validation of qpcr rapid bacterial quantification through ... · epa validation study of method c:...
TRANSCRIPT

Validation of qPCR Rapid Bacterial Quantification through
Viable E. coli cell count in the Saginaw Bay Watershed
TYLER LEFEVRE
ADVISOR: DR. TAMI SIVY
1

Overview Introduction to fecal coliforms
Current detection methods
qPCR rapid testing
EPA Method C validation study
The qPCR quantification issue
Viability testing
Future research
2

Fecal Indicator Bacteria Coliforms Indicator of water quality
Characteristics: Rod shaped
Gram-negative
Non-spore forming
Fecal Coliforms Indicator of fecal contamination
Typically Escherichia coli
Snyder, K. Genomes of Two Popular Research Strains of E. coli Sequenced https://www.bnl.gov/newsroom/news.php?a=11019 (accessed April 2, 2017).
3

Overview Introduction to fecal coliforms
Current detection methods
qPCR rapid testing
EPA Method C validation study
The qPCR quantification issue
Viability testing
Future research
4

Current Methods – Idexx Colilert-18
Enzymatic, colorimetric
Measures coliforms and fecal coliforms after overnight incubation period (18 hours)
Faster methods being researched/validated qPCR rapid testing (3-4 hours)
Michigan beach allowable threshold: 300 Colony Forming Units (CFU)/100 mL water Set by the Michigan DEQ
idexx.com 4-Methylumbelliferyl β-D-glucuronide (MUGlcU)
5

Polymerase Chain Reaction (PCR)
http://www.mun.ca/biology/scarr/Gr12-26.html 6
Annealing
Extension

Polymerase Chain Reaction (PCR) Ethidium bromide staining
www.researchgate.net http://www.madsci.org/posts/archives/1999-02/919869466.Mb.r.html
Presence/absence (qualitative)
7

Overview Introduction to fecal coliforms
Current detection methods
qPCR rapid testing
EPA Method C validation study
The qPCR quantification issue
Viability testing
Future research
8

Quantitative PCR (qPCR) Utilizes fluorescent probes to quantitate DNA
Fluorescence monitored in real time
Probe is hybridized to fit between primers
9
http://www.sinobiological.com/real-time-pcr-service-gene-expression-analysis-by-qpcr-cro-service.html

Controls Blanks
Known levels of Salmon DNA
Standard curve used to calculate the number of 1S rRNA sequence in calibrator
Non Template Controls (NTCs)
Duplicates
Background dye (ROX)
10

qPCR Run Protocol
Run time approximately 90 minutes
Combined extension and annealing steps
11

qPCR Raw Data Cycle Threshold (CT)
Fluorescence α 1/ CT α [DNA]
[DNA]
7 Genome Equivalents (GE)
12

Overview Introduction to fecal coliforms
Current detection methods
qPCR rapid testing
EPA Method C validation study
The qPCR quantification issue
Viability testing
Results
Future research
13

EPA Validation Study of Method C: Escherichia coli in Water by TaqMan Quantitative Polymerase Chain
Reaction (qPCR). 24 L water collected from various sites Filtered at SVSU
Distributed to multiple labs
Tested: Colilert-18
qPCR
Goal: to find a reliable and reproducible conversion between CFU from Colilert and GE from qPCR Determine an allowable level of GE
14
Log (Target Sequence Copies)

Filtration Vacuum filtration
Polycarbonate filter membranes
Rod-shaped bacteria ≈ 0.5 µm
0.4 µm pore size, 47mm diameter
100 mL of sample
100 mL Phosphate-buffered saline (PBS) rinse
PBS Blanks
E. coli calibrators
90% ethanol sterilization
15

DNA Extraction (EPA Method C) Bead beat with acid-washed glass beads in pH 8.0 Tris-EDTA buffer
Salmon testes internal control
Purify through several centrifugation steps
16
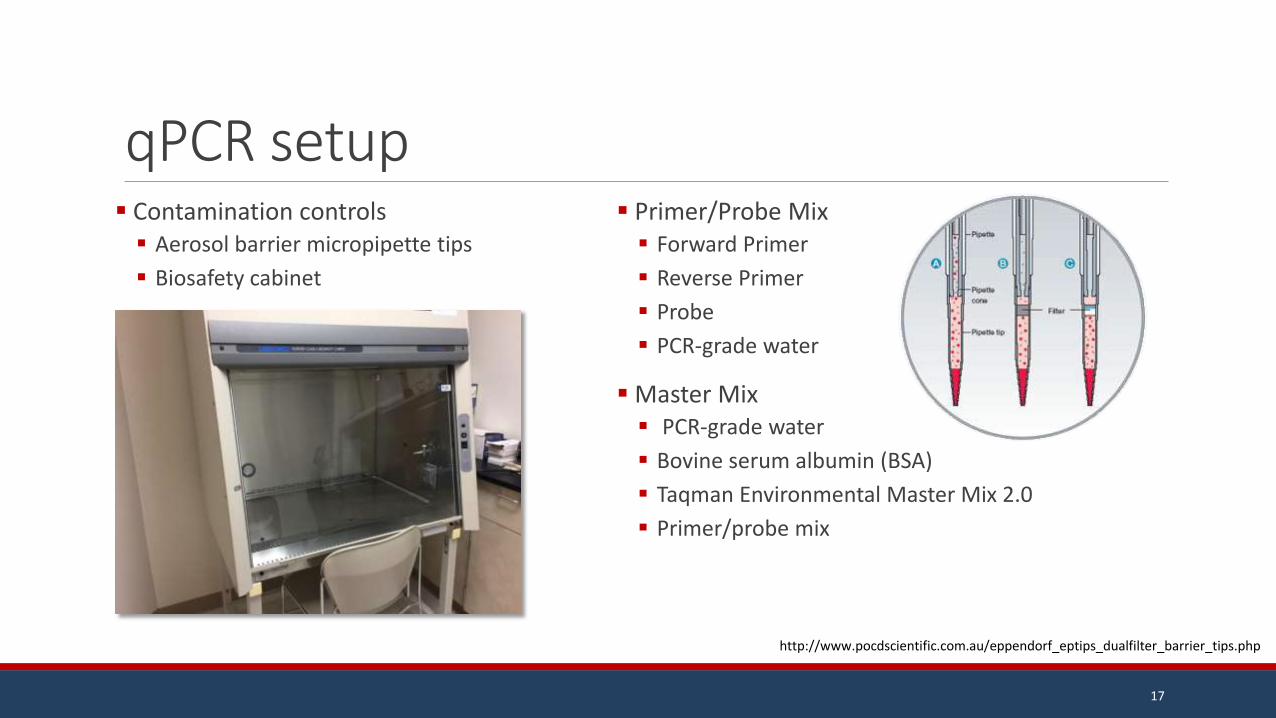
qPCR setup Contamination controls Aerosol barrier micropipette tips
Biosafety cabinet
Primer/Probe Mix Forward Primer
Reverse Primer
Probe
PCR-grade water
Master Mix PCR-grade water
Bovine serum albumin (BSA)
Taqman Environmental Master Mix 2.0
Primer/probe mix
17
http://www.pocdscientific.com.au/eppendorf_eptips_dualfilter_barrier_tips.php

SVSU Validation Study Results
0
0.5
1
1.5
2
2.5
3
3.5
4
4.5
5
0
0.5
1
1.5
2
2.5
3
3.5
4
4.5
5
Saginaw Bay (7/19) Saginaw Bay (7/20) Saginaw Bay (7/21) Saginaw River (7/27) Saginaw River (7/28) Saginaw River (7/29)
qP
CR
lo
g G
E/1
00 m
L
Co
lile
rt l
og
CF
U/1
00 m
L
Sampling Locations (Dates)
qPCR
Allowable CFU
Colilert
18

SVSU Validation Study Results
y = 0.7314x + 1.3421 R² = 0.914
0
0.5
1
1.5
2
2.5
3
3.5
4
0 0.5 1 1.5 2 2.5 3 3.5
Co
liler
t (l
og
CFU
/10
0 m
L)
E. coli Genome Equivalents (log GE)
Colilert vs. Method C
Pearson Correlation Coefficient: 0.96
19

Overview Introduction to fecal coliforms
Current detection methods
qPCR rapid testing
EPA Method C validation study
The qPCR quantification issue
Viability testing
Future research
20

SVSU Validation Study Results
0
0.5
1
1.5
2
2.5
3
3.5
4
4.5
5
0
0.5
1
1.5
2
2.5
3
3.5
4
4.5
5
Saginaw Bay (7/19) Saginaw Bay (7/20) Saginaw Bay (7/21) Saginaw River (7/27) Saginaw River (7/28) Saginaw River (7/29)
qP
CR
lo
g G
E/1
00 m
L
Co
lile
rt l
og
CF
U/1
00 m
L
Sampling Locations (Dates)
qPCR
Allowable CFU
Colilert
21

The qPCR Quantification Issue qPCR is DNA-based DNA doesn’t need a living host to exist
Obtained results can be falsely high
How can this be studied? Compare viable (live) cell DNA to non-viable
(dead) cell DNA
Fluorescent viability dyes
Study effects of UV-sterilization
0
500
1000
1500
2000
2500
3000
3500
4000
4500
5000
Flu
ore
sce
nce
Pe
ak A
rea
Pre- or Post-UV Samples
Live
Dead
22

Ultraviolet Sterilization
100 – 400 nm
Relatively high energy
Causes thymine dimers in DNA Renders DNA unusable for transcription/translation
and replication
Cell death/non-viability
23

Cell Viability Dyes SYTO® 9 nucleic acid dye Live and dead cells
Green
Fluoresces at 510-540 nm
https://bio-ggs.blogspot.com/2010_05_01_archive.html
SYTO 9 PI SYTO 9 PI
Propidium iodide Dead cells
Red
Fluoresces at 620-650 nm
24
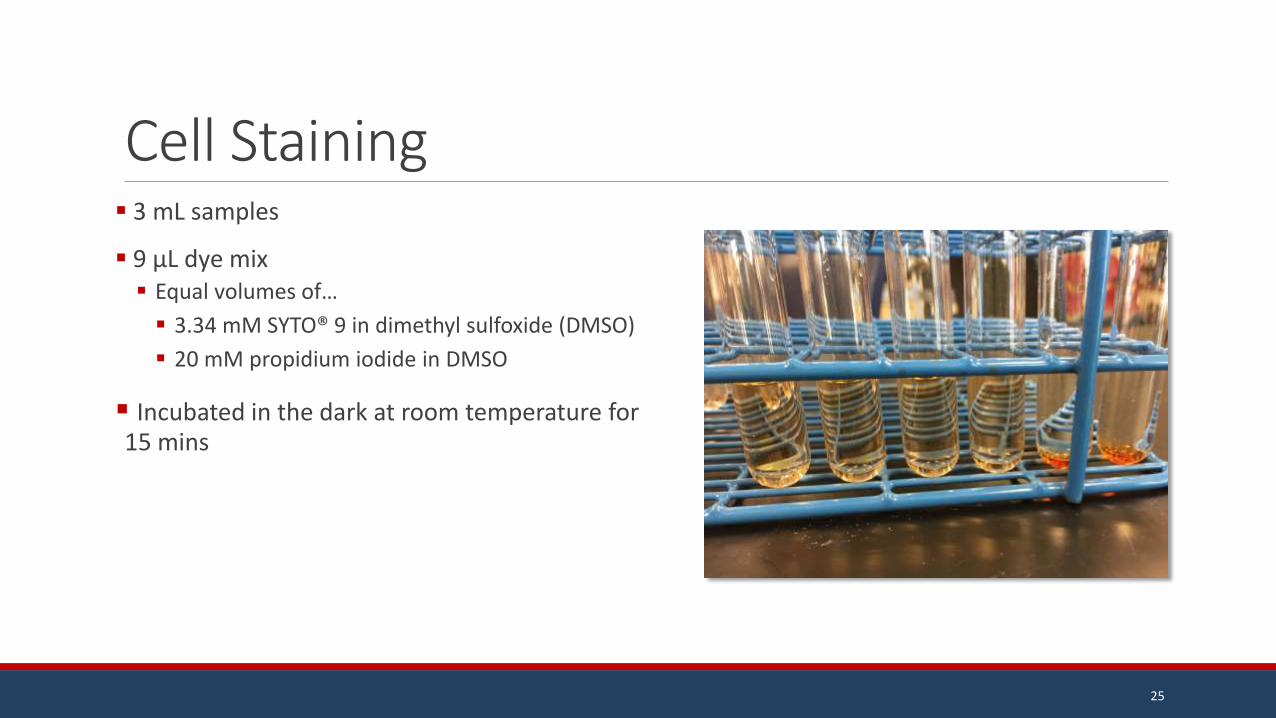
Cell Staining 3 mL samples
9 μL dye mix Equal volumes of…
3.34 mM SYTO® 9 in dimethyl sulfoxide (DMSO)
20 mM propidium iodide in DMSO
Incubated in the dark at room temperature for 15 mins
25

Fluorescence Spectrophotometry
https://micro.magnet.fsu.edu/primer/java/fluorescence/exciteemit/ https://www.researchgate.net/figure/23236997_fig1_Figure-1-101-Fluorescence-fundamentals-Jablonski-diagram-displaying-the-energy-states
26
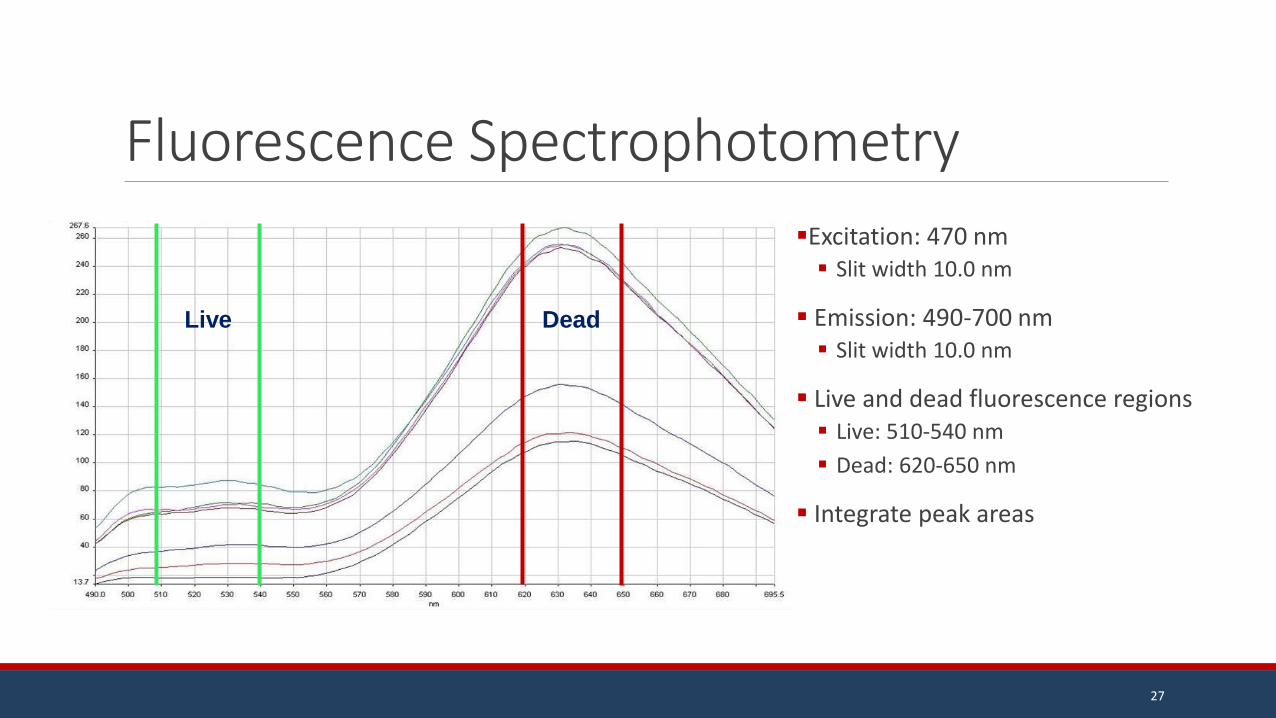
Fluorescence Spectrophotometry
Live Dead
Excitation: 470 nm Slit width 10.0 nm
Emission: 490-700 nm Slit width 10.0 nm
Live and dead fluorescence regions Live: 510-540 nm
Dead: 620-650 nm
Integrate peak areas
27

Results – Fluorescence Spectrophotometry
0
5
10
15
20
2/15/2017 3/13/2017 3/21/2017
% L
ivin
g E.
co
li
Sampling Date
Pre-UV
Post-UV
28
% Living E. coli Pre- and Post-UV
Decrease in live cells after UV treatment in 2/3 sampling dates Expected
More dead cells than live cells in all samples

qPCR DNA Extraction (Pre/Post-UV) Bead beat with acid-washed glass beads in pH 8.0 Tris-EDTA buffer
Salmon testes internal control
Centrifugation
FastDNA® Spin Kit for Soil Protein precitipation solution (PPS)
Binding matrix
Centrifuge with spin filters
SEWS-M
Washes impurities away from bound DNA
DNA elution solution (DES)
29

Results – qPCR
0
0.5
1
1.5
2
2.5
3
3.5
4
4.5
5
2/15/17 3/13/17 3/21/17
E. c
oli
Ge
no
me
Eq
uiv
ale
nts
(lo
g G
E)/1
00
mL
Sampling Date
Pre-UV
Post-UV
30
E. coli GE per 100 mL water Log scale
Amount of detected GE decreases from pre- to post-UV in 2/3 sampling dates Not the same two as in
fluorescence data
For true comparison, quantification data from fluorescence spectrophotometry is required

Results – Quantification Via Fluorescence Known concentration of cells
Create standards with known ratios of live to dead cells
Test their fluorescence emission
Compare intensity of standards to intensity of samples at live and dead wavelength ranges
31
y = 0.0184x + 0.006 R² = 0.7532
0.00
0.50
1.00
1.50
2.00
0 10 20 30 40 50 60 70 80 90 100
Live
/Dea
d A
rea
Rat
io
Percent Live Cells
Fluorescence Standard Curve

Results – Quantification Via Fluorescence
32
y = 284.62x - 807.95 R² = 0.7631
0
5000
10000
15000
20000
25000
30000
35000
0 10 20 30 40 50 60 70 80 90 100
Flu
ore
scen
ce In
ten
sity
Percent Live Cells
Live Fluorescence Standard Curve (510-540 nm)
y = -38.748x + 15421 R² = 0.8564
10000
11000
12000
13000
14000
15000
16000
0 20 40 60 80 100 120
Fuo
resc
en
ce In
ten
sity
Percent Dead Cells
Dead Fluorescence Standard Curve (620-650 nm)

Future Research Test additional samples with Colilert and qPCR to add to the Method C data set
Continue viability testing and compare with qPCR results
Explore methods to quantify E. coli using fluorescence spectrophotometry
Investigate use of alternative viability testing technologies, i.e. flow cytometry
Perform controlled assays of UV light exposure on contaminated samples
33

Acknowledgements Dr. Tami Sivy
The SVSU Honors Program
The SVSU Undergraduate Research Program for funding
The Saginaw Bay Environmental Science Institute (SBESI) at SVSU for providing facilities and equipment
Carol Injasoulian and the Bay City Wastewater Treatment Plant
The MWEA
34

References EPA Method C: Escherichia coli in Water by TaqMan Quantitative Polymerase Chain Reaction (qPCR).
Thermo Fisher Scientific. TaqMan® Real-Time PCR (qPCR). Thermofisher.com (accessed April 2, 2017).
Thermo Fisher Scientific. Invitrogen™ LIVE/DEAD® BacLight™ Bacterial Viability Kits. Thermofisher.com (accessed April 4, 2017).
MP Biomedicals. FastDNA™ SPIN Kit for Soil. mpbio.com (accessed April 4, 2017).
35

36
Thank You!

37
Questions?