validation of the regional authority indexgwmarks/assets/doc/3. validation_feb2008...the purpose of...
TRANSCRIPT
[3]
Validation of the Regional Authority Index*
Arjan H. Schakel
words: 10,354
Forthcoming in Regional and Federal Studies, Vol. 18 (2).
Abstract
This article validates the Regional Authority Index with seven widely used decentralization indices in the literature. A principal axis analysis reveals a common structure. The major source of disagreement between the Regional Authority Index and the other indices stems from the fact that the Regional Authority Index does not include local governance whereas most other indices do. Two other sources of disagreement concern the treatment of federal versus non-federal countries, and countries which have recently regionalized and/or have asymmetrical regions, whereby the more fine-grained Regional Authority index captures greater variation. The second part discusses content validity of fiscal indicators. Acknowledgements: * I would like to thank Liesbet Hooghe, Lucas Leemann, Gary Marks and Jan Rovny for their helpful discussions and comments. Thanks also go to Dawn Brancati, Christine Kearney, Daniel Treisman, Jaap Woldendorp and Hans Keman for kindly providing their data. I owe a special debt of gratitude to the people of the Center for European Studies and the Political Science department at the University of North Carolina where most of the research was done.

INTRODUCTION The purpose of this article is to validate the Regional Authority Index. One could
distinguish between two reasons for assessing (internal) validity of measurements. First,
by validating measurements, commonalities come to the fore. In how far do the measures
measure the same? This is how assessing (internal) validity is usually understood.
Another reason, however, may lie in exploring differences between measurements. When
do measures of the same concept disagree? The answer to this question reveals
information which might be helpful in deciding when or how to use one or the other
measurement. In this article the validity of the Regional Authority Index is assessed by
looking at the commonalities as well as the differences between the Regional Authority
Index and other, widely used, regionalization and decentralization indices.
Three types of indices exist: indices measuring institutional decentralization/
regionalization, indices of fiscal decentralization/ regionalization or indices that
combine institutional and fiscal components. Institutional indices have been developed
by Mohammad Arzaghi and J. Vernon Henderson (2005), Dawn Brancati (2006), Liesbet
Hooghe and Gary Marks (2001), Jan-Erik Lane and Svante Ersson (1999), Arend Lijphart
(1999) and Daniel Treisman (2002). Fiscal indices have been introduced by Dietmar
Braun (2000), Frank Castles (1999), Dan Stegarescu (2005a), Jean-Philippe Meloche,
François Vaillancourt and Serdar Yilmaz (2004), Robert Ebel and Serdar Yilmaz (2002),
Ruben Enikolopov and Ekaterina Zhuravskaya (2007), and Wallace Oates (1972). Some
authors combine the two types into one index, as does Jaap Woldendorp, Hans Keman
and Ian Budge (2002).
1

Despite the abundance of indices, there is little systematic comparison of their
validity (an important exception is Rodden (2004)). This article focuses on two types of
validity (Ray 2007; Bollen 1989)1:
• Convergent validity assesses whether a given indicator is empirically associated
with other indicators that conform to theoretical expectations: it involves
comparing alternative measures of the same concept or comparing measures of
different concepts (Ray 2007: 12). Measurements of the same concept, in our case,
decentralization, should converge, that is, they should correlate across a given set
of cases.
• Content validity assesses the degree to which an indicator captures the content of
the measured concept (Adcock and Collier 2001: 537). This is a “qualitative type
of validity where the domain of the concept is made clear and the analyst judges
whether the measures fully represent the domain” (Bollen 1989: 185). Testing for
content validity “does not involve the comparison of a measure with any other
quantitative data, and can be employed even before any data is collected” (Ray
2007: 12). Content validity means that scholars agree on the definition of
decentralization, or agree on how decentralization can be broken down into
different types of decentralization. The measurements may differ in their
‘content’ because different theoretical assumptions underly them.
I assess convergent validity for the Regional Authority Index by comparing the
index with seven institutional-type regionalization and decentralization indices
commonly used in the literature. I do not use fiscal indices to examine convergent
2
validity of the Regional Authority Index because there are major caveats with respect to
content validity. I point out two caveats with conceptualizing and operationalizing fiscal
decentralization.
In the next section, I introduce and compare seven institutional measures. Can
decentralization be conceived as a single, continuous dimension? What is the common
structure underlying these measures? I then test several hypotheses for explaining
variation among the different measures, and I analyze the strongest cases of
disagreement in greater detail. In the last section, I examine the content validity of fiscal
indicators of decentralization.
DECENTRALIZATION INDICES
I conceive of decentralization as a single, continuous dimension ranging from
centralization in which the central government monopolizes decision-making authority
to decentralization in which subnational governments have extensive decision-making
authority that falls short of a monopoly over authority. It is important to note that this is
a simplification. Some authors differentiate among vertical vs. horizontal
decentralization, or decentralization with respect to decision-making, appointment,
electoral, fiscal or personnel (Treisman 2002), or between fiscal, political and
administrative decentralization (Schneider 2003).
The Regional Authority Index is consistent with these understandings in that it too is
composed of different components: institutional depth, policy scope, fiscal autonomy,
representation, and law making, executive control, fiscal control and constitutional
reform. However, the Regional Authority Index differs from some (but not all) indices in
3

that it focuses on regional tiers, i.e. the intermediate tiers with a minimum average
jurisdictional population size of 150,000. Several decentralization indices that I discuss
here consider the dispersion of power across all subnational tiers, thus including the
local tier, and sometimes they also include dispersion of power to interests groups (i.e.
corporatism).
I compare the Regional Authority Index with the following indices:
Arzaghi and Henderson (2005)2
These authors present a “nuanced index of ‘institutional‘ decentralization, or
effective federalism” (Arzaghi and Henderson 2005: 1176) which they construct by
assessing fiscal, political, and administrative responsibilities of subnational government.
This index is an average of six indicators, each of which ranges from 0 to 4:
• Unitary (0) or federal (4) government structure;
• Election of a regional executive: no (0) or yes (4);
• Election of a local executive: no (0) or yes (4);
• Ability of the center to suspend lower levels of government or to override their
decisions: no (4) or yes (0);
• Revenue raising authority of lower level governments: no (0), limited (2) or full
(4);
• Revenue sharing: no (0), limited (2) or full (4).
The dataset consists of scores for five-year intervals between 1960−1995 for 16
European and OECD countries that overlap with the Regional Authority Index dataset.3
4

Brancati (2006)
This index measures political decentralization, which is understood as the vertical
division of authority among subnational levels of government that have independent
decision-making power over at least one issue area.
The index consists of three components, which together construct a scale ranging
from 0 to 5:
• Subnational elections: 1 point when there are subnational elections;
• Subnational legislative control over policies: 1 point each for: tax authority,
education and public order/police;
• Subnational veto over constitutional amendments: 1.
The dataset consists of 40 European, Balkan and OECD countries4, for the years
1985−2000.5
Hooghe and Marks (2001)
The Hooghe and Marks index is the only of seven which focuses on regional autonomy
–rather than decentralization– within a country. This is an additive index of four
components, ranging between 0 and 12:
• Constitutional federalism (0-4), which taps constitutional or legal provisions
relating to regional government in the state. One point is assigned for each of the
following characteristics (Hooghe and Marks 2001: 194):
Existence of a functioning regional tier of government;
Extensive authoritative competencies, including control over two or more of
the following: taxation; police; education policy (including tertiary education);
5
cultural policy; transport and communications policy; economic development;
local government; and determination of regional political institutions (e.g.,
administrative hiring, budget process, timing of regional elections);
Specific regional competencies that are constitutionally guaranteed;
A federal state in which constitutional change is co-decided by the central
state and regions.
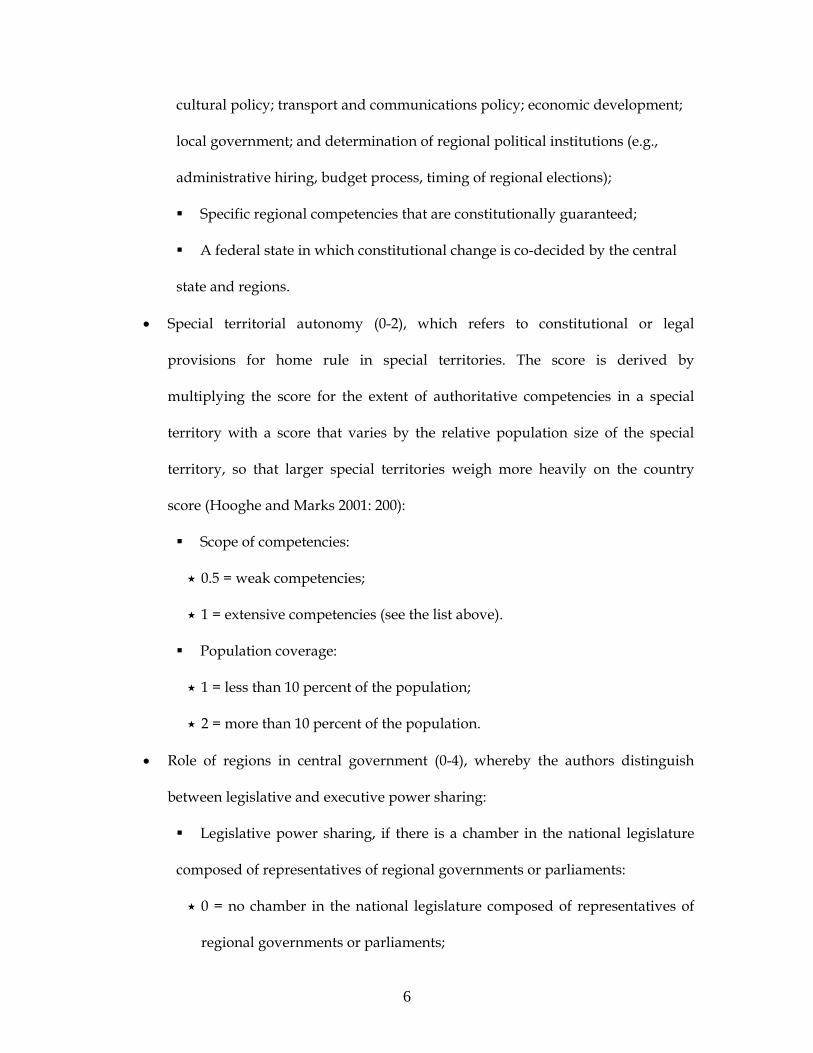
• Special territorial autonomy (0-2), which refers to constitutional or legal
provisions for home rule in special territories. The score is derived by
multiplying the score for the extent of authoritative competencies in a special
territory with a score that varies by the relative population size of the special
territory, so that larger special territories weigh more heavily on the country
score (Hooghe and Marks 2001: 200):
Scope of competencies:
0.5 = weak competencies;
1 = extensive competencies (see the list above).
Population coverage:
1 = less than 10 percent of the population;
2 = more than 10 percent of the population.
• Role of regions in central government (0-4), whereby the authors distinguish
between legislative and executive power sharing:
Legislative power sharing, if there is a chamber in the national legislature
composed of representatives of regional governments or parliaments:
0 = no chamber in the national legislature composed of representatives of
regional governments or parliaments;
6
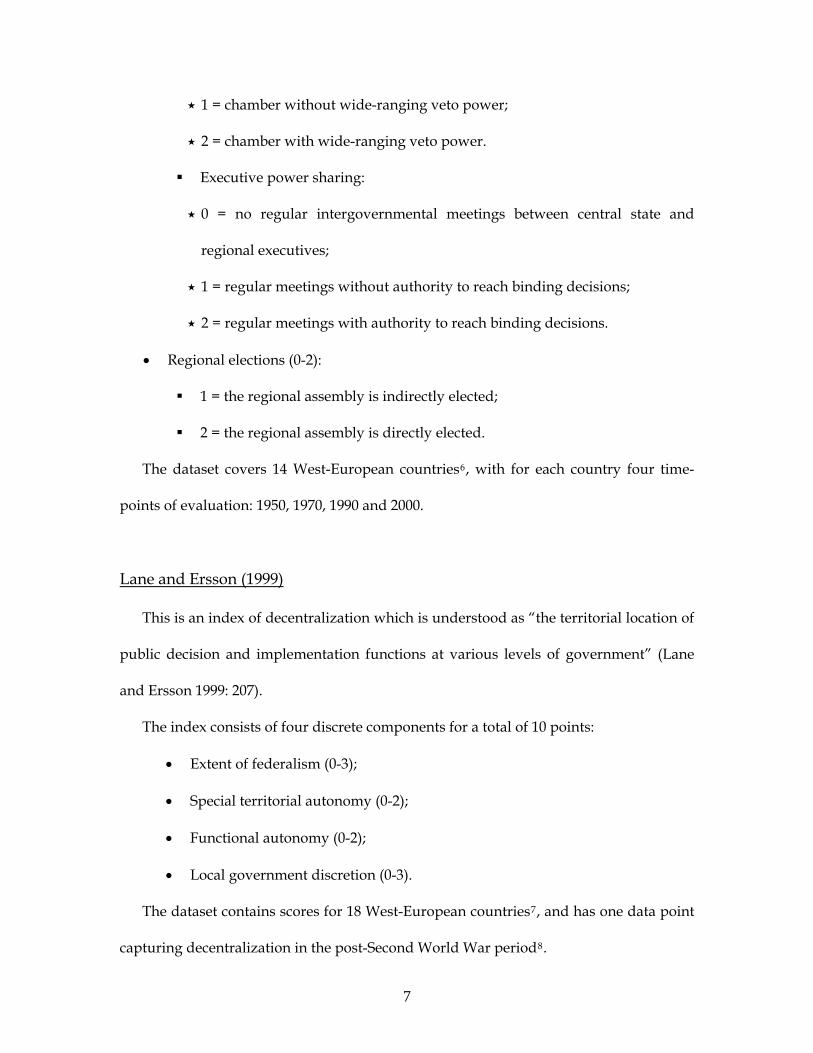
1 = chamber without wide-ranging veto power;
2 = chamber with wide-ranging veto power.
Executive power sharing:
0 = no regular intergovernmental meetings between central state and
regional executives;
1 = regular meetings without authority to reach binding decisions;
2 = regular meetings with authority to reach binding decisions.
• Regional elections (0-2):
1 = the regional assembly is indirectly elected;
2 = the regional assembly is directly elected.
The dataset covers 14 West-European countries6, with for each country four time-
points of evaluation: 1950, 1970, 1990 and 2000.
Lane and Ersson (1999)
This is an index of decentralization which is understood as “the territorial location of
public decision and implementation functions at various levels of government” (Lane
and Ersson 1999: 207).
The index consists of four discrete components for a total of 10 points:
• Extent of federalism (0-3);
• Special territorial autonomy (0-2);
• Functional autonomy (0-2);
• Local government discretion (0-3).
The dataset contains scores for 18 West-European countries7, and has one data point
capturing decentralization in the post-Second World War period8.
7
Lijphart (1999)
Lijphart measures federalism and decentralization which he conceives as one
dimension. The index consists of five ordinal categories which construe a scale that
ranges from 1 to 5:
• 1= unitary and centralized;
• 2= unitary and decentralized;
• 3= semi-federal;
• 4= federal and centralized;
• 5= federal and decentralized.
This dataset consists of 36 countries, of which 24 West-European and OECD
countries overlap with the Regional Authority Index.9 There is one score which is an
average evaluation of the post-Second World War period.10
Treisman (2002)
Treisman focuses on decentralization, and he measures different types: vertical,
decision-making, appointment, electoral, fiscal and personnel decentralization.11
Decision-making decentralization comes closest to the definition of decentralization
used in this article, and I therefore use it to validate the Regional Authority Index.
An index of decision-making decentralization can be made by summing three
components of decentralization identified by Treisman, which creates a scale ranging
from 0 to 312:
8
• Weak autonomy = 1: the constitution reserves to subnational legislatures the
exclusive right to legislate on at least one specific policy area or if subnational
legislatures have residual authority;
• Residual autonomy = 1: the constitution gives subnational legislatures the
exclusive right to legislate on policy areas not specifically assigned in the
constitution;
• Subnational veto = 1: there is a regionally-elected upper chamber that has the
constitutional right to block legislation.
The dataset covers 41 European, Balkan and OECD-countries13, and the scores reflect
the situation in the mid-1990s.
Woldendorp, Keman and Budge (2000)
Their autonomy index measures “how independent the non-central units of
government are as regards policy making” (Woldendorp et al., 2000: 35).
The autonomy index consists of four components, which combine in a scale from 0 to
8.
• Central fiscalization (0-2)14:
2: if a country has a degree of fiscal centralization lower than 75%;
1: if a country has a degree of fiscal centralization between 75% and 90%;
0: if a country has a degree of fiscal centralization equal to or more than 90%.
• Regional autonomy (0-2):
2: if regional autonomy is formally laid down (as is the case in federalist states);
1: if the country is a semi-federalist system;
0: neither.
9

• Centralization (0-2):
2: if the state is not considered to be centralized;
1: is the state is considered to be medium centralized;
0: if the state is considered to be highly centralized.
• Local government autonomy (0-2):
2: if three conditions are met: local government is mentioned in the constitution,
its autonomy is recognized, and it is guaranteed own representation;
1: if one of these conditions is met;
0: all other cases.
The dataset contains 37 European, Balkan and OECD-countries15, and there is one
time-point of evaluation which reflects the post-Second World War period.16
Factor analysis
To see whether these diverse measures of a single concept −decentralization− have a
common structure, a principal axis analysis is employed (Marks et al. 2007).17 Since the
number of countries for which we have scores differs per decentralization index, I
perform four separate factor analyses so that I can maximize the number of cases.
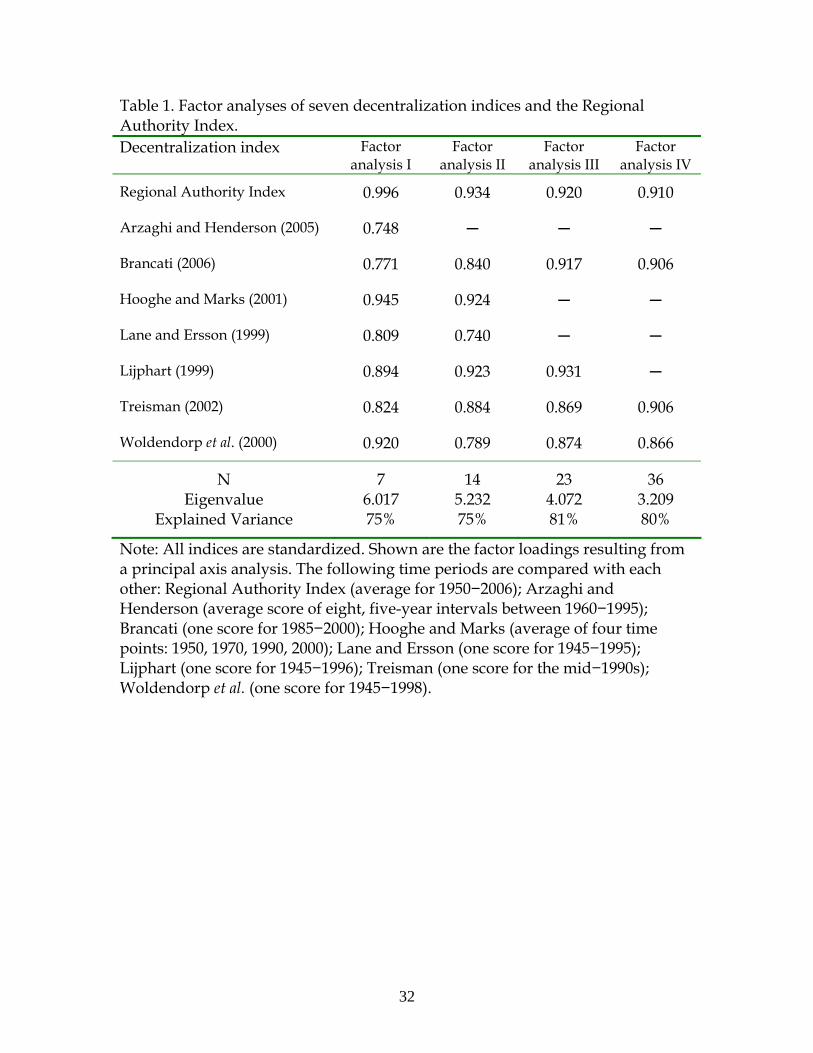
The factor analyses in Table 1 reveal that the indices do indeed have a common
structure. In each analysis, the principal axis has an eigenvalue well above one, and the
explained variance is 75% or more. The Regional Authority Index measure loads
strongly on the principal axis in all four analyses. Lijphart’s and Hooghe and Marks’,
and to a lesser extent Brancati’s and Treisman’s measure also load heavily on the
principal axis.
[Table 1 about here]
10
SOURCES AND CASES OF DISAGREEMENT
In this section, I explore the sources of disagreement between the decentralization
indexes and I pay close attention to the most important cases of disagreement.
The decentralization indices can be considered as expert judgments. As can be seen
from the description of the indices, each expert uses her/his own criteria. Although
there are commonalities in these criteria, there are also many differences. Furthermore,
experts differ in their level of knowledge for different countries. One may hypothesize
that this all leads to different evaluations of subnational autonomy in countries.
Sources of disagreement
To explore the structure of disagreement between the Regional Authority Index and
the other measures, the Regional Authority Index is regressed on each decentralization
index.18 By exploring the residuals from regressing the Regional Authority Index on one
of the other decentralization indices one can see when the measures disagree. I am
interested in systematic sources of bias or error −not in random error. Where can we
expect to observe larger residuals, that is to say, where can we expect the scores of the
Regional Authority Index to differ systematically from those of one of the other indices?
No regional tier
One major difference between the Regional Authority Index and all but one of the
alternative seven indices is that the Regional Authority Index only captures intermediate
11
regional tiers, not local government. The Regional Authority Index also excludes
regional tiers with an average population size below 150,000 people. Six of the seven
other indices consider local as well as regional government in assessing decentralization.
So the Regional Authority Index is designed to measure regional government, and this,
one would expect, is somewhat conceptually distinct from decentralization, which the
other indices measure.
It seems reasonable, then, to expect negative residuals for countries which have only
one subnational government tier, which are countries with local government only. That
is to say, the Regional Authority Index should under-estimate decentralization in
countries that have only a local tier.
Federal versus non-federal countries
The fine-grained character of the Regional Authority Index allows for capturing
graduations in the extent of regional autonomy − even in countries with highly
autonomous regions, such as federal countries. This is different from most indices,
which usually employ a sharply discontinuous measure, sometimes simply
dichotomous, that distinguishes federal from non-federal countries. Lijphart, for
example, assigns all federal countries a score of 5 whereas only Austria scores a 4.5. All
federal countries, except Austria, thus receive the highest score while non-federal
countries are allowed to have more differentiated scores (between 1, 2, and 3).
The Regional Authority Index is more sensitive to variation within the federal
category: the range among federal countries is 14, from about 17 (Austria and the
Russian Federation) to almost 30 (Germany) up to about 31 (Bosnia and Herzegovina).
12
This range is about the same as it is for non-federal countries which vary between 0
(multiple countries) to about 14 (the Netherlands and Sweden).
Other indices, however, work exactly the opposite way: they tend to treat the non-
federal countries more as a homogenous group and allow more variation among the
federal countries. Treisman’s measure, for example, gives only six out of 33 non-federal
countries a score higher than zero, whereas all eight federal countries score between 1
and 3.
Differential sensitivity in measurement should produce systematic differences in
scoring. That is to say, for some indices, such as Lijphart’s, one would expect the
residuals with the Regional Authority Index to be larger for federal countries than for
non-federal countries. Conversely, for other indices such as Treisman’s, the residuals
should be smaller for federal countries and larger for non-federal ones.
These different biases in scoring become apparent when one compares, for each
index, means, standard deviations and ranges for federal with those for non-federal
countries (see Table 2).
[Table 2 about here]
All decentralization indices are able to differentiate between federal and non-federal
countries, i.e. the mean score for non-federal countries is significantly different from the
mean for federal countries.19 This means that all decentralization indices pick up
between-group differences.
But not all measures are equally suited to capture within-group differences.
The ratio measure in Table 2 gives a sense of this. The ration is calculated by dividing
the standard deviation of federal countries by that of non-federal countries. A ratio
larger than one indicates that the decentralization index is biased to capturing variation
13
among federal countries, a ratio smaller than one indicates the opposite. One can see
that the Regional Authority Index, Arzaghi and Henderson and Woldendorp et al.
differentiate equally between countries within each group. Hooghe and Marks and
Lijphart tend to treat the federal countries as a homogenous group whereas Brancati,
Lane and Ersson and Treisman tend to treat non-federal countries as a homogenous
group.
One may expect differences in scoring to lead to negative residuals (underestimation
by the Regional Authority Index) for federal countries for the Hooghe and Marks and
Lijphart measures whereas it should lead to positive residuals (overestimation by the
Regional Authority Index) for federal countries for the Brancati, Lane and Ersson and
Treisman measures.
Asymmetry and regionalizing
A last source of disagreement might be expected for countries that, for some reason
or another, are complicated to evaluate. This may be so when a country has
asymmetrical regions which depart from the general country pattern, or when
decentralization in a country has been in flux recently.
The vertical state structure is not necessarily uniform within a single country at a
certain point in time and over time. A country might have a special autonomous region
which has more autonomy than other subnational units, for example Grønland and the
Færøerne in Denmark and Åland in Finland. There might also be differences between
units of the same subnational tier. Examples are the historic communities versus the
other autonomas communidades in Spain and the special statute regions versus the
ordinary regions in Italy.
14

Decentralization is a moving target. Subnational tiers may be created or abolished,
autonomy may be deepened or revoked. In France, for example, the régions were
institutionalized in 1964 and over time were granted more autonomy. How scholars
evaluate these differences at a certain point in time may differ, and this, one would
expect, should lead to variation in scoring.
Explaining disagreement
Testing these expectations requires that disagreement is operationalized. I use as
measure the residuals from regressing the Regional Authority Index on the other
decentralization indices.
The first two sources of disagreement −presence or absence of a regional tier and
federal or non-federal− are operationalized as dummy variables.20 To measure
asymmetry and dynamic regionalization, I construct an additive index (0-2), whereby I
allocate a value of 1 to a country that has (had) asymmetric regions21, and a value of 1 to
a the country that has experienced radical regionalization22 in the post-Second World
War period. The Regional Authority Index is regressed on the decentralization indices
and the residuals are subsequently regressed on the sources of disagreement variables.23
I begin by considering absolute residuals and than look at raw residuals (taking the sign
into account).
[Table 3 about here]
The absolute residual analysis in Table 3 shows that the sources of disagreement
differ across decentralization indices. The strongest predictor of disagreement for
Brancati and Treisman is the ‘no regional tier’ variable. The federal-non federal variable
is effective in explaining disagreement with the Treisman index and the
15
asymmetry/regionalized variable explains disagreement with the Lijphart variable.
None of the factors appeared significantly associated with the residuals for Arzaghi and
Henderson, Hooghe and Marks, Lane and Ersson , and Woldendorp et al..
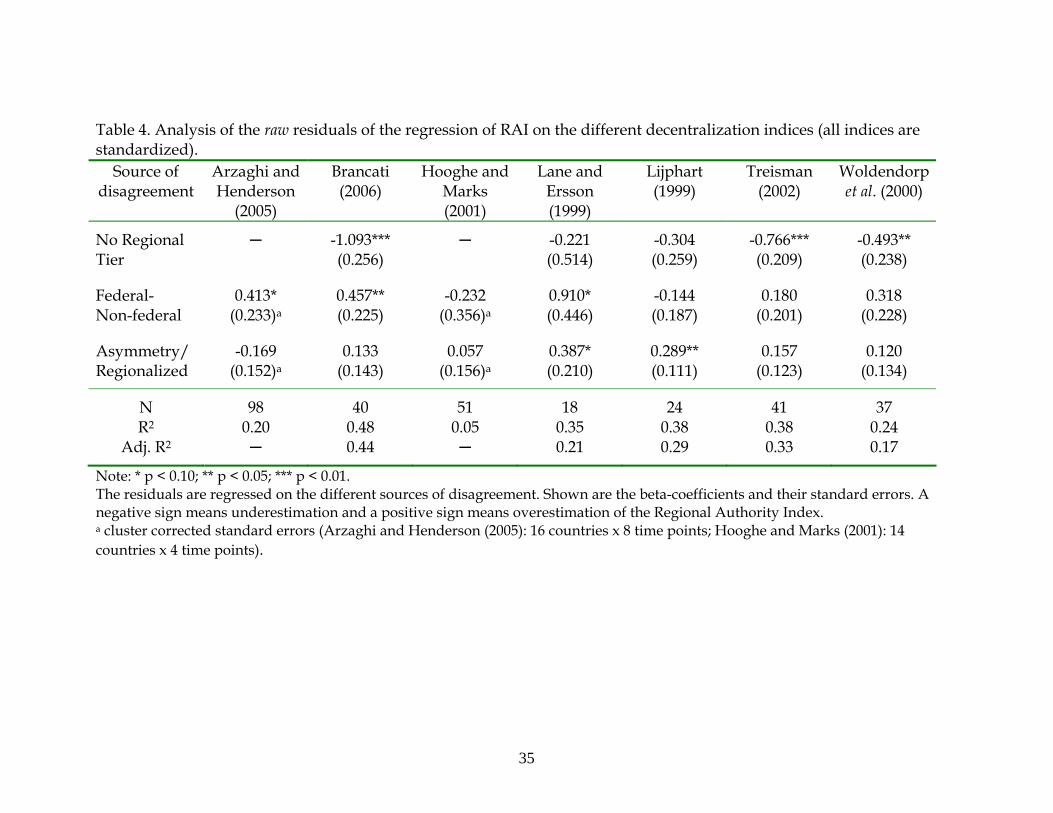
I repeat the same analysis for raw residuals and report the results in Table 4. The
most striking result is that all beta-coefficients are negative for the ‘no regional tier’
variable which means that the Regional Authority Index systematically underestimates
subnational autonomy of countries which have no regional tier.
[Table 4 about here]
Cases of disagreement
It is not only interesting to see what the sources of disagreement are but also whether
disagreement is caused by certain countries. What are the outliers? I define a ‘case of
disagreement’ as having a residual score of two standard deviations or more. Table 5
shows thirteen cases of disagreement involving nine countries.
[Table 5 about here]
The differences in scoring for Cyprus, Finland, Luxembourg and Macedonia can be
explained by the fact that the Regional Authority Index does not measure local
government while the other decentralization indices do. But the precise scoring of these
cases still raises some questions.
Cyprus and Luxembourg score 1 (out of 3) on the Treisman measure since the
Constitution of these countries reserves to subnational legislatures the exclusive right to
legislate in at least one specific policy area. For Luxembourg this is birth, marriage, and
death certificates24 and for Cyprus it is town planning25. This kind of scoring leads to
some curious bedfellows: Australia and Russia also score 1 on Treisman’s index, and yet
16
it would be difficult to sustain that the states of Australia and the federacii subwekty in the
Russian Federation have the same autonomy as the municipalities in Cyprus and
Luxembourg. Treisman’s index, then, may not be discriminatory enough to tap the full
range of variation in decentralization.
A similar observation could be made for the Macedonian score on Brancati’s index.
Macedonia scores 3 out of 5, because local governments have authority over taxation
(+1) and education (+1) and they have an elected assembly (+1). However, the 1995 Law
on self-government strongly curtailed these powers as Brancati notes herself.26
Macedonia’s score of 3 ranks on par with the regioni in Italy, the autonomas communidades
in Spain, the Australian states, the Russian federal subjects and the Belgian
Gemeenschappen/Regio’s.
Woldendorp et al. give Macedonia a score of 4 (out of 7). The score reflects that
local government is mentioned in the constitution in combination with independent
rights and its own representative body (+2 points) and that fiscal centralization is lower
than 75% (+2 points). The latter part of the scoring is contested by several more recent
studies which highlight the limited tax autonomy of Macedonian local governments.
Woldendorp et al. measure fiscal centralization as “Central Government Revenues as a
% of General Government” (2000: 32-38) which is for Macedonia 44% (meaning that the
local governments collect 66% of general government revenue). Financial governmental
data for Macedonia is hard to find but the new Law on Local Government Finance
(2002) assigns the levy of various taxes on property to local government units together
with 3% of the personal income tax and access to an equalisation fund equal to 3% of
value added taxes (Davey 2004). Local governments share in government expenditures
as a percentage of general government expenditures was 7% in 2003 (Davey 2004). In
17
light of this data the scoring of Macedonia by Woldendorp et al. is questionable for the
post-2000 period but appears plausible for the 1991-1998 period (but see Todorovski
2001 for the late 1990s).
The higher score for Finland for Woldendorp et al. has to do with the fact that the
Regional Authority Index does not measure local government. Finland scores high on
subnational autonomy, a component of the Woldendorp et al. measure, which brings it
on par with the Scandinavian as well as with the federal countries. Unlike its
Scandinavian neighbors, Finland had no significant regional (or county) level of
government before 1993, which is why the Regional Authority Index underestimates
decentralization in Finland but not in the other Scandinavian countries.
A case where the source of disagreement lies in a different definition of the
boundaries of the country is Serbia and Montenegro which is scored relatively lower on
decentralization by Brancati than the Regional Authority Index. The main reason, it
appears, is that Brancati focuses primarily on Serbia during 1985−2000, while the
Regional Authority Index considers Serbia and Montenegro as a unit.27
Three cases of disagreement concern differences in whether particular tiers are
included or excluded.
The first is Belgium, which Hooghe and Marks give a lower score than the Regional
Authority Index in 1970 and in 1990. The main reason for this disagreement is that
Hooghe and Marks focused on one government tier −the most autonomous tier at a
given time point− rather than on all intermediate tiers. In 1970, the most autonomous
tier consisted of the provinces, and by 1990 −their next time point− it was the
communities. The Regional Authority Index, on the other hand, evaluates all
intermediate tiers of government present at any time point. Belgium is also a case of
18
disagreement with the Brancati measure. The main reason is that Brancati also focused
on one tier of government, namely the regions/communities but not the provinces. This
results in a lower scoring by Brancati.
A third case of divergence, also with the Hooghe and Marks measure, is Sweden
which is scored higher by the Regional Authority Index in 1950 and 1970. Hooghe and
Marks consider the county governments in the Scandinavian countries as local and do
not include them because their measure concerns regional autonomy. Hooghe and
Marks therefore do not include the län in Sweden whereas the Regional Authority Index
does28, resulting in a lower scoring by Hooghe and Marks.
The remaining disagreements cannot be reduced to the local government factor, to
country definition or to inclusion/exclusion of particular tiers.
A first and second case of divergence is Germany, which Lane and Ersson and
Brancati score significantly lower on decentralization than the Regional Authority Index.
Lane and Ersson give Germany 4 (out of 10), which places Germany at the same level as
Denmark, Finland and the Netherlands. The main reason for this is Lane and Ersson’s
unusually expansive operationalization of decentralization: not only does it include local
governance (+3 for Denmark and Finland), but also functional, neo-corporatist
autonomy (+2 for the Netherlands).
Brancati scores Germany 3 (out of 5) as she estimates that the Länder do not have
control over public order/police (-1) and constitutional amendments do not require
Länder approval (-1). Both coding decisions are contestable. Public order/police is
actually a concurrent power (Watts 1999 and Swenden 2006; this issue). On
constitutional change, Länder approval of constitutional amendments is indispensable
19
due to their dominance in the Bundesrat (this issue). Brancati does not measure shared
power exercised via an upper chamber but the Regional Authority Index does.
Another case of disagreement with the Brancati measure concerns Cyprus. Brancati
scores Cyprus 3 out of 5, while the Regional Authority Index scores it 0. The
disagreement lies in the operationalization of decentralization. Closer examination
shows that Brancati includes consociational arrangements laid down in the Constitution
which decentralize authority to the Greek and Turkish Communities while the Regional
Authority Index excludes decentralization to non-territorial actors.
A fourth and final case of disagreement is Poland which Arzaghi and Henderson
score higher than the Regional Authority Index. The difference in opinion appears to be
whether the central government has the ability to suspend or to override subnational
decisions. According to Arzaghi and Henderson, the answer is no, and so Poland
receives a score of 4 instead of 0 for this sub-indicator. The scoring of Poland seems to be
incorrect. The highest regional tier, the wojedwództwa, have gained directly elected
councils and more autonomy since the end of communism, but their decisions are still
subject to central sanctioning (see the country profiles in this issue; Council of Europe
2000: 47-48 and Kowalczyk 2000: 228). Central control is even greater for the lower
regional tier, powiaty, and for local government, the gminy, for which the central
government has the right to override decisions and has the authority to suspend the
councils (Council of Europe 2000: 46-51; Glowacki 2002: 113-114; Okraszewska and
Kwiatkowski 2002: 201-202; Kowalczyk 2000: 222-228).
20
CONTENT VALIDITY OF FISCAL INDICATORS
Fiscal indicators are widely employed as an overall measure of decentralization (see
for example Braun 2000; Castles 1999; Fisman and Gatti 2002; Lane and Ersson 1999;
Oates 1972; and Stegarescu 2005b). These indicators are based upon two extensively
used sources: the Governance Finance Statistics database by the International Monetary
Fund and Historical and/or National Accounts and/or Revenue Statistics of the
Organization of Economic Cooperation and Development. Many different
operationalizations exist but the most broadly used operationalizations are the
following:
a. subnational share of total government expenditures
b. intergovernmental grant share (i.e. grants from higher tier governments) as a
percentage of total subnational revenue
c. subnational own revenue (i.e. revenues from taxes plus fees and levies) as a
percentage of total subnational revenue
d. subnational tax revenue share as a percentage of total subnational revenue
e. subnational tax revenue share as a percentage of total government tax revenue
One can categorize the different operationalizations in two broad classes:
expenditure (a and b) and revenue (c, d and e) aggregate fiscal indicators. Both classes of
fiscal indicators raise two main caveats/problems with respect to content validity. First
of all, fiscal indicators do not differentiate very well between decision-making authority
and the authority to implement29 and, therefore, cannot be used to measure subnational
21
decision-making authority. The second caveat is that fiscal indicators do not measure
effectively differences in subnational implementation powers.
Caveat 1: Expenditure and revenue fiscal indicators fail to capture how much decision-
making authority subnational governments have and do not differentiate between decision-
making and implementation.
To exemplify this caveat one may differentiate between regulatory policies and policies
involving the direct expenditure of public funds (Majone 1994). This distinction helps us to
tell apart policies with a direct bearing on the public budget, for example welfare state
policies, from policies that are not expensive for government budgets but have
considerable impact on society through the rules they impose, for example civil and
criminal law. While the cost of expenditure programmes is borne by the public budget,
the cost of most regulatory policies is borne by citizens and firms (Majone 1994).
To the extent that regions have control over regulatory policies, expenditure fiscal
indicators would tell us nothing about decentralization. Imagine two countries, one in
which subnational governments have the authority to implement expenditure policies
(country A) and one in which subnational governments have authority regarding
regulatory policies (country B). An expenditure fiscal indicator will score country A
higher than country B on subnational decentralization. However, it would be wrong to
conclude that country A is more decentralized than country B or that subnational
governments in country A are more autonomous than those in country B. In fact,
subnational governments in country B might have much more autonomy than those in
country A since regulatory policies have to capacity to affect society deeply.
22
Fiscal indicators on the expenditure side are particularly problematic for capturing
decision-making decentralization, since it does not tell us whether the expenditure
comes from conditional or unconditional grants, whether the central government
determines how the money should be spent, whether it sets the framework legislation
within which subnational governments implement, or whether −indeed− subnational
governments spend the money autonomously (Akai and Sakata 2002; Breuss and Eller
2004; Burankaya and Lockwood 2007; Ebel and Yilmaz 2002; Fisman and Gatti 2002;
Panizza 1999; Sharma 2006).
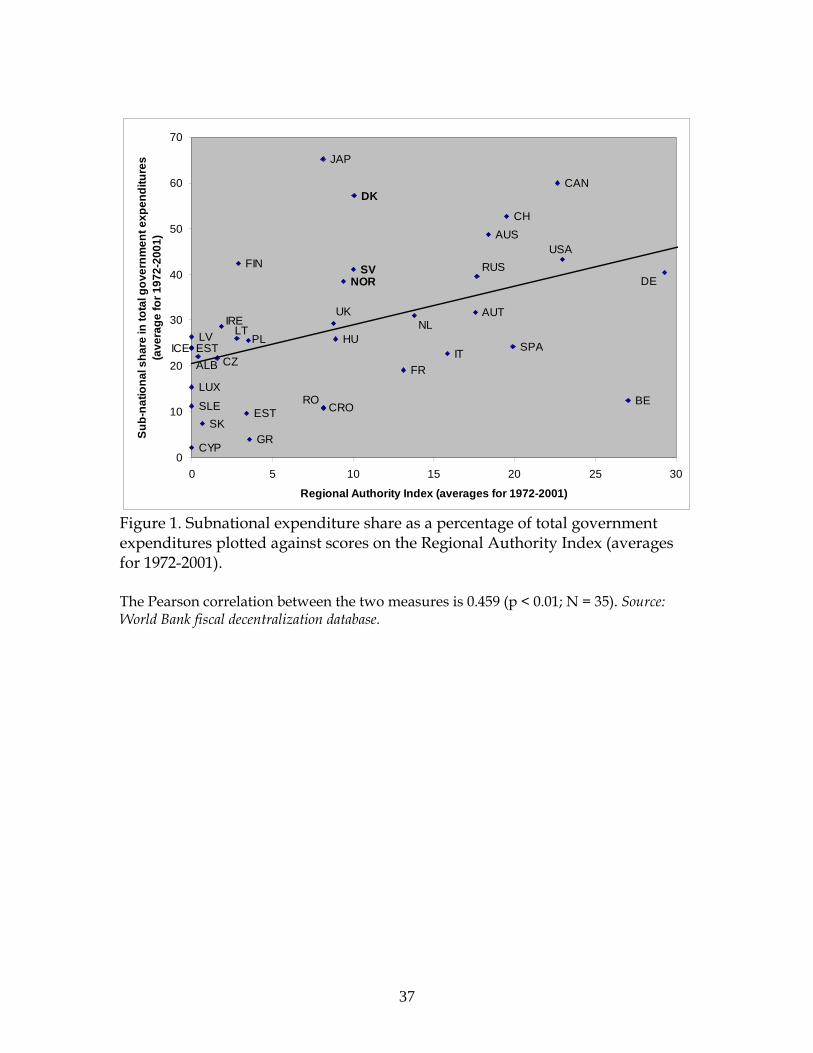
The argument can be shown empirically in a scatter plot of the Regional Authority
Index against the subnational share of total government expenditure (see Figure 1).
Subnational governments in Scandinavian countries have the same (or higher) shares of
total government expenditures than their peers in federal countries. To conclude from
this that Scandinavian countries are as decentralized as federal countries would be
wrong. Subnational governments in Scandinavian countries have less decision-making
authority over policies, less taxation power, and they do not enjoy power sharing.30 The
national government decides policies and local and regional governments implement
them (Rodden 2004).
[Figure 1 about here]
One could ‘correct’ the indicator for subnational share by looking at the share of
intergovernmental grants (Akai and Sakata 2002; Breus and Eller 2004; Oates 1972;
Stegarescu 2005a). This indicator measures the amount of central government
involvement in subnational provision of policies. Often a distinction is made between
conditional (specific) and unconditional (general) grants, whereby it is generally
assumed that central government involvement is higher with conditional grants (Shah
23

2007). A conditional grant ties expenditure to particular strings (conditions) imposed by
the central government. But this does not solve the problem. Aside from data
availability regarding unconditional and conditional grants (Rodden 2004), there is the
problem that intergovernmental grants do not seem to differentiate between federal and
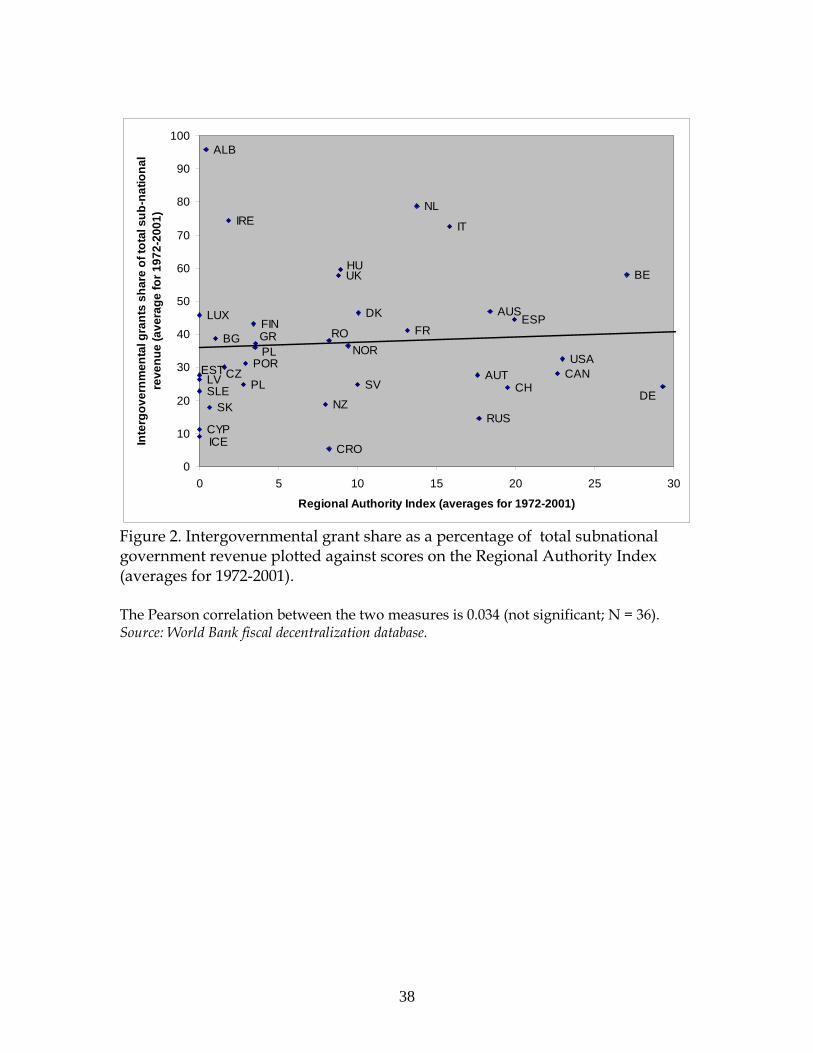
non-federal countries (see Figure 2), as an One-way Anova analysis as regards to
average (1972−2001) subnational intergovernmental grant share as a percentage of total
subnational revenue bears out (N = 35; F: 0.50; p = 0.482)31.
[Figure 2 about here]
Fiscal indicators on the revenue side are not biased against direct expenditure or
regulatory policies. But they generate their own problems of concept validity. Revenue
fiscal indicators do not help us figure out whether authorities that can tax autonomously
can also decide autonomously what to do with the money (Ebel and Yilmaz 2002;
Marlow 1988; Martinez-Vazquez and McNab 1997; Panizza 1999). While the revenue
might be collected freely, it may have to be spent on policies laid down by the central
government. There is no direct, theoretical or empirical, link between the authority to
collect revenues and the authority to decide and implement policies.
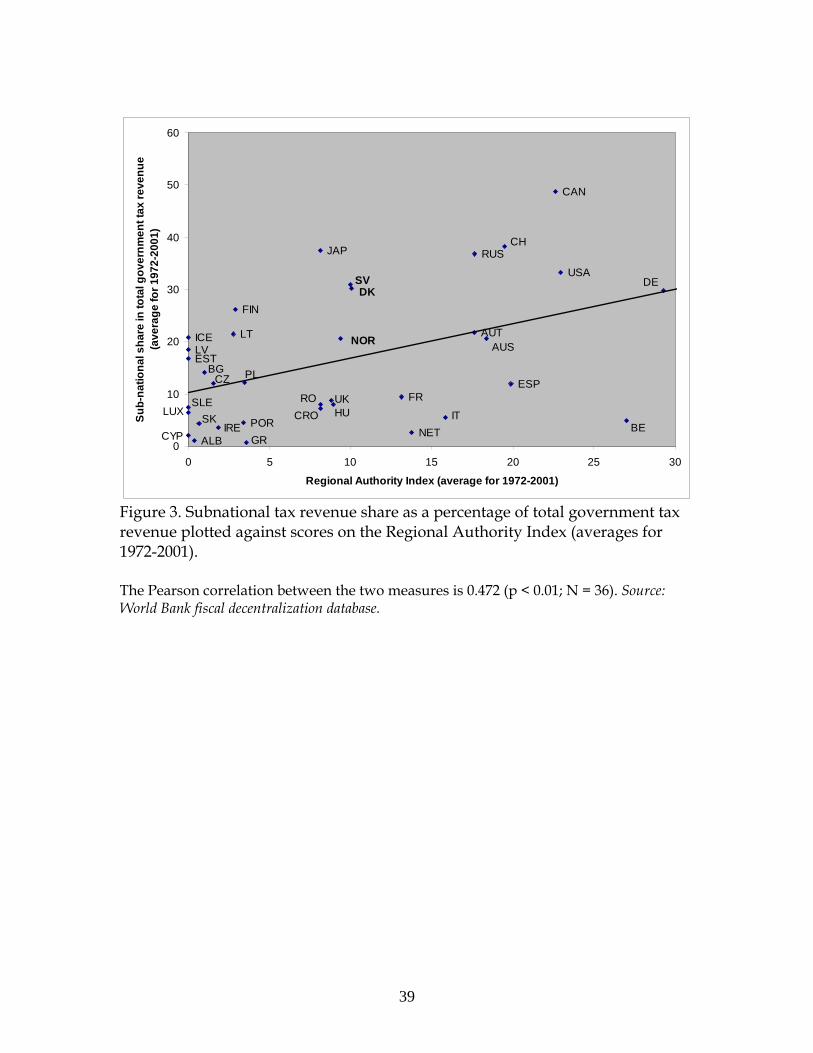
This is apparent in Figure 3 which plots the average Regional Authority Index score
for 1972−2001 against the subnational tax revenue as a percentage of total government
tax revenue (averages for 1972−2001). The correlation is moderate and significant (r =
0.47, p < 0.01, N = 36). But a closer look at individual countries reveals that Sweden and
Denmark are ranked at the same level as the USA and, to a lesser extent, the Russian
federation and Switzerland, all three of which are federations. The counties in Denmark
and Sweden may set the rate of income tax within central government parameters (this
issue). But it would be wrong to conclude that the subnational tiers in Sweden and
24
Denmark have the same policy and institutional autonomy as their peers in the USA, the
Russian federation and Switzerland.
[Figure 3 about here]
The fundamental difference between the subnational tiers in Sweden and Denmark
and the constituent units in federal countries is that the central government retains full
decision-making rights regarding tax powers in the former −and can unilaterally change
the rules if and whenever it so desires− while it is constitutionally bound to respect
regional tax powers in the USA, Switzerland, and arguably even in semi-democratic
Russia. Moreover, regional authorities in Sweden and Denmark have primarily
administrative powers over a broad range of policies within a national legislative
framework. In the USA, Switzerland and the Russian Federation subnational tiers have
principal authority over a swathe of policies.32
Caveat 2: Fiscal indicators do not necessarily measure differences in implementation
authority.
There are two reasons. First, one cannot differentiate whether observed differences
in fiscal centralization are due to genuine decentralization or whether they reflect
differences in political economy. The argumentation is given by Oates (1972, p. 199−200):
“… even if there exists an identical allocation of functions among levels of government across
two countries, their centralization ratios will generally differ if they do not have the same relative
expenditure patterns on these functions. A country, for example, with an unusually large portion
of its resources devoted to national defense will have, other things being equal, a relatively high
25

degree of fiscal centralization. …. centralization ratios may differ because certain services
provided publicly in one economy are provided in the private sector in another”
Note that this argument applies to the Regional Authority Index too but that fiscal
indicators, and especially direct expenditure policies, are vulnerable to this problem. In
the Scandinavian countries, a large proportion of government expenditure is devoted to
welfare state policies, and these are often provided by subnational governments. In
market-liberal Anglo-Saxon countries, welfare state functions tend to be privatized. So a
difference in political economy explains higher expenditure (and revenue) in
Scandinavian countries than in Anglo-Saxon countries whereas the allocation of
functions among levels of government might be identical. The Regional Authority Index
is not wholly invulnerable to the risk of conflating expenditure with authority, but since
it relies on legal documents to gauge the allocation of functions rather than fiscal data, it
avoids this problem to some extent.
Second, fiscal measures conflate whether an increase in fiscal numbers is the result of
a shift in functions or resources between government tiers, or whether it simply reflects
a change in the size of government activities (Stegarescu 2005a). An increase in fiscal
decentralization might be due to a relative increase in either the volume or the range of
public goods provided by subnational governments. In the former, authority has not
increased; in the latter, it has. Imagine a country in which a subnational government
provides unemployment benefits. If the following year the subnational government
provides sickness pay as well as unemployment benefits, there will have been an
increase in authority. This will coincide, presumably, with an increase in subnational
expenditure share and/or in an increase in subnational tax share (to finance the
26
increased expenditure). However, subnational expenditure (or revenue) could also have
increased without an expansion of authority, for example, if unemployment had
increased.
CONCLUSION
A comparison of the Regional Authority Index with seven decentralization indices in
the literature shows a great amount of agreement. A single underlying factor accounts
for about three-quarters of the variance. This is remarkable given the diverse ways of
operationalizing a fluid concept such as decentralization.
An analysis of residuals (by regressing the Regional Authority Index on the seven
decentralization indices) shows that the most consistent source of disagreement comes
from the fact that the Regional Authority Index focuses on regional government to the
exclusion of local government, while most decentralization indices include local
government. A second source of difference relates to the sophistication of the measures.
The more fine-grained Regional Authority Index is able to capture greater variation
among both federal and unitary countries than most decentralization indices. Finally,
countries-on-the-move, which have undergone major regionalization/federalization in
the post-Second World War period, and countries with asymmetrical regions tend to
generate more diverse scores differ across decentralization indexes than countries with
greater architectural stability.
Finally, an analysis of the content validity of fiscal indicators examined the
shortcomings of fiscal indicators as a measurement of subnational authority or
decentralization. Two caveats were considered. First, fiscal indicators fail to capture
27
whether subnational governments can decide autonomously what to do with the
money. Second, we cannot tell whether differences in fiscal decentralization is due to
genuine political decentralization or due to differences in political economy and/or a
change in the size of government activities. Their value as a proxy for decentralization
appears therefore limited.
28
REFERENCES Adcock, Robert and David Collier (2001), ‘Measurement Validity: A Shared Standard for
Qualitative and Quantitative Research’, American Political Science Review, Vol.95, No.3, pp.529-46.
Akai, Nobuo and Masayo Sakata (2002), ‘Fiscal Decentralization Contributes to Economic Growth: Evidence from State-Level Cross-Section Data for the United States’, Journal of Urban Economics, Vol.52, No.1, pp.93-108.
Arzaghi, Mohammed and J. Vernon Henderson (2005) ‘Why Countries are Fiscally Decentralizing’, Journal of Public Economics, Vol.89, No.7, pp.1157-89. Database available at: http://www.econ.brown.edu/faculty/henderson/papers.html
Baldi, Brunetta (1999), ‘Beyond the Federal-Unitary Dichotomy’, Working Paper. Institute of Governmental Studies. Univeristy of California, Berkely.
Bollen, Kenneth (1989), Structural Equations with Latent Variables. New York: Wily. Brancati, Dawn (2006), ‘Decentralization: Fueling or Dampening the Flames of Ethnic
Conflict and Secessionism’, International Organization, Vol.60, No.3, pp.651-85. Braun, Dietmar (2000), ‘The Territorial Division of Power in Comparative Public Policy
Research: An Assessment’, in: Dietmar Braun (ed), Public Policy and Federalism. Aldershot, Ashgate.
Breauss, Fritz and Markus Eller (2004), ‘Fiscal Decentralisation and Economic Growth: Is There Really a Link?’, CESifo DICE Report, Journal of Institutional Comparisons, Vol.2, No.1, pp.3-9.
Castles, Francis G. (1999), ‘Decentralization and the Post-War Economy’, European Journal of Political Research, Vol.36, No.1, pp.27-53.
Council of Europe (2000). Structure and Operation of Local and Regional Democracy: Poland. Strasbourg: Council of Europe.
Davey, Kenneth (2004), Fiscal Decentralisation in South-Eastern Europe. Budapest: The Local Government and Public Reform Initiative.
Ebel, Robert D. and Serdar Yilmaz (2002), ‘On the Measurement and Impact of Fiscal Decentralization’, Policy Research Working Paper, 2809, Washington: World Bank.
Enikolopov, Ruben and Ekaterina Zhuravskaya (2007), ‘Decentralization and Political Institutions’, Journal of Public Economics, Vol.91, No.11-12, pp.2261-90.
Fisman, Raymond and Roberta Gatti (2002), ‘Decentralization and Corruption: Evidence Across Countries’, Journal of Public Economics, Vol.83, No.3, pp.325-45.
Glowacki, Viktor (2002), ‘Regionalization in Poland’, in: Gérard Marcou (ed) Regionalization for Development and Accession to the EU: A Comparative Perspective. Budapest: The Local Government and Public Reform Initiative.
Hooghe, Liesbet and Gary Marks (2001), Multi-Level Governance and European Integration. Lanham: Rowman and Littlefield.
Kowalczyk, Andrzej (2000), ’Local Government in Poland’, in: Tamás M. Horváth (ed) Decentralization: Experiments and Reforms, Volume 1. Budapest: Local Government and Public Sector Reform Initiative.
Lane, Jan-Erik and Svante Ersson (1999), Politics and Society in Western Europe. London: Sage Publications.
Lijphart, Arend (1999), Patterns of Democracy: Government Forms and Performance in Thirty-Six Countries. New Haven: Yale University Press.
29

Majone, Giandomenico (1994), ‘The Rise of the Regulatory State in Europe’, West European Politics, Vol.17, No.3, pp.77-101.
Martinez-Vazquez, Jorge and Robert McNab (1997), ‘Fiscal Decentralization, Economic Growth, and Democratic Governance’, Working Paper 97-7, George State University: Andrew Young School of Policy Studies.
Meloche, Jean-Philippe, François Vaillancourt, and Serdar Yilmaz (2004), ‘Decentralization or Fiscal Autonomy? What Does Really Matter? Effects of Growth and Public Sector Size in European Transition Countries’, Policy Research Working Paper, 3254, Washington: World Bank.
Marks, Gary, Liesbet Hooghe, Marco R. Steenbergen, and Liesbet Hooghe (2007), ‘Crossvalidating Data on Party Positioning on European Integration,' Electoral Studies, Vol.26, No.1, pp.23–38.
Oates, Wallace (1972), Fiscal Federalism. New York: Harcourt Brace Javanovich. Okraszewska, Aldona and Jacek Kwiatkowski (2002), ‘The State of Democracy in
Poland’s Gminas‘, in: Gábor Soós, Gábor Tóka, and Glen Wright (eds) The State of Local Democracy in Central Europe. Budapest: Local Government and Public Service Reform Initiative.
Panizza, Ugo (1999), ‘On the Determinants of Fiscal Centralization: Theory, and Evidence’, Journal of Public Economics, Vol.74, No.1, pp.97-139.
Ray, Leonard (2007), ‘Validity of Measured Party Positions on European Integration: Assumptions, Approaches, and a Comparison of Alternative Measures’, Electoral Studies, Vol.26, No.1, pp.11-22.
Rodden, Jonathan (2004), ‘Comparative Federalism and Decentralization. On Meaning and Measurement’, Comparative Politics, Vol.36, No.4, pp.481-99.
Schneider, Aaron (2003), ‘Decentralization: Conceptualization and Measurement’, Studies in Comparative International Development, Vol.38, No.3, pp.32-56.
Shah, Anwar (2007), ‘A Practioner’s Guide to Intergovernmental Fiscal Transfers’, in Robin Boadway and Anwar Shah (eds), Intergovernmental Fiscal Transfers. Principles and Practice. World Bank, Washington DC.
Sharma, Chanchal Kumar (2006), ‘Decentralization Dilemma: Measuring the Degree and Evaluating the Outcomes, The Indian Journal of Political Science, Vol.67, No.1, pp.49-64. Available at: http://mpra.ub.uni-muenchen.de/204/
Stegarescu, Dan (2005a), ‘Public Sector Decentralisation: Measurement, Concepts and Recent International Trends’, Fiscal Studies, Vol.26, No.3, pp.301-33.
Stegarescu, Dan (2005b), ‘Costs, Preferences, and Institutions: An Empirical Analysis of the Determinants of Government Decentralization’, Discussion Paper No. 05-39, Manheim: Centre for European Economic Research.
Swenden, Wilfried (2006), Federalism and Regionalism in Western Europe. A Comparative and Thematic Analysis. Houndmills: Palgrave Macmillan.
Todorovski, Ilija (2001), ‘Local Government in Macedonia’, in Emilia Kandeva (ed) Stabilization of Local Governments. Local Governments in Central and Eastern Europe. Volume 2. Budapest: Local Government and Public Sector Reform Initiative.
Treisman, Daniel (2002), ‘Defining and Measuring Decentralization: A Global Perspective’, Unpublished manuscript.
Watts, Ronald L. (1999) Comparing Federal Systems. Second Edition. Montreal: McGill-Queen’s University Press.
30
Woldendorp, Jaap, Hans Keman and Ian Budge (2000), Party Government in 28 Democracies (1945-1998): Composition – Duration – Personnel. Dordrecht: Kluwer Academic Publisihers.
World Bank fiscal decentralization database (consulted May 2006): http://web.worldbank.org/WBSITE/EXTERNAL/TOPICS/EXTPUBLICSECTORANDGOVERNANCE/EXTDSRE/0,,contentMDK:20248616~menuPK:2086395~pagePK:210058~piPK:210062~theSitePK:390243,00.html
31
32
Table 1. Factor analyses of seven decentralization indices and the Regional Authority Index. Decentralization index Factor
analysis I Factor
analysis II Factor
analysis III Factor
analysis IV
Regional Authority Index 0.996 0.934 0.920 0.910
Arzaghi and Henderson (2005) 0.748 ─ ─ ─
Brancati (2006) 0.771 0.840 0.917 0.906
Hooghe and Marks (2001) 0.945 0.924 ─ ─
Lane and Ersson (1999) 0.809 0.740 ─ ─
Lijphart (1999) 0.894 0.923 0.931 ─
Treisman (2002) 0.824 0.884 0.869 0.906
Woldendorp et al. (2000) 0.920 0.789 0.874 0.866
N 7 14 23 36 Eigenvalue 6.017 5.232 4.072 3.209
Explained Variance 75% 75% 81% 80%
Note: All indices are standardized. Shown are the factor loadings resulting from a principal axis analysis. The following time periods are compared with each other: Regional Authority Index (average for 1950−2006); Arzaghi and Henderson (average score of eight, five-year intervals between 1960−1995); Brancati (one score for 1985−2000); Hooghe and Marks (average of four time points: 1950, 1970, 1990, 2000); Lane and Ersson (one score for 1945−1995); Lijphart (one score for 1945−1996); Treisman (one score for the mid−1990s); Woldendorp et al. (one score for 1945−1998).

Table 2. Comparison of means, standard deviations, and ranges between federal and non-federal countries for eight decentralization indices (standardized). Decentralization index Federal countries Non-federal countries Ratio Mean St. dev. N Min − Max Mean St. dev. N Min − Max
Arzaghi and Henderson (2005) 0.873 0.776 5 -0.892 − 1.400 -0.397 0.825 11 -1.351 − 0.942 0.941
Brancati (2006) 1.203 0.863 9 -0.318 − 2.616 -0.349 0.736 31 -2.274 − 1.638 1.173
Hooghe and Marks (2001) 1.829 0.323 8 1.527 − 2.131 -0.305 0.700 48 -0.890 − 1.829 0.423
Lane and Ersson (1999) 1.259 1.033 3 0.663 − 2.452 -0.252 0.809 15 -1.127 − 1.259 1.277
Lijphart (1999) 1.539 0.128 6 1.278 − 1.592 -0.513 0.483 18 -0.917 − 0.400 0.265
Treisman (2002) 1.396 0.821 8 0.525 − 2.848 -0.319 0.727 33 -0.636 − 1.687 1.129
Woldendorp et al. (2000) 1.468 0.690 7 0.616 − 2.243 -0.342 0.709 30 -1.554 − 0.616 0.973
Regional Authority Index 1.477 0.547 9 0.896 − 2.340 -0.409 0.652 33 -1.030 − 1.452 0.839
Note: The ratio score is obtained by dividing the standard deviation for federal countries by the standard deviation of non-federal countries. A ratio of more than 1 indicates that federal countries vary more in their scores than non-federal countries. A ratio score of less than 1 indicates that non-federal countries vary more than in their scores than federal countries. The following countries were considered federal for most of the time during their democratic existence in the post-Second World War period: Australia, Austria, Bosnia and Herzegovina, Canada, Germany, Russian Federation, Serbia and Montenegro, Switzerland and the United States.
33
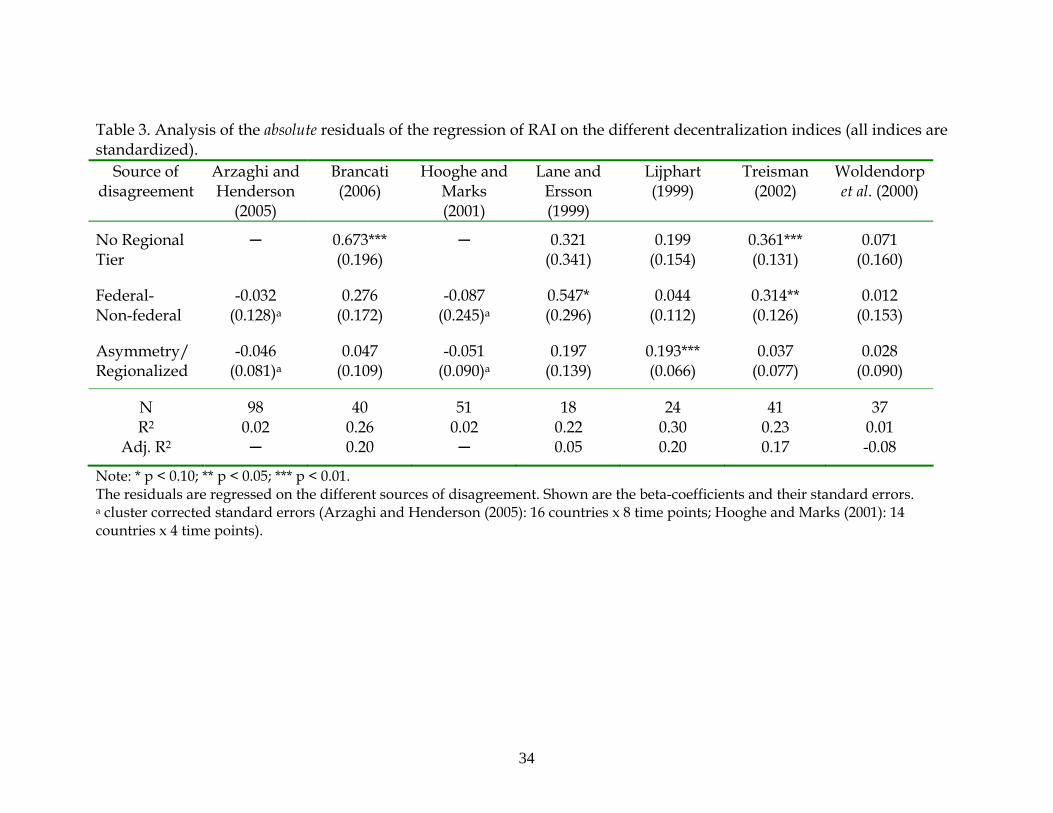
Table 3. Analysis of the absolute residuals of the regression of RAI on the different decentralization indices (all indices are standardized).
Source of disagreement
Arzaghi and Henderson
(2005)
Brancati (2006)
Hooghe and Marks (2001)
Lane and Ersson (1999)
Lijphart (1999)
Treisman (2002)
Woldendorp et al. (2000)
No Regional ─ 0.673*** ─ 0.321 0.199 0.361*** 0.071 Tier (0.196) (0.341) (0.154) (0.131) (0.160)
Federal- -0.032 0.276 -0.087 0.547* 0.044 0.314** 0.012 Non-federal (0.128)a (0.172) (0.245)a (0.296) (0.112) (0.126) (0.153)
Asymmetry/ -0.046 0.047 -0.051 0.197 0.193*** 0.037 0.028 Regionalized (0.081)a (0.109) (0.090)a (0.139) (0.066) (0.077) (0.090)
N 98 40 51 18 24 41 37 R2 0.02 0.26 0.02 0.22 0.30 0.23 0.01
Adj. R2 ─ 0.20 ─ 0.05 0.20 0.17 -0.08
Note: * p < 0.10; ** p < 0.05; *** p < 0.01. The residuals are regressed on the different sources of disagreement. Shown are the beta-coefficients and their standard errors. a cluster corrected standard errors (Arzaghi and Henderson (2005): 16 countries x 8 time points; Hooghe and Marks (2001): 14 countries x 4 time points).
34
35
Table 4. Analysis of the raw residuals of the regression of RAI on the different decentralization indices (all indices are standardized).
Source of disagreement
Arzaghi and Henderson
(2005)
Brancati (2006)
Hooghe and Marks (2001)
Lane and Ersson (1999)
Lijphart (1999)
Treisman (2002)
Woldendorp et al. (2000)
No Regional ─ -1.093*** ─ -0.221 -0.304 -0.766*** -0.493** Tier (0.256) (0.514) (0.259) (0.209) (0.238)
Federal- 0.413* 0.457** -0.232 0.910* -0.144 0.180 0.318 Non-federal (0.233)a (0.225) (0.356)a (0.446) (0.187) (0.201) (0.228)
Asymmetry/ -0.169 0.133 0.057 0.387* 0.289** 0.157 0.120 Regionalized (0.152)a (0.143) (0.156)a (0.210) (0.111) (0.123) (0.134)
N 98 40 51 18 24 41 37 R2 0.20 0.48 0.05 0.35 0.38 0.38 0.24
Adj. R2 ─ 0.44 ─ 0.21 0.29 0.33 0.17
Note: * p < 0.10; ** p < 0.05; *** p < 0.01. The residuals are regressed on the different sources of disagreement. Shown are the beta-coefficients and their standard errors. A negative sign means underestimation and a positive sign means overestimation of the Regional Authority Index. a cluster corrected standard errors (Arzaghi and Henderson (2005): 16 countries x 8 time points; Hooghe and Marks (2001): 14 countries x 4 time points).
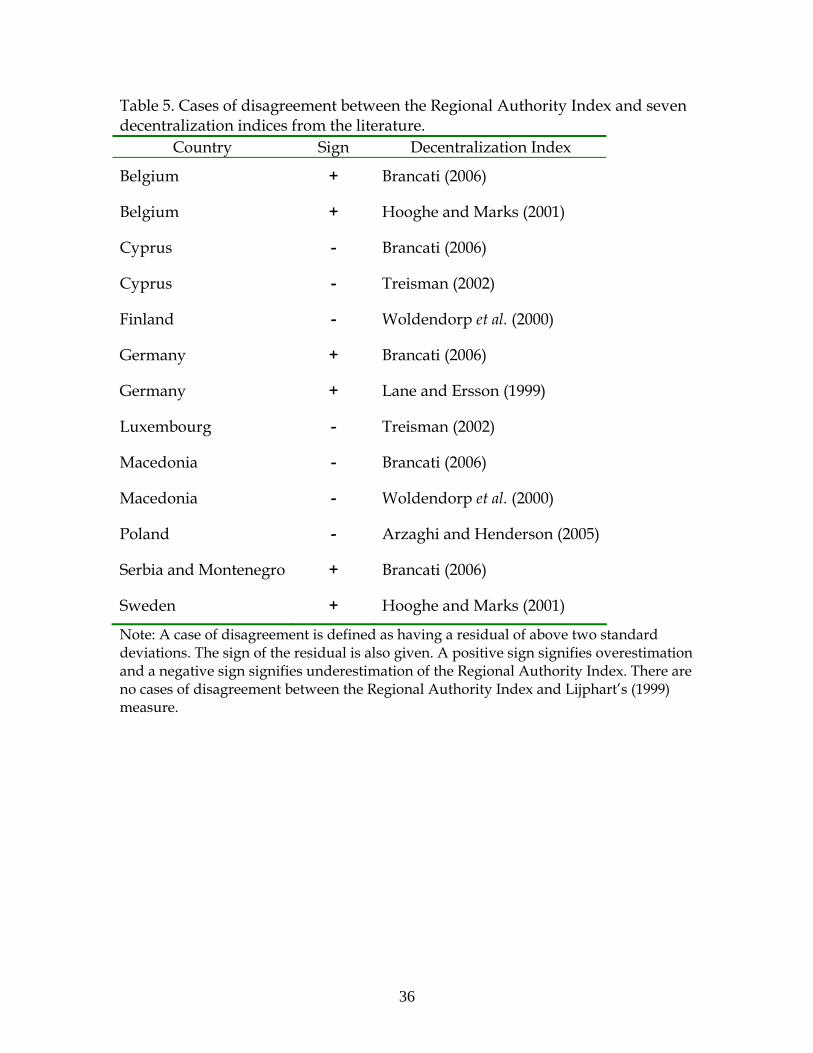
Table 5. Cases of disagreement between the Regional Authority Index and seven decentralization indices from the literature.
Country Sign Decentralization Index
Belgium + Brancati (2006)
Belgium + Hooghe and Marks (2001)
Cyprus - Brancati (2006)
Cyprus - Treisman (2002)
Finland - Woldendorp et al. (2000)
Germany + Brancati (2006)
Germany + Lane and Ersson (1999)
Luxembourg - Treisman (2002)
Macedonia - Brancati (2006)
Macedonia - Woldendorp et al. (2000)
Poland - Arzaghi and Henderson (2005)
Serbia and Montenegro + Brancati (2006)
Sweden + Hooghe and Marks (2001)
Note: A case of disagreement is defined as having a residual of above two standard deviations. The sign of the residual is also given. A positive sign signifies overestimation and a negative sign signifies underestimation of the Regional Authority Index. There are no cases of disagreement between the Regional Authority Index and Lijphart’s (1999) measure.
36
CAN
DE
CHAUS
USARUS
AUT
SPAIT
BE
FR
DK
NLUK
ROCRO
SV
HU
NOR
JAP
FIN
GR
EST
CZ
LTPL
IRE
ALB
LVICE EST
LUX
SLESK
CYP0
10
20
30
40
50
60
70
0 5 10 15 20 25 30
Regional Authority Index (averages for 1972-2001)
Sub-
natio
nal s
hare
in to
tal g
over
nmen
t exp
endi
ture
s (a
vera
ge fo
r 197
2-20
01)
Figure 1. Subnational expenditure share as a percentage of total government expenditures plotted against scores on the Regional Authority Index (averages for 1972-2001). The Pearson correlation between the two measures is 0.459 (p < 0.01; N = 35). Source: World Bank fiscal decentralization database.
37
CYPICE
SKSLELV
EST
BG
LUX
IRE
ALB
FINGRPL
PORCZ
PL
NORRO
NZ
CRO
SV
FRDK
HUUK
NL
RUS
CH
IT
BE
AUT
AUSESP
USACAN
DE
0
10
20
30
40
50
60
70
80
90
100
0 5 10 15 20 25 30
Regional Authority Index (averages for 1972-2001)
Inte
rgov
ernm
enta
l gra
nts
shar
e of
tota
l sub
-nat
iona
l re
venu
e (a
vera
ge fo
r 197
2-20
01)
Figure 2. Intergovernmental grant share as a percentage of total subnational government revenue plotted against scores on the Regional Authority Index (averages for 1972-2001). The Pearson correlation between the two measures is 0.034 (not significant; N = 36). Source: World Bank fiscal decentralization database.
38
BGESTLVICE
SLELUX
SKCYP
IREALB
PORGR
NETCRO HU
UKRO FR
BEIT
CZ PL
LT NOR
FINDK
SV
AUSAUT
ESP
DEUSA
RUSCH
CAN
JAP
0
10
20
30
40
50
60
0 5 10 15 20 25 30
Regional Authority Index (average for 1972-2001)
Sub-
natio
nal s
hare
in to
tal g
over
nmen
t tax
reve
nue
(ave
rage
for 1
972-
2001
)
Figure 3. Subnational tax revenue share as a percentage of total government tax revenue plotted against scores on the Regional Authority Index (averages for 1972-2001). The Pearson correlation between the two measures is 0.472 (p < 0.01; N = 36). Source: World Bank fiscal decentralization database.
39

Appendix Table A.1. Pearson correlations among eight decentralization indices. (1) (2) (3) (4) (5) (6) (7) (8)
(1) Regional Authority Index 1
(2) Arzaghi and Henderson (2005) 0.758** 1
(3) Brancati (2006) 0.667** 0.607* 1
(4) Hooghe and Marks (2001) 0.877** 0.799* 0.749** 1
(5) Lane and Ersson (1999) 0.632** 0.439 0.566* 0.548* 1
(6) Lijphart (1999) 0.856** 0.719* 0.791** 0.880** 0.839** 1
(7) Treisman (2002) 0.790** 0.576* 0.790** 0.832** 0.628** 0.726** 1
(8) Woldendorp et al. (2000) 0.740** 0.826** 0.721** 0.646* 0.808** 0.845** 0.671** 1
Note: * p < 0.05; ** p < 0.01. Pairwise deletion: N = 42.
40

Table A.2. Pearson correlations among disagreement estimators. No Regional Tier Federal−
Non federal Asymmetry/ Regionalized
No Regional Tier 1
Federal−Non federal -0.253 1
Asymmetry/Regionalized -0.267* -0.019 1
Note: * p < 0.10; (N = 42).
41
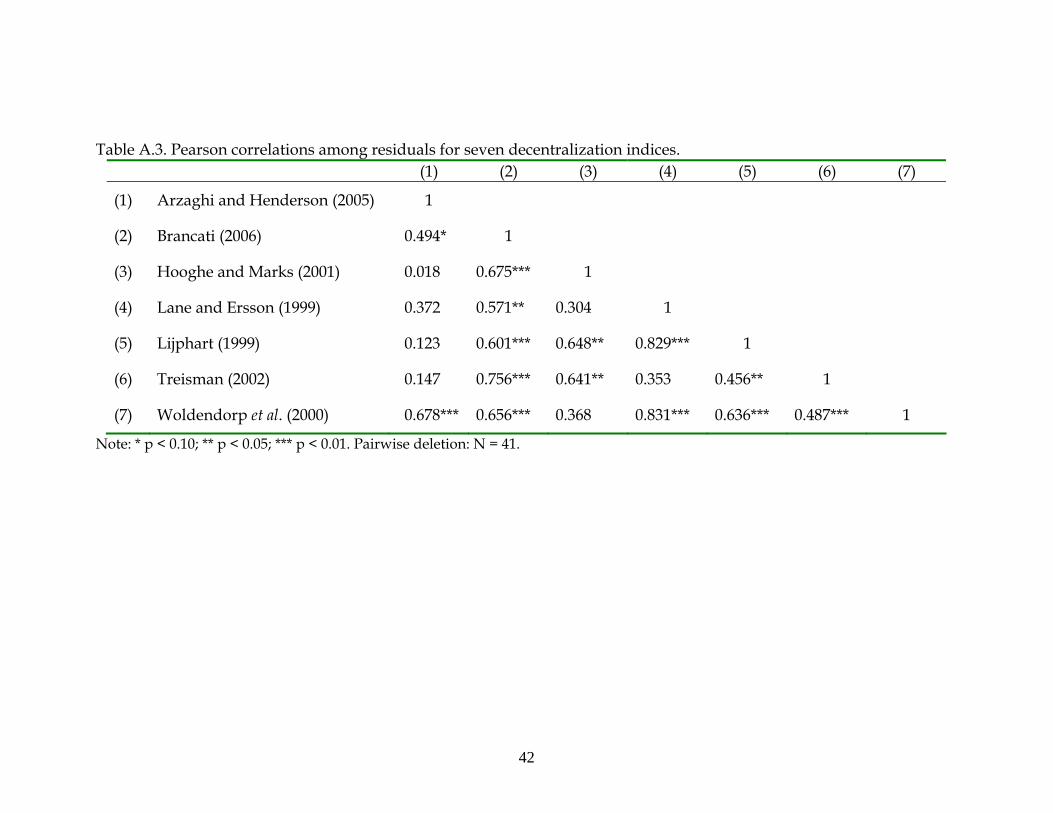
Table A.3. Pearson correlations among residuals for seven decentralization indices.
(1) (2) (3) (4) (5) (6) (7)
(1) Arzaghi and Henderson (2005) 1
(2) Brancati (2006) 0.494* 1
(3) Hooghe and Marks (2001) 0.018 0.675*** 1
(4) Lane and Ersson (1999) 0.372 0.571** 0.304 1
(5) Lijphart (1999) 0.123 0.601*** 0.648** 0.829*** 1
(6) Treisman (2002) 0.147 0.756*** 0.641** 0.353 0.456** 1
(7) Woldendorp et al. (2000) 0.678*** 0.656*** 0.368 0.831*** 0.636*** 0.487*** 1
Note: * p < 0.10; ** p < 0.05; *** p < 0.01. Pairwise deletion: N = 41.
42

1 Bollen (1989) and Ray (2007) distinguish four types of validity. In addition to the two mentioned types of validity they identify criterion validity and construct validity. Criterion validity “involves the comparison of a measure with some other generally accepted measure of the same concept” (Ray 2007: 12). A given measure is compared to a ‘golden standard’. Since there is no ‘golden standard’ for decentralization, criterion validity cannot be assessed. Construct validity “assesses whether a measure relates to other observed variables in a way that is consistent with theoretically derived predictions” (Bollen 1989: 188). Construct validity is not assessed because theoretically derived predictions relating to the effects of regionalization and decentralization are imprecise. 2 The dataset, from which the Arzaghi and Henderson (2005) scores are derived, was kindly provided by Christine A. Kearney. 3 Australia, Canada, France, Germany, Greece, Hungary, Italy, Japan, the Netherlands, Poland, Romania, Russian Federation, Spain, Turkey, United Kingdom, and the USA. 4 Australia, Austria, Belgium, Bosnia and Herzegovina, Bulgaria, Canada, Croatia, Cyprus, the Czech Republic, Denmark, Estonia, Finland, France, Germany, Greece, Hungary, Iceland, Ireland, Italy, Japan, Latvia, Lithuania, Luxembourg, Macedonia, the Netherlands, New Zealand, Norway, Poland, Portugal, Romania, Russian Federation, Serbia and Montenegro, Slovakia, Slovenia, Spain, Sweden, Switzerland, Turkey, United Kingdom, and the USA. 5 Seventeen country scores were provided by Brancati (2006) herself (i.e. Belgium, Bosnia and Herzegovina, Canada, Estonia, Finland, Greece, Lithuania, Norway, Poland, Romania, Slovenia, Spain, Sweden, Switzerland, Turkey, United Kingdom, and the United States). Twenty-three countries were and scored by the author on the basis of information provided by Brancati in personal communication. 6 Austria, Belgium, Denmark, Finland, France, Germany, Greece, Ireland, Italy, the Netherlands, Portugal, Spain, Sweden and the United Kingdom. 7 Austria, Belgium, Denmark, Finland, France, Germany, Greece, Iceland, Ireland, Italy, Luxembourg, the Netherlands, Norway, Portugal, Spain, Sweden, Switzerland and the United Kingdom. 8 The authors do not refer to a precise time point but since their book concerns the 1945─1995 period it is reasonable to assume that they consider scores to be an average for this time period. 9 Australia, Austria, Belgium, Canada, Denmark, Finland, France, Germany, Greece, Iceland, Ireland, Italy, Japan, Luxembourg, Malta, the Netherlands, New Zealand, Norway, Portugal, Spain, Sweden, Switzerland, United Kingdom and the USA. 10 Lijphart (1999) presents average scores for the years 1945 to 1996. 11 Vertical decentralization is operationalized as the number of tiers in a country (Treisman 2002: 5 and 14). The Pearson correlation with the Regional Authority Index is 0.546 (p < 0.01; N = 38). Appointment decentralization is conceptualized as the extent to which executive appointments are made by actors at the same (or lower) tier, rather than from above (“for each appointment that was made by an actor at a higher tier, one point is assigned for each tier that the appointer was above the appointee” Treisman 2002: 17). Electoral decentralization is operationalized as the extent to which subnational officials are elected (“percentage of subnational tiers at which the executive was chosen by direct
43
44
election or selected by a directly elected legislature” Treisman 2002: 18). Appointment and electoral decentralization appear to have affinity with the representation dimension of the Regional Authority Index, i.e. executive and assembly, respectively. The Pearson correlations are low: -0.144 (not significant; N = 38) and 0.215 (not significant; N = 39), respectively. Fiscal decentralization is the share of subnational government in total tax revenues or the share of subnational government in public expenditures. Both are fiscal indicators, and as I argue below, they raise important concept validity concerns. Personnel decentralization is the share of subnational governments in total government administration employees (Treisman 2002: 19). The Pearson correlation between this indicator and the Regional Authority Index is 0.562 (p < 0.01; N = 32). 12 The decision to sum three types of decision making decentralization is mine. Treisman is reluctant to combine the various measures of decentralization into a single index. For example, he notes that “the right of subnational actors to interfere in central legislative decisions will not necessarily coincide with their autonomy from central interference, so it makes more sense to use [the] different types of indicators separately than to combine them” (2002: 9-10). This is a defensible position, theoretically or empirically, it is perfectly possible that these different decentralization rights not coincide. The starting point in this article, and in the issue as a whole, is that decentralization is a multifaceted phenomenon which is best captured by combining measures of diverse components. The Regional Authority Index introduced in this special issue differentiates between self rule and shared rule, and these concepts resemble Treisman’s notions of subnational autonomy from central interference and subnational actors right to interfere in central legislative decisions respectively. Just as the Regional Authority Index is a summation of self rule and shared rule, it seems sensible to combine the two indicators of decision-making decentralization into a single measure. 13 Albania, Australia, Austria, Belgium, Bulgaria, Canada, Croatia, Cyprus, the Czech Republic, Denmark, Estonia, Finland, France, Germany, Greece, Hungary, Iceland, Ireland, Italy, Japan, Latvia, Lithuania, Luxembourg, Macedonia, Malta, the Netherlands, New Zealand, Norway, Poland, Portugal, Romania, Russian Federation, Slovakia, Slovenia, Spain, Sweden, Switzerland, Turkey, United Kingdom, and the USA. 14 The operationalization of central fiscalization diverges somewhat from the one published in Woldendorp et al. (2000). The adjustments were made after communication with Hans Keman and Jaap Woldendorp. 15 Australia, Austria, Belgium, Bulgaria, Canada, the Czech Republic, Denmark, Estonia, Finland, France, Germany, Greece, Hungary, Iceland, Ireland, Italy, Japan, Latvia, Lithuania, Luxembourg, Macedonia, Malta, Netherlands, New Zealand, Norway, Poland, Portugal, Romania, Russian Federation, Slovakia, Slovenia, Spain, Sweden, Switzerland, Turkey, United Kingdom and the USA. 16 The authors do not specify a particular time point, but since their book covers the 1945-1998 time span it seems reasonable to assume that their scores average the situation for the duration of this time period. 17 The Pearson correlations between the decentralization indexes are given in the appendix. 18 The approach is similar to the one developed by Marks et al. 2007 in cross-validating several measures of party positioning. 19 ANOVA results available upon request from the author.
45
20 No regional tier: whether the country has a regional tier or not (0 = country has a regional tier; 1 = country has no regional tier, i.e. Cyprus, Estonia, Iceland, Latvia, Luxembourg, Macedonia, Malta, and Slovenia). Federal-non federal: whether the country has been a federal or non-federal country for the largest part of the post-Second World War period (since becoming democratic) (0 = non-federal country; 1 = federal country i.e. Australia, Austria, Bosnia and Herzegovina, Canada, Germany, Russian Federation, Serbia and Montenegro, Switzerland and the United States). 21 Countries which scored one point: Australia (Territories versus States), Belgium (Gemeenschappen versus Regio’s), Canada (Territories versus Provinces), Denmark (Færøerne and Grønland versus Amter), Finland (Åland), Italy (Regioni a statuto speciale versus Regioni a statuto ordinare), Portugal (Açores and Madeira), Spain (Ceuta and Mellila; historic Autonomas Comunidades versus the other Comunidades), United Kingdom (Northern Ireland, London Regional Authority, Scotland and Wales versus Regions) and the United States (Alaska, Hawaii and Washington D.C. versus States). 22 The cut-off point of having regionalized is to have had an absolute change of at least 10 in the Regional Authority Index country score over the post-Second World War period. The following countries meet this criterion: Belgium, France, Italy, Spain and the United Kingdom. Since most changes involve more autonomy, I call this variable ‘regionalized’, though for the United Kingdom there almost as many ‘negative’ as positive changes (because of the suspension of the parliament of Northern Ireland and the abolishment of the counties in Northern Ireland, Scotland, Wales and parts of England). This does not need to concern us since the variable should indicate whether there is difference cross-sectionally and over- time. Differences increase the likelihood of disagreement. 23 The Pearson correlations between the sources of disagreement and between the residuals of the different decentralization indices are given in the appendix. 24 Art. 108 (dataset from Treisman). 25 Art. 176 (dataset from Treisman). 26 Data provided by Brancati (pers. comm.). 27 The other decentralization indexes do not include Yugoslavia and/or Serbia and Montenegro for the time period in question. 28 The upper chamber with län representation was abolished in 1971 and the Regional Authority Index score decreases for subsequent time periods. Therefore the time points 1990 and 2000 do not lead to a case of disagreement. 29 The distinction between the authority to decide and the authority to implement is based upon Braun’s (2000) ‘Right to Decide’ and ‘Right to Act’ respectively. “The Right to Decide refers to who may decide what will be done (policy formulation and decision-making). The Right to Act refers to who may decide on how it will be done (policy implementation)” (Braun 2000, p. 29; original italics). 30 Sweden counties (län) were represented in an upper chamber before the 1971 parliamentary reform. The data reflect the 1972−2001 period. 31 The following countries were considered to be federal Australia, Austria, Belgium, Canada, Germany, Russia, Spain, Switzerland and the United States of America. Excluding Belgium and Spain from the federal group does not lead to different conclusions (oneway ANOVA analysis: N = 35; F: 1.85, p = 0.182). 32 One could extend this argument to the other countries in the dataset.