validation of the time based separation concept at london ... · pdf filetenth usa/europe air...
TRANSCRIPT

Tenth USA/Europe Air Traffic Management Research and Development Seminar (ATM2013)
Validation of the Time Based Separation concept at London Heathrow Airport
Charles Morris and John Peters Approach and Wake Concepts Team
NATS CTC Whiteley, United Kingdom [email protected]
Peter Choroba Transversal Performance & Methods Unit EUROCONTROL Experimental Centre
Bretigny sur Orge, France [email protected]
Abstract — Headwind conditions on final approach cause a reduction in the landing rate which impacts not only the achieved capacity, but also the predictability of operations, time and fuel efficiency, and the environment (emissions). The ground speed reduction in headwind conditions results in an increase in the time spacing between each arrival pair for distance based separations. The Time Based Separation (TBS) concept changes the separation rules on final approach from distance based to time based to stabilize the time spacing between arrival pairs across headwind conditions in order to recover the lost landing rate currently experienced. This paper presents the key results of the final research phase of the validation of the TBS concept. This validation has been conducted in the framework of the SESAR Development phase project P6.8.1 Flexible and Dynamic Use of Wake Turbulence Separations. The work in P6.8.1 started in 2010 and is about to be finalized in February 2013 achieving pre-industrial development (V3) maturity level. The project has developed and assessed both the generic TBS concept and a local adaptation of the concept to the London Heathrow operating environment. The scope of this paper is focused on the validation of the concept for London Heathrow airport covering the real-time simulation results and the wake turbulence safety data analysis results.
Keywords - time based separation, time based spacing, wake turbulence, LIDAR, SESAR.
I. INTRODUCTION
In today’s operations, aircraft are either separated by wake turbulence rules or by runway and radar separations that apply when wake turbulence separations are not required. These separations requirements are expressed in terms of time for take-off clearance and in terms of distance for arrivals on final approach.
Existing departure and arrival wake turbulence separations are considered at times to be over-conservative in that they are fixed regardless of the prevailing meteorological conditions impact on the transport and decay of the wake turbulence.
A reduction of the aircraft ground speed is observed when the headwind speed increases (despite the landing stabilisation speed adjustments). This results in increased time separation for each aircraft pair, a reduction of the landing rate and a lack of stability of the runway throughput during arrival operations. This impacts not only the achieved capacity, but also the
predictability of operations, time and fuel efficiency, and the environment (emissions).
The impact on predictability for core hubs is particularly important at the network level. The service disruption caused by the reduction in achieved runway throughput compared to declared capacity in medium and strong headwinds has a significant impact on the overall network performance and is particularly exacerbated if this occurs on the first rotation of the day because of the impact on all the other rotations throughout the day.
The Time Based Separation (TBS) concept is addressing this problem by defining procedures and specifying user and high level system requirements to allow stable arrival runway throughput in all headwind conditions on final approach.
The concept has been extensively evaluated refined and partially validated by EUROCONTROL (ECTL), NATS and in the European Commission 6th Framework Program (EC 6FP) RESET project since 2001. The scope (V1) and feasibility (V2) validations were successfully conducted prior to the TBS concept becoming part of the SESAR Development Phase P6.8.1 project, which is aiming to achieve pre-industrial development (V3) maturity by 2013 for transition into local implementation and deployment:
• Model based assessments have been conducted in order to quantify the risk of a wake vortex encounter associated with the use of time based separations [4].
• Model based assessments have been conducted in order to quantify the costs and benefits and the return on investment of the time based separation concept [3] [5] [6] [18].
• NATS has developed, evaluated and carried out initial validation of the ATC tools that can provide for spatial visualization of the time based separation rules to the final approach and tower runway controllers [7].
• Real time simulations for the TBS concept were conducted by EUROCONTROL [8] [9], and by the Swedish ANSP LFV for EC 6FP RESET project [10].

• A detailed TBS concept of operation was produced by Eurocontrol in cooperation with NATS in 2008 [11] [12].
• A dedicated wake turbulence LIDAR measurement campaign was conducted at London Heathrow from October 2008 to December 2010 at IGE/NGE (in-ground effect / near-ground effect) glideslope elevations.
• A TBS human-in-the-loop real time simulation validation with Heathrow approach controllers was conducted by NATS in October 2010 [13].
• TBS user group workshops were held in NATS in 2010 and 2011 with Heathrow Approach Controllers, Tower Runway Controllers, and Airspace Users, to address the issues and recommendations from the ECTL, NATS and RESET validation activities and to further develop and refine the TBS concept.
II. TBS CONCEPT DESCRIPTION
A. Generic Concept
The objective of time based separation is to improve the landing rate resilience to headwind conditions on final approach through recovering the lost landing rate currently experienced when applying distance based separations. This is to be achieved by stabilizing the delivered time spacings between aircraft on final approach across headwind conditions [14].
The time spacing impact of headwind conditions when applying distance based separations is significant. Table 1 shows the increase in the time spacings for the distance based separations when compared to the reference landing rate for a 160kn ground speed in low headwind conditions.
Table 1: Time Spacing Impact of Headwind Conditions
Mean Headwind
Time Spacing Impact
15kn 6.7 %
25kn 14.3 %
35kn 23.1 %
A procedural airspeed of steady 160kn indicated airspeed (IAS) is applied to 4DME (4Nm from the runway landing threshold) on final approach at Heathrow. For the 3 degree glideslope and the runway surface elevation of 80ft at Heathrow, this is at glideslope altitudes of 1400ft at 4DME to 3,300ft at 10DME, where headwind conditions of 15kn to 25kn occur frequently. In low headwind condition where the typical landing rate for the Heathrow traffic mix is around 40 aircraft an hour, the increase in time spacing in a 20kn headwind reduces the landing rate by up to 4 aircraft an hour.
The TBS Concept involves changing the separation rules on final approach from distance based separations to time based separations. There is a need to facilitate delivery to time based separation constraints by the final approach and tower controllers. This is achieved through the provision of separation indicators displayed on the extended runway center-
line of the final approach controller radar display and the tower runway controller air traffic monitor display, and changing the controller separation/spacing procedures to take into account the use of the separation indicators in supporting the arrival delivery on final approach.
Figure 1: Example of Separation Indicators on Final Approach
The wake turbulence time based separations have been derived from the distance based separations taking into account the ground speed profile of aircraft on the final approach glideslope in low headwind conditions. A complication is the diversity of airspeed profiles flown on final approach, both the procedural airspeed profiles prior to landing speed stabilization, and the airspeed profiles employed during landing stabilization in relation to the aircraft type, landing weight and other factors. These result in a multiplicity of time spacings associated with each distance based separation in the low headwind conditions.
To manage this complication a reference airspeed profile is used to establish the reference time based separations in low headwind conditions. This reference airspeed profile is applied to the prevailing glideslope wind conditions to calculate the TBS distance to be displayed by the separation indicator. The actual airspeed profile of the follower aircraft under TBS will still vary, but only in the same way that it varies under DBS today. Therefore, the variation in time spacing under TBS will be no different to that under DBS in low wind conditions, and for TBS this time spacing for a particular airspeed profile is stabilized across headwind conditions. In this way the diversity of airspeed profiles employed on final approach is accommodated without the need to explicitly take into account the airspeed profile intent of the aircraft.
The TBS distance is to be applied from the follower aircraft merging on to final approach until the lead aircraft crosses the runway landing threshold in the same way as for distance based separation.
The low headwind conditions proposed is a minimum of 5kn in order to provide additional spacing in the low, still and tail wind conditions in which pilot reported wake turbulence encounters are most prevalent for distance based separations.
The reference airspeed profile is to be representative of the local airspeed procedures of the aerodrome. For the generic concept a reference landing stabilization airspeed of 150kn IAS is proposed. The impact of the runway elevation and glideslope angle on the true airspeed profile and resulting ground speed profile is to be taken into account when establishing the reference time based separations.
Generic reference time separations have been established by applying the wake turbulence distance based separations for the ICAO wake categories, applied to the runway landing threshold. These are for a 5kn headwind on the glideslope over the spacing to the runway landing threshold. This is for a reference airspeed profile of 170kn IAS to 6 DME, reducing to 150kn IAS by 5 DME, and flying steady landing stabilization airspeed of 150kn IAS to the runway landing threshold on a 3
degree glideslope and an 80ft runway elevation. For spacing minimum pairs, 60s is proposed to provide sufficient time for the runway occupancy time of the lead aircraft.
Table 2: Generic Reference Time Based Separations
Follower
Leader
A380
560T
Heavy
More than 136T
Medium
7T to 136T
Light
7T or less
A380 60s 145s 167s 189s
Heavy 60s 98s 122s 145s
Medium 60s 60s 60s 122s
Light 60s 60s 60s 60s
B. Heathrow Concept
Heathrow reference wake turbulence time based separations have been established by applying the UK distance based separations for the UK wake categories, applied to 4DME under the local Heathrow procedures. These are for a mean 5kn to 7kn headwind on the glideslope over the spacing to 4DME, such that the ground speed equates to the indicated airspeed when applying the Heathrow procedural airspeed profile of a steady 160kn IAS over the distance based separations to 4DME. This equates to a 22.5s per Nm conversion of the UK distance based separations and is applied to the wake category pairs requiring wake separation. For spacing minimum pairs, 60s is proposed to be applied over the spacing to 4DME for providing sufficient time for the runway occupancy of the lead aircraft and the provision of sufficient time for clearance to land to the follower aircraft. The 60s time spacing for spacing minimum pairs is applied in the context of the 2.5Nm/3Nm minimum radar separation or spacing minimum procedures, where the separation indicator distance displayed to the controllers is required to not be less than the minimum radar separation or spacing minimum.
Table 3: Heathrow Reference Time Based Separations
Follower
Leader
A380
560T
Heavy
More than 162T
Upper Medium
104T to 162T
Lower Medium
40T to 104T
Small
17T to 40T
Light
17T or less
A380 (JJ)
90s* 135s 158s 158s 158s 180s
Heavy (HH)
90s* 90s 113s 113s 135s 158s
Upper Medium
(UM) 60s 60s 68s 90s 90s 135s
Lower Medium
(LM) 60s 60s 60s 60s 68s 113s
Small (SS)
60s 60s 60s 60s 68s 90s
Light (LL) 60s 60s 60s 60s 60s 60s
90s* for runway occupancy time of lead aircraft.
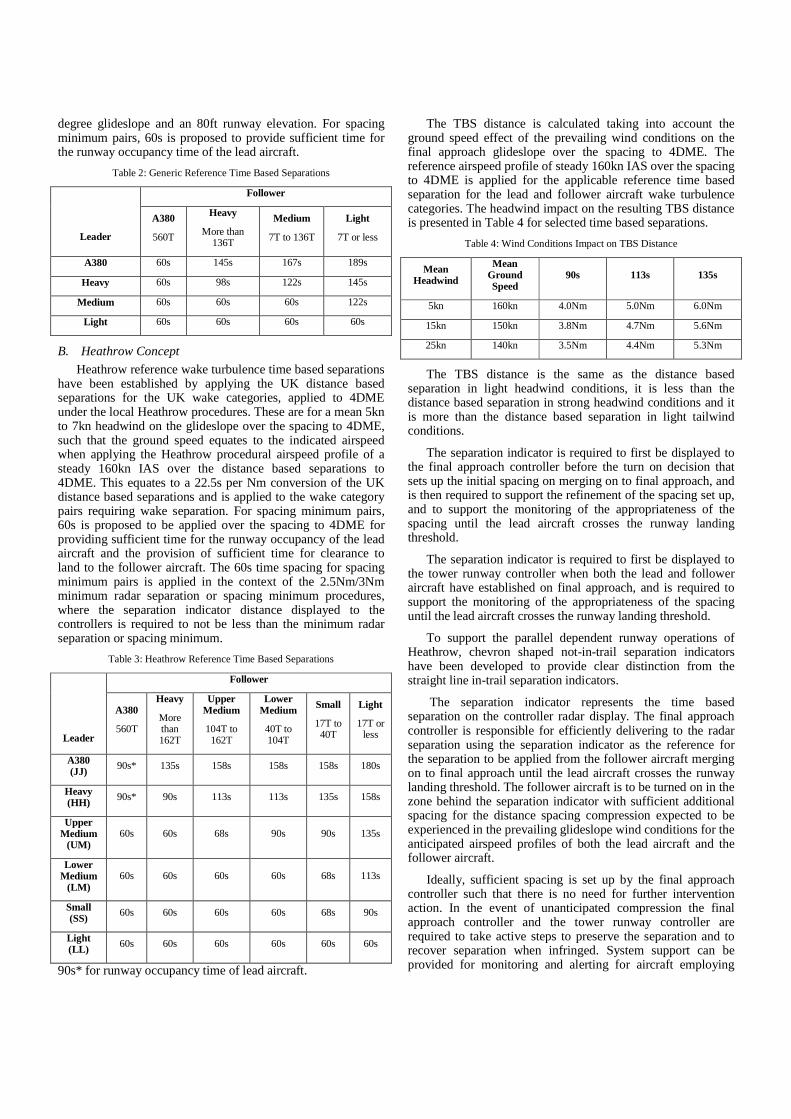
The TBS distance is calculated taking into account the ground speed effect of the prevailing wind conditions on the final approach glideslope over the spacing to 4DME. The reference airspeed profile of steady 160kn IAS over the spacing to 4DME is applied for the applicable reference time based separation for the lead and follower aircraft wake turbulence categories. The headwind impact on the resulting TBS distance is presented in Table 4 for selected time based separations.
Table 4: Wind Conditions Impact on TBS Distance
Mean Headwind
Mean Ground Speed
90s 113s 135s
5kn 160kn 4.0Nm 5.0Nm 6.0Nm
15kn 150kn 3.8Nm 4.7Nm 5.6Nm
25kn 140kn 3.5Nm 4.4Nm 5.3Nm
The TBS distance is the same as the distance based separation in light headwind conditions, it is less than the distance based separation in strong headwind conditions and it is more than the distance based separation in light tailwind conditions.
The separation indicator is required to first be displayed to the final approach controller before the turn on decision that sets up the initial spacing on merging on to final approach, and is then required to support the refinement of the spacing set up, and to support the monitoring of the appropriateness of the spacing until the lead aircraft crosses the runway landing threshold.
The separation indicator is required to first be displayed to the tower runway controller when both the lead and follower aircraft have established on final approach, and is required to support the monitoring of the appropriateness of the spacing until the lead aircraft crosses the runway landing threshold.
To support the parallel dependent runway operations of Heathrow, chevron shaped not-in-trail separation indicators have been developed to provide clear distinction from the straight line in-trail separation indicators.
The separation indicator represents the time based separation on the controller radar display. The final approach controller is responsible for efficiently delivering to the radar separation using the separation indicator as the reference for the separation to be applied from the follower aircraft merging on to final approach until the lead aircraft crosses the runway landing threshold. The follower aircraft is to be turned on in the zone behind the separation indicator with sufficient additional spacing for the distance spacing compression expected to be experienced in the prevailing glideslope wind conditions for the anticipated airspeed profiles of both the lead aircraft and the follower aircraft.
Ideally, sufficient spacing is set up by the final approach controller such that there is no need for further intervention action. In the event of unanticipated compression the final approach controller and the tower runway controller are required to take active steps to preserve the separation and to recover separation when infringed. System support can be provided for monitoring and alerting for aircraft employing

abnormal airspeed profiles on final approach, and for monitoring and alerting for infringement scenarios from the distance spacing compression caused by lead aircraft with a slower than anticipated airspeed profile, or from follower aircraft with a faster than anticipated airspeed profile.
On first call to Approach ATC, the pilot is required to confirm the aircraft type of the aircraft and to provide notification of approach speed non-conformances against the procedural airspeed profile published in the AIP. Pilots of airline operators that regularly use Heathrow also optionally provide notification of the intent to employ an abnormally slow or an abnormally fast landing stabilization speed profile for the aircraft type (e.g. from landing light or landing heavy).
TBS awareness briefings are to be provided to airline operators and pilots. Pilots are to be informed that TBS procedures apply at a destination airport at the pre-departure briefing and when entering the destination airport airspace through the airport air traffic information service. TBS procedures are to be incorporated into the top of descent briefing.
The wake turbulence time based separations are to be applied in the context of all the other separation and spacing constraints on final approach. These include the minimum radar separation constraints, the runway spacing constraints appropriate for the runway visual conditions, the runway spacing constraints appropriate for the runway surface braking conditions and exit taxiway serviceability, the scenario specific spacing requirements such as for a runway inspection or for accommodating conflicting or crossing traffic, and the interlaced departure gap spacing for interlaced mode operations. The separation indicator is required to clearly represent the maximum separation or spacing constraint to be applied between the arrival pair.
The tower supervisor in coordination with the approach supervisor, or the tower runway controller in coordination with the final approach controller, are responsible for changes to the runways-in-use, changes to the runway modes, and changes to the separation and spacing constraints that are required to be applied on each runway-in-use. This information is required to be provided electronically to the TBS tool.
The arrival sequence order, and the aircraft landing runway intent indicating which aircraft are to land on the departure runway for parallel dependent runway operations, is coordinated by the approach supervisor and the intermediate approach controllers and reflected in the AMAN sequence. This information is required by the TBS tool together with the incorporation of late changes to the arrival sequence order or the aircraft landing runway intent.
Missed approaches and late runway switches are required to be automatically tracked in order to support the timely removal and updating of the associated separation indicators. Missed approach aircraft are required to be re-inserted into the arrival sequence.
Scenario specific spacing may be initiated through tower procedures or approach procedures depending on the specific scenario and coordinated across tower and approach operations. The scenario specific spacing is required to be
provided electronically to the TBS tool. This also applies to the departure gap spacing for interlaced mode operations.
Any discrepancy between the pilot reported aircraft type on first call to Approach ATC and the aircraft type on the flight progress strip is required to be corrected.
A glideslope wind conditions service is required to provide the glideslope wind profile to the TBS tool.
The degraded mode procedure in the event of a glideslope wind conditions service failure is for new separation indicators to be displayed with the current day distance based separations.
The degraded mode procedure in the event that the arrival sequence is not of the required integrity is to switch off the separation indicators and revert to current day distance based separations.
The degraded mode procedure in the event of the sudden loss of separation indicators is to continue with the separation/spacing set up on final approach provided the final approach controller and tower runway controller consider it safe to continue, and to switch off the separation indicators and revert to current day distance based separations.
III. VALIDATION TOWARDS V3 MATURITY IN SESAR
A. The key validation objectives towards V3 maturity level
As already described in Introduction, the concept definition and feasibility phases have already taken place since 2001. The key validation areas necessary to reach the V3 maturity level in SESAR Development phase (2010-2013 for TBS) have been defined as follows [15]:
• Definition of the time based separations corresponding to the current ICAO distance based wake turbulence radar separations;
• Validation of the defined time based separations as per the application of the E-OCVM and the resulting TBS validation strategy and plan and anticipated associated validation priorities below;
• Assessment of the change in the wake vortex encounter hazard risk associated with the reduction of the distance spacing resulting from applying the pre-specified fixed time based separations under the full range of headwind conditions that are experienced in operations;
• Assessment of the spatial headwind stability along the glide path and the impact that this has on the distance spacing resulting from applying the pre-specified fixed time based separations;
• Assessment of the potential benefits of employing TBS for various airports considering the distribution of their wind conditions throughout the year;
• Definition of the HMI and ATM component requirements and operational procedures enabling the air traffic controllers to apply time based separations;
• Assessment and refinement of the HMI and ATM component requirements and operational procedures

enabling the air traffic controllers to apply time based separations;
• Definition of the operational, functional and algorithm requirements of the TBS tool support;
• Assessment of the operational, including functional and algorithm requirements of the TBS tool support;
• Validation that actual delivery to the TBS minima is safe with respect to the wake turbulence encounter, mid-air collision, runway collision, runway accident and the spacing related missed approach ATC tower collision hazard. This should take into account the variability in aircraft landing stabilization speeds, prevailing wind conditions, spatial wind stability, controller performance and pilot performance on all points on the final approach path;
• Validation that the proposed tool support for the approach controllers and for the tower runway controllers operating in all conditions has an acceptable impact on task performance and safety; and
• Validation that the procedural changes for the approach controllers and for the tower runway controllers and aircrew operating in all conditions have an acceptable impact on task performance and safety.
B. Validation exercises
In order to cover the key validation areas, four main validation exercises have been defined:
• Real-time simulation – Approach controllers
• Real-time simulation – Tower controllers
• Wake turbulence assessment via LIDAR data collection campaign and LIDAR data analysis
• Safety assessment and human performance assessment. These aspects of TBS validation are not covered in detail by this paper but are the subject of wider detailed assessment within the SESAR P6.8.1 project.
IV. REAL TIME SIMULATIONS – APPROACH & TOWER
A. Heathrow Approach Validation Exercise
The thirteen day Time Based Separation (TBS) Heathrow Approach validation exercise was run from 11th February 2012 to 5th March 2012 on the Swanwick approach real-time simulator at NATS CTC. The measured positions were Final Approach Controller, Intermediate Approach Controllers North and South and the Tower Runway Controller when manned [16].
A total of fifty one simulation exercise runs were completed, of which six were for training. Thirteen exercise runs were DBS as baselines for the matched TBS exercise runs; the remaining thirty eight exercise runs, including scenarios, were using TBS. Matched runs were pairs of exercise runs with the same wind conditions and same controllers in the same measured positions, conducted with DBS for reference and TBS for direct comparison; the first exercise run of the pair
being alternated between DBS and TBS to mitigate any influence of running one method before the other.
Nine different traffic samples were used during the validation exercise, six westerly and three easterly samples. These traffic samples were combined with fourteen different wind profile scenarios ranging from light wind conditions to extremely challenging wind conditions, including headwinds, tailwinds, crosswinds, and changing winds on final approach. The spacing minimum (2.5Nm or 3Nm) for each wind scenario was agreed with an operational Heathrow tower runway controller prior to the start of the validation exercise.
Nineteen specific scenario exercise runs were completed, which included seven exercise runs with a Heathrow tower runway controller. The scenarios included the following; extreme catch up, pull away, crosswind and light wind conditions, aircraft speed non-conformances, 3Nm spacing minimum, controller handovers, arrivals landing on the parallel departure runway, runway inspections, blocked runways, missed approaches, aircraft emergencies, incorrect arrival sequences and separation indicator failures.
A total of ten Swanwick Heathrow approach controllers and one Heathrow tower controller were involved in the validation exercise simulations. Overall the exercise had a good number and a good mix of controllers and operational experience to assess TBS.
Aircraft landing rates were consistently increased with TBS for all eleven matched runs, for the traffic samples and wind conditions simulated; up to 5 additional aircraft per hour were landed with TBS compared to DBS, with a mean of 2 additional aircraft per hour. Note that mean of 2 reflects the range of wind conditions simulated but not the distribution of winds that are typically experienced at Heathrow. The measured improvement in the landing rate is statistically significant.
Figure 2: Aircraft Landing Rates - Passing 4DME
Separation accuracy for Wake pairs at 4DME shows a clear and statistically significant improvement with TBS, though for Spacing Minimum pairs the accuracy was the same as DBS. Overall TBS performed generally better than DBS.
The percentage of under-separation with TBS was almost half that compared to DBS.

Holding times and Stack entry to touchdown times were reduced with TBS compared to DBS. The mean reduction in holding times with TBS was 0.9 minutes, with a maximum reduction of 9.4 minutes. The mean reduction in stack entry to touchdown times with TBS was 1.4 minutes, with a maximum reduction of 9.3 minutes. Note that these results reflects the range of wind conditions simulated but not the distribution of winds that are typically experienced at Heathrow. The trend of the graph in Fig. 4 can be seen to move towards the DBS axis, indicating earlier touchdown times with TBS.
Figure 3: Aircraft Landing Times - TBS compared with DBS
There was no difference in controller workloads with TBS compared with DBS. There was a very slight increase in R/T usage, but this appears linked to the higher aircraft landing rates.
Situation Awareness for the final approach controller was slightly reduced with TBS, though this reduction was not statistically significant at the 95% significance level. The reduction was evident through a change of focus onto the TBS indicators and away from the flight strips resulting in less awareness of aircraft types, wake vortex categories and the relative position of the lead aircraft.
Several TBS tool issues were observed during the simulation that adversely affected the usability of the prototype tool along with user confidence and trust. These were mainly associated with the indicator support for aircraft landing on the departure runway where the requirement for the in-trail separation and spacing requirements to be considered alongside the not-in-trail separation requirements was not implemented in the prototype, and where the new requirement for supporting the provision for a departure gaps between arrivals landing on the departure runway was raised.
Figure 4: Situation Awareness (SA) - Matched Exercise Runs
The findings from the Heathrow Approach Validation Exercise show that the TBS concept is viable as simulated for Heathrow Approach and could deliver significant benefits in terms of higher aircraft landing rates in stronger wind conditions along with reduced holding and approach times.
B. Heathrow Tower Validation Exercise
The seven day TBS Heathrow Tower validation exercise was conducted on the Heathrow Airport Tower 360° simulator at NATS Heathrow House, London between 11th July 2012 and 24th July 2012. The measured position was the Tower Runway Controller [16].
A total of thirty one exercise runs were completed. Eight exercise runs were DBS as baselines for the matched TBS runs; the remaining fifteen exercise runs, including scenario runs, were using TBS. Matched runs were pairs of exercise runs derived from the same traffic samples with the same wind conditions from the Heathrow Approach Validation Exercise, run with DBS for reference and TBS for direct comparison; the first run of the pair being alternated between DBS and TBS to mitigate any influence of running one method before the other.
Eight matched runs were planned along with a series of scenario runs. During the seven days of the simulation a total of twelve controllers took part which was a good number and good mix of controllers with extensive operational experience to assess TBS.
On each day two controllers took part, alternating between controlling on the single measured position, and acting as an expert observer, for each run. Nine specific scenario runs were completed, covering the following scenarios; TBS indicator failure, runway closure, aircraft landing on the departure runway, runway inspection, reduced visibility, and wake-only indicators.
The higher aircraft landing rates as delivered in the Heathrow Approach Validation Exercise with TBS were handled easily by the Tower controller. There was no statistically significant difference in separation accuracy at runway threshold between DBS and TBS.
There were no statistically significant differences in controller workload with TBS compared to DBS: all were found to be acceptable. Situation Awareness remained high

and comfortably above the acceptable limit at all times, there were no statistically significant differences between TBS compared to DBS.
There were no statistically significant differences between the clearance to land margins (of 15 seconds or less), the number of go-around instructions, the number of wake vortex advisories, or the number of expedited runway vacation requests issued between DBS and TBS.
The Tower runway controllers indicated that they could accommodate the TBS indictors into their scan; the presence of the TBS indicators reduced the need to obtain and process information on aircraft types and wake turbulence categories from the electronic flight progress strips. This change of scan indicates that the TBS tool needs to perform with a high degree of accuracy and reliability because of the high levels of trust placed on the correct calculation and display of the TBS indicators.
The findings of the Heathrow Tower Validation Exercise show that the TBS concept is viable as simulated for Heathrow Tower and could deliver significant benefits in terms of higher aircraft landing rates in stronger wind conditions.
V. WAKE TURBULENCE RISK ASSESSMENT
Wake turbulence at Heathrow was measured using a Lockheed Martin WindTracer® LIDAR. By scanning in a plan perpendicular to the approach path and measuring the movement of particles in the air the LIDAR estimates the circulation strength and location of wake vortices generated by aircraft.
The Heathrow IGE/NGE measurement campaign started in October 2008 and ended in December 2010. The LIDAR was installed at London Heathrow Airport, at about 1200m from the runway threshold (see Fig 5). It was set up to scan arriving aircraft on both runways 27L and 27R.
Figure 5: Heathrow IGE/NGE LIDAR Location
The following data have been collected:
• Aircraft data: time of the aircraft passing through the scanning plane, aircraft type and WV category, etc.;
• LIDAR data: concerns WV data (position of port and starboard vortices at each time of the track, circulation, time age of the WV, etc.) as well as wind data, both headwind (LIDAR makes a ~90° rotation between 1
and 3 times per hour in order to measure headwind component) and crosswind (named “in-plane wind”);
• Anemometer data: given by the runway anemometer whose purpose is to determine the surface wind at Heathrow. Headwind and crosswind components are available every minute as two-minute mean wind; and
• METAR data: of the weather conditions over the previous 30 minutes reported at 20 minutes and 50 minutes past the hour.
Following detailed data cleaning, the LIDAR data element of the database contains 104,201 tracks (56,779 for 27L and 47,422 for 27R), where each LIDAR track can contain up to two vortex tracks (positive and negative). The breakdown by UK WT category pairs is shown in Table 5.
Table 5: LIDAR Tracks by UK WT Category Pair
Follower
JJ HH UM LM SS LL
JJ 11 316 9 360 9 2
HH 341 24159 606 20528 430 81
UM 22 2289 243 1588 80 4
LM 163 10231 2122 37685 2332 245
SS 1 77 25 220 13 4
Lead
er
LL 0 1 0 2 1 1
VI. LIDAR DATA ANALYSIS
In order to support the TBS safety assessment an analysis of the collected LIDAR data has been undertaken. This analysis focuses on the IGE/NGE LIDAR data and aim to understand how the likelihood of vortex persistence will change under a TBS separation regime [17].
The primary metric for the LIDAR data analysis is the probability of vortex persistence, for a given circulation strength or greater, after a defined time period; where the vortex circulation strength is measured in meters squared per second (m2/s), and the time period reflects the time spacing for the modeled aircraft pair at the LIDAR scan plane. This metric is expressed as a Complimentary Cumulative Distribution Function (CCDF), an example of which is given in Fig. 7.
It is accepted that although the LIDAR data may give an estimate of the vortex strength, this data cannot provide an absolute answer as to the severity of an encounter that may occur. Therefore, comparative analysis is used to make a relative assessment of the probability of persisting vortex strength, i.e. vortex strength CCDFs, under current day operations (DBS) against those from a TBS separation regime. This assessment is performed by addressing the following questions:
• Is the probability of persisting vortex strength, considering “all wind conditions”, under a TBS separation regime no more than 5 percentage points greater than today, i.e. current DBS operations?

• Is the probability of persisting vortex strength in “any wind condition” under a TBS separation regime no greater than today under “low wind conditions”, or no greater than today in the same wind conditions?
• Is the probability of persisting vortex strength in “any wind conditions” under a TBS separation regime with separation infringement no greater than today with an equivalent separation infringement under “low wind conditions”, or no greater than today in the same wind conditions?
In each case, a TBS scenario is compared to a DBS baseline (reflecting “today”). The LIDAR data analysis makes no assumption as to how controllers may actually deliver separations, therefore both the DBS baselines and TBS scenarios assume that minimum separations are applied. That is, the assessment is made at exactly the defined separation minima for the separation regime being modeled. In addressing the above questions the following assumptions have been made:
• “All wind conditions” considers all vortex tracks measured by the LIDAR, irrespective of the associated wind conditions.
• “Low wind conditions” is assumed to be where the total wind speed associated with the vortex track is between 0kn and 5kn, and represents reasonable worse case conditions with regards to vortex persistence.
• “Any wind conditions” focuses on analyzing tracks in 2kn pure headwind bands; pure headwind being defined as when the crosswind is less than 2kn.
In conducting the LIDAR data analysis two methods have been employed. The Eurocontrol (ECTL) method addresses the generic case, using default ICAO separation regimes, and then goes on to examine four major European airports by applying local traffic mixes and local wind profiles. The ECTL method applies a technique to extrapolate vortex tracks in order to maximize data usage, as defined in detail in the ICRAT paper [1].
The local London Heathrow analysis considers UK specific aircraft wake turbulence (WT) categories and their associated separation rules. This analysis also therefore considered a Heathrow specific interpretation of the TBS separation regime. In addition, the local Heathrow analysis considers the separation between an arrival pair being delivered at 4DME.
The NATS Pairwise method is an innovative approach to LIDAR data analysis in that only observed arrival aircraft pairs on approach to Heathrow during the IGE/NGE LIDAR data collection campaign are considered, i.e. there is no sampling of LIDAR tracks for any other follower. For a given separation regime, e.g. DBS and TBS, the time spacing at the LIDAR scan plane is calculated using associated detailed radar data. Any observed catch-up or pull-away between aircraft after the separation delivery point (4DME) and the LIDAR scan plane (~0.5DME) is therefore maintained.
In addition, given the availability of associated detailed radar data, for TBS scenarios the Pairwise method aims to
represent the TBS system. That is, rather than representing a fixed time spacing between aircraft, the Pairwise method determines the actual time spacing that would occur based on the calculated TBS distance and the follower aircraft’s divergence from the TBS reference airspeed profile.
Finally, in order to address the various wind conditions, the LIDAR data is associated with anemometer data captured from each of the four Heathrow runways over the same time period. This data provides, the wind speed and direction at ground level, as a two minute average reporting every minute.
For certain pairs the number of observations with valid LIDAR tracks is insufficient for persistence probability calculations to be made. Fig. 6 summarizes the pairs that could (green) and could not (red) be analyzed.
Follower
JJ HH UM LM SS LL
JJ
HH
UM
LM
SS L
ead
er
LL
Figure 6: Wake Turbulence category pairs that could (green) and could not (red) be analyzed
Under current DBS rules, the time spacing between arrivals increases as headwind speed increases. The stronger wind speed both enhances the natural decay of the vortices and increases the likelihood of the vortices being transported out of the path of the follower aircraft. As the TBS concept aims to achieve consistent time spacing between aircraft, irrespective of the wind conditions, the first key result is to understand whether the probability of persisting vortex strength changes as wind speed increases.
Fig. 7 shows that under a TBS separation regime where the time spacing remains constant, the probability of persisting vortex strength still decreases as the wind speed increases. Therefore, the reduction in time spacing under TBS rules in moderate to strong wind conditions is outweighed by the increase in decay and transportation of vortices in those wind conditions. It can therefore be concluded that under strong wind conditions TBS rules still reduce the probability of persisting vortex strength compared to low wind conditions.
Figure 7: Example of probability of persisting vortex strength as wind speed
increases under TBS rules (WS = wind speed in knots)

Fig. 8, Fig. 9, and Fig. 10 provide examples of results in response to the three key questions (as defined above) addressed by the LIDAR data analysis. Fig. 8 shows an example comparison where for all vortex circulation strength thresholds the probability of persisting vortex strength under TBS rules in all winds (red dashed line) is no more than 5 percentage points greater than under DBS rules in all winds (solid blue line). In this case, the maximum measured increase is 2.3 percentage points, with the maximum measured increase across all analyzed pairs and all strength thresholds being 3.9 percentage points.
Figure 8: Example of TBS versus DBS all winds
Fig. 9 shows an example of the comparison of 2kn pure headwind bands under TBS rules versus DBS under low wind conditions (total wind between 0kn and 5kn). These results show that for the lower pure headwind bands the probability of persisting vortex strength under TBS is greater than the DBS low winds baseline.
Figure 9: Example TBS pure headwind versus DBS low winds
Fig. 10 shows example results for 4-6kn pure headwind, comparing TBS versus DBS in the same wind condition; Fig. 10 also illustrates how 95% confidence intervals (shaded areas) around the CCDFs are used in the analysis to account for statistical variation in the results, in particular for the small data sets. The TBS probabilities are only deemed to be statistically greater than the DBS probabilities where the confidence intervals do not overlap.
There is a single instance only where the assessment criteria are not met from a purely quantitative perspective. That is for UK Heavy-Heavy pairs in 4-6kn pure headwind, where the persisting circulation strength is less than 150m2/s. For Heavy followers, circulation strengths below 200m2/s are deemed
moderate and therefore from a qualitative perspective the assessment criteria are still met.
Figure 10: Example TBS 4-6kn pure headwind versus DBS 4-6kn pure
headwind
A summary of the pure headwind results for all WT category pairs analyzed is provided in Fig. 11. In addition, when analyzing the separation infringement cases (0.5Nm and 1Nm) for the same WT category pairs the same overall conclusions are reached. This analysis process was also conducted for pure crosswind conditions (headwind limited to 5kn) and examining total wind bands, and the same conclusions reached. Therefore, at the level of validation maturity being assessed it is considered that the safety criteria are satisfied.
Figure 11: Summary results for analysis of pure headwind bands
The Pairwise method makes a number of assumptions as to how both TBS and DBS separation regimes are modeled. Therefore detailed sensitivity analysis has also been undertaken to assess whether these assumptions impact on the LIDAR data analysis conclusions. In each case the analysis process was repeated, i.e. the key questions were addressed, and in each case the same results were achieved.
For example, the Pairwise method defines vortex persistence as vortices measured as present within ±160m of the centerline at the LIDAR scan plane (for the IGE/NGE location). Sensitivity analysis conducted by both NATS and ECTL has shown that, although the absolute results change, varying the width of the corridor does not change the comparative analysis conclusions.
The Pairwise method also assumes that any vortex observation is valid for up to 15 seconds after its observation time (for both DBS and TBS scenarios), unless updated by a more recent observation. Again, although varying the value of this parameter changes the absolute results it does not change the comparative analysis conclusions.

In conclusion, the LIDAR data analysis for the local Heathrow case, using the NATS Pairwise method, has shown that:
• The probability of persisting vortex strength in all wind under TBS is not more than 5 percentage points greater than under DBS in all winds;
• In moderate and strong wind conditions the probability of persisting vortex strength under TBS is less than measured in low wind conditions under DBS.
• In low wind conditions, the probability of persisting vortex strength under TBS is not statistically greater than under DBS in the same wind conditions;
• The same conclusions can be reached when a separation infringement of 0.5Nm and 1Nm is applied equally to the TBS scenarios and DBS baselines;
• Under strong wind conditions TBS rules still provide a lower probability of persisting vortex strength compared to low wind conditions.
VII. CONCLUSION
The results of the Heathrow Approach and Tower Validation Exercises and the Heathrow and Generic LIDAR Data Analyses have been used to provide evidence against the issues being addressed in the Safety Assessment, the Human Performance Assessment, the Business Benefit Assessment and the Environment Assessment.
These assessments have concluded that the TBS concept is viable from a safety and human performance assessment perspective; and could deliver significant benefits in terms of recovering the reduction in landing rate currently experienced with DBS in headwind conditions, with the resulting beneficial impact on the environment and the predictability and efficiency of operations.
The TBS concept has achieved the pre-industrial development maturity and is now ready to begin the Heathrow local industrialization and deployment project phase.
ACKNOWLEDGMENTS
The authors would like to thank the project partners and colleagues for their active contribution to the TBS validation process. The special thanks goes to Peter Eriksen, Nicolas Bourgois, Frederic Rooseleer, Vincent Treve, Christian Musson, Wietze Oenema, all of the Heathrow Approach and Tower Controllers who participated in the user group and validation activities, as well as Jennifer Sykes, Michael Cowham, Debbie Randall and Julian Taylor. The activities developed to achieve the results presented on this paper, were created by NATS and EUROCONTROL for the SESAR Joint Undertaking within the frame of the SESAR Programme co-financed by the EU and EUROCONTROL. The opinions expressed herein reflect the author’s view only. The SESAR Joint Undertaking is not liable for the use of any of the information included herein.
REFERENCES [1] N. Bourgeois, P. Choroba, G. Winckelmans, “Conditional reduction of
ICAO wake turbulence minima on final approach”, 2012.
[2] G. Eason, B. Noble, and I. N. Sneddon, “On certain integrals of Lipschitz-Hankel type involving products of Bessel functions,” Phil. Trans. Roy. Soc. London, vol. A247, pp. 529–551, April 1955.
[3] E. Freville, J.P. Nicolaon, Potential benefits of a Time-based separation procedure to maintain the arrival capacity of an airport in strong headwind conditions, ATM Seminar, 2003
[4] Eurocontrol TBS Project: Aircraft Wake Vortex Modelling in support of the Time Based Separation Project, AO-06-11079EB, May 2008
[5] Eurocontrol European Wake Vortex Mitigation Benefits Study (EUROBEN): High Level Benefits Analysis & Systemic Analysis, November 2005
[6] Eurocontrol European Wake Vortex Mitigation Benefits Study (EUROBEN): Detailed Study of the Implementation of TBS and Crosswind Reduced Separations at Heathrow, June 2006
[7] NATS Planned Spacing Tool Project: September/October 2004 Trial 2 Report, July 2005
[8] Eurocontrol TBS Project: CDG Real-Time Simulation Results, EEC Note No. 17/-6, November 2006
[9] Eurocontrol TBS Project: Results from the December 2007 Time Based Separation Real-Time Simulation Exercises, EEC Report No. 411, December 2008
[10] EC 6FP RESET Project, TBS HIL Combined Simulation Plan and Report, RST-WP&-LFV-001-D7.1, March 2010
[11] Eurocontrol TBS Project: TBS ConOps Description, November 2008
[12] NATS TBS Project: Summary Concept of Operations for Time Based Separaiton on Final Approach, December 2009
[13] NATS TBS Project, TBS Workshop September 2010 Validation Report, January 2011
[14] SESAR P06.08.01 D05 Operational Service and Environment Definition (OSED) for TBS, February 2013
[15] SESAR P06.08.01 D07 Validation Plan (VALP) for TBS, July 2012
[16] SESAR P06.08.01 D10 Validation Report (VALR) for TBS for the VP303 Heathrow Approach and VP302 Heathrow Tower Simulations, November 2012
[17] SESAR P06.08.01 D11 Internal exercise results - Appendix 2: TBS Data Collection Campaign and LIDAR Data Analysis report, February 2013
[18] J. Sykes, NATS, TBS benefits modelling preliminary results, TBS/-WP/006, August 2010
AUTHOR BIOGRAPHIES
Charles MORRIS is a technical leader in the Approach and Wake Concepts Team in NATS SESAR. He is currently NATS lead for the SESAR P06.08.01 project. His research focus is ATM concept development and validation with sixteen years of leading research into approach operations at NATS. Peter CHOROBA is a validation expert in the Performance and Transversal Methods Unit in EUROCONTROL. He is currently project manager of the SESAR P06.08.01 project. His research interests are wake turbulence related concepts as well as the ATM performance management. Peter received his PhD in Transport and Communication technologies from University of Zilina, Slovakia. John PETERS is a research analyst in the Approach and Wake Concepts Team in NATS SESAR. He has a Bachelor degree in Operational Research from Lancaster University, UK. His research focus at NATS is on understanding the persistence of wake vortices for a range of separation concepts.