validity issues in the likert and thurstone …people.cas.sc.edu/wedell/reprints/roberts laughlin...
TRANSCRIPT

EDUCATIONAL AND PSYCHOLOGICAL MEASUREMENTROBERTS ET AL.
VALIDITY ISSUES IN THE LIKERT AND THURSTONEAPPROACHES TO ATTITUDE MEASUREMENT
JAMES S. ROBERTSMedical University of South Carolina
JAMES E. LAUGHLIN AND DOUGLAS H. WEDELLUniversity of South Carolina
This article highlights the theoretical differences between the Likert and Thurstoneapproaches to attitude measurement and demonstrates how such differences can lead todiscrepant attitude estimates for individuals with the most extreme opinions. Both simu-lated data and real data on attitude toward abortion are used to demonstrate this discrep-ancy. The results suggest that attitude researchers should, at the very least, devote moreattention to the empirical response characteristics of items on a Likert attitude question-naire. At most, these results suggest that other methods, such as the Thurstone techniqueor one of its recently developed item response theory counterparts, should be used toderive attitude estimates from disagree-agree responses.
Introductory texts often portray the Thurstone (1928) and the Likert(1932) approaches to attitude measurement as though both methods provideequally valid scores measuring attitude when individuals respond to a set ofquestionnaire items using a (binary or graded) disagree-agree response scale(Mueller, 1986; Petty & Cacioppo, 1981). This overly simplistic portrayal isfostered by studies that indicate that Likert and Thurstone attitude scorestypically are correlated to at least a moderate degree (.60≤ r ≤ .95), regardlessof whether responses to the same set of items are scored with the two proce-
This study was partially conducted while the first author was a postdoctoral fellow in the Di-vision of Statistics and Psychometric Research at Educational Testing Service under the mentor-ship of Dr. John Donoghue. We would like to thank Dr. Donoghue for his helpful commentsabout this work. Correspondence should be sent to James S. Roberts, Medical University ofSouth Carolina, Institute of Psychiatry–4N, 67 President Street, P.O. Box 250861, Charleston,SC 29425; e-mail: [email protected].
Educational and Psychological Measurement, Vol. 59 No. 2, April 1999 211-233© 1999 Sage Publications, Inc.
211

dures (Ferguson, 1941; Likert, 1932; Likert, Roslow, & Murphy, 1934) or re-sponses to independently constructed Likert (1932) and Thurstone (1928)questionnaires are compared (Edwards & Kenney, 1946; Flamer, 1983; Jaccard,Weber, & Lundmark, 1975; Likert, 1932; Rhoads & Landy, 1973). Giventhese results, researchers usually have differentiated the two methods usingother measurement criteria such as reliability and efficiency of scale con-struction. The general finding has been that Likert attitude scores exhibit ei-ther higher composite reliability (i.e., corrected split-half or corrected paral-lel forms reliability) or higher test-retest reliability as compared to Thurstoneattitude scores (Seiler & Hough, 1970). In addition, the general perception isthat the Likert technique is easier and more efficient to carry out than theThurstone technique, primarily because the former method does not require ajudgment group to produce item scale values (Barclay & Weaver, 1962; Ed-wards & Kenny, 1946; Mueller, 1986). These two features may account forthe relatively superior popularity of the Likert procedure for attitude mea-surement (Petty & Cacioppo, 1981).
Although previous studies have suggested that Likert and Thurstone atti-tude scores will be related linearly to at least a moderate extent, they do notconvincingly demonstrate that the two scores both measure the latent attitudewith the same degree of validity. The relationship between Likert scores andtrue attitudes could still differ systematically from the corresponding relation-ship found for Thurstone scores whenever the correlation between the twotypes of scores is only moderately high. Therefore, distinctions between thetwo procedures still might be made with regard to their respective validities.
We argue against the idea that the Thurstone and Likert methods generallyyield comparably valid estimates of true attitudes and for the idea that themethods should not be treated as equally applicable in traditional attitudemeasurement situations. Instead, the appropriate application of eithermethod depends on the item response process that participants use whenendorsing attitude items. We also argue that in those traditional situations inwhich participants respond to attitude items using a graded or binarydisagree-agree response scale, the empirical response process generallyfavors the use of the Thurstone procedure as opposed to the Likert procedure.Moreover, we use both simulated and real data to illustrate how the applica-tion of the Likert procedure in these situations can yield invalid measures forindividuals with the most extreme attitudes. In contrast, the validity of mea-sures from the Thurstone procedure does not degenerate in these situations.
Review of the Thurstone and Likert Approaches
The Thurstone Approach
The classic Thurstone approach to attitude scale construction involvestwo main stages. In the first stage, a large number of attitude statements are
212 EDUCATIONAL AND PSYCHOLOGICAL MEASUREMENT

written to span the entire range of possible opinions, and these items arescaled with regard to their unfavorability or favorability toward a given atti-tude object. There are several Thurstonian techniques for scaling attitudeitems, including pairwise comparisons (Thurstone, 1927a, 1927b, 1927c),equal-appearing intervals (Thurstone & Chave, 1929), and successive inter-vals (Safir, 1937). All of these methods require a group of participants tomake favorability judgments about each item (or each pair of items), and allthree methods yield a set of item scale values that indicate how favorably orunfavorably the item’s sentiment reflects the attitude object. Those itemswith scale values having large standard errors are discarded from the pool ofitems under consideration. In the second stage, participants are asked to indi-cate attitude statements with which they agree. Attitude estimates are devel-oped for each individual by computing the mean (or median) scale valueassociated with endorsed items, and then these attitude estimates are used todevelop empirical operating characteristic curves for each item. The finalThurstone scale is limited to “relevant” items with scale values that are moreor less uniformly distributed across the attitude continuum. A relevant item isone that attracts endorsements primarily from participants whose attitudesare comparable to the sentiment expressed by the item.
The operating characteristic of a relevant Thurstone item reflectsCoombs’s (1964) notion of an ideal point process—a process in which theindividual endorses an attitude item to the extent that it reflects the individu-al’s own opinion. Responses resulting from an ideal point process are bestanalyzed with some form of unfolding model in which the probability ofendorsement is a function of the proximity between an individual and an itemon the underlying attitude continuum. Moreover, by limiting the final scale toonly relevant items, the Thurstone procedure can be regarded as a type ofunfolding model (Andrich, 1988, 1996; Andrich & Luo, 1993; Roberts,1995).
Figure 1 illustrates the theoretical item characteristic curves (ICCs) pre-dicted from an unfolding model. For example, a neutral item should beendorsed most by individuals with relatively neutral attitudes, and it shouldbe endorsed less frequently by persons with more extreme attitudes in eitherdirection. In contrast, a moderately positive item should be endorsed most byindividuals with moderately positive attitudes, and it should be endorsed lessby those with neutral opinions and even less so by persons with negative atti-tudes. In addition, because the unfolding model operates on the basis of theabsolute distance between an individual and an item on the continuum, thosepersons with extremely positive attitudes may exhibit relatively less agree-ment with a moderately positive item because it fails to reflect the extremityof their opinions. A moderately negative item would be characterized by theopposite pattern of responding as shown in Figure 1.
ROBERTS ET AL. 213

The Likert Procedure
The Likert procedure attempts to measure individual attitudes withoutderiving the locations of attitude items on the underlying continuum (i.e.,without deriving item scale values). When constructing a Likert scale, a largenumber of preliminary items are developed such that each item expresses aclearly negative or positive opinion—neutral items are avoided. Participantsgenerally are asked to indicate how much they disagree or agree with eachitem using a graded disagree-agree scale. Responses to negatively wordeditems are reverse scored, and then all responses are subjected to a variety ofanalyses that attempt to identify the most discriminating, homogeneous, andreliable items. These techniques may involve calculating discriminationindexes, item-total correlations, item-deleted alpha coefficients, and/or prin-cipal components. The final scale is limited to a reasonably small set (gener-ally 20 or fewer) consisting of items that appear optimal with regard to one ormore of these criteria.
214 EDUCATIONAL AND PSYCHOLOGICAL MEASUREMENT
Figure 1. Theoretical item characteristic curves associated with an unfolding model.Note. From (upper) left to right, the curves correspond to a moderately negative item, a neutral item, and a mod-erately positive item.

Likert never provided a theoretical model to justify his method; the use ofclassical test theory to justify the procedure occurred years after Likert’soriginal proposal. Nonetheless, the procedures commonly used to select finalscale items are consistent with the idea of a dominance response process(Coombs, 1964). In a dominance response process, an individual endorses anitem to the extent that the individual is located above the item on the underly-ing continuum. Responses from a dominance process generally are analyzedwith some form of cumulative model in which the probability of endorsementincreases as the signed distance between the individual and the item on theattitude continuum increases. Several researchers have noted that the Likertprocedure is, in a functional sense, a type of cumulative model (Andrich,1996; Green, 1954; Roberts, 1995).
Figure 2 illustrates the theoretical ICCs associated with a general cumula-tive model. Specifically, individuals are expected to agree with a positivelyworded item to the extent that their attitudes are more positive than (i.e.,dominate) the sentiment expressed by the item. Conversely, individuals areexpected to endorse a negatively worded item to the extent that their attitudesare more negative than the opinion expressed by the item. Recall that in theLikert procedure, responses to negatively worded items are reverse scored.As a result of this rescoring, the monotonically decreasing ICC shown in Fig-ure 2 is reflected along the vertical axis and yields a monotonically increasingcharacteristic curve.
The Empirical Response Process
Several researchers (Andrich, 1996; Roberts, 1995; van Schuur & Kiers,1994) have argued that participants generally use some type of ideal pointresponse process when they respond to attitude statements using either agraded or a binary disagree-agree response scale. This perspective resultsfrom the fact that empirical ICCs derived from such statements typicallyresemble those in Figure 3. The 10 items shown in Figure 3 were designed tomeasure attitudes toward abortion. The corresponding ICCs were generatedby first scaling the attitude statements using the successive intervals proce-dure. Scale values derived from this procedure were based on the statementfavorability judgments of 303 participants. In addition, graded disagree-agree responses from 781 participants were obtained for each item using a 6-point response scale on which 1 =strongly disagree, 2 =disagree, 3 =slightlydisagree, 4 =slightly agree, 5 =agree, and 6 =strongly agree. Each partici-pant’s attitude score was estimated from the median scale value associatedwith those items with which the participant agreed to at least some extent(i.e., estimates were derived using the Thurstone procedure). Participantsthen were sorted into one of 26 homogeneous attitude score groups withapproximately 30 individuals per group. The mean attitude score for eachgroup is portrayed on the horizontal axis, and the average item response for
ROBERTS ET AL. 215

each group is given on the vertical axis. The ICCs are arranged on the basis ofitem content (from very negative, to moderate, to very positive sentiments),and the corresponding Thurstone scale values are given parentheticallybeside each item.
The most important feature about the ICCs in Figure 3 is that they aremore consistent with an ideal point response process than with a dominanceresponse process. Specifically, the ICCs for the two extremely negative state-ments are more or less a monotonically decreasing function of estimated atti-tude such that individuals with the most negative opinions endorse thesestatements the most. However, the ICCs begin to exhibit a marked degree ofnonmonotonic behavior as the corresponding attitude statements becomemore moderate in content. We refer to this nonmonotonic behavior asfolding.The folding of ICCs first is apparent with the moderately negative statementsin which those individuals with moderately negative attitudes show the high-est levels of endorsement, but those participants to either side of this attitudi-
216 EDUCATIONAL AND PSYCHOLOGICAL MEASUREMENT
Figure 2. Theoretical item characteristic curves associated with a cumulative model.Note. From (upper) left to right, the curves represent a negatively worded item, the same negatively wordeditem after reverse scoring item responses, and a positively worded item.

nal position exhibit less and less agreement. The folding becomes markedwhen considering neutral items. In those cases, individuals with relativelyneutral attitudes exhibit the most agreement, and those participants with atti-tudes that are more extreme in either a negative or a positive direction reveal
ROBERTS ET AL. 217
Figure 3. Empirical item characteristic curves associated with 10 items designed to measureattitudes toward abortion.
Note. Each vertical axis denotes the mean level of observed agreement (1 =strongly disagreeto 6 =stronglyagree), whereas each horizontal axis denotes the mean Thurstone attitude score. Means were calculated withinhomogeneous Thurstone attitude score groups composed of approximately 30 respondents per group.

substantially lower levels of agreement. The ICCs for the moderately positiveitems are opposite in appearance from those for moderately negative items,albeit somewhat less folded in this case. Furthermore, the ICCs for theextremely positive items are more or less monotonically increasing with esti-mated attitude. Taken together, these ICCs suggest that some type of idealpoint-response process is operating when participants respond to items suchas those in Figure 3.
Theoretical Differences Between Methods
If disagree-agree responses to attitude statements generally follow fromsome type of ideal point process, then why has the Likert procedure per-formed reasonably well in these situations? This question can be answeredbest by comparing the ICCs for a moderately positive item under both anunfolding model and a cumulative model. This comparison is shown in Fig-ure 4. The degree of correspondence between theoretical ICCs under bothmodels is considerable for all but the most extremely positive regions of theattitude continuum. For less extreme attitude positions, both models makesimilar predictions about how individuals will respond to the item. However,the two models make divergent predictions for individuals with the mostpositive attitudes. The unfolding model suggests that individuals withextremely positive attitudes will begin to agree less with a moderately posi-tive item because the item does not reflect the extremity of their opinion wellenough. In contrast, the cumulative model suggests that individuals withextremely positive attitudes will endorse a moderately positive item as muchor more than individuals with less positive attitudes. Consequently, theunfolding model predicts that individuals with extreme attitudes will exhibitless agreement than that predicted by the cumulative model. A similar sce-nario can be constructed to describe how individuals with the most negativeattitudes would respond to moderately negative items under both models.
Given the premise of an ideal point-response process, the Likert proce-dure performs at least reasonably well because neutral items that exhibit themost nonmonotonic ICCs typically are not included on the scale (Andrich,1996; Edwards & Kenney, 1946; Ferguson, 1941; Roberts, 1995). Instead,the scale generally is limited to moderately extreme and extreme items thatexhibit relatively small amounts of nonmonotonic behavior, if any. The itemselection procedures that are used to develop Likert scales help alleviate themost offending neutral items from consideration. Moreover, traditionalinstructions for developing Likert scale items explicitly suggest that neutralitems be avoided (Mueller, 1986). After these traditional scale constructiontechniques are applied, the selected scale items generally will exhibit a highdegree of monotonicity, yet there often will be some nonmonotonic behaviorin the extreme attitude regions, as illustrated in Figure 4. As we shall see, this
218 EDUCATIONAL AND PSYCHOLOGICAL MEASUREMENT

nonmonotonic behavior can lead to problems when obtaining measurementswith the Likert technique.
Implications of the TheoreticalDifferences Between Models
The theoretical item response characteristics associated with the unfoldingand cumulative models can be quite similar when considering the behavior ofmoderately extreme items in nonextreme regions of the attitude continuum.However, these models can produce substantially different expectations inmore extreme regions of the attitude continuum. These theoretical differ-ences lead to some specific predictions with regard to comparisons of Likertand Thurstone attitude scores derived from disagree-agree responses.
1. Likert and Thurstone scores should be related monotonically to each other inthose cases in which individual attitudes are not too extreme relative to theitems under study.
ROBERTS ET AL. 219
Figure 4. Comparison of the theoretical item characteristic curves associated with an unfold-ing model (denoted by squares) and a cumulative model (denoted by plus signs).

2. Likert and Thurstone scores should be related nonmonotonically in situationsin which individual attitudes are substantially more extreme than the items inquestion.
3. When this nonmonotonicity occurs, Likert scores will suggest incorrectly thatindividuals with the most extreme Thurstone scores actually have more mod-erate opinions.
In the pages that follow, we use both simulated and real data to provide sup-port for these hypotheses.
A Simulated Example
Method
The responses of 200 simulees were generated to a series of 59 attitudeitems using the Graded Unfolding Model (Roberts, 1995; Roberts & Laugh-lin, 1996a, 1996b). This model assumes an ideal point response process andproduces ICCs similar to those shown in Figure 1. Responses were on a 6-point scale on which 1 represented the strongest level of disagreement and 6represented the strongest level of agreement. Each simulee’s “true attitude”was sampled randomly from anN(0,2) distribution. Scale values for the 59items ranged from –4.35 to +4.35 and divided the true attitude continuuminto equally spaced segments of size .15. These person and item parameterswere similar to those used in past evaluations of unfolding models. Eachsimulee’s responses to the 59 items were replicated independently 100 timesusing the same nominal parameters.
On the first replication, responses to the 59 items were subjected to a prin-cipal components analysis, and the items with the largest absolute pattern coef-ficients on the first component were chosen to form an optimal 20-item Likertscale under the constraint that 10 items were from the negative side of the trueattitude continuum and 10 items were from the positive side. The negativeitems were reversed scored, and the Likert attitude estimate for a given simu-lee was simply the sum of the 20 scored responses. These same 20 items wereused to generate Likert scores for each simulee on subsequent replications.
A 20-item Thurstone scale was constructed by choosing items that spannedthe latent attitude continuum from –4.05 to +4.05 in equal intervals of .45. (Oneof the 20 items was arbitrarily located at .15.) Thurstone attitude scores werecomputed by averaging the true scale values associated with items endorsed bya given simulee. Endorsement was defined as a response of 4 or more.
At the end of each replication, a given simulee had a Likert score andThurstone score based on the 20 items that were deemed optimal for themethod in question. Each simulee’s Likert scores were averaged across the 100replications, and the same was done for the corresponding Thurstone scores.Average Likert and Thurstone scores then were compared to true attitudes.
220 EDUCATIONAL AND PSYCHOLOGICAL MEASUREMENT

Results
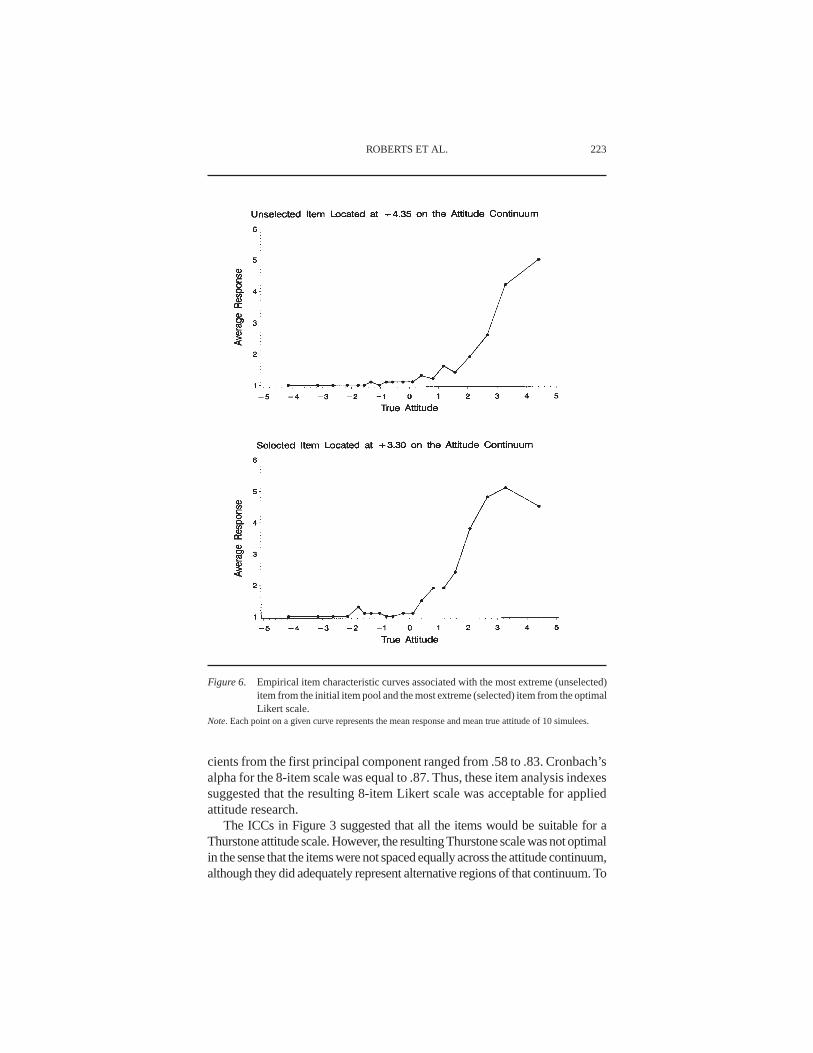
Selection of Likert items. Figure 5 illustrates the pattern coefficients on thefirst principal component for the 59 items from the first replication. The 10negative items identified as optimal by the principal components procedurehad true scale values within the interval of [–3.00, –1.65]. Similarly, the opti-mal positive items were located in the [+1.95, +3.30] interval on the attitudecontinuum. Thus, the selected items were from moderately extreme regionsof the attitude continuum, as opposed to the most extreme regions. Conse-quently, the ICCs associated with the selected items exhibited more foldingthan did those associated with the most extreme, unselected items. This fact isillustrated in Figure 6, which contrasts the empirical ICC for the most posi-tive item selected for the Likert scale with that for the most positive item inthe initial item pool. The most extreme item from the pool exhibited an essen-tially monotonic ICC. In contrast, the ICC associated with most positive itemselected for the Likert scale exhibited a substantial degree of folding in theextremely positive regions of the attitude continuum. Even with these clearlynonmonotonic items, the Likert scale yielded a Cronbach’s alpha of .96, andall corrected item-total correlations were greater than .70.
Relationships among true attitudes, Likert estimates, and Thurstone esti-mates. Figure 7 illustrates the relationships found between mean Likertscores, mean Thurstone scores, and true attitudes. The relationship betweenaverage Thurstone scores and true attitudes was monotonically increasingthroughout the simulated continuum. However, the relationship betweenmean Likert scores and true attitudes was markedly nonmonotonic. Asexpected, the nonmonotonicity was confined to those simulees with extremetrue attitudes. In those instances, Likert scores consistently suggested moremoderate attitude positions when, in fact, the corresponding true attitudeswere the most extreme.
Figure 8 directly compares the mean Likert and Thurstone estimates.There was a nonmonotonic relationship between the two sets of attitude esti-mates such that those simulees with the most extreme Thurstone scores hadcorresponding Likert scores that were indicative of more moderate attitudepositions. This gave rise to an elongated S-shaped function relating the twomeasures.
An Example With Real Data
Method
Graded disagree-agree responses to the 10 items in Figure 3 were obtainedfrom 781 participants. Of theses participants, 750 were undergraduate stu-
ROBERTS ET AL. 221

dents at the University of South Carolina, and 31 were members of specialinterest groups who were known in advance to be for or against the legalstatus of abortion. Responses to each item were on a 6-point scale on which 1 =strongly disagree, 2 =disagree, 3 =slightly disagree, 4 =slightly agree, 5 =agree, and 6 =strongly agree.
A series of item analyses were conducted to determine which of the 10items would be suitable for a Likert scale. The results suggested that the 8nonneutral items corresponding to the two upper and two lower panels of Fig-ure 3 would suffice. Together, these 8 items produced corrected item-totalcorrelations that ranged from .45 to .75, and the corresponding pattern coeffi-
222 EDUCATIONAL AND PSYCHOLOGICAL MEASUREMENT
Figure 5. Pattern coefficients from the first principal component of the interitem correlationmatrix associated with simulated responses to 59 items.
Note. Coefficients are plotted against the true scale value for each item.
cients from the first principal component ranged from .58 to .83. Cronbach’salpha for the 8-item scale was equal to .87. Thus, these item analysis indexessuggested that the resulting 8-item Likert scale was acceptable for appliedattitude research.
The ICCs in Figure 3 suggested that all the items would be suitable for aThurstone attitude scale. However, the resulting Thurstone scale was not optimalin the sense that the items were not spaced equally across the attitude continuum,although they did adequately represent alternative regions of that continuum. To
ROBERTS ET AL. 223
Figure 6. Empirical item characteristic curves associated with the most extreme (unselected)item from the initial item pool and the most extreme (selected) item from the optimalLikert scale.
Note. Each point on a given curve represents the mean response and mean true attitude of 10 simulees.

compensate for the unequal item spacing, each individual’s attitude scorewas derived by computing the median (as opposed to the mean) of scale val-ues associated with items that the individual endorsed to at least some extent.
Results
Figure 9 illustrates the relationship between each individual’s Likert andThurstone scores. The data were smoothed using a cubic spline method
224 EDUCATIONAL AND PSYCHOLOGICAL MEASUREMENT
Figure 7. The relationship between true attitude and mean Thurstone attitude score (top panel)and true attitude and mean Likert score (bottom panel).
Note. Means were calculated across 100 replications.

(Reinsch, 1967), and the resulting curve also is shown in the plot. The corre-lation between Likert and Thurstone scores was .80, and thus, the degree oflinear association between the two measures was within the range reported inprevious comparison studies (i.e., .60≤ r ≤ .95). The data were nonethelessconsistent with the pattern expected under an ideal point hypothesis. Namely,the Likert and Thurstone scores were monotonically (if not linearly) relatedfor those individuals with nonextreme Thurstone attitude estimates. How-ever, the relationship between the two sets of estimates became nonmono-tonic in the extreme regions of the Thurstone continuum. Specifically, theLikert method suggested that individuals with the most extreme Thurstoneattitude scores actually had more moderate opinions relative to the other indi-viduals in the sample.
ROBERTS ET AL. 225
Figure 8. The relationship between mean Likert and mean Thurstone attitude scores computedacross 100 replications.

In addition to smoothing the data with a spline function, the mean valuesof attitude estimates also were calculated in an effort to corroborate the pri-mary trends in the data. Specifically, the data were ranked on the basis ofThurstone estimates and then partitioned into 26 relatively homogenous atti-tude groups with approximately 30 individuals per group. The means of theLikert and Thurstone estimates were computed within each of these groups.The resulting means are shown in Figure 10. Again, the pattern predictedfrom the ideal point hypothesis was evident, although weaker. The relation-ship between the two estimates was nonmonotonic in the extreme portions ofthe Thurstone attitude continuum. Moreover, the Likert method suggestedthat those individuals with the most extreme Thurstone estimates actuallyhad more moderate opinions relative to the other participants in the sample.
226 EDUCATIONAL AND PSYCHOLOGICAL MEASUREMENT
Figure 9. The relationship between observed Likert and Thurstone scores derived from 781respondents.
Note. The number of individuals at a given point on the graph is indexed by the symbol associated with thatpoint. The solid curve represents the value predicted by a cubic spline smoothing function applied to the data.

The nature of the nonmonotonic relationship between Likert andThurstone scores became even more apparent when looking separately at thenegatively worded and positively worded items from the scale. The fournegatively worded items had a Cronbach’s alpha value of .82 and the cor-rected item-total correlations ranged from .53 to .72. Figure 11 illustrates therelationship between the means of the original Thurstone attitude estimatesand the Likert scores derived from the four negatively worded items. (Again,these means were calculated within each of the 26 attitude groups describedpreviously.) The relationship among mean attitude scores is monotonic forall participants except those with the most negative Thurstone attitude esti-mates. This extreme segment of individuals presumably disagreed with themoderately negative items (“Abortion should be illegal except in casesinvolving incest or rape,” “Abortion is basically immoral except when the
ROBERTS ET AL. 227
Figure 10. The relationship between mean Likert and mean Thurstone attitude scores.Note. Means were calculated within relatively homogeneous Thurstone attitude score groups. Each mean wasbased on approximately 30 responses.

woman’s physical health is in danger”) because they did not match theirextreme positions well enough. The statements were, in essence, too moder-ate for them. Consequently, these individuals obtained relatively low scoreson these items. Their item scores were converted to relatively higher scoresafter reverse scoring negatively worded items, and thus, the Likert scoresmade individuals from this segment appear as though they possessed moremoderate attitudes.
The mean Likert scores associated with the positive items are plottedagainst the mean Thurstone scores from the original test in Figure 12. Thefour positive items had a Cronbach alpha value of .82, and the corrected item-total correlations ranged from .58 to .69. In the case of positively wordeditems, the Likert and Thurstone scores were more or less monotonicallyrelated for all individuals except those with the most extremely positiveThurstone attitude estimates. This segment of individuals agreed less withthe moderately positive items (“Abortion should be a woman’s choice, but
228 EDUCATIONAL AND PSYCHOLOGICAL MEASUREMENT
Figure 11. The relationship between mean Likert attitude scores derived from the four nega-tively worded items and mean Thurstone attitude scores.
Note. Means were calculated within relatively homogeneous Thurstone attitude score groups with approxi-mately 30 responses in each group.

should never be used simply due to its convenience,” “Abortion should gener-ally be legal, but should never be used as a conventional method of birth con-trol”) presumably because these items were too moderate for them to whole-heartedly endorse. Consequently, these individuals received lower scores onthese items, which led to lower Likert scores.
Discussion
The results of the simulation and the real data examples suggest that theLikert procedure may falter for individuals who hold extreme attitudinalpositions when responses result from some type of ideal point process. This isbecause the Likert procedure is functionally a cumulative model of theresponse process, and as such, it is not always compatible with responsesfrom an ideal point process. In contrast, the Thurstone procedure is function-ally an unfolding model, and thus, it does correspond to the situation in which
ROBERTS ET AL. 229
Figure 12. The relationship between mean Likert attitude scores derived from the four posi-tively worded items and mean Thurstone attitude scores.
Note.Means were calculated within relatively homogeneous Thurstone attitude score groups with approxi-mately 30 responses in each group.

responses follow from an ideal point process. Due to this correspondence, theThurstone procedure does not suffer from the degraded validity exhibitedwith the Likert method when individuals with extreme attitudes aremeasured.
So what is an applied attitude researcher to do? A knee-jerk reaction tothese data is to include only the most extreme items on a Likert attitudescale—items that are located in the extreme portions of the attitude contin-uum and exhibit essentially monotonic characteristic curves. Although thisstrategy may often work, it suffers from at least two practical drawbacks.First, as shown in the simulation, it sometimes may be difficult to identify themost extreme items with standard item analysis techniques. In these cases,the moderately extreme items with slightly nonmonotonic characteristiccurves may appear to be more optimal candidates for the scale as compared tothe most extreme items. The degree to which this difficulty is encounteredultimately will depend on a variety of factors, which include the distributionof item locations in relation to the locations of individuals and the dis-criminability of the items. Second, even if one could identify the mostextreme items, it may not always be wise to limit the scale solely to them. Ifitems are too extreme (e.g., “Abortion should be a socially acceptable methodof birth control,” “Abortionists should be harassed”), then few individualsother than those with the most extreme attitudes would endorse them to anyappreciable degree. Consequently, the resulting scale scores could vary toolittle across the sample and fail to adequately differentiate individuals acrossmuch of the attitude continuum.
Another overly simplistic response to these results is to simply ignorethem. One might rationalize that the Likert procedure generally performedwell in a majority of cases from both examples reported in this article, and itonly produced conflicting estimates for a small minority of individuals/simu-lees studied. However, this rationale also is quite problematic. Individualswith the most extreme attitudes may form a particularly important segment ina given attitude research project. For example, a researcher may want to iden-tify those individuals who like or dislike a given attitude object the most sothat such individuals can be compared and contrasted on a variety of potentialexplanatory variables. Obviously, identification of these individuals could bedifficult if the Likert procedure was used to obtain attitude scores. Further-more, the proportion of persons who are mismeasured with the Likert methodwill vary from one situation to another and may be more or less than thatexhibited in the current examples.
The results do suggest at least two other courses of action for appliedresearchers. At the very least, the results suggest that more attention shouldbe devoted to the ICCs associated with scale items. This can be done only ifscale values are available for each item, which is usually not the case with tra-ditional Likert scales. Assuming that scale values are developed, then ICCscorresponding to a given sample can be constructed, and the scale can be lim-
230 EDUCATIONAL AND PSYCHOLOGICAL MEASUREMENT
ited to those items that exhibit essentially monotonic behavior. However,examination of the ICCs should not be confined solely to the scale construc-tion process, but instead should be part of the scale application regimen. Thedegree of monotonicity inherent in the ICCs will be highly dependent on therelative locations of persons and items on the attitude continuum, and therange of person locations can obviously change from sample to sample.Therefore, ICCs should be examined in all applied situations in which thesample in question is large enough to justify the results.
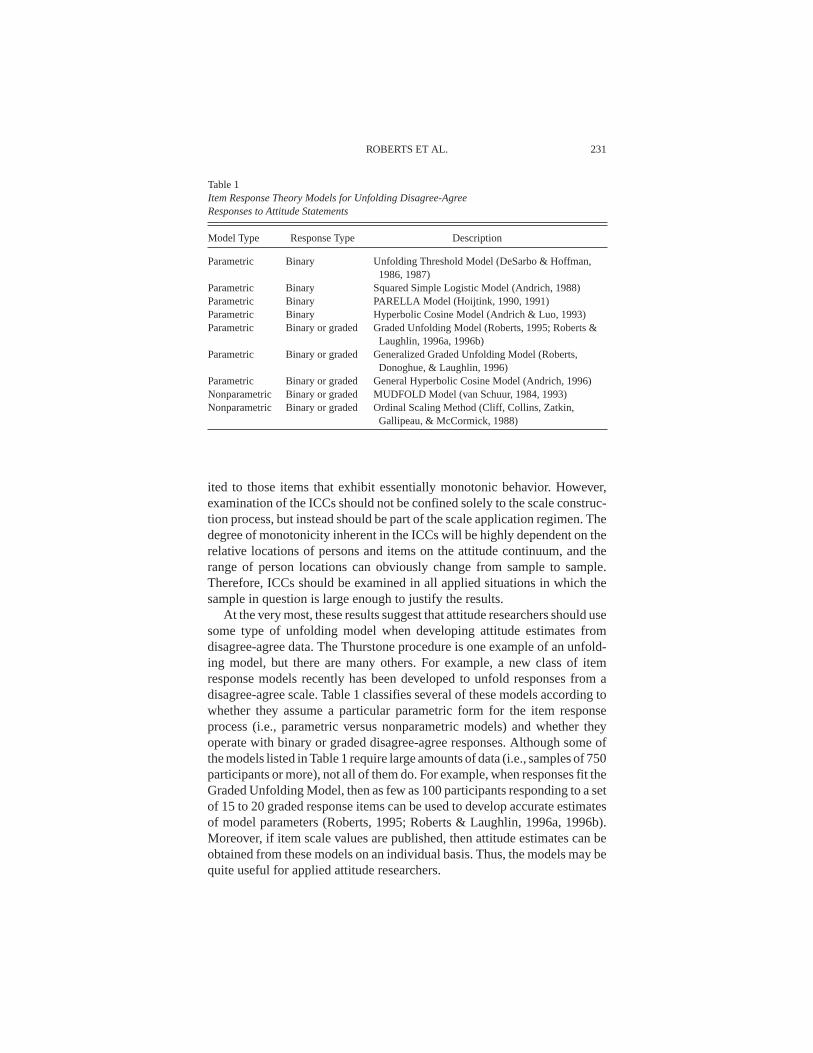
At the very most, these results suggest that attitude researchers should usesome type of unfolding model when developing attitude estimates fromdisagree-agree data. The Thurstone procedure is one example of an unfold-ing model, but there are many others. For example, a new class of itemresponse models recently has been developed to unfold responses from adisagree-agree scale. Table 1 classifies several of these models according towhether they assume a particular parametric form for the item responseprocess (i.e., parametric versus nonparametric models) and whether theyoperate with binary or graded disagree-agree responses. Although some ofthe models listed in Table 1 require large amounts of data (i.e., samples of 750participants or more), not all of them do. For example, when responses fit theGraded Unfolding Model, then as few as 100 participants responding to a setof 15 to 20 graded response items can be used to develop accurate estimatesof model parameters (Roberts, 1995; Roberts & Laughlin, 1996a, 1996b).Moreover, if item scale values are published, then attitude estimates can beobtained from these models on an individual basis. Thus, the models may bequite useful for applied attitude researchers.
ROBERTS ET AL. 231
Table 1Item Response Theory Models for Unfolding Disagree-AgreeResponses to Attitude Statements
Model Type Response Type Description
Parametric Binary Unfolding Threshold Model (DeSarbo & Hoffman,1986, 1987)
Parametric Binary Squared Simple Logistic Model (Andrich, 1988)Parametric Binary PARELLA Model (Hoijtink, 1990, 1991)Parametric Binary Hyperbolic Cosine Model (Andrich & Luo, 1993)Parametric Binary or graded Graded Unfolding Model (Roberts, 1995; Roberts &
Laughlin, 1996a, 1996b)Parametric Binary or graded Generalized Graded Unfolding Model (Roberts,
Donoghue, & Laughlin, 1996)Parametric Binary or graded General Hyperbolic Cosine Model (Andrich, 1996)Nonparametric Binary or graded MUDFOLD Model (van Schuur, 1984, 1993)Nonparametric Binary or graded Ordinal Scaling Method (Cliff, Collins, Zatkin,
Gallipeau, & McCormick, 1988)

This article has illustrated a particular problem with the Likert method,but we must emphasize that the problem has been demonstrated only in situa-tions in which responses presumably follow from some type of ideal pointprocess. Although disagree-agree responses generally appear consistent withan ideal point process, other response scales need not be. For example, thereis no evidence to suggest that frequency responses (e.g., “How often have youpicketed a Planned Parenthood clinic?” 1 =never, 2 = once, 3 = two to fivetimes, 4 =more than five times) would follow from an ideal point process. Infact, such responses seem intuitively consistent with a dominance processand thus should be compatible with cumulative models in general and theLikert method in particular.
References
Andrich, D. (1988). The application of an unfolding model of the PIRT type to the measurementof attitude.Applied Psychological Measurement, 12, 33-51.
Andrich, D. (1996). A hyperbolic cosine latent trait model for unfolding polytomous responses:Reconciling Thurstone and Likert methodologies.British Journal of Mathematical and Sta-tistical Psychology, 49, 347-365.
Andrich, D., & Luo, G. (1993). A hyperbolic cosine latent trait model for unfolding dichotomoussingle-stimulus responses.Applied Psychological Measurement, 17, 253-276.
Barclay, J. E., & Weaver, H. B. (1962). Comparative reliabilities and the ease of construction ofThurstone and Likert attitude scales.Journal of Social Psychology, 58, 109-120.
Cliff, N., Collins, L. M., Zatkin, J., Gallipeau, D., & McCormick, D. J. (1988). An ordinal scal-ing method for questionnaire and other ordinal data.Applied Psychological Measurement,12, 83-97.
Coombs, C. H. (1964).A theory of data. New York: Wiley.DeSarbo, W. S., & Hoffman, D. L. (1986). Simple and weighted unfolding threshold models for
the spatial representation of binary choice data.Applied Psychological Measurement, 10,247-264.
DeSarbo, W. S., & Hoffman, D. L. (1987). Constructing MDS joint spaces from binary choicedata: A multidimensional unfolding threshold model for marketing research.Journal ofMarketing Research, 24, 40-54.
Edwards, A. L., & Kenney, K. C. (1946). A comparison of the Thurstone and Likert techniquesof attitude scale construction.Journal of Applied Psychology, 30, 72-83.
Ferguson, L. W. (1941). A study of the Likert technique of attitude scale construction.Journal ofSocial Psychology, 13, 51-57.
Flamer, S. (1983). Assessment of the multitrait-multimethod matrix validity of Likert scales viaconfirmatory factor analysis.Multivariate Behavioral Research, 18, 275-308.
Green, B. F. (1954). Attitude measurement. In G. Lindzey (Ed.),Handbook of social psychology(1st ed., Vol. 1, pp. 335-369). Reading, MA: Addison-Wesley.
Hoijtink, H. (1990). A latent trait model for dichotomous choice data.Psychometrika, 55, 641-656.
Hoijtink, H. (1991). The measurement of latent traits by proximity items.Applied PsychologicalMeasurement, 15, 153-169.
Jaccard, J., Weber, J., & Lundmark, J. (1975). A multitrait-multimethod analysis of four attitudeassessment procedures.Journal of Experimental Social Psychology, 11, 149-154.
Likert, R. (1932). A technique for the measurement of attitudes.Archives of Psychology, 140, 5-53.
232 EDUCATIONAL AND PSYCHOLOGICAL MEASUREMENT

Likert, R., Roslow, S., & Murphy, G. (1934). A simple and reliable method of scoring theThurstone attitude scales.Journal of Social Psychology, 5, 228-238.
Mueller, D. J. (1986).Measuring social attitudes: A handbook for researchers and practitioners.New York: Teachers College Press.
Petty, R. E., & Cacioppo, J. T. (1981).Attitudes and persuasion: Classic and contemporary ap-proaches. Dubuque, IA: William C. Brown.
Reinsch, C. H. (1967). Smoothing by spline functions.Numerishe Mathematik, 10, 177-183.Rhoads, R. F., & Landy, F. J. (1973). Measurement of attitudes of industrial work groups toward
psychology and testing.Journal of Applied Psychology, 58, 197-201.Roberts, J. S. (1995).Item response theory approaches to attitude measurement(Doctoral dis-
sertation, University of South Carolina, Columbia, 1995).Dissertation Abstracts Interna-tional, 56, 7089B.
Roberts, J. S., Donoghue, J. R., & Laughlin, J. E. (1996, June 28).A generalized item responsemodel for unfolding responses from a graded scale. Paper presented at the 61st annual meet-ing of the Psychometric Society, Banff, Alberta, Canada.
Roberts, J. S., & Laughlin, J. E. (1996a). A unidimensional item response model for unfoldingresponses from a graded disagree-agree response scale.Applied Psychological Measure-ment, 20, 231-255.
Roberts, J. S., & Laughlin, J. E. (1996b).The graded unfolding model: A unidimensional item re-sponse model for unfolding graded responses(RR-96-16). Princeton, NJ: Educational Test-ing Service.
Safir, M. A. (1937). A comparative study of scales constructed by three psychophysical meth-ods.Psychometrika, 2, 179-198.
Seiler, L. H., & Hough, R. L. (1970). Empirical comparisons of the Thurstone and Likert tech-niques. In G. Summers (Ed.),Attitude measurement(pp. 159-173). Chicago: Rand McNally.
Thurstone, L. L. (1927a). Psychophysical analysis.American Journal of Psychology,38, 368-389.Thurstone, L. L. (1927b). A law of comparative judgment.Psychological Review,34, 273-286.Thurstone, L. L. (1927c). The method of paired comparisons for social values.Journal of Abnor-
mal and Social Psychology, 26, 249-269.Thurstone, L. L. (1928). Attitudes can be measured.The American Journal of Sociology, 26,
249-269.Thurstone, L. L., & Chave, E. J. (1929).The measurement of attitude: A psychophysical method
and some experiments with a scale for measuring attitude toward the church. Chicago: Uni-versity of Chicago Press.
van Schuur, W. H. (1984).Structure in political beliefs: A new model for stochastic unfoldingwith application to European party activists. Amsterdam: CT Press.
van Schuur, W. H. (1993). Nonparametric unidimensional unfolding for multicategory data.Po-litical Analysis, 4, 41-74.
van Schuur, W. H., & Kiers, H.A.L. (1994). Why factor analysis is often the incorrect model foranalyzing bipolar concepts, and what model can be used instead.Applied PsychologicalMeasurement, 18, 97-110.
ROBERTS ET AL. 233