validity of a submaximal i-mile track test in predicting …€¦ · · 2007-10-30validity of a...
TRANSCRIPT

Pediatric Exercise Science, 2000, 12, 80-90 O 2000 Human Kinetics Publishers, Inc.
Validity of a Submaximal I-Mile Track Jog Test in Predicting V0,max in Fit Teenagers
Brian R. Hunt, James D. George, Pat R. Vehrs, A. Garth Fisher, and Gilbert W. Fellingham
The purpose of this study was to validate the ability of the I-mile jog test to predict V02max in fit teenagers. Forty-one males and 42 females performed the steady-state, submaximal jogging test on an indoor track, along with a maximal graded exercise test (GXT) on a treadmill. Open circuit calorimetry was used during the GXT to measure maximal oxygen consumption (V0,max). We generated the following age-specific prediction equation applicable to boys and girls 13-17 years old (n = 83, Radj = .88, SEE = 3.26 ml . kg-' - min-I): V0,max = 92.91 + 6.50 x gender (0 = female, 1 = male) - 0.141 x body mass (kg) - 1.562 x jog time (min) - 0.125 x heart rate (bpm). Cross-validation results were acceptable (SEEpress = 3.44 ml - kg-' . min-I). As a field test, the submaximal 1-mile jogging test may alleviate problems associated with pac- ing, motivation, discouragement, injury, and fatigue that are sometimes asso- ciated with maximal effort timed or distance run tests.
Maximum oxygen consumption (V0,max) is considered the single best index of physical work capacity or cardiorespiratory fitness (CRF). Nevertheless, measur- ing V0,max during a maximal graded exercise test (GXT) is often impractical be- cause of the need for trained laboratory personnel, expensive indirect calorimetry equipment, on-line computers, and in some cases appropriate medical supervision. Moreover, maximal GXTs are exhausting for the participant and do not accornmo- date the testing of large groups of people at the same time. In an effort to overcome these practical limitations, a number of field tests have been developed that predict V0,ma.x or CRE
To date, the most popular tests used to assess CRF in school aged individu- als (K-12) are performance-based distance runs (3, 17, 21, 24, 25, 28). For ex- ample, the 1-mile walk/run (8-10, 12,29, 3 I), 1.5-mile run (16, 19), and 12-min run (5,7, 11,27) are frequently used because equipment needs are minimal, most schools have a track or field that can be used to administer the tests, and large groups of people can all be tested at the same time. In addition, participants only
B.R. Hunt, J.D. George, andA.G. Fisher are with the Department of Physical Educa- tion at Brigham Young University, Provo, UT 84602. P.R. Vehrs is with the Baylor College of Medicine, One Baylor Plaza, Houston, TX 77030 and the Texas Children's Hospital. G.W. Fellingham is with the Department of Statistics at Brigham Young University.

Submaximal Track Jog - 81
need to record their run distance or time to determine their CRE Despite these advantages, however, the need for alternative tests is warranted since performance- based running tests require maximal effort, which is not always necessary or ap- propriate. For example, unconditioned, asthmatic, or obese children may find a maximal run discomforting and discouraging. Additionally, individuals who are inexperienced runners may be unable to pace themselves properly over the test distance or time, resulting in a poor performance.
Submaximal, steady-paced exercise tests such as the 1-mile walk (10, 23) and the 1-mile jog (14) that estimate CRF using elapsed exercise time and exercise heart rate (HR) may be more appropriate for youth. Recently, McSwegen et al. (30) showed that the 1-mile Rockport Fitness Walking Test (23) achieved accept-
- able accuracy (r = 30, SEE = 4.9 rnl - kg-' . min-') in high school-aged individu- als. Thus far, the validity of the I-mile jog (14) has been determined in college- aged adults (14,32,35), but it has not been established in children or adolescents.
The purpose of this study was twofold: first, to cross-validate the submaximal 1-mile track jog (14) in teenagers, aged 13 to 17 years and, second, to develop a new prediction equation for this age group if the original 1-mile track jog regres- sion model proved invalid.
Methods
Participants
Eighty-six volunteers, aged 13 to 17 years, consented to participate in this study. Each participant, along with a parent or legal guardian, signed an informed con- sent form in accordance with the Institutional Review Board and school district requirements. Prior to testing, all participants completed a brief health question- naire to screen for possible cardiovascular and orthopedic contraindications to maximal exercise. The guidelines for exercise testing as set forth by the American College of Sports Medicine (1) and the American Heart Association (2) were fol- lowed.
Testing Procedures
To prepare for the exercise tests, participants were asked to: (a) avoid fatiguing exercise the day of the test, (b) refrain from consuming a heavy meal within 3 hrs of the test, (c) wear lightweight and nonrestrictive clothing (jogging shoes and shorts), and (d) warm up and stretch as needed. All participants (N = 86) per- formed two tests: the submaximal, steady-state 1-mile track jog (MJ) and a maxi- mal graded exercise test (GXT) on a motor driven treadmill. Both tests were com- pleted in a random order within a 2-week period. At least 48-hrs of rest was re- quirea wnen ~ T ~ r e - ~ ~ i r ~ n m e n t a l -- conditions of the indoor track on which the MJ test was performed were similar to the exercise laboratory (22°C and 4 5 % relative humidity).
1-Mile Track Jog
The MJ protocol required participants to jog a 1-mile distance (1.61 km) at a mod- erate submaximal self-selected steady pace (14) on an indoor track. To help pre- vent highly motivated andlor lower fit participants from working too hard, the

82 - Hunt et a/.
following criteria (14) were set: (a) participants were restricted to an elapsed 1- mile jog time of 2 8.0 min for males and 2 9.0 min for females, and (b) exercise HR was not to exceed 180 bpm at any time during the test. Exercise HR was monitored using an electronic monitoring device (Polar, Stamford, CT).
Participants were instructed to jog a warm-up lap (402 m) at an easy pace (e.g., at least 2 min for males and 2.25 min for females). Heart rate was monitored after the warm-up lap, and participants with a HR > 180 bpm were instructed to jog at a slower pace for the actual test. After the warm-up, participants were instructed to: (a) jog the entire 1-mile distance at a steady pace; (b) maintain a comfortable and submaximal level of exertion; and (c) jog continuously. To help ensure that participants main- tained a steady pace, the test administrator monitored and recorded the elapsed time and exercise HR of each lap. At the completion of the 1-mile distance, the administra- tor also recorded each participant's steady-state HR, elapsed jog time, and rating of perceived exertion (RPE) using the Borg 15-point scale (4).
Maximal Treadmill GXT
V0,max was measured using a maximal GXT treadmill protocol previously de- scribed (13-15, 32, 35). The first stage involved a 3-min warm-up at a walking pace; the second stage involved jogging at a constant, self-selected pace for 3 min at a level grade. Participants used hand signals to inform the test administrator when a comfortable treadmill jogging speed between 4.5 mph (7.3 kph) and 7.5 mph (12 kph) was achieved. After the second stage, the self-selected jogging speed remained constant, and the treadmill grade was increased by 2.5% for each addi- tional 2-min stage of the GXT. Throughout the test, participants were not allowed to grasp the front or side handrails of the treadmill. Near the end of each stage, exercise HR was recorded from an electronic HR monitor (Polar, Stamford, CT), and participants reported their RPE from the Borg 15-point scale (4). The test was terminated when the participant was unable to continue despite verbal encourage- ment.
Expired gas volumes were directed through a 3-L mixing chamber and mea- sured with a Ventilation Measurement Module (Sensor Medics, Yorba Linda, CA). The fractions of CO, and 0, were determined from the mixing chamber by a mass spectrometer (Marquette, St. Louis, MO), and oxygen consumption (VO,) values were calculated every four breaths using an on-line computer program (Consentius Technologies, Salt Lake City, UT). V0,max was computed by averaging the high- est six VO, values achieved during the final minute of the GXT. Oxygen consump- tion values were considered maximal if two of the following three criteria (13,33, 34) were met: (a) respiratory exchange ratio (RER) 2 1.1, (b) HR no more than 15 bpm below age-predicted HRrnax (220 - age), and (c) leveling off of VO, despite an increase in work.
Statistical Analysis
One-way ANOVAs were used to determine if significant gender differences ex- isted between each of the demographic and exercise response variables. V0,max was estimated from the MJ data using the original regression equation (MJadU,J of George et al. (14):
V0,max = 100.5 + 8.344 (G) - 0.1636 (WT) - 1.438 (T) - 0.1928 (HR)

Submaximal Track Jog - 83
where G = gender (0 = females, 1 = male), WT = body weight in kg, T = time to complete the 1-mile jog (min s), and HR = submaximal steady-state HR (bpm) at the end of the 1 -mile jog.
A split-plot repeated measures ANOVA multivariate technique and Bonferonni post hoc analysis were used to compare the observed V0,max and the estimate of V02max from the MJ (within-subject factor) and evaluate the differ- ences for a gender effect (between-subject factor). Alpha was adjusted to maintain the nominal alpha at p = .05. A simple Pearson product-moment correlation (r) between measured and estimated V02max was used to evaluate concurrent valid- ity of the MJ,,, equation. Standard error of estimate (SEE) and total error (TE) were computed to quantify the accuracy of the MJ,,, equation using the following equations (26):
SEE = s,-,/l -r&
Multiple linear regression analyses was also used to generate the best re- gression equation to predict V0,max from the following independent variables: age, gender, height, weight, BMI, 1-mile jog time, and steady-state HR. The sig- nificance of each variable added was tested at p < .05 using partial F tests. The estimated V02max using the new equation developed from this study was then regressed against measured V0,max to test for homogeneity of the slope and in- tercept using dummy coded (0, 1) gender groups (20,22). The slope and intercept were also tested for a significant difference from one and zero, respectively. Mul- tiple Pearson product moment correlations (R) and SEE values were calculated, along with PRESS (predicted residual sum of squares) statistics (18) for the total group and each gender. PRESS statistics are an alternative to traditional data split- ting cross-validation techniques that estimate the performance of a prediction equa- tion when the equation is applied to a similar but independent sample.
The FitnessGram test battery (6) includes cutoff scores for a "Healthy Fit- ness Zone" for CRF in children and adolescents. The minimal values of the CRF "Healthy Fitness Zone" (35 ml - kg ' . rnin-I for females, 42 ml kg" mir-I for males) were used as a criterion-referenced standard. The proportion of individuals whose CRF classifications using measured and estimated V0,max values that were in agreement was calculated.
- -- Results --
Data from 83 (males = 41, females =%) of the 86 participants were anam= - - -
Three participants were unable to maintain a steady-state exercise HR at or below 180 bpm during the 1-mile jog test and were dropped from the study. Descriptive statistics for the total, female, and male samples are presented in Table 1. There were no gender differences in HRmax (F,, ,, = 0.08, p = .782) and RERrnax (F,, ,, = 0 . 0 3 , ~ = .86) values. The measured V02max of the males was, on average, 10.8 ml . kg-' . min-' higher (F,, ,, = 114.5, p < .0005) than that of the females. All participants in these analyses met the minimal criteria for a valid maximal GXT.
84 - Hunt et at.
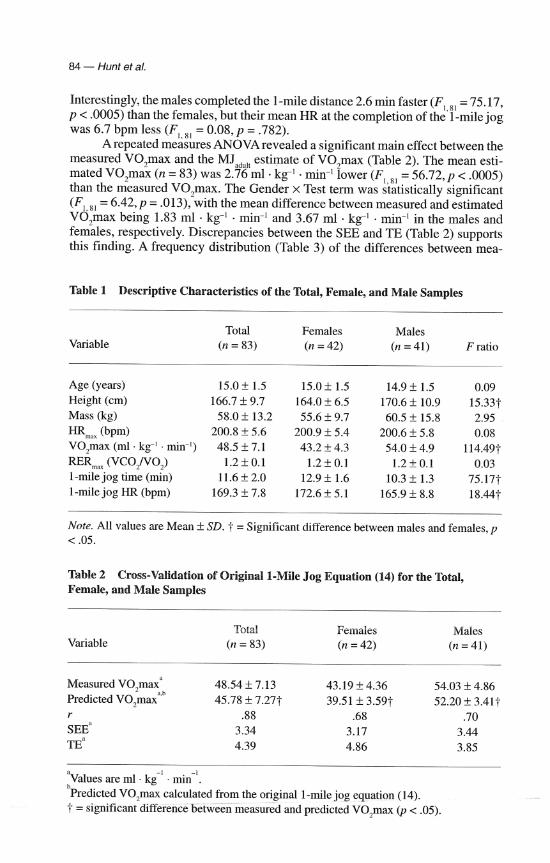
Interestingly, the males completed the I-mile distance 2.6 min faster (F,,,, = 75.17, p < .0005) than the females, but their mean HR at the completion of the 1-mile jog was 6.7 bpm less (F,, ,, = 0.08, p = .782).
A repeated measures ANOVA revealed a significant main effect between the measured V0,max and the MJ,u,t estimate of V02max (Table 2). The mean esti- mated V02max (n = 83) was 2.76 mi . kg-' + min-' lower (F,,, , = 56.72, p < .0005) than the measured V02max. The Gender x Test term was statistically significant (F,,,, = 6 . 4 2 , ~ = .013), with the mean difference between measured and estimated V02max being 1.83 ml - kg1 - rnin-' and 3.67 rnl . kg-' - min-' in the males and females, respectively. Discrepancies between the SEE and TE (Table 2) supports this finding. A frequency distribution (Table 3) of the differences between mea-
Table l Descriptive Characteristics of the Total, Female, and Male Samples
Variable Total Females Males
(n = 83) (n = 42) (n = 41) F ratio
Age (years) Height (cm) Mass (kg)
HR,,, (bpm) V0,max (ml . kg' . min-I) RER,,, (vCO,NO,) 1-mile jog time (min) 1-mile jog HR (bpm)
Note. All values are Mean + SD. 7 = Significant difference between males and females, p < .05.
Table 2 Cross-Validation of Original 1-Mile Jog Equation (14) for the Total, Female, and Male Samples
Variable Total Females Males
(n = 83) (n = 42) (n = 41)
Measured vO,maxa 48.54 + 7.13 43.19 f 4.36 54.03 f 4.86 Predicted ~ 0 , m a < ' ~ 45.78 4 7.277 39.51 +_ 3.597 52.20 f 3.417 r .88 .68 .70 SEE' 3.34 3.17 3.44
4.39 4.86 3.85
-1 b l u e s are ml . k g ' . min . b~redicted V0,max calculated from the original 1-mile jog equation (14). t = significant-difference between measured and predicted V0,max @ < .05).
Submaximal Track Jog - 85
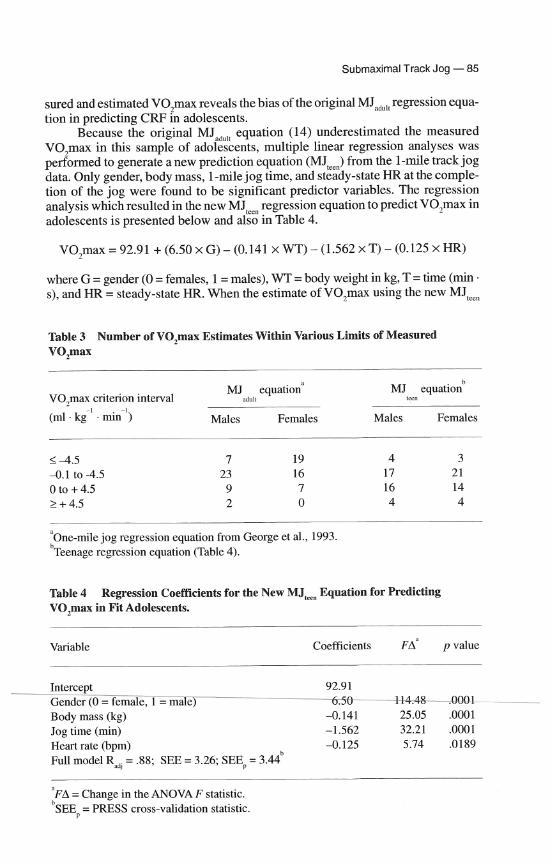
sured and estimated V0,max reveals the bias of the original MJ,du,t regression equa- tion in predicting CRF in adolescents.
Because the original MJ,,, equation (14) underestimated the measured V02max in this sample of adolescents, multiple linear regression analyses was performed to generate a new prediction equation (MJ,,,,,) from the 1-mile track jog data. Only gender, body mass, 1-mile jog time, and steady-state HR at the comple- tion of the jog were found to be significant predictor variables. The regression analysis which resulted in the new MJ, regression equation to predict V02max in adolescents is presented below and also in Table 4.
V02max = 92.91 + (6.50 x G) - (0.141 x WT) - (1.562 x T) - (0.125 x HR)
where G = gender (0 = females, 1 = males), WT = body weight in kg, T = time (rnin . s), and HR = steady-state HR. When the estimate of V02max using the new MJ,,,,
Table 3 Number of V02max Estimates Within Various Limits of Measured V02max
MJ equationa MJ equationh V0,max criterion interval addl teen
(ml . kg' . min-') Males Females Males Females
'one-mile jog regression equation from George et al., 1993. ' ~ e e n a ~ e regression equation (Table 4).
Table 4 Regression Coefficients for the New MJ,,, Equation for Predicting V0,max in Fit Adolescents.
Variable Coefficients FA^ p value
Intercept - - - - 92.91 Gender (0 = female, 1 = male) JU -
Body mass (kg) -0.141 25.05 .0001 Jog time (min) -1.562 32.21 .0001 Heart rate (bpm) -0.125 5.74 .0189 Full model R, = .88; SEE = 3.26; SEEp = 3.44)
a~~ = Change in the ANOVA F statistic. SEE^ = PRESS cross-validation statistic.

86 - Hunt ef a/.
regression equation was regressed against measured V02max, the intercept and slope of the regression line were not significantly different than zero (t,, = .034, p > .05) and one (t,, = 0, p > .05), respectively.
Plots of observed V0,max versus predicted V02max using the original MJadult regression equation and new MJteen regression equation are presented in Figure 1. Table 3 compares the distributions of the differences between measured and pre- dicted V02max using the original MJad,, regression equation and the new MJwn equation. Based on FitnessGram standards, the new MJtee, equation achieved a 97.6% proportion of correct classification decisions between observed and pre- dicted V02max (Table 5). The two participants (1 male and 1 female) who failed to exceed the criterion reference standard based on their measured V02max received a passing score based on their estimated CRF.
Discussion
Endurance runs, such as the 1-mile and 1.5-mile runs, have been used to assess car- diorespiratory endurance in junior and senior high school students. The findings of this study show that the original MJadulF prediction equation (14) significantly underes- timated V0,max in this group of physically fit adolescents. A possible explanation for this is that the linear relationship between submaximal jogging speed, steady-state heart rate, and observed V02max (expressed in rnl . kg' - mit-I) is different in younger teenagers as compared with college-aged individuals (14,15). Thus, we generated the
Predicted V0,max
Figure 1 -Scatter plots of measured V0,max and estimated V0,max using the equation (solid circles and dashed Line) and the MJ, equation (open circles and solid line). Dotted line represents the line of identity.

Submaximal Track Jog - 87
Table 5 Two-by-Two Contingency Table of FitnessGram Pass/Fail Results Based on Measured and Estimated V0,max (ml . kg1 .
Measured V0,max
Pass Fail c
Estimated vO,maxb Pass 81 2 97.6 Fail 0 0
'~ender-specific cut-off points for passing the Fitmesspram standards are 2 35 ml . kg1 min-' for females and 2 42 ml . kg-' . min-l for males. Calculated using new regression equation (Table 4). "c = proportion of correct classification decisions.
age-specific MJ,, equation that accurately predicts (Rad = .88, SEE = 3.26 ml - kg1 . min-I) CRF in fit adolescents. Moreover, the accuracy the prediction equation is similar to previous reports using the original prediction equation. For ex- ample, George et al. (14) reported a Rad, correlation of .87 and a SEE of 3.0 ml . kg ' - min-I when predicting V02max, (range = 35.6 to 59.4 ml . kg1 - .-I) in 18-29- year-old fit college students. A Pearson product moment correlation of .88 was also reported in a group of 21 Caucasian males (35) having V02max values ranging from 30.1 to 61.5 ml . kg1 - min-'.
As with previous studies (14, 32, 35) participants tended to jog the 1-mile distance at relatively high intensities, despite instructions to run at a steady, mod- erate pace. Males and females in this study completed the MJ test at a steady-state HR, which represented 82.7% and 85.9% of their actual HRmax, respectively (Table 1). Nevertheless, several observations suggest that the selected jogging pace was appropriate. Participants did not perceive their exercise intensity as difficult, in that the average RPE reported by males was 9 (range, 7-16) and 10 (range, 7-13) by females. A RPE of 9-10 is considered a "very light" exercise intensity (4). In addition, males completed the MJ in an average time of 10.3 f 1.2 min (range, 8.0-13.9 min), and females jogged at 12.9 f 1.56 min (range, 10.1-16.5 rnin). All participants met the time criteria for completing the MJ. Finally, none of the par- ticipants demonstrated any signs or symptoms suggestive of over-exertion.
One advantage of the MJ test is that the predictor variables (Table 3) of gender, body mass, elapsed jog time, and ending steady-state exercise HR are not difficult to assess. A major advantage of the MJ test is that it is safe, requires
~ & ~ t ~ ~ Q , l d ~ d o l e s c e n t s f i ~ t h e - t e s t - e a s y -
perform. Endurance runs that use overall elapsed time or total distance covered in a specified time period for the criterion measurement require maximal effort, high motivation, and the ability to pace oneself over the duration of the test. Since many individuals who perform endurance runs may be sedentary, performing a test of this nature can be quite uncomfortable and fatiguing, and could lead to injury. The MJ test may serve as a more enjoyable testing experience. Implementing the MJ test could be an avenue to teach important principles about exercise, such as pac- ing and the importance of moderate intensity continuous exercise. A less-intense

88 - Hunt et a/.
exercise testing experience may encourage adolescents to begin and maintain an exercise program to improve their CRF.
Eighty-one of the 86 participants (94%) in this study had measured CRF levels above the low end of the healthy fitness zone (6) of 35 rnl - kg ' - min-' for females and 42 rnl . kg-' . min-' for males. These passlfail thresholds represent approximately the 20th percentile (6). The three participants whose data were ex- cluded from the analysis due to an inability to meet the MJ time and HR criteria had measured CRF levels below the passlfail threshold. Two other participants (1 male and 1 female) had measured CRF values below the healthy fitness zone but were able to meet the MJ time and HR criteria. For those youth who are less fit, the 1-mile walk test (23,30) would be more appropriate. Deciding which test to per- form can be accomplished by practicing the MJ and monitoring exercise time and HR. Youth who are highly motivated and have high levels of CRF may choose either the 1-mile walk or jog or a more traditional field test.
One potential problem with performing the MJ test is the measurement of exer- cise HR. If heart rate monitors are not available, participants must be taught to take an accurate pulse rate to ensure the accuracy of the test. If HR monitors are worn, pastici- pants should focus on maintaining a submaximal steady pace rather than their exer- cise HR. A steady-state pace can easily be monitored using a large clock positioned on the track.
In conclusion, this study demonstrates that a submaximal 1-mile track jogging test is a viable alternative to maximal endurance runs such as the 1-mile run or the 1.5-mile run in predicting CRF in adolescents. In addition, a test of this nature could alleviate problems of pacing motivation, discouragement, and injury associated with endurance runs. The 1-mile track jog test is easy to perform and simple to administer, and the new MJ,, prediction equation accurately predicts CRF in relatively fit teen- agers. Future studies are warranted to evaluate the predictive accuracy and generalizability of the MJ,,, equation in similar but independent samples of teens.
References
1. American College of Sports Medicine. ACSMS Guidelines for Exercise Testing and Prescription (5th ed.). Baltimore: Williams and Wilkins, 1995.
2. American Heart Association Council on Cardiovascular Disease in the Young. Stan- dards for exercise testing in the pediatric age group. Circ. 66: 1377a-1397a, 1982.
3. Bonen, A., V.H. Heyward, K.J. Cureton, R.A. Boileau, and B.H. Massey. Prediction of maximal oxygen uptake in boys, ages 7-15 years. Med. Sci. Sports Exerc. 11:24-29, 1979.
4. Borg, G.A.V. Psychophysical basis of perceived exertion. Med. Sci. Sports Exerc. 14377- 381, 1982.
5. Coleman, A.E., and A.S. Jackson. Two procedures for administering the 12-minute run. J. Hlth. Phys. Educ. Rec. 45:60-62, 1974.
6 . Cooper Institute for Aerobics Research. FitnessGram: Test Administration Manual. Dallas, TX: Cooper Institute for Aerobics Research, 1994.
7. Cooper, K.H. A means of assessing maximal oxygen intake. JAMA 203(3):135-138, 1968.
8. Cureton, K.J., M.A. Sloniger, J.P. O'Bannon, D.M. Black, and W.P. McCormack. A generalized equation for prediction of V0,peak from I-mile runlwalk performance. Med. Sci. Sports Exerc. 27:445-451, 1995.
Submaximal Track Jog - 89
9. Dolgener, F.A., and W.B. Brooks. The effects of interval and continuous training on V0,max and performance in the mile run. J. Sports Med. 18:345-352, 1978.
10. Dolgener, F.A., L.D. Hensley, J.J. Marsh, and J.K. Fjelstul. Validation of the Rockport fitness walking test in college males and females. Res. Quart. Exerc. Sport 65: 152-158, 1994.
11. Doolitle, T.L., and R. Bigbee. The 12-minute run-walk: a test of cardiorespiratory fit- ness of adolescent boys. Res. Quart. Exerc. Sport 39:491-495, 1968.
12. Doriack, J.J., and J.K. Nelson. The one mile run and two mile runs as measures of cardiovascular fitness in college women. J. Sports Med. Phys. Fit. 23:322-325,1983.
13. Freedson, P.S. and T.L. Goodman. Measurement of oxygen consumption. In: Pediatric Laboratory Exercise Testing: Clinical Guidelines, T.W. Rowland (Ed.). Champaign, IL: Human Kinetics, 1993, pp. 91-114.
14. George, J.D., P.R. Vehrs, P.A. Allsen, G.W. Fellingham, andA.G. Fisher. V0,max esti- mation from a submaximal 1-mile track jog for fit college-aged individuals. Med. Sci. Sports Exerc. 25:401-406, 1993.
15. George, J.D., P.R. Vehrs, PA. Allsen, G.W. Fellingham, and A.G. Fisher. Development of a submaximal treadmill jogging test for fit college-aged individuals. Med. Sci. Sports Exerc. 25:643-647,1993.
16. Getchell, L.H., D. Kirkendall, and G. Robbins. Prediction of maximal oxygen uptake in young women joggers. Res. Quart. 48:61-67, 1977.
17. Gutin, B., R.K. Fogle, and K. Stewart. Relationship among submaximal heart rate, aerobic power, and running performance in children. Res. Quart. 47536-540, 1976.
18. Holiday, D.B., J.E. Ballard, and B.C. McKeown. PRESS-related statistics: regression tools for cross-validation and case diagnostics. Med. Sci. Sports Exerc. 27:612-620, 1995.
19. Jackson, A., R. Dishman, S. LaCroix, R. Patton, and R. Weinberg. The heart rate, per- ceived exertion and pace of the 1.5 mile run. Med. Sci. Sports Exerc. 13:224-228,1981.
20. Jackson, A.S. Application of regression analysis to exercise science. In: Measurement Concepts in Physical Education and Exercise Science, M.J. Safrit and T.M. Wood (Ed.). Champaign, IL: Human Kinetics, 1989, pp. 181-205.
21. Jackson, A.S., andA.E. Coleman. Validation of distance run tests for elementary school children. Res. Quart. 47536-94, 1976.
22. Kirlinger, EN., and E.J. Pedhazur. Multiple Regression in Behavioral Research. New York: Holt, Rinehart and Winston, 1973.
23. Kline, G., J.P. Porcari, R. Hintermeister, P.S. Freedson, A. Ward, R.F. McCarron, J. Ross, and J.M. Rippe. Estimation of V0,max from a 1-mile track walk, gender, age, and body weight. Med. Sci. Sports Exerc. 19:253-259, 1987.
24. Krahenbuhl, G.S., R.P. Pangrazi, G.W. Petersen, L.N. Burkett, and M.J. Schneider. Field testing of cardiorespiratory fitness in primary school children. Med. Sci. Sports
1 0 : 2 0 8 - 2 1 3 , 1978. 25. Krahenbuhl, G.S., R.P. Pangrazzi, L.N. B u r ~ a s a r F i e l d - -
estimation of V0,max in children eight years of age. Med. Sci. Sports 9:37-40, 1977. 26. Lohrnan, T.G. Skinfolds and body density and their relation to body fatness: a review.
Hum. Biol. 53:181-225, 1981. 27. Maksud, M.G., and K.D. Coutts. Application of the Cooper 12 minutes run-walk test to
young males. Res. Quart. 42:54-59, 197 1. 28. Massicotte, D.R., R. Gauthier, and P. Markon. Prediction of V0,max from the running
performance of children aged 10-17 years. J. Sports Med. 15: 10-17, 1985.

90 - Hunt et at.
29. McCormack, W.P., KJ. Cureton, T.A. Bullock, and P.G. Weyand. Metabolic determi- nants of 1-mile runlwalk performance in children. Med. Sci. Sports Exerc. 23:611-617, 1991.
30. McSegin, P.J., S.A. Plowman, G.B. Wolff, and G.L. Guttenberg. The validity of a one mile walk test for high school age individuals. Meas. Phys. Educ. Exerc. Sci. 2:47-63, 1998.
31. Oja, P., R. Laukkanen, M. Pasanen, T. Tyry, and I. Vuori. A 2-km walking test for assessing cardiorespiratory fitness of healthy adults. Int. J. Sports Med. 12356-362, 1991.
32. Quail, J.W., P.R. Vehrs, and A.S. Jackson. Predicting V02max in African Americans and Whites with the 1-mile track jog test. Meas. Phys. Educ. Exerc. Sci. 3:l-14, 1999.
33. Rivera-Brown, A.M., M.A. Rivera, and W.R. Frontera. Applicability of criteria for in active adolescents. Ped. Exerc. Sci. 4:331-339, 1992.
34. Rowland, T.W. Aerobic exercise testing protocols. In: Pediatric Laboratory Exercise Testing: Clinical Guidelines, T.W. Rowland, (Ed.). Champaign, IL,: Human Kinetics, 1993, pp. 19-42.
35. Vehrs, P.R., J.D. George, and G.W. Fellingham. Prediction of V02max before, during, and after 16 weeks of endurance training. Res. Quac Exerc. Sport 69:297-303, 1998.