valley of the sun united way final evaluation of the rapid ...€¦ · valley of the sun united way...
TRANSCRIPT

Valley of the Sun United WayFinal Evaluation of the
Rapid Rehousing 250 ProgramCommissioned by Valley of the Sun United Way
Prepared by Focus Strategies
June 2017

Valley of the Sun United WayFinal Evaluation of the Rapid Rehousing 250 Program
Commissioned by Valley of the Sun United Way
Prepared by Focus StrategiesTracy Bennett, Director of Analytics and EvaluationKatharine Gale, Principal Associate
Many thanks to the collaborative efforts of public and private funders in Maricopa County, in partnership with Valley of the Sun United Way, for raising the resources to dedicate to the development and evaluation of this innovative rapid rehousing program for single adults. Thanks also to the leadership provided by Operations Team members; the executive and line staff from A New Leaf, UMOM, Mercy House, and HOM Inc.; and the RRH 250 participants who shared their experiences in focus groups with us. Every individual we encountered was passionate about improving the lives of homeless adults and shared invaluable insight and ideas throughout this work.

Visit Focus Strategies’ website
focusstrategies.net to find our reports, research, news, and more information about who we are and what we do. Focus Strategies offers analytic services to help communities reduce and end homelessness. Our services include system planning and performance measurement; system and program evaluations; coordinated entry design; supportive housing system development; and point in time counts.

Valley of the Sun United Way Final Evaluation of the Rapid Rehousing 250 Program
Table of Contents
A. Executive Summary ............................................................................................................................... 4
B. Purpose of Report ................................................................................................................................. 8
C. Sources of Information ......................................................................................................................... 9
1. Stakeholder Interviews and Focus Groups ............................................................................... 9
2. Client Data: Assessment, Demographics, Program Exits, and Returns to Homelessness......... 9
3. Program Cost ........................................................................................................................... 11
D. Themes Identified Through Stakeholder Interviews and Focus Groups ............................................. 11
1. Results of Client Focus Groups ................................................................................................ 11
2. Staff and Stakeholder Themes ................................................................................................ 13
3. Changes Reported That May Impact Future Program Performance ...................................... 15
E. Quantitative Data Analysis: Clients Enrolled and Achievement of Key Program Milestones ............. 16
1. Timing of Assessment, Enrollment, Move-In and Exit From the RRH 250 Program ............... 16
2. Descriptive Characteristics of Clients Enrolled in the RRH 250 Program ................................ 18
F. Housing Outcomes .............................................................................................................................. 27
1. Exiting the RRH 250 Program .................................................................................................. 27
2. Characteristics Associated With Receiving Financial Assistance ............................................ 29
3. Characteristics Associated With Exits to Permanent Housing ................................................ 30
4. Characteristics Associated With Returns to Homelessness .................................................... 39
G. Summary and Conclusions .................................................................................................................. 45
1. Key program results ................................................................................................................ 45
2. Other Findings and Recommendations................................................................................... 45
Appendix A: Staff Focus Group Participants and Stakeholder Interviews .................................................. 52
Appendix B: Staff Focus Group Questions .................................................................................................. 53
Appendix C: Stakeholder Interview Questions ........................................................................................... 54
Appendix D: Client Focus Group Participant Characteristics ...................................................................... 55
Appendix E: Client Focus Group Questions ................................................................................................ 56

Appendix F: Summary of Stakeholder Focus Group and Interview Themes .............................................. 57
Appendix G: Summary of Client Focus Group Themes ............................................................................... 62
Appendix H: Data Cleaning and Quality Analysis ........................................................................................ 65
List of Tables
Table 1: Clients Assessed, Enrolled, Moved-In, and Exited From RRH 250 Program by Quarter ............... 17
Table 2: Time Between Program Milestones .............................................................................................. 18
Table 3: Client Demographic Characteristics .............................................................................................. 18
Table 4: VI-SPDAT Scores ............................................................................................................................ 20
Table 5: Relationship of VI-SPDAT Scores to Demographic Characteristics ............................................... 20
Table 6: Client Recent History of Homelessness ......................................................................................... 21
Table 7: Relationship of VI-SPDAT Scores to History of Homelessness ...................................................... 23
Table 8: Financial Assistance Provided by RRH 250 Program ..................................................................... 24
Table 9: Total Program Cost Estimated Using Provider Invoicing ............................................................... 27
Table 10: Exit Destinations by Whether Clients Were Financially Assisted by the Program ...................... 28
Table 11: Demographic and Homeless Characteristic Associated With Receiving Financial Assistance .... 29
Table 12: Demographic and History of Homelessness Characteristics Associated With Exiting to Permanent Housing For All Clients Enrolled in the Program (Intent to Treat) ........................................... 31
Table 13: Demographic and History of Homelessness Characteristics Associated With Exiting to Permanent Housing For Financially Assisted Clients (Per Protocol) ........................................................... 33
Table 14: Grouping All Enrolled Clients By Highest and Lowest VI-SPDAT Scores (Intent to Treat) ........... 35
Table 15: Demographic and History of Homelessness Characteristics Associated With Exiting to Permanent Housing For All Clients With the Highest VI-SPDAT Scores Enrolled in the Program (Intent to Treat) ........................................................................................................................................................... 35
Table 16: Demographic and History of Homelessness Characteristics Associated With Exiting to Permanent Housing For All Clients With the Lowest VI-SPDAT Scores Enrolled in the Program (Intent to Treat) ........................................................................................................................................................... 36
Table 17: Grouping Financially Assisted Clients By Highest and Lowest VI-SPDAT Scores (Per Protocol).. 37
Table 18: Demographic and History of Homelessness Characteristics Associated With Exiting to Permanent Housing For Financially Assisted Clients With the Highest VI-SPDAT Scores (Per Protocol) ... 37
Table 19: Variables Associated with Higher Rates of Exit to Permanent Housing ..................................... 38

Table 20: Demographic and History of Homelessness Characteristics Associated With Returns to Homelessness for All Enrolled Clients (Intent to Treat) .............................................................................. 39
Table 21: Demographic and History of Homelessness Characteristics Associated With Returns to Homelessness for Financially Assisted Clients (Per Protocol) ..................................................................... 41
Table 22: Demographic and History of Homelessness Characteristics Associated With Returns to Homelessness For All Enrolled Clients With the Highest VI-SPDAT Scores (Intent to Treat) ..................... 43
Table 23: Demographic and History of Homelessness Characteristics Associated With Returns to Homelessness For All Enrolled Clients With the Lowest VI-SPDAT Scores (Intent to Treat) ...................... 43
Table 24: Variables Associated with Higher Rates of Returns to Homelessness ........................................ 44
Table 25: Outcome Summary ..................................................................................................................... 45
List of Figures
Figure 1: Cumulative Percent of Clients Assessed, Enrolled, Moved-In, and Exited From RRH 250 Program .................................................................................................................................................................... 17
Figure 2: Distribution of Length of Time Homeless in Past Three Years ..................................................... 22
Figure 3: Relationship of VI-SPDAT Service Level Recommendation to Program Length of Stay and Length of Financial Assistance ................................................................................................................................ 25
Figure 4: Relationship of VI-SPDAT Service Level Recommendation to Rental Assistance Funds and Total Client Financial Assistance .......................................................................................................................... 25
Figure 5: Relationship of VI-SPDAT Service Level Recommendation to Housing Stabilization Funds and Average Monthly Rental Assistance ........................................................................................................... 26
Figure 6: Exit Destinations by Whether Clients Were Financially Assisted by the Program ....................... 29


A. Executive Summary Focus Strategies was commissioned to evaluate the operations and outcomes of the Maricopa County Rapid Rehousing 250 (RRH 250) program. This program was originally designed to transition at least 250 single individuals who had used overflow shelter on the Human Services Campus into appropriate rapid rehousing opportunities, effectively ending their homelessness. A collaborative of public and private funders raised $2.5 million in dedicated resources to support the effort. The initial goal was to use this resource, along with a partner program launched at the same time to provide permanent supportive housing (known as PSH 275), to end the need for overflow shelter. Initial research conducted by the community had indicated that approximately 50% of the estimated 500 users of overflow shelter could benefit from rapid rehousing and the expectation was that with $2.5 million, approximately $10,000 per targeted individual, 250 persons could be rapidly rehoused within six months.
This report represents the evaluation of the first full year of the Rapid Rehousing 250 program. The report incorporates qualitative and quantitative information to: document the challenges and successes experienced in program implementation and operation, describe the single adults who were enrolled in the RRH 250 project between July 2015 and August 2016, determine the characteristics of those who were most likely to exit to permanent housing, and investigate factors associated with returns to homelessness. It concludes with some key findings and recommendations.
Summary of Key Findings As of August 31, 2016, there were a total of 378 enrollments in the RRH250 program, representing 373 unique clients. Three-quarters of the clients were male, with an average age of 45 years. Clients reported diverse racial and educational backgrounds. Half of clients entered the program with some income and half reported having no income. Clients varied in terms of total previous months homeless over the last three years. Though nearly 40% of clients had been homeless for more than twelve months in the preceding three years, only 16% of them met the HUD definition for chronic homelessness. The average VI-SPDAT assessment score among RRH 250 clients was 5.8, and 66% of participants fell within the VI-SPDAT score range that indicates they are recommended for a rapid rehousing intervention.
Of the 378 enrollments, 255 clients (68%) received financial assistance through the RRH 250 program and moved into housing. Chronically homeless individuals and those with lower VI-SPDAT scores were more likely to receive financial assistance in the program. It took just over 30 days on average for clients to go from program enrollment to moving into permanent housing.
There were 373 exits from the program as of March 31, 2017, and, among those assisted 73.4% were in permanent housing locations. Financial assistance towards housing was associated with higher permanent housing exit rates, as was female gender, entering the program from a sheltered setting, lower VI-SPDAT score at initial assessment, longer length of stay in the program, and higher income at program exit. Somewhat surprisingly, chronic homelessness at program entry was not related to the likelihood of clients finishing the program with permanent housing.
Of the 185 clients who were assisted and left the program with permanent housing, 45 (24%) returned to homelessness at a later date. These returns occurred fairly quickly following program exit, approximately
Final Evaluation of the RRH 250 Program | Prepared for Valley of the Sun United Way by Focus Strategies | June 2017 | Page 4 of 71

three months after exiting, while non-returnees had been out of the program for nearly eight months. Clients who returned were more likely to have experienced domestic violence prior to program entry and less likely to have income at program exit. For clients who received financial assistance and completed the entire program, experiencing domestic violence and having some income at program exit were similarly influential on the likelihood of return to homelessness, though the overall rate of return to homelessness did not significantly differ based on whether the client was financially assisted.
Conclusions and Recommendations Despite a slower start up period than originally hoped for by the program funders, the program housed just over 250 single adults in its first year. The total number who were housed through the program by receiving financial assistance was 252. At the end of the program year 185 of those assisted had completed the program with permanent housing, and another 38 that had been enrolled but not financially assisted had also entered permanent housing.
In terms of the impact on the population at the overflow shelter, it was reported to us that the census of the overflow shelter and campus had fallen by between 200 and 300, most likely due to the combined impact of the RRH 250 and PSH 275 programs. However, the program clearly did not result in a one-for-one reduction of people using the overflow shelter, indicating that the population using the shelter was more dynamic and larger than originally anticipated.
The commitment of $2.5 million for this program in the first year, and its continuation into the second and third year were significant outcomes, as well as the unprecedented level of coordination of multiple funders and providers to implement the program.
Several additional findings and recommendations are also worth noting: 1) Reduce Funding Variability
This program was funded as a pilot with an initial commitment of one year of funding. The intent was to house all 250 persons within the first six months of the program, however, it took far longer to get all clients enrolled and housed. Information about program continuance was not available until very late in the first year. This caused the program to “ramp up” and then “ramp down” almost entirely, before extending and admitting a new cohort in year two. Starting up and winding down is disruptive to the process of working with clients and recruiting and maintaining trained staff. It artificially constrains the time available for clients who enter later in a program year. We recommend planning for longer contract periods (18 months to two years) with decisions made 4-6 months prior to end regarding continuation, extension, or discontinuing.
2) Establish Standard Case Loads and Expectations
This program funded three providers at three different rates with different expectations about the number of persons to be served; thus, case management caseloads varied across the providers. Clients, while generally very satisfied with the program, remarked in some cases that their case managers were very busy. Caseloads also varied over time as the program enrolled and dis-enrolled clients and as staff were brought on (see 1. above). Establishing standard caseloads is an area that could use additional
Final Evaluation of the RRH 250 Program | Prepared for Valley of the Sun United Way by Focus Strategies | June 2017 | Page 5 of 71

research and discussion. We recommend both internal discussion in this program and discussion across the community’s rapid rehousing programs to develop a standardized framework for case management.
3) Review Engagement Process from Enrollment to Housing
This program appears to have experienced significant client loss in the first year between enrollment/briefing and receiving financial assistance (a proxy for getting housed by the program). Just over 32% of those who enrolled (121 people) did not go on to receive financial assistance and become housed by the program.
Our analysis found that those who did not proceed to receiving financial assistance after being enrolled were more likely to be Veterans and more likely to have a higher VI-SPDAT score, and that being chronically homeless made people less likely to leave the program before receiving financial assistance. We recommend that next steps include a discussion of these as well as other factors of the program design that might contribute to why some people do not make it from the enrollment/briefing stage to financial assistance. It is also important to determine whether the addition of a dedicated Housing Locator in the second year impacts the rate at which people enrolled gained housing.
4) Target Improvement of Housing Outcomes and Income Strategies
Just under three-quarters of those of those who received financial assistance exited the program with permanent housing (73.4%). Outcomes were significantly better for those who had an income at exit. We note that having income at entry was not a significant factor, indicating that the program could be successful with those who entered without income but that securing an income was important.
Interestingly, income was not significantly related to permanent housing outcomes for those determined to be highest need by virtue of having a higher SPDAT score (8 and above). For all high scoring clients enrolled in the program, longer lengths of stay in the program and receipt of financial assistance were significant. For the lowest scoring group income at exit was significant, as was employment at entry. This group was more likely to be successful if they entered the program with employment.
Potential implications of these findings include developing different approaches for clients with different income plans. Those who enter with income may need a different type of case management, while those with the highest needs may need additional time or support to secure income or execute an alternative housing plan.
5) Review Rates of Return to Homelessness and Consider Follow Up Strategies
The return rate for the entire program (including those who did not receive financial assistance) was 28%. For those receiving financial assistance the return rate was 24%. This is above the standard recommended by the National Alliance to End Homelessness, which has established 85% not returning (or fewer than 15% returning) as a target. However, there is little information about returns for single adults. Research on single adult Veterans served in the national Support Services for Veteran Families program (SSVF) found return rates of 16% in the first year, rising to 26.6% in the second year.
Final Evaluation of the RRH 250 Program | Prepared for Valley of the Sun United Way by Focus Strategies | June 2017 | Page 6 of 71
Two factors contributed significantly to whether clients who had been housed in the program were more likely to return to homelessness; those who reported previously having experienced domestic violence prior to entry were more likely to return as well as those who had no income at the time of completing the program. We recommend these two factors be considered in revising the program design.
Returns typically happen rather quickly; the average time from program exit to a return for those provided financial assistance was 3.2 months. This finding could indicate that it may be worthwhile to explore continuing to check in on clients after exit, particularly in the first three months, or providing some other form of after-care.
6) Consider Retaining Transfer Capacity to Other Programs
During the first year of the program, another program for Permanent Supportive Housing (PSH 275) was also launched. The two programs case conferenced together and allowed for transfers from RRH 250 to PSH for a small number of cases that appeared to be in need. Our focus groups included two clients that had benefited from this type of program transfer. At the end of the first year, with the introduction of coordinated entry, this transfer capacity was eliminated. We recommend that the community reconsider this policy and practice, and consider having a portion of PSH units or other subsidy program turnover available as a “back stop” for rapid rehousing.
7) Recommendations for Implementing Future Large-Scale Collaborations
The effort to create and sustain the Rapid Rehousing 250 program was significant and involved many parties. It was seen as an important step, both in its own right and as a model for future collaboration. Expectations changing frequently during the first several months caused frustrations for many, though many challenges were corrected or improved, showing a willingness to change, modify, and incorporate learning. For future efforts of this type we recommend that the planning process include greater clarity of roles and expectations across funders and between funders and providers. Finally, getting regular and usable data was a challenge for the program and for the evaluation of it. Improving data quality and usage and developing program dashboards as part of program design is recommended, ideally with most information able to be extracted from HMIS.
Final Evaluation of the RRH 250 Program | Prepared for Valley of the Sun United Way by Focus Strategies | June 2017 | Page 7 of 71

B. Purpose of Report Focus Strategies was commissioned to evaluate the operations and outcomes of the Maricopa County Rapid Rehousing 250 (RRH 250) program. This program was originally designed to transition at least 250 single individuals who had used overflow shelter on the Human Services Campus into appropriate rapid rehousing opportunities, effectively ending their homelessness. A collaborative of public and private funders raised $2.5 million in dedicated resources to support the effort. The initial goal was to use this resource, along with a partner program launched at the same time to provide permanent supportive housing (known as PSH 275), to end the need for overflow shelter. Initial research conducted by the community had indicated that approximately 50% of the estimated 500 users of overflow shelter could benefit from rapid rehousing and the expectation was that with $2.5 million, approximately $10,000 per targeted individual, 250 persons could be rapidly rehoused within six months.
In April 2015, Valley of the Sun United Way (“VSUW”) issued an RFP on behalf of the funders. Two contracts were awarded to non- profit services providers, one to A New Leaf to rehouse at least 100 men, and one to a collaborative of UMOM and Mercy House (a California-based provider with rapid rehousing experience) to rehouse at least 150 men and women. UMOM, a family provider, was funded to rehouse at least 50 women, and Mercy House (under a subcontract to UMOM) was funded to rehouse 100 men.
In addition, HOM Inc. was contracted with directly by VSUW to provide administration of the financial assistance, including briefing program participants, inspecting housing units prior to lease up, and administering the financial assistance through direct payments to landlords, utility agencies and other vendors. An Operations Team (Ops Team), comprised of representatives from each of the primary funders (VSUW, Arizona Department of Housing, and Maricopa County), managed implementation of the RRH 250 project.
During the first year, the Operations Group periodically provided lists to the providers of eligible persons who had previously been assessed and could be potentially enrolled in the program. The providers conducted outreach to persons on the list, primarily at the Humans Services Campus and the Watkins women’s shelter, and engaged and enrolled clients. Enrolled clients received a housing briefing from HOM Inc. and then searched for housing with assistance from their case management agency if they needed or wanted it. Clients were provided lists of housing, but were able to select their own unit as long as the rent was within the permitted range and the unit passed an inspection. Once rehoused, clients received a temporary subsidy for housing, paid to the landlord by HOM Inc., and home-based case management services from the agency that enrolled them. The anticipated duration of the program was approximately six months, but was expected to vary across clients based on need.
Assessment Referral/ Outreach
Enrollment/Briefing
Financially Assisted/ Housed
End Financial
Assistance
End Provider Return
Final Evaluation of the RRH 250 Program | Prepared for Valley of the Sun United Way by Focus Strategies | June 2017 | Page 8 of 71

This report represents the evaluation of the first full year of the Rapid Rehousing 250 program. It also serves as an evaluation of a rapid rehousing efforts specifically targeted for homeless single adults. Although evidence is accumulating on the effectiveness of rapidly rehousing family households, using rapid rehousing with single adults is far less prevalent. To our knowledge, scant data exists with regard to its efficacy, or the conditions under which it is most likely to be successful. This report, therefore, incorporates qualitative and quantitative information to: document the challenges and successes experienced in program implementation and operation, describe the single adults who were enrolled in the RRH 250 project between July 2015 and August 2016, determine the characteristics of those who were most likely be in permanent housing at the end of the program, and investigate factors associated with later returns to homelessness. It concludes with some key findings and recommendations.
C. Sources of Information Both quantitative and qualitative data were used for this evaluation. The qualitative data was drawn from interviews and focus groups conducted with key system stakeholders, including funders and provider leadership and staff, and clients who had enrolled in the RRH 250 project. The quantitative data was extracted from Homelink (VI-SPDAT data), the Maricopa County Homeless Management Information System (HMIS; all data related to demographics, homeless history, and enrollment and exit dates), and a housing software platform used by HOM Inc. to track housing related expenditures and allow the conduct of all housing related tasks relevant to rapid rehousing. Each data source is described in further detail below.
1. Stakeholder Interviews and Focus Groups During March and April of 2017, Focus Strategies held three in-person focus groups with line staff from the three provider agencies and conducted phone-based stakeholder calls with individuals or small groups including the leadership of provider agencies, representatives of program funders, and others. We interviewed a total of 26 persons connected to the program, and received one set of written answers from someone unable to participate in a phone focus group. See Appendix A for information about participants, Appendix B and C for questions used in the focus groups and stakeholder interviews, and Appendix F for a summary of the focus groups and stakeholder interviews.
Focus Strategies also held four client focus groups with 17 current and former participants in the RRH 250 program. See Appendix D for information about participants, Appendix E for questions used in the focus groups, and Appendix G for a summary of the focus groups.
2. Client Data: Assessment, Demographics, Program Exits, and Returns to Homelessness The data in this report covers July 2015 through March 2017. Four data files were provided to Focus Strategies:1
a. Assessment: Focus Strategies received a data extract from Homelink that contained Client IDs, VI-SPDAT scores, and assessment date. Homelink is a system that can be used for Coordinated Entry, Assessment, Scoring, and Referral. Phoenix has since retired the use of Homelink. The data
1 See Appendix H for information on data cleaning and data quality.
Final Evaluation of the RRH 250 Program | Prepared for Valley of the Sun United Way by Focus Strategies | June 2017 | Page 9 of 71

received represented 375 clients assessed with the VI-SPDAT between November 2013 and March 2017.
The VI-SPDAT is an assessment tool consisting of 17 questions each assigned one potential point. The tool was developed as a combination of the VI (Vulnerability Index) designed to identify among homeless people those most vulnerable, and the SPDAT (Service Prioritization Decision Assistance Tool) a case management assessment tool design to determine needs and well-being of clients in case management. The combined tool is shorter than the contributing tools and is intended as an initial assessment, or “triage” tool, not a case management tool. It is used to assign a score to every person assessed that ranks people from 0-17 in terms of relative need, and also as an initial recommendation based on score for most appropriate intervention: a score of 0-3 is associated with a recommendation to receive general assistance (non-homeless specific services); a score of 4-7 is recommended for rapid rehousing, and a score of 8 and above is recommended for permanent supportive housing (PSH).
During the course of the program, the VI-SPDAT tool was modified and a “2.0” version was put into use. Version 1 of the VI-SPDAT was used to initially assess 262 clients and Version 2 was used for the other 113 clients. All Version 1 scores were converted locally to be comparable to Version 2 scores, which are the scores that were received and used for this report. We note, however, that there was a higher than expected number of enrolled clients whose score reflected a recommendation for PSH using the 2.0 compatible score. It may be that during the transformation process, some who scored for rapid rehousing using Version 1 ended up with a “PSH score” after the conversion.
b. Demographics: Focus Strategies received an HMIS data extract which contained information for 373 unique clients enrolled in the RRH 250 program between July 2015 and August 2016. For the RRH 250 project, program enrollment occurred for most clients on the same day the client was briefed on the process associated with searching for and finding housing. Data elements included: provider, client start date, exit date, age, gender, primary and secondary race, ethnicity, prior living situation, disability status, chronic status, number of times homeless in past three years, number of months homeless in past three years, veteran status, history of domestic violence, income at entry, health insurance at entry, employment status at entry, and highest level of education attained. Exit dates ranged from September 2015 through March 2017.
c. Exit Destination: Focus Strategies received an HMIS data extract which contained data for 349 clients who had been enrolled in and exited from the program, and who had any valid response documented in the exit destination field in HMIS (i.e., includes “exit interview not completed”); the clients included in this report is a subset of those in the Demographics data file. Data elements included entry date, exit date, and exit destination. Entry dates ranged from July 2015 through August 2016 while exit dates ranged from September 2015 through March 2017.
d. Returns to Homelessness: Using the HMIS system to determine if clients had enrolled in shelter after finishing the RRH 250 program, each of the service providers looked up and documented
Final Evaluation of the RRH 250 Program | Prepared for Valley of the Sun United Way by Focus Strategies | June 2017 | Page 10 of 71

returns to homelessness of clients they served. The three files received were combined and contained records for 364 clients. Specific data fields varied by provider, but each data set contained Client ID, Entry Date, Exit Date, Exit Type, Return to Homelessness (Y/N), and Return Date. Entry dates ranged from July 2015 through August 2016, while exit dates ranged from September 2015 to February 2017.
3. Program Cost Two sources of data were provided to Focus Strategies to understand the cost of the program. The first documents client specific housing expenditures while the second reflects program level invoicing over the course of the project for case management and housing related expenses. Case management cost or time spent was not available at the client level.
a. Housing Expenditure Data: HOM Inc. provided Focus Strategies with an extract from the Housing Data Systems (HDS), a housing software platform designed to perform and track housing tasks associated with rapid rehousing (including data collection for funders). The data extract included client level housing expenditure data, and represented 255 clients who had moved into housing with financial assistance from the program. This group of clients represents a subset of those in the Demographics data file, and an overlapping subset with those in the Exit Destination data file. Expenditures are broken down by Housing Stabilization Funds, which cover one-time expenditures including application fees, security deposits, non-refundable fees, and utility deposits, and Rental Assistance Funds which include monthly housing assistance and/or utility assistance payments. Move-in dates ranged from July 2015 through September 2016.
b. Total Program Cost: Valley of the Sun United Way (VSUW) provided data reflecting the monthly program invoicing by providers from June 2015 through February 2017. The summary of all invoices from VSUW broke out billing between costs for case management and for housing assistance, but did not assign costs to specific clients.
D. Themes Identified Through Stakeholder Interviews and Focus Groups Focus groups with staff and clients, and stakeholder interviews with agency and funder leadership were used to obtain qualitative information about the program. Questions for clients focused largely on their experience and satisfaction levels with various aspects of the program including outreach and enrollment, housing search, and housing stabilization phases, as well as recommendations they had for changes. Interviews and focus groups with staff and funders focused on the initial expectations for the program, changes over time, strengths and challenges experienced during the first year, and their perceptions of program results and learnings from the first year.
1. Results of Client Focus Groups Seventeen clients participated in three focus groups and an individual interview. The clients participating in the focus groups overall expressed a high level of satisfaction with the program. Universally, clients cited the support or assistance of their case manager as the thing they liked best about the program.
Final Evaluation of the RRH 250 Program | Prepared for Valley of the Sun United Way by Focus Strategies | June 2017 | Page 11 of 71

Clients described the level of support available as appropriate and reported that their case managers cared about them, were reliable and helpful and went out of their way to support them, even though several also acknowledged they were very busy. Female participants universally said “the support” was the best thing about the program. In the two focus groups held with men, they spoke in terms of reliability and trust. They described their case managers as “there for them”. They also spoke about them as being trustworthy and reflected that the program made them feel trusted themselves. One person said the case managers are “willing to trust you and give you a second chance.” Another said his case managers were “true to their word, always there.” Another said “they need a raise! You can tell even when they are dealing with something, they give it 100%.”
Clients who had experience with other programs mentioned the RRH 250 program as excelling in this respect, and different from other experiences they had had. Two clients had moved to a longer-term subsidy program and while they were grateful for the subsidy, preferred the attention and case management received from the RRH 250 program, wondering why they couldn’t keep their case manager.
Clients also expressed a great deal of satisfaction with the material support they received. Move-in kits were described as very helpful and also a sign of the program’s seriousness about supporting the client. One person said "it felt like Christmas” and another described it as “real support.” Other forms of material support such as furniture vouchers, microwaves and bus passes were mentioned specifically by clients as being very helpful. In addition, most clients mentioned that their case manager had made sure they knew about other resources they could go to, particularly food banks that could help them.
We asked clients what they understood about the program at the start and how the enrollment process went. Most clients expressed surprise at first being informed they were potentially eligible for this program. They described hearing about the program in different ways, through CASS staff, a note on their bed, or through rumors from other clients. One person said she was told she had an appointment and two weeks later found out she was eligible and that it felt like “winning a game show.”
Expectations about what the program would provide once the clients were enrolled varied somewhat though not dramatically. Most clients understood what the program offered, its likely duration, and the expectations of what they needed to do. One woman said “they coach us very well – information was spelled out clearly.” Clients had a variety of experiences finding housing, ranging from those who found the housing fully on their own to ones who had received very intensive help from their case managers to identify and secure housing. It appeared that the variable level of help received corresponded with the clients’ desire for help or independence – no one said they had not gotten the help they needed to find housing. Some clients did complain about out-of-date housing lists. Most clients were satisfied with the role of HOM Inc. though they didn’t have a lot to say about it other than remembering the briefing.
Most expressed satisfaction with the length of the subsidy and the type of support offered, though one client said he felt the program should last longer. Clients had more varied reviews about the housing they had secured. Some clients were very satisfied with their housing – one said he had “a beautiful place” and another mentioned having had a choice of apartments. Several others had mixed feelings or concerns
Final Evaluation of the RRH 250 Program | Prepared for Valley of the Sun United Way by Focus Strategies | June 2017 | Page 12 of 71

about their housing. Some mentioned that they were dissatisfied with the location. For a few this was because they felt that the location was dangerous, and/or had too many other people from the campus there. One person said there were “lots of people from CASS there, lots of drug activity, and I don’t want to use.” Two women said they did not go out from their apartments. Two others mentioned that they had moved far away. They liked the housing they had found but the location was inconvenient and far from their support systems such as friends and church. Two people mentioned that their units were on the second floor and they had difficulty with stairs. Several mentioned feeling that the landlords were using the program to get the rent and felt that they didn’t have long term security.
We asked about additional services or supports that clients wanted or would have benefited from. A few mentioned wanting more focus on employment or education, though others mentioned having received help with employment or handling it on their own. One suggested that there should be more focus on preventing people from losing housing. Another said there needed to be more case managers: “they are good when there, but don’t have much time.”
Finally, clients of the program had varying views of their future. Some felt that their future was very bright while others said they just wanted to “hang on” and “keep progressing”. A few mentioned they were planning to move from where they were living now to be closer to family in other places. Two participants had already lost their housing from the program and had returned to the campus when we spoke with them. They mentioned wanting to start over and one specifically mentioned wanting to get back in the program.
2. Staff and Stakeholder Themes Thirty-four persons in line staff roles and in leadership of provider, funder or partner organizations were interviewed one-on-one or in small groups, and one person who was unable to participate in a phone focus group provided a set of written answers.
Overall stakeholders felt the program had gotten off to a bit of a bumpy start but was generally successful, and had improved with time. Everyone acknowledged that a lot of people have been rehoused, and that there had been a mixed impact on the overflow shelter and the campus – while not completely eliminating the need for overflow, the combination of the RRH 250 and PSH 275 programs appear to have reduced the regular census at the campus. Funders specifically identified this program as the first time a group of funders had aligned funding and oversight in this way. The result was an unprecedented level of investment of millions of additional dollars in funding as well as new working relationships.
Different expectations and assumptions about how the program would work and what was possible caused friction at the outset. Funders wanted to see very quick movement to housing and expected all 250 people to be housed within the first six months. Providers expressed that the goal was not realistic, but felt they were not listened to, and that the funders “had to learn.” The Operations Group, mid-level funder staff responsible for the roll out and ongoing operations, felt at times sandwiched between the providers and the funder groups expectations. Many stakeholders felt that the relationship between
Final Evaluation of the RRH 250 Program | Prepared for Valley of the Sun United Way by Focus Strategies | June 2017 | Page 13 of 71

funders and providers changed in this program from the past in which providers were contracted to deliver services and then had greater autonomy and influence in the design. Some providers felt they had less influence here, though others felt that the program had been designed to be flexible and that their input was solicited and resulted in changes.
Providers reported that they had not initially expected to be conducting outreach to identify and enroll clients. Their expectation was that the list process would identify who should be enrolled and they would not be expected to find or assess them. However, since coordinated entry did not exist, the process of referrals, assessment, and enrollment had to be incorporated into the program. This took significant time throughout the first year, particularly in the first months, posed a significant challenge, and was source of additional friction (especially for providers whose operations for the program were not based at the campus).
Several stakeholders (both funder and provider representatives) also mentioned that the relationship with the Human Services Campus and the CASS shelter where most clients were staying when identified for the program, had been challenging. People said coordination had not been well-established, and that without coordinated entry and with other changes, the relationship had created confusion for clients and for staff. Overall, many people said that in hindsight establishing a clearer partnership framework at the outset would have been good.
During the first six months, several changes occurred that have been noted in previous reports. Most significantly, the program had previously required that all clients be fully assessed by one of the program providers with the complete SPDAT (a longer version of the VI-SPDAT designed to be used as a case management tool) before enrollment. This both took time and also resulted in some people being refused entry to the program whose initial assessment with the VI-SPDAT indicated eligibility. Eliminating this step was seen as a benefit by most.
Providers and funders felt that the program was successful in getting many people housed but had concerns about the long-term stability of clients. Many of the providers identified that the single adult population served had differences from the family population with whom most rapid rehousing has been done in the past. Some identified the specific challenge of participants experiencing isolation and depression once housed. Some also exhibit what one stakeholder described as “survivor’s guilt” – clients feeling badly that they had been given the opportunity for housing when others that they knew had not. Many of the providers commented that the clients need social support and that creating a new life is hard. The program is not long enough, some felt, to really support this kind of change, and anecdotally providers reported that some clients were returning to the campus either for company, meals, etc. while keeping their apartments, or even leaving their housing to return to the campus. One person wondered whether shared housing, a strategy not strongly pursued in this program, could be a solution to the isolation for some participants.
The basic elements of the program (case management and financial assistance) were seen as strong, and generally, the basic design was seen as effective though not necessarily long enough. For case management, caseloads in the program were not standard, with one provider serving twice as many
Final Evaluation of the RRH 250 Program | Prepared for Valley of the Sun United Way by Focus Strategies | June 2017 | Page 14 of 71

clients per case manager as the others. Even agencies with higher staffing levels felt that for this population a lower client to case manager ratio was needed.
Nearly everyone believed that employment needed to be a part of the program design but people did not agree about the best strategy to pursue greater employment outcomes and said this area still needs work. One issue that was identified was that the clients in the program do not necessarily want or have the ability to hold a long-term, full-time job. Some said that clients prefer to work in temporary or day labor situations where they are paid immediately.
Some stakeholders also expressed concerns about housing and about changes in the housing market. Challenges finding units and getting landlords to work with the program were reported as increasing, and a few people commented on the poor quality of some of the housing that clients were living in.
Some stakeholders also talked about the challenges of getting good data. In particular, the Operations Group members expressed frustrations at the lack of readily available data to track progress.
3. Changes Reported That May Impact Future Program Performance We learned of four significant changes that happened toward the end of the first year, and are likely not reflected in the results covered by this report. The first was the development of shared standards for the operation of rapid rehousing in Maricopa County. Adopted in July 2016, these standards align the practice around financial assistance and recertification for rapid rehousing programs generally. While the standards do not deal specifically with the case management model, they do align the way in which programs offer financial assistance including requiring that participants begin paying some rent right away if they have income, and using a progressive engagement approach to financial assistance rather than a set length or step-away model in which assistance is periodically reduced by a set amount. Most case managers and provider representatives we interviewed felt this was an improvement that increased flexibility while also engaging clients more quickly in planning and saving. One case manager expressed concern, however, that this change made it more difficult to attract landlords to the program because a firm commitment of three months’ rent could no longer be made at the outset.
The second change was the implementation of coordinated entry for single adults, which replaced the specific targeting and referral system for RRH 250. This was started in August 2016. Stakeholders reported this change was difficult at first, and was only just being implemented within the year covered by this report, but as our interviews came several months later we heard that most felt that this was ultimately a big improvement. As described above, the outreach/enrollment portion of the program in the first year took significant staff time and was a major challenge. Providers appreciate now being able to enroll clients directly and begin working with them, though they have some concerns that not all referrals are appropriate for the program. In addition, the change to coordinated entry has eliminated the ability to transfer rapid rehousing clients to PSH if participation in the RRH program reveals deeper need for support (“progressive engagement”). Several stakeholders talked about understanding the need for fairness in the process and not wanting to unfairly bypass clients who were not yet housed, but also needing some method for helping RRH 250 clients who are in need of more support without them having to lose housing and return to shelter. In addition, case managers felt that their knowledge should be
Final Evaluation of the RRH 250 Program | Prepared for Valley of the Sun United Way by Focus Strategies | June 2017 | Page 15 of 71

included in the process of the initial recommendation for intervention. They said things like “the SPDAT’s a good tool but it’s a tool” and “we have a pretty good idea of how many have higher needs” than the score shows, but “we no longer have input.”
The third significant change is that HOM Inc., the agency providing housing subsidy management, added a dedicated Housing Locator who was able to work directly with clients having difficulty finding housing, supporting and supplementing the case management staff. This addition was universally hailed as positive and important. Again, this change occurred after the first full year of the program so its impact is not reflected in the data used for this report.
Finally, the RRH250 program launched a partnership with the City and County branches of Arizona@Work, the statewide workforce development network. Arizona@Work provides a wide range of job preparation, skill building, job search and retention assistance to job seekers through the state, not specifically targeted for people experiencing homelessness. This partnership started after the program began and was just launching at the end of the first year. Initial reviews of this relationship were mixed from providers, with some reporting clients having made more use of the partnership than others. Workforce stakeholders also said their experience of the partnership was different based on the assigned case worker. A separate report on the employment aspect of the program will be provided in September 2017.
E. Quantitative Data Analysis: Clients Enrolled and Achievement of Key Program Milestones Next, we turn attention to the quantitative analysis. In the following two sections, we describe the clients enrolled, the attainment of key program milestones, and characteristics associated with exits to permanent housing. The first section begins with an examination of the number of clients at key program milestones (assessment, enrollment, move-in, and exit) by quarter of the program, as well as the time it took to reach each milestone. This is followed by data that documents client demographic characteristics, history of homelessness, and financial assistance provided for housing; the relationship of VI-SPDAT scores to each of these variables is also explored.
1. Timing of Assessment, Enrollment, Move-In and Exit From the RRH 250 Program As noted, 373 unique clients enrolled in the RRH 250 program between July 2015 and August 2016. Of these, 310 (83%) were assessed using the VI-SPDAT prior to enrollment, with assessments occurring as late as September 2016 (see Table 1). Because five clients enrolled in the program two times, there were a total of 378 enrollments. The data also illustrate that program enrollment occurred more slowly than originally anticipated, with only 20% of enrollments occurring in the first quarter. The rate of enrollment increased in the second and third quarters so that over 90% of the enrollments were accomplished by March 2016. Clients continued to enroll through September 2016.
The RRH 250 program financially assisted 255 of the 373 individuals (68%). Table 1 illustrates that the percentage of clients financially assisted over time roughly parallels the percentage of those enrolled. This suggests that, overall, the program was very timely in linking clients with HOM Inc. for financial assistance. Finally, Table 1 shows that almost 83% of the 373 exited clients had left the program by the fifth quarter of services. Figure 1 illustrates these relationships.
Final Evaluation of the RRH 250 Program | Prepared for Valley of the Sun United Way by Focus Strategies | June 2017 | Page 16 of 71

Table 1: Clients Assessed, Enrolled, Moved-In, and Exited From RRH 250 Program by Quarter
Assessed Enrolled Moved In Exited Period N (310) % N (378) % N (255) % N (373) % Prior to 2015 23 7.4 January – March 2015 22 7.1 April – June 2015 30 9.7 July – September 2015 78 25.2 75 19.8 33 12.9 1 0.3 October – December 2015 78 25.2 103 27.2 68 26.7 10 2.7 January – March 2016 52 16.8 103 27.2 71 27.8 67 18.0 April – June 2016 22 7.1 64 16.9 51 20.0 131 35.1 July – September 2016 5 1.6 33 8.7 32 12.5 100 26.8 October – December 2016 48 12.9 January – March 2017 16 4.3
Figure 1: Cumulative Percent of Clients Assessed, Enrolled, Moved-In, and Exited From RRH 250 Program
Table 2 describes the length of time that passes between the key milestones of assessment, enrollment, financial assistance, and exit. Table 2 shows that the average time from assessment to enrollment was 4.3 months, from enrollment to move-in was 33.2 days, and from enrollment to exit was 5.3 months. Averages by quarter varied somewhat over time; the most noteworthy trend was that the time it took between enrollment and exit continually decreased over time until it reached just under four months. We would also like to note the extreme range of values for each of the timeframes: over two years from assessment to enrollment, up to five months from enrollment to move-in, and up to 17 months from enrollment to exit. It is important to note that assessment, administration of the Vi-SPDAT tool, was not necessarily done by the case management agency and could have occurred months prior to enrollment in the program.
0%
20%
40%
60%
80%
100%
% o
f Clie
nts
Enrolled Moved In Exited Assessed
Final Evaluation of the RRH 250 Program | Prepared for Valley of the Sun United Way by Focus Strategies | June 2017 | Page 17 of 71

Table 2: Time Between Program Milestones
Time From Assessment to
Enrollment (Months) Time From Enrollment to
Move-In (Days) Time From Enrollment to
Exit (Months) Enrollment Period N Range Average N Range Average N Range Average July – September 2015 60 0.4-21 4.6 58 5-99 27.1 75 0.6-17 7.1 October – December 2015 86 0.2-20 3.4 73 5-151 36.6 103 0.2-16 5.7 January – March 2016 80 0.3-28 4.5 67 2-103 36.1 102 0.8-13 4.9 April – June 2016 53 0.2-20 5.9 41 5-99 33.9 63 0.4-11 3.9 July – September 2016 31 0.2-19 4.3 16 5-61 25.0 30 0.6-8 3.9
Total Program 310 0.2-27 4.3 255 2-151 33.2 373 0.2-17 5.3
Regardless of whether they received financial assistance, 373 (99%) of those who enrolled between July 2015 and August 2016 exited the program before April 2017. Table 1 and Figure 1 show that few clients exited in the first two quarters, but the number of clients exiting the program roughly followed the same trajectory of clients entering the program. Table 2 demonstrates that clients, on average, stayed in the RRH 250 program for 5.3 months. We explore client exit data in the Housing Outcomes section.
2. Descriptive Characteristics of Clients Enrolled in the RRH 250 Program
Client Demographics Table 3 summarizes the demographic data for the 373 clients enrolled in the RRH 250 program. The data show that the age of participants ranged from 19 to 71, with an average of 45 years. The clients were predominantly male, with 53% being white and 39% African American. Approximately 20% reported being Latino/Hispanic. Just over one third of participants reported having a disability, and 6% were employed at program entry. Further, almost 85% reported having health insurance at program entry, while almost one-half reported some source of income. Finally, there was a wide distribution of educational backgrounds, with about one-quarter not having graduated high school and another quarter reporting some post-high school education, but the largest proportion of individuals having graduated high school or attained a GED.
Table 3: Client Demographic Characteristics
Total (N=373) Range Average Age 19-71 45.0 N % Gender Male 275 73.7 Female 97 26.0 Transgender 1 0.3
Final Evaluation of the RRH 250 Program | Prepared for Valley of the Sun United Way by Focus Strategies | June 2017 | Page 18 of 71

N % Race White 197 52.8 Black 145 38.9 Am. Indian/Alaskan Native 26 7.0 Native Hawaiian/Pac Islander 4 1.1 Asian 1 0.3 N % Hispanic/Latino 74 19.8
N % Veteran 21 5.6 Experienced DV 65 17.4 Disability 128 34.3 Income at Entry 186 49.9 Employment at Entry 24 6.4 Health Insurance at Entry 314 84.2 N % Education Less than High School 10 2.7 Some HS 84 22.5 Graduated HS 119 31.9 GED 73 19.6 Post-Secondary 73 19.6 BA/MA 14 3.8
VI-SPDAT Scores and Relationship to Demographic Characteristics Table 4 shows the VI-SPDAT assessment results for RRH 250 clients. The average VI-SPDAT score was 5.8,2 which falls within the four to seven range for recommendation for a rapid rehousing intervention. Although 66% of clients had a VI-SPDAT score in the RRH range, 15% were assessed as being most appropriate for General Assistance (GA) and 20% as most appropriate for Permanent Supportive Housing (PSH).3
2 The median VI-SPDAT score was 6, almost identical to the average score of 5.8, suggesting a fairly normal distribution of scores. All analyses, therefore, use the mean score. 3 As noted above, during the course of the program, the VI-SPDAT tool was modified and a “2.0” version was put into use. Version 1 of the VI-SPDAT was used to initially assess 262 clients and Version 2 was used for the other 113 clients. All Version 1 scores were converted locally to be comparable to Version 2 scores, which are the scores that were received and used for this report.
Final Evaluation of the RRH 250 Program | Prepared for Valley of the Sun United Way by Focus Strategies | June 2017 | Page 19 of 71

Table 4: VI-SPDAT Scores
Total (N=375) Range Average VI-SPDAT Score 0-16 5.8 N % VI-SPDAT Service Level Recommendation General Assistance 55 14.7 Rapid Rehousing 246 65.6 Permanent Supportive Housing 74 19.7
We evaluated whether client assessment scores varied based on demographic characteristics.4 Table 5 shows that, while most other demographic characteristics did not differentiate groups, higher scores were associated with clients who were white, veteran, disabled, or unemployed at program entry (though we note that we only have employment information for 97 clients.) Differences in scores based on race is an unexpected result and deserves further exploration.
Table 5: Relationship of VI-SPDAT Scores to Demographic Characteristics
N Range Average Gender Male 270 1-16 5.8 Female 94 0-14 6.0 Transgender 1 8-8 8.0 N Range Average Race5 White 192 1-16 6.1 Black 142 2-13 5.6 Other 31 0-9 4.7 N Range Average Hispanic/Latino Yes 72 2-14 5.8 No 293 0-16 5.8 N Range Average Veteran6 Yes 21 2-16 6.9 No 344 0-14 5.8
4 Several variables that appear in the table illustrating demographic characteristics show no associations in any of the analyses to be presented so are not included in further tables. These variables include age, education, and whether clients had health insurance at entry. 5 Analyses collapsed the American Indian/Alaskan Native, Native Hawaiian/Pacific Islander and Asian categories into a single category called “other”; mean assessment score differed by race; F (2, 362) = 5.4, p<.01. 6 Mean VI-SPDAT score differed by veteran status; F (1, 363) = 4.67, p<0.05.
Final Evaluation of the RRH 250 Program | Prepared for Valley of the Sun United Way by Focus Strategies | June 2017 | Page 20 of 71

N Range Average Experienced DV Yes 61 0-16 6.1 No 304 1-15 5.8 N Range Average Disability7 Yes 124 0-16 6.6 No 240 1-14 5.5 N Range Average Income at Entry Yes 182 0-16 5.7 No 181 1-14 5.5 N Range Average Employment at Entry8 Yes 24 1-8 5.0 No 73 1-14 6.2
History of Homelessness and Relationship to VI-SPDAT Scores Table 6 summarizes key characteristics related to history of homelessness for those enrolled in the RRH 250 project. At project entry, individuals reported an average of two times homeless in the past three years. There was a wide variation in number of months homeless over the last three years, with almost 40% reporting more than 12 months of homelessness and about one-third reporting between one and three months. Figure 2 illustrates this surprising bimodal distribution.
Table 6: Client Recent History of Homelessness
Total (N=373) Range Average Number of Times Homeless in 3 Years 0-4 1.9 N % Total Months Homeless in 3 Years 1 – 3 121 32.4 4 – 6 55 14.7 7 – 9 24 6.4 10 – 12 14 3.8 More than 12 143 38.3 No Answer/Didn’t Know 16 4.3
7 Proportion of those with Disability differed between by service level recommendation; X2(2) = 19.8, p<.001. 8 Mean VI-SPDAT score differed by employment status; F (1, 95) = 4.69, p<0.05.
Final Evaluation of the RRH 250 Program | Prepared for Valley of the Sun United Way by Focus Strategies | June 2017 | Page 21 of 71

N % Chronic 59 15.8 N % Prior Living Situation Unsheltered 63 16.9 Emergency Shelter 300 80.4 Fam/Friends 7 1.9 Institution 3 0.8
Figure 2: Distribution of Length of Time Homeless in Past Three Years
Not surprisingly, given the intent to target those using the overflow shelter, 97% of clients enrolled had most recently been literally homelessness (either sheltered or unsheltered). Although the intention was to enroll people using overflow shelter, 17% of the clients were reportedly unsheltered prior to entering the program. Despite 40% of clients having been homeless for more than 12 months, only 16% of clients were recorded as being chronically homeless.9
We next evaluated whether VI-SPDAT score varied based on a client’s history of homelessness. Analyses suggested that the number of times clients reported being homeless was unrelated to average score. Table 7 further illustrates the average VI-SPDAT scores do not depend on total length of time homeless, chronicity, or prior living situation. Two things deserve further explanation. First, there was a trend for chronically homeless individuals to have a higher assessment score than the non-chronically homeless; it is not a statistically significant difference because regardless of chronicity, the range of VI-SPDAT scores is large in both groups. Second, it appears that for each incremental three months of homelessness over the last three years, the average VI-SPDAT score increases, until more than 12 months of homelessness, at which point the average score decreases. Several factors are associated with this trend not showing
9 HUD defines chronically homeless individuals as having a disabling condition and experiencing homelessness for (1) 12 months or more OR (2) four or more times in the last three years for a total period of at least 12 months. Homelessness is defined as living in a shelter, safe haven, or a place not suitable for human habitation.
32.4%
14.7%
6.4%3.8%
38.3%
0%5%
10%15%20%25%30%35%40%45%
1-3 4-6 7-9 10-12 More than 12
% o
f Clie
nts
Number of Months
Final Evaluation of the RRH 250 Program | Prepared for Valley of the Sun United Way by Focus Strategies | June 2017 | Page 22 of 71

statistical significance, including the small number of clients in the 7-9 and 10-12 month groups, and the large range of VI-SPDAT scores in each of the groups.
Table 7: Relationship of VI-SPDAT Scores to History of Homelessness
N (350) Range Average Total Months Homeless in 3 Years 1-3 119 1-13 5.5 4-6 54 2-14 5.7 7-9 24 3-16 6.2 10-12 14 3-11 6.9 More than 12 139 0-15 5.9 N (365) Range Average Chronic Yes 56 0-16 6.4 No 309 1-15 5.7 N (365) Range Average Prior Living Situation Unsheltered 62 1-16 6.4 Emergency Shelter 293 0-15 5.7 Fam/Friends 7 4-9 6.4 Institution 3 5-7 6.3
The finding that history of homelessness is not related to VI-SPDAT score is similar to findings we reported in an Interim Report provided in December 2015. In that case, we received data for 3,295 clients who had been assessed with the VI-SPDAT (the “whole universe” of clients who had been assessed at the time in Phoenix). Surprisingly, the three VI-SPDAT service level recommendations resulted in groups of people who were extremely similar in terms of length of time homeless. There was, however, a substantial difference among them in terms of chronicity, with the rate of chronicity much greater in those scoring for PSH.10 Those falling into the RRH and PSH categories were more similar than different on a number of other characteristics, including length of time homeless (41 months vs. 46 months), previous stays at the Men’s Overflow Shelter (25% vs. 29%), previous stays in the parking lot (15% vs. 16%), and whether they were new to the system (36% vs. 30%).
Because it is counter-intuitive that history of homelessness is unrelated to VI-SPDAT score in the current sample of clients, these findings are worthy of further investigation and replication.11
10 In some sense, this finding is an artifact of the VI-SPDAT scoring algorithm which provides additional points for chronicity; those who are chronically homeless are more likely to be categorized as appropriate for PSH. 11 Replication of a finding might involve conducting the same analysis with clients of other programs, in other places, or across the board for all assessed. If the finding persists this may be an area to discuss, as targeting based on length of time homeless is recommended by HUD.
Final Evaluation of the RRH 250 Program | Prepared for Valley of the Sun United Way by Focus Strategies | June 2017 | Page 23 of 71

Financial Investments and Relationship to VI-SPDAT Scores Table 8 summarizes financial assistance information from HOM Inc. Financial assistance is broken into “housing stabilization funds” referring to one-time costs needed to establish tenancy, such as application fees and deposits, and rental assistance funds.
Table 8: Financial Assistance Provided by RRH 250 Program
Total Assisted
(N=255) Range Average Program Length of Stay (months) 0.2-17 6.4 Months of Financial Assistance 0-15 5.4 Range Average Application Fee ($) 0-82 31 Security Deposit ($) 0-1,125 244 Non-refundable Fees ($) 0-536 139 Utility Deposit ($) 0-526 47 Total Housing Stabilization Funds ($) 20-1,420 461 Range Average Housing Assistance Payments (HAP; $) 0-8,016 2,687 Utility Assistance Payments (UAP; $) 0-1,211 143 Total Rental Assistance Funds ($) 0-8,016 2,829 Average Monthly Rental Assistance ($) 0-3,500 558 Range Average CLIENT TOTAL ASSISTANCE ($) 20-8,491 3,291
A series of analyses were conducted to determine whether factors associated with financial assistance were related to VI-SPDAT score. It turns out that several statistically significant associations exist. Figure 3 illustrates that clients with higher assessment scores had longer lengths of stay in the program12 and received financial assistance for a longer time.13
12 VI-SPDAT score was positively correlated with length of stay; r=0.18, p<.01. 13 VI-SPDAT score was positively correlated with months assisted; r=0.19, p<.01.
Final Evaluation of the RRH 250 Program | Prepared for Valley of the Sun United Way by Focus Strategies | June 2017 | Page 24 of 71
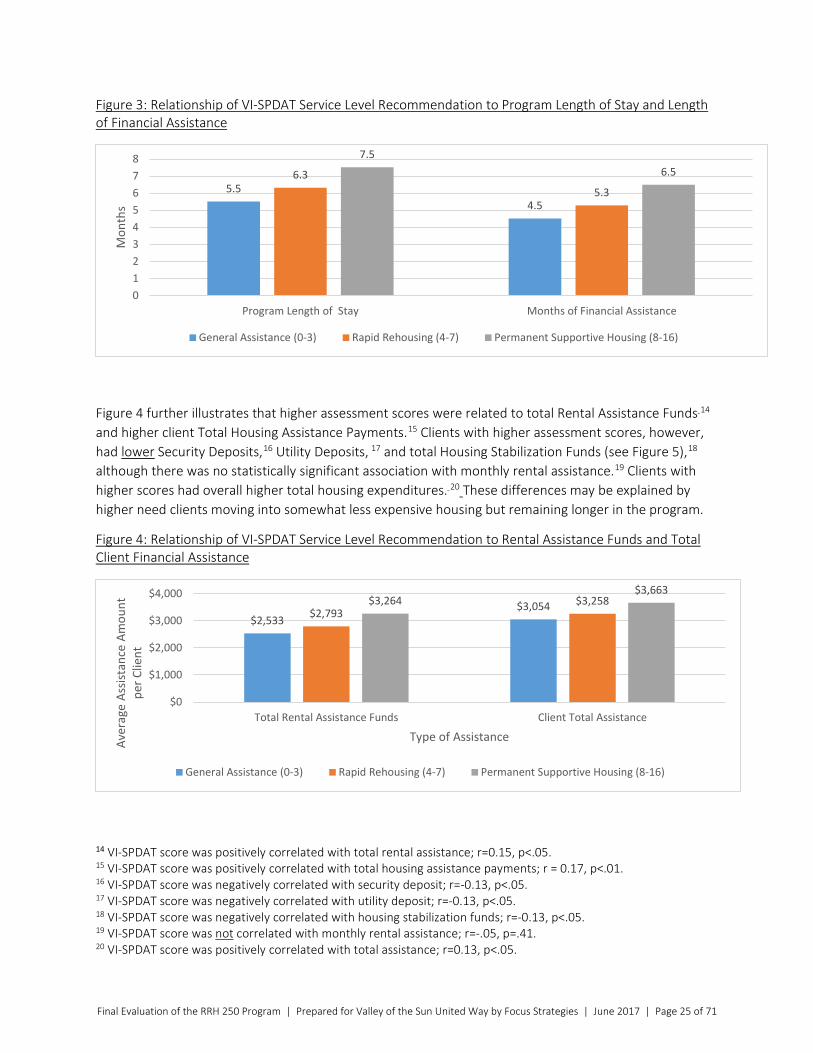
Figure 3: Relationship of VI-SPDAT Service Level Recommendation to Program Length of Stay and Length of Financial Assistance
Figure 4 further illustrates that higher assessment scores were related to total Rental Assistance Funds 14 and higher client Total Housing Assistance Payments.15 Clients with higher assessment scores, however, had lower Security Deposits,16 Utility Deposits, 17 and total Housing Stabilization Funds (see Figure 5),18 although there was no statistically significant association with monthly rental assistance.19 Clients with higher scores had overall higher total housing expenditures. 20 These differences may be explained by higher need clients moving into somewhat less expensive housing but remaining longer in the program.
Figure 4: Relationship of VI-SPDAT Service Level Recommendation to Rental Assistance Funds and Total Client Financial Assistance
14 VI-SPDAT score was positively correlated with total rental assistance; r=0.15, p<.05. 15 VI-SPDAT score was positively correlated with total housing assistance payments; r = 0.17, p<.01. 16 VI-SPDAT score was negatively correlated with security deposit; r=-0.13, p<.05. 17 VI-SPDAT score was negatively correlated with utility deposit; r=-0.13, p<.05. 18 VI-SPDAT score was negatively correlated with housing stabilization funds; r=-0.13, p<.05. 19 VI-SPDAT score was not correlated with monthly rental assistance; r=-.05, p=.41. 20 VI-SPDAT score was positively correlated with total assistance; r=0.13, p<.05.
5.54.5
6.35.3
7.56.5
012345678
Program Length of Stay Months of Financial Assistance
Mon
ths
General Assistance (0-3) Rapid Rehousing (4-7) Permanent Supportive Housing (8-16)
$2,533$3,054$2,793
$3,258$3,264$3,663
$0
$1,000
$2,000
$3,000
$4,000
Total Rental Assistance Funds Client Total Assistance
Aver
age
Assis
tanc
e Am
ount
pe
r Clie
nt
Type of Assistance
General Assistance (0-3) Rapid Rehousing (4-7) Permanent Supportive Housing (8-16)
Final Evaluation of the RRH 250 Program | Prepared for Valley of the Sun United Way by Focus Strategies | June 2017 | Page 25 of 71

Figure 5: Relationship of VI-SPDAT Service Level Recommendation to Housing Stabilization Funds and Average Monthly Rental Assistance
Total Program Cost As previously mentioned, VSUW provided data reflecting the monthly invoicing from RRH 250 provider organizations from June 2015 through February 2017. Invoices reflected costs that were associated with case management or housing assistance at the program level and are not representative of client specific data. Table 9 shows a summary of these data, along with two ways of estimating the total program cost per client served. Cost per client enrolled is likely to underestimate the true cost per client, since cost is spread over all clients including those who did not participate in the entire program. Conversely, cost per client financially assisted likely overestimates the case management cost per client as those clients who enrolled but did not participate in the entire program did require case management for at least some length of time. Regardless, as the table indicates, the total average program cost per client served likely falls between $4,900 to $7,200 using these approaches. We note that even the higher figure is under the initially budgeted $10,000 per client, showing the program to be potentially more cost effective than anticipated.
Underspending in the first year allowed some funds to be carried over into a second year. In previous reports, we noted a trend toward increased financial assistance expenses as the program want on, indicating that future per client costs may be expected to increase.
$521 $578$465
$567
$399$494
$0
$200
$400
$600
$800
Total Housing Stabilization Funds Average Monthly Rental Assistance
Aver
age
Assis
tanc
e Am
ount
pe
r Clie
nt
Type of Assistance
General Assistance (0-3) Rapid Rehousing (4-7) Permanent Supportive Housing (8-16)
Final Evaluation of the RRH 250 Program | Prepared for Valley of the Sun United Way by Focus Strategies | June 2017 | Page 26 of 71

Table 9: Total Program Cost Estimated Using Provider Invoicing
Total Cost
Cost Per Client Enrolled (N=373)
Cost Per Client Financially Assisted
(N=255) Total Case Management Expenditures $850,520 $2,280 $3,335 Total Housing Assistance Expenditures $980,202 $2,628 $3,844 Total Program Cost $1,830,722 $4,908 $7,179
Summary As of August 31, 2016, there were a total of 378 enrollments in the RRH250 program, accounted for by 373 unique clients. Three-quarters of the clients were male, with an average age of 45 years. Clients reported diverse racial and educational backgrounds and total months homeless over the last three years. Though nearly 40% of clients had been homeless for more than twelve months in the preceding three years, only 16% of them met the HUD definition for chronic homelessness, and 97% were literally homeless upon program entry. The average VI-SPDAT assessment score amongst RRH 250 clients was 5.8, and 66% of participants fell within the VI-SPDAT score range that indicates appropriateness for rapid rehousing intervention.
Of the 378 enrollments, 255 clients (68%) received financial assistance and moved into housing. Chronically homeless individuals and those with lower VI-SPDAT scores were more likely to receive financial assistance in the program, while veterans were less likely. It took just over 30 days on average for clients to go from program enrollment to moving into permanent housing.
F. Housing Outcomes In the second quantitative section, we turn to housing outcomes for the RRH 250 clients. Because of the way exits are recorded in HMIS, an exit is described as being “to” a certain destination. For example, when someone is in their own housing at the end of the program this is described as an “exit to permanent housing” even though the client remains in place at the end of the program enrollment. We investigate the factors associated with successful permanent housing exits as well as factors related to returns to homelessness following exits to permanent housing. The section begins with descriptive data on the permanent housing exit destinations.
1. Exiting the RRH 250 Program As noted, 373 single adults exited the RRH 250 program during the time period covered. Of these, 252 (67.6% of total) clients moved into housing with financial assistance and 121 (32.4% of total) clients were
Final Evaluation of the RRH 250 Program | Prepared for Valley of the Sun United Way by Focus Strategies | June 2017 | Page 27 of 71

enrolled in the program but exited without the financial assistance of the program.21 These clients presumably were not successfully engaged in the RRH 250 program and/or found other opportunities.
Of the 121 individuals who exited without receiving financial assistance, a significant number nonetheless exited to a permanent housing situation. Table 10 provides the specific breakdown of exit locations by whether clients were financially assisted by the program as well as the total number who exited overall, while Figure 6 displays the data graphically.
Looking first at the rightmost columns in Table 10 (Total Exited), we would like to comment on the 22% of unknown/missing exit destinations. This proportion of missing data (includes exits documented as “exit interview not completed”) is large, and depending on the actual destinations of those exits, impacts the conclusions that can be drawn. Specifically, for all those enrolled and exited from the program, only 59.8% of exit destinations are to permanent housing. In contrast, for those clients with any reported known exit destination, 76.9% are to permanent locations.
Table 10: Exit Destinations by Whether Clients Were Financially Assisted by the Program
Financially Assisted by Program and Exited
Not Financially Assisted by Program and Exited Total Exited
N (252) % N (121) % N (373) % % of Known Exits (N=290)
Exit Destination22 Permanent Housing 185 73.4 38 31.4 223 59.8 76.9 Unsheltered/ES 23 9.1 27 22.3 50 13.4 17.2 Other 14 5.6 3 2.5 17 4.6 5.9 Missing 30 11.9 53 43.8 83 22.3 --
The data also show that financial assistance from the program increases the likelihood of exiting to permanent housing; those financially assisted by the program were more likely to exit to permanent housing than those without assistance (73.4% vs. 31.4%). Again, when looking only at those with a reported known exit destination, these figures increase to 83.3% for those with assistance (185 out of 222 exits) and 55.9% for those with no financial assistance (38 of 68 exits).
21 Five clients remained open in the RRH 250 program as of the end of March 2017, three of whom continued with financial assistance and two of whom were not receiving assistance at the time of the data extract. 22 Analyses collapsed the Temporary Housing, Jail/Hospital and Deceased categories into a single category called “other”; proportion of clients exiting to specific housing types differed by whether they received financial assistance; X2(5) = 73.8, p<.001.
Final Evaluation of the RRH 250 Program | Prepared for Valley of the Sun United Way by Focus Strategies | June 2017 | Page 28 of 71
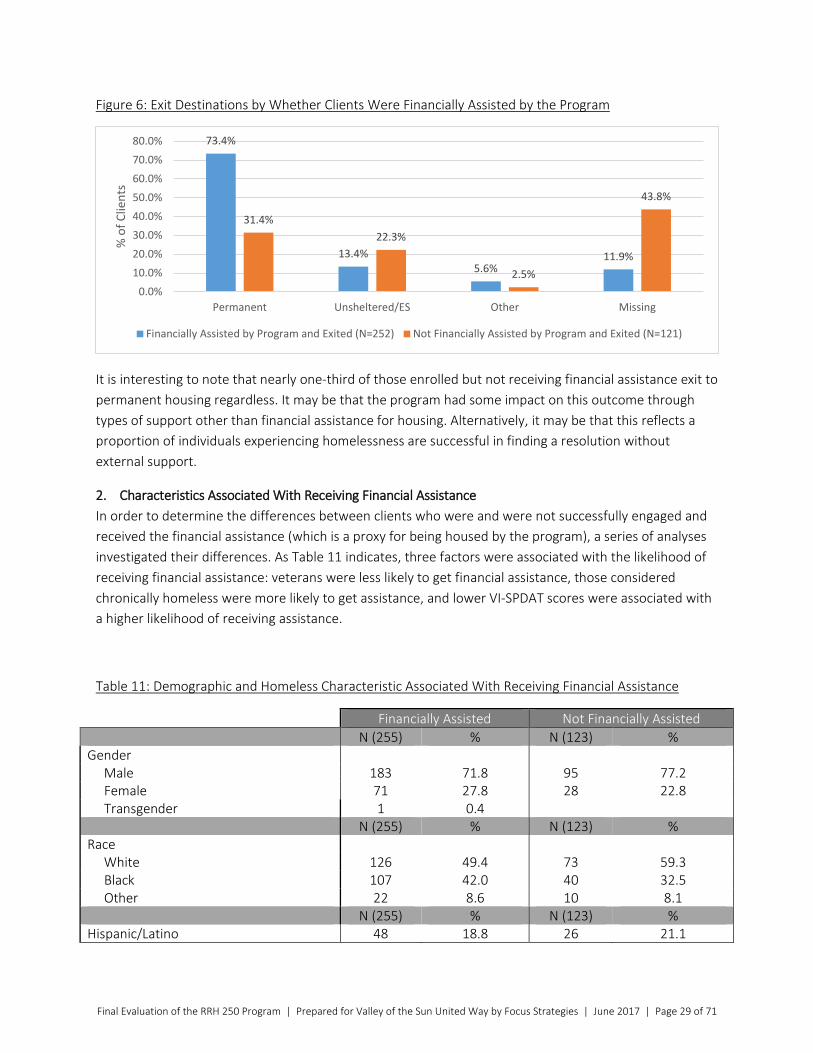
Figure 6: Exit Destinations by Whether Clients Were Financially Assisted by the Program
It is interesting to note that nearly one-third of those enrolled but not receiving financial assistance exit to permanent housing regardless. It may be that the program had some impact on this outcome through types of support other than financial assistance for housing. Alternatively, it may be that this reflects a proportion of individuals experiencing homelessness are successful in finding a resolution without external support.
2. Characteristics Associated With Receiving Financial Assistance In order to determine the differences between clients who were and were not successfully engaged and received the financial assistance (which is a proxy for being housed by the program), a series of analyses investigated their differences. As Table 11 indicates, three factors were associated with the likelihood of receiving financial assistance: veterans were less likely to get financial assistance, those considered chronically homeless were more likely to get assistance, and lower VI-SPDAT scores were associated with a higher likelihood of receiving assistance.
Table 11: Demographic and Homeless Characteristic Associated With Receiving Financial Assistance
Financially Assisted Not Financially Assisted N (255) % N (123) % Gender Male 183 71.8 95 77.2 Female 71 27.8 28 22.8 Transgender 1 0.4 N (255) % N (123) % Race White 126 49.4 73 59.3 Black 107 42.0 40 32.5 Other 22 8.6 10 8.1 N (255) % N (123) % Hispanic/Latino 48 18.8 26 21.1
73.4%
13.4%5.6%
11.9%
31.4%22.3%
2.5%
43.8%
0.0%10.0%20.0%30.0%40.0%50.0%60.0%70.0%80.0%
Permanent Unsheltered/ES Other Missing
% o
f Clie
nts
Financially Assisted by Program and Exited (N=252) Not Financially Assisted by Program and Exited (N=121)
Final Evaluation of the RRH 250 Program | Prepared for Valley of the Sun United Way by Focus Strategies | June 2017 | Page 29 of 71

N (255) % N (123) % Veteran23 9 3.5 13 10.6 Experienced DV 47 18.4 19 15.4 Disability 86 33.7 43 35.0 Income at Entry 135 52.9 54 43.9 Employment at Entry 20 7.8 5 3.3 Range Average (N=255) Range Average (N=123) Number of Times Homeless 0-4 2.0 0-4 1.8 N (255) % N (123) % Total Months Homeless in 3 Years 1 – 3 77 30.2 44 35.8 4 – 6 42 16.5 13 10.6 7 – 9 17 6.7 8 6.5 10 – 12 12 4.7 3 2.4 More than 12 96 37.6 50 40.7 No Answer/Didn’t Know 11 4.3 5 4.1 N (255) % N (123) % Chronic24 48 18.8 12 9.8 N (255) % N (123) % Prior Living Situation Unsheltered 39 15.3 24 19.5 Emergency Shelter 208 81.6 97 78.9 Fam/Friends 5 2.0 2 1.6 Institution 3 1.2 Range Average (N=251) Range Average (N=119) VI-SPDAT Score25 0-14 5.7 1-16 6.2 N (251) % N (119) % VI-SPDAT Service Level Recommendation General Assistance 40 15.9 15 12.6 Rapid Rehousing 165 65.7 75 63.0 Permanent Supportive Housing 46 18.3 29 24.4
Because there are similar programs to RRH 250 targeted specifically to Veterans it is likely that providers referred Veterans to other programs for services; this assumption was confirmed by the program providers as a likely explanation for this finding.
3. Characteristics Associated With Exits to Permanent Housing The remainder of this section examines the factors that are associated with permanent housing exits and returns to homelessness. Two approaches to the analysis are presented: (1) a comparison of all clients
23 Proportion of veterans differed between the groups; X2(1) = 7.5, p<.01. 24 Proportion of chronically homeless clients differed between the 2 groups; X2(1) = 5.11, p<.05. 25 Mean VI-SPDAT score differed between the 2 groups; F (1,368) =3.94, p<.05.
Final Evaluation of the RRH 250 Program | Prepared for Valley of the Sun United Way by Focus Strategies | June 2017 | Page 30 of 71

who exited to permanent housing with all clients who exited to another type of destination, regardless of whether they received financial assistance (i.e., a version of “Intent to Treat”, a term used in randomized trials, and refers here to analyzing the outcomes of all clients who enrolled in the program); and (2) a comparison using only clients who received financial assistance from the program and then exited to PH or exited elsewhere (i.e., a version of “Per Protocol,” a term used in randomized trials, and refers here to analyzing outcomes of clients who received the full treatment, or all program components). Each approach to analysis has pros and cons, however, if the same results are found using both approaches, more confidence in the results is possible.
Permanent Housing Exits For All Enrolled Clients (Intent to Treat) Table 12 summarizes the known demographic and homeless history characteristics of those clients who exited the RRH 250 program to permanent housing as compared to clients exiting to other destinations. Of all the factors presented, seven statistically differentiate those exiting to permanent housing from those who do not:
• gender (females are more likely to have exited to permanent housing than males), • prior living situation (those who are unsheltered are less likely to exit to permanent housing than
those who came from shelter), • VI-SPDAT score at initial assessment (clients with lower scores are more likely to exit to
permanent housing), • VI-SPDAT service level recommendation (clients scored for general assistance have a higher
likelihood of exiting to permanent housing while those who scored for permanent supportive housing were less likely to exit to permanent housing),
• income at program exit (clients are more likely to exit to permanent housing if they have any income at exit, and clients who exited to permanent housing have, on average, higher income than those who exited to other destinations),
• financial assistance (clients who received financial assistance are more likely to exit to permanent housing), and
• length of stay in program (clients who exit to permanent housing have longer lengths of stay).
Table 12: Demographic and History of Homelessness Characteristics Associated With Exiting to Permanent Housing For All Clients Enrolled in the Program (Intent to Treat)
Exit to PH Other Exits N (223) % N (150) % Gender26 Male 154 69.1 120 80.0 Female 69 30.9 29 19.3 Transgender 1 0.7
26 We note that because the program divided enrollment with different case management agencies based on gender we cannot distinguish whether gender differences may be masking provider differences. Our previous report spoke to this issue as well and identified that gender appeared to be significant even when controlling for provider. Analyses did not include the single transgender individual; Gender differed between the two groups; X2(1) = 6.07, p<.05.
Final Evaluation of the RRH 250 Program | Prepared for Valley of the Sun United Way by Focus Strategies | June 2017 | Page 31 of 71

N (223) % N (150) % Race White 110 49.3 88 58.7 Black 90 40.4 53 35.3 Other 23 10.3 9 6.0 N (223) % N (150) % Hispanic/Latino 40 17.9 32 21.3 N (223) % N (150) % Veteran 9 4.0 13 8.7 Experienced DV 43 19.3 22 14.7 Disability 75 33.6 52 34.7 Income at Entry 119 53.4 66 44.0 Employment at Entry 17 7.6 8 5.3 Range Average (N=223) Range Average (N=150) Number of Times Homeless 0-4 1.9 1-4 2.0 N (223) % N (150) % Total Months Homeless in 3 Years 1 – 3 75 33.6 43 28.7 4 – 6 38 17.0 16 10.7 7 – 9 15 6.7 10 6.7 10 – 12 10 4.5 5 3.3 More than 12 76 34.1 69 46.0 No Answer/Didn’t Know 9 4.0 7 4.7 N (223) % N (150) % Chronic 37 16.6 23 15.3 N (223) % N (150) % Prior Living Situation27 Unsheltered 27 12.1 35 23.3 Emergency Shelter 190 85.2 111 74.0 Fam/Friends 5 2.2 2 1.3 Institution 1 0.4 2 1.3 Range Average (N=219) Range Average (N=146) VI-SPDAT Score28 0-15 5.6 1-16 6.2 N (219) % N (146) % VI-SPDAT Service Level Recommendation29 General Assistance 41 18.7 14 9.6 Rapid Rehousing 139 63.5 99 67.8 Permanent Supportive Housing 39 17.8 33 22.6 N (223) % N (150) % Financially Assisted30 185 83.0 67 44.7 Income at Exit31 152 68.2 61 40.7
27 Proportion of clients in prior living situations differed between the 2 groups; X2(3) = 9.46, p<.05. 28 Mean VI-SPDAT score differed between the 2 groups; F(1,363)=5.438, p<.05. 29 Proportion of clients with each service level recommendation differed between the 2 groups; X2(2) = 6.12, p<.05. 30 Proportion of clients who were financially assisted differed between the 2 groups; X2(1) = 60.0, p<.001. 31 Proportion of clients with income at exit differed between the 2 groups; X2(1) = 35.5, p<.001.
Final Evaluation of the RRH 250 Program | Prepared for Valley of the Sun United Way by Focus Strategies | June 2017 | Page 32 of 71

Range Average (N=198) Range Average (N=136) Total Financial Assistance ($)32 1,375-8,491 3,321 20-5,881 3,048 Monthly Income at Exit ($)33 0-8,840 1,183 0-5,120 604 Range Average Range Average LOS in Program34 0.4-17.0 6.0 0.2-10.7 4.3 Months Assisted35 2.0-15.2 5.5 0.0-9.5 4.9
Permanent Housing Exits Clients Financially Assisted (Per Protocol) Table 13 summarizes the characteristics of those financially assisted clients who exited the RRH 250 program to permanent housing as compared to clients exiting to other locations. Only three factors differentiate the two groups using this approach to analysis: number of times homeless (clients with fewer times homeless are more likely to exit to permanent housing), VI-SPDAT service level recommendation (clients scored for general assistance have a higher likelihood of exiting to permanent housing while those who scored for permanent supportive housing were less likely to exit to permanent housing), and income at exit (clients who exit to permanent housing are more likely to have income at exit).
Table 13: Demographic and History of Homelessness Characteristics Associated With Exiting to Permanent Housing For Financially Assisted Clients (Per Protocol)
Exit to PH Other Exits N (185) % N (67) % Gender Male 127 68.6 53 79.1 Female 58 31.4 13 19.4 Transgender 1 1.5 N (185) % N (67) % Race White 86 46.5 39 58.2 Black 80 43.2 25 37.3 Other 19 10.3 3 4.5 N (185) % N (67) % Hispanic/Latino 30 16.2 17 25.4 N (185) % N (67) % Veteran 7 3.8 2 3.0 Experienced DV 37 20.0 9 13.4 Disability 60 32.4 25 37.3 Income at Entry 103 55.7 30 44.8 Employment at Entry 15 8.1 5 7.5
32 N=185 for PH, 67 for non-PH. 33 Mean client income at exit differed between the 2 groups: F(1,332)=18.5, p<.001. 34 N=223 for PH, 150 for non-PH; Mean length of stay in program differed between the two groups; F (1,371) = 34.9, p<.001. 35 N=185 for PH, 67 for non-PH.
Final Evaluation of the RRH 250 Program | Prepared for Valley of the Sun United Way by Focus Strategies | June 2017 | Page 33 of 71

Range Average (N=185) Range Average (N=67) Number of Times Homeless36 0-4 1.9 0-4 2.3 N (185) % N (67) % Total Months Homeless in 3 Years 1 – 3 58 31.4 17 25.4 4 – 6 34 18.4 7 10.4 7 – 9 12 6.5 5 7.5 10 – 12 9 4.9 3 4.5 More than 12 65 35.1 31 46.3 No Answer/Didn’t Know 7 3.8 4 6.0 N (185) % N (67) % Chronic 34 18.4 14 20.9 N (185) % N (67) % Prior Living Situation Unsheltered 25 13.5 13 19.4 Emergency Shelter 154 83.2 52 77.6 Fam/Friends 5 2.7 Institution 1 0.5 2 3.0 Range Average (N=182) Range Average (N=66) VI-SPDAT Score 0-14 5.5 1-12 6.1 N (182) % N (66) % VI-SPDAT Service Level Recommendation37 General Assistance 36 19.8 4 6.1 Rapid Rehousing 115 63.2 49 74.2 Permanent Supportive Housing 31 17.0 13 19.7 N (185) % N (67) % Income at Exit38 136 73.5 31 46.3 Range Average (N=varies) Range Average (N=varies) Total Financial Assistance39 1,375-8,491 3,321 20-5,881 3,048 Income at Exit (Amount)40 0-8,840 1,260 0-4,473 728 Range Average (N=185) Range Average (N=67) LOS in Program 1.8-17.0 6.5 0.2-10.7 6.0 Months Assisted 2.0-15.2 5.5 0.0-9.5 4.9
36 Mean number of times homeless differed between the two groups; F (1,250) = 5.83, p<.05. 37 Proportion of clients with each service level recommendation differed between the 2 groups; X2(2) = 6.74, p<.05. 38 Proportion of clients with income at exit differed between the 2 groups; X2(1) = 16.3, p<.001. 39 N=185 for PH, 67 for non-PH. 40 N=168 for PH, 62 for non-PH; Mean client income at exit differed between the 2 groups: F(1,228)=8.27, p<.01.
Final Evaluation of the RRH 250 Program | Prepared for Valley of the Sun United Way by Focus Strategies | June 2017 | Page 34 of 71

Permanent Housing Exits of Enrolled Highest and Lowest Scoring Clients (Intent to Treat) In an effort to further examine factors related to successful housing outcome, clients categorized as those with the highest assessment scores (PSH; eight and above) and those with the lowest assessment scores (GA; three and below) were directly compared. Table 14 indicates the numbers and percent of clients who fell into each of the categories. Clients who scored from four through seven (RRH) were not included in these analyses, as we were interested in looking at those whose scores differed the most, to see if high or low scorers differ in outcomes and relevant characteristics that might have implications for the program.
Table 14: Grouping All Enrolled Clients By Highest and Lowest VI-SPDAT Scores (Intent to Treat)
Total Number
(N=370) N % Highest Scoring (PSH; eight and above) 75 20.0 Not Included in Analysis (RRH; four to seven) 240 64.9 Lowest Scoring (GA; three and under) 55 15.1
A series of analyses investigated the differences between clients who exited to permanent housing (PH) and those who didn’t within each of these groups. Table 15 provides data for those factors that differentiated those in the highest scoring group, while Table 16 shows the factors that differentiate those in the lowest scoring group. In both high and low assessment groups, females were more likely to exit to permanent housing, which mirrors the trend found in the population overall. In addition, receipt of financial assistance from the program was related to PH exit regardless of VI-SPDAT score. Other factors differed in either the high or low assessment group. Specifically, in the highest scoring group, race was related to PH exits, with white clients more likely to exit to permanent housing. Of note, neither having income at exit nor amount of income were related to the likelihood of exit to permanent housing amongst those with the highest scores. In addition, permanent housing exits were associated with longer stays and more months of financial assistance.
Table 15: Demographic and History of Homelessness Characteristics Associated With Exiting to Permanent Housing For All Clients With the Highest VI-SPDAT Scores Enrolled in the Program (Intent to Treat)
Exit to PH Other Exits N (39) % N (36) % Gender41 Male 24 61.5 29 80.6 Female 15 38.5 6 16.7 Transgender 1 2.8
41 Analyses did not include the single transgender individual; Gender differed between the two groups; X2(1) = 4.13, p<.05.
Final Evaluation of the RRH 250 Program | Prepared for Valley of the Sun United Way by Focus Strategies | June 2017 | Page 35 of 71

N (39) % N (36) % Race42 White 28 71.8 21 58.3 Black 8 20.5 15 14.7 Other 3 7.7 N (39) % N (36) % Financially Assisted43 31 79.5 15 41.7 Range Average Range Average LOS in Program44 0.8-16.2 7.4 0.6-9.2 4.0 Months Assisted45 2.8-14.3 7.4 0-10.6 4.6
Exit outcomes for clients with the lowest assessment scores were related to both income at exit and employment at entry (though again we note that information about employment was very limited.). In particular, clients with employment at entry and income at exit, were more likely to exit to permanent housing.
Table 16: Demographic and History of Homelessness Characteristics Associated With Exiting to Permanent Housing For All Clients With the Lowest VI-SPDAT Scores Enrolled in the Program (Intent to Treat)
Exit to PH Other Exits N (41) % N (14) % Gender46 Male 28 68.3 14 100.0 Female 13 31.7 Transgender N (41) % N (14) % Employment at Entry47 6 14.6 N (41) % N (14) % Financially Assisted48 36 87.8 4 28.6 Income at Exit49 33 80.5 7 50.0 Range Average (N=41) Range Average (N=14) LOS in Program50 1.1-10.6 5.1 0.8-8.1 3.8
42 Analyses collapsed the American Indian/Alaskan Native, Native Hawaiian/Pacific Islander and Asian categories into a single category called “other”; Race differed between the three groups; X2(2) = 6.02, p<.05. 43 Proportion of clients who were financially assisted differed between the 2 groups; X2(1) = 11.3, p<.01. 44 N=39 for PH, 33 for non-PH; Mean length of stay in program differed between the two groups; F (1,70) = 23.4, p<.001. 45 N=31 for PH, 15 for non-PH; Mean months assisted differed between the two groups; F (1,44) = 7.83, p<.01. 46 Analyses did not include the single transgender individual; Gender differed between the two groups; X2(1) = 7.88, p<.01. 47 Proportion of clients who were employed at program entry differed between the 2 groups; X2(1) = 5.73, p<.05. 48 Proportion of clients who were financially assisted differed between the 2 groups; X2(1) = 18.5, p<.001. 49 Proportion of clients with income at exit differed between the 2 groups; X2(1) = 5.75, p<.05. 50 Length of stay in program differed between the 2 groups; F (1,53) = 4.01, p=.05.
Final Evaluation of the RRH 250 Program | Prepared for Valley of the Sun United Way by Focus Strategies | June 2017 | Page 36 of 71
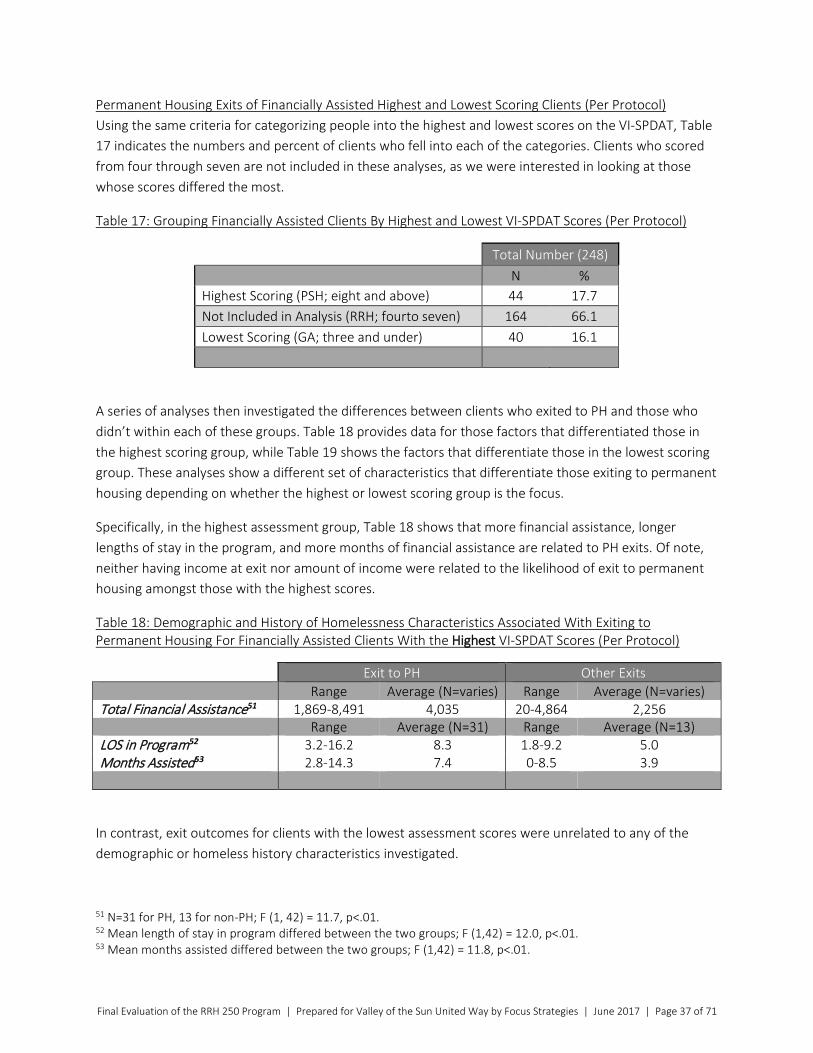
Permanent Housing Exits of Financially Assisted Highest and Lowest Scoring Clients (Per Protocol) Using the same criteria for categorizing people into the highest and lowest scores on the VI-SPDAT, Table 17 indicates the numbers and percent of clients who fell into each of the categories. Clients who scored from four through seven are not included in these analyses, as we were interested in looking at those whose scores differed the most.
Table 17: Grouping Financially Assisted Clients By Highest and Lowest VI-SPDAT Scores (Per Protocol)
Total Number (248) N % Highest Scoring (PSH; eight and above) 44 17.7 Not Included in Analysis (RRH; fourto seven) 164 66.1 Lowest Scoring (GA; three and under) 40 16.1
A series of analyses then investigated the differences between clients who exited to PH and those who didn’t within each of these groups. Table 18 provides data for those factors that differentiated those in the highest scoring group, while Table 19 shows the factors that differentiate those in the lowest scoring group. These analyses show a different set of characteristics that differentiate those exiting to permanent housing depending on whether the highest or lowest scoring group is the focus.
Specifically, in the highest assessment group, Table 18 shows that more financial assistance, longer lengths of stay in the program, and more months of financial assistance are related to PH exits. Of note, neither having income at exit nor amount of income were related to the likelihood of exit to permanent housing amongst those with the highest scores.
Table 18: Demographic and History of Homelessness Characteristics Associated With Exiting to Permanent Housing For Financially Assisted Clients With the Highest VI-SPDAT Scores (Per Protocol)
Exit to PH Other Exits Range Average (N=varies) Range Average (N=varies) Total Financial Assistance51 1,869-8,491 4,035 20-4,864 2,256 Range Average (N=31) Range Average (N=13) LOS in Program52 3.2-16.2 8.3 1.8-9.2 5.0 Months Assisted53 2.8-14.3 7.4 0-8.5 3.9
In contrast, exit outcomes for clients with the lowest assessment scores were unrelated to any of the demographic or homeless history characteristics investigated.
51 N=31 for PH, 13 for non-PH; F (1, 42) = 11.7, p<.01. 52 Mean length of stay in program differed between the two groups; F (1,42) = 12.0, p<.01. 53 Mean months assisted differed between the two groups; F (1,42) = 11.8, p<.01.
Final Evaluation of the RRH 250 Program | Prepared for Valley of the Sun United Way by Focus Strategies | June 2017 | Page 37 of 71
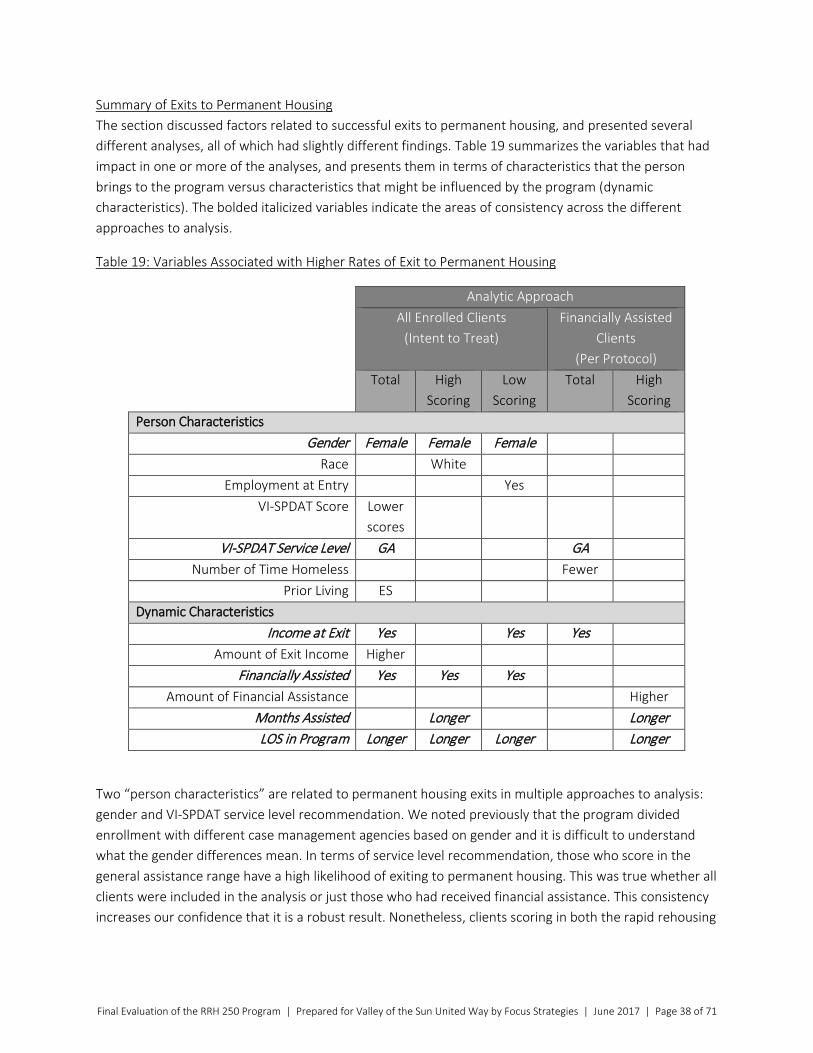
Summary of Exits to Permanent Housing The section discussed factors related to successful exits to permanent housing, and presented several different analyses, all of which had slightly different findings. Table 19 summarizes the variables that had impact in one or more of the analyses, and presents them in terms of characteristics that the person brings to the program versus characteristics that might be influenced by the program (dynamic characteristics). The bolded italicized variables indicate the areas of consistency across the different approaches to analysis.
Table 19: Variables Associated with Higher Rates of Exit to Permanent Housing
Analytic Approach All Enrolled Clients
(Intent to Treat) Financially Assisted
Clients (Per Protocol)
Total High Scoring
Low Scoring
Total High Scoring
Person Characteristics Gender Female Female Female
Race White Employment at Entry Yes
VI-SPDAT Score Lower scores
VI-SPDAT Service Level GA GA Number of Time Homeless Fewer
Prior Living ES Dynamic Characteristics
Income at Exit Yes Yes Yes Amount of Exit Income Higher
Financially Assisted Yes Yes Yes Amount of Financial Assistance Higher
Months Assisted Longer Longer LOS in Program Longer Longer Longer Longer
Two “person characteristics” are related to permanent housing exits in multiple approaches to analysis: gender and VI-SPDAT service level recommendation. We noted previously that the program divided enrollment with different case management agencies based on gender and it is difficult to understand what the gender differences mean. In terms of service level recommendation, those who score in the general assistance range have a high likelihood of exiting to permanent housing. This was true whether all clients were included in the analysis or just those who had received financial assistance. This consistency increases our confidence that it is a robust result. Nonetheless, clients scoring in both the rapid rehousing
Final Evaluation of the RRH 250 Program | Prepared for Valley of the Sun United Way by Focus Strategies | June 2017 | Page 38 of 71

and permanent supportive housing ranges exited to permanent housing at rates almost as high (67% for RRH and PSH; 71% for GA).
Four “dynamic characteristics” are related to permanent housing exits in multiple analysis approaches: having income at exit, being financially assisted by the program, and having longer lengths of assistance as well as longer lengths of stay in the program. We return to a discussion of these factors in our conclusions.
4. Characteristics Associated With Returns to Homelessness Return to homelessness is used to measure whether people who participated in the program and ended the program with permanent housing remain housed after the program ended. It specifically measures whether, after exit from the program with a permanent housing destination, a person enrolled in an emergency shelter program within the HMIS system. It is assumed that an emergency shelter enrollment indicates that the person has been required to leave or has voluntarily left their permanent housing. Returns to homelessness cannot track those who may have lost or left housing but not returned for help to the homeless system, or have sought help from a homeless system in another community. This is a standard measure to estimate returns to homelessness and is used nationally to make this type of estimate.
Returns to Homelessness For All Enrolled Clients (Intent to Treat) Of the 223 people who exited to PH, 57 (26%) returned to homelessness (e.g., had a later entry to emergency shelter in the HMIS system). Table 20 presents data for the groups of people who did and did not return to homelessness. Two factors distinguished those clients who exited to permanent housing and later returned to homelessness from those who did not: domestic violence (those who experienced domestic violence prior to program entry were more likely to return), and income at exit (clients with income were less likely to return). Importantly, if clients were going to return to homelessness after exit to permanent housing, it occurred relatively fast. The average time since program exit for clients who returned was significantly shorter than the time non-returnees have been out of the program (3 months vs. 8 months).
Table 20: Demographic and History of Homelessness Characteristics Associated With Returns to Homelessness for All Enrolled Clients (Intent to Treat)
Returned to Homelessness Did Not Return N (57) % N (151) % Gender Male 35 61.4 105 69.5 Female 22 38.6 46 30.5 N (57) % N (151) % Race White 36 63.2 68 45.0 Black 17 29.8 65 43.0 Other 4 7.0 18 11.9 N (57) % N (151) % Hispanic/Latino 8 14.0 29 19.2
Final Evaluation of the RRH 250 Program | Prepared for Valley of the Sun United Way by Focus Strategies | June 2017 | Page 39 of 71

N (57) % N (151) % Veteran 3 5.3 6 4.0 Experienced DV54 17 29.8 26 17.2 Disability 23 40.4 46 30.5 Income at Entry 29 50.9 81 53.6 Employment at Entry 3 5.3 11 7.3 Range Average (N=57) Range Average (N=151) Number of Times Homeless 1-4 2.1 0-4 1.8 N (57) % N (151) % Total Months Homeless in 3 Years 1 – 3 17 29.8 53 35.1 4 – 6 10 17.5 26 17.2 7 – 9 4 7.0 11 7.3 10 – 12 2 3.5 7 4.6 More than 12 23 40.4 46 30.5 No Answer/Didn’t Know 1 1.8 8 5.3 N (57) % N (151) % Chronic 12 21.1 22 14.6 N (57) % N (151) % Prior Living Situation Unsheltered 6 10.5 19 12.6 Emergency Shelter 50 87.7 127 84.1 Fam/Friends 1 1.8 4 2.6 Institution 1 0.7 Range Average (N=55) Range Average (N=149) VI-SPDAT Score 1-15 6.0 0-13 5.4 N (55) % N (149) % VI-SPDAT Service Level Recommendation General Assistance 10 18.2 28 18.8 Rapid Rehousing 33 60.0 97 65.1 Permanent Supportive Housing 12 21.8 24 16.1 N (57) % N (151) % Financially Assisted 45 78.9 129 85.4 Income at Exit55 34 59.6 108 71.5 Range Average (N=51) Range Average (N=132) Total Financial Assistance ($)56 1,786-5,752 3,215 1,375-7,687 3,129 Monthly Income at Exit ($) 0-5,967 938 0-7,012 1,175 Range Average N57 % Length of Stay in Program (months) 0.4-10.7 5.8 0.6-12.7 5.8 Length of Assistance (months) 2.6-9.3 5.3 2.0-14.3 5.2 Time to Return/Time since Exit (months)58 0.1-9.1 3.4 0.0-14.9 8.4
54 Proportion of clients who experienced domestic violence differed between the 2 groups; X2(1) = 4.01, p<.05. 55 Proportion of clients with income at exit differed between the 2 groups; X2(1) = 35.5, p<.001. 56 N=45 for Returned, 129 for Not Returned. 57 N equals the number of valid data points per group: N=57 (LOS, Returned), 151 (LOS, Not Returned), 45 (LOA, Returned), 129 (LOA, Not Returned), 55 (Time to Return), 151 (Time Since Exit). 58 Mean Time to Return to Homelessness was significantly different from Mean Time Since Exit for clients that did not return; F (1, 204) = 108.5, p<.001.
Final Evaluation of the RRH 250 Program | Prepared for Valley of the Sun United Way by Focus Strategies | June 2017 | Page 40 of 71
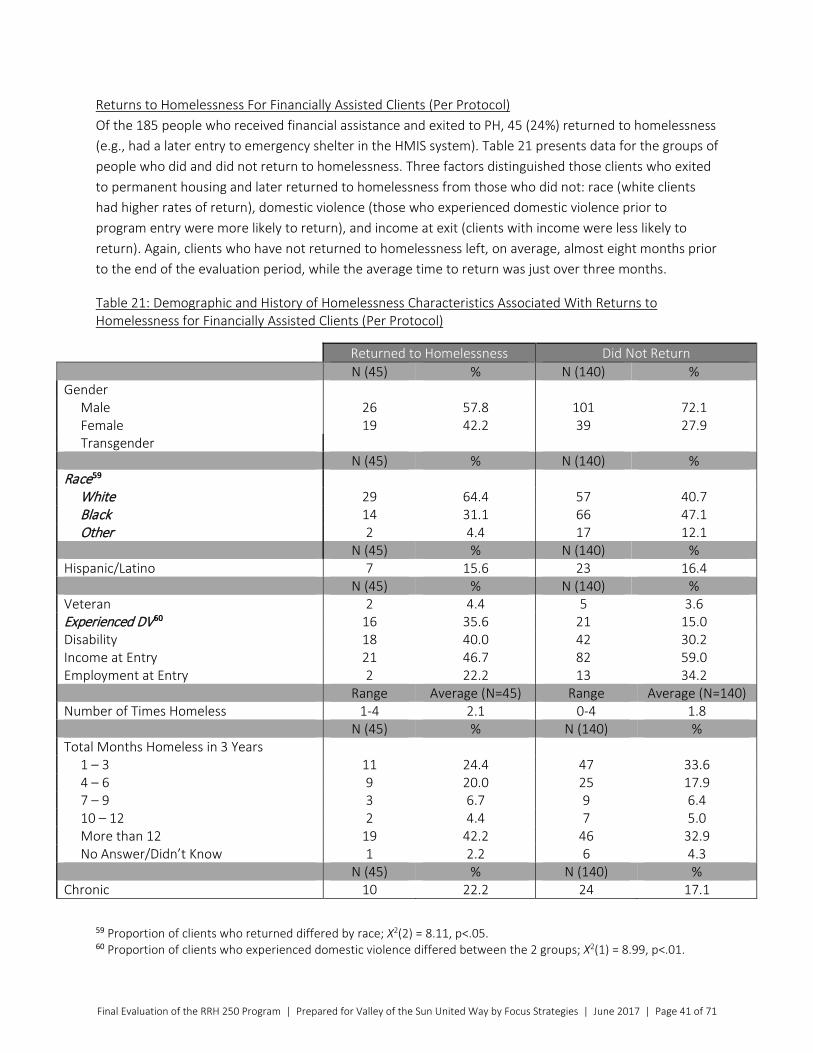
Returns to Homelessness For Financially Assisted Clients (Per Protocol) Of the 185 people who received financial assistance and exited to PH, 45 (24%) returned to homelessness (e.g., had a later entry to emergency shelter in the HMIS system). Table 21 presents data for the groups of people who did and did not return to homelessness. Three factors distinguished those clients who exited to permanent housing and later returned to homelessness from those who did not: race (white clients had higher rates of return), domestic violence (those who experienced domestic violence prior to program entry were more likely to return), and income at exit (clients with income were less likely to return). Again, clients who have not returned to homelessness left, on average, almost eight months prior to the end of the evaluation period, while the average time to return was just over three months.
Table 21: Demographic and History of Homelessness Characteristics Associated With Returns to Homelessness for Financially Assisted Clients (Per Protocol)
Returned to Homelessness Did Not Return N (45) % N (140) % Gender Male 26 57.8 101 72.1 Female 19 42.2 39 27.9 Transgender N (45) % N (140) % Race59 White 29 64.4 57 40.7 Black 14 31.1 66 47.1 Other 2 4.4 17 12.1 N (45) % N (140) % Hispanic/Latino 7 15.6 23 16.4 N (45) % N (140) % Veteran 2 4.4 5 3.6 Experienced DV60 16 35.6 21 15.0 Disability 18 40.0 42 30.2 Income at Entry 21 46.7 82 59.0 Employment at Entry 2 22.2 13 34.2 Range Average (N=45) Range Average (N=140) Number of Times Homeless 1-4 2.1 0-4 1.8 N (45) % N (140) % Total Months Homeless in 3 Years 1 – 3 11 24.4 47 33.6 4 – 6 9 20.0 25 17.9 7 – 9 3 6.7 9 6.4 10 – 12 2 4.4 7 5.0 More than 12 19 42.2 46 32.9 No Answer/Didn’t Know 1 2.2 6 4.3 N (45) % N (140) % Chronic 10 22.2 24 17.1
59 Proportion of clients who returned differed by race; X2(2) = 8.11, p<.05. 60 Proportion of clients who experienced domestic violence differed between the 2 groups; X2(1) = 8.99, p<.01.
Final Evaluation of the RRH 250 Program | Prepared for Valley of the Sun United Way by Focus Strategies | June 2017 | Page 41 of 71

N (45) % N (140) % Prior Living Situation Unsheltered 4 8.9 21 15.0 Emergency Shelter 40 88.9 114 81.4 Fam/Friends 1 2.2 4 2.9 Institution 1 0.7 Range Average (N=44) Range Average (N=138) VI-SPDAT Score 1-14 5.8 0-13 5.4 N (44) % N (138) % VI-SPDAT Service Level Recommendation General Assistance 9 20.5 27 19.6 Rapid Rehousing 26 59.1 89 64.5 Permanent Supportive Housing 9 20.5 22 15.9 N (45) % N (140) % Income at Exit61 28 62.2 108 77.1 Range Average (N=42) Range Average (N=126) Total Financial Assistance ($)62 1,786-5,752 3,215 1,375-8,491 3,355 Income at Exit (Amount) 0-5,967 975 0-8,840 1,355 Range Average (N=45) Range Average (N=140) Length of Stay in Program (months) 3.1-10.7 6.2 1.9-17.0 6.5 Length of Assistance (months) 2.6-9.3 5.3 2.0-15.2 5.5 Time to Return/Time since Exit (months)63 0.1-9.1 3.2 0.0-14.9 7.7
Returns to Homelessness Following Exit to Permanent Exits For All Enrolled Clients Scoring Highest and Lowest on VI-SPDAT (Intent to Treat) We again investigated client characteristics associated with returns to homelessness in those with the highest and lowest VI-SPDAT scores. Tables 22 and 23 show that regardless of whether they are high or low scoring, clients were more likely to return if they had a history of experiencing domestic violence. Again, the average time since program exit for clients returned was significantly shorter than the time non-returnees have been out of the program (3-4 months vs. 9 months). No other factors significantly differentiated high scoring clients who returned from those who didn’t.
61 Proportion of clients with income at exit differed between the 2 groups; X2(1) = 3.89, p<.05. 62 N=45 for Returned, 140 for Not Returned. 63 N=44 for Time to Return; Mean Time to Return to Homelessness was significantly different from Mean Time Since Exit for clients that did not return; F (1, 182) = 56.6, p<.001.
Final Evaluation of the RRH 250 Program | Prepared for Valley of the Sun United Way by Focus Strategies | June 2017 | Page 42 of 71
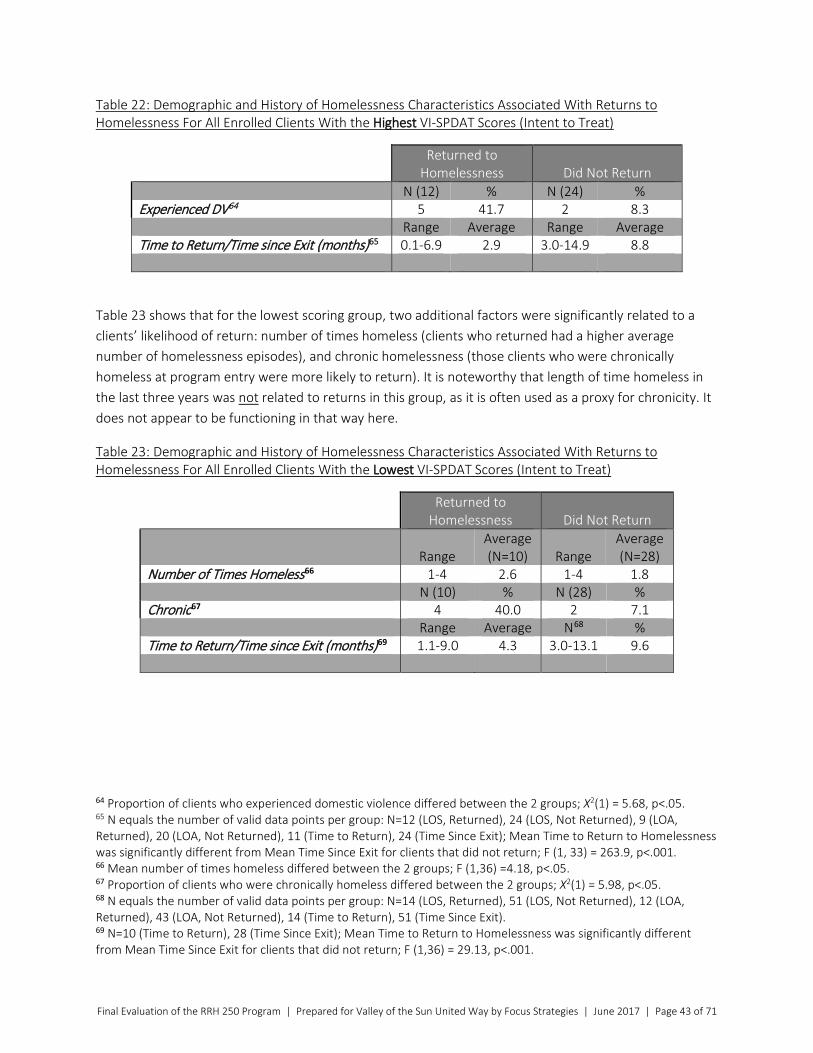
Table 22: Demographic and History of Homelessness Characteristics Associated With Returns to Homelessness For All Enrolled Clients With the Highest VI-SPDAT Scores (Intent to Treat)
Returned to
Homelessness Did Not Return N (12) % N (24) % Experienced DV64 5 41.7 2 8.3 Range Average Range Average Time to Return/Time since Exit (months)65 0.1-6.9 2.9 3.0-14.9 8.8
Table 23 shows that for the lowest scoring group, two additional factors were significantly related to a clients’ likelihood of return: number of times homeless (clients who returned had a higher average number of homelessness episodes), and chronic homelessness (those clients who were chronically homeless at program entry were more likely to return). It is noteworthy that length of time homeless in the last three years was not related to returns in this group, as it is often used as a proxy for chronicity. It does not appear to be functioning in that way here.
Table 23: Demographic and History of Homelessness Characteristics Associated With Returns to Homelessness For All Enrolled Clients With the Lowest VI-SPDAT Scores (Intent to Treat)
Returned to
Homelessness Did Not Return
Range Average (N=10) Range
Average (N=28)
Number of Times Homeless66 1-4 2.6 1-4 1.8 N (10) % N (28) % Chronic67 4 40.0 2 7.1 Range Average N68 % Time to Return/Time since Exit (months)69 1.1-9.0 4.3 3.0-13.1 9.6
64 Proportion of clients who experienced domestic violence differed between the 2 groups; X2(1) = 5.68, p<.05. 65 N equals the number of valid data points per group: N=12 (LOS, Returned), 24 (LOS, Not Returned), 9 (LOA, Returned), 20 (LOA, Not Returned), 11 (Time to Return), 24 (Time Since Exit); Mean Time to Return to Homelessness was significantly different from Mean Time Since Exit for clients that did not return; F (1, 33) = 263.9, p<.001. 66 Mean number of times homeless differed between the 2 groups; F (1,36) =4.18, p<.05. 67 Proportion of clients who were chronically homeless differed between the 2 groups; X2(1) = 5.98, p<.05. 68 N equals the number of valid data points per group: N=14 (LOS, Returned), 51 (LOS, Not Returned), 12 (LOA, Returned), 43 (LOA, Not Returned), 14 (Time to Return), 51 (Time Since Exit). 69 N=10 (Time to Return), 28 (Time Since Exit); Mean Time to Return to Homelessness was significantly different from Mean Time Since Exit for clients that did not return; F (1,36) = 29.13, p<.001.
Final Evaluation of the RRH 250 Program | Prepared for Valley of the Sun United Way by Focus Strategies | June 2017 | Page 43 of 71

Returns to Homelessness Following Exit to Permanent Exits For Financially Assisted Clients Scoring Highest and Lowest on VI-SPDAT (Per Protocol) We were unable to investigate client characteristics associated with returns to homelessness in those with the highest and lowest VI-SPDAT scores due to the very small number of people who fell into the lowest scoring group (N=20) or the highest scoring group (N=13). The Ns further decreased when returns to homelessness were taken into account.
Summary of Returns to Homelessness Table 24 summarizes the variables that had impact in one or more of the analyses, and again presents them in terms of characteristics that the person brings to the program versus characteristics than might be influenced by the program (dynamic characteristics). The bolded italicized variables indicate the areas of consistency across analyses.
Table 24: Variables Associated with Higher Rates of Returns to Homelessness
Analytic Approach All Enrolled Clients
(Intent to Treat) Financially
Assisted Clients (Per Protocol)
Total High Scoring
Low Scoring
Total
Person Characteristics Race White
Experienced DV Experience Experience Experience Number of Time Homeless Higher
Chronic Homelessness Yes Dynamic Characteristics
Income at Exit No income No income
One “person characteristic” is related to returns to homelessness in all clients as well as those financially assisted: whether they report having previous experience with domestic violence at program entry. For low scoring clients the number of past homeless episodes and being chronically homeless also leads to higher rates of return. A single “dynamic characteristic” is related to returns to homelessness: those with no income at exit are more likely to return to homelessness than those with income at exit. We return to a discussion of these factors in our conclusions.
Final Evaluation of the RRH 250 Program | Prepared for Valley of the Sun United Way by Focus Strategies | June 2017 | Page 44 of 71

G. Summary and Conclusions 1. Key program results Despite a slower start up period than originally hoped for by the program funders, the program housed more than 250 single adults in its first year. The total number who were housed through the program by receiving financial assistance was 255. At the end of the program year, 185 of those assisted had completed the program with permanent housing, and another 38 that had been enrolled but not financially assisted had also entered permanent housing.
Table 25: Outcome Summary
Unique Clients Enrolled
Housed through the program
Assisted and in housing at the end of the program
Gained housing without financial assistance from the program
373 255 185 38
The impact on the population at the overflow shelter was less clear and was not the specific subject of this evaluation. It was reported to us that the census of the overflow shelter and campus had fallen by between 200 and 300, most likely due to the combined impact of the RRH 250 and PSH 275 programs. However, the program clearly did not result in a one-for-one reduction of people using the overflow shelter, indicating that the population using the shelter was more dynamic and larger than originally anticipated. Funders in particular noted that this was a significant learning from the programs, albeit one that provided challenges for how to target resources to specific groups of clients to achieve specific reductions.
Finally, the commitment of $2.5 million for this program in the first year, and the program’s continuation into the second and third year with new resources were significant outcomes, as well as the level of coordination of multiple funders and providers to implement the program.
2. Other Findings and Recommendations 1) Reduce Funding Variability
This program was funded as a pilot, and an initial commitment of one year of funding was made. The intent was to have all 250 persons housed within the first six months of the program. This turned out not to be possible, and it took far longer to get all clients enrolled and housed. Not all of the funding was expended in the first year and some was ultimately carried over along with additional funds being added. Information about whether the program would be continued, however, was not available until very late in the first year, causing the program to “ramp up” and then “ramp down” almost entirely before extending and admitting a new cohort in year two.
Future years of this program, and rapid rehousing programs in general, will benefit from more consistent or predictable funding. Starting up and winding down is disruptive to the process of working with clients and recruiting and maintaining trained staff. It artificially constrains the time available for clients who enter later in a program year. This appears confirmed in this report by information showing that clients
Final Evaluation of the RRH 250 Program | Prepared for Valley of the Sun United Way by Focus Strategies | June 2017 | Page 45 of 71

that entered in the earlier part of the program had longer time in the program, on average, than those enrolled later in the program. This pattern also increases work on staff to begin the enrollment process again with a new cohort when new funding is added. While this report covers only the first year, at the time of our interviews the second year was ending with uncertainty about future funding.
We understand that pilots are launched to intentionally test a concept and are not always intended to be continuously funded. In the future, we recommend planning for longer contract periods (18 months to two years) with decisions made 4-6 months prior to end regarding continuation, extension, or discontinuing. This will allow for smoother transitions for staff, and more consistent experience for clients.
2) Establish Standard Case Loads and Expectations
This program funded three providers at three different rates with different expectations about the number of persons to be served; thus, case management caseloads varied across the providers. Clients, while generally very satisfied with the program, remarked in some cases that their case managers were very busy. Caseloads also varied over time as the program enrolled and dis-enrolled clients and as staff were brought on (see above). We note that one of the agencies had shared caseloads where both case managers worked with all current clients while the other two assigned clients to specific case managers. (Our previous report discussed in depth differences in the results for the three providers. For this report we have not broken out the provider differences.)
Several staff mentioned that they felt that caseloads should be standardized and should be kept lower for this program than for other rapid rehousing as it served a higher need population. Using VI-SPDAT score as a proxy for need, the program served primarily those considered “appropriate” for rapid rehousing, though it also served clients scored as appropriate for other resources. Clients entered the program without income (50%), with disabilities (34%), with multiple past episodes of homelessness (average 1.9 episodes), and with long periods of homelessness (38% homeless longer than 12 months.)
Establishing standard caseloads is an area that could use additional research and discussion. We do not have formal comparative research on appropriate caseloads for this program type, though anecdotally we hear programs and communities talk about 25-35 in rapid rehousing. The State of Connecticut is currently piloting a 6- month modified Critical Time Intervention model for rapid rehousing in which caseloads will be closer to 20 or fewer. We note that with a program of this type in which some clients have higher need levels than others, consideration would need to be given both to numbers of clients per case manager and whether case managers serve a mixed group of higher and lower need clients and/or clients in different stages of the program.
The introduction of standards for financial assistance was generally welcomed by the providers in this program as an improvement that led to clearer expectations and a greater sense of consistency. We recommend both internal discussion and discussion across the community’s rapid rehousing programs to develop a standardized framework for case management.
Final Evaluation of the RRH 250 Program | Prepared for Valley of the Sun United Way by Focus Strategies | June 2017 | Page 46 of 71

3) Review Engagement Process From Enrollment to Housing
As noted above, this program appears to have experienced significant client loss in the first year between enrollment/briefing and receiving financial assistance (a proxy for getting housed by the program). Just over 32% of those who were enrolled (121 people) did not go on to receive financial assistance. We note that 31% of those (38 people) were reported to have secured permanent housing in some other manner, but 69% of those not assisted appear to have either left the program without housing or to have no information available about what happened to them (83 people). This is a significant number when it is considered that they were enrolled, went to a housing briefing, and presumably began the case management process. HOM Inc. pointed out that for their organization, a client being briefed but not ever receiving financial assistance also means they do not receive any payment for the client. For case management providers this attrition/loss rate also represents time away from other clients in the program.70
Our analysis found that those who did not proceed to receiving financial assistance after being enrolled were more likely to be Veterans and more likely to have a somewhat higher VI-SPDAT score, and that being chronically homeless made people less likely to leave the program before receiving financial assistance. Veterans make up a small number of the total (20). We suspect and providers affirmed that because there are similar programs to this one dedicated specifically for Veterans, some are referred to other programs when their Veteran status is determined or a program opening becomes available. Why being chronically homeless increases chances of getting financial assistance is not clear to us, especially since neither disability nor length of time homeless alone are significant. We believe further discussion of factors that might contribute to why some people do not make it from the enrollment/briefing stage to financial assistance will be beneficial.
The addition of a dedicated Housing Locator at HOM Inc. to work with the program in the second year was universally hailed as an improvement by all provider staff, and may impact the rate of attrition. The program should look closely at this issue, whether the Housing Locator improves the situation, and/or whether other measures should be taken.
4) Target Improvement of Program Outcomes and Income Strategies
As stated above, 73.4% of those who received financial assistance exited the program with permanent housing. This outcome rate is higher than the 64% for the same population group reported in the interim report submitted in November of last year, which may in part be accounted for by a decrease in missing data for the group assisted. This number is lower than the National Alliance suggested target of 80% for rapid rehousing programs but is close to that reported for single adult Veterans in the SSVF Program of 76.3% with a permanent housing destination. 71
70 We note that while this issue was raised as a specific challenge by HOM Inc., none of the case management providers reported having concerns about this early attrition rate. 71 Thomas Byrne, Dan Treglia, Dennis P. Culhane, John Kuhn & Vincent Kane (2015): Predictors of Homelessness Among Families and Single Adults After Exit From Homelessness Prevention and Rapid Re-Housing Programs:
Final Evaluation of the RRH 250 Program | Prepared for Valley of the Sun United Way by Focus Strategies | June 2017 | Page 47 of 71

Outcomes were significantly better for those who had an income at exit. We note that the correlation between having income and being able sustain housing is intuitive and that this finding seems to underscore the importance of gaining income. We also note that having an income at entry was not a significant factor, indicating that the program could be successful with those who entered without income but that securing an income was important.
Interestingly, income at exit was not significantly related to permanent housing outcomes for those determined to be highest need by virtue of having a higher SPDAT score (8 and above). For those clients enrolled in the program, longer length of stay and receipt of financial assistance were significant. Number of months in the program for those in the highest need group was on average three months longer than for those in that group who did not end the program with permanent housing. We are not certain what this means, however, better outcomes for higher need people who stay longer in the program, despite no impact of income, may indicate that it allows time for another housing solution to be sought (See 6. below on retaining transfer capacity).
Potential implications of these findings include developing specific different approaches for clients with different income plans. Those who enter with income may need a different type of case management, while those with the highest needs may need additional time or support to secure an income or execute a different housing plan. The current flexible approach likely already results in different case management techniques; case managers report spending very different amounts of time with client based on “need” but it is not clear whether that is related to these specific factors or other perceptions of need.
5) Review Rates of Return to Homelessness and Consider Follow Up Strategies
The return rate for the entire program, including those who did not receive financial assistance, was 28%. For those receiving financial assistance the return rate was 24%. This is above the standard for rapid rehousing programs recommended by the National Alliance to End Homelessness, which has established 85% not returning (fewer than 15% returning) as a target. Although it is also higher than what previous program studies have found, most rapid rehousing most typically serves families so there is not a lot of information about returns just for single adults. Research on single adult Veterans served in the national Support Services for Veteran Families program (SSVF) found return rates of 16% in the first year, rising to 26.6% in the second year. (We note that the method of tracking returns only count those that return to the VA and not to the homeless system.)72
Two factors contributed significantly to whether clients who were enrolled in the program were more likely to return to homelessness; those who reported previously having experienced domestic violence prior to entry were more likely to return as well as those who had no income at the time of completing the program. The lack of income at exit is intuitive, and discussed above as being consistent with initial outcome rates. This finding has implications for focusing on income and employment. (Our next report in
Evidence From the Department of Veterans Affairs Supportive Services for Veteran Families Program, Housing Policy Debate, p.9.
72 Byrne, Thomas, et. al. p. 10.
Final Evaluation of the RRH 250 Program | Prepared for Valley of the Sun United Way by Focus Strategies | June 2017 | Page 48 of 71
September will explore employment outcomes during the second year of the program when a partnership with Arizona@Work program was added.) We do not have specific conjectures about the impact of reporting having experienced previous domestic violence on later returns but we note it and suggest that it be discussed.
When the analysis focused specifically on the returns among the highest scoring group, the only factor related to returns was previous experience with domestic violence. Among those with the lowest scores, two more factors were significant: number of times homeless (clients who returned had a higher average number of homelessness episodes), and chronic homelessness (those clients who were chronically homeless at program entry were more likely to return). We note that this analysis includes those who did not receive financial assistance as well but it does still indicate that characteristics generally associated with being higher need also results in higher rates of return and might require additional attention.
We also note that returns typically happen rather quickly; the average time from program exit to a return for those provided financial assistance was 3.2 months. This finding could indicate that it may be worthwhile to explore continuing to check in on clients after exit or providing some other form of limited after-care.
We cannot determine if the rate and timing of returns to homelessness is affected by differences in the population from those previously studied, the program’s operations, or something else about the community. We do note, however, that Phoenix/Maricopa County has the somewhat unusual situation of having most of its homeless services and shelter beds for single adults in one location, the Human Services Campus. Clients that we spoke to referenced the campus frequently, some describing it as the specific thing they wanted to avoid going back to, but nearly all referring to it as the alternative to being in this program. In our interviews, staff also frequently mentioned the campus as being a central place where clients were used to being, and that it served as a draw to some. It was specifically mentioned that some people move to their own apartments but continue to come to the campus for other services or to socialize. It may be that since it is clear to clients what the alternative will be if they lose housing, and that the experience is familiar, likelihood of return is increased. This is worthy of future exploration.
As described above, providers reported that a portion of those served seemed to have issues of isolation, depression and “survivors’ guilt”. In contrast to families served in rapid rehousing, we were told, this client population does not have a built-in set of relationships or responsibilities once rehoused around which to build a new life. We noted above the perceived draw of the campus and the potential that this could contribute to higher return rates. We also note the enthusiasm that many clients we met with expressed for their relationship with their case managers. We believe this is an important topic to discuss and that the program should consider exploring or developing models for creating increased social support and community connections.
Final Evaluation of the RRH 250 Program | Prepared for Valley of the Sun United Way by Focus Strategies | June 2017 | Page 49 of 71

6) Reconsider Retaining Transfer Capacity to Other Programs
As described above, during the first year of the program, another program for Permanent Supportive Housing (PSH 275) was also launched. The two programs case conferenced together and allowed for transfers from RRH 250 to PSH for a small number of cases that appeared to be in need. Our focus groups included two clients that had benefited from this type of program transfer.
At the end of the first year, with the introduction of coordinated entry, this transfer capacity was eliminated. Clients in rapid rehousing who are in danger of losing their housing must be reassessed with the VI-SPDAT and only those who score in the range of Permanent Supportive Housing are eligible. They are also not specifically prioritized. The result we heard was that clients must return to the campus and even then may not “score for” PSH.
There are arguments on both sides of this decision. Prioritizing those who have already been rapidly rehoused for limited resources means that fewer PSH units are available to those who are currently experiencing homelessness and may have been waiting a long time. On the other hand, the inability to move from RRH to PSH means that clients for whom rapid rehousing is not enough support will almost certainly lose their housing and in many cases have a greater difficulty getting housing again due to increased housing barriers (eviction, debt) than prior to the program. In addition, using PSH for RRH clients who are at imminent risk of losing their housing preserves a unit that may not be available again and, for programs with vouchers which may be difficult to use in the open market, ensures lease up.
We recommend that the community reconsider this stance, considering having a portion of PSH units or other subsidy program turnover available as a “back stop” for rapid rehousing.
7) Recommendations for Implementing Future Large-Scale Collaborations
The effort to create and sustain the Rapid Rehousing 250 program was significant and involved many parties. The fact that this program was funded by multiple funders, and at a significant amount, was reported as a first for Maricopa County and is a significant achievement. It was seen as an important step, both in its own right and as a model for future collaboration.
Above, and in previous reports, we have discussed some of the challenges faced, especially in the first few months when expectations were changing frequently frustrating providers, and the speed of rehousing was troubling to funders. We also note that as adjustments were made, many of the difficulties at start up were corrected or improved, showing a willingness to change, modify, and incorporate learning; the change process also led to the challenge of time and energy spent in and between meetings.
For future efforts of this type we would recommend that the planning process include greater clarity of roles and expectations across funders and between funders and providers, with day-to-day oversight established with one party if possible. We also recommend that program processes be developed as much as possible with input from affected parties and then allowed to be used for a period of time before changes.
Final Evaluation of the RRH 250 Program | Prepared for Valley of the Sun United Way by Focus Strategies | June 2017 | Page 50 of 71

Finally, getting regular and usable data was a challenge for the program. Even with the close attention to enrollment and housing outcomes the program did not have a clear, shared reporting or dashboard method to track progress that could be used in meetings to ensure that all where “on the same page.” The data for this report was improved from previous reports on the program, but was still incomplete and had to come from a wide variety of sources. Developing program dashboards as part of program design is recommended, ideally with most information able to be extracted from HMIS.
Final Evaluation of the RRH 250 Program | Prepared for Valley of the Sun United Way by Focus Strategies | June 2017 | Page 51 of 71

Appendix A: Staff Focus Group Participants and Stakeholder Interviews
Agency or Body Name(s) and Title(s) A New Leaf Karen Brown, Director of Support Services
Michelle Alberti, Program Manager Kirby Milner, Case Manager Renisha Tedford, Case Manager Diane Ovalle, Case Manager Darla Russell, Case Manager
Mercy House Larry Haynes, Executive Director Patti Long, Operations Director Joe Manarelli, Housing Stability Specialist Lavelle Lewis, Housing Stability Specialist
UMOM Darlene Newsome, Chief Executive Officer Mattie Lord, Chief Program Officer Chela Schuster, Senior Director, Housing Danielle King, Housing Stability Coordinator Amy Atterberry Housing Stability Specialist Jeanette Aparicio, Housing Stability Specialist
HOM Inc. Sharon Shore, Chief Program Officer Michael Shore, Chief Executive Officer Janet Flores, Lead Housing Specialist Maritza Pena, Housing Location Specialist Kendall Yee, Administrative Assistant Marcie McFarlin, Lead Housing Specialist Trevor Thundershield, Program Support Specialist Antonisha (Nisha) Dorsey, Lead Housing Specialist
Funders Collaborative Amy Schwabenlender, Community Impact Vice President, Valley of the Sun United Way Bruce Liggett, Human Services Director, Maricopa County Moe Gallegos, Human Services Director, City of Phoenix IDA Betsy Long, Homeless Program Administrator, Arizona Department of Economic Security Brad Burt, Commander - Central City Precinct, City of Phoenix Police Department Michael Trailor, Director, Arizona Department of Economic Security (formally Director of Arizona Department of Housing) (provided written answers to questions)
Operations Group Karia Basta, Special Needs Program Administrator, Arizona Department of Housing Margaret Kilman, Homelessness Projects Program Manager, Maricopa County Human Services Kim Van Nimwegen, Homeless Coordinador, City of Tempe (formerly of Valley of the Sun United Way)
ARIZONA@WORK, City of Phoenix
Lasetta Hogans, Workforce Partnership Specialist Connie Garcia, Career Advisor
Final Evaluation of the RRH 250 Program | Prepared for Valley of the Sun United Way by Focus Strategies | June 2017 | Page 52 of 71

Appendix B: Staff Focus Group Questions
1. Please briefly introduce yourself – (your role in the program, how long you worked in the project.)
2. How would you describe the purpose of the RRH 250 program? Do you think the underlying purpose or intent has changed since the program began?
3. How do you think the first full year went? What do you think went best? What were the greatest challenges? What are some of the things you, your agency, and/or the community learned over time about housing homeless adults?
4. What changes in how the overall program was implemented were made over the course of the year? Why were these changes made and how did they impact the program’s effectiveness?
5. What changes did you make at the agency or individual level? Why were these changes made and how did they impact the program’s effectiveness?
6. Please specifically address your relationship with
a. The other program service providers in RRH 250
b. HOM Inc.
c. The Ops Team
d. The Employment Program
e. Other providers or parts of the system
7. Knowing what you know today, do you have any recommendations for anything more or different that should be changed?
8. Questions resulting from client focus groups:
Final Evaluation of the RRH 250 Program | Prepared for Valley of the Sun United Way by Focus Strategies | June 2017 | Page 53 of 71

Appendix C: Stakeholder Interview Questions
Introduction: As you know, Focus Strategies has been engaged to evaluate the Rapid Rehousing 250 program. For this evaluation we will be using a combination of quantitative information about the program as well as qualitative feedback from various stakeholders in the projects, including participants, providers, funders and others. We have recently conducted focus groups with program participants and with program line staff. We are now conducting interviews with other stakeholders who may have different experience or perspectives on the program. Before we begin do you have any questions for me?
1. Please tell me about your job/role in the community and your relationship to the RRH250 program. How familiar with the project would you say you are?
2. How would you describe the purpose of the RRH 250 program?
3. Do you think the underlying purpose or intent changed since the program began?
4. How do you think the first full year went? What are your impressions about what went well?
5. What are your impressions about the greatest challenges?
6. What are some of the things you feel have been learned from this project about rehousing homeless adults?
7. Are you aware of changes in program structure or implementation made over the course of the year? Why were these changes made and how do you believe they impacted the program’s effectiveness?
8. Are you aware of changes or developments in the planning, delivery or funding of homeless services that you believe could have an impact on this program? What are they?
9. Comparing this project to other projects of similar size and scope in your community, would you say this program has been more successful, less successful or the same as other similar initiatives?
10. Knowing what you know today, do you have any recommendations for anything that should be changed in potential future versions of this program?
11. What do you most hope to learn from this evaluation?
Final Evaluation of the RRH 250 Program | Prepared for Valley of the Sun United Way by Focus Strategies | June 2017 | Page 54 of 71

Appendix D: Client Focus Group Participant Characteristics
In March 2017, members of the Focus Strategies team conducted client focus groups with a total of 17 individuals who had participated in the RRH 250 program. At each of the four focus groups, participants were asked to fill out a brief survey that asked for basic demographic information and questions relevant to their current housing situation. A total of 16 participants completed the survey.
The first table below presents demographic characteristics for the clients participating in the focus groups. Average age of participants was 45.8 years, with a range of 27 to 61 years of age. The majority of respondents identified as male (N=13; 81%), and the racial/ethnic background was very diverse (38% Black/African American, 25% Latino/Hispanic, 19% White, 13% “other”, and 6% Native American.
Table 1: Demographic Characteristics
Characteristic Average Range N % Gender
Male 13 81% Female 3 19%
N % Race
Black/African American 6 38% White/Caucasian 3 19%
Latino/Hispanic 4 25% Native American 1 6%
Asian/Pacific Islander 0 0% Other 2 13%
At the time of these client focus groups, 13 (81%) of clients said they were living or staying in a place of their own with a lease, 2 (13%) said they were living or staying at the Human Services Campus, and 1 person (6%) said they were living in another shelter. Thus, after participation in the RRH 250 program, 81% of individuals were housed, and 19% of individuals were homeless. Their reported average length of stay in their current situation was 9.5 months, with housed people reporting an average of just over 10 months (see Table 2).
Table 2: Current Living Situation and Length of Stay
Housing # % Average LOS (months) Own Lease 13 81% 10.2 Human Services Campus 2 13% 10 Shelter 1 6% 0.5 Total 16 100% 9.5
Final Evaluation of the RRH 250 Program | Prepared for Valley of the Sun United Way by Focus Strategies | June 2017 | Page 55 of 71

Appendix E: Client Focus Group Questions
1. Please briefly introduce yourself – (You don’t have to give your name and we are not writing anything down that identifies you)
2. You have been asked to this focus group because you are or were part of a rapid rehousing program to help people from the campus get back into housing. Do you remember how you first heard about this program? What did you understand the program was for?
3. Did the program help you find housing?
a. If yes, what help did you get? Did it come from your program? From HOM Inc.? What else would have helped you or would have made it easier to find housing?
b. If no, did you have trouble finding housing? What help did you get? What would have helped you find housing?
c. If you got housed through the program,
i. What services or help did you get
ii. How long did you get support for after you got housing? What kind of support was most important to you?
iii. If you need help, can you call the program for assistance?
4. (For those with housing) What do you like about where you live now? What don't you like?
5. Did you get connected to employment or employment services through this program? Were those services helpful?
6. Were you connected to any other services in the community through this program? Were those services helpful?
7. What about the program did you like most? Least?
8. Where do you think you will be living a year from now?
9. Do you have any other suggestions for what could make the program better for others who need help finding housing?
Final Evaluation of the RRH 250 Program | Prepared for Valley of the Sun United Way by Focus Strategies | June 2017 | Page 56 of 71

Appendix F: Summary of Stakeholder Focus Group and Interview Themes
Focus Strategies held three in-person focus groups with line staff from the three provider agencies and conducted phone-based stakeholder calls with individuals or small groups including with leadership of the provider agencies, representatives of the program funders, and others. We interviewed a total of 26 persons connected to the program, and received one set of written answers from someone unable to participate in a phone focus group. This appendix summarizes stakeholder response to the questions asked.
1. Program Purpose • “End homelessness, connect clients to resources” • Provide immediate response to people who need a little assistance • Focus on high acuity single males using the HSC • Get those at MOS and east lot housed • Trying to close overflow – “naively though if we housed 500 we’d be done” Housed more
than were ever there, but didn’t solve it – didn’t realize number wasn’t fixed. • First joint funding/fundraising effort for funders • Provide a housing solution to people experiencing homelessness. Originally to deal with MOS. • House people from parking lot; • Also reduce number of people on campus • Some people saw as first test of using RRH with individuals in our community –
demonstration for a different population • Help as many people as possible who are homeless get into housing and implement – create
stability (know started out with 250 displaced from overflow.)
2. Changes over first year
In intent
• First focused on chronic and then change to more appropriate for RRH; Then changed to whoever is on campus
• Goals were house as many a could • No change in intent – think basically same • Things changed a lot – not sticking to lane – not looking in context of other programs • Started out with a lot to figure out and a lot of meetings! Worked itself out over first 6
months. • Was never just people from parking lot – from beginning only needed one stay there- real set
of mixed messages • Word on the street got around if you want RRH go to the overflow – they moved overflow
onto the campus but kept filling it even when there were beds in the mainstream shelters (CASS and Watkins.)
• Nothing aware of
Final Evaluation of the RRH 250 Program | Prepared for Valley of the Sun United Way by Focus Strategies | June 2017 | Page 57 of 71

In Program design
• First did full SPDAT- With switch to VI SPDAT more clients in , fewer chronically homeless and not MOS or parking lot
• Using Coordinated Entry and VI-SPDAT much more appropriate, now don’t do full assessments until housed
• Getting a new supervisor made big difference half way through first year • Alignment of financial assistance and trying to work same way – been an improvement • Progressive engagement better than flat structure – engage before month 4. More structure
similarity, less client holding out; Impacted how landlord understand too, • RRH has evolved from light touch to hybrid with greater case managing, bridging to PSH • Changes with HOM Inc. – who did what, added more briefings, fewer participants, individuals
sit done right after • At end of first year moving to CES, very hard at first and slow. • In second year referral process got smoother • In first year focused on time frames – in second year told to under promise and over deliver
3. How did first year go?
What Worked?
• Program started out rocky but worked out the bugs in first 6 months • Guaranteed assistance to landlords – 3 months got them in • Mid-level success-works for some and not for others – only find out once in housing • Made a dent – overflow population down • Process perspective successful – first time in the community had City, County, State and
VSUW together • Providers and funders worked well together to solve issues • UMOM/Mercy house partnership worked well • Dedicated staff with RRH experience, able to jump in and house a lot of people • Works on the standards help focus. Seeing better results
Challenges
• Getting going – first weeks funders thought “this is crazy, we haven’t housed anyone.” Took longer than expected.
• Slow start • Trying to get things going AND doing as a group process was a conflict • In first year, things changed weekly – once procedures finalized things went better. • Throw money at it (spend quickly) didn’t work, unrealistic to start up so fast • Seat of pants – now more defined • Trying to do outreach, “leaving notes on back packs was kind of ridiculous.” • Time went into assessments- time wasn’t able to be used with clients. Hundreds of hours • Transfer to PSH took long time but worked for some when was possible. • Not having a well-established CES
Final Evaluation of the RRH 250 Program | Prepared for Valley of the Sun United Way by Focus Strategies | June 2017 | Page 58 of 71

• Not having standards • Not connecting participants to employment • Trying to make decisions by committee but no entity where the buck stopped. Good and bad • Challenges in communication between Op Team and Funder group – not always hearing
same thing. Op team in the middle; Roles and responsibilities never fully defined. Contract holder not same as who was asking
• Felt sometimes like the funders versus the providers • Didn’t take all the provider advice we got – esp. about structure – should have taken more of
their advice • Data coming in challenges with quality of data and asking for data all the time • Different staffing levels – agency had to do 100 with 2 people. • Rents increasing in year two • Lots of people couldn’t lease up, not because of felonies or credit but because would
disengage. • One year grant – really challenging • Not having control of the housing dollars- this is the one and only contract with HOM Inc.
paid separately
4. What have learned • Some staff still think not targeted well – maybe should be for 0-3 instead of 4-7 • Sometime clients just leave when no more incentive • Funders learned to work together – took time, not just sitting alone making decision • Working with multiple providers learned that different ways of doing things, thought RRH
was same; Learned that not everyone doing things same way – should have started there • How difficult when can’t find people – staying in touch. • CE needs to be improved. Need specialist for housing. Should have follow up after person is
housed • This population has a lot of isolation and depression. Loneliness. Hard to break from campus. • Landlord important- every time see the client check in with the landlord. • Lot of people we see homeless a long time and acculturated to homelessness - need help
getting involved in meaningful activities and connection with social groups/family so don’t go back to campus; Really different from families
• Need more support in community, more holistic case manager • Employment really back • Crisis planning really key – have a crisis plan what to do in an emergency • Exit planning from the beginning – what is YOUR plan to making sure YOU don’t come back to
shelter • Need more time to secure employment before can start paying rent.
5. Case Management structure
• See everyone with 3-5 days, minimum 1x a month, Stops when financial assistance stops – should continue through end of lease.
Final Evaluation of the RRH 250 Program | Prepared for Valley of the Sun United Way by Focus Strategies | June 2017 | Page 59 of 71

• Complete goal sheets and case plans, work on job through employment hub, bus passes, get connected to other services. Can keep for case management after subsidy but haven’t done that – create dependency
• After move-in see at least once a month – ideally more. Squeaky wheel gets the grease, some 4-5 times a month, some only 1-2, case by case
• Lot of pressure to exit people quickly; now adding file review for closed cases and exit interviews with people
• Once closed no more contact; Not typically keeping CM open after subsidy
6. Role of HOM Inc.
• Love them- helpful • At first tension because not clear on roles • Briefings were too limited, now more frequent • Added housing locator Housing Locator great resource. Landlords one person to call • Glad not doing check writing • Sometimes clients confused where to go – show up at HOM Inc. • Like partnership between agency and dedicated HOM Inc. person • HOM Inc. report sometimes being out of loop on program decisions • “After briefing we only know if we housed them, see 80%, not sure if some got PSH or housed
another way. Monthly changes a lot of work sometimes providers late with info”
7. Housing • Need apartment complexes that understand population • More business-like landlord throw clients out more easily • Complexes very discriminating – more places interested in working with people – put people
who the community, regular setting, but when it’s a business, throw them out – need more for sex offender
• Rents have gone up – higher barriers equal higher rent • Have resources but no units. Impact: less client choice, more concentration, quality of units C
or D • Some of the housing that is approved is in bad shape
8. Employment • AZ WORKS awesome, responsive • Issues with felonies, work force turns them away • Population wants “instant gratification” – temp jobs, make money today • One provider has own employment hub • Workforce too many hoops and sometimes conflicts e.g. pay towards clients rent without
coordinating with CM • Clients on SSI afraid to look for work and lose benefits • Good relationship between Workforce and some case managers but not all of them ––but
time frames different.
Final Evaluation of the RRH 250 Program | Prepared for Valley of the Sun United Way by Focus Strategies | June 2017 | Page 60 of 71

• Referral process greatest challenge for employment services – lots not employment ready – not used to getting up certain time or calling employer if late or wearing proper attire
9. Other providers • St Joes mentioned a lot as an important collaboration
10. Other changes that could have impacted program?
• Funders: Always working on 10 things at a time – CES, lowering barriers at CASS, data collection, shelter expansion
• Changes at CASS and collective management was changing • Problems with communication with CASS • Change in relationship to providers –give us the money and we’ll do it
11. Successful? • feel very successful – people housed, money raised, and new way of working. • Resources to house 700 people over two years. • Housed a lot of people; Not really for overflow – some impact but not what expected • Issues of agendas continue to be problem – providers used to making own decisions –
changing environment • Concerns about who its working for and not • Started we didn’t believe we could house people with no money and no work experience • Funders cut their teeth on this project – RRH 250 considered one of their biggest wins – but
no longer feels like were a community of partners
12. Recommend for future? • Stable funding – multi-year grant or renewable • Work with less clients than have now – caseloads more like PSH • Should work with lower acuity clients • Bring back full SPDAT - RRH and increase in need RRH (12 mo) • Housing specialists should be able to give input in general into CE– should be more included
in the decisions • When waiting for SSI keep going on rent – bridge program for SSI • Do better job of ongoing evaluation • More sharing in RRH provider group – open with data • More data sharing period – really look at how doing • Partnership principles • Look at potential for shared housing • Look at population issues of isolation and depression, survivor guilt • Need to address progressive engagement so not have to lose housing to get help • Improve CASS connection – not using CE for shelter
Final Evaluation of the RRH 250 Program | Prepared for Valley of the Sun United Way by Focus Strategies | June 2017 | Page 61 of 71

Appendix G: Summary of Client Focus Group Themes
Focus Strategies held four focus groups with current and former participants in the Rapid Re-Housing 250 Program, with a total of 17 participants. This Appendix summarizes client responses to the questions asked.
1. Hearing about program/Expectations
Most said program reached out to them or CASS reception let them know and connected them
• Informed had appointment – 2 weeks later found eligible “like winning a game show.” • Found letter on bunk • Rumors at CASS so asked about it • Referred by someone in program – followed up on own
2. Understanding of the program
• Help you get housing, three months of assistance. Didn’t expect stuff • Three months’ rent, bus pass, can look for job • Got more help than expected
3. HOM Inc./Briefing
• Remembers the paperwork • Case Manager went with • “Was a lot of information, couldn’t have done it myself – my case manager kept track of it.”
4. Case management
A. While Looking for Housing
• Met with me every day – told him where to find apartments • Case manager told me where landlord was that would take eviction • Case manager took her to look around – extremely important to her • Lists/On own did footwork • Provided help moving
B. After • See how you are doing/check up • Learning budgeting • Bus passes • Job search/employment - connections • Furniture voucher • Rent • Bus passes • Clothes • Behavioral Health
Final Evaluation of the RRH 250 Program | Prepared for Valley of the Sun United Way by Focus Strategies | June 2017 | Page 62 of 71
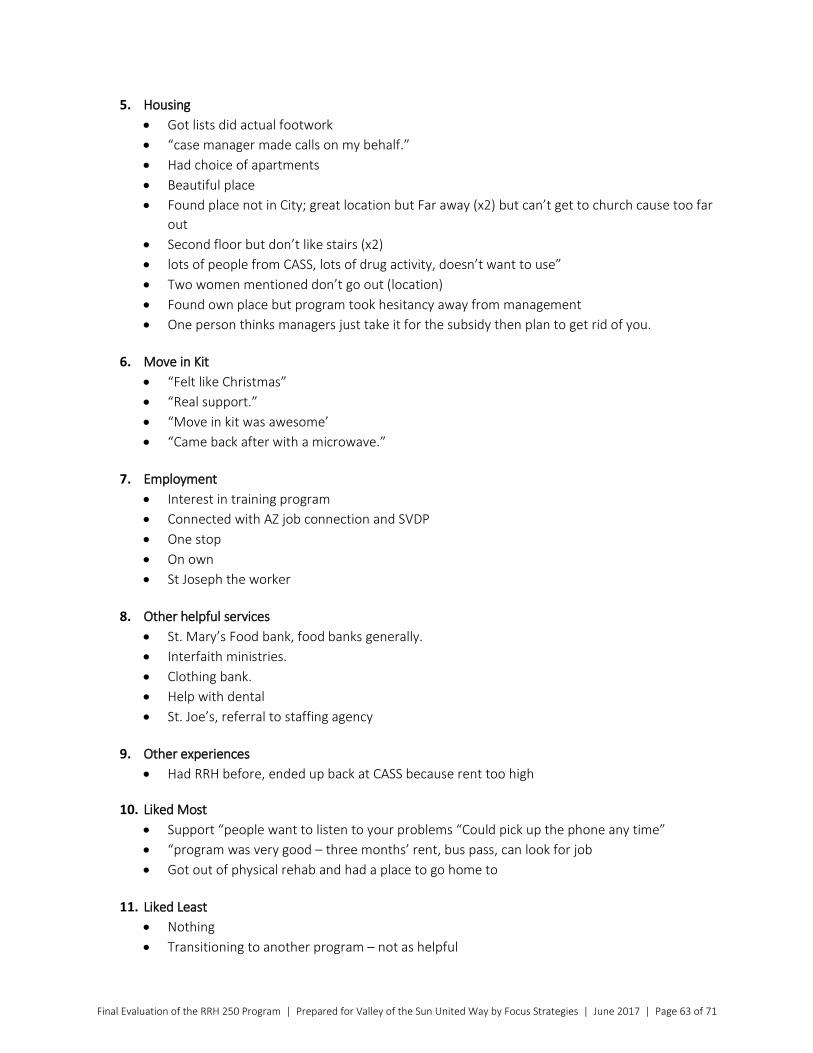
5. Housing • Got lists did actual footwork • “case manager made calls on my behalf.” • Had choice of apartments • Beautiful place • Found place not in City; great location but Far away (x2) but can’t get to church cause too far
out • Second floor but don’t like stairs (x2) • lots of people from CASS, lots of drug activity, doesn’t want to use” • Two women mentioned don’t go out (location) • Found own place but program took hesitancy away from management • One person thinks managers just take it for the subsidy then plan to get rid of you.
6. Move in Kit
• “Felt like Christmas” • “Real support.” • “Move in kit was awesome’ • “Came back after with a microwave.”
7. Employment
• Interest in training program • Connected with AZ job connection and SVDP • One stop • On own • St Joseph the worker
8. Other helpful services
• St. Mary’s Food bank, food banks generally. • Interfaith ministries. • Clothing bank. • Help with dental • St. Joe’s, referral to staffing agency
9. Other experiences
• Had RRH before, ended up back at CASS because rent too high
10. Liked Most • Support “people want to listen to your problems “Could pick up the phone any time” • “program was very good – three months’ rent, bus pass, can look for job • Got out of physical rehab and had a place to go home to
11. Liked Least
• Nothing • Transitioning to another program – not as helpful
Final Evaluation of the RRH 250 Program | Prepared for Valley of the Sun United Way by Focus Strategies | June 2017 | Page 63 of 71

12. Where want to be in a year? • Graduated, back in nursing • Get back CNA license • Stay in place, clean up finances • Move back home and manage my health • Get a house/rent a house • Get back in the program • Move out of state/home with family (x3) • Look for a house to rent
13. Quotes
• “if you have 3 months’ rent and intention to work you will get it but it’s up to you to maintain”
• “you have to decide to not want to go back” to CASS • “How much better can it be?” • Just the right amount • “My future looks brighter than it did last year this time.” • Coach us very well – information was spelled out • “Willing to trust you and give you a second chance • “True to word, always there” • “They need a raise! You can tell even when they are dealing with something, they give it
100%”
14. What else should program do? • Do something before people get to be homeless • More focus on employment/job • Focus on education • Have way to give back - volunteer • More flexibility in the support, not just 3 months • more case managers – they are good when there but don’t have much time
Final Evaluation of the RRH 250 Program | Prepared for Valley of the Sun United Way by Focus Strategies | June 2017 | Page 64 of 71

Appendix H: Data Cleaning and Quality Analysis
Data Provided
Focus Strategies requested data for this report for all program participants enrolled in the RRH 250 program from July 1, 2015 through August 31, 2016. Data was provided that documented all enrollments, exits, and returns through March 31, 2017.
Figure 1: Program Steps
Table 1: Data Sources for Program Steps
Program Step Data Source(s)
Assessment Homelink
Referral/Outreach None Available
Enrollment/Briefing Demographics, Entry Exit, Exit Destination
Financially Assisted/Move-In Date HOM Inc.
End Financial Assistance HOM Inc.
End Provider Entry Exit, Exit Destinations, Returns
Return Returns
The data provided included 383 total participants, with 388 total program entries. The representation of the number of clients in each data set is described in Table 2 below.
Table 2. Number of Clients Represented by Each Data Set
Total
Assessment Data, Clients (Homelink) 375
Demographic Data, Clients 373
Financial Assistance Data, Records (HOM Inc.) 255
Exit Destination Data, Records 349
Returns Data, Records 368
Assessment Referral/ Outreach
Enrollment/Briefing
Financially Assisted/ Housed
End Financial
Assistance
End Provider Return
Final Evaluation of the RRH 250 Program | Prepared for Valley of the Sun United Way by Focus Strategies | June 2017 | Page 65 of 71

Entry Exit Data, Records 229
Data Matching and Cleansing
Providers were identified and matched based on Client ID for all data sets except . HOM Inc., which did not contain Client ID. HOM Inc. data records were matched to the corresponding data from other data sets using Client First and Last Name. Data matching was confirmed using Client Name and Provider. Five clients had two distinct program entries during the selected date range; for those clients, records were matched based on Client ID and Entry Date, and the earliest available Assessment and Demographic data was used for analysis. Clients with two program entries appear as one individual in Assessment and Demographic analyses and as two records in program entry, exit, financial assistance, exit outcome, and return data. The Demographics data set often contained more than one record for a single person; in those cases, the bolded record was used for that client. Table 3 defines each data field used for analysis, its original source, and rules used to cleanse the data. Italicized fields are derived from one more more raw data fields as defined.
Table 3: Data Cleaning Rules
Data Field Data Source (Source Field Name)
Cleaning Rules
ClientID Data Request (Client ID) • If client entered program more than once, “-1” and “-2” were added to Client ID
FirstName Data Request (First Name)
LastName Data Request (Last Name)
Provider Data Request (Provider)
AssessmentDate Homelink (Date of Assessment) • Formatted as Date (mm/dd/yyyy)
AssessmentScore Homelink (Assessment Score (Total))
• 0-4=Other Supportive Services • 5-9=Rapid Rehousing • 10-16=Permanent Supportive Housing
Age Demographics (Age)
Gender Demographics (Gender) • Transgender male to female = Transgender
PrimaryRace Demographics (Primary Race)
SecondaryRace Demographics (Secondary Race)
• Null=Single Race • All other values=Multi-Race
Ethnicity Demographics (Ethnicity)
Final Evaluation of the RRH 250 Program | Prepared for Valley of the Sun United Way by Focus Strategies | June 2017 | Page 66 of 71

PriorLivingSituation Demographics (Prior Living Situation)
• Emergency Shelter, including hotel or motel paid for with emergency shelter voucher (HUD)=Emergency Shelter
• Hospital or other residential non-psychiatric medical facility (HUD)=Institution
• Jail, prison or juvenile detention facility (HUD)=Institution
• Place not meant for habitation (HUD)=Unsheltered • Psychiatric hospital or other psychiatric facility
(HUD)=Institution • Staying or living in a family member’s room,
apartment or house (HUD)=Family/Friends • Staying or living in a friend’s room, apartment or
house (HUD)=Family/Friends
Disab Demographics (Disab)
Chronic Demographics (CH HUD)
NumTimes Demographics (Num Times) • Never=0 • 4+=4
TotalMo Demographics (Total Mo)
Vet Demographics (Vet)
DomViolence Demographics (DV)
Income Demographics (Inc)
HealthIns Demographics (Health Ins)
Employment Demographics (Empl)
Education Demographics (Education)
• 7th grade or 8th grade (HUD)=Less than High School • 9th grade (HUD)=Some High School • 10th grade (HUD)=Some High School • 11th grade (HUD)=Some High School • 12th grade, No diploma (HUD)=Some High School • High School Diploma (HUD)=Graduated High School • GED (HUD)=GED • Associates Degree=Post-Secondary • Certificate of advanced learning or skilled
artisan=Post-Secondary • Post-secondary School (HUD)=Post-Secondary • Bachelors Degree=BA/MA • Masters Degree=BA/MA
MoveIn HOM Inc. (movein) • Formatted as Date (mm/dd/yyyy)
MoveOut HOM Inc. (moveout) • Converted “- -“ to blank • Formatted as Date (mm/dd/yyyy)
Final Evaluation of the RRH 250 Program | Prepared for Valley of the Sun United Way by Focus Strategies | June 2017 | Page 67 of 71

AppFee HOM Inc. (appfee) • Formatted as currency
SecDep HOM Inc. (secdep) • Formatted as currency
NRF HOM Inc. (nrfdep) • Formatted as currency
UtilDep HOM Inc. (utildep) • Formatted as currency
TotalHousingStab HOM Inc. (subtot1) • Formatted as currency
HAP HOM Inc. (hap) • Formatted as currency
UAP HOM Inc. (uap) • Formatted as currency
TotalRentAssist HOM Inc. (subtot2) • Formatted as currency
TotalAssist HOM Inc. (pgmtot) • Formatted as currency
EntryDate1 Exit Destination (Entry Date) • Formatted as Date (mm/dd/yyyy)
ExitDate1 Exit Destination (Exit Date) • Formatted as Date (mm/dd/yyyy)
ExitDestination Exit Destination (Exit Destination)
IncomePerEE Exit Destination (Income per EE) • Formatted as currency
EntryDate3 Returns (Entry Date) • Formatted as Date (mm/dd/yyyy)
ExitDate3 Returns (Exit Date) • Formatted as Date (mm/dd/yyyy)
ExitType Returns (Exit Type (Positive, Negative, Unknown))
Return Returns (Return to Homeless System (Y/N))
ReturnDate Returns (If Yes, Date of Return to Homeless System)
• Manually entered Return Dates that were populated in “Notes” field of Returns data
• Converted “N/A” and “?” to blank • Formatted as Date (mm/dd/yyyy)
EntryDate2 Entry Exit (Entry Date) • Formatted as Date (mm/dd/yyyy)
ExitDate2 Entry Exit (Exit Date) • Formatted as Date (mm/dd/yyyy)
FinanciallyAssisted TotalAssist • If TotalAssist>0, Yes • If TotalAssist<=0 or blank, No
Exited ExitDate1 (Exit1), ExitDate2 (Exit2), ExitDate3 (Exit3)
• If Exit1, Exit2, or Exit3 are populated, Yes • If Exit1, Exit2, and Exit3 are blank, No
EntryDateFinal EntryDate1 (Entry1), EntryDate2 (Entry2), EntryDate3 (Entry3)
• Use Entry1 if available • If Entry1 blank, use Entry2 • If Entry1 and Entry2 blank, use Entry3 • If Entry1, Entry2, and Entry3 are blank, leave blank
Final Evaluation of the RRH 250 Program | Prepared for Valley of the Sun United Way by Focus Strategies | June 2017 | Page 68 of 71

ExitDateFinal ExitDate1 (Exit1), ExitDate2 (Exit2), ExitDate3 (Exit3)
• Use Exit1 if available • If Exit1 blank, use Exit2 • If Exit1 and Exit2 blank, use Exit3 • If EntryDateFinal is blank, leave blank • If EntryDateFinal is populated, enter 3/31/2017
ExitDestinationGroup ExitDestination (ED)/ExitType (ET)
• ED: Deceased (HUD)=Deceased • ED: Emergency Shelter, including hotel or motel paid
for with emergency shelter voucher (HUD)=Unsheltered/ES
• ED: Hospital or other residential non-psychiatric medical facility (HUD)=Jail/Hospital
• ED: Hotel or motel paid for without emergency shelter voucher (HUD)=Temporary Housing
• ED: Jail, prison or juvenile detention facility (HUD)=Jail/Hospital
• ED: No exit interview completed (HUD)=Missing • ED: Permanent housing for formerly homeless
persons (HUD)=Permanent Housing • ED: Place not meant for habitation
(HUD)=Unsheltered/ES • ED: Psychiatric hospital or other psychiatric facility
(HUD)=Jail/Hospital • ED: Rental by client, no ongoing housing subsidy
(HUD)=Permanent Housing • ED: Rental by client, with other ongoing housing
subsidy (HUD)=Permanent Housing • ED: Staying or living with family, permanent tenure
(HUD)=Permanent Housing • ED: Staying or living with friends, permanent tenure
(HUD)=Permanent Housing • ED: Staying or living with friends, temporary tenure
(e.g., room apartment or house)(HUD)=Temporary Housing
• ED: Blank and ET: Positive=Permanent Housing • ED: Blank and ET:
Negative/Indeterminate/N/A/Blank=Missing
ReturnDateFinal ReturnDate (Return1) • Use Return1 if available • If Return1 blank, enter 3/31/2017
Data Quality
Table 4 describes any data quality issues that affected data analysis. Percentages are calculated out of the total number of clients/records available for that data set. Data is considered to have multiple values when there were multiple records for that client in the relevant data set, and there were different values
Final Evaluation of the RRH 250 Program | Prepared for Valley of the Sun United Way by Focus Strategies | June 2017 | Page 69 of 71

amongst the different records for that field. As described above, the information in the bolded record was used for analysis. Unlisted data fields did not have any notable data quality concerns.
Table 4: Data Quality Issues that Affected Data Analysis
Total
Assessment: Assessment Date N=375
Invalid Values (Assessment Date after Entry Date) 65 (17%)
Demographics: Age N=373
Multiple Values 50 (13%)
Demographics: Disab N=373
Missing/Null 1 (0.3%)
Multiple Values 9 (2%)
Demographics: CH HUD N=373
Multiple Values 15 (4%)
Demographics: Num Times N=373
Multiple Values 13 (3%)
Demographics: Total Mo N=373
Missing/Null/DKR 16 (4%)
Multiple Values 32 (9%)
Demographics: DV N=373
Multiple Values 27 (7%)
Demographics: Inc N=373
Multiple Values 32 (9%)
Demographics: Health Ins N=373
Multiple Values 31 (8%)
Demographics: Empl N=373
Missing/Null/DK 273 (73%)
Demographics: Prior Living Situation N=373
Multiple Values 49 (13%)
Demographics: Education N=373
Multiple Values 36 (10%)
Exit Destination: Income at Exit N=349
Final Evaluation of the RRH 250 Program | Prepared for Valley of the Sun United Way by Focus Strategies | June 2017 | Page 70 of 71
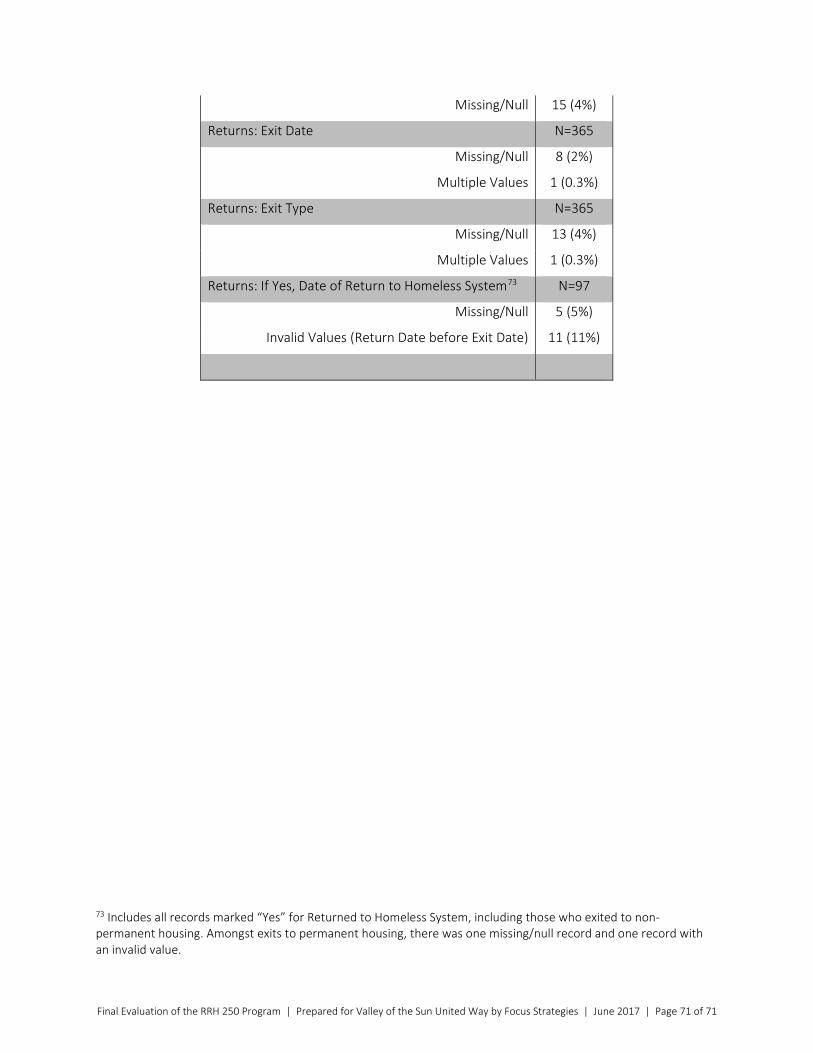
Missing/Null 15 (4%)
Returns: Exit Date N=365
Missing/Null 8 (2%)
Multiple Values 1 (0.3%)
Returns: Exit Type N=365
Missing/Null 13 (4%)
Multiple Values 1 (0.3%)
Returns: If Yes, Date of Return to Homeless System73 N=97
Missing/Null 5 (5%)
Invalid Values (Return Date before Exit Date) 11 (11%)
73 Includes all records marked “Yes” for Returned to Homeless System, including those who exited to non-permanent housing. Amongst exits to permanent housing, there was one missing/null record and one record with an invalid value.
Final Evaluation of the RRH 250 Program | Prepared for Valley of the Sun United Way by Focus Strategies | June 2017 | Page 71 of 71