valorisation of by-products from brewing and canned fish ... · hydrolysates with antihypertensive...
TRANSCRIPT

Valorisation of by-products from brewing and
canned fish industry: characterization of
hydrolysates with antihypertensive and antioxidant
activities
Thesis submitted to Universidade do Porto, in partial fulfillment of requirements for
the degree of Ph.D. in Sustainable Chemistry
Elsa Marisa Ferreira Vieira
Under the supervision of:
Prof. Dra. Isabel Maria Pinto Leite Viegas Oliveira Ferreira
co-supervision of:
Prof. Dra. Helena Maria Ferreira da Costa Ferreira Carmo
co-supervision of:
Cathedratic Professor Olívia Maria de Castro Pinho
Porto
May, 2016

ii
© AUTHORISED THE PARTIAL REPRODUCTION OF THIS THESIS (SUBJECT TO THE APPROVAL OF THE PUBLISHERS OF JOURNALS IN WHICH THE ARTICLES WERE PUBLISHED) ONLY FOR RESEARCH PURPOSES THROUGH A WRITTEN DECLARATION OF THE PERSON CONCERNED THAT SUCH PLEDGES.
iii
This work has been supported by Fundação para a Ciência e a Tecnologia (FCT)
through grant no. PEst-C/EQB/LA0006/2011 and to the PhD grant
(SFRH/BD/81845/2011) financed by Programa Operacional Potencial Humano -
Quadro de Referência Estratégico Nacional - Tipologia 4.1 - Formação Avançada
(POPH-QREN) subsidised by Fundo Social Europeu (FSE) and national funds from
Ministério da Ciência, Tecnologia e Ensino Superior (MCTES).
iv
The experimental work presented in this thesis was undertaken under the Ph.D.
Programme in Sustainable Chemistry (REQUIMTE), hosted by Universidade do
Porto and Universidade Nova de Lisboa. The experimental work was mainly
performed in the Laboratory of Bromatology and Hydrology, Department of Chemical
Sciences, Faculty of Pharmacy, University of Porto (Portugal).
v
ACKNOWLEDGEMENTS
I wish to express my deepest gratitude:
To my supervisor Professor Doctor Isabel Ferreira, co-supervisor Professor Doctor
Helena Carmo and co-supervisor Cathedratic Professor Olívia Pinho for the
opportunity to develop this project, as well, for the guidance provided during the
course of my Ph.D.
To Fundação para a Ciência e Tecnologia (FCT) by the PhD grant
(SFRH/BD/81845/2011) financed by Programa Operacional Potencial Humano -
Quadro de Referência Estratégico Nacional - Tipologia 4.1 - Formação Avançada
(POPH-QREN) subsidised by Fundo Social Europeu (FSE) and national funds from
Ministério da Ciência, Tecnologia e Ensino Superior (MCTES), which made possible
the accomplishment of the present work.
To Doctor José das Neves and Doctor Diana Dias da Silva for their collaboration in
the cell culture work. Thanks for their availability, guidance and concern
demonstrated during all the experimental work.
To Professor Doctor Rui Vitorino for his collaboration with the Mass Spectrometry
analysis in the Department of Chemistry, University of Aveiro. Thanks for the warm
welcoming and concern during the experimental work.
To Professor Doctor John Van Camp for accepting me in the Research Group Food
Chemistry and Human Nutrition (nutriFOODchem). Thanks for his invaluable
scientific input and fruitful discussions.
To Doctor Charlotte Grootaert for sharing her scientific knowledge with me and for
the direct laboratory supervision, precise guidelines, scientific accuracy and
friendship during my internship at nutriFOODchem laboratory, and not least, for her
expert proof-reading of manuscript.
To the collaborators from the Laboratory of Bromatology and Hydrology: Sara
Cunha, Armindo Melo e Edgar Pinto for their valuable scientific knowledge and
assistance in the development of parts of the experimental work.
vi
To Unicer - Bebidas de Portugal, S.A. (Leça do Balio, Portugal), in the name of its
production director, for providing the yeast surplus samples used in this study.
To Conservas Ramirez & Cia (Filhos), S.A. (Matosinhos, Portugal), in the name of
its production director, for providing the sardine by-product samples used in this
study.
To all my great researcher colleagues at the Department of Food Safety and Food
Quality in University of Gent (Belgium), for their warm welcome, full integration and
assistance during my internship at nutriFOODchem laboratory.
To all my special friends at the Laboratory of Bromatology and Hydrology: Francisca,
Sónia, Olga, Joana, Anabela C., Anabela B., Filipa and Antónia, for the support,
encouragement, exchange of knowledge and continuous presence during this
journey. Thanks for creating such a relaxing, pleasant and inspiring working
environment.
To my parents, my sister and José for the constant support and encouraging words
during the intense laboratory work in the course of my Ph.D. and during the last
period of writing process.
“Take these broken wings and learn to fly”
Paul McCartney

vii
ABSTRACT
A large amount of agro-industrial by-products is annually generated by canned
fish industry and brewing process - mostly brewer´s spent grain (BSG) and brewer´s
spent yeast (BSY). Since the main uses of these wastes are animal feed or
incineration, sustainable practices demand for economic and environmental
valorization. One possible approach is the recovery of protein fraction from these
by-products for production of autolysates/ hydrolysates with potential biological
properties and, thus, with greater commercial interest.
This PhD research work aimed to produce BSY autolysates, sardine protein
hydrolysates (SPH) and BSG protein hydrolysates with antioxidant and angiotensin-
I converting enzyme inhibitory (ACE-I) activities, with potential use as new bioactive
food ingredients. To achieve this purpose, a BSY extract was obtained by mechanic
disruption procedure to recover valuable compounds (enzymes, proteins, vitamins,
antioxidant compounds) and produce BSY autolysates, SPH and BSG protein
hydrolysates by the action of BSY proteases. The processing conditions for
autolysis/ hydrolysis were optimized by response surface methodology and
monitorization was performed by chromatographic, electrophoretic, hydrolysis
degree (DH) and/ or protein recovery analyses. Autolysate/ hydrolysates were
characterized in relation to proximate composition, molecular weight distribution and
hydrophobicity; the antioxidant activities were screened by chemical and/or cell-
based assays and the ACE-I was measured by a fluorimetric assay. Ultrafiltration
(UF) membranes were used to concentrate the bioactive fraction. In order to predict
the in vivo bioavailability of the bioactive compounds, the impact of gastrointestinal
(GI) digestion and the permeability through Caco-2 and Caco-2/HT29-MTX cell
models were also evaluated. Mass spectrometry was performed to confirm the
molecular mass range of compounds permeated in the transport assays.
Data showed that the BSY autolysate, produced at 36ºC for 6 h, at pH of 6,
presented TPC, FRAP and ACE-I activity (IC50) of 385 µM GAE/mL, 374 µM TE/mL
and 379 µg protein/mL, respectively. After simulated GI digestion, BSY autolysate
exhibited a protective effect against oxidative stress induced by hydrogen peroxide
in Caco-2 cells and good permeability through Caco-2 and Caco-2/HT29-MTX cell
models. Regarding to SPH production, data showed that sarcoplasmic proteins from
sardine by-products were effectively hydrolysed by BSY proteases. Under the
optimum hydrolysis conditions, E/S ratio 0.27:1 U/mg (0.725 U/mL), 50ºC for 7 h, at
pH of 6, sarcoplasmic SPH presented a FRAP value of 290 μM TE/mL and an ACE-

viii
I activity (IC50) of 164 µg protein/mL. These activities were enhanced by UF (10 kDa-
membrane). The ACE-I of SPH remained unchanged upon GI digestion (117 µg
protein/mL), but no ACE-I activity was detected after cell transport, suggesting the
degradation of ACE-I peptides by brush-border peptidases. Antioxidant activity
increased after GI digestion (344 μM TE/mL) and sarcoplasmic SPH bioactive
compounds permeated across Caco-2 and Caco-2/HT29-MTX co-culture cell
monolayers, providing further evidence of intestinal absorption. Additionally, Mass
spectrometry revealed that peptides with m/z between 1000 and 5000 were
transported across Caco-2/HT29-MTX co-culture cell monolayer, presumably via
transcytosis mechanisms. The sarcoplamic SPH also exhibited anti-inflammatory
activity in TNF-α simulated endothelial cells through the inhibition of NO, ROS and
pro-inflammatory cytokines production, MCP-1, VEGF, IL-8 and ICAM-1. In addition,
BSY proteases hydrolysed muscle and viscera proteins from sardine by-products,
but in a lesser extent compared with Alcalase® and Neutrase®. However, viscera
SPH prepared by BSY proteases presented significantly higher emulsion, foaming
and oil binding properties compared with other viscera SPH. Besides sardine
proteins (animal origin), BSY proteases efficiently hydrolysed the BSG proteins
(vegetal origin). Under the hydrolysis conditions optimized, E/S ratio of 0.29:1 U/mg
(0.725 U/mL), 50ºC, 6 h, at pH of 6.0, BSG protein hydrolysate presented DH of
17.1%, TPC of 1.65 mg GAE/mL and FRAP value of 1.88 mg TE/mL. The main BSY
proteases responsible for the BSG protein hydrolysis were indicated as belonging
to the class of serine peptidases and metallopeptidases. Compared with treatments
by commercial enzymes, BSY proteases were less efficient to hydrolyse the BSG
proteins; Alcalase® prompted the highest TPC (0.083 mg GAE/mg dw) and ACE-I
activity (385 µg protein/mL). Moreover, <10 kDa UF fractions inhibited the
intracellular ROS generation and exerted a protective ability against hydrogen
peroxide induced oxidative damage in Caco-2 and HepG2 cell lines, indicating its
potential use in food systems as natural antioxidants. Overall, this research
suggested that BSY autolysates, SPH and BSG protein hydrolysates can be
considered a high added-value ingredient with promising nutraceutical applications.
Keywords: Brewer´s spent yeast, brewer´s spent grain, sardine protein hydrolysate,
antioxidant activity, angiotensin- I converting enzyme.
ix
RESUMO
Anualmente são produzidas grandes quantidades de sub-produtos agro-alimentares
por parte das indústrias conserveira e cervejeira (levedura e dreche). Dado que as principais
aplicações destes sub-produtos são a alimentação animal e incineração, recomendam-se
práticas sustentáveis que promovam a sua valorização económica e ambiental. Uma
possível aplicação é a recuperação da fração proteica destes sub-produtos para produção
de autolisados/ hidrolisados com potenciais propriedades biológicas, e, por isso, com maior
interesse sob o ponto de vista comercial.
O trabalho desenvolvido nesta tese de doutoramento teve como objetivo a produção
de autolisados de levedura de cerveja, hidrolisados proteicos de sardinha e hidrolisados
proteicos da dreche, com atividades antioxidante e de inibição da enzima conversora da
angiotensina I (ECA), para potencial uso como ingredientes bioativos na indústria alimentar.
De forma a atingir estes objetivos, extratos de levedura de cerveja foram obtidos por
disrupção mecânica para recuperar os compostos biológicos (enzimas, proteínas, vitaminas,
compostos antioxidantes) e utilizar as proteases na produção dos referidos autolisados/
hidrolisados. As condições de autólise/ hidrólise foram otimizadas por metodologia de
superfície de resposta e a monitorização dos processos foi avaliada por métodos de
cromatografia, eletroforese, grau de hidrólise (GH) e recuperação da proteína. Os
autolisados/ hidrolisados foram caracterizados relativamente à sua composição nutricional,
distribuição dos pesos moleculares e hidrofobicidade; as atividades antioxidantes foram
avaliadas for ensaios químicos e por modelos celulares e a atividade inibitória da ECA foi
avaliada por um método fluorimétrico. A ultrafiltração (UF) foi empregue para concentrar a
fração bioativa. A biodisponibilidade dos compostos bioativos foi avaliada através dos
ensaios de simulação da digestão gastrointestinal (GI) e de transporte intestinal através de
dois modelos celulares: Caco-2 e co-cultura Caco-2/HT29-MTX.
Os resultados mostraram que o autolisado de levedura de cerveja, produzido a 36ºC
por 6 h, a pH 6, apresentou um teor de fenólicos totais (FT), FRAP e inibição da ECA (IC50)
de 385 µM GAE/mL, 374 µM TE/mL e 379 µg proteína/mL, respetivamente. Após simulação
da digestão GI, o autolisado de levedura de cerveja exibiu um efeito protetor contra o stress
oxidativo induzido por peróxido de hidrogénio nas células Caco-2 e uma boa permeabilidade
através das monocamadas celulares Caco-2 e Caco-2/HT29-MTX. Relativamente à
produção de hidrolisados proteicos de sardinha, os resultados evidenciaram que as
proteínas sarcoplasmáticas extraídas dos sub-produtos de sardinha foram eficazmente
hidrolisadas pelas proteases da levedura de cerveja. Aplicando as condições de hidrólise
otimizadas, relação enzima substrato de 0.27:1 U/mg (0.725 U/mL), 50ºC por 7 h, a pH 6,
os hidrolisados de proteínas sarcoplasmáticas apresentaram um valor de FRAP de 290 μM
TE/mL e uma atividade de inibição da ECA de 164 µg proteína/mL. Ambas as atividades
foram melhoras por UF (membrana de 10 kDa). Apesar da atividade inibitória da ECA do
x
hidrolisado de proteínas sarcoplasmáticas de sardinha não ter sido alterada após a
simulação da digestão GI (117 µg proteína/mL), esta propriedade não foi detetada após o
transporte celular; este resultado sugere que os compostos bioativos que atravessaram as
monocamadas Caco-2 e Caco-2/HT29-MTX foram degradados pelas peptidases da
bordadura em escova. A atividade antioxidante também aumentou após o ensaio de
simulação da digestão GI e os compostos bioativos atravessaram as monocamadas Caco-
2 e Caco-2/HT29-MTX, evidenciando potencial absorção intestinal in vivo. Adicionalmente,
os resultados de espectrometria de massa mostraram que péptidos com m/z entre 1000-
5000 atravessaram a monocamada Caco-2/HT29-MTX, provavelmente por mecanismos de
transcitose. O hidrolisado de proteínas sarcoplasmáticas de sardinha também apresentou
propriedades anti-inflamatórias em células endoteliais estimuladas pelo fator de necrose
tumoral (TNF-α), visível pelos resultados de inibição da produção de óxido nítrico, espécies
reativas de oxigénio e das citocinas pro-inflamatórias MCP-1, VEGF, IL-8 and ICAM-1. As
proteases do extrato de levedura também conseguiram hidrolisar as proteínas musculares
e viscerais dos sub-produtos de sardinha, embora de forma menos eficaz quando esta
hidrólise foi comparada com a promovida pelas enzimas comerciais Alcalase® e Neutrase®.
Contudo, comparativamente aos outos hidrolisados de proteínas viscerais, o tratamento
com proteases da levedura de cerveja produziu hidrolisados com melhores propriedades de
emulsão, formação de espuma e capacidade de retenção de gordura. Adicionalmente estas
proteases também conseguiram hidrolisar as proteínas da dreche (origem vegetal).
Aplicando as condições de hidrólise otimizadas, relação enzima substrato de 0.29:1 U/mg
(0.725 U/mL), 50ºC por 6 h, a pH 6, os hidrolisados proteicos da dreche apresentaram um
GH de 17.1%, TF de 1.65 mg GAE/mL e um valor de FRAP de 1.88 mg TE/mL. Os resultados
apontam que as principais proteases responsáveis por esta hidrólise pertencem à classe
das peptidases de serina e metaloproteases. No estudo comparativo da hidrólise das
proteínas da dreche com proteases comerciais, as proteases da levedura de cerveja
revelaram menor eficácia; contrariamente o tratamento com Alcalase® produziu
hidrolisados com maior teor em FT (0.083 mg GAE/mg peso seco) e atividade inibitória da
ECA (385 µg proteína/mL). Além disso, a fração menor de 10 kDa inibiu a produção de
espécies reativas de oxigénio e exerceu um efeito protetor contra o stress oxidativo induzido
por peróxido de hidrogénio nas linhas celulares Caco-2 e HepG2.
Em conclusão, este estudo sugere que os autolisados de levedura de cerveja,
hidrolisados proteicos de sardinha e hidrolisados proteicos da dreche podem ser
considerados ingredientes bioativos, apresentando promissoras aplicações na área dos
nutracêuticos.
Palavras-chave: autolisados de levedura de cerveja, hidrolisados proteicos de sardinha e
hidrolisados proteicos da dreche, atividade antioxidante, atividade inibitória da enzima
conversora da angiotensina.

xi
LIST OF PUBLICATIONS
The information present in this dissertation was submitted to international peer
reviewing, toward publication in international scientific journals and some of them
were presented as oral / poster communications in scientific meetings, as detailed
next:
Publications in international peer-review journals
1. Elsa F. Vieira, Joana Carvalho, Edgar Pinto, Sara C. Cunha, Agostinho A.
Almeida, Isabel M.P.L.V.O. Ferreira. (2016). Nutritive value, antioxidant activity
and phenolic compounds profile of Brewer’s spent yeast extract. (submitted).
2. Elsa F. Vieira, Sara C. Cunha, Isabel M.P.L.V.O. Ferreira. (2016). A bioactive
ingredient obtained from the inner cellular content of Brewer´s spent yeast.
(submitted).
3. Elsa F. Vieira, Armindo Melo, Isabel M.P.L.V.O. Ferreira. (2016). Autolysis of
intracellular content of brewer`s spent yeast to maximize ACE-inhibitory and
antioxidant activities. (submitted).
4. Elsa F. Vieira, José das Neves, Rui Vitorino, Diana Dias da Silva, Helena Carmo,
Isabel M.P.L.V.O. Ferreira. (2016). Impact of in vitro gastrointestinal digestion
and transepithelial transport on antioxidant and ACE-inhibitory activities of
brewer´s spent yeast autolysate. (submitted).
5. Elsa F. Vieira, Isabel M.P.L.V.O. Ferreira (2016). Antioxidant and
antihypertensive hydrolysates obtained from by-products of cannery sardine and
brewing industries. International Journal of Food Properties.
DOI:10.1080/10942912.2016.1176036.
6. Elsa F. Vieira, José das Neves, Rui Vitorino, Isabel M.P.L.V.O. Ferreira. (2016).
Simulated gastrointestinal digestion and in vitro intestinal permeability of
bioactive protein hydrolysates obtained from canned sardine and brewing by-
products. (submitted).
7. Elsa F. Vieira, John Van Camp, Isabel M.P.L.V.O. Ferreira, Charlotte Grootaert.
(2016). Anti-inflammatory activity of a hydrolysate from canned sardine and
brewing by-products through inhibition of TNF-a-induced endothelial dysfunction
in a co-culture model of Caco-2 and endothelial cells. (submitted).
8. Elsa F. Vieira, Olívia Pinho, Isabel M.P.L.V.O. Ferreira (2016). Characterization
of hydrolysates obtained from muscle and viscera proteins of canned sardine
by-products. (submitted).

xii
9. Elsa F. Vieira, M. Angélica M. Rocha, Elisabete Coelho, Olívia Pinho, Jorge A.
Saraiva, Isabel M.P.L.V.O. Ferreira, Manuel A. Coimbra. (2014). Valuation of
brewer's spent grain using a fully recyclable integrated process for extraction of
proteins and arabinoxylans. Industrial Crops and Products, 52, 136-143.
10. Elsa F. Vieira, Juliana Teixeira, Isabel M.P.L.V.O. Ferreira. (2016). Valorisation
of brewers’ spent grain and spent yeast through protein hydrolysates with
antioxidant properties. European Food Research and Technology. DOI:
10.1007/s00217-016-2696-y.
11. Elsa F. Vieira, Diana Dias da Silva, Helena Carmo, Isabel M.P.L.V.O. Ferreira.
(2016). Antioxidant and ACE inhibitory activities of hydrolysates of brewers'
spent grain proteins by proteases from spent yeast or by commercial enzymes:
protective capacity in Caco-2 and HepG2 cells. (submitted).
Oral Communications in Scientific Meetings
1. Tiago Almeida, Cristina Moura, Elsa F. Vieira, Olívia Pinho, Isabel M.P.L.V.O.
Ferreira. (2012). “Proteolytic activity of surplus yeast extracts”. 5th Meeting of
Young Researchers of University of Porto (IJUP2012), Porto, Portugal.
2. Joana Carvalho, Elsa F. Vieira, Sónia Meireles, Tiago Brandão, Isabel
M.P.L.V.O. Ferreira. (2014). “Effect of serial repitching on proteolytic and
bioactive properties of brewer`s spent yeast extracts: storage stability
evaluation”. 7th Meeting of Young Researchers of University of Porto (IJUP2014).
Porto, Portugal.
3. Elsa F. Vieira, Isabel M.P.L.V.O. Ferreira. (2015). “Intestinal transport of sardine
(Sardine pichardus) protein hydrolysate prepared from action of Saccharomyces
brewing yeast surplus proteases - assessment of antioxidant and ACE-inhibitory
activities”. 15th International Nutritional & Diagnostics Conference, Prague,
Czech Republic.
4. Elsa F. Vieira, Sandra J. Vieira, Isabel M.P.L.V.O. Ferreira. (2015). “Optimization
of brewer´s spent grain protein hydrolysis by proteases from Saccharomyces
brewing surplus using Response Surface Methodology”. Euro Food Chem XVIII
Conference, Madrid, Spain.

xiii
Poster Communications in Scientific Meetings
1. Elsa F. Vieira, Isabel M.P.L.V.O. Ferreira. (2014). “Optimization by RSM of
enzymatic proteolysis of sardine sarcoplasmic protein hydrolysates (Sardina
pilchardus) produced by proteases from Saccharomyces brewing by-product
and evaluation of potential antioxidant and ACE inhibitory activities”. The 2014
Belgian Peptide Group Meeting, Ghent, Belgium.
2. Elsa F. Vieira, José das Neves, Isabel M.P.L.V.O Ferreira. (2014). “Simulated
gastrointestinal digestion and in vitro intestinal absorption of potential antioxidant
and ACE inhibitory peptides from Saccharomyces brewing by-product extract”.
Total Food Conference 2014 science and technology for the economic and
sustainable exploitation of agri-food chain wastes and co-products, Norwich,
United Kingdom.
3. Elsa F. Vieira, Isabel M.P.L.V.O Ferreira. (2015). “Comparison of functional,
antioxidant and ACE-inhibitory activities of sardine (Sardinella pilchardus)
viscera protein hydrolysates using proteases from brewers' yeast surplus
(Saccharomyces pastorianus) and commercial proteases”. 15th International
Nutritional & Diagnostics Conference, Prague, Czech Republic.
4. Elsa F. Vieira, Teixeira J., Isabel M.P.L.V.O. Ferreira. (2015). “Valuation of spent
brewer´s yeast as natural source of proteases and bioactive compounds:
Influence of serial repitching”. Euro Food Chem XVIII Conference, Madrid,
Spain.

xiv
xv
TABLE OF CONTENTS
ACKNOWLEDGEMENTS ....................................................................................... v
ABSTRACT .......................................................................................................... vii
RESUMO .............................................................................................................. ix
LIST OF PUBLICATIONS ...................................................................................... xi
TABLE OF CONTENTS ....................................................................................... xv
LIST OF FIGURES ............................................................................................. xxiv
LIST OF ABBREVIATIONS ................................................................................ xxix
Motivation and research aims ................................................................................. 1
Thesis outline ......................................................................................................... 5
PART I
“Brewer´s spent yeast extracts”
CHAPTER 1 ........................................................................................................ 11
Literature review
Brewer`s spent yeast: potential source of biological compounds and proteases for
application in the production of food hydrolysates
1.1. Brewer`s spent yeast ..................................................................................... 13
1.1.1. By-product ............................................................................................. 13
1.1.2. Nutritional composition ........................................................................... 13
1.1.3. Antioxidant system ................................................................................. 15
1.1.4. Enzymatic system .................................................................................. 17
1.1.5. Potential applications ............................................................................. 18
1.2. Production of BSY extract ............................................................................. 20
1.3. Biological activities of BSY extract ................................................................. 23
1.4. Screening methods to search for autolysates/ hydrolysates bioactivity .......... 25
1.4.1. In vitro antioxidant chemical activity ....................................................... 26
1.4.2. Antihypertensive activity ......................................................................... 28
1.5. Bioavailability methods .................................................................................. 31
1.5.1. Simulated GI digestion ........................................................................... 31
1.5.2. Cell culture systems ............................................................................... 31
1.5.3. In vivo assays ........................................................................................ 34
xvi
CHAPTER 2 ........................................................................................................ 35
Nutritive value, antioxidant activity and phenolic compounds profile of Brewer’s
spent yeast extract
ABSTRACT .......................................................................................................... 37
2.1. INTRODUCTION ........................................................................................... 37
2.2. MATERIAL AND METHODS ......................................................................... 38
2.2.1. Reagents and standards ........................................................................ 38
2.2.2. Samples ................................................................................................. 39
2.2.3. BSY extract preparation ......................................................................... 39
2.2.4. Proximate composition ........................................................................... 39
2.2.5. Amino acid composition and chemical score .......................................... 39
2.2.6. Analyses of minerals .............................................................................. 40
2.2.6.1. Sample preparation ..................................................................................... 40
2.2.6.2. Inductively coupled plasma mass spectrometry analysis ....................................... 40
2.2.6.3. Atomic absorption spectrometry analysis .......................................................... 40
2.2.7. Analysis of B-complex vitamins .............................................................. 40
2.2.7.1. Extraction of B-complex vitamins .................................................................... 40
2.2.7.2. Preparation of B-complex vitamins standard solution ........................................... 41
2.2.7.3. Chromatographic conditions for separation of B-complex vitamins ........................... 41
2.2.8. Antioxidant activity of BSY extracts ........................................................ 41
2.2.8.1. Ferric reducing antioxidant potential (FRAP) assay .............................................. 41
2.2.8.2. DPPH radical scavenging capacity assay .......................................................... 42
2.2.8.3. Ferricyanide reducing power (RP) assay ........................................................... 42
2.2.9. Extraction of phenolic compounds .......................................................... 42
2.2.9.1. HPLC analysis of phenolic compounds ............................................................. 42
2.3. RESULTS AND DISCUSSION....................................................................... 43
2.3.1. Nutritional composition of BSY extracts .................................................. 43
2.3.1.1. Amino acid composition ................................................................................ 43
2.3.1.2. Minerals content ......................................................................................... 45
2.3.1.3. B-complex vitamins content ........................................................................... 45
2.3.2. Antioxidant activity ................................................................................. 46
2.3.3. Phenolic compounds .............................................................................. 46
2.4. CONCLUSIONS ............................................................................................ 48
CHAPTER 3 ........................................................................................................ 49
A bioactive ingredient obtained from the inner cellular content of Brewer´s spent
yeast
ABSTRACT .......................................................................................................... 51
3.1. INTRODUCTION ........................................................................................... 51
3.2. MATERIAL AND METHODS ......................................................................... 53
3.2.1. Chemicals, reagents and equipments .................................................... 53
3.2.2. Samples ................................................................................................. 53
3.2.3. Preparation of BSY extracts ................................................................... 53
3.2.4. Proximate composition ........................................................................... 54

xvii
3.2.5. Sodium dodecyl sulfate polyacrylamide gel electrophoresis ................... 54
3.2.6. Amino acid composition and chemical score of BSY extract proteins ..... 55
3.2.7. Determination of biological properties of BSY extracts ........................... 55
3.2.7.1. Enzyme activity assay ................................................................................. 55
3.2.7.2. Total phenolic content (TPC) and total flavonoid content (TFC) .............................. 55
3.2.7.3. Antioxidant activity of BSY extracts ................................................................. 56
3.2.7.4. ACE-I activity ............................................................................................ 56
3.2.8. Effect of storage conditions on the stability of BSY biological properties 57
3.2.9. Statistical analysis .................................................................................. 57
3.3. RESULTS AND DISCUSSION ...................................................................... 57
3.3.1. Proximate composition of freeze-dry BSY extracts ................................. 57
3.3.2. Amino acid composition of BSY protein fraction ..................................... 58
3.3.3. Molecular weight distribution of BSY extract protein fraction .................. 59
3.3.4. Proteolytic activity of BSY extracts ......................................................... 61
3.3.5. TPC, TFC and antioxidant activity of BSY extracts ................................. 62
3.3.6. ACE-I activity of BSY extracts ................................................................ 64
3.3.7. Stability of biological activity of frozen BSY extracts ............................... 64
3.4. CONCLUSIONS ............................................................................................ 66
CHAPTER 4 ........................................................................................................ 67
Autolysis of intracellular content of brewer`s spent yeast to maximize ACE-inhibitory
and antioxidant activities
ABSTRACT .......................................................................................................... 69
4.1. INTRODUCTION ........................................................................................... 69
4.2. MATERIAL AND METHODS ......................................................................... 70
4.2.1. Reagents ............................................................................................... 70
4.2.2. Brewer’s spent yeast (BSY) extract ........................................................ 70
4.2.3. Autolysis of BSY extract ......................................................................... 71
4.2.4. Analytical Methods ................................................................................. 71
4.2.4.1. Determination of Total Phenolic content ......................................................................... 71
4.2.4.2. Determination of Ferric Ion Reducing Antioxidant Power ............................................... 71
4.2.4.3. Determination of ACE-I activity ....................................................................................... 71
4.2.5. Experimental design, modelling and optimization of autolysis conditions 72
4.2.6. Statistical analysis .................................................................................. 72
4.3. RESULTS AND DISCUSSION ...................................................................... 72
4.3.1. Experimental design .............................................................................. 72
4.3.2. Analysis of response surfaces................................................................ 76
4.3.3. Validation of the RSM model .................................................................. 78
4.4. CONCLUSIONS ............................................................................................ 79

xviii
CHAPTER 5 ........................................................................................................ 81
Impact of in vitro gastrointestinal digestion and transepithelial transport on
antioxidant and ACE-inhibitory activities of brewer´s spent yeast autolysate
ABSTRACT .......................................................................................................... 83
5.1. INTRODUCTION ........................................................................................... 83
5.2. MATERIAL AND METHODS ......................................................................... 84
5.2.1. Reagents and cells ................................................................................. 84
5.2.2. Equipments ............................................................................................ 85
5.2.3. Preparation of BSY autolysates and in vitro GI digestion ........................ 85
5.2.4. In vitro biological activity ......................................................................... 86
5.2.5. Cell-based assays .................................................................................. 86
5.2.5.1. Cell culture maintenance and generation of cell monolayers ...........................................86
5.2.5.2. Cell viability determination ...............................................................................................86
5.2.5.3. Mitochondrial integrity determination ...............................................................................87
5.2.5.4. ROS levels production .....................................................................................................87
5.2.5.5. Permeability experiments ................................................................................................88
5.2.6. Peptide analyses by RP-HPLC and by MALDI-TOF ............................... 89
5.2.7. Statistical analysis .................................................................................. 89
5.3. RESULTS AND DISCUSSION....................................................................... 89
5.3.1. Impact of in vitro GI digestion of BSY autolysate biological activity ........ 89
5.3.2. Intestinal permeability of peptides from BSY autolysate ......................... 92
5.3.3. Biological activity of BSY permeates ...................................................... 98
5.4. CONCLUSIONS ............................................................................................ 99
PART II
“Sardine protein hydrolysates”
CHAPTER 6 ...................................................................................................... 103
Literature review
Development of sardine protein hydrolysates and their health promoting ability
6.1. Canned sardine industry .............................................................................. 105
6.2. Nutritional composition of sardine by-product .............................................. 105
6.3. Potential applications of SPH ....................................................................... 106
6.4. Preparation of SPH ...................................................................................... 107
6.4.1. Preparation of Sardine Protein concentrate (SPC) ............................... 107
6.4.2. Protein hydrolysis ................................................................................. 109
6.4.3. SPH concentration and purification ...................................................... 110
6.4.4. Identification of bioactive peptides from SPH........................................ 111
6.5. Nutritional composition of SPH .................................................................... 111
6.6. Bioactivities of SPH and derived peptides .................................................... 113
6.7. Functional properties of SPH ....................................................................... 113
xix
6.7.1. Solubility .............................................................................................. 113
6.7.2. Emulsifying properties .......................................................................... 114
6.7.3. Foaming ............................................................................................... 114
6.7.4. Water binding capacity ......................................................................... 115
6.7.5. Oil binding capacity .............................................................................. 115
CHAPTER 7 ...................................................................................................... 121
Antioxidant and antihypertensive hydrolysates obtained from by-products of cannery
sardine and brewing industries
ABSTRACT ........................................................................................................ 123
7.1. INTRODUCTION ......................................................................................... 123
7.2. MATERIAL AND METHODS ....................................................................... 124
7.2.1. Standards and reagents ....................................................................... 124
7.2.2. Equipment............................................................................................ 125
7.2.3. By-products .......................................................................................... 125
7.2.4. Preparation of the Sardine sarcoplasmic protein extracts (SPE) .......... 125
7.2.5. Extraction of Brewer´s spent yeast (BSY) proteases ............................ 126
7.2.6. Enzymatic hydrolysis ........................................................................... 126
7.2.7. Hydrolysis rate (HR %)......................................................................... 126
7.2.8. Protein recovery (PR %) and % of peptides formed ............................. 127
7.2.9. Degree of hydrolysis (DH %) ................................................................ 127
7.2.10. Ferric reducing ability (FRAP) ............................................................ 127
7.2.11. Reducing power method (RP) ............................................................ 128
7.2.12. ACE-I activity ..................................................................................... 128
7.2.13. SDS-Polyacrylamide gel electrophoresis (SDS-PAGE) ...................... 128
7.2.14. SPH amino acid composition ............................................................. 128
7.2.15. Experimental design, modelling and optimization ............................... 129
7.2.16. Statistical analysis .............................................................................. 129
7.3. RESULTS AND DISCUSSION .................................................................... 129
7.3.1. Optimization of hydrolysis conditions ................................................... 131
7.3.2. Analysis of response surfaces.............................................................. 133
7.3.3. Validation of RSM model ...................................................................... 133
7.3.4. Characterization of SPH obtained under optimum conditions ............... 134
7.4. CONCLUSIONS .......................................................................................... 136
CHAPTER 8 ...................................................................................................... 137
Simulated gastrointestinal digestion and in vitro intestinal permeability of bioactive
protein hydrolysates obtained from canned sardine and brewing by-products
ABSTRACT ........................................................................................................ 139
8.1. INTRODUCTION ......................................................................................... 139
8.2. MATERIAL AND METHODS ....................................................................... 140
8.2.1. Materials and cells ............................................................................... 140
xx
8.2.2. By-products .......................................................................................... 141
8.2.3. Preparation and fractionation of SPH ................................................... 141
8.2.4. In vitro Simulated GI Digestion ............................................................. 141
8.2.5. Ferric reducing antioxidant potential (FRAP) assay .............................. 142
8.2.6. ACE-I activity assay ............................................................................. 142
8.2.7. Cell viability study ................................................................................. 143
8.2.8. Permeability experiments ..................................................................... 143
8.2.9. Reversed-phase high performance liquid chromatography ................... 144
8.2.10. Mass spectrometry ............................................................................. 145
8.2.11. Statistical analysis .............................................................................. 145
8.3. RESULTS AND DISCUSSION..................................................................... 145
8.3.1. Effect of Ultrafiltration on biological activities of SPH ............................ 145
8.3.2. Effect of simulated GI digestion on bioactivities of SPH<10 kDa .......... 146
8.3.3. Cellular viability of SPH.GI<10 kDa ...................................................... 147
8.3.4. Intestinal permeability of SPH.GI<10 kDa ............................................ 148
8.3.5. Effect of intestinal transport on the bioactivity of SPH.GI<10 kDa ......... 154
8.4. CONCLUSIONS .......................................................................................... 154
CHAPTER 9 ...................................................................................................... 155
Anti-inflammatory activity of a hydrolysate from canned sardine and brewing by-
products through inhibition of TNF-a-induced endothelial dysfunction in a co-culture
model of Caco-2 and endothelial cells
ABSTRACT ........................................................................................................ 157
9.1. INTRODUCTION ......................................................................................... 157
9.2. MATERIAL AND METHODS ....................................................................... 159
9.2.1. Reagents and standards and cells ....................................................... 159
9.2.2. By-products .......................................................................................... 159
9.2.3. Preparation of SPH .............................................................................. 159
9.2.4. Desalting of SPH .................................................................................. 160
9.2.5. Protein content ..................................................................................... 160
9.2.6. Cell culture routine ............................................................................... 160
9.2.7. Cell viability experiments ...................................................................... 160
9.2.8. In vitro cell culture models .................................................................... 161
9.2.9. Exposure to TNF-α to induce endothelial inflammation ......................... 162
9.2.9.1. Cell viability study ......................................................................................................... 162
9.2.9.2. Determination of intracellular reactive oxygen species (ROS) ............................... 162
9.2.9.3. Inhibition of NO production ........................................................................................... 162
9.2.9.4. Inhibition of pro-inflammatory cytokines production ...................................................... 163
9.2.10. Statistical analysis .............................................................................. 163
9.3. RESULTS .................................................................................................... 163
9.3.2. Establishment of the co-culture model .................................................. 164
9.3.3. Effects on viability of endothelial cells .................................................. 164
9.3.4. Effects on NO production in endothelial cells........................................ 166
9.3.5. Effects on ROS levels in endothelial cells ............................................. 167
9.3.6. Effects on inflammation markers expression ........................................ 167

xxi
9.4. DISCUSSION .............................................................................................. 172
9.5. CONCLUSIONS .......................................................................................... 173
CHAPTER 10 .................................................................................................... 175
Characterization of hydrolysates obtained from muscle and viscera proteins of
canned sardine by-products
ABSTRACT ........................................................................................................ 177
10.1. INTRODUCTION ....................................................................................... 177
10.2. MATERIAL AND METHODS ..................................................................... 178
10.2.1. Reagents and standards .................................................................... 178
10.2.2. Equipments ........................................................................................ 179
10.2.3. Sardine by-products and proteolytic enzymes .................................... 179
10.2.4. Hydrolyses of muscle and viscera proteins ........................................ 179
10.2.5. Determination of DH% and molecular weight profile of hydrolysates .. 180
10.2.6. Proximate composition ....................................................................... 180
10.2.7. Determination of antioxidant and ACE-I activities ............................... 180
10.2.8. Determination of techno-functional properties .................................... 181
10.2.9. Colour measurement ......................................................................... 181
10.2.10. Statistical analysis ............................................................................ 181
10.3. RESULTS AND DISCUSSION .................................................................. 182
10.3.1. DH and molecular weight distribution profile of SPH .......................... 182
10.3.2. Protein and lipid content of SPH ........................................................ 182
10.3.3. Determination of antioxidant and ACE-I activities ............................... 184
10.3.4. Techno-functional properties of SPH .................................................. 185
10.3.4.1. Solubility ..................................................................................................................... 185
10.3.4.2. Emulsifying properties ................................................................................................ 186
10.3.4.3. Foaming properties ..................................................................................................... 187
10.3.4.4. Water Binding Capacity (WBC) ................................................................................... 188
10.3.4.5. Oil Binding Capacity (OBC) ........................................................................................ 188
10.3.5. Colour of SPH .................................................................................... 190
10.4. CONCLUSIONS ........................................................................................ 190
xxii
PART III
“Brewer´s spent grain protein hydrolysates”
CHAPTER 11 .................................................................................................... 193
Literature review
Development of brewer´s spent grain protein hydrolysates and their health
promoting ability
11.1. Brewer`s spent grain by-product:characteristics and potential applications 195
11.2. Preparation of Brewer´s spent grain protein hydrolysates .......................... 199
11.2.1. Extraction of BSG proteins ................................................................. 199
11.2.2. Hydrolysis of BSG proteins ................................................................. 199
11.3. Biological properties of BSG protein hydrolysate ....................................... 200
CHAPTER 12 .................................................................................................... 205
Valorisation of Brewers’ spent grain and spent yeast through protein hydrolysates
with antioxidant properties
ABSTRACT ........................................................................................................ 207
12.1. INTRODUCTION ....................................................................................... 207
12.2. MATERIAL AND METHODS...................................................................... 208
12.2.1. By-products ........................................................................................ 208
12.2.2. Reagents ............................................................................................ 209
12.2.3. Apparatus ........................................................................................... 209
12.2.4. Preparation of BSY proteases ............................................................ 209
12.2.5. Preparation of BSG protein fraction .................................................... 210
12.2.6. Enzymatic Hydrolysis ......................................................................... 210
12.2.6.1. Experimental Design................................................................................................... 210
12.2.6.2. Determination of DH% and HR% ................................................................................ 211
12.2.6.3. Determination of total phenolic content (TPC) ............................................................ 211
12.2.6.4. Ferric Ion Reducing Antioxidant Power (FRAP) assay ............................................... 211
12.2.7. Effect of potential inhibitors of BSY proteases .................................... 212
12.2.8. Statistical analysis .............................................................................. 213
12.3. RESULTS AND DISCUSSION ................................................................... 213
12.3.1. Influence of pH on solubility and hydrolysis of BSG protein fraction ... 213
12.3.2. Central composite design and response surface method ................... 214
12.3.3. The effect of temperature, time and E/S ratio on the response value . 215
12.3.4. Validation of the RSM model .............................................................. 219
12.3.5. Hydrolysis monitoring by RP-HPLC .................................................... 219
12.3.6. Effect of potential natural inhibitors of BSY proteases ........................ 220
12.3.7. Effect of potential inhibitors of BSY proteases ................................... 221
12.4. CONCLUSIONS ........................................................................................ 222
xxiii
CHAPTER 13 .................................................................................................... 223
Antioxidant and ACE inhibitory activities of hydrolysates of brewers' spent grain
proteins by proteases from spent yeast or by commercial enzymes: protective
capacity in Caco-2 and HepG2 cells
ABSTRACT ........................................................................................................ 225
13.1. INTRODUCTION ....................................................................................... 225
13.2. MATERIAL AND METHODS ..................................................................... 226
13.2.1. Reagents and cells ............................................................................ 226
13.2.2. Equipments ........................................................................................ 227
13.2.3. BSG protein extraction ....................................................................... 227
13.2.4. BSY proteases and commercial enzymes .......................................... 227
13.2.5. Preparation of Brewers' spent grain protein hydrolysates ................... 228
13.2.6. Determination of DH% and PR % ...................................................... 228
13.2.7. Characterization of BSG protein hydrolysates .................................... 230
13.2.7.1. Proximate composition analysis .................................................................................. 230
13.2.7.2. Molecular weight distribution profile ............................................................................ 230
13.2.7.3. Proteins and peptides profile ...................................................................................... 230
13.2.8. Ultrafiltration of BSG protein hydrolysates .......................................... 230
13.2.9. ACE-I activity ..................................................................................... 231
13.2.10. Chemical antioxidant activities ......................................................... 231
13.2.11. Cell-based antioxidant activities ....................................................... 231
13.2.11.1. Cell culture routine .................................................................................................... 231
13.2.11.2. Samples preparation to cell culture studies .............................................................. 232
13.2.11.3. Cell viability determination ........................................................................................ 232
13.2.11.4. Mitochondrial integrity determination ........................................................................ 232
13.2.11.5. ROS production ........................................................................................................ 233
13.2.12. Statistical analysis ............................................................................ 233
13.3. RESULTS AND DISCUSSION .................................................................. 234
13.3.1. Measuring the extent of hydrolysis ..................................................... 234
13.3.2. Proximate composition of BSG protein hydrolysates .......................... 234
13.3.3. Molecular weight distribution and peptides/proteins profile ................. 235
13.3.4. Effect of UF on ACE-I activity of BSG protein hydrolysates ................ 237
13.3.5. Effect of UF on antioxidant activity of BSG protein hydrolysates ........ 238
13.3.6. Cellular antioxidant activities .............................................................. 239
13.4. CONCLUSIONS ........................................................................................ 242
GENERAL CONCLUSIONS ............................................................................... 245
FUTURE PROSPECTS ...................................................................................... 251
BIBLIOGRAFIC REFERENCES ......................................................................... 257
xxiv
LIST OF FIGURES
Figure i.1. Recovery of added value compounds from brewing and canned sardine
agro-industrial by-products for production of SPH and BSG protein hydrolysates. .. 3
Figure i.2. Schematic overview of the organization of this thesis, with indication of
the different chapters included in each part (I, II and III). ........................................ 7
Figure 1.1. Microscopic structure of yeast cell and proximate composition (% dw) of
BSY.. .................................................................................................................... 14
Figure 1.2. Classes of natural antioxidants of yeast cells.. .................................... 16
Figure 1.3. Classification of disruption techniques ................................................ 20
Figure 1.4. Yeast wall mechanical disruption, using glass beads, applied at
laboratorial scale. ................................................................................................. 22
Figure 1.5. Physiological effects of food derived bioactive peptides on major body
systems. ............................................................................................................... 25
Figure 1.6. Polarized epithelial cells with different types of intercellular contacts and
different absorption and transport mechanisms of compounds through intestinal
epithelium membrane ........................................................................................... 32
Figure 1.7. Two-chamber transwell transport model ............................................. 33
Figure 3.1. SDS-PAGE profiles of BSY extracts ................................................... 61
Figure 3.2. Biological activities stability of MIST BSY extract, stored at -25ºC for 6
months. ................................................................................................................ 65
Figure 4.1. Response surface and contour plots for interaction effects of temperature
(ºC) and time (h) autolysis on Total phenolics (A), FRAP (B) and ACE-I activity
(C). ....................................................................................................................... 77
Figure 4.2. Response surface and contour plots for interaction effects of temperature
(ºC) and time (h) autolysis on the desirability index for combined responses of BSY
autolysate. ............................................................................................................ 79
Figure 5.1. Cell viability (%) (A) and TMRE mitochondrial inclusion (%) (B) after 24
h of exposure (37ºC, 5% CO2) to digested BSY autolysate at different protein
concentrations ...................................................................................................... 91
Figure 5.2. Protective effect of the digested BSY autolysate on ROS levels after 24
h of exposure (37ºC, 5% CO2) at different protein concentrations (mg/mL) under no
stress treatment (A) and after oxidative stress induced by hydrogen peroxide (6 h
exposure) (B) ........................................................................................................ 92
Figure 5.3. RP-HPLC chromatographic profile of digested BSY autolysate before (0
min) and after permeability (180 min) through Caco-2 cell monolayers (A) and Caco-
2/HT29 co-culture cell monolayers (B) . ................................................................ 93
Figure 5.4. MALDI-TOF mass spectra of digested BSY autolysate added to the
apical compartment at the beginning of transport experiment (A) and five

xxv
concentrated permeate taken from the basolateral compartment after 180 min of a
permeability experiment across Caco-2/HT29-MTX co-culture cell monolayer
(B). ....................................................................................................................... 94
Figure 5.5. Comparative in vitro cumulative permeability of BSY peptides across
Caco-2 cell monolayers (A) and Caco-2/HT29-MTX co-culture cell monolayers
(B) ........................................................................................................................ 96
Figure 6.1. Flow diagram for the preparation of fish protein hydrolysates and
bioactive peptides, at laboratorial and industrial scales. ..................................... 108
Figure 6.2. Different fractions obtained in the SPC preparation. ......................... 107
Figure 7.1. The RP-HPLC profiles of (i) SPE plus BSY proteases [S+E] without
hydrolysis; (ii) SPH presenting HR=9.3% (25ºC, 1.50 h); and (iii) SPH presenting
HR=83% (50ºC, 7.00 h) ...................................................................................... 130
Figure 7.2. Counter plots for interaction effects of temperature (ºC) and time (h) on
Hydrolysis Rate (%) (A); Antioxidant activity determined by FRAP assay (B) and
ACE-I activity (C) of SPH. ................................................................................... 134
Figure 7.3. SDS-PAGE profiles of sarcoplasmic proteins plus BSY proteases [S+E]
without hydrolysis and SPH. ............................................................................... 135
Figure 8.1. Effect of SPH.GI<10 kDa at different peptide concentrations on Caco-2
cell viability, after 24 h of incubation at 37ºC, 5% CO2 (MTT assay). .................. 148
Figure 8.2. RP-HPLC chromatographic profiles of SPH.GI<10 kDa added to the
apical side at the beginning of permeability experiment (A) and collected from the
basolateral side after 180 min of transport across Caco-2/HT29-MTX co-culture cell
monolayer (B), and after 180 min of transport across Caco-2 cell monolayer
(C) ...................................................................................................................... 149
Figure 8.3. Comparative permeability (P% as mean values ± standard deviation
bars) for sum of peptides fractions 1-11 from SPH.GI<10 kDa in Caco-2 cell after
180 min (37ºC) of transport across Caco-2 cell monolayer and Caco-2/HT29 co-
culture cell monolayer ........................................................................................ 152
Figure 8.4. MALDI-TOF mass spectra of SPH.GI<10 kDa taken from the basolateral
side after 180 min of a permeability experiment across Caco-2/HT29-MTX co-culture
cell monolayer. ................................................................................................... 153
Figure 9.1. Effect of Ultrafiltration and Desalting processes of SPH, at the same
protein concentration of 1.0 mg/mL on differentiated Caco-2 (A) and EAhy926 (B)
cells viability (%) (MTT assay) after 24 h of incubation (37°C, 10% CO2) ........... 165
Figure 9.2. Effect of desalted SPH<10 kDa at different protein concentrations (0.1,
0.5, 1.0, 2.0 and 5.0 mg protein/mL) on differentiated Caco-2 and EAhy926 cells
viability (%) (MTT assay) after 24 h of incubation (37°C, 10% CO2) ................... 166
Figure 9.3. Effect of SPH<10 kDa (and metabolites) at the protein concentrations of
0.5 and 2.0 mg/mL on EAhy926 cells viability (%), after 4 h of incubation (37ºC, 10%
CO2) in the co-culture and standard models, under TNF-α-induced inflammatory (1
h of TNF-α 10 ng/mL stimulation) and non-inflammatory conditions ................... 168

xxvi
Figure 9.4. Effect of SPH<10 kDa (and metabolites) at the protein concentrations of
0.5 and 2.0 mg/mL on NO production of EAhy926 cells after 4 h of incubation (37ºC,
10% CO2) in the co-culture and standard models, under TNF-α-induced
inflammatory (1 h of TNF-α 10 ng/mL stimulation) and non-inflammatory conditions.
........................................................................................................................... 169
Figure 9.5. Effect of SPH<10 kDa (and metabolites) at the protein concentrations of
0.5 and 2.0 mg/mL on intracellular ROS levels of EAhy926 cells, after 4 h of
incubation (37ºC, 10% CO2) in the co-culture and standard models, under TNF-α-
induced inflammatory (1 h of TNF-α 10 ng/mL stimulation) and non-inflammatory
conditions ........................................................................................................... 170
Figure 9.6. Effect of SPH<10 kDa (and metabolites) at protein concentrations of 0.5
and 2.0 mg/mL on the secretion of MCP-1 (A); VEGF (B); IL-8 (C) and ICAM-1 (D)
in EAhy926 cells, after 4 h of incubation (37ºC, 10% CO2) in the co-culture and
standard models, under TNF-α-induced inflammatory (1 h of TNF-α 10 ng/mL
stimulation) and non-inflammatory conditions. .................................................... 171
Figure 10.1. SE-HPLC profiles of muscle (MUSC) and viscera (VISC) SPH produced
by Brewer´s spent yeast proteases (Bsy), Alcalase® (Alc) and Neutrase® (Ntr)
action. Hydrolyses were performed at 50ºC for 7 h, using an E/S ratio of 0.20:1 U/mg
(1 U/mL) ............................................................................................................. 183
Figure 10.2. Solubility profiles of muscle (MUSC) and visceral (VISC) SPH as a
function of pH (4-10 range) obtained by treatment with Brewer´s spent yeast
proteases (Bsy), Alcalase® (Alc) and Neutrase® (Ntr) action ............................. 186
Figure 11.1. Schematic structure of a barley grain (A) and the BSG (B). ............ 195
Figure 12.1. Effect of pH on solubility of BSG protein fraction, at 25°C, (A). Effect of
pH on hydrolysis of BSG protein fraction by BSY proteases, at 37°C, (B). .......... 214
Figure 12.2. Response surface plots for the effects of variable incubation
temperature (°C), incubation time (h) and E/S ratio (U/mg) on the responses: (A)
Degree of Hydrolysis (DH %); (B) Total Phenolic contents (TPC) and (C) FRAP
activity. ............................................................................................................... 218
Figure 12.3. Chromatograms obtained by RP-HPLC analysis of BSG proteins
hydrolysates ....................................................................................................... 220
Figure 13.1. SE-HPLC (A) and RP-HPLC (B) profiles of BSG protein hydrolysates
with different DH (%), obtained after enzymatic hydrolysis with BSY extract (BSYH),
Neutrase® (NTH) and Alcalase® (ALH). ............................................................. 236
Figure 13.2. Comparison of ACE-I activity (A), Total Phenolic Content (B) and FRAP
(C) of BSG protein starting material (NT, no treatment), full BSG protein hydrolysates
(BSYH, NTH, ALH) and respective <10 kDa and <3 kDa fractions...................... 238
Figure 13.3. Effect of BSG protein hydrolysates (<10 kDa fractions) on cell viability
(%) and TMRE mitochondrial inclusion (%) in Caco-2 cell line (A) and HepG2 cell
line (B), after 24 h of incubation at 37ºC, 5% CO2. .............................................. 241
Figure 13.4. Protective effect of BSG protein hydrolysates (<10 kDa fractions at
concentrations of 0.1 and 1.0 mg/mL) for 24 h against oxidative stress induced by
H2O2 (6 h of exposure) in Caco-2 cell line (A) and HepG2 cell line (B) ................ 242

xxvii
LIST OF TABLES
Table 1.1. Potential applications of BSY as functional food ingredients for animal
and human nutrition .............................................................................................. 19
Table 1.2. Biological activities assessed in BSY autolysates and hydrolysates .... 24
Table 1.3. Classification of in vitro analytical methods for evaluation of the
antioxidant activity of food protein hydrolysates and bioactive compounds. .......... 27
Table 1.4. In vitro analytical methods used for evaluation of the ACE-I activity of food
hydrolysates and bioactive peptides ..................................................................... 30
Table 2.1. Nutritional composition of BSY extract ................................................. 44
Table 2.2. Mean content (mg/100 g dw) of phenolic compounds of BSY extracts in
the free and bound fractions ................................................................................. 47
Table 3.1. Proximate composition (% dw) of freeze-dried BSY extracts ............... 58
Table 3.2. Amino acid composition of BSY extracts (g/100 g protein) and comparison
with FAO/WHO reference protein ......................................................................... 60
Table 3.3. Biological activity of BSY extracts, namely proteolytic activity, ACE-I
activity, Total Phenolic Content (TPC), Total Flavonoid Content (TFC) and
antioxidant activity ................................................................................................ 63
Table 4.1. Experimental design for evaluation the effects of autolysis conditions on
biological properties of BSY autolysate ................................................................ 74
Table 4.2. Analysis of variance (ANOVA) for Total phenolic content, Antioxidant
activity and ACE-I activity of BSY autolysate ........................................................ 75
Table 4.3. Performance of RSM model in predicting the optimum autolysis conditions
to enhance the biological activities of BSY autolysate .......................................... 78
Table 5.1. Apparent permeability coefficient (Papp) of BSY peptides (P1-P6) after 180
min of transport across Caco-2 cell and Caco-2/HT29-MTX co-culture cell
models ................................................................................................................. 98
Table 5.2. FRAP and ACE-I activity of Caco-2 and Caco-2/HT29-MTX co-culture cell
model permeates at different times of transport, five-fold concentration of permeates
............................................................................................................................. 99
Table 6.1. Degree of hydrolysis (DH %) and proximate composition (% dw) obtained
for various SPH .................................................................................................. 112
Table 6.2. Summary of ACE-I activity reported for various SPH and derived bioactive
peptides ............................................................................................................. 116
Table 6.3. Summary of antioxidant activity reported for various SPH and derived
bioactive peptides .............................................................................................. 117
Table 6.4. Summary of techno-functional properties reported for various SPH ... 119
Table 7.1. Results from experimental design by CCD for evaluation the effects of
hydrolysis temperature and time conditions on HR, FRAP and ACE-I activity .... 132
xxviii
Table 8.1. Antioxidant and ACE-I activities of SPH, its fractions <10 kDa and <3 kDa
and the in vitro GI digest of SPH<10 kDa ........................................................... 146
Table 8.2. Cumulative percentage permeability (P%) of SPH.GI<10 kDa peptides
through the Caco-2/HT29-MTX co-culture cell monolayer and through Caco-2 cell
monolayer for 180 min (37ºC, 5% CO2) .............................................................. 150
Table 10.1. Antioxidant and ACE-I activities of muscle (MUSC) and visceral (VISC)
SPH produced by Brewer´s spent yeast proteases (Bsy), Alcalase® (Alc) and
Neutrase® (Ntr) action ........................................................................................ 185
Table 10.2. Techno-functional properties and colour and of muscle (MUSC) and
visceral (VISC) SPH obtained by treatment with Brewer´s spent yeast proteases
(Bsy), Alcalase® (Alc) and Neutrase® (Ntr) ........................................................ 189
Table 11.1. Proximate composition (% dw) and potential applications of BSG .... 197
Table 11.2. Treatments applied to extract the BSG proteins, to produce the BSG
protein hydrolysates and its biological activities when it was evaluated .............. 201
Table 12.2. Procedure for studying the effect of inhibitors of BSY proteases on BSG
proteins .............................................................................................................. 213
Table 12.1. Experimental design for evaluation of the effects of hydrolysis conditions
at pH 6.0 on Hydrolysis Degree (DH %), total phenolic content (TPC) and FRAP
Assay of BSG protein fraction by BSY proteases ................................................ 215
Table 12.3. Model summary and analysis of variance (ANOVA) for Degree of
Hydrolysis (Y1), TPC (Y2) and FRAP (Y3) .......................................................... 217
Table 12.4. Effect of inhibitors on BSG protein hydrolysis by BSY proteases ..... 222
Table 13.1. Conditions used for preparation of BSG protein hydrolysates .......... 229
Table 13.2. Hydrolysis yield (%) and proximate composition (% dw) of BSG protein
hydrolysates ....................................................................................................... 235

xxix
LIST OF ABBREVIATIONS
AAS Atomic absorption spectrometry
Abz o-aminobenzoylglycyl-p-nitrophenylalanylproline
ACE Angiotensin-converting enzyme
ACE-I Angiotensin-converting enzyme inhibitory
API Aminopeptidase I
BHT Butylated hydroxytoluene
BSA Bovine serum albumin
BSG Brewer´s spent grain
BSY Brewer´s spent yeast
Caco-2 Human adenocarcinoma colon cancer cell monolayer
CCD Central composite design
CHP Cyclo-His-Pro
CE Catechin equivalents
CPY Carboxypeptidase Y
CPS Carboxypeptidase S
DAD Diode array detector
DH Degree of hydrolysis
DMEM Dulbecco’s modified eagle medium
DMSO Dimethyl sulfoxide
DPPH 2,2-diphenyl-1-picrylhydrazyl
DPP-IV Dipeptidyl-peptidase IV
DRIs Dietary Reference Intakes
dw Dry weight
EAA Essential amino acid
EAI Emulsifying activity index
EFSA European Food Safety Authority
ESI Emulsifying stability index
E/S Enzyme substrate ratio
ET Electron transfer
FAA Flavour amino acid
FAO Food and agriculture organization of the United Nations
FAPGG N-[3-(2-furyl)acryloyl]-L-phenylalanyl-glycyl-glycine
FE Foam expansion
FS Foam stability

xxx
FRAP Ferric reducing antioxidant power
FPLC Fast performance liquid chromatography
GAE Gallic acid equivalents
GC/MS Gas chromatography mass spectrometry
GFC Gel filtration chromatography
GI Gastrointestinal
GRAS Generally recognized as safe
GSH Glutathione
GSSG Oxidized glutathione
HAT Hydrogen atom transfer
HBBS Hank’s balanced salt solution
HepG2 Human hepatocarcinoma monolayer
HHL N-α-hippuryl-L-histidyl-L-leucine
H29-MTX Mucous-secreting HT29-MTX
H2O2 Hydrogen peroxide
HPLC High performance liquid chromatography
HR Hydrolysis rate
IC50 Peptide concentration required to inhibit ACE activity by 50%
ICAM-1 Intercellular adhesion molecule-1
ICP-MS Inductively coupled plasma mass spectrometry
IL-8 Interleukin-8
LC Liquid chromatography
LC-MS Liquid chromatography mass spectrometry
LOD Limit of detection
LOQ Limit of quantification
MALDI-TOF Matrix-assisted laser desorption/Ionization time of flight
MCP-1 Monocyte chemoattractant protein 1
MTT 3-(4,5-Dimethylthiazol-2-yl)-2,5-diphenyltetrazolium bromide
MWCO Molecular weight cut-off
NADPH Reduced nicotinamide adenine dinucleotide phosphate
NO Nitric oxide
NSI Nitrogen solubility index
nd Not detected
np Not performed
nq Not quantified
nr Not reported
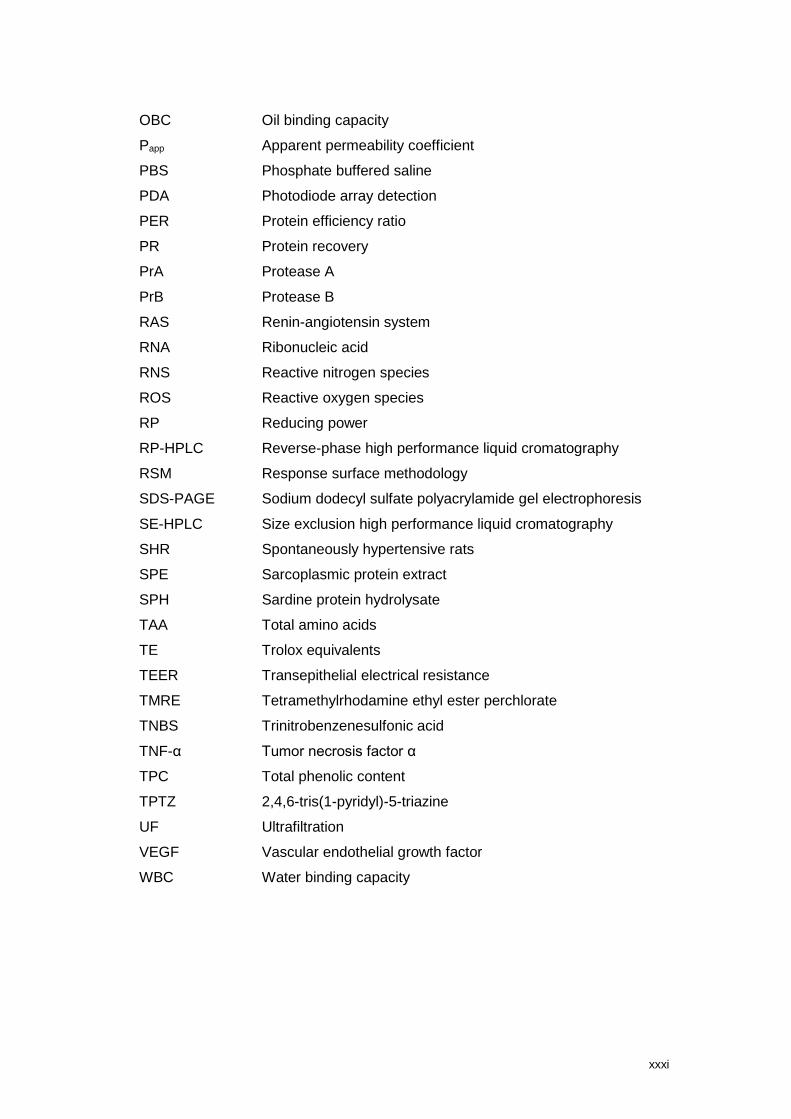
xxxi
OBC Oil binding capacity
Papp Apparent permeability coefficient
PBS Phosphate buffered saline
PDA Photodiode array detection
PER Protein efficiency ratio
PR Protein recovery
PrA Protease A
PrB Protease B
RAS Renin-angiotensin system
RNA Ribonucleic acid
RNS Reactive nitrogen species
ROS Reactive oxygen species
RP Reducing power
RP-HPLC Reverse-phase high performance liquid cromatography
RSM Response surface methodology
SDS-PAGE Sodium dodecyl sulfate polyacrylamide gel electrophoresis
SE-HPLC Size exclusion high performance liquid cromatography
SHR Spontaneously hypertensive rats
SPE Sarcoplasmic protein extract
SPH Sardine protein hydrolysate
TAA Total amino acids
TE Trolox equivalents
TEER Transepithelial electrical resistance
TMRE Tetramethylrhodamine ethyl ester perchlorate
TNBS Trinitrobenzenesulfonic acid
TNF-α Tumor necrosis factor α
TPC Total phenolic content
TPTZ 2,4,6-tris(1-pyridyl)-5-triazine
UF Ultrafiltration
VEGF Vascular endothelial growth factor
WBC Water binding capacity

xxxii
Motivation, Research aims and Thesis outline
1
MOTIVATION AND RESEARCH AIMS
Brewing and canned fish industry generate annually significant amounts of by-
products. Due to the global intense pressure towards green environmental technology,
finding alternatives to reduce the pollution arising from these two agro-industrial activities is
a major cause of concern. Efforts have been done to reduce the amount of waste by finding
alternative uses for by-products apart from the current general use for animal feed or
incineration. The main challenge is to convert the underutilized by-products into more
profitable and marketable products. An alternative is to extract the protein fraction of these
by-products and hydrolyze to obtain biological active peptides. The search for Angiotensin
I-converting enzyme (ACE) inhibitors and antioxidants, with little or no side effects
compared to the available synthetic ACE inhibitors (such as, captopril) and antioxidants
forms (such as, α-tocopherol and butylated hydroxyanisole) have received great attention
(1).
In Portugal, two important industries facing this challenge are the Unicer- Bebidas de
Portugal, S.A. brewing (Leça do Balio, Portugal) and the canned sardine industry
Conservas Ramirez & Cia (Filhos), SA (Matosinhos, Portugal). The main by-products
generated by the brewing are brewer´s spent grain (BSG), brewer´s spent yeast (BSY) and
brewer´s spent hops (2). In 2013, Unicer brewing generated 42.261 tonnes of by-products,
corresponding more than 96% to BSG (36.958 tonnes) and yeast surplus (6.257 tonnes)
(3). These by-products contain more than 20% of protein and are generally sold for local
producers as protein supplements for cattle feed (2). Other possibility is incineration,
however it comprises an environmental problem due the gas emission effects (4). Several
attempts have been described to reuse BSG and BSY through the recovery of valuable
nutrients or production of protein hydrolysates (5), (6). BSG protein hydrolysates have been
recognized to possess antioxidant, anti-inflammatory, α-glucosidase inhibitory and
dipeptidyl-peptidase IV (DPP-IV) inhibitory activities (6). Technological-functional properties
of BSG protein isolates/hydrolysates have also been studied (7), (8). Concerning to BSY,
applications in aquaculture, food industry, cosmetic and pharmacology are described (5),
(9), (10). Moreover, several laboratory preparations of yeast enzymes have been
characterized and purified, from which protease B (PrB) and Carboxypeptidase Y (CPY)
have been the most extensively studied (11).

2
Canned sardine industry generated annually several solid wastes including heads,
tails and viscera, which constitute more than 40% of the original raw material (12), (13). In
2009, Conservas Ramirez & Cia (Filhos), SA generated 5.060 tonnes of by-products (14).
This material is an important source of proteins, being traditionally transformed into
powdered fish flour for animal feed (12). However, to increase the commercial value of
sardine proteins by-product, an interesting alternative is to digest these proteins into
biologically active peptides (15-17). Certainly, the current conditions of handling and
preservation of sardine by‐products must be improved if they are intended as raw material
for the production of Sardine Protein Hydrolysates (SPH). Additionally, as sardine is a
pelagic-oil fish, the oil recovery should be an important step because its presence in the
obtained SPH represents a problem due to its oxidation (13). SPH have industrial
applications well evidenced by the commercial products available in the market, such as,
Valtryon® and Lapis Suport® (18), (19). Industrial application of SPH include food and feed
industry, agriculture, biotechnology, cosmetics and biomedical sectors due to their
nutritional value, biological activities and good functional properties, particularly high water
solubility. The main biological properties of SPH reported included: antioxidant,
antihypertensive, antithrombotic, immunomodulatory, antimicrobial, among others (12),
(13), (20).
The major goal of this thesis was to find new application for the by-products generated
from the brewing and canned fish industry, as a source of bioactive hydrolysates and its
potential use for production of new bioactive ingredients. For this purpose, a BSY extract
was obtained by mechanic disruption procedure to recover valuable compounds (enzymes,
proteins, vitamins, antioxidant compounds) and chemically and nutritionally characterized.
SPH and BSG protein hydrolysates were produced by the action of proteases present in
the BSY extract. The antioxidant and ACE-I activities of BSY extract, SPH and BSG protein
hydrolysates were screened by chemical and cell-based assays. In order to predict the in
vivo bioavailability of the bioactive compounds generated, the impact of gastrointestinal (GI)
digestion and the permeability through Human adenocarcinoma colon cancer cell
monolayer (Caco-2) and Caco-2/HT29-MTX cell models were also evaluated, aiming to find
valorization of these agro-industrial by-products, which is advisable from both economic
and environmental standpoints. Figure i.1 presents a schematic overview of the major aims
of this thesis.

Motivation, Research aims and Thesis outline
3
Figure i.1. Recovery of added value compounds from brewing and canned sardine agro-
industrial by-products for production of SPH and BSG protein hydrolysates.
To accomplish the main goal of this thesis, different specific objectives were
established:
1. Assess the biological activities of BSY extract prepared by mechanical disruption
and its stability during storage at -25ºC for 6 months;
2. Study the influence of number of reuses of yeast in beer fermentation step on the
biological activities of the BSY extract;
3. Optimize the autolysis conditions to enhance the antioxidant and ACE-I activities
of the BSY extract;
4. Assess the stability of the antioxidant and ACE-I activities of the BSY autolysate
to GI proteases and to transport across Caco-2 and Caco-2/HT29-MTX co-culture
models;
Agro-industrial by-products
Production marked by-products
Economical value Food ingredientes
Nutraceuticals
Recovery of added value compounds
Source of proteins
Canned sardine industry
Sardine by-product
Source of proteins
Brewing
BSY BSG
Source of protein and proteases
4
5. Optimize the hydrolysis of sardine sarcoplasmic proteins by BSY proteases to
produce a SPH with enhanced antioxidant and ACE-I activities;
6. Evaluate of the effect of Ultrafiltration membranes in the antioxidant and ACE-I
activities of the SPH, prepared by action of BSY proteases;
7. Assess the stability of the antioxidant and ACE-I activities of the SPH, prepared
by action of BSY proteases to GI proteases and to transport across Caco-2 and
Caco-2/HT29-MTX co-culture models;
8. Screen for the anti-inflammatory activity of the SPH, prepared by action of BSY
proteases;
9. Compare the functional properties of muscle and viscera SPH prepared by BSY
proteases and by the commercial enzymes Alcalase® and Neutrase®;
10. Optimize the hydrolysis conditions of BSG proteins by the BSY proteases to
produce a BSG protein hydrolysate with enhanced antioxidant and ACE-I
activities;
11. Compare the antioxidant and ACE-I activities of the BSG protein hydrolysate
prepared by BSY proteases and by the commercial enzymes Alcalase® and
Neutrase®.
Motivation, Research aims and Thesis outline
5
THESIS OUTLINE
This thesis is divided in three parts (Part I, Part II and Part III), which closely mimic
the development of the research program. Each part is organized in two sections: a
“Literature review” and the “Experimental work”. Chapters regarding to “Experimental work”
are related with each other, and the approach chosen in each one was dependent on the
conclusions attained in previous one(s). Each chapter contain their own introduction,
material and methods, experimental results and discussion, and a brief conclusion. The text
of this thesis is overall organized in thirteen chapters followed by the “General conclusions
and Future prospects” obtained with this thesis. Figure i.2 presents a schematic overview
of the organization of this thesis.
Part I entitled “Brewer´s spent yeast extract” includes Chapter 1 to 5. Chapter 1 is a
literature overview of BSY nutritional characteristics and applications, the common cell
disruption processes used to produce BSY extracts; as well as, the main biological activities
reported for BSY autolysates and hydrolysates.
- Chapter 2 describes the potential use of a BSY extract prepared by mechanical
disruption as a source of proteolytic enzymes and antioxidant and ACE-I activities;
- Chapter 3 explores the influence of the yeast reuse during beer fermentation step on
the proteolytic activity and antioxidant and ACE-I activities of the BSY extract prepared
by mechanical disruption;
- Chapter 4 reports the autolysis optimization of the BSY extract to enhance its antioxidant
and ACE-I activities;
- Chapter 5 describes the simulated GI digestion and the in vitro intestinal cell permeability
of the BSY autolysate with enhanced antioxidant and ACE-I activities.
Part II entitled “Sardine protein hydrolysates” includes Chapter 6 to 10. Chapter 6 is
a literature overview of the canned sardine by-product, it describes the characterization of
sardine sarcoplasmic proteins, the typical process adopted for the manufacturing of SPH
and the main biological activities reported.
- Chapter 7 reports the hydrolysis optimization of the sardine sarcoplasmic proteins by
BSY proteases to produce a SPH with antioxidant and ACE-I activities;
- Chapter 8 describes the simulated GI digestion and the in vitro intestinal cell permeability
of the SPH with antioxidant and ACE-I activities;

6
- Chapter 9 explores the potential anti-inflammatory properties of the SPH prepared by
action of the BSY proteases;
- Chapter 10 compares the biological activities and techno-functional properties of
different muscle and viscera SPH prepared by action of BSY proteases and the
commercial enzymes: Alcalase® and Neutrase®.
Part III entitled “Brewer´s spent grain protein hydrolysates includes Chapters 11 to
13. Chapter 11 is a literature overview of the BSG nutritional characteristics and
applications, it also describes the typical enzymatic process adopted for the manufacturing
of BSG protein hydrolysates and the main biological activities reported.
- Chapter 12 reports the hydrolysis optimization of BSG proteins by BSY proteases with
antioxidant and ACE-I activities;
- Chapter 13 compares the biological activities of different BSG protein hydrolysates
prepared by action of BSY proteases and the commercial enzymes: Alcalase® and
Neutrase®.
The experimental work was mainly developed in the following research laboratories:
- LAQV/REQUIMTE, Laboratory of Bromatology and Hydrology, Department of Chemical
Sciences, Faculty of Pharmacy, University of Porto (Portugal);
- UCIBIO/REQUIMTE, Laboratory of Toxicology, Department of Chemical Sciences,
Faculty of Pharmacy, University of Porto (Portugal);
- CICS, Department of Pharmaceutical Sciences, Instituto Superior de Ciências da Saúde-
Norte (Portugal);
- QOPNA, Mass Spectrometry Center, Department of Chemistry, University of Aveiro
(Portugal);
- Research Group Food Chemistry and Human Nutrition, Department of Food Safety and
Food Quality, Faculty of Bioscience Engineering, University of Gent (Belgium).
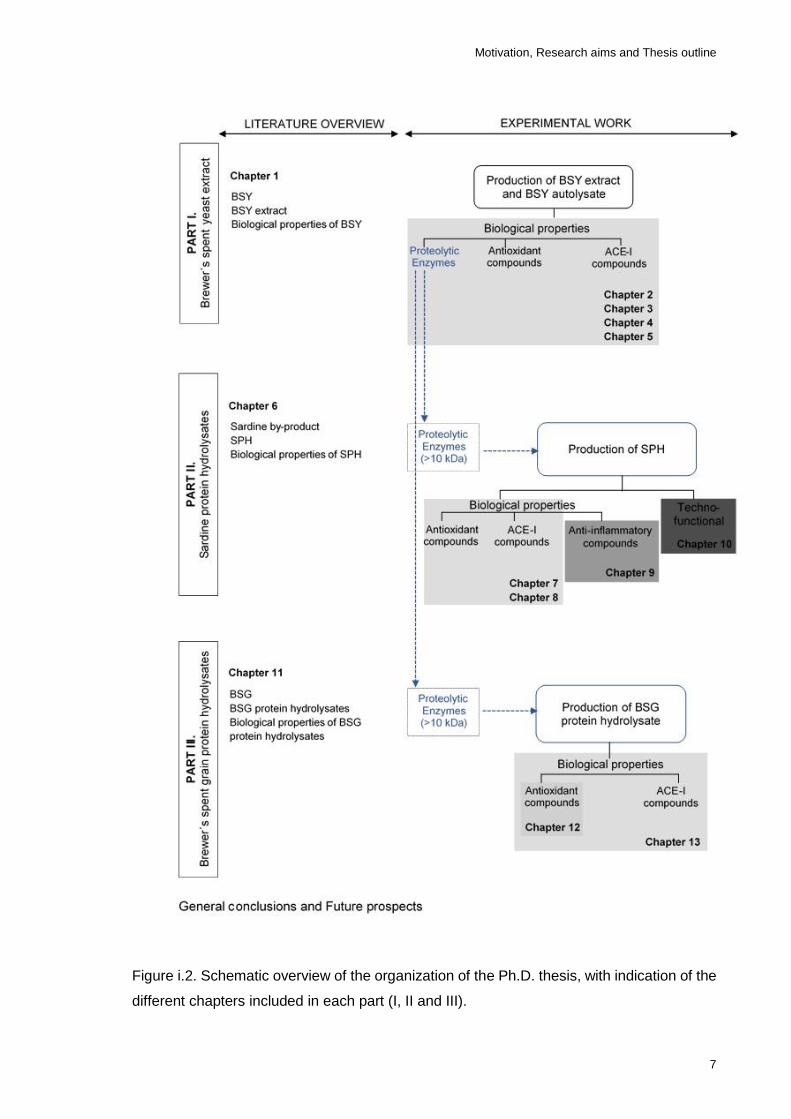
Motivation, Research aims and Thesis outline
7
Figure i.2. Schematic overview of the organization of the Ph.D. thesis, with indication of the
different chapters included in each part (I, II and III).

8

PART I
“Brewer´s spent yeast extracts”
_____________________
Chapter 1
Literature review
Brewer`s spent yeast: potential source of biological compounds and proteases for
application in the production of food hydrolysates
Chapter 2
Nutritive value, antioxidant activity and phenolic compounds profile of Brewer’s spent
yeast extract
Chapter 3
A bioactive ingredient obtained from the inner cellular content of Brewer´s spent yeast
Chapter 4
Autolysis of intracellular content of brewer`s spent yeast to maximize ACE-inhibitory and
antioxidant activities
Chapter 5
Impact of in vitro gastrointestinal digestion and transepithelial transport on antioxidant and
ACE-inhibitory activities of brewer´s spent yeast autolysate

10

CHAPTER 1
Literature review
Brewer`s spent yeast: potential source of biological
compounds and proteases for application in the
production of food hydrolysates
_____________________
This chapter presents a literature overview of BSY nutritional
characteristics and applications, the common cell disruption processes
used to produce BSY extracts; as well as, the main biological activities
reported for BSY autolysates and hydrolysates.

12
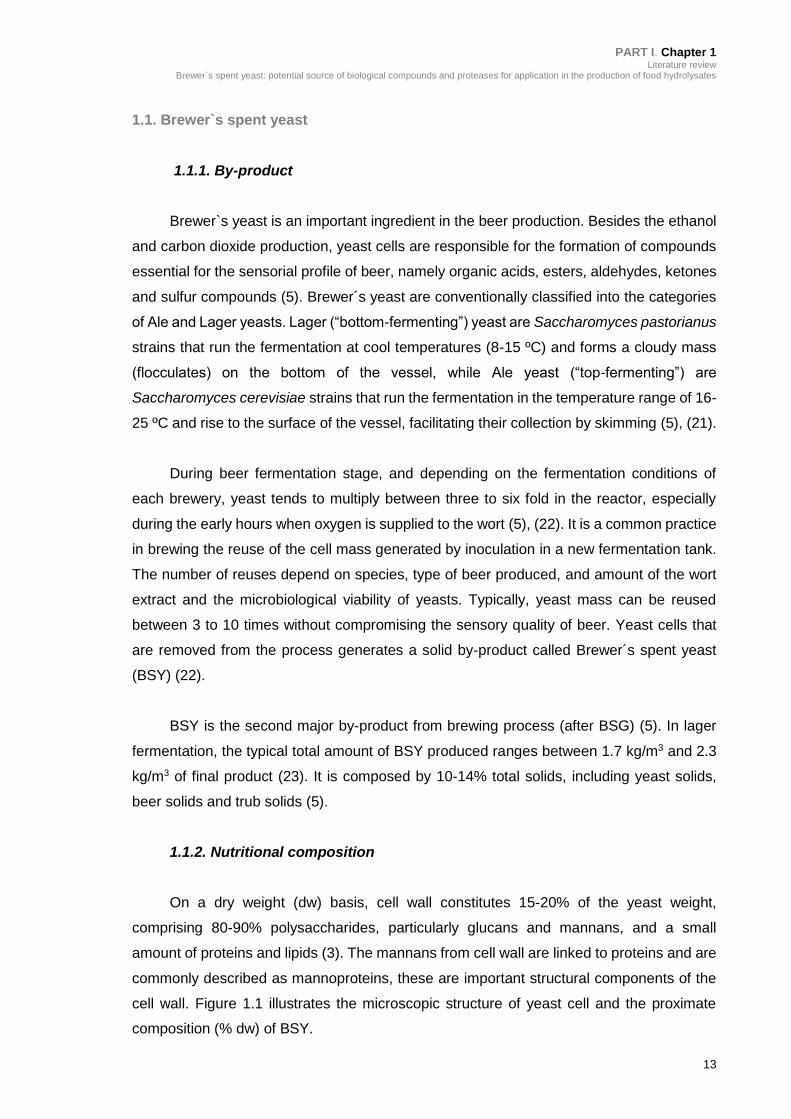
PART I. Chapter 1 Literature review
Brewer`s spent yeast: potential source of biological compounds and proteases for application in the production of food hydrolysates
13
1.1. Brewer`s spent yeast
1.1.1. By-product
Brewer`s yeast is an important ingredient in the beer production. Besides the ethanol
and carbon dioxide production, yeast cells are responsible for the formation of compounds
essential for the sensorial profile of beer, namely organic acids, esters, aldehydes, ketones
and sulfur compounds (5). Brewer´s yeast are conventionally classified into the categories
of Ale and Lager yeasts. Lager (“bottom-fermenting”) yeast are Saccharomyces pastorianus
strains that run the fermentation at cool temperatures (8-15 ºC) and forms a cloudy mass
(flocculates) on the bottom of the vessel, while Ale yeast (“top-fermenting”) are
Saccharomyces cerevisiae strains that run the fermentation in the temperature range of 16-
25 ºC and rise to the surface of the vessel, facilitating their collection by skimming (5), (21).
During beer fermentation stage, and depending on the fermentation conditions of
each brewery, yeast tends to multiply between three to six fold in the reactor, especially
during the early hours when oxygen is supplied to the wort (5), (22). It is a common practice
in brewing the reuse of the cell mass generated by inoculation in a new fermentation tank.
The number of reuses depend on species, type of beer produced, and amount of the wort
extract and the microbiological viability of yeasts. Typically, yeast mass can be reused
between 3 to 10 times without compromising the sensory quality of beer. Yeast cells that
are removed from the process generates a solid by-product called Brewer´s spent yeast
(BSY) (22).
BSY is the second major by-product from brewing process (after BSG) (5). In lager
fermentation, the typical total amount of BSY produced ranges between 1.7 kg/m3 and 2.3
kg/m3 of final product (23). It is composed by 10-14% total solids, including yeast solids,
beer solids and trub solids (5).
1.1.2. Nutritional composition
On a dry weight (dw) basis, cell wall constitutes 15-20% of the yeast weight,
comprising 80-90% polysaccharides, particularly glucans and mannans, and a small
amount of proteins and lipids (3). The mannans from cell wall are linked to proteins and are
commonly described as mannoproteins, these are important structural components of the
cell wall. Figure 1.1 illustrates the microscopic structure of yeast cell and the proximate
composition (% dw) of BSY.

14
Figure 1.1. Microscopic structure of yeast cell and proximate composition (% dw) of BSY.
The figure yeast diagram was taken from Northern Arizona University (2008) (24).
Proximate composition is based on chemical analysis reported by (22), (25-27).
The nutritional composition of BSY has been reported by several authors (22), (24-
27). BSY is predominantly composed by proteins, ranging between 35 and 60% (dw), which
have high biological value, representing between 70-85% of casein value (25), (28). The
most abundant amino acids of BSG are lysine, leucine, valine, tryptophan, threonine and
phenylalanine, and it is slightly deficient in sulfur amino acids, such as, cysteine and
methionine (29), (30). The amino acids score of BSY is 98.1%, presenting a well-balanced
amino acid profile for human consumption (25). Other components of BSY are
carbohydrates (35-45%); lipids (4-6%); and minerals (5-7.5%), namely calcium,
phosphorus, potassium, selenium, chromium, magnesium and iron (6), (22), (30-32). BSY
is a good source of a biologically active form of chromium trivalent, known as glucose
tolerance factor, which has been extensively studied for its medicinal properties (5). The
yeast intracellular compartment is mostly composed of soluble proteins, B-complex
vitamins, nucleic acids, minerals and enzymes (5).
Composition % dw
Protein 35-60 Total nitrogen (TN) 8.2 N as free ammonium 1.0 Amino nitrogen (AN) 4.5 AN/TN 0.57 Total carbohydrate 35-45 β-glucan 17.2 Glycogen 7.7 Soluble fibre 9.65 Insoluble fibre 2.57 RNA 4-7 Fat 4-6 Minerals 5-7.5 Bitterness (BU/g) 30
nucleus vacuole mitochondrion
bud
nuclear membrane
cell wall cytoplasmic membrane
capsule
cytosol
periplasm

PART I. Chapter 1 Literature review
Brewer`s spent yeast: potential source of biological compounds and proteases for application in the production of food hydrolysates
15
1.1.3. Antioxidant system
Reactive oxygen species (ROS) and reactive nitrogen species (RNS) can damage
different cell macromolecules, being related to the development of several diseases (33).
Yeast cells contain enzymatic and non-enzymatic defense systems to protect their cellular
constituents and maintain the cellular redox state. Figure 1.2. presents the main classes of
antioxidant defense in yeast cells. The antioxidant mechanisms of yeast have been
reviewed by several authors (33-37). Several enzymes, including catalase, superoxide
dismutase, glutathione reductase, thioredoxin reductase and methionine reductase, are
capable of removing ROS and RNS and their products and/or repairing the damage caused
by oxidative stress (35). Catalase catalyses the breakdown of hydrogen peroxide to oxigen
and water, while superoxide dismutases catalyses the breakdown of superoxide anion to
hydrogen peroxide and oxygen. The enzymes glutathione reductase and thioredoxin
reductase require nicotinamide adenine dinucleotide phosphate (NADPH) to reduce
oxidized glutathione (GSSG) and thioredoxin, respectively. The enzyme glutathione
reductase is primarily responsible for the reduction of GSSG and maintenance of the
gluthathione (GSH)/GSSG ratio in cell, whereas the enzyme glutathione peroxidase
catalyses the reduction of hydroperoxides, using GSH as a reductant. Thioredoxin
peroxidase reduces both hydrogen peroxide and alkyl hydroperoxides, in combination with
thioredoxin reductase, thioredoxin and NADPH.

16
Figure 1.2. Classes of natural antioxidants of yeast cells. Adapted from (38).
Besides the enzymatic protection against ROS and RNS, there are small molecules,
soluble in aqueous or (in some cases) lipid environments, that act as radical scavengers.
Some examples include Coenzyme Q10, GSH, polyamines, glutaredoxin, ascorbic acid,
phenolic compounds, vitamin E and vitamin A (35). Recently it has been proposed that
methionine residues exposed on the surface of proteins can also act as antioxidants to
protect the active sites of proteins (35). GSH, a tripeptide y-L-glutamyl-L-cystinylglycine,
acts as a radical scavenger, reacting with oxidants to produce GSSG. In addition to GSH,
amino acid-derived polyamines have also been implicated in protecting yeast against
oxidative stress. Other example are glutaredoxins, a class of small proteins with an active
site containing two redox sensitive cysteines, which act as a source of electrons for
ribonucleotide reductase.
Although yeasts are non-photosynthetic microorganisms, some yeasts can
biosynthesize carotenoids and phenolic compounds. Due to their free radical scavenging
and/or provitamin A (carotene) potential, carotenoids and phenolic compounds prevent
various types of cancer and other diseases (39). According to Moreira [PhD dissertation]
(40), ferulic acid and p-coumaric acid are the main contributors for the phenolic composition
of BSY. Although yeasts synthesize erythroascorbate instead of ascorbate, there are few
reports describing the presence of ascorbic acid in Saccharomyces cerevisiae (35), (41).
Vitamin E acts as a lipid-based radical chain breaking molecule with scavenging capacity
Non Enzymatic
Cofactors: Coenzyme Q10
Vitamins: A (retinol), E
Minerals: Se, Zn
Carotenoids: β-carotene
Phenolic acids: ferulic, p-coumaric
N non-protein compounds: uric acid
Organosulfur compounds: GSH
Enzymatic
Primary enzymes:
Superoxide dismutase
Catalase
Glutathione peroxidase
Secondary enzymes
Glutathine reductase
Glutathione transferase
Thioredoxin reductase
Methionine reductase
Antioxidant defense in yeast cells

PART I. Chapter 1 Literature review
Brewer`s spent yeast: potential source of biological compounds and proteases for application in the production of food hydrolysates
17
for free radicals, such as, lipid peroxyl, alkoxyl and hydroxyl radicals. Trolox, a water-soluble
analog of vitamin E, decreased the levels of hydrogen peroxide and superoxide, as well as,
increased the activity of enzymatic antioxidants in yeast. Vitamin E has also been described
to have regulatory actions in inducing antioxidant enzymes synthesis. Other micronutrients,
such as, manganese, copper, zinc and selenium, are components of antioxidant enzymes
and have been reported in yeast (33).
1.1.4. Enzymatic system
Yeast vacuole has a slightly acidic environment (pH ~6.2) compared with the cytosol
(pH ~7.2) and contains several proteases, including protease A (PrA), PrB, CPY,
carboxypeptidase S (CPS), aminopeptidase I (API), aminopeptidase Co and dipeptidyl
aminopeptidase B (11), (42), (43). These vacuolar exopeptidases and endopeptidases are
released from autolyzed cells and may promote protein degradation to generate smaller
peptide fragments (44). These enzymes are classified as metalloproteases, serine
proteases and aspartyl proteases (11). In brief, serine proteases comprise a large family
whose enzymatic activity is mediated by a characteristic catalytic triad consisting of
asparagine, histidine and serine. In contrast, metalloproteases depend on metal ions,
especially Zn2+ for their catalytic function, and the aspartyl proteases are characterized by
two catalytic asparagine residues, mediating an acid-base hydrolysis reaction (11).
PrA is a monomeric 42 kDa aspartyl endoprotease with a key role for the vacuolar
protease activation cascade. PrB, CPY and AP depend on PrA for proteolytic activation.
PrB is a 76 kDa serine endoproteases; CPY is a serine carboxypeptidase and initially
synthesized as a ~60 kDa precursor; CPS is a zinc-dependent metallo-carboxypeptidase
and initially synthesized as a ~64 kDa precursor and AP1 is a zinc-dependent metallo-
aminopeptidase and initially synthesized as a ~61 kDa precursor (11).
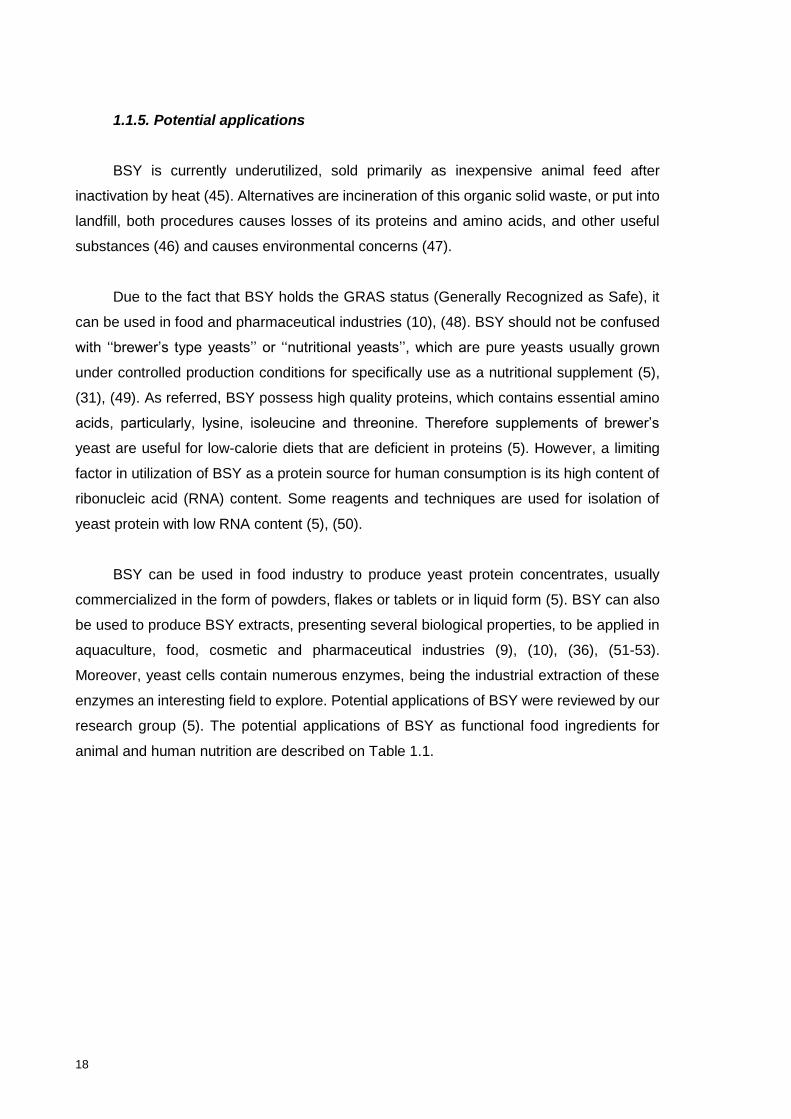
18
1.1.5. Potential applications
BSY is currently underutilized, sold primarily as inexpensive animal feed after
inactivation by heat (45). Alternatives are incineration of this organic solid waste, or put into
landfill, both procedures causes losses of its proteins and amino acids, and other useful
substances (46) and causes environmental concerns (47).
Due to the fact that BSY holds the GRAS status (Generally Recognized as Safe), it
can be used in food and pharmaceutical industries (10), (48). BSY should not be confused
with ‘‘brewer’s type yeasts’’ or ‘‘nutritional yeasts’’, which are pure yeasts usually grown
under controlled production conditions for specifically use as a nutritional supplement (5),
(31), (49). As referred, BSY possess high quality proteins, which contains essential amino
acids, particularly, lysine, isoleucine and threonine. Therefore supplements of brewer’s
yeast are useful for low-calorie diets that are deficient in proteins (5). However, a limiting
factor in utilization of BSY as a protein source for human consumption is its high content of
ribonucleic acid (RNA) content. Some reagents and techniques are used for isolation of
yeast protein with low RNA content (5), (50).
BSY can be used in food industry to produce yeast protein concentrates, usually
commercialized in the form of powders, flakes or tablets or in liquid form (5). BSY can also
be used to produce BSY extracts, presenting several biological properties, to be applied in
aquaculture, food, cosmetic and pharmaceutical industries (9), (10), (36), (51-53).
Moreover, yeast cells contain numerous enzymes, being the industrial extraction of these
enzymes an interesting field to explore. Potential applications of BSY were reviewed by our
research group (5). The potential applications of BSY as functional food ingredients for
animal and human nutrition are described on Table 1.1.
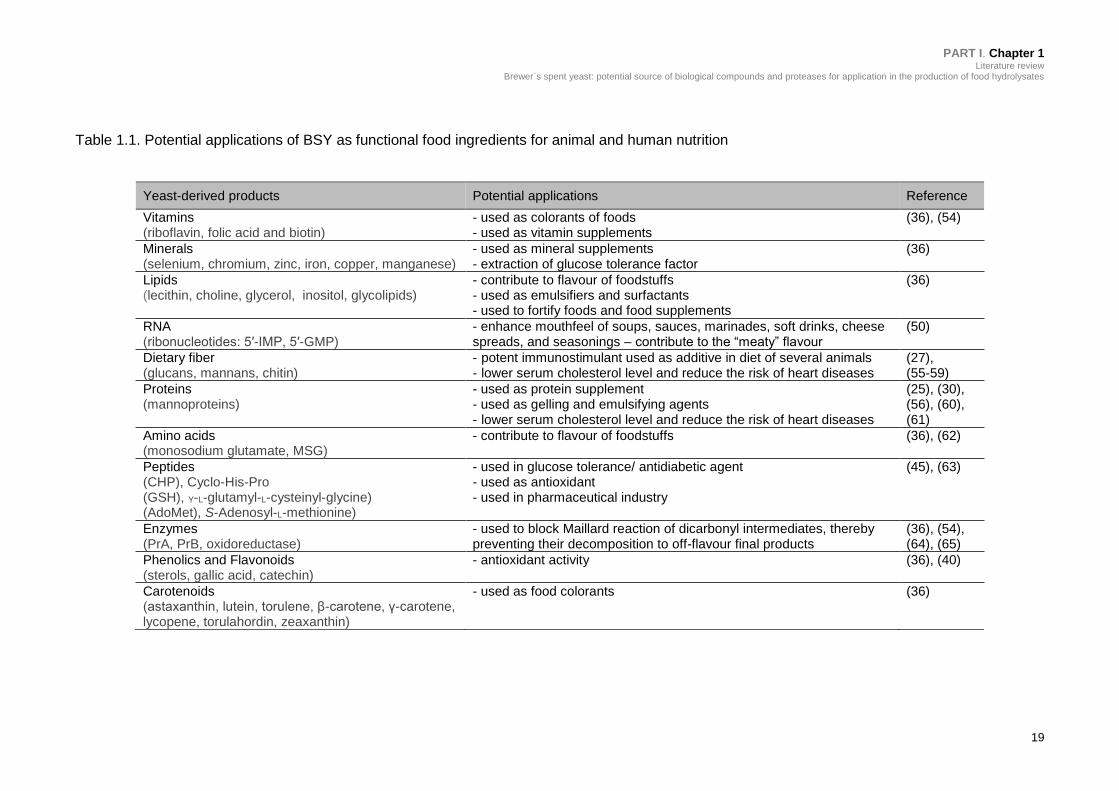
PART I. Chapter 1 Literature review
Brewer`s spent yeast: potential source of biological compounds and proteases for application in the production of food hydrolysates
19
Table 1.1. Potential applications of BSY as functional food ingredients for animal and human nutrition
Yeast-derived products Potential applications Reference
Vitamins (riboflavin, folic acid and biotin)
- used as colorants of foods - used as vitamin supplements
(36), (54)
Minerals (selenium, chromium, zinc, iron, copper, manganese)
- used as mineral supplements - extraction of glucose tolerance factor
(36)
Lipids (lecithin, choline, glycerol, inositol, glycolipids)
- contribute to flavour of foodstuffs - used as emulsifiers and surfactants - used to fortify foods and food supplements
(36)
RNA (ribonucleotides: 5′-IMP, 5′-GMP)
- enhance mouthfeel of soups, sauces, marinades, soft drinks, cheese spreads, and seasonings – contribute to the “meaty” flavour
(50)
Dietary fiber (glucans, mannans, chitin)
- potent immunostimulant used as additive in diet of several animals - lower serum cholesterol level and reduce the risk of heart diseases
(27), (55-59)
Proteins (mannoproteins)
- used as protein supplement - used as gelling and emulsifying agents - lower serum cholesterol level and reduce the risk of heart diseases
(25), (30), (56), (60), (61)
Amino acids (monosodium glutamate, MSG)
- contribute to flavour of foodstuffs
(36), (62)
Peptides (CHP), Cyclo-His-Pro (GSH), Y-L-glutamyl-L-cysteinyl-glycine) (AdoMet), S-Adenosyl-L-methionine)
- used in glucose tolerance/ antidiabetic agent - used as antioxidant - used in pharmaceutical industry
(45), (63)
Enzymes (PrA, PrB, oxidoreductase)
- used to block Maillard reaction of dicarbonyl intermediates, thereby preventing their decomposition to off-flavour final products
(36), (54), (64), (65)
Phenolics and Flavonoids (sterols, gallic acid, catechin)
- antioxidant activity (36), (40)
Carotenoids (astaxanthin, lutein, torulene, β-carotene, γ-carotene, lycopene, torulahordin, zeaxanthin)
- used as food colorants
(36)

20
1.2. Production of BSY extract
The cytoplasm of yeast cell is a valuable source of proteins, peptides, enzymes, RNA,
minerals, vitamins, among other compounds. The recovery of these intracellular
compounds implies an efficient breakage of the cell walls; the final product is called yeast
extract (48), (66). The identification of a suitable cell disruption method is very important to
promote an efficient and cost effective recovery of the intracellular products with reduced
contaminants and minimal micronization of cell debris (67), (68).
Disruption technique can be classified into mechanical (employing shear force) and
non-mechanical (physical, chemical or enzymatic lysis) methods, as summarized in Figure
1.3.
Figure 1.3. Classification of disruption techniques. Adapted from (69).
The non-mechanical methods, particularly the autolysis process, are commonly used
at the laboratorial scale (50). In opposite, the mechanical methods are most appropriate for
large-scale disruption and allow high recovery yields. In the mechanical methods, cell wall
is broken due to stress produced by high pressure, cavitation, sonication, ultrasound or
abrasion during rapid agitation with glass beads (69). Its application is restrict due to the
temperature elevation, requiring multiple steps of cooling, and the large quantity of cell
debris in the final products (66), (67). At laboratorial scale, cell disruption using glass beads
is routinely used, as well as, some high-pressure methods as the Hughes press or the
French press. Bead mill, high pressure homogenizer and high-intensity ultrasound are
mechanical methods scalable for industrial use (69).
Yeast cell disruption
Mechanical methods
Solid shear
Bead Mill X-press Hughes press
Liquid shear
Microfluidizer Sonicator Ultrasonicator Homogenizer French press
Physical
Decompression Osmotic shock Thermolysis Freeze-thaw Desiccation Electrically-assisted treatment
Chemical
Antibiotics Detergents Chelating agents Solvents Chaotropes Hydroxide Hypochlorite
Enzymatic
Autolysis Hydrolysis
Non-mechanical methods

PART I. Chapter 1 Literature review
Brewer`s spent yeast: potential source of biological compounds and proteases for application in the production of food hydrolysates
21
In the Ultrasonication method, an intense shear action induced by high frequency
sonic waves is used for cell wall disintegration. This method creates high shear force by
high-frequency ultrasound (above 16 kHz) (66). Although ultrasonic is rather effective for
lysis of yeast cells, it is usually accompanied by temperature increase, high content of cell
debris and undesirable formation of chemical compounds (67). In the Bead Mill method,
compounds are released from cells due to the action of circulating beads dispersed in the
fluid (66), (70), it can be operated either in batch or in a continuous recycling mode (70).
The major disadvantages of using Bead Mill and homogenizer are the poor selectivity in
product release (i.e. the co-release of contaminants) and micronization of the cell debris,
either of which can substantially increase the costs of subsequent downstream operation
(46). The efficiency of mechanical cell disruption is usually monitored by measuring the
amounts of proteins released; the activity of recovered enzymes or the number of surviving
cells (69).
The limitations associated with mechanical methods have inspired search of
alternative methods for recovery of intracellular compounds from BSY. Currently,
application of electrotechnologies, such as, the Pulsed electric field and High-voltage
electrical discharges, are promising for intracellular extraction from bio-suspensions (68).
Additionally, Electroporation has many advantages when compared with other disruption
techniques, since it exerts a minimal undesirable impact on liquid components inside and
outside the cell and can be done without significant temperature increase and formation of
cell debris (67). Also, Lamoolphak et al. (47) used Hydrothermal decomposition of yeast
cells for production of proteins and amino acids (using subcritical or supercritical water).
Recovery of enzymes fraction by Ultrasonication and Bead Mill methods are the most
effective for the destruction of cell wall while maintaining enzymes activity (70). In order to
optimize the yield of cell disruption, beads with 0.25-0.75 mm of diameter and 40-50% cells
(wet weight) is recommended (69). The pH of the disruption media also plays an important
role because the enzymes/ proteins released after cell disruption must maintain their
activity/ native structure (71). Figure 1.4. displays an example of yeast wall mechanical
disruption (using glass beads) procedure, applied at laboratorial scale.
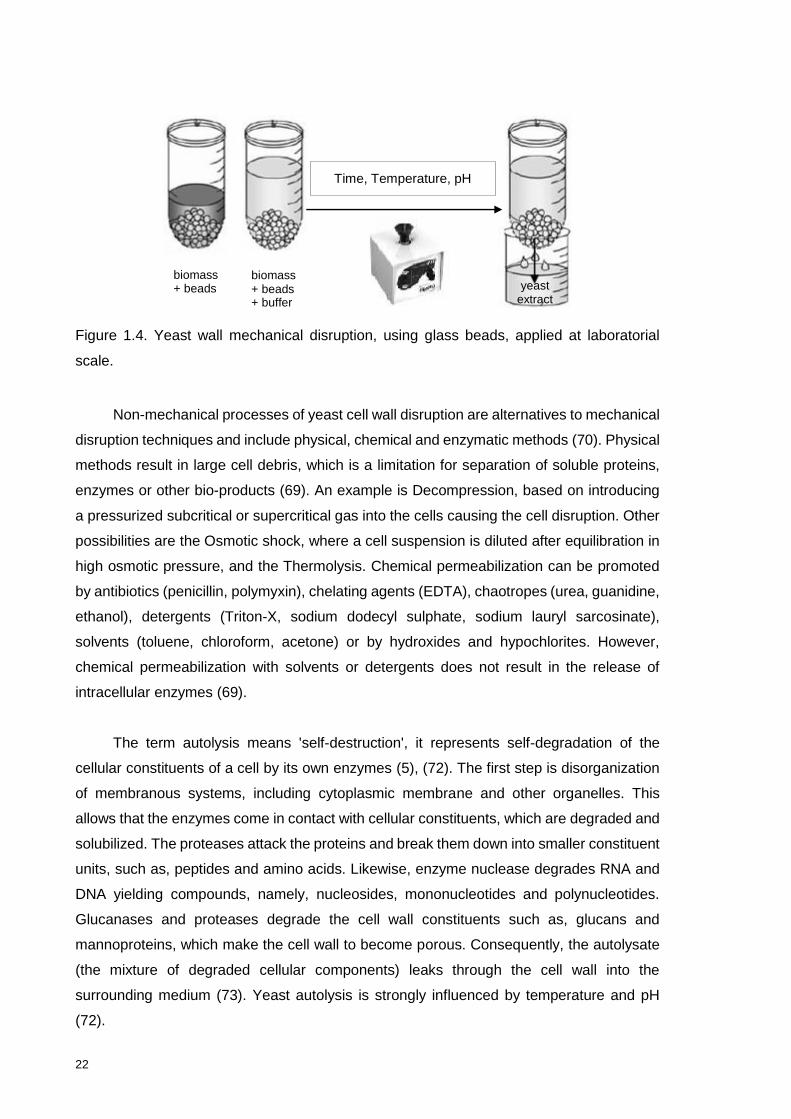
22
Figure 1.4. Yeast wall mechanical disruption, using glass beads, applied at laboratorial
scale.
Non-mechanical processes of yeast cell wall disruption are alternatives to mechanical
disruption techniques and include physical, chemical and enzymatic methods (70). Physical
methods result in large cell debris, which is a limitation for separation of soluble proteins,
enzymes or other bio-products (69). An example is Decompression, based on introducing
a pressurized subcritical or supercritical gas into the cells causing the cell disruption. Other
possibilities are the Osmotic shock, where a cell suspension is diluted after equilibration in
high osmotic pressure, and the Thermolysis. Chemical permeabilization can be promoted
by antibiotics (penicillin, polymyxin), chelating agents (EDTA), chaotropes (urea, guanidine,
ethanol), detergents (Triton-X, sodium dodecyl sulphate, sodium lauryl sarcosinate),
solvents (toluene, chloroform, acetone) or by hydroxides and hypochlorites. However,
chemical permeabilization with solvents or detergents does not result in the release of
intracellular enzymes (69).
The term autolysis means 'self-destruction', it represents self-degradation of the
cellular constituents of a cell by its own enzymes (5), (72). The first step is disorganization
of membranous systems, including cytoplasmic membrane and other organelles. This
allows that the enzymes come in contact with cellular constituents, which are degraded and
solubilized. The proteases attack the proteins and break them down into smaller constituent
units, such as, peptides and amino acids. Likewise, enzyme nuclease degrades RNA and
DNA yielding compounds, namely, nucleosides, mononucleotides and polynucleotides.
Glucanases and proteases degrade the cell wall constituents such as, glucans and
mannoproteins, which make the cell wall to become porous. Consequently, the autolysate
(the mixture of degraded cellular components) leaks through the cell wall into the
surrounding medium (73). Yeast autolysis is strongly influenced by temperature and pH
(72).
biomass + beads
biomass + beads + buffer
yeast extract
Time, Temperature, pH

PART I. Chapter 1 Literature review
Brewer`s spent yeast: potential source of biological compounds and proteases for application in the production of food hydrolysates
23
By contrast, hydrolysis is accomplished by proteolytic enzymes and cell wall lysis
enzymes. This process aims the production of a yeast extract with a low salt content (48).
Several kinds of enzymes from bacterial, vegetable, yeast or animal origin have been used
to produce BSY extracts, including Glucanases (74); Proteases (74), (75); Nucleases (29),
(74); Deaminases (29), (74); Pepsin (75); Trypsin (75); Pancreatin (76); (77); Flavourzyme
(29), (45), (48), (76), (78); Protamex (10), (45), (48), (78); Alcalase (45) and Neutrase (45).
1.3. Biological activities of BSY extract
BSY autolysates and hydrolysates are a source of nutrients and bioactive
compounds, acting as nutraceuticals in animal and human nutrition (5). The recent patent
by Esteves et al. (79) describes a method for obtaining peptide and polysaccharide extracts
from BSY by hydrolysis with an enzymatic extract of Cynara scolymus flowers (55ºC, 3 h),
followed by Ultrafiltration (UF) techniques. These BSY hydrolysates are claimed to present
anti-hypertensive, anti-inflammatory, anti-ulcerative, antioxidant, antidiabetic, prebiotic,
anticancer, antimicrobial and anti-obesity properties, with potential applications in the
human and animal diet, as well, in pharmaceuticals. A summary of biological activities of
BSY autolysates/ hydrolysates, as well as, the process preparation employed is presented
in Table 1.2.
BSY extracts have also been used as source of enzymes to produce protein
hydrolysates from different food matrices. For instance, bovine skimmed milk digested with
purified PrB from the cell-free extract of the BSY was found to inhibit proliferation activity of
HL-60 cells (44). The same authors also reported an ACE-I activity (IC50) of 0.42 mg of
protein/mL when skimmed milk was digested with the same purified PrB (64). Additionally,
application of crude BSY protease extract to pineapple (80); papaya juice (81); beetroot and
carrot juices (82); starch (83) and dairy products (84), (85) appears quite promising.

24
Table 1.2. Biological activities assessed in BSY autolysates and hydrolysates
BSY extract preparation BSY protein hydrolysis Fraction / Purification
Method Process Enzyme Hydrolysis Assay Bioactivity assessed Reference
ACE-I activity
Cultivation 30ºC, 24 h Pepsin E/S ratio: 1% (w/v), 37ºC, 12 h, pH 2
(1) 5 kDa MWCO UF, (2) SE-HPLC, (3) RP-HPLC
HHLa as substrate
0.070 mg peptide /mL (75)
np np Alcalase E/S ratio: nr 50ºC, 12 h, pH 7.5-8.5
(1) peptide adsorption trough an resin column, (2) SE-HPLC, (3) RP-HPLC, (4) Gel filtration HPLC
HHLa as substrate
3.0-3.4 µmol peptide/L (86)
Antioxidant activity
8% BSY suspension
np Flavourzyme
E/S ratio: nr 50ºC, 48 h, pH 7.0
Acid treatment, activated carbon and 5 kDa MWCO UF
ABTS DPPH
IC50= 0.9 mg peptide/mL IC50= 1.9 mg peptide/mL
(45)
np np Pancreatine E/S ratio: nr 50ºC, 5 h, pH 7.5-8.9
np ABTS IC50= 1.3 mg peptide/mL (77)
Antidiabetic activity
8% BSY suspension
np Flavourzyme
E/S ratio: nr 50ºC, 48 h, pH 7.0
Acid treatment, activated carbon and 5 kDa MWCO UF
CHPb CHP = 674.0 μg/g (45)
a HHL, Hippuryl-L-histidyl-L-leucine. b CHP, Cyclo-His-Pro (is an endogenous cyclic dipeptide structurally related to hypothalamic tyrotropin-releasing hormone, suggested to relate glycemic control in diabetes). DPPH, 2,2-diphenyl-1-picrylhydrazyl; ABTS, 2,2`-azino-bis(3-ethylbenzthiazoline-6-sulphonic acid), MWCO, molecular weight cut-off. np, not performed, nr, not reported.

PART I. Chapter 1 Literature review
Brewer`s spent yeast: potential source of biological compounds and proteases for application in the production of food hydrolysates
25
1.4. Screening methods to search for autolysates/ hydrolysates bioactivity
Autolysates/ hydrolysates may contain bioactive peptides that have a positive impact
on body function and positive influence on health beyond their basic role as nutrient sources
(87). Bioactive peptides have low molecular weight (i.e. 3-20 amino acid residues) and their
activity is based on size, amino acid composition and sequence. Furthermore, their
biological responses depend on the ability to cross the intestinal epithelium and enter the
blood circulation, or to bind directly to specific epithelial cell surface receptor sites to exert
physiological functions of the organism (88), (89).
Several biological activities have been reported for food protein hydrolysates and for
specific peptide sequences derived from these hydrolysates, namely, antioxidant,
antihypertensive, anti-inflammatory, immunomodulatory, neuroactive, antimicrobial,
mineral and hormonal regulating properties (Figure 1.5). Several in vitro methods have been
developed for screening these properties and were reviewed by several authors (38), (87-
99). The following section will focus on the in vitro antioxidant and ACE-I activities assays.
Figure 1.5. Physiological effects of food derived bioactive peptides on major body systems.
Adapted from (100).

26
1.4.1. In vitro Antioxidant chemical activity
When the balance between the production and neutralization of ROS, RNS and free
radicals by the antioxidant defense system is compromised, cells suffer the consequences
of oxidative stress (38), (97), (101). The main targets of ROS, RNS and free radicals are
proteins, DNA, RNA, sugars and lipids. Oxidative stress is linked to the development of
several diseases, such as, neurodegenerative disorders, hypertension, inflammation,
cancer, diabetes, Alzheimer disease, Parkinson’s disease and ageing problems (38). Due
to the potential health risks of synthetic antioxidants, as butylated hydroxyanisole (BHA),
butylated hydroxytoluene (BHT) tert-butylhydroquinone (TBHQ) and propyl gallate (PG), the
search for safe natural antioxidants is important (97), (102).
Due to the complexity of different oxidative processes and the possibility that an
antioxidant acts by different mechanisms, it is very difficult to select a suitable antioxidant
assay that measures the overall antioxidant potential of the compound (94). Moreover, the
conditions of the assay and the antioxidants solubility in the reaction media may affect the
antioxidant activity assessed (88). For this reason, various methods are suggested to
measure the antioxidant activity (103). Specific assays have not yet been developed or
standardized to measure the antioxidant activity of food hydrolysates (103).
The methods used for determining the antioxidant activity of a compound are
classified in two main groups according to the chemical reactions involved: assays based
on the hydrogen atom transfer reaction (HAT) and assays based on the electron transfer
(ET) (97). HAT-based methods measure the ability of an antioxidant to quench free radicals
by hydrogen donation; reactions are solvent and pH independent and are quite rapid. The
main limitation of HAT assays is the presence of reducing agents (including metals), which
can lead to incorrect high apparent reactivity (97). ET-based methods detect the ability of
an antioxidant to quench free radicals, metals and/or carbonyls by electron transference
(90). Other chemical assays that measure the scavenging capacity of individual ROS, such
as, superoxide anion, singlet oxygen, hydrogen peroxide, hydroxyl radical and peroxynitrite,
have been currently used and reviewed by several authors (90), (96), (98). Table 1.3
summarizes the most widely used assays for determination of the antioxidant activity of
food protein hydrolysates and bioactive compounds.
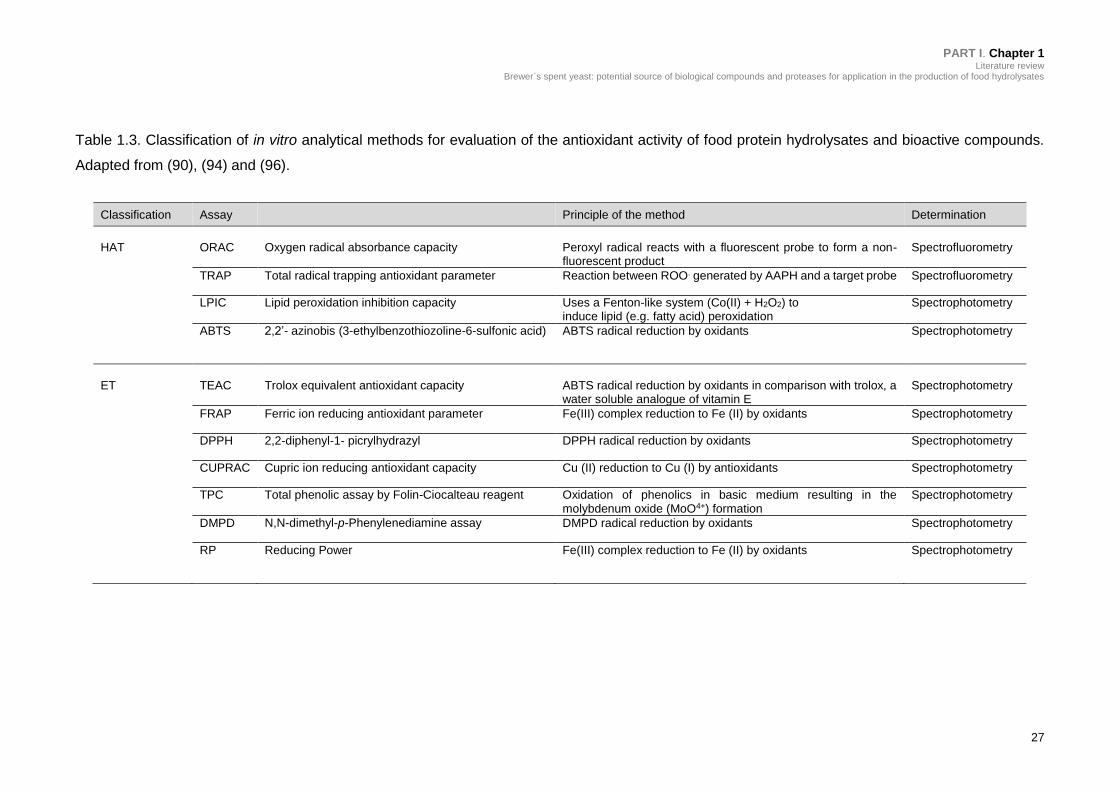
PART I. Chapter 1 Literature review
Brewer`s spent yeast: potential source of biological compounds and proteases for application in the production of food hydrolysates
27
Table 1.3. Classification of in vitro analytical methods for evaluation of the antioxidant activity of food protein hydrolysates and bioactive compounds.
Adapted from (90), (94) and (96).
Classification Assay Principle of the method Determination
HAT
ORAC Oxygen radical absorbance capacity Peroxyl radical reacts with a fluorescent probe to form a non-
fluorescent product Spectrofluorometry
TRAP Total radical trapping antioxidant parameter Reaction between ROO. generated by AAPH and a target probe Spectrofluorometry
LPIC Lipid peroxidation inhibition capacity Uses a Fenton-like system (Co(II) + H2O2) to induce lipid (e.g. fatty acid) peroxidation
Spectrophotometry
ABTS 2,2’- azinobis (3-ethylbenzothiozoline-6-sulfonic acid) ABTS radical reduction by oxidants Spectrophotometry
ET TEAC Trolox equivalent antioxidant capacity ABTS radical reduction by oxidants in comparison with trolox, a
water soluble analogue of vitamin E Spectrophotometry
FRAP Ferric ion reducing antioxidant parameter Fe(III) complex reduction to Fe (II) by oxidants Spectrophotometry
DPPH 2,2-diphenyl-1- picrylhydrazyl DPPH radical reduction by oxidants Spectrophotometry
CUPRAC Cupric ion reducing antioxidant capacity Cu (II) reduction to Cu (I) by antioxidants Spectrophotometry
TPC Total phenolic assay by Folin-Ciocalteau reagent Oxidation of phenolics in basic medium resulting in the molybdenum oxide (MoO4+) formation
Spectrophotometry
DMPD N,N-dimethyl-p-Phenylenediamine assay DMPD radical reduction by oxidants Spectrophotometry
RP Reducing Power Fe(III) complex reduction to Fe (II) by oxidants Spectrophotometry

28
1.4.2. Antihypertensive activity
Hypertension is strongly associated with cardiovascular diseases, leading to
premature morbidity and mortality (104), (105). Emerging evidence indicates that bioactive
peptides can promote antihypertensive effects via different mechanisms. The main group
of antihypertensive peptides corresponds to the inhibitors of ACE. However, bioactive
peptides can also interact with the renin-angiotensin system (RAS), Angiotensin II receptor,
arginine-nitric oxide pathway, endothelin system and Ca2+ channels (105).
Physiologically, hypertension occurs when renin produces Angiotensin I from
angiotensinogen (103). ACE (EC 3.4.15.1) is a zinc metallocarboxydipeptidase, commonly
found in vascular endothelial cells and neuroepithelial cells. This enzyme plays a significant
physiological role in regulating blood pressure in the RAS; ACE can convert the inactive
Angiotensin I into a potent vasoconstrictor, the Angiotensin II. At the same time, ACE also
inactivates Bradykinin, a potent vasodilatory peptide. Hence, as ACE raises blood pressure,
specific inhibitors of ACE are used as pharmaceuticals to treat hypertension (89), (103),
(106), (107). Currently, several synthetic ACE-I, such as, captopril, lisinopril, enalapril and
fosinopril, are been used to treat hypertension, however, they are known to have strong
side effects, including coughing, taste disturbance and skin rash (15), (107). Therefore, the
search for natural ACE-inhibitory peptides derived from food proteins with no side effects is
of great importance (89).
Several methods are described in literature to evaluate the ACE-Inhibitory (ACE-I)
activity of a compound, which include spectrophotometric, fluorometric, radiochemical,
capillary electrophoresis, and HPLC methods (107). Synthetic substrates, such as, N-α-
hippuryl-L-histidyl-L-leucine (HHL), N-[3-(2-furyl)acryloyl]-L-phenylalanyl-glycyl-glycine
(FAPGG) and o-aminobenzoylglycyl-p-nitrophenylalanylproline (Abz-Gly-Phe-(NO2)-Pro
(Abz) are used for measuring the in vitro ACE-I activity. HPLC, spectrophotometer, or
spectrofluorometer are needed when HHL, FAPGG or Abz are used, respectively. Natural
substrates as Angiotensin-I and Bradykinin are also used in these assays, but in a lesser
extent (108). Table 1.4 summarizes the methods currently used to assess the ACE-I activity
of food hydrolysates and bioactive peptides. ACE-I values are commonly expressed as IC50
values, i.e., the concentration of peptide needed to inhibit 50% of the ACE activity.
It should be highlighted that different methods and/or experimental conditions
influence the ACE-I values, even with identical amino acid sequence (107). The IC50 value

PART I. Chapter 1 Literature review
Brewer`s spent yeast: potential source of biological compounds and proteases for application in the production of food hydrolysates
29
strongly depends on various reaction parameters, such as, nature and concentration of
substrate, volume, enzyme quantity and detection methods of reaction products (108).
Thus, comparison between IC50 values of hydrolysate or peptides could lead to biased
conclusions if all parameters are not considered. For example, the IC50 value of the same
bioactive peptide Ile-Val-Tyr (IVY) was reported to be 0.479 mM by Iroyukifujita et al. (109),
2.399 mM by Wu et al. (110) and 14.74 mM by Miyakoshi et al. (111). Other example is the
peptide VY, which exhibited an IC50 of 10 μM by Matsufuji et al. (112) when FAPGG was
used as substrate and an IC50 value of 16 μM by Terashima et al. (113), using HHL as
substrate.

30
Table 1.4. In vitro analytical methods used for evaluation of the ACE-I activity of food hydrolysates and bioactive peptides
Substrate Detection Principle Reference
Synthetic
HHL
N-α-hippuryl-L-histidyl-L-
leucine
HPLC HHL as substrate of ACE is hydrolyzed to
hippuric acid (HA) and His-Leu (HL)
(114)
(115)
MEKCa (116)
FAPGG N-[3-(2-furyl)acryloyl]-L-
phenylalanyl-glycyl-glycine
Spectrophotometry FAPGG as a substrate of ACE is hydrolyzed to
FAG and Gly-Gly
(117)
(118)
(119)
(120)
Abz Abz-Gly-Phe-(NO2)-Pro Spectrofluorometry Abz as substrate of ACE is hydrolyzed to Abz-
Gly (o-aminobenzoylglycine (fluorescent
product)
(121)
(122)
Natural
Angiotensin-I HPLC Angiotensin I as substrate of ACE is hydrolyzed
to Angiotensin-II or bradykinin fragment 1-5,
respectively
(104)
(108)
Bradykinin HPLC
a Micellar Electrokinetic Chromatography

PART I. Chapter 1 Literature review
Brewer`s spent yeast: potential source of biological compounds and proteases for application in the production of food hydrolysates
31
1.5. Bioavailability methods
Studies related with bioactivity of food hydrolysates and bioactive peptides are mostly
restricted to in vitro experiments. In fact, only limited numbers of clinical trials were
conducted to test their efficacy as functional ingredients in humans (102), (123). However,
before exploitation of food hydrolysates and bioactive peptides as functional ingredients for
human nutrition, its stability in the GI tract, absorption and bioavailability in the human
organism must be investigated. Bioaccessibility is usually defined as the quantity or fraction
that is released from the food matrix in the GI tract and becomes available for absorption.
It is usually evaluated by in vitro digestion procedures, generally simulating gastric and
small intestinal digestion, followed by Caco-2 cells uptake (123). Bioavailability is defined
as the fraction of ingested nutrient or compound that reaches the systemic circulation and
is used by the body; besides GI digestion and absorption, also includes metabolism, tissue
distribution and bioactivity.
1.5.1. Simulated GI digestion
Proteolysis by GI enzymes is a critical factor that determines the biological activity of
food hydrolysates. During this process, Pepsin and Pancreatin can hydrolyze the food
hydrolysate, leading to (i) modifications of the biological peptide sequences already present
in the food hydrolysate; (ii) increasing formation of existing active peptides, and/or (iii) the
creation of new active peptides from sequences not previously exhibiting biological activity
in the food hydrolysate.
1,5.2. Cell culture systems
Compared with expensive and time-consuming animal studies and human clinical
trials, in vitro cultured cell model systems allow for rapid and inexpensive screening of active
compounds (88). Caco-2 cell monolayers, due to their similarity to the intestinal endothelium
cells, have been the most commonly reported model system in the literature for studying
intestinal permeability of bioactive compounds (124). This model can also be used to
evaluate the cytotoxicity of the compounds at the concentrations intended to be used to
obtain the desired bioactivity, as well as, to study the potential to inhibit intracellular
oxidation and to reduce inflammatory responses (88).
Upon culturing as a monolayer, Caco-2 cells differentiate to form tight junctions
between cells that will serve as a model of paracellular movement of compounds across the
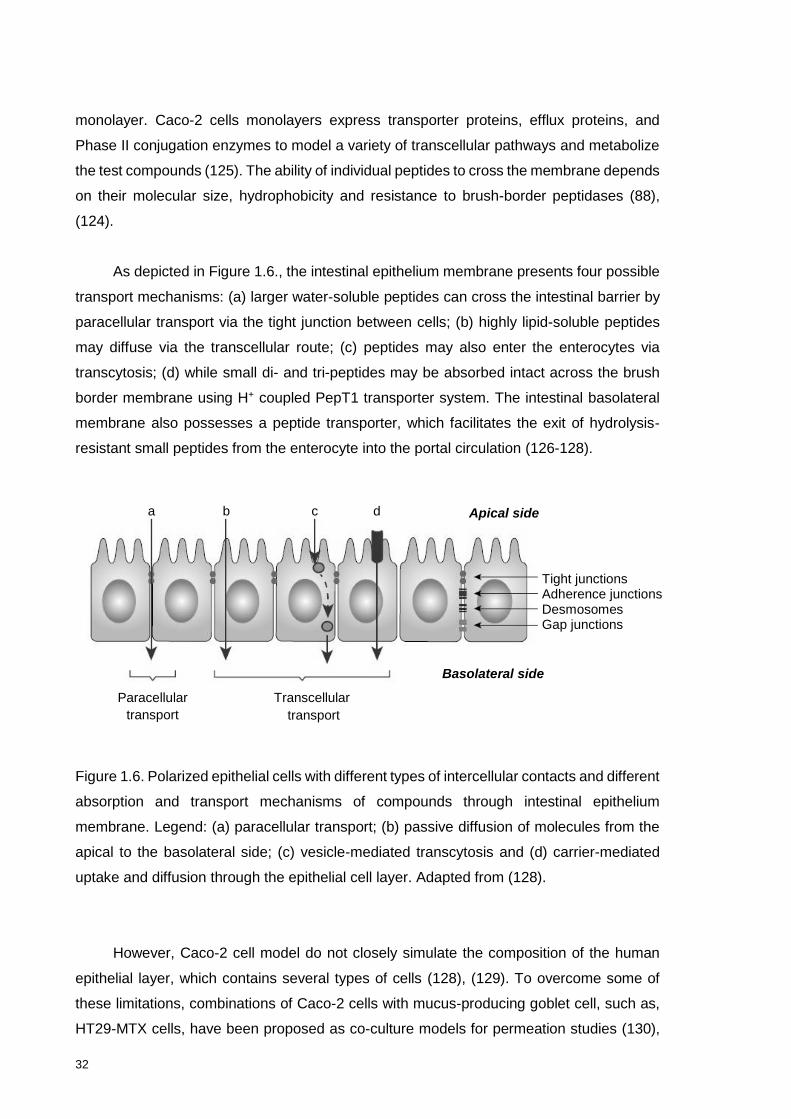
32
monolayer. Caco-2 cells monolayers express transporter proteins, efflux proteins, and
Phase II conjugation enzymes to model a variety of transcellular pathways and metabolize
the test compounds (125). The ability of individual peptides to cross the membrane depends
on their molecular size, hydrophobicity and resistance to brush-border peptidases (88),
(124).
As depicted in Figure 1.6., the intestinal epithelium membrane presents four possible
transport mechanisms: (a) larger water-soluble peptides can cross the intestinal barrier by
paracellular transport via the tight junction between cells; (b) highly lipid-soluble peptides
may diffuse via the transcellular route; (c) peptides may also enter the enterocytes via
transcytosis; (d) while small di- and tri-peptides may be absorbed intact across the brush
border membrane using H+ coupled PepT1 transporter system. The intestinal basolateral
membrane also possesses a peptide transporter, which facilitates the exit of hydrolysis-
resistant small peptides from the enterocyte into the portal circulation (126-128).
Figure 1.6. Polarized epithelial cells with different types of intercellular contacts and different
absorption and transport mechanisms of compounds through intestinal epithelium
membrane. Legend: (a) paracellular transport; (b) passive diffusion of molecules from the
apical to the basolateral side; (c) vesicle-mediated transcytosis and (d) carrier-mediated
uptake and diffusion through the epithelial cell layer. Adapted from (128).
However, Caco-2 cell model do not closely simulate the composition of the human
epithelial layer, which contains several types of cells (128), (129). To overcome some of
these limitations, combinations of Caco-2 cells with mucus-producing goblet cell, such as,
HT29-MTX cells, have been proposed as co-culture models for permeation studies (130),
Paracellular
transport
c a b d3
Tight junctions Adherence junctions Desmosomes Gap junctions
Apical side
Basolateral side
Transcellular
transport

PART I. Chapter 1 Literature review
Brewer`s spent yeast: potential source of biological compounds and proteases for application in the production of food hydrolysates
33
(131). Co-culture of Caco-2/HT29-MTX cells leads to the establishment of monolayers with
intermediate properties regarding transepithelial electrical resistance (TEER), peptide
hydrolysis and absorption. The proportion of 90:10, expressed as initial cell seeding for
Caco-2/HT29-MTX cells, is the most prevalent in the literature and accepted to better mimic
the natural epithelial barrier (129), (132), (133). Compared to Caco-2 monolayer, the
expression of goblet cells in HT29-MTX cell line increases absorption of lipophilic
compounds (131), (133).
Semipermeable plastic supports that can be fitted into the wells of multi-well culture
plates are usually used in cell culture models (Figure 1.7.). Cells are exposed to the
bioactive compounds either from the apical (upper compartment) or the basolateral side
(lower compartment) of the transwell system to evaluate, respectively, the cellular uptake
and cellular efflux of the test compounds. After incubation for various time periods, aliquots
from the opposite chambers are removed for the determination of the concentration of test
compounds and its percentage of permeability.
Figure 1.7. Two-chamber transwell transport model. Adapted from www.corning.com.
6-well plate
Transwell insert

34
1.5.3. In vivo assays
Once the potential biological activity of the food hydrolysates and bioactive peptides
is established through in vitro assay methods, animal studies and human clinical trials
should be conducted to confirm the desired biological function (102). To date, only a small
number of studies evaluated the efficacy of food hydrolysates bioactivity in humans (134)
and in animal models, such as, spontaneously hypertensive rats (SHR) (101), (135).
Results from the in vivo assays are crucial for a bioactive compound be approved by the
European Food Safety Authority (EFSA, Panel on Dietetic Products, Nutrition and Allergies)
as a new functional food or nutraceutical formulation (18).
CHAPTER 2
Nutritive value, antioxidant activity and phenolic
compounds profile of Brewer’s spent yeast extract
_____________________
This chapter describes the potential use of a BSY extract prepared
by mechanical disruption as a source of proteolytic enzymes and
biological activities, as antioxidant and ACE-I activities.

36
PART I. Chapter 2 Nutritive value, antioxidant activity and phenolic compounds profile of Brewer’s spent yeast extract
37
ABSTRACT
Brewer´s spent yeast (BSY) is the second major by-product from the brewing process.
Mechanical disruption of yeast cell wall can be used to obtain β-glucan rich ingredients with
applications in food industry and separation of inner yeast content with potential applications
as food and nutraceutical ingredients. In this work, the nutritional composition, including
minerals and B-complex vitamins, together with the antioxidant activity and phenolic
compounds profile of BSY extract, prepared by mechanic disruption of BSY and removal of
yeast cell wall, was investigated. Composition analysis showed that lyophilised BSY extract
presented 64.1% of proteins and 4.0% of RNA. The amino acid profile showed a high
proportion of essential amino acids. The BSY extract also contains macrominerals (Na, K,
Ca, Mg) and increased content of trace elements, such as, Zn (11.90 mg/100 g dw), Fe
(1.76 mg/100 g dw), and Mn (0.56 mg/100 g dw), and vitamins B3 (77.2 mg/100 mg dw),
B6 (55.1 mg/100 g dw) and B9 (3.0 mg/100 g dw) when compared with other BSY extracts
described in the literature. It also presents antioxidant activity, confirmed by three different
assays. HPLC-DAD analysis showed that two phenolic compounds were detected as free
forms, gallic acid (21.3 mg/100 g dw) and (±) catechin (34.2 mg/100 g dw), and alkaline
hydrolysis released other bounded phenolic compounds: protocatechuic acid and p-
coumaric acid. The nutritive value, antioxidant properties and phenolic composition of the
lyophilised BSY extract indicates that it can be an interesting ingredient for food and
nutraceutical industries.
2.1. INTRODUCTION
Brewer`s spent yeast (BSY) is the second major by-product from the brewing process.
It is low in calories, fat and carbohydrates, however, it can be a valuable source of
inexpensive fibre, mainly β-glucans (136-139), nucleotides (50), vitamins and minerals (5).
In the brewing process, serial repitching of Saccharomyces biomass is usual; thus,
yeast is reused four to six times before its disposal (140). Yeast presents adaptive response
to oxidative stress similar to that of human cells, consequently vitamins, namely B6 and
B12, and minerals (enzyme co-factors), such as, zinc, copper and manganese can
accumulate in yeast (51). Moreover, Saccharomyces adsorb phenolic compounds from
exterior medium, increasing its antioxidant activity and phenolic compounds content (141).
Although these compounds exhibit biological activities, such as, prevention of age-related
diseases, inhibition of cancer cell proliferation and enhancement of immune response (9),
(45), (76), (142), until now efforts to recover bioactive compounds from BSY are limited.
38
Moreover, the separation of yeast compounds for use in food applications requires
efficient means of disrupting cell walls and separating the products of interest. Mechanical
processes can be used to separate yeast cell-wall β-glucans, which are known for lowering
cholesterol and triacylglycerols in blood, enhancing the immune system and the anti-
inflammatory activity, stimulating the skin cell response to combat free radicals and delaying
aging process. EFSA has already approved the use of Saccharomyces β-glucans - referred
to as “yeast beta-glucans” - as a new food ingredient and suggests a use ranging between
50 and 200 mg per serving (143). However, new applications for the inner cell content are
needed to make the process of β-glucans’ separation profitable.
Attempts to reuse the BSY in biotechnological processes include production of flavour
enhancers (48), (50). In a previous work, mechanical rupture of cell wall, using glass beads,
to separate cell wall constituents and produce a yeast extract rich in nucleotides that can
be used as flavour enhancers was described (50). However, the full characterization of this
extract is of major relevance to find new applications for BSY. Thus, the goal of this work
was to study the nutritional composition, the minerals and B-complex vitamins content, the
antioxidant activity and the phenolic profile of the BSY extract obtained by mechanical
disruption, removal of cell wall and lyophilisation, to assess its potential interest as an
ingredient in food and nutraceutical industries.
2.2. MATERIAL AND METHODS
2.2.1. Reagents and Standards
HPLC grade solvents were from Merck (Darmstadt, Germany). Iron (III) chloride
hexahydrate; 2,4,6-tripyridyl-s-triazine (TPTZ); 2,2-diphenyl-1-picrylhydrazyl (DPPH); 6-
hydroxy-2,5,7,8-tetramethylchroman-2-carboxylic acid (Trolox); potassium ferricyanide and
trichloroacetic acid (TCA) were purchased from Sigma Chemical Co. (St. Louis, MO, USA).
Ultrapure water was obtained from a Seralpur Pro 90 CN water purification. For mineral
analysis, all solutions were prepared using polypropylene laboratory ware: pipette tips
(VWR, Radnor, PA), volumetric flasks (Kartell, Milan, Italy) and centrifuge tubes (TRP,
Trasadingen, Switzerland). High purity HNO3 (≥69% w/w, TraceSELECT® Ultra, from Fluka,
L’Isle d’Abeau Chesnes, France) and H2O2 (30% v/v, TraceSELECT® from Fluka, Seelze,
Germany) were used as received. Mineral standard solutions were prepared from
AccuTrace™ (AccuStandard®, New Haven, CT, USA) 10 µg/mL multi-element ICP-MS
standards. Single-element standard solutions of Na, K, Ca, Mg and Fe, water-soluble
vitamins and polyphenol standards were obtained from Sigma Chemical Co. (St. Louis, MO,
USA).
PART I. Chapter 2 Nutritive value, antioxidant activity and phenolic compounds profile of Brewer’s spent yeast extract
39
2.2.2. Samples
Six different batches of BSY biomasses, collected between January and March of 2014 and
with 3, 4, 5 and 6 repitchings in the brewing fermentation step, were kindly supplied as slurry
by Unicer brewing (Leça do Balio, Portugal). Biomasses were transported to the laboratory
under refrigerated conditions, protected from light and stored at 4ºC until extract preparation
(1 day maximum).
2.2.3. BSY extract preparation
The debittering process and the mechanical disruption procedure of the yeast cells were
performed as described by Vieira et al. (50). All steps were carried out under refrigerated
conditions to minimize autolysis. Yeast cell wall was removed by centrifugation and the
resulting clear supernatants (extracts of the inner yeast content) obtained from the six BSY
biomasses were freeze-dried and stored at -20°C until further analyses.
2.2.4. Proximate composition
The composition of BSY extracts were analysed in triplicate and mean results were
expressed as % dw. Moisture content was determined at 105ºC until constant weight. Total
nitrogen was analysed by the Kjeldahl method (144) and protein content was estimated
using factor conversion of 6.25; free α-amino nitrogen was measured by the ninhydrin
method using glycine as standard (145). Total lipid and ash contents were determined
according to AOAC methods (144) and total carbohydrate was determined by difference.
RNA was extracted according to Liwarska-Bizukojc and Ledakowicz (146) method; the
concentration of RNA was determined based on Hebert et al. (147) method.
2.2.5. Amino acid composition and chemical score
BSY extracts were submitted to protein hydrolysis with 6 M HCl at 110ºC for 24 h and further
derivatization was conducted according to the method validated by Pérez-Palacios et al.
(148). All amino acids except tryptophan were separated by Gas chromatography-mass
spectrometry (GC/MS) and the relative amino acid composition was expressed as g/100 g
of protein. The parameters used for estimating the nutritive value of the BSY extract protein
fraction were: 1) essential amino acid (EAA) index, calculated considering essential amino
acids in the standard protein as described by FAO/WHO (149); chemical score; and protein
efficiency ratio (PER) calculated from the equation developed by Lee et al. (150). The
chemical score and PER were calculated using the following equations (1 and 2):
Chemical score = EAA in BSY extract EAA in standard protein (1) ⁄
PER (Eq. 3) = −1.816 + 0.435[Met] + 0.780[Leu] + 0.211[His] − 0.944[Tyr] (2)
40
2.2.6. Analyses of minerals
2.2.6.1. Sample preparation
Microwave-assisted acid digestion was performed in PTFE vessels using 300 mg of sample,
4 mL of 69% (w/w) HNO3 and 1 mL of 30% (v/v) H2O2 and the following microwave heating
program: 250 W for 1 min, 0 W for 2 min, 250 W for 5 min, 400 W for 5 min, and 600 W for
5 min. After digestion, vessels content was transferred to 25 mL volumetric flasks and the
volume was made-up with ultrapure water. Solutions were then analysed by Inductively
coupled plasma mass spectrometry (ICP-MS) and Atomic absorption spectrometry (AAS).
2.2.6.2. Inductively coupled plasma mass spectrometry analysis
ICP-MS analyses were carried out under the following instrumental conditions: argon flow
rate 14 L/min; auxiliary argon flow rate 0.8 L/min; nebulizer flow rate 0.95 L/min; RF power
1550 W. The elemental isotopes (m/z ratios) 52Cr, 55Mn, 57Fe, 59Co, 65Cu, 66Zn, 82Se and
95Mo were monitored for analytical determinations; 45Sc, 89Y, 115In and 159Tb were used as
internal standards. The instrument was tuned daily for maximum signal sensitivity and
stability, as well as, for low oxides and double charged species formation using the Tune B
iCAP Q solution (Thermo Fisher Scientific; 1 μg/L of Ba, Bi, Ce, Co, In, Li and U in 2% HNO3
+ 0.5% HCl). The internal standard solution was prepared by appropriate dilution of the
corresponding AccuStandard® (New Haven, CT, USA) solution (ICP-MS-200.8-IS-1: 100
μg/mL of Sc, Y, In, Tb and Bi). Calibration standards were prepared from a SCP Science
(Baie-d'Urfé, Quebec, Canada) 100 μg/mL multi-element ICP-MS standard solution
(PlasmaCAL SCP-33-MS). The detection limits were calculated as the concentration
corresponding to 3 standard deviations of 10 replicate integrations of the blank (HNO3 2%
v/v).
2.2.6.3. Atomic absorption spectrometry analysis
Determination of Na, K, Ca and Mg was performed using a Perkin Elmer (Überlingen,
Germany) 3100 flame (air-acetylene) atomic absorption spectrometer instrument.
2.2.7. Analysis of B-complex vitamins
2.2.7.1. Extraction of B-complex vitamins
Extraction of vitamins from BSY extracts was performed according to Parlog et al. (151).
The lyophilized extract (1 g) was homogenized with 10 mL of mobile phase A (50 mM
ammonium acetate/methanol, 99:1), sonicated for 30 min at 27±3°C in ultrasonic water bath
(FungiLab SA, Barcelona, Spain), centrifuged and then filtered through a 0.22 μm
membrane, prior to HPLC injection.

PART I. Chapter 2 Nutritive value, antioxidant activity and phenolic compounds profile of Brewer’s spent yeast extract
41
2.2.7.2. Preparation of B-complex vitamins standard solution
The aqueous stock solutions of each vitamin were prepared every week and stored in the
refrigerator in amber-glass bottles to protect vitamins from light-induced oxidation. Individual
standard stock solutions of vitamin B2 (riboflavin), B3 (nicotinic acid), B6 (pyridoxine), and
B12 (cyanocobalamin) were prepared by dissolving 10 mg of each compound in 10 mL of
ultrapure water containing 0.01% of trifluoracetic acid, as described by Grotzkyj et al. (152).
Standard stock solution of folic acid (B9) was prepared by dissolving 10 mg of the compound
in 100 mL of pure water containing 4 mL of 1 M NaOH, as described by Ciulu et al. (153).
Working standard solutions were prepared fresh daily and kept protected from light. The
calibrations curves were made by running 6 different standard solutions (6 concentration
levels) of each vitamin in the HPLC system.
2.2.7.3. Chromatographic conditions for separation of B-complex vitamins
High Performance Liquid Chromatography (HPLC) analysis was carried out according to
the procedure described by Parlog et al. (151). The injection volume was 30 µL and all
samples were run in triplicate. Photodiode array detection (PDA) was used to perform
spectral scans over the range 230-360 nm and quantification was conducted at 260 nm for
B2, B3 and B6, and at 280 nm for B9 and B12. Peak identification and purity were
investigated by comparing the UV spectra of each individual compound when analysed in
mixtures or in single compound standard solutions. Analysis was carried out using an
analytical HPLC system (Jasco, Tokyo, Japan), equipped with a quaternary low pressure
gradient HPLC pump (Jasco PU-1580), a degasification unit (Jasco DG-1580-53 3-line
degasser), an autosampler (Jasco AS-2057-PLUS), a MD-910 multiwavelengh detector
(Jasco) and a 7125 Rheodyne injection valve (California, USA). The column was a
Chrompack P 300 RP (polystyrenedivinylbenzene copolymer, 8 µm, 300Å, 150 x 4.6 mm
i.d.) (Chrompack, Middleburg, The Netherlands). Data acquisition was accomplished using
Borwin Controller software, version 1.50 (JMBS Developments, Le Fontanil, France).
2.2.8. Antioxidant activity of BSY extracts
2.2.8.1. Ferric reducing antioxidant potential (FRAP) assay
The measurement of the Ferric reducing antioxidant potential assay (FRAP) was done
according to Jansen and Ruskovska (154). Trolox was used as standard at 0.0025-0.125
mg/mL to generate a calibration curve and results (mean values ± standard deviation) were
expressed as milligrams of Trolox Equivalent per gram of dry weight BSY extract (mg
TE/100 g dw).
42
2.2.8.2. DPPH radical scavenging capacity assay
The 2,2-Diphenyl-1-picrylhydrazyl radical-scavenging capacity (DPPH) assay was
performed as described by Herald et al. (155). Trolox was used as standard at 0.0025-0.125
mg/mL to generate a calibration curve and data was reported as means ± standard deviation
for three replications. Results (mean ± standard deviation) were expressed as milligrams of
Trolox Equivalent per gram of dry weight BSY extract (mg TE/100 g dw).
2.2.8.3. Ferricyanide reducing power (RP) assay
The ferricyanide reducing power (RP) was determined as described by Almeida et al. (156).
Trolox was used as standard at 0.0025-0.125 mg/mL to generate a calibration curve and
results (mean ± standard deviation) were expressed as milligrams of Trolox Equivalent per
gram of dry weight BSY extract (mg TE/100 g dw).
2.2.9. Extraction of phenolic compounds
The extraction of phenolic compounds was conducted as described by Khamam et al. (157):
50 mg of lyophilized BSY extract were homogenized with 1 mL of mobile phase A for
extraction of free phenolic compounds, whereas bounded phenolic compounds were
extracted after alkaline hydrolysis: 50 mg of lyophilized BSY extract was treated with 1 mL
of 2 M NaOH for 2 h at room temperature and constant agitation (250 rpm). After
centrifugation at 5,000 rpm for 5 min, the resultant extract was acidified to pH 2 using 6 M
HCl and extracted three times with diethyl ether. The ether extracts were mixed, evaporated
to the dryness under vacuum at 35°C and finally dissolved in 1 mL of mobile phase A.
2.2.9.1. HPLC analysis of phenolic compounds
HPLC analysis was carried out according to the procedure described by Khanam et al. (157)
with some adjustments. The binary mobile phase consisted of 6% (v/v) glacial acetic acid
in water (solvent A) and acetonitrile (solvent B) and was pumped at a flow rate of 0.7
mL/min, for a total run time of 75 min, at temperature of 35ºC. A gradient program was used
as follows: 0-3.5% B for 11 min, 3.5-5% B for 9 min, 5-10% B for 3 min, 10-13% B for 7 min,
13-15% B for 15 min, 15-30% B for 15 min, 30-50% B for 5 min, 50-100% B for 5 min and
returning to the starting conditions for 5 min (0% B) before the next sample injection. The
injection volume was 20 µL. PDA was used to perform spectral scans over the range 190-
400 nm and quantification was conducted at 236 nm for (±)-catechin, (-)-epicatechin and
rutin; at 260 nm for protocatechuic and vanillic acids; at 280 nm for gallic, syringic and
cinnamic acids; at 320 nm for the derivatives of cinnamic acid (caffeic, p-coumaric,
chlorogenic and ferulic acids) and at 350 nm for isoquercetin. Phenolic compounds
identification was performed by comparison with retention times and spectra of standards,
PART I. Chapter 2 Nutritive value, antioxidant activity and phenolic compounds profile of Brewer’s spent yeast extract
43
as well as, co-elution after fortification with the standards. Quantification was based on
external standards calibration and samples were analysed in triplicate. The HPLC system
was from Gilson (Villiers le Bel, France), consisting of two pumps (305 and 306), an 805
manometric module, a 811C dynamic mixer, an injection port with a 20 μL loop (Rheodyne,
Rohnert Park, California, USA) and a PDA (Varian, Santa Clara, Califórnia, USA) controlled
by a data processor software (Varian Santa Clara, Califórnia, USA). Chromatographic
separation was achieved with a 150 x 4.6 mm, Spherisorb® ODS-2 80Å (3 µm particle size)
column from Waters (Milford, Massachusetts, USA).
2.3. RESULTS AND DISCUSSION
2.3.1. Nutritional composition of BSY extracts
The proximate composition of freeze-dried BSY extracts obtained using a mechanic
disruption process is shown in Table 2.1. BSY extracts contained low moisture (7.7%), low
fat content (1.3% dw) and high protein content (64.1% dw), which contributes to its stability
during storage. Protein content was in agreement with the value reported by Caballero-
Córdoba and Sgarbieri (25), in which a mechanic disruption using glass beads was also the
process used for BSY extract production, although an alkaline treatment was previously
performed for debittering of brewer’s yeast. The ash content (14.0%) and the total amino
nitrogen (3.8%) were in agreement with the values reported by Saksinchai et al. (26), in
which a autolysis process (50ºC, 20 h) was adopted to produce the BSY extract. Also, the
RNA content (4.0%) was in agreement with Vieira et al. (50), confirming the potential use
of this extract for flavour enhancers production.
2.3.1.1. Amino acid composition
The amino acid composition of BSY extracts and chemical scores are also presented
in Table 2.1. Results indicated an amino acid profile rich in essential amino acids compared
to the reference amino acid pattern recommended by FAO/WHO (1990) (149) for adult
humans. These results also agree with the amino acid profile obtained by Caballero-
Córdoba and Sgarbieri (25). Generally, S-amino acids (methionine and cysteine) are the
limiting factor to the nutritive value of yeast protein. However, as reported in Table 2.1, S-
amino acids were above the FAO/WHO reference (149). Essential amino acids account for
about 40% of total amino acids, being in agreement with the reference value recommended
by FAO/WHO (149). The protein efficiency ratio (PER) was 2.4 and BSY extracts presented
a high content of the flavour enhancer amino acids (glutamic acid, aspartic acid, glycine
and alanine), accounting to 34.0% of total amino acids. The amino acid composition

44
indicates that protein fraction of BSY extracts presents a good potential for applications in
food and dietary supplement industries as a protein rich ingredient.
Table 2.1. Nutritional composition of BSY extract

PART I. Chapter 2 Nutritive value, antioxidant activity and phenolic compounds profile of Brewer’s spent yeast extract
45
2.3.1.2. Minerals content
The macrominerals (Na, K, Ca, Mg) and trace elements (Cr, Fe, Mn, Cu, Co, Mo, Se,
Zn) composition of BSY extracts is also presented in Table 2.1. Due to the lack of
information regarding the mineral composition of BSY extracts prepared by mechanic
disruption using glass beads, as performed in this work, results were compared with the
mineral profile of BSY extracts reported by Alvim et al. (28), in which a dehydrated yeast
extract was prepared by spray dryer. The sodium content, 1228.6 mg/100 g dw, was lower
than data reported by Alvim et al. (28), 1475 mg/100 g dw. By the contrary, the potassium
content (91.5 mg/100 g dw) was similar to the content reported by Alvim et al. (28), 99
mg/100 g dw. Both minerals play an important role in the regulation of cell acid-base balance
and water retention, and are essential for ribosomal protein synthesis. The calcium and
magnesium contents were 27.1 mg/100 g dw and 273.6 mg/100 g dw, respectively. These
elements helps in bone formation, muscle function, neurotransmission, cell division and
blood coagulation, and magnesium is important in the appropriate utilization of vitamins B
and E and in maintaining fluid and electrolyte balance. According to the National Academy
of Science (158), the Dietary Reference Intakes (DRIs) of Na, K, Ca and Mg for a young
adult are 1500, 4700, 1000 and 420 mg, respectively.
Concerning to trace elements, mean contents of 0.019 mg/100 g dw and 0.030
mg/100 g dw were found for Cr and Mo, respectively, whereas the content of Zn was 11.90
mg/100 g dw, Fe content was 1.755 mg/100 g dw and Mn content was 0.564 mg/100 g dw.
According to the National Academy of Science (158), the DRIs of these elements for a
young adult are 0.025-0.035 mg for Cr, 0.045 mg for Mo, 8-11 mg for Zn, 8-18 mg for Fe,
and 1.8-2.3 mg for Mn. The BSY extract can be used as supplement to fulfil these
requirements.
2.3.1.3. B-complex vitamins content
Vitamins B3, B6 and B9 were quantified in the BSY extracts (Table 2.1). The mean
content of vitamin B3 (77.2 mg/100 g dw) was significantly higher than the content reported
by Pinto et al. (32) (0.79 mg/100 g dw) for lyophilized brewer’s yeast surplus obtained after
alkaline treatment without removal of cell wall. Brewer’s yeast is considered one of the best
dietary sources of vitamin B3; this vitamin participates in several metabolic functions and
also assists in antioxidant and detoxification functions. The mean content of vitamin B6 was
55.1 mg/100 g dw, which was significantly higher than the content reported by Pinto et al.
(32) for lyophilized brewer’s yeast surplus, which was 9.99 mg/100 g dw. This vitamin plays
a vital role in the function of several enzymes that catalyse essential chemical reactions in
the human body, especially those involved in protein and amino acid metabolism.
Regarding to vitamin B9, the mean content found (3.0 mg/100 g dw) was also higher than

46
the values reported by Pinto et al. (32) (0.25 mg/100 g dw). This vitamin plays a central role
in one-carbon metabolism; derivatives of folate act as co-factors, carrying one-carbon units
for various reactions in the cell, such as, synthesis of certain amino acids and nucleotides
(159). Vitamins B2 and B12 were not detected in BSY extracts. Pinto et al. (32) quantified
both vitamins (at 1.38 and 75.8 mg/100 g dw mean levels, respectively), but only in the
lyophilised BSY without any treatment. These results indicate that the processes used to
obtain the BSY extracts significantly influence their vitamin composition, but the removal of
yeast wall concentrated the content of vitamins B3, B6 and B9.
2.3.2. Antioxidant activity
The mean values of antioxidant activity of BSY extracts evaluated by FRAP, DPPH
and RP were, respectively, 261±14; 59.7±2.5 and 127.6±1.0 mg TE/100g dw. Significant
positive correlations were observed between results from FRAP versus DPPH (R2 = 0.9721)
and versus RP (R2 = 0.8750), and also between DPPH versus RP (R2 = 0.9632).
2.3.3. Phenolic compounds
The free and bound phenolic compounds were analysed by HPLC. As shown in Table
2.2, only gallic acid and (±)-catechin were quantified in the free fraction, being the (±)-
catechin the most representative compound (62%). In the bound fraction, six phenolic
compounds were quantified in the following order of abundance: cinnamic acid (1.2 mg/100
g dw), gallic acid (2.1 mg/100 g dw), ferrulic acid (9.2 mg/100 g dw), p-coumaric acid (10.3
mg/100 g dw), protocatechuic acid (13.1 mg/100 g dw) and (+)-catechin (24.6 mg/100 g
dw). The total phenolic compounds content in the free and bound fractions were,
respectively, 55.5 mg/100 g dw and 60.6 mg/100 g dw. No information was found in
literature concerning phenolic compounds content in BSY.
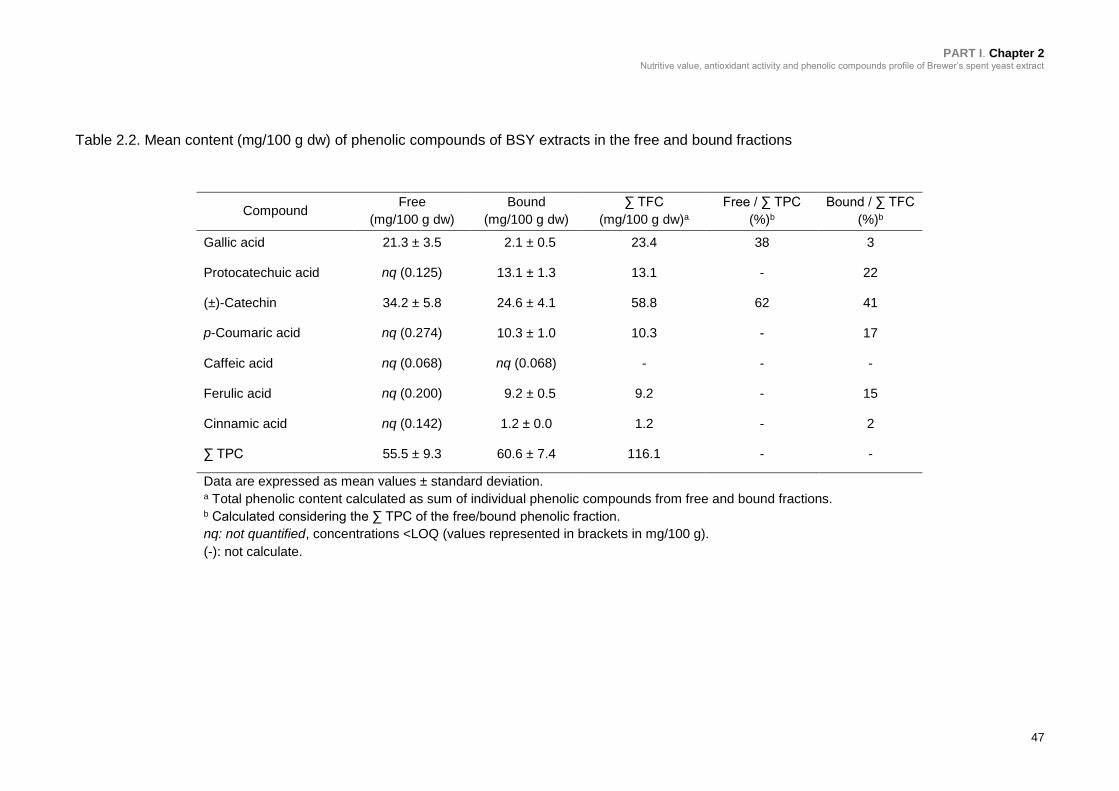
PART I. Chapter 2 Nutritive value, antioxidant activity and phenolic compounds profile of Brewer’s spent yeast extract
47
Table 2.2. Mean content (mg/100 g dw) of phenolic compounds of BSY extracts in the free and bound fractions
Compound Free
(mg/100 g dw)
Bound
(mg/100 g dw)
∑ TFC
(mg/100 g dw)a
Free / ∑ TPC
(%)b
Bound / ∑ TFC
(%)b
Gallic acid 21.3 ± 3.5 2.1 ± 0.5 23.4 38 3
Protocatechuic acid nq (0.125) 13.1 ± 1.3 13.1 - 22
(±)-Catechin 34.2 ± 5.8 24.6 ± 4.1 58.8 62 41
p-Coumaric acid nq (0.274) 10.3 ± 1.0 10.3 - 17
Caffeic acid nq (0.068) nq (0.068) - - -
Ferulic acid nq (0.200) 9.2 ± 0.5 9.2 - 15
Cinnamic acid nq (0.142) 1.2 ± 0.0 1.2 - 2
∑ TPC 55.5 ± 9.3 60.6 ± 7.4 116.1 - -
Data are expressed as mean values ± standard deviation. a Total phenolic content calculated as sum of individual phenolic compounds from free and bound fractions. b Calculated considering the ∑ TPC of the free/bound phenolic fraction.
nq: not quantified, concentrations <LOQ (values represented in brackets in mg/100 g).
(-): not calculate.
48
2.4. CONCLUSIONS
This study provides a detailed analysis of the nutritional composition, antioxidant
activity and phenolic compounds profile of BSY extracts produced by mechanic disruption
of brewer’s spent yeast (Saccharomyces pastorianus) and removal of the cell walls (for
separation of β-glucans). Results showed that the extracts from the inner content of BSY
cells are a rich source of proteins containing essential amino acids, RNA, vitamins (B3, B6
and B9) and minerals. Higher contents were observed in comparison with other BSY
extracts described in the literature. Chromatographic analysis also showed that BSY
extracts contains phenolic compounds in both the free and bounded forms: gallic acid,
protocatechuic acid, (±)catechin, p-coumaric, ferulic and cinnamic acids were quantified.
Additionally, BSY extracts present antioxidant activity, which makes this yeast extract a
potential ingredient to be used in the formulation of functional foods and nutraceuticals.
Moreover, since BSY extracts production complements the use of yeast cell wall for β-
glucans and fibre obtaining, it makes the whole process much cost-effective.
49
CHAPTER 3
A bioactive ingredient obtained from the inner cellular
content of Brewer´s spent yeast
_____________________
This chapter explores the influence of the yeast reuse during beer
fermentation step on the proteolytic activity and biological activities of
the BSY extract prepared by mechanical disruption.

50

PART I. Chapter 3 A bioactive ingredient obtained from the inner cellular content of Brewer´s spent yeast
51
ABSTRACT
During brewing, Saccharomyces yeast is used in the fermentation process several times
until its disposal. Yeast surplus is the second major brewing by-product, mostly used for
animal feed. Despite its underutilization, it can be of value as a source of bioactive
compounds. In this work, a new ingredient was obtained from the inner cell content of
Brewer´s spent yeast (BSY) by mechanical disruption of the cell wall of yeast surplus with
different number of reuses in the brewing process. Proximate composition, amino acid
profile, molecular weight distribution and biological activities (proteolytic, antioxidant and
angiotensin converting enzyme-inhibitory (ACE-I) activity) of freeze-dried BSY extracts
were assessed. Additionally, the stability of the biological properties of BSY extract during
6 months of storage at -25ºC was evaluated.
Proteins were the major components of BSY extracts, its amino acid profile was well-
balanced for human consumption. The antioxidant activities of the BSY extracts were not
influenced by the serial reuse of yeast biomass in the brewing process, neither by the
storage period. However, BSY extracts prepared from yeast with lower number of reuses in
brewing process presented the highest proteolytic activity and maximum ACE-I activity.
BSY extracts are promising as a protein rich bioactive ingredient for food, nutraceutical or
cosmetic industries.
3.1. INTRODUCTION
Currently, there is an increased interest in exploitation of yeasts as a natural resource
of bioactive compounds for use as ingredients in food. Brewing process produces annually
considerable amounts of brewer´s spent yeast (BSY), which constitutes a serious
environmental problem. This biomass is underutilized, being normally used as low-
economical valuable animal feed products (5). However, BSY are GRAS microorganisms,
containing several beneficial nutrients, such as, vitamins B complex (folic, biotin), minerals
(zinc, chromium, iron, magnesium), nucleic acids, amino acids and glutathione (2).
Therefore, nutritional and economical valorization of this relatively inexpensive waste to
recover natural compounds has become an important contribution to the sustainable
development of the brewing process (27), (36), (63). Saccharomyces yeast cells also
contain numerous vacuolar proteases, including serine, aspartyl and metalloproteases,
which can be used in fermentation processes to obtain hydrolysates with several biological
activities (44), (160). Potential applications of BSY has been reviewed by several authors
(2), (161). Other alternative is the extraction of the inner yeast cell components, namely,

52
amino acids, peptides, proteins, carbohydrates, minerals and nucleotides. They can be
commercially produced on a large scale by hydrolysis, autolysis or plasmolysis of BSY for
use in the food industry, for example as flavour enhancers to replace glutamates and
nucleotides in many processed foods (2), (10) or used as healthy food ingredients (61).
Until now, few studies have focused in the bioactive properties of yeasts. Some
studies have demonstrated that they may exhibit antioxidant properties, such as, prevention
of macular degeneration, inhibition of cancer cell proliferation, enhancement of immune
response and increase glucose tolerance (2), (45), (76). These beneficial effects have been
attributed to the presence of various functional components, including polysaccharides,
flavonoids, phenolic acids and carotenoids (35), (36). Also, enzymatic hydrolysis of yeast
substances have generated peptides with high levels of radical scavenging activities, oral
glucose tolerance activity and ACE-I effect (76), (86).
Serial repitching of Saccharomyces biomass is usual in the brewing process; yeast is
reused four to six times before its disposal (5). This practice can induce cellular stress.
Several antioxidants can be produced in yeasts grown under stressful conditions or in
response to fermentation medium ingredients, such as, phenolics or additives that are
known to be toxic to cells grown aerobically (36). Therefore, it can be of interest to
understand the influence of yeast repitching in the bioactivity of BSY extracts.
In this work, BSY extracts were prepared from the inner cell content using yeast
surplus with different reuses in the fermentation process. Mechanical cell disruption was
achieved by vortexing using glass beads, under refrigerated conditions. The proteolytic
activity, the antioxidant activity and the ACE-I activity of freeze-dried extracts were
evaluated. Furthermore, since BSY extract utilization as a functional ingredient depends
largely on the stability upon storage; the effect of frozen storage on the stability of the
biological activity was also evaluated. To the best of our knowledge, this is the first
description of the influence of serial repitching in the bioactivity of BSY extracts. The use of
these BSY extracts with biological properties for food and nutraceutical applications could
be an ideal approach to reuse the Saccharomyces pastorianus surplus from the brewing
process and simultaneously to overcome environmental industrial problems.
PART I. Chapter 3 A bioactive ingredient obtained from the inner cellular content of Brewer´s spent yeast
53
3.2. MATERIAL AND METHODS
3.2.1. Chemicals, reagents and equipments
Folin-Ciocalteu phenol reagent; 2,2-Diphenyl-1-picrylhydrazyl (DPPH); sodium dodecyl
sulfate (SDS); 2,4,6-tripyridyl-s-triazine (TPTZ); iron (III) chloride hexahydrate; ascorbic
acid; bovine serum albumin (BSA); 6-hydroxy-2,5,7,8-tetramethylchroman-2-carboxylic
acid (Trolox); catechin; gallic acid; molecular weight standard (205-6.6 kDa); rabbit lung
acetone powder for Angiotensin-I-converting enzyme (ACE) extraction were all purchased
from Sigma-Aldrich (St. Louis, MO, USA). Methanol, sodium acetate, sodium carbonate
decahydrate, sodium nitrite, aluminum chloride and sodium hydroxide were purchased from
Merck (Darmstadt, Germany). o-aminobenzoylglycyl-p-nitro-phenylalanylproline (o-ABz-
Gly-Phe(NO2)-Pro) was purchased from Bachem Feinchemikalien (Bubendorf,
Switzerland). Ultra-pure water was obtained from a Seral-Seralpur Pro 90 CN water
purifying system. All reagents used were of analytical grade.
Spectrophotometric analyses were carried out using a BMG LABTECH´s SPECTROstar
Nano-microplate, cuvette UV/Vis absorbance reader (Offenburg, Germany). Fluorimetric
analyses were carried out using a fluorescence microplate reader (FLUOstar Optima, BMG
Labtech GmbH). GC-MS analyses were carried out in an Agilent 6890 gas chromatograph
(Agilent, Avondale, PA, USA) coupled to a MS detector (Agilent 5973).
3.2.2. Samples
Twelve samples of 0.5 kg of BSY (Saccharomyces pastorianus) used to produce lager beer
were collected: 3 samples of yeast biomass used twice in the brewing process (coded as
R2), 3 samples of yeast biomass with three serial reuses in the brewing process (coded as
R3), 3 samples of yeast biomass with four serial reuses in the brewing process (coded as
R4) and 3 samples of BSY containing a mixture of biomasses with different number of
reuses in fermentation process (coded as MIST). All samples were provided as slurry by
the Unicer brewing (Leça do Balio, Portugal); transported in a 1 liter glass bottle to
laboratory under refrigerated conditions and stored at 4ºC until preparation procedure (1
day maximum).
3.2.3. Preparation of BSY extracts
All steps were performed under refrigerated temperatures to minimize autolysis. Firstly,
BSY was centrifuged at 5,000 x g for 15 min at 4°C to remove beer liquor. The biomass was
washed three times with phosphate buffer, pH 6.0 (volume ratio 1:3). After centrifugation at
5,000 x g during 15 min at 4°C, the yeast cell pellet was weighed and stored under
refrigerated conditions. A mechanical disruption method by Vieira et al. (50) with some
54
modifications was adopted to promote the breakdown of yeast cell wall and release the
inner content into the extracellular environment. Biomass was destroyed with glass beads
with a diameter of 0.60 mm at a ratio 1:1:1 (biomass: phosphate buffer pH 6.0: glass beads);
(m/v/m), by vortexing 10 times (1 min each) with 1 min cooling intervals on ice-water bath
to keep the temperature below 4°C during the entire process. After removing the glass
beads by allowing the suspension to stand, the homogenate was centrifuged at 12,000 x g
for 40 min at 4ºC (twice) to remove the cell debris. The resulting clear supernatant was
carefully collected and freeze-dried. The supernatant was then resuspended in phosphate
buffer pH 6.0 and divided into aliquots. These BSY resuspended extracts were used for
time zero analysis and subsequently frozen at -25 °C for further analyses (1, 2, 4 and 6
months).
3.2.4. Proximate Composition
Freeze-dried BSY extracts were assayed for protein content (total nitrogen determined by
Kjeldahl method x 6.25), fat content (Soxhlet extraction with n-hexane for 12 h), ash content
(incineration in a muffle furnace at 550ºC until the ash had a white appearance) and
moisture (oven at 105ºC until constant weight) according to AOAC official methods (144).
All assays were performed in triplicate and the contents were expressed on a dry weight
basis (% dw).
3.2.5. Sodium dodecyl sulfate polyacrylamide gel electrophoresis (SDS-PAGE)
Relative molecular weight profiles of BSY extracts were determined by sodium dodecyl
sulfate gel (SDS)-polyacrylamide electrophoresis (PAGE) analysis. Separation gels
consisted of a 4% polyacrylamide stacking gel and a 15% polyacrylamide resolving gel and
were performed according to Laemmli (162) method. For all BSY extracts, the weight of
protein loaded (determined by Lowry method (163)) was 25 µg. Gels were stained in
Coomassie brilliant blue R-250 (0.125% in 50% methanol and 10% acetic acid) for 1 h and
destained using an acetic acid-methanol mixture (10% acetic acid and 50% methanol)
during 1 h, followed by 5% methanol (v/v) and 7% (v/v) acetic acid, repeatedly until the
protein bands were clearly visible. The standard proteins were simultaneously run for
protein identification: myosin (205 kDa), β-galactosidase (116 kDa), phosphorilase β (97
kDa), transferrin (80 kDa), bovine serum albumin (66 kDa), glutamate dehidrogenase (55
kDa), ovalbumin (45 kDa), carbonic anhidrase (31 kDa), trypsin inhibitor (21 kDa), lysozyme
(14 kDa) and aprotinin (6.6 kDa).

PART I. Chapter 3 A bioactive ingredient obtained from the inner cellular content of Brewer´s spent yeast
55
3.2.6. Amino acid composition and chemical score of BSY extract proteins
BSY extracts were submitted to autolysis with 6 M HCl at 110ºC for 24 h and further
derivatization was conducted according the validated method of Pérez-Palacios et al. (148).
Amino acids were separated by Gas chromatography mass spectrometry (GC/MS). The MS
system was routinely set in selective ion monitoring (SIM) mode and each compound was
quantified based on peak area using one target and one or two qualifier ions. The amount
of amino acids were calculated, based on the peak area in comparison with that of the
standards. The results were used to determine the relative amino acid composition
(expressed as g/100 g of protein). Essential amino acid index was calculated considering
the essential amino acids (EAA) in the standard protein, as described by FAO/WHO (149)
and the protein efficiency ratio (PER) was calculated considering the equation developed
by Lee et al. (150). The chemical score and PER were calculated using the following
equations (1 and 2):
Chemical score = EAA in test protein EAA in standard protein (1) ⁄
PER (Eq. 3) = −1.816 + 0.435[Met] + 0.780[Leu] + 0.211[His] − 0.944[Tyr] (2)
3.2.7. Determination of biological properties of BSY extracts
Biological properties of BSY were analyzed concerning total phenolic content (TPC), total
flavonoid content (TFC), antioxidant activities (DPPH, FRAP and RP), proteolytic activity
and ACE-I activity.
3.2.7.1. Enzyme activity assay
Protease activity of BSY extracts was assayed by Sigma’s non-specific protease method
described by Cupp-Enyard (164). Assays were performed in triplicate. Protease activity was
expressed as the number of protease units per mL of enzyme (U/mL). One unit of protease
activity (U) was defined as the amount of the enzyme needed to catalyze the formation of
1 µg of tyrosine per 1 min, at 37ºC. A commercial protease solution (Alcalase® 2.4L) diluted
at 0.2 U/mL was used as positive control, for comparison.
3.2.7.2. Total phenolic content (TPC) and total flavonoid content (TFC)
The method used for TPC determination was similar to that of Herald et al. (155). Gallic
acid was used as a standard at 12.5-200 μM to produce a calibration curve (average R2 =
0.9975). Total phenolic concentration was expressed as µM GAE (Gallic Acid
Equivalent)/mL of sample. The method used for TFC determination was similar to that of
Herald et al. (155). Catechin was used as a standard at 5-250 μM to generate a calibration
curve (average R2 = 0.9983). Total flavonoid concentration was expressed as µM CE
(Catechin Equivalent)/mL of sample.
56
3.2.7.3. Antioxidant activity of BSY extracts
The DPPH radical-scavenging capacity assay was performed as described by Herald et al.
(155). Trolox was used as a standard at 50-500 μM to generate a calibration curve (average
R2 = 0.9940). The analyses of BSY extracts were carried out in triplicate and the results
were expressed as µM TE (Trolox Equivalent)/mL of sample. The measurement of the
Ferric Reducing Antioxidant Power (FRAP) assay was done by the assay based on the
method of Jansen and Ruskovska (154). Trolox was used as a standard at 50-500 μM to
generate a calibration curve (average R2 = 0.9956) and results were expressed as mean
values ± standard deviations as µM TE (Trolox Equivalent)/mL of sample. The
measurement of the Reducing power (RP) was done by the assay based on the method of
Almeida et al. (156). Trolox was used as a standard at 50-500 μM to generate a calibration
curve (average R2 = 0.9942) and results were expressed as µM TE (Trolox Equivalent)/mL
of sample. The intra-assay variation of the DPPH, FRAP and RP assays were, respectively,
2.9%, 3.1% and 4.3%, as determined with three quality control samples. A standard solution
of vitamin C (500 µM) was used as positive control in antioxidant activity assays.
3.2.7.4. ACE-I activity
The ACE-I activity was measured using the fluorimetric assay of Sentandreu and Toldrá
(121), with the modifications reported by Quirós et al. (122). ACE was extracted from rabbit
lung acetone powder with 100 mM sodium borate buffer (pH 8.3) containing 300 mM NaCl,
according to the procedure described by Minervini et al. (165). Prior to assay, the
supernatant was diluted 10-fold with 50 mM potassium phosphate buffer, pH 8.3, so that it
would have the same ACE activity as the commercial preparation (~3 U/mg of protein). ACE
inhibitory percentage (I %) was calculated using the equation 3:
I % = (B − A)|(B − C) × 100 (3)
where B is the fluorescence of the ACE solution without the inhibitor, BSY extract; A is the
fluorescence of the tested sample, BSY extract; and C is the fluorescence of experimental
blank, o-ABz-Gly-Phe(NO2)-Pro dissolved in 150 mM Tris-base buffer (pH 8.3), containing
1.125 M NaCl. The percent inhibition curves (using a minimum of five determinations for
each sample peptide concentration) were plotted versus protein concentration to estimate
the mean IC50 value, which is defined as the concentration required to decrease the ACE
activity by 50% (122).
PART I. Chapter 3 A bioactive ingredient obtained from the inner cellular content of Brewer´s spent yeast
57
3.2.8. Effect of storage conditions on the stability of BSY extract biological properties
The stability of BSY extracts biological properties during storage at -25ºC was investigated.
For stability studies, the biological properties of freeze-dried and resuspended BSY
extracts, stored at -25ºC for 1, 2, 4 and 6 months, were evaluated and compared with the
properties presented at initial time (0 months).
3.2.9. Statistical analysis
Data were reported as mean ± standard deviation of at least triplicate experiments. All
statistical analyses were performed using the software SPSS for Windows, version 22.0
(SPSS Inc., Chicago, IL, USA). One-way analysis of variance with Duncan’s post hoc test
was carried out to ascertain significant differences between BSY extracts with different
number of reuses in brewing process. In all cases, 5% significance level (p <0.05) was
accepted as denoting significance.
3.3. RESULTS AND DISCUSSION
3.3.1. Proximate composition of freeze-dry BSY extracts
The moisture content of freeze-dried BSY extracts obtained from yeast surplus with
two, three, and four serial reuses in the brewing process and from the mixture of spent yeast
with different number of reuses was very similar and ranged between 5.0% and 6.4%. Its
proximate composition (% dw) is shown in Table 3.1. The protein fraction was the major
component of BSY extracts and its content ranged from 69.8% (R2) to 76.5% (R4). The ash
content was around 1%, whereas the lipid content was lower than 1%. Comparison of the
proximate compositions of BSY extracts with literature is a difficult task because different
processes for cell debittering and lysis were performed and also because they are reported
for different Saccharomyces species. However, the proximate composition is in agreement
with the results obtained by Caballero-Córdoba and Sgarbieri (25), when mechanical cell
rupturing process using glass beads was also employed. Statistical treatment of results
indicates significant differences concerning the composition of BSY extracts with different
reuses in the brewing process; however, the most relevant is the increase of protein content
with the increase of yeast repitching.

58
Table 3.1. Proximate composition (% dw) of freeze-dried BSY extracts
R2 R3 R4 MIST Mean
Protein 69.8±2.8c 73.3±4.1b 76.5±2.8a 71.4±0.3bc 72.8±3.7
Lipid 0.5±0.1b 0.6±0.1a 0.6±0.1a 0.5±0.0b 0.6±0.1
Ash 1.2±0.1b 1.3±0.2a 1.4±0.3a 0.6±0.1c 1.1±0.4
nd A 28.6±2.6a 24.8±4.3b 21.5±2.9c 27.5±0.3ab 25.6±3.9
R2: 3 samples of yeast biomass used twice in the brewing process; R3: 3 samples
of yeast biomass with three serial reuses in the brewing process; R4: 3 samples
of yeast biomass with four serial reuses in the brewing process; MIST: 3 samples
of yeast surplus containing a mixture of biomass with different number of reuses
in the fermentation process. Results are expressed as a mean ± standard
deviation (n=9). Values in the same row followed by different superscripted letters
indicate significant differences at p <0.05, Duncan’s post hoc test.
A nd. not determined; fraction corresponding to sum of carbohydrates, RNA, non-
nitrogen fraction and others components.
3.3.2. Amino acid composition of BSY protein fraction
The amino acid composition of the BSY protein fraction is presented in Table 3.2. In
general, BSY extracts prepared from spent yeast with different reuses in brewing process
had a similar amino acid profile (p <0.05). Furthermore, the essential amino acid profile of
BSY extracts was considerably higher (p <0.05) than the suggested amino acid pattern
recommended by FAO/WHO for adult humans (149). Similar results were observed by
Caballero-Córdoba and Sgarbieri (25). BSY extracts were rich in glutamic acid (12.6%-
15.8%), histidine (10.5%-11.6%) and alanine (8.0%-8.8%), as quantified by Caballero-
Córdoba and Sgarbieri (28). However, these contents were relatively higher, when
compared with BSY extracts obtained from other processes, namely autolysis and
hydrolysis, as observed by other authors (25), (45), (166). According to Jung et al. (45), the
amino acids histidine and proline are the components of CHP (Cyclo-His-Pro), an
endogenous cyclic dipeptide involved in antioxidant activity of BSY hydrolysates. Generally,
S-amino acids (methionine and cysteine) are the limiting factor to the nutritive value of yeast
protein (25). However, as reported in Table 3.2, the S-amino acids were above the
FAO/WHO reference (149); the contents observed were in accordance with those reported
by Caballero-Córdoba and Sgarbieri (25). The essential amino acids ranged between
37.2% and 38.9%, being close to the reference value of 40%, recommended by FAO/WHO

PART I. Chapter 3 A bioactive ingredient obtained from the inner cellular content of Brewer´s spent yeast
59
(149). BSY extracts presented a high content of the flavour enhancers, glutamic acid,
aspartic acid, glycine and alanine, the sum of which represents 30.1-32.9% of total amino
acids. The results of chemical score based on lysine (limiting amino acid) of BSY extracts
ranged between 1.3 and 1.7 and the protein efficiency ratio (PER) ranged between 1.6 and
2.4. In general, based on our results, extracts obtained from mechanical disruption of BSY
were shown to be high quality nutritional ingredients.
3.3.3. Molecular weight distribution of BSY extract protein fraction
The molecular weight of BSY extract proteins were determined by SDS-PAGE. The
typical SDS-PAGE profile observed for protein fraction from yeast surplus with two, three,
and four serial reuses in the brewing process and from the mixture of spent yeast with
different number of reuses was very similar. As shown in Figure 3.1, the electrophoretic
patterns of BSY proteins presented seven major bands with 61, 58, 47, 42, 33, 29 and 27
kDa. Also, minor bands were observed with molecular weight lower than 21 kDa and higher
than 61 kDa. According to Slaughter and Nomura (167), vacuolar proteases have been
identified in a brewing strain of Saccharomyces cerevisiae; PrB has a molecular weight of
33 kDa, PrA has 42 kDa and CPY has 61 kDa. The BSY extracts presented 3 bands with
these molecular weights, presumably corresponding to the 3 proteases described by
Slaughter and Nomura (167). Although, only a purification process of BSY enzymes can
confirm protein identification, the proteolytic activity of extracts can be easily evaluated.

60
Table 3.2. Amino acid composition of BSY extracts (g/100 g protein) and comparison with
FAO/WHO reference protein
Amino acid composition (g/100 g Protein)a
Amino acids Ions R2 R3 R4 MIST FAO/WHOb
Alanined 232 8.0±0.3 8.1±0.3 8.8±0.2 8.3±0.1 -
Argininec 286 5.4±0.8 5.5±0.6 6.8±0.8 5.6±0.8 -
Aspartic acidd 316 5.9±0.2 5.1±0.2 5.3±0.2 5.1±0.2 -
Cysteine 406 1.4±0.0 1.9±0.0 2.1±0.0 1.1±0.0 -
Glutamic acidd 432 12.6±0.4 13.4±0.5 15.8±0.4 14.5±0.4 -
Asparagine 417 2.1±0.0 2.6±0.1 2.2±0.1 2.2±0.0 -
Glutamine 329 2.6±0.2 3.1±0.2 3.3±0.2 2.8±0.2 -
Glycined 218 3.6±0.6 3.7±0.8 2.9±0.3 3.4±0.4 -
Histidinec 196 10.6±0.8 10.5±0.8 10.7±0.9 11.6±1.0 1.6
Isoleucinec 200 3.5±0.0 3.4±0.1 3.5±0.0 3.0±0.1 1.3
Leucinec 200 3.6±0.2 3.5±0.2 3.3±0.0 3.2±0.3 1.9
Lysinec 300 2.6±0.2 2.6±0.2 2.7±0.3 2.2±0.2 1.6
Methioninec 218 3.1±0.2 3.1±0.1 2.4±0.2 2.7±0.1 1.7
Phenylalaninec 336 3.2±0.0 3.2±0.0 3.1±0.0 3.6±0.0 -
Proline 184 2.3±0.0 2.61±0.0 1.9±0.0 2.7±0.0 -
Serine 362 4.2±0.2 4.4±0.3 4.2±0.2 4.6±0.1 -
Threoninec 404 2.4±0.0 2.5±0.1 2.5±0.0 2.0±0.1 0.9
Tyrosine 466 2.3±0.0 2.3±0.0 2.4±0.0 2.8±0.0 -
Valinec 186 3.6±0.1 3.5±0.2 4.0±0.1 4.3±0.1 1.3
Triptophan nd nd nd nd nd -
∑ Amino acid (TAA)
82.9±8.6 84.3±9.5 87.9±7.7 85.5±8.4
∑ Essential amino acid (EAA)c
38.0±4.6 37.2±4.6 38.9±4.5 38.1±5.4
∑ Flavour amino acid (FAA)d
30.1±3.0 30.3±3.6 32.9±2.1 31.3±2.4
EAA/AA 0.5±0.0 0.4±0.0 0.4±0.0 0.5±0.0
Protein efficiency ratio (PER)
2.4±0.8 2.3±0.7 1.8±0.5 1.6±1.0
Chemical scoree 1.6±0.3 1.3±0.3 1.7±0.3 1.4±0.3
a Values represent mean ± standard deviation (n=3). b Suggested profile of EAA requirements for adults (FAO/WHO, 1990). c Essential amino acids. d Flavour amino acids. e Chemical score calculated based on lysine (limitant amino acid).
nd. not determined.
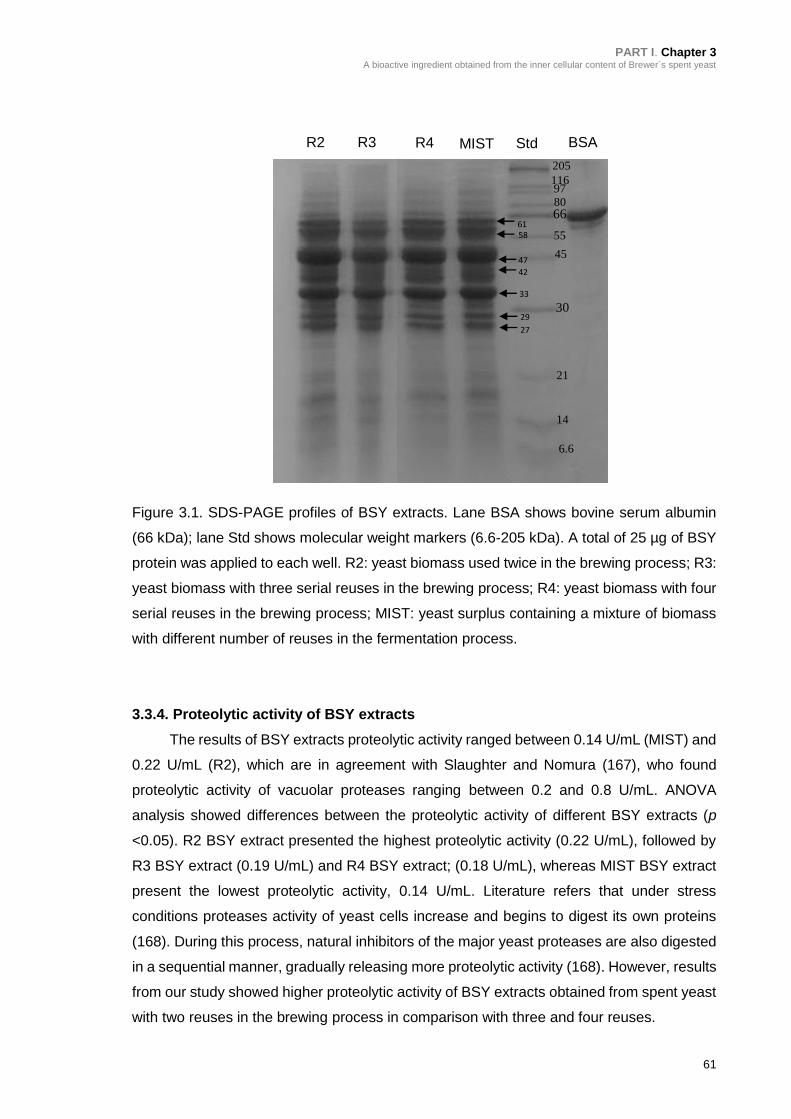
PART I. Chapter 3 A bioactive ingredient obtained from the inner cellular content of Brewer´s spent yeast
61
Figure 3.1. SDS-PAGE profiles of BSY extracts. Lane BSA shows bovine serum albumin
(66 kDa); lane Std shows molecular weight markers (6.6-205 kDa). A total of 25 µg of BSY
protein was applied to each well. R2: yeast biomass used twice in the brewing process; R3:
yeast biomass with three serial reuses in the brewing process; R4: yeast biomass with four
serial reuses in the brewing process; MIST: yeast surplus containing a mixture of biomass
with different number of reuses in the fermentation process.
3.3.4. Proteolytic activity of BSY extracts
The results of BSY extracts proteolytic activity ranged between 0.14 U/mL (MIST) and
0.22 U/mL (R2), which are in agreement with Slaughter and Nomura (167), who found
proteolytic activity of vacuolar proteases ranging between 0.2 and 0.8 U/mL. ANOVA
analysis showed differences between the proteolytic activity of different BSY extracts (p
<0.05). R2 BSY extract presented the highest proteolytic activity (0.22 U/mL), followed by
R3 BSY extract (0.19 U/mL) and R4 BSY extract; (0.18 U/mL), whereas MIST BSY extract
present the lowest proteolytic activity, 0.14 U/mL. Literature refers that under stress
conditions proteases activity of yeast cells increase and begins to digest its own proteins
(168). During this process, natural inhibitors of the major yeast proteases are also digested
in a sequential manner, gradually releasing more proteolytic activity (168). However, results
from our study showed higher proteolytic activity of BSY extracts obtained from spent yeast
with two reuses in the brewing process in comparison with three and four reuses.
R3 R4 MIST Std BSA R2
205
97 116
80 66
55
45
21
30
14
6.6
61 58
471 42
33
29
27
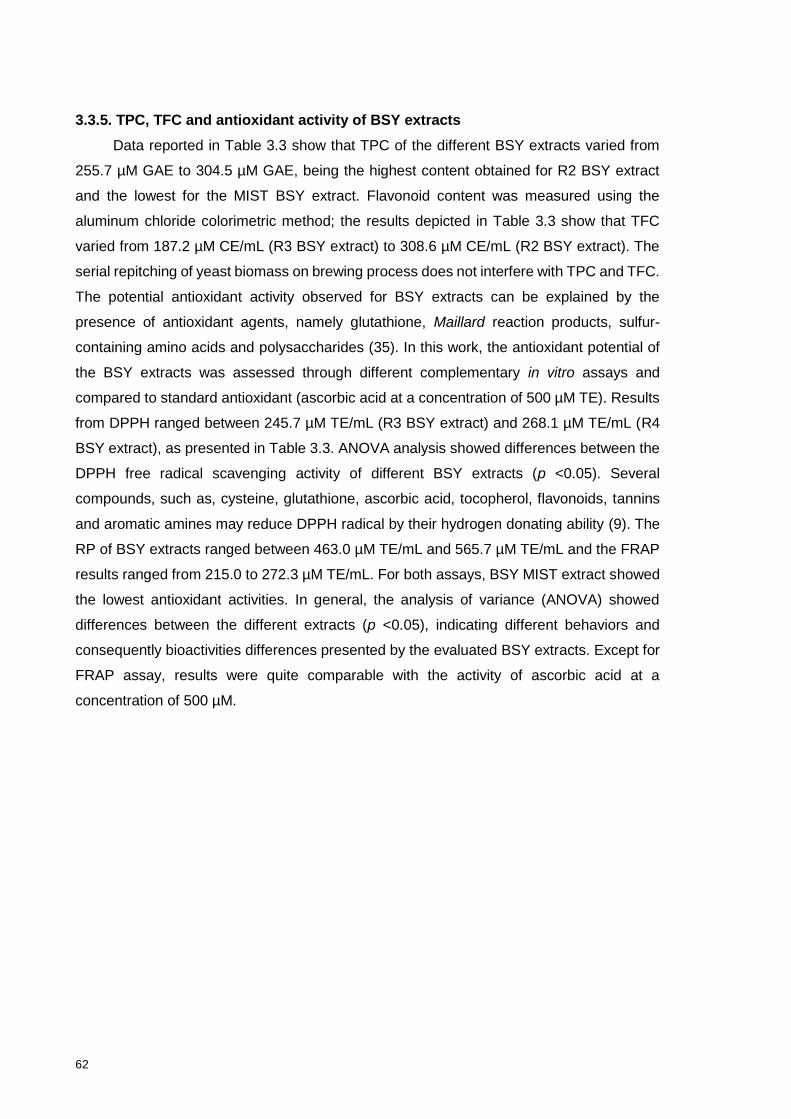
62
3.3.5. TPC, TFC and antioxidant activity of BSY extracts
Data reported in Table 3.3 show that TPC of the different BSY extracts varied from
255.7 µM GAE to 304.5 µM GAE, being the highest content obtained for R2 BSY extract
and the lowest for the MIST BSY extract. Flavonoid content was measured using the
aluminum chloride colorimetric method; the results depicted in Table 3.3 show that TFC
varied from 187.2 µM CE/mL (R3 BSY extract) to 308.6 µM CE/mL (R2 BSY extract). The
serial repitching of yeast biomass on brewing process does not interfere with TPC and TFC.
The potential antioxidant activity observed for BSY extracts can be explained by the
presence of antioxidant agents, namely glutathione, Maillard reaction products, sulfur-
containing amino acids and polysaccharides (35). In this work, the antioxidant potential of
the BSY extracts was assessed through different complementary in vitro assays and
compared to standard antioxidant (ascorbic acid at a concentration of 500 µM TE). Results
from DPPH ranged between 245.7 µM TE/mL (R3 BSY extract) and 268.1 µM TE/mL (R4
BSY extract), as presented in Table 3.3. ANOVA analysis showed differences between the
DPPH free radical scavenging activity of different BSY extracts (p <0.05). Several
compounds, such as, cysteine, glutathione, ascorbic acid, tocopherol, flavonoids, tannins
and aromatic amines may reduce DPPH radical by their hydrogen donating ability (9). The
RP of BSY extracts ranged between 463.0 µM TE/mL and 565.7 µM TE/mL and the FRAP
results ranged from 215.0 to 272.3 µM TE/mL. For both assays, BSY MIST extract showed
the lowest antioxidant activities. In general, the analysis of variance (ANOVA) showed
differences between the different extracts (p <0.05), indicating different behaviors and
consequently bioactivities differences presented by the evaluated BSY extracts. Except for
FRAP assay, results were quite comparable with the activity of ascorbic acid at a
concentration of 500 µM.
PART I. Chapter 3 A bioactive ingredient obtained from the inner cellular content of Brewer´s spent yeast
63
Table 3.3. Biological activity BSY extracts, namely proteolytic activity, ACE-I activity, Total Phenolic Content (TPC), Total Flavonoid Content (TFC) and
antioxidant activity
Antioxidant activity
BSY Prot. Activity
(U/mL) (i) IC50
(µg/mL) (ii) TPC
(µM GAE/mL) TFC
(µM CE/mL) FRAP
(µM TE/mL) DPPH
(µM TE/mL) RP
(µM TE/mL)
R2 0.22±0.0a 266.3±11.5d 304.5±1.6a 308.6±9.7a 272.3±14.6a 257.5±6.9ab 555.0±4.8a
R3 0.19±0.0b 288.8±6.5c 286.1±54.5a 187.2±82.5b 218.8±43.2bc 245.7±22.5b 513.0±55.9ab
R4 0.18±0.0b 309.8±7.6b 295.5±22.0a 234.4±63.2b 247.4±44.2ab 268.1±6.5a 565.7±48.7a
MIST 0.14±0.0c 468.5±7.5a 255.7±8.1b 239.4±12.1b 215.0±4.2c 267.9±4.1a 463.0±20.0b
Control(iii) 0.19±0.0 16±1.0 1077±45.4 282±2.5 627±13.8
R2: 3 samples of yeast biomass used twice in the brewing process; R3: 3 samples of yeast biomass with three serial reuses in the brewing
process; R4: 3 samples of yeast biomass with four serial reuses in the brewing process; MIST: 3 samples of yeast surplus containing a
mixture of biomass with different number of reuses in the fermentation process. Results are expressed as a mean ± standard deviation
(n=9). Values in the same column followed by different subscripted letters indicate significant differences at p <0.05, Duncan’s post hoc
test. (i) 1U = 1 µg of tyrosine equivalent released from casein per min. (ii) IC50 = concentration (µg protein/mL) of ACE inhibitor required to inhibit 50% of the ACE activity. (iii) Alcalase® diluted at 0.2 U/mL was used as positive control in the enzyme activity assay; Captopril was used as positive control in the
ACE-I assay; a standard solution of vitamin C (500 µM) was used as positive control in antioxidant activity assays.
Legend: µM CE (Catechin Equivalent); µM TE (Trolox Equivalent); µM GAE (Gallic Acid Equivalent).

64
3.3.6. ACE-I activity of BSY extracts
In our study, the highest ACE-I activity (lowest IC50 value) was observed for BSY
prepared from R2 biomass, 266.3 µg protein/mL, as presented in Table 3.3. In contrast, the
BSY extracts prepared from MIST, presented the lowest ACE-I activity, value of 468.5 µg
protein/mL. ANOVA analysis shows that the serial repitching of yeast biomass on brewing
process influenced significantly this biological property (p <0.05). There is little information
in the literature regarding the potential ACE-I of Saccharomyces yeast, particularly for BSY.
Kim et al. (75) reported the ACE-I from Saccharomyces cerevisiae extract with an IC50 of
70 µg/mL, after 24 h of cultivation at 30ºC, treatment with pepsin and further purification of
the ACE-I peptides by UF, Sephadex G-25 column chromatography and RP-HPLC.
According to these authors, the ACE-I activity of the peptide fraction purified was slightly
lower than that of the commercial antihypertensive drug captopril. BSY can be considered
a good source for antihypertensive compounds due its GRAS status and the absence of
adverse effects, such as coughs and allergies, associated with captopril or other synthetic
antihypertensive agents.
3.3.7. Stability of biological activity of frozen BSY extracts
Freeze-dried BSY extracts maintained its proteolytic acitivity after 6 months of storage
at -25ºC, while frozen resuspended BSY extracts presented a significant decrease (p <0.05)
of the proteolytic activity after 4 months at -25ºC, decreasing to approximately half of the
initial value after 6 months. However, no significant differences were observed on the other
biological activities of the freeze-dried or frozen resuspended BSY extracts (p <0.05). The
results obtained for resuspended BSY extracts of MIST are summarized in Figure 3.2 and
highlight that storage time of 6 months (at -25ºC) preserve the ACE-I activity, TPC, TFC
and antioxidant activity of the BSY extracts.

PART I. Chapter 3 A bioactive ingredient obtained from the inner cellular content of Brewer´s spent yeast
65
Figure 3.2. Biological activities stability of MIST BSY extract, stored at -25ºC for 6 months. Results are expressed as mean ± standard deviation of.
Legend: µM CE (Catechin Equivalent); µM TE (Trolox Equivalent); µM GAE (Gallic Acid Equivalent); IC50 = concentration (µg/mL) of ACE inhibitor
required to inhibit 50% of the ACE activity; 1U = 1 µg of tyrosine equivalent released from casein per min.
* significantly different from initial value (0 Month), p <0.05, Student t test.
66
3.4. CONCLUSIONS
Proteins are the major components of BSY extracts, its amino acid profile is well-balanced
for human consumption. Additionally, those extracts present ACE-I activity and antioxidant
activity. The antioxidant activity of BSY extract was comparable to the conventional
synthetic antioxidant ascorbic acid, tested at the concentration of 500 µM. The number of
the yeast reuses in brewing process does not influence significantly the antioxidant activity
of yeast extracts, however, proteolytic activity and ACE-I activity reduces with the increase
of serial repitching. Good stability of biological activities of BSY extracts was observed
during a storage period of 6 months at -25ºC, without loss of their TPC, TFC, antioxidant
properties, as well, its ACE-I activity. However, its proteolytic activity decrease
approximately 50% after 4 months of storage at -25ºC when resuspended. Therefore, BSY
extracts obtained using mechanical disruption can be explored in functional foods, cosmetic
and pharmaceutical products due to their bioactive properties. To the best of our knowledge,
this is the first report on the influence of serial repitching of brewing yeast on biological
properties of its extracts.
67
CHAPTER 4
Autolysis of intracellular content of brewer`s spent
yeast to maximize ACE-inhibitory and antioxidant
activities
_____________________
This chapter presents the autolysis optimization of the BSY extract
to enhance its antioxidant and ACE-inhibitory activities.

68

PART I. Chapter 4 Autolysis of intracellular content of brewer`s spent yeast to maximize ACE-inhibitory and antioxidant activities
69
ABSTRACT
Brewer´s spent yeast (BSY), the second major by-product from brewing, is recognized as
a promising source of potentially bioactive ingredients. Mechanical disruption of BSY cell
wall was performed to remove the β-glucans rich fraction and obtain the intracellular
content, rich in proteins and enzymes, which were submitted to further autolyses. Response
surface methodology (RSM) enabled the prediction of optimum autolysis conditions to
achieve the highest Total Phenolic Content (TPC), antioxidant properties (evaluated by
FRAP assay) and angiotensin I-converting enzyme inhibitory (ACE-I) activity. Autolysis of
BSY inner cell content at 36.0°C, 6.0 h gave a TPC of 385 µM GAE/mL, a FRAP value of
374 µM TE/mL and an IC50 value of 379 µg/mL. These experimental results were in
agreement with the RSM predicted values. The combination of ACE-I and antioxidant
activity in one autolysate can be very useful for application as function ingredient for food
industry.
4.1. INTRODUCTION
Brewer´s spent yeast (BSY) (Saccharomyces genre) is the second major by-product
from brewing (5), which presens a well-balanced amino acid profile, phenolic compounds,
peptides, vitamins, β-glucans and nucleotides (36), (50), (86). It is also a source of several
proteolytic enzymes, such as, PrA, PrB, CPY, AP1, aminopeptidase C and dipeptidyl
aminopeptidase B (11), (44), (64). BSY autolysates and hydrolysates have been reported
to possess several biological properties, particularly antioxidant (45), (76), (79), (169) and/or
antihypertensive activities (86), (75), (79), (169), (170). Autolysis or self-digestion is often
used for intracellular break down of proteins, nucleic acids and other cell constituents. The
yeast autolytic process is usually carried out by incubation of yeast cells under moderate
agitation and temperatures between 45-60ºC for 8-72 h. The major disadvantages are low
extraction yield, difficult solid liquid separation due to high content of residue in autolysates,
and risk of deterioration due to microbial contamination. Hydrolysis by sonication and
digestion by enzymes, such as, trypsin, chymotrypsin flavourzyme, papain, and pancreatin
is faster, although more expensive because requires exogenous enzymes (76), (169).
The recovery of yeast cell-wall β-glucans to be used as a food ingredient was
approved by the EFSA (143). However, to make the process of β-glucans’ separation from
BSY profitable, new applications for the inner cell content are required. Cell wall
disintegration for β-glucans’ separation can be performed by mechanical procedures (46),
(50), (66). Ultrasound extraction is highly efficient, but it promotes protein denaturation due

70
to the increase of temperature (46), (66). Thus, when the main purpose is the recovery of
native enzyme fraction for further autolysis of inner cell content, vortexing with glass beads
under refrigerated conditions is commonly adopted at laboratorial scale (44), (50).
Therefore, the objective of the present study was to produce an autolysate from intracellular
BSY content to obtain a functional ingredient. The combination of ACE-I and antioxidant
activity in one product could be very useful for the control of cardiovascular diseases. For
this purpose, Response Surface Methodology (RSM) was employed to optimize the
autolysis process (time and temperature) in order to achieve maximum antioxidant and
ACE-I activities.
4.2. MATERIAL AND METHODS
4.2.1. Reagents
Acetonitrile (HPLC grade) and Folin-Ciocalteu phenol reagent were obtained from Merck
(Darmstadt, Germany). Bovine serum albumin (BSA); trifluoroacetic acid (TFA); gallic acid;
2,4,6-tripyridyl-s-triazine (TPTZ); 6-hydroxy-2,5,7,8-tetramethylchroman-2-carboxylic acid
(Trolox); commercial angiotensin-I-converting enzyme (ACE) (EC 3.4.15.1, 5.1 U/mg) and
the Millipore 5 kDa MWCO UF membranes were purchased from Sigma-Aldrich (St. Louis,
MO, USA). ABz-Gly-Phe(NO2)-Pro was purchased from Bachem Feinchemikalien
(Bubendorf, Switzerland). Ultrapure water was obtained from a Seral-Seralpur Pro 90 CN
water purification system from Belgolabo (Overijse, Belgium).
4.2.2. Brewer’s spent yeast (BSY) extract
The BSY (Saccharomyces pastorianus) was supplied as slurry by Unicer brewing (Leça do
Balio, Portugal). BSY was collected in 1 liter glass bottle and transported to the laboratory
under refrigerated conditions. The BSY extract was prepared according to Vieira et al.(50)
protocol. Firstly, BSY was washed three times with phosphate buffer, pH 6.0 (volume ratio
1:3). After centrifugation (5,000 x g) during 15 min at 4°C, the yeast cell wall was destroyed
with glass beads with a diameter of 0.60 mm at a ratio 1:1:1 (BSY: phosphate buffer pH 6.0:
glass beads); (m/v/m), by vortexing 10 times (1 min each) with 1 min cooling intervals on
ice-water bath to keep the temperature below 4°C during the entire process. After removing
the glass beads by allowing the suspension to stand, the homogenate was centrifuged at
12,000 x g, for 40 min at 4ºC, to remove the cell debris. The resulting clear supernatant was
collected and kept at -20ºC until used.

PART I. Chapter 4 Autolysis of intracellular content of brewer`s spent yeast to maximize ACE-inhibitory and antioxidant activities
71
4.2.3. Autolysis of BSY extract
The protein content of BSY extract was determined by the Bradford method (171) and the
protease activity was performed according to Cupp-Enyard assay (164). Autolyses were
performed using 10 mL of BSY extract, under constant agitation (200 rpm) at different
temperatures and times, according to the experimental design described in sub-section
4.2.5. Control samples were BSY extract without any further treatment. Autolyses were
terminated by heating the final solutions at 90ºC for 15 min, followed by centrifugation at
10,000 x g for 10 min.
4.2.4. Analytical Methods
4.2.4.1. Determination of Total Phenolic content
The method used for Total Phenolic quantification was similar to that described by Herald
et al. (155). Gallic acid was used as standard at 10-500 μM to produce a calibration curve
(average R2 = 0.9979). Total phenolic content (TPC) was expressed as mean values ±
standard deviations, as µM of gallic acid equivalent per mL of BSY autolysate (µM GAE/mL).
Spectrophotometric analyses were carried out using a BMG LABTECH´s SPECTROstar
Nano-microplate, cuvette UV/Vis absorbance reader (Offenburg, Germany).
4.2.4.2. Determination of Ferric ion reducing antioxidant power
Determination of Ferric ion reducing ability (FRAP) was based on the method described by
Jansen and Ruskovska (154). Trolox was used as standard at 10-500 μM to produce a
calibration curve (average R2 = 0.9943). Results were expressed as mean values ± standard
deviations, as µM of Trolox equivalent per mL of BSY autolysate (µM TE/mL).
4.2.4.3. Determination of ACE-I activity
ACE-I activity was measured using the fluorimetric assay of Sentandreu and Toldrá (121),
with the modifications reported by Quiros et al. (122). ACE-I percentage (I %) was calculated
using the equation:
I % = (B − A)|(B − C) × 100 (1)
where B is the fluorescence of the ACE solution without the inhibitor (BSY autolysate), A is
the fluorescence of the tested sample (BSY autolysate) and C is the fluorescence of
experimental blank, o-ABz-Gly-Phe(NO2)-Pro dissolved in 150 mM Tris-base buffer (pH
8.3), containing 1.125 M NaCl. The percent inhibition curves (using a minimum of five
determinations for each sample peptide concentration) were plotted versus peptide
concentration to estimate the mean IC50 value, which is defined as the concentration
required to decrease the ACE activity by 50% (122). Peptide content was determined by
72
Bradford method (171). Fluorimetric analyses were carried out using a fluorescence
microplate reader (FLUOstar Optima, BMG Labtech GmbH).
4.2.5. Experimental design, modelling and optimization of autolysis conditions
The autolysis conditions that enabled the BSY autolysate with highest antioxidant and ACE-
I activities were optimized using a Central composite design (CCD). Two variables, namely,
temperature (X1) and time (X2) were included in the model, in which each parameter was
examined at five different levels, as shown in Table 4.1. CCD consisted of a complete 22-
factorial design as cubic points, with four axial points at a distance of α = 1.414 from the
design centre and five centre points. The responses used in experimental design were TPC
(Y1), antioxidant activity evaluated by FRAP assay (Y2) and ACE-I activity (Y3). The optimal
values of response Y were obtained by solving the regression equation and by analysis of
2D contour plots using the predictive equations of RSM. Then, the accuracy of the models
was tested by conducting a set of experiments using the critical values optimized; the t test
was conducted to compare the responses prepared under optimized conditions with those
predicted by models.
4.2.6. Statistical analysis
Analysis of the experimental design, calculation of predicted data and production of surface
plots were carried out using the software Design Expert trial version 7 (Stat-Ease Inc.,
Minneapolis, MN, USA). Statistical analysis of the other analytical results was performed
with SPSS 22.0 (SPSS Inc., Chicago, IL, USA). Analysis of variance (ANOVA) of the data
was performed, differences were considered significant at p <0.05.
4.3. RESULTS AND DISCUSSION
A BSY extract containing 10 mg of proteins/mL was used in the autolyses
experiments. The protease activity of the BSY extract was 0.22 U/mL and the pH was 6.0.
Before the autolysis process, the BSY extract presented a TPC of 217 µM GAE/mL; a FRAP
value of 199 µM TE/mL and an IC50 value of 481 µg protein/mL.
4.3.1. Validation of the experimental design
In order to investigate the effect of autolysis conditions on the bioactivity of BSY
extract, the experiments were performed in a random manner at different combinations of
temperature (X1) and time (X2). The TPC (Y1), FRAP (Y2) and ACE-I activity (Y3) of BSY
autolysates were used as response factors for CCD (Table 4.1). Adequacy and significance

PART I. Chapter 4 Autolysis of intracellular content of brewer`s spent yeast to maximize ACE-inhibitory and antioxidant activities
73
of the models were evaluated by analysis of the variance (ANOVA) by means of Fisher´s
F-test, as detailed in Table 4.2. The independent variable X1 and X2 had a significant effect
on all the responses. The interactions between X1.X2 also had significant effect on all
responses (p <0.05). Quadratic term for X1 likewise had significant effect on all responses,
but quadratic term for X2 only had significant effect on Y1 response. Thus, models
presented a quadratic response for the three studied responses.
The quadratic models were validated by two diagnostic residuals, the squared
correlation coefficient (R2) and the predictive squared correlation coefficient (Q2). Typical
values indicating good models are R2 >0.75 and Q2 >0.60 (172). The R2 for checking the
fitness of model was very good (R2 adjust was relatively close to 1), indicating that model
explained 99.9%, 98.2% and 97.0% of the variation on the X1, X2 and X3, respectively. The
Q2 values were respectively 0.8461; 0.9756 and 0.9961 for the three responses, indicating
the goodness of the model. The statistical analysis of variance also revealed that the “lack
of fit” was not significant (p >0.05) for all the response surface models and the ‘‘Adeq
Precision’’ was higher than 4 (as desirable) for all responses, indicating an adequate signal-
to-noise ratio. This confirmed the adequacy of model terms to describe the experimental
data and for the prediction of the three studied parameters.
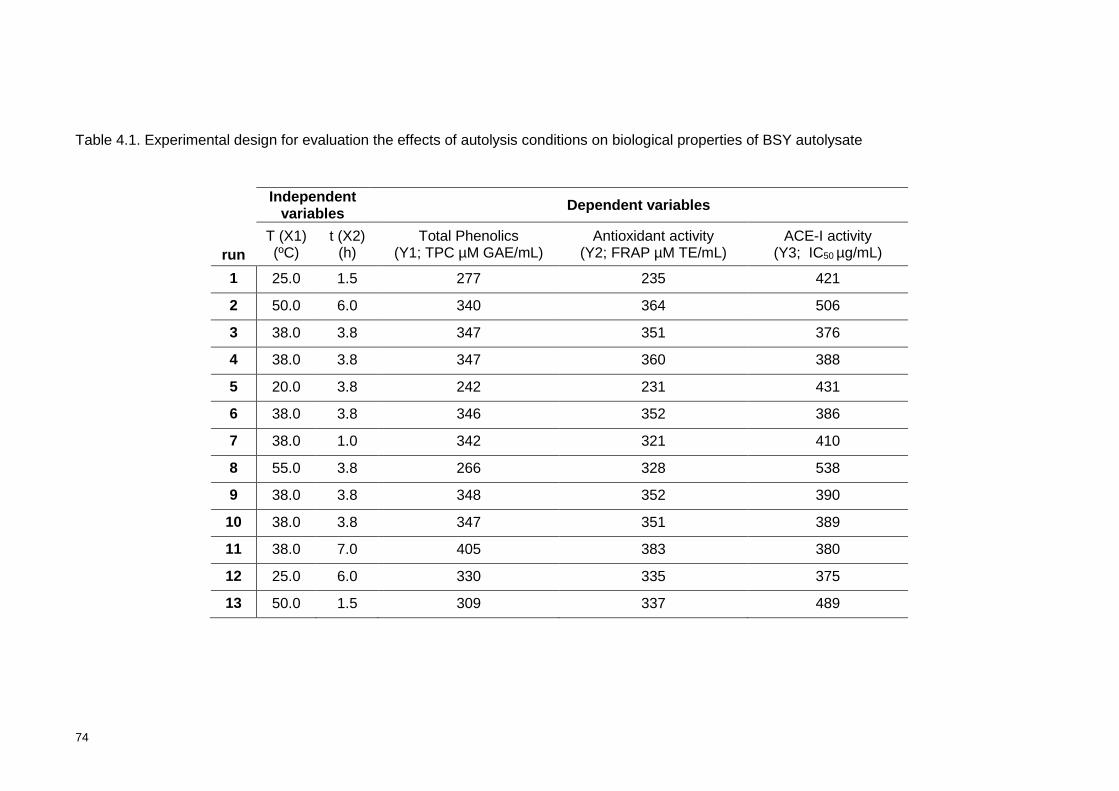
74
Table 4.1. Experimental design for evaluation the effects of autolysis conditions on biological properties of BSY autolysate
run
Independent variables
Dependent variables
T (X1) (ºC)
t (X2) (h)
Total Phenolics (Y1; TPC µM GAE/mL)
Antioxidant activity (Y2; FRAP µM TE/mL)
ACE-I activity (Y3; IC50 µg/mL)
1 25.0 1.5 277 235 421
2 50.0 6.0 340 364 506
3 38.0 3.8 347 351 376
4 38.0 3.8 347 360 388
5 20.0 3.8 242 231 431
6 38.0 3.8 346 352 386
7 38.0 1.0 342 321 410
8 55.0 3.8 266 328 538
9 38.0 3.8 348 352 390
10 38.0 3.8 347 351 389
11 38.0 7.0 405 383 380
12 25.0 6.0 330 335 375
13 50.0 1.5 309 337 489

PART I. Chapter 4 Autolysis of intracellular content of brewer`s spent yeast to maximize ACE-inhibitory and antioxidant activities
75
Table 4.2. Analysis of variance (ANOVA) for Total phenolic content, Antioxidant activity and ACE-I activity of BSY autolysate
Source Sum of Squares Mean Square F value p-value
Y1 Y2 Y3 Y1 Y2 Y3 Y1 Y2 Y3 Y1 Y2 Y3
Model 22277.6 25609.0 35587.8 4455.5 5121.8 7117.6 2303.0 130.4 77.3 <0.0001* <0.0001* <0.0001*
X1- ºC 684.5 9057.0 15329.6 684.5 9057.0 15329.6 353.8 230.5 166.6 <0.0001* <0.0001* <0.0001*
X2- h 3800.8 5778.4 755.2 3800.8 5778.4 755.2 1964.6 147.1 8.2 <0.0001* <0.0001* 0.0242**
X1.X2 120.1 1347.0 990.1 120.1 1347.0 990.1 62.1 34.3 10.8 0.0001* 0.0006* 0.0135**
X12 15063.7 9271.3 18506.4 15063.7 9271.3 18506.4 7786.3 236.0 201.1 <0.0001* <0.0001* <0.0001*
X22 1199.2 0.1 231.4 1199.2 0.1 231.4 619.9 0.0 2.5 <0.0001* 0.9755 0.1568
Residual 13.5 275.0 644.2 1.9 393 92.0
Lack of Fit 10.7 212.6 517.5 3.6 70.9 172.5 5.1 4.5 5.4 0.0745 0.0889 0.0676
Pure Error 2.8 62.4 126.7 0.7 15.6 31.7
Total 22291.1 25884.0 36232.0
Q2 (Y1) = 0.8461 R2 pred (Y1) = 0.9964 R2 adjust (Y1) = 0.9990 ratio = 172.7
Q2 (Y2) = 0.9756 R2 pred (Y2) = 0.9378 R2 adjust (Y2) = 0.9818 ratio = 37.2
Q2 (Y3) = 0.9961 R2 pred (Y3) = 0.8930 R2 adjust (Y3) = 0.9695 ratio = 27.1
Y1- Total Phenolic Content; Y2- FRAP; Y3- ACE-I activity.
* Significance at p <0.01; ** Significance at p <0.05.

76
4.3.2. Analysis of response surfaces
The relationship between independent and dependent variables was graphically
represented by 2D contour plots generated by the RSM model. As shown in Figure 4.1
(surface and contour plots A and B), TPC and FRAP tended to steadily increase at higher
temperature (6.0 h) and reached a maximum at the middle of temperature design, while
undergo a reduction when autolysis time was extended at higher temperature. Similar
behaviour was observed by other authors for other kind of food hydrolysates (173). The
minimum values of TPC and FRAP response were observed for lower temperature and time
responses. These results suggest that extension of autolysis time enhances the antioxidant
and phenolic composition of BSY autolysates. However, for longer autolysis time under high
temperature, the negative quadratic effect became significant. This may be attributed to the
thermal degradation of phenolic and other antioxidant compounds at higher temperatures.
Concerning to ACE-I activity, as observed in Figure 4.1 (surface and contour plot C),
it increased with time over moderate temperature (which means lower IC50 values),
however, when the autolysis time was extended at higher temperature, the BSY autolysate
presented a reduction in ACE-I activity (higher IC50 values), suggesting degradation of ACE-
I peptides. These results are in agreement to those observed for other food hydrolysates
(173), (174).
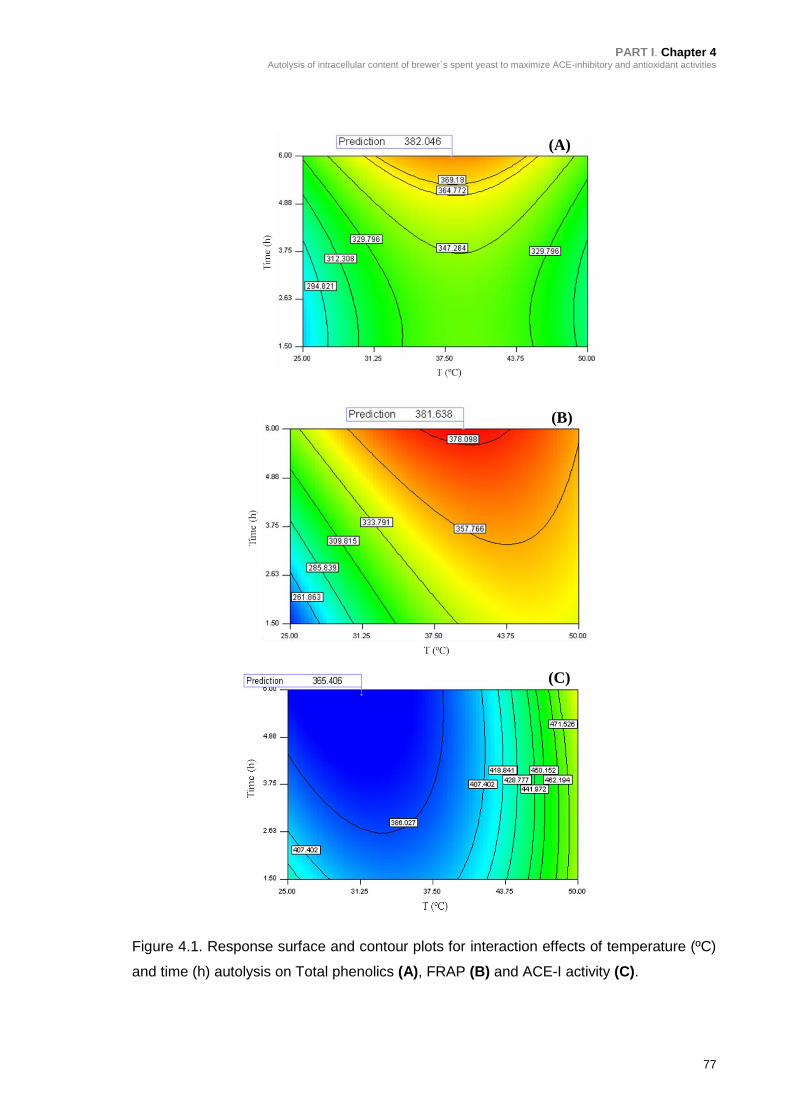
PART I. Chapter 4 Autolysis of intracellular content of brewer`s spent yeast to maximize ACE-inhibitory and antioxidant activities
77
Figure 4.1. Response surface and contour plots for interaction effects of temperature (ºC)
and time (h) autolysis on Total phenolics (A), FRAP (B) and ACE-I activity (C).
(A) (A)
(B)
(C)
(A)
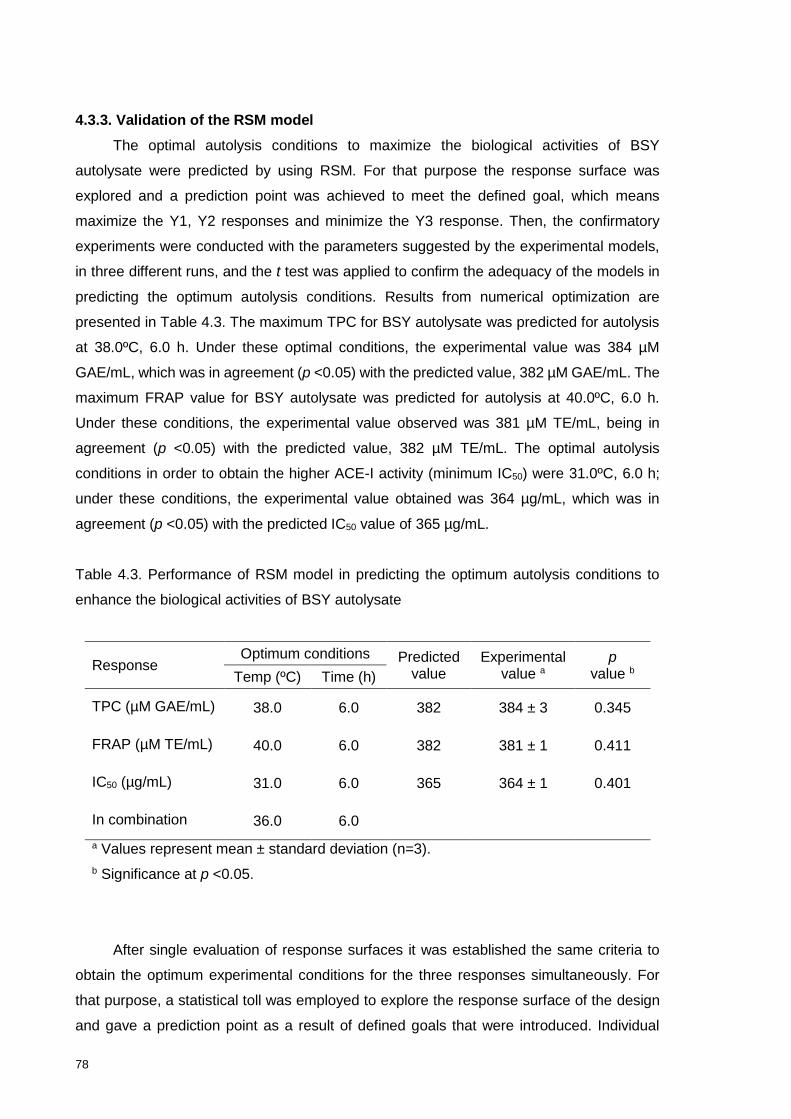
78
4.3.3. Validation of the RSM model
The optimal autolysis conditions to maximize the biological activities of BSY
autolysate were predicted by using RSM. For that purpose the response surface was
explored and a prediction point was achieved to meet the defined goal, which means
maximize the Y1, Y2 responses and minimize the Y3 response. Then, the confirmatory
experiments were conducted with the parameters suggested by the experimental models,
in three different runs, and the t test was applied to confirm the adequacy of the models in
predicting the optimum autolysis conditions. Results from numerical optimization are
presented in Table 4.3. The maximum TPC for BSY autolysate was predicted for autolysis
at 38.0ºC, 6.0 h. Under these optimal conditions, the experimental value was 384 µM
GAE/mL, which was in agreement (p <0.05) with the predicted value, 382 µM GAE/mL. The
maximum FRAP value for BSY autolysate was predicted for autolysis at 40.0ºC, 6.0 h.
Under these conditions, the experimental value observed was 381 µM TE/mL, being in
agreement (p <0.05) with the predicted value, 382 µM TE/mL. The optimal autolysis
conditions in order to obtain the higher ACE-I activity (minimum IC50) were 31.0ºC, 6.0 h;
under these conditions, the experimental value obtained was 364 µg/mL, which was in
agreement (p <0.05) with the predicted IC50 value of 365 µg/mL.
Table 4.3. Performance of RSM model in predicting the optimum autolysis conditions to
enhance the biological activities of BSY autolysate
Response Optimum conditions Predicted
value Experimental
value a p
value b Temp (ºC) Time (h)
TPC (µM GAE/mL) 38.0 6.0 382 384 ± 3 0.345
FRAP (µM TE/mL) 40.0 6.0 382 381 ± 1 0.411
IC50 (µg/mL) 31.0 6.0 365 364 ± 1 0.401
In combination 36.0 6.0
a Values represent mean ± standard deviation (n=3).
b Significance at p <0.05.
After single evaluation of response surfaces it was established the same criteria to
obtain the optimum experimental conditions for the three responses simultaneously. For
that purpose, a statistical toll was employed to explore the response surface of the design
and gave a prediction point as a result of defined goals that were introduced. Individual
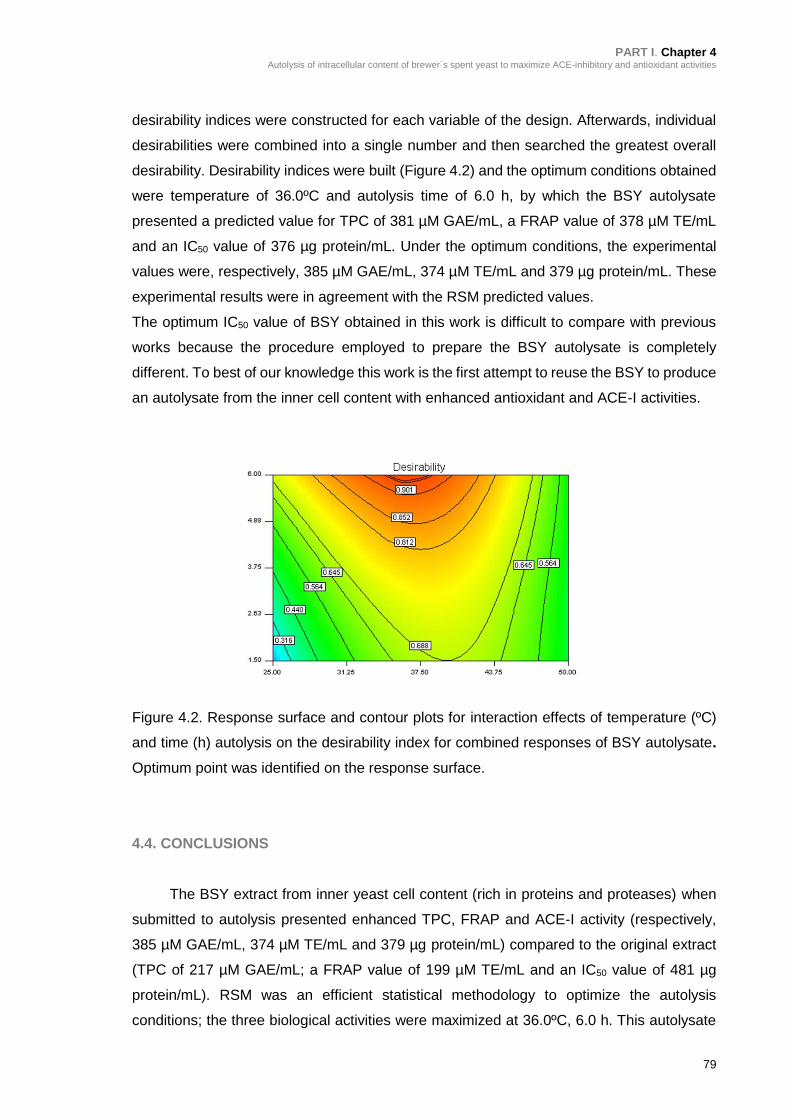
PART I. Chapter 4 Autolysis of intracellular content of brewer`s spent yeast to maximize ACE-inhibitory and antioxidant activities
79
desirability indices were constructed for each variable of the design. Afterwards, individual
desirabilities were combined into a single number and then searched the greatest overall
desirability. Desirability indices were built (Figure 4.2) and the optimum conditions obtained
were temperature of 36.0ºC and autolysis time of 6.0 h, by which the BSY autolysate
presented a predicted value for TPC of 381 µM GAE/mL, a FRAP value of 378 µM TE/mL
and an IC50 value of 376 µg protein/mL. Under the optimum conditions, the experimental
values were, respectively, 385 µM GAE/mL, 374 µM TE/mL and 379 µg protein/mL. These
experimental results were in agreement with the RSM predicted values.
The optimum IC50 value of BSY obtained in this work is difficult to compare with previous
works because the procedure employed to prepare the BSY autolysate is completely
different. To best of our knowledge this work is the first attempt to reuse the BSY to produce
an autolysate from the inner cell content with enhanced antioxidant and ACE-I activities.
Figure 4.2. Response surface and contour plots for interaction effects of temperature (ºC)
and time (h) autolysis on the desirability index for combined responses of BSY autolysate.
Optimum point was identified on the response surface.
4.4. CONCLUSIONS
The BSY extract from inner yeast cell content (rich in proteins and proteases) when
submitted to autolysis presented enhanced TPC, FRAP and ACE-I activity (respectively,
385 µM GAE/mL, 374 µM TE/mL and 379 µg protein/mL) compared to the original extract
(TPC of 217 µM GAE/mL; a FRAP value of 199 µM TE/mL and an IC50 value of 481 µg
protein/mL). RSM was an efficient statistical methodology to optimize the autolysis
conditions; the three biological activities were maximized at 36.0ºC, 6.0 h. This autolysate
80
presents potential for application as ingredient of functional foods due to its antioxidant and
ACE-I activities. Further work should be done to assess the bioactivity of peptides from BSY
autolysates after GI digestion, their resistance to brush-border peptidases and their
susceptibility to intestinal transepithelial transport after GI digestion.

CHAPTER 5
Impact of in vitro gastrointestinal digestion and
transepithelial transport on antioxidant and ACE-
inhibitory activities of brewer´s spent yeast autolysate
_____________________
This chapter describes the simulated GI digestion and the in vitro
intestinal cell permeability of the BSY autolysate that presented
enhanced antioxidant and ACE-I activities

82
PART I. Chapter 5
Impact of in vitro gastrointestinal digestion and transepithelial transport on antioxidant and ACE-inhibitory activities of brewer´s spent yeast autolysate
83
ABSTRACT
The impact of in vitro gastrointestinal digestion and transepithelial transport on antioxidant
and ACE-I activities of brewer´s spent yeast (BSY) autolysate obtained from the inner cell
content was investigated using Caco-2 cell monolayer and Caco-2/HT29MTX co-culture cell
monolayer. Gastrointestinal digestion enhanced both activities (FRAP of 405 µM TE/mL
and IC50 of 345 μg protein/mL). Within a concentration range of 0.5 to 3.0 mg protein/mL of
digested BSY autolysate no cytotoxic effects were observed on Caco-2 cells after 24 h
exposition and the response to oxidative stress, induced by hydrogen peroxide,
demonstrated the protective role of the BSY autolysate. High apparent permeability
coefficient (Papp) values for BSY peptides across Caco-2 cell monolayer model (12.4-
20.8x10⁻⁶ cm/s) and Caco-2/HT29-MTX cell monolayer (14.5-26.1x10⁻⁶ cm/s) were
observed in both models. Antioxidant and ACE-I activities after transepithelial transport
suggest that bioactive peptides from digested BSY autolysate and from the action of brush-
border peptidases were well absorbed.
5.1. INTRODUCTION
Brewer´s spent yeast (BSY), the second major by-product from brewing, is currently
used as a low-valuable animal feed product (2), (5). However, it owns the GRAS (Generally
Recognized as Safe) status and can be valorized through the production of added value
functional food ingredients, such as, β‐glucans from cell wall (175) and nucleotides (50).
BSY extracts can be obtained by autolysis, plasmolysis and hydrolysis although the
most frequent is autolysis (72). The production of BSY autolysates usually involves
incubation of cell suspensions of BSY at temperatures ranging from 45 to 60 °C with a
reaction time between 8 and 72 h (72), (79), (176). Another possibility not explored in the
literature is the autolysis of intracellular content that contains native proteins and proteases,
for this purpose a mechanical disruption of BSY cell wall under refrigerated conditions is
required (177). After cell wall removing, useful for β‐glucans recovery, mild autolysis
conditions with lower temperatures and reducing autolysis time can be applied to the inner
cell content. BSY autolysates contain bioactive peptides that may have potential
applications as food or nutraceutical ingredients due to their antioxidant and ACE-I activities
(79). However, the challenge before in vivo efficacy studies is to understand the impact of
simulated gastrointestinal (GI) digestion; intestinal cell permeability and interaction with
intracellular sources of oxidative stress.

84
The human colorectal adenocarcinoma Caco-2 cell line has been widely used to
evaluate the cytotoxicity of bioactive compounds at concentrations used to exert the desired
bioactivity in the body, as well as, to study the potential for inhibiting intracellular oxidation
(88). Moreover, Caco-2 cell line has been used as in vitro model of absorptive enterocytes
to evaluate the permeability of drugs and food compounds (131), (178). However, only few
studies addressed the intestinal transport of complex mixtures of peptides (127), (178),
(179). Furthermore, to the best of our knowledge this is the first study in which the
permeability of a BSY autolysate is assessed. The Caco-2 cell monolayers exhibit
spontaneous enterocyte-like differentiation under standard culture conditions, showing
morphological polarity and expression of brush-border hydrolases, transporters, microvilli
and tight junctions, thus mimicking the main characteristics of the human small intestine
(133), (178). Nevertheless, this model presents limitations since besides the absorptive
enterocytes (80%) the human intestinal epithelial includes other types of cells, including
enteroendocrine, goblet and paneth cells. Another disadvantage of the Caco-2 cell line is
that the tightness of the monolayer resembles that of the colon and not the small intestine,
therefore paracellular transport can be underestimated (180). To overcome these
limitations, co-cultures of Caco-2 and mucus-secreting cells (HT29-MTX) have been
proposed as a more bio-relevant model of the intestinal epithelium (131), (133), (180).
The major goals of the present study were to investigate: (i) the effect of in vitro GI
digestion on antioxidant and ACE-I activities of BSY autolysate and the ability of the GI
digest to protect Caco-2 cell line regarding viability, mitochondrial integrity and oxidative
stress, (ii) the resistance to brush-border peptidases and the susceptibility to intestinal
transepithelial transport of BSY peptides, comparing two cell monolayer systems broadly
used as models for the small intestine epithelium (Caco-2 and Caco-2/HT29-MTX co-culture
cell monolayers), and (iii) the biological activity of BSY permeates.
5.2. MATERIAL AND METHODS
5.2.1. Reagents and cells
Pepsin; pancreatin; commercial angiotensin-I-converting enzyme (ACE, EC 3.4.15.1, 5.1
U/mg); bovine serum albumin (BSA); trifluoroacetic acid (TFA); 6-hydroxy-2,5,7,8-
tetramethylchroman-2-carboxylic acid (Trolox); dimethyl sulfoxide (DMSO); 3-(4,5-
dimethylthiazol-2-yl)-2,5-diphenyltetrazolium bromide (MTT) and the Millipore UF
membrane 5 kDa were purchased from Sigma-Aldrich (St. Louis, MO, USA). The o-
aminobenzoylglycyl-p-nitro-phenylalanylproline (o-ABz-Gly-Phe(NO2)-Pro) was purchased
from Bachem Feinchemikalien (Bubendorf, Switzerland). GIBCO Dulbecco’s Modified

PART I. Chapter 5
Impact of in vitro gastrointestinal digestion and transepithelial transport on antioxidant and ACE-inhibitory activities of brewer´s spent yeast autolysate
85
Eagle Medium (DMEM), heat-inactivated fetal bovine serum (FBS), penicillin/streptomycin,
trypsin-EDTA and Hank’s balanced salt solution (HBSS, pH 7.0-7.4) were purchased from
Invitrogen (Carlsbad, CA). Falcon® translucent polyethylene terephthalate (PET) cell
culture inserts (3.0 µm pore size, 24 mm diameter inserts, 4.2 cm2 effective growth area)
were acquired from BD Biosciences (Franklin Lakes, NJ, USA) and 6-well and 96-well
microplates were purchased from Corning Costar (Sigma-Aldrich, St. Louis, MO, USA).
Human colon carcinoma (Caco-2) cell line was obtained from the American Type Culture
Collection (ATCC) and mucus producing HT29-MTX cell line was kindly provided by Dr. T.
Lesuffleur (INSERM U178, Villejuif, France).
5.2.2. Equipments
The RP-HPLC analyses were carried out using an analytical HPLC system (Jasco, Tokyo,
Japan) equipped with a quaternary low pressure gradient HPLC pump (Jasco PU-1580), a
degasification unit (Jasco DG-1580-53 3-line degasser), an autosampler (Jasco AS-2057-
PLUS), a multiwavelengh detector (Jasco MD-910) and a 7125 Rheodyne injector valve
(CA, USA). The data acquisition was accomplished using Borwin Controller software,
version 1.50 (JMBS Developments, Le Fontanil, France).
Mass Spectrometry (MS) data were acquired using a 4800 MALDI-TOF/TOF (Applied
Biosystems, Darmstadt, Germany) mass spectrometer in the m/z range of 1000-12000. The
MS data was processed using Data Explorer 4.8 Software (Applied Biosystems).
Spectrophotometric analyses were carried out using a SPECTROstar Nano-microplate,
cuvette UV/Vis absorbance reader (BMG Labtech GmbH, Offenburg, Germany).
Fluorimetric analysis were carried out using a fluorescence microplate reader (FLUOstar
Optima, BMG Labtech GmbH).
5.2.3. Preparation of BSY autolysates and in vitro GI digestion
BSY samples (Saccharomyces pastorianus) were supplied by Unicer brewing (Leça do
Balio, Portugal). Disruption of cell wall to extract the inner yeast content was performed
according to Vieira et al. (177). BSY autolysates from the inner cell content, presenting 10
mg/mL of proteins determined by the Bradford method (171) and pH 6.0, were submitted to
autolysis at 36°C, 6 h and filtered using a 5 kDa MWCO membrane.
To mimic digestion in the stomach and upper intestine, in vitro pepsin-pancreatin digestion
of BSY autolysate from the inner cell content was performed according to the method
described by Samaranayaka et al. (181). The digested BSY autolysate was used for
screening in vitro biological activity (described in sub-section 5.2.4) and for RP-HPLC
analysis (described in sub-section 5.2.6). Freeze-drying of digested BSY extract was
required for cell assays (described in sub-section 5.2.5).

86
5.2.4. In vitro biological activity
Determination of Ferric ion reducing ability (FRAP) was based on the method of Jansen
and Ruskovska (154). Trolox was used as standard at 10-500 μM to produce the calibration
curve. Results were expressed as mean values ± standard deviations of µM of Trolox
equivalent per mL (µM TE/mL). Assays were performed in triplicate.
ACE-I activity was measured in triplicate using the fluorimetric assay of Sentandreu and
Toldrá (121), with the modifications reported by Quiros et al. (122). ACE-I percentage (I)
was calculated using the equation:
I % = (B − A)|(B − C) × 100 (1)
where B is the fluorescence of the ACE solution without an inhibitor (BSY autolysate); A is
the fluorescence of the tested sample of BSY autolysate; and C is the fluorescence of
experimental blank (o-ABz-Gly-Phe(NO2)-Pro dissolved in 150 mM Tris-base buffer (pH
8.3), containing 1.125 M NaCl). IC50 values were measured as the concentration required
to decrease the ACE activity by 50% (122).
5.2.5. Cell-based assays
5.2.5.1. Cell culture maintenance and generation of cell monolayers
Caco-2 and HT29-MTX cell lines at passage 36 and 47, respectively, were used. The two
cell lines were maintained in DMEM supplemented with 10% (v/v) FBS, and 100 U/mL
penicillin and 100 µg/mL streptomycin, at 37ºC under 5% CO2, water saturated atmosphere.
The medium was changed every other day. For cell permeability studies, 90% confluent
Caco-2 and HT29-MTX cells were harvested using trypsin-EDTA and seeded onto
permeable membrane supports mounted in 6-well plates. Seeding density was 2.8x10⁵
cells/mL for Caco-2 cell monolayers and Caco-2/HT29-MTX co-culture model (cell ratio of
90:10), as described by Antunes et al. (131). The culture medium was allowed to
differentiate for 21 days before permeability experiments. The integrity of the cell
monolayers was checked before and after permeability assays by the Transepithelial
Electrical Resistance (TEER) using an epithelial voltammeter (EVOM, World Precision
Instrument, Sarasota, FL, USA).
5.2.5.2. Cell viability determination
Caco-2 cell viability was determined using the MTT assay described by Laitinen et al. (182).
Caco-2 cells at densities of 8x10⁴ cells/well were seeded on 96-well plates in order to obtain
a confluent monolayer within 1 day. Then, cells were incubated for 24 h (37°C, 5% CO2)
with the digested BSY samples at six different concentrations: 0.5; 1.0; 2.0; 3.0; 4.0 and 6.0
mg protein/mL. A negative control (NEGc, cells treated with medium only) and a positive
control (POSc, cells treated with medium and 1% Triton X-100) were also included. After
PART I. Chapter 5
Impact of in vitro gastrointestinal digestion and transepithelial transport on antioxidant and ACE-inhibitory activities of brewer´s spent yeast autolysate
87
cell treatment with the test samples, the culture medium was aspirated and the attached
cells were rinsed with 200 µL HBSS, followed by the addition of fresh culture medium
containing 0.25 mg/L MTT. After 30 min of incubation (37°C, 5% CO2), the formed
intracellular crystals of formazan were dissolved using 100 µL of DMSO and determined by
measuring the absorbance at 570 nm. Data were obtained from three independent
experiments, with each plate containing six replicates for each test sample. Cell viability (%)
was calculated relative to the maximum viability of NEGc, as follows:
𝐶𝑒𝑙𝑙 𝑣𝑖𝑎𝑏𝑖𝑙𝑖𝑡𝑦 (%) = (𝐴𝑏𝑠 𝑠𝑎𝑚𝑝𝑙𝑒
𝐴𝑏𝑠 𝑁𝐸𝐺𝑐) × 100 (2)
where Absorbance of NEGc was used as a measure of the formazan formed in negative
control cells and Absorbance of sample as the measure of the formazan formed after
sample test exposure.
5.2.5.3. Mitochondrial integrity determination
Assessment of mitochondrial integrity was performed by measuring the
tetramethylrhodamine ethyl ester perchlorate (TMRE) inclusion, according to Dias da Silva
et al. (183) protocol. Caco-2 cells at the density of 105 cells/well were seeded onto 96-well
plates. After 24 h, the media was gently aspirated and the cells were incubated with digested
BSY autolysate at six different peptide concentrations for 24 h (37°C, 5% CO2). Then, cells
were rinsed twice with HBSS and incubated at 37ºC with 100 µL of 2 mM TMRE for 30 min.
Then, the media was gently aspirated and replaced by 0.2% BSA in HBSS. Fluorescence
was measured at 37ºC set to 544 nm excitation and 590 nm emission. TMRE mitochondrial
inclusion (%) was calculated relative to the maximum levels of the NEGc. Data were
obtained from three independent experiments, with each plate containing six replicates of
each test sample.
5.2.5.4. ROS levels production
The intracellular reactive oxygen species (ROS) production was monitored by means of the
2`,7`-dichlorodihydrofluorescein diacetate (DCFH-DA) assay, according to Dias da Silva et
al. (183) protocol. DCFH-DA penetrates into cells and is hydrolyzed to DCFH by intracellular
esterases; the presence of ROS can oxidize DCFH to form DCF, a fluorescent product
(183). For this determination, Caco-2 cells at the density 105 cells/well were seeded onto
96-well plates and allowed to attach for 24 h. On the day of the experiment, the differentiated
cells were rinsed with HBSS and incubated with 200 µL per well of digested BSY autolysate
at six different peptide concentrations for 24 h (37°C, 5% CO2). A negative control (NEGc,
cells treated with medium only) was also included. After the treatment period, cells were
rinsed twice with HBSS and incubated with 10 mM DCFH-DA for 30 min (37°C, 5% CO2).
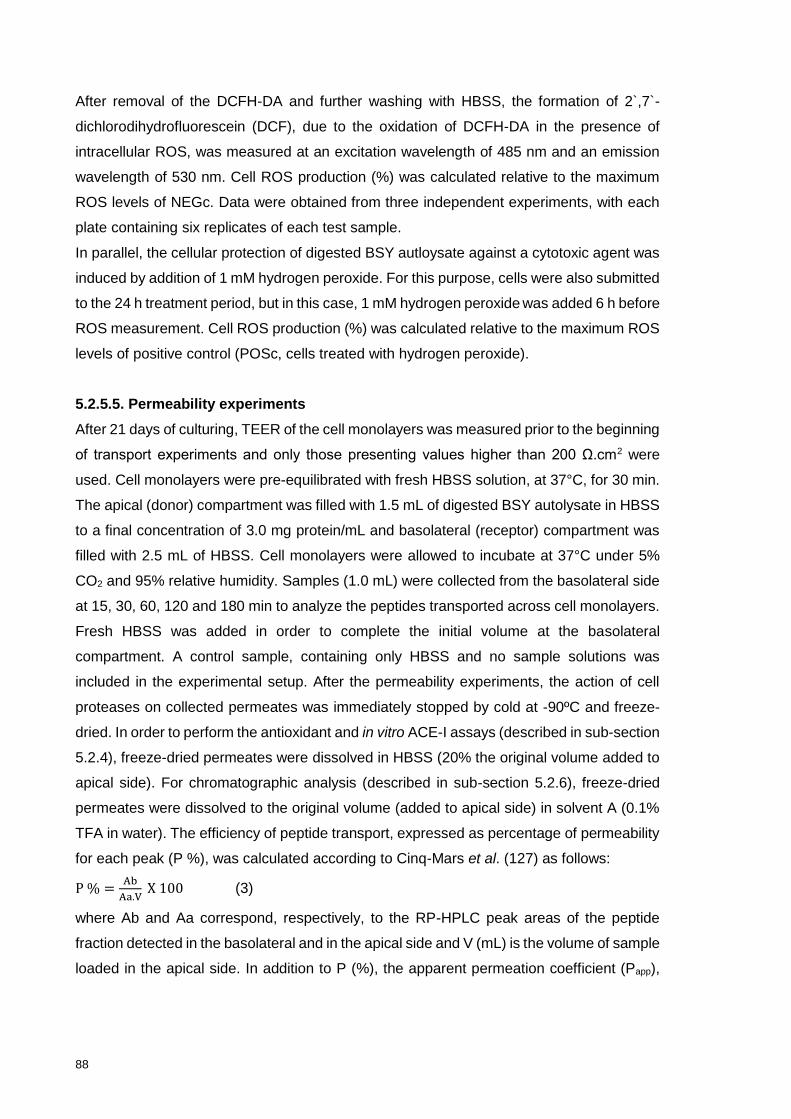
88
After removal of the DCFH-DA and further washing with HBSS, the formation of 2`,7`-
dichlorodihydrofluorescein (DCF), due to the oxidation of DCFH-DA in the presence of
intracellular ROS, was measured at an excitation wavelength of 485 nm and an emission
wavelength of 530 nm. Cell ROS production (%) was calculated relative to the maximum
ROS levels of NEGc. Data were obtained from three independent experiments, with each
plate containing six replicates of each test sample.
In parallel, the cellular protection of digested BSY autloysate against a cytotoxic agent was
induced by addition of 1 mM hydrogen peroxide. For this purpose, cells were also submitted
to the 24 h treatment period, but in this case, 1 mM hydrogen peroxide was added 6 h before
ROS measurement. Cell ROS production (%) was calculated relative to the maximum ROS
levels of positive control (POSc, cells treated with hydrogen peroxide).
5.2.5.5. Permeability experiments
After 21 days of culturing, TEER of the cell monolayers was measured prior to the beginning
of transport experiments and only those presenting values higher than 200 Ω.cm2 were
used. Cell monolayers were pre-equilibrated with fresh HBSS solution, at 37°C, for 30 min.
The apical (donor) compartment was filled with 1.5 mL of digested BSY autolysate in HBSS
to a final concentration of 3.0 mg protein/mL and basolateral (receptor) compartment was
filled with 2.5 mL of HBSS. Cell monolayers were allowed to incubate at 37°C under 5%
CO2 and 95% relative humidity. Samples (1.0 mL) were collected from the basolateral side
at 15, 30, 60, 120 and 180 min to analyze the peptides transported across cell monolayers.
Fresh HBSS was added in order to complete the initial volume at the basolateral
compartment. A control sample, containing only HBSS and no sample solutions was
included in the experimental setup. After the permeability experiments, the action of cell
proteases on collected permeates was immediately stopped by cold at -90ºC and freeze-
dried. In order to perform the antioxidant and in vitro ACE-I assays (described in sub-section
5.2.4), freeze-dried permeates were dissolved in HBSS (20% the original volume added to
apical side). For chromatographic analysis (described in sub-section 5.2.6), freeze-dried
permeates were dissolved to the original volume (added to apical side) in solvent A (0.1%
TFA in water). The efficiency of peptide transport, expressed as percentage of permeability
for each peak (P %), was calculated according to Cinq-Mars et al. (127) as follows:
P % =Ab
Aa.V X 100 (3)
where Ab and Aa correspond, respectively, to the RP-HPLC peak areas of the peptide
fraction detected in the basolateral and in the apical side and V (mL) is the volume of sample
loaded in the apical side. In addition to P (%), the apparent permeation coefficient (Papp),

PART I. Chapter 5
Impact of in vitro gastrointestinal digestion and transepithelial transport on antioxidant and ACE-inhibitory activities of brewer´s spent yeast autolysate
89
expressed in cm/s, was calculated according to Ferraro et al. (184) from the following
equation:
Papp =Q
A.C.t (4)
where Q is the total amount of permeated peptides during the 180 min of the transport
experiment (mg), A is the diffusion area (4.2 cm2), C is the apical compartment
concentration at time zero (mg/mL), and t is the time of the experiment(s).
5.2.6. Peptide analyses by Reverse-phase HPLC and by MALDI-TOF/TOF
Peptide profiles from digested BSY autolysate (0 min) and permeates (at 15, 30, 60, 120
and 180 min) from Caco-2 and Caco-2/HT29-MTX co-culture cell permeability assays were
analysed by RP-HPLC, according to the method described by Ferreira el al. (185).
Additionally, analyses by matrix-assisted laser desorption/ionisation time of-flight/time-of-
flight (MALDI-TOF/TOF) mass spectrometry were also performed to determine the
molecular mass of the peptide mixture. For this purpose, the digested BSY autolysate and
five-fold concentrated permeates from Caco-2/HT29-MTX cell model were cleaned with
ZipTip C18 (Millipore) using the manufacturer’ instructions. Then, the eluted samples were
premixed with matrix (3 mg/mL alpha-cyano-4-hydroxycinnamic acid (CHCA) in 50% (v/v)
aqueous acetonitrile, 0.1% TFA), spotted onto a target plate, and dried at room temperature.
The 4800 MALDI-TOF/TOF was calibrated using horse myoglobine [m/z 16952.56 (+1); m/z
8476.78 (+2); m/z 5651.85 (+3)] and cytochrome c [m/z 12349.72 (+1); m/z 6177.94 (+2)].
5.2.7. Statistical analysis
The student t-test was performed to compare the permeability profile between the two cell
models; one-way analysis of variance (ANOVA) was carried out for comparing multiple
samples, followed by Duncan’s post-hoc test. Differences with p <0.05 were considered
significant. All statistical calculations were performed using SPSS 22.0 (SPSS software,
Chicago, USA).
5.3. RESULTS AND DISCUSSION
5.3.1. Impact of in vitro GI digestion of BSY autolysate on the biological activity
The autolysate obtained from the inner cell content of BSY presented both antioxidant
and ACE-I activities, the FRAP value was 374±12 µM TE/mL and IC50 was 379±10 µg
protein/mL. The in vitro pepsin-pancreatin digestion significantly (p <0.05) enhanced both
activities, since FRAP value increased to 405±9 µM TE/mL and IC50 decreased to 345±10

90
µg protein/mL, probably due to the stability of the existing antioxidant and ACE-I compounds
to digestion and the generation of small peptides presenting these activities.
The viability of Caco-2 cells after treatment with the digested BSY autolysate,
assessed by the MTT assay, indicates no toxic effects concerning mitochondrial enzyme
activity after exposition (24 h at 37ºC, 5% CO2) to the digested BSY autolysate at
concentrations between 0.5 and 4.0 mg protein/mL (Figure 5.1.A). Moreover,
concentrations up to 3.0 mg protein/mL significantly increased the MTT reduction by Caco-
2 cells, reflecting higher metabolic competence. It is not uncommon for some chemicals/
compounds to induce an increase in cellular metabolic activity, which would result in
increased mitochondrial succinate dehydrogenase activity (186). As the protocol performed
in the present study uses cells at confluence, the attained data is not compatible with cell
proliferation. However, at the highest concentration, 6.0 mg protein/mL, the viability of Caco-
2 cells significantly (p <0.05) decreased to around 70%.
TMRE assay indicates that exposition of Caco-2 cells to the digested BSY autolysate
at concentrations lower or equal to 4.0 mg protein/mL did not cause significant mitochondrial
disruption (Figure 5.1.B). Conversely, it was observed an increase of the inner mitochondrial
membrane potential, which is consistent with the effects obtained in the MTT assay. The
mitochondrial membrane potential is a central parameter controlling calcium homeostasis
and ATP synthesis (both involved in several vital cellular processes). Accordingly,
mitochondrial hyperpolarization has been directly correlated with cell survival (187).
Concerning the overall oxidative stress in Caco-2 cells under normal conditions (no
oxidative stress), high inhibition of ROS production was observed for concentrations lower
than 3.0 mg protein/mL (p <0.05) after exposure for 24 h to digested BSY autolysate (Figure
5.2.A), suggesting a protective antioxidant effect of Caco-2 cells. A significant increase in
ROS production occurred in the presence of hydrogen peroxide when compared with
unstressed conditions (Figure 5.2.B). However, digested BSY autolysate presented a
protective effect on Caco-2 cells, as evidenced by the lower ROS generation (p <0.05). The
concentration of 3.0 mg protein/mL was selected for permeability experiments taking in
consideration the results from cell viability, mitochondrial membrane potential and oxidative
stress response.
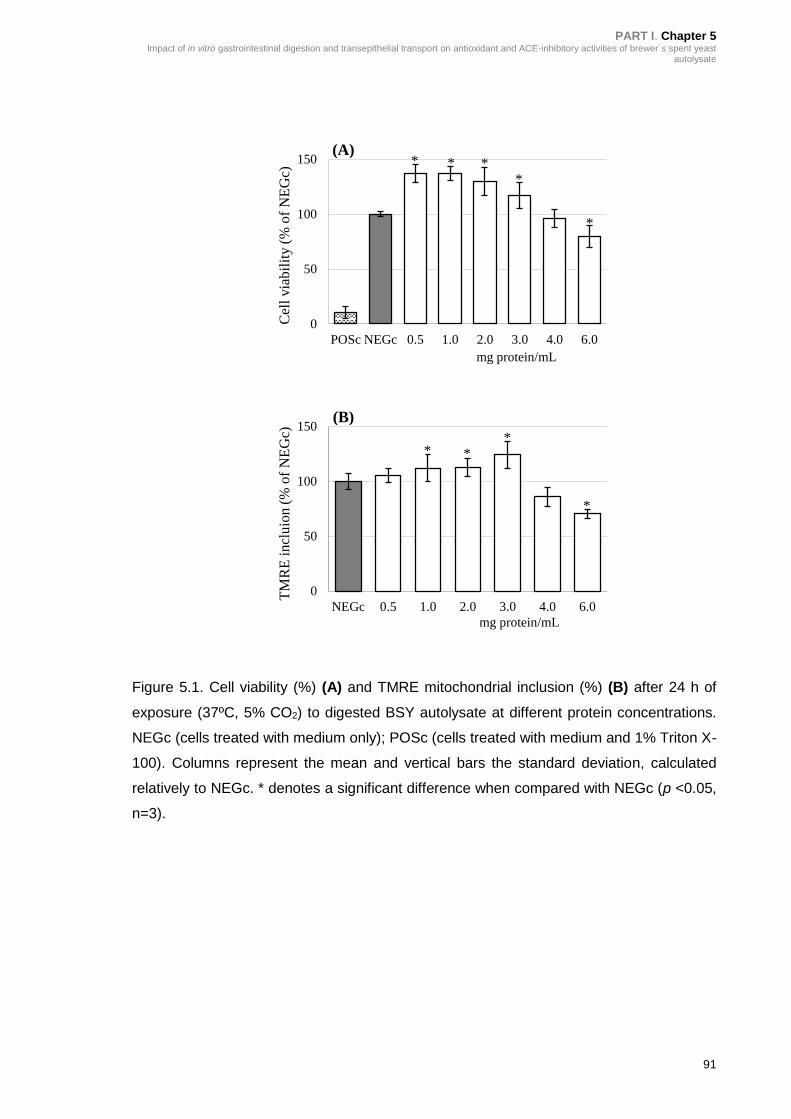
PART I. Chapter 5
Impact of in vitro gastrointestinal digestion and transepithelial transport on antioxidant and ACE-inhibitory activities of brewer´s spent yeast autolysate
91
Figure 5.1. Cell viability (%) (A) and TMRE mitochondrial inclusion (%) (B) after 24 h of
exposure (37ºC, 5% CO2) to digested BSY autolysate at different protein concentrations.
NEGc (cells treated with medium only); POSc (cells treated with medium and 1% Triton X-
100). Columns represent the mean and vertical bars the standard deviation, calculated
relatively to NEGc. * denotes a significant difference when compared with NEGc (p <0.05,
n=3).
0
50
100
150
POSc NEGc 0.5 1.0 2.0 3.0 4.0 6.0
Cel
l via
bil
ity (
% o
f N
EG
c)
mg protein/mL
* * *
*
*
(A)
0
50
100
150
NEGc 0.5 1.0 2.0 3.0 4.0 6.0
TM
RE
incl
uio
n (
% o
f N
EG
c)
mg protein/mL
*
*
* *
(B)

92
Figure 5.2. Protective effect of the digested BSY autolysate on ROS levels after 24 h of
exposure (37ºC, 5% CO2) at different protein concentrations (mg/mL) under no stress
treatment (A) and after oxidative stress induced by hydrogen peroxide (6 h exposure) (B).
NEGc (cells treated with medium only); POSc (cells treated with medium and 1 mM
hydrogen peroxide). Columns represent the mean and vertical bars the standard deviation,
calculated relative to respective control. # indicates respective differences between “no
oxidative stress” and “oxidative stress” treatments (p <0.05, n=3). Bars labeled with different
subscript and superscript letters have mean values that are significantly different at p <0.05
(ANOVA followed by Duncan's test).
5.3.2. Intestinal permeability of peptides from BSY autolysate
Caco-2 and Caco-2/HT29-MTX monolayers with TEER values of 360-390 Ω.cm2 and
220-250 Ω.cm2 at 21 days, respectively, were used in the permeability studies. Lower TEER
values observed for the co-culture model are related to the establishment of looser tight
junction between Caco-2 and HT29-MTX cells (131), (179). After permeability experiments,
TEER values of Caco-2 and Caco-2/HT29-MTX co-culture cell monolayers remained
unchanged compared to the original values (decrease less than 10%), suggesting that the
digested BSY autolysate did not affect significantly the viability and integrity of cell
monolayers. Figure 5.3 shows the typical RP-HPLC profile of the digested BSY autolysate
used in cell permeability assays, in which six major peptide fractions were separated and
numbered from P1 to P6 according to the polarity increase. Elution was monitored at 214
0
50
100
150
200
NEGc 0.5 1.0 2.0 3.0 4.0 6.0 POSc 0.5 1.0 2.0 3.0 4.0 6.0
Cel
l R
OS
lev
els
(% o
f C
on
tro
l)
mg protein/mL mg protein/mL
no stress stress A#
D#
C#
B#
D#
C#
C#
a ab b b
c
d d
(B) (A)

PART I. Chapter 5
Impact of in vitro gastrointestinal digestion and transepithelial transport on antioxidant and ACE-inhibitory activities of brewer´s spent yeast autolysate
93
nm. RP-HPLC profile of permeates from Caco-2 and Caco-2/HT29-MTX co-culture cell
monolayers obtained at 180 min are also shown in Figure 5.3. Similar RP-HPLC profiles
were obtained in the apical and basolateral sides of Caco-2 (Figure 5.3.A) and Caco-
2/HT29-MTX monolayers (Figure 5.3.B), although qualitative differences were observed on
peak areas. According to the literature small peptides presenting less than 1000 kDa are
transported intact through the intestinal epithelium by PepT1, a proton-coupled membrane
transporter (88). However, MALDI-MS spectra of permeates confirmed the presence of
oligopeptides with molecular weight higher than 1000 kDa, not only in the digested BSY
autolysate but also in permeates (Figure 5.4.A and B). The paracellular transport through
the intercellular junctions can be involved in the transepithelial absorption of peptides larger
than three amino acid residues; although the absorptive transcytosis have been suggested
as the main transport system for long-chain oligopeptides (88), (188). Moreover, as
illustrated in Figure 5.4, there are more peptide fragments in the sample taken from the
basolateral side than that from the apical side, which suggests a partial degradation of
apical peptides into smaller fragments by the action of cell peptidases and their absorption
through the Caco-2/HT29-MTX cell monolayer (178).
Figure 5.3. RP-HPLC chromatographic profile of digested BSY autolysate before (0 min)
and after permeability (180 min) through Caco-2 cell monolayers (A) and Caco-2/HT29 co-
culture cell monolayers (B). The absorbance was monitored at 214 nm. Retention time for
chromatographic peaks was: (P1) 4.2-6.2 min; (P2) 6.3-10.0 min; (P3) 10.1-13.3 min; (P4)
13.4-16.0 min; (P5) 16.1-17.5 min and (P6) 17.6-19.6 min.
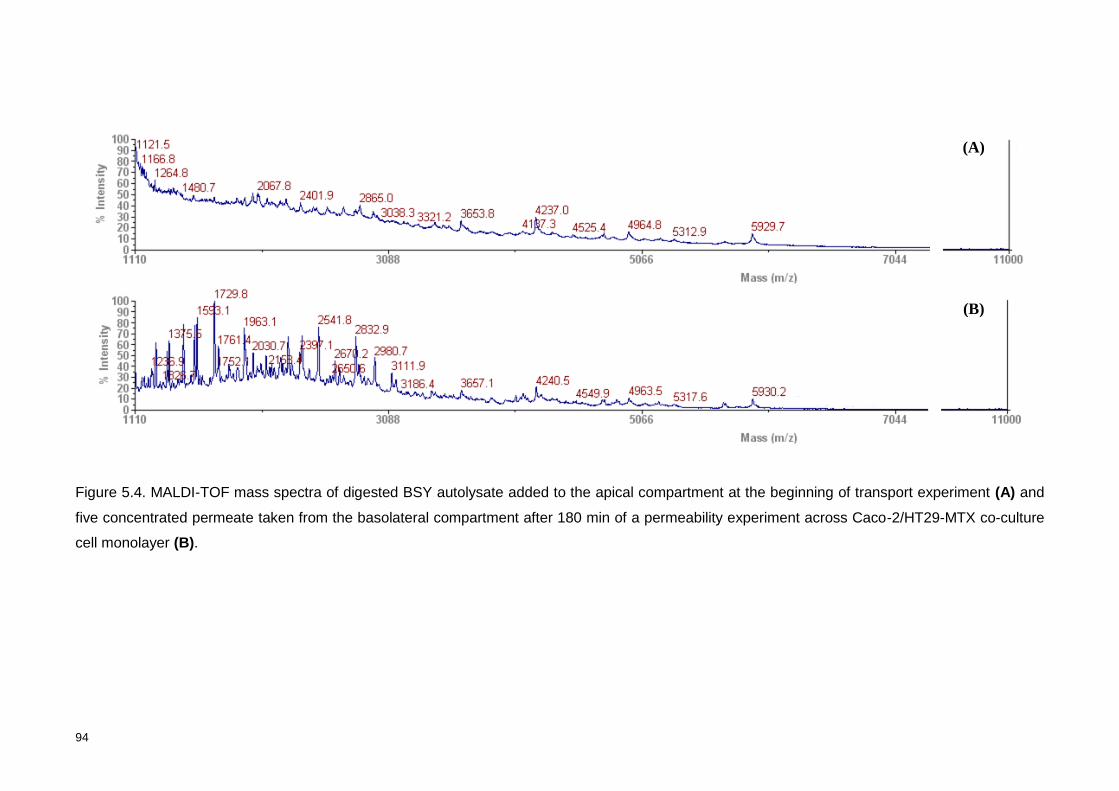
94
Figure 5.4. MALDI-TOF mass spectra of digested BSY autolysate added to the apical compartment at the beginning of transport experiment (A) and
five concentrated permeate taken from the basolateral compartment after 180 min of a permeability experiment across Caco-2/HT29-MTX co-culture
cell monolayer (B).
(B)
(A)
PART I. Chapter 5
Impact of in vitro gastrointestinal digestion and transepithelial transport on antioxidant and ACE-inhibitory activities of brewer´s spent yeast autolysate
95
The permeability profile of peptide fractions (P1 to P6) for both cell models is depicted
in Figure 5.5 as the cumulative transport up to 180 min. Intense permeation of peptide
fractions was observed during the first 30-60 min. In Caco-2 cell monolayers, the
accumulated permeability at 180 min was significantly higher for P5 and P6 peptide
fractions, which reached, respectively, 44.9±2.6% and 55.4±1.3% (Figure 5.5.A). In the
case of the Caco-2/HT29-MTX co-culture cell model, the accumulated permeability was
significantly higher at 180 min of transport for P2, P5 and P6 peptide fractions, reaching,
respectively, 63.5±2.6%, 52.7±1.6% and 69.6±0.6% of transport rate (Figure 5.5.B). The
presence of HT29-MTX cells led to a significant transport increase of peptides when
compared with the Caco-2 cell monolayer. As aforementioned, this result can be explained
by the lower TEER values observed for Caco-2/HT29-MTX co-culture cell monolayer.
Permeability was higher for the more hydrophobic peptides (P5 and P6 fractions), which is
in agreement to data reported by other authors for other type of food peptides (127).

96
Figure 5.5. Comparative in vitro cumulative permeability of BSY peptides across Caco-2 cell monolayers (A) and Caco-2/HT29-MTX co-culture cell
monolayers (B). Permeation (%) was calculated from the area of each peptide fraction in the RP-HPLC chromatogram, numbered from P1 to P6
according to the increase of polarity (see Figure 5.3 for peak identification). Experiments were conducted from the apical to the basolateral compartment.
Individual points and error bars represent mean ± standard deviation (n=3).
(B) (A)

PART I. Chapter 5 Impact of in vitro gastrointestinal digestion and transepithelial transport on antioxidant and ACE-inhibitory activities of brewer´s spent yeast
autolysate
97
Papp values can be correlated with the predictable magnitude of in vivo absorption. In
the present work, the criteria defined by Yee (189) was considered, according to which a
compound with Papp value lower than 10−6 cm/s indicates poor in vivo absorption (0-20%);
Papp values between 10−6-10−5 cm/s correspond to substances with moderate absorption
(20-70%) and Papp values over 10−5 cm/s suggest that compounds are well absorbed (70-
100%). In this work, Papp values at 180 min of absorptive transport of BSY peptides across
Caco-2 monolayers were in the range of 12.4-20.8×10⁻⁶ cm/s (Table 5.1), suggesting
extensive in vivo absorption. This parameter was significantly higher when the Caco-
2/HT29-MTX co-culture cell monolayer was used (ranging between 14.5-26.1×10⁻⁶ cm/s).
This last model is presumably closer to the in vivo situation and, thus, more realistically
simulates the intestinal epithelium (131), (132). In general, the high Papp values are in
accordance with values reported in the literature for other food-derived peptides (Papp
ranging 4.1-20.8×10⁻⁶ cm/s) (188). The presence of mucus-producing cells makes the co-
culture monolayer looser, with higher number of paracellular pores per cm2 (133), and, thus,
more permeable. Similar conclusions were observed by Musatti et al. (179), when
comparing the Caco-2 and Caco-2/HT29-MTX cell culture models to evaluate the transport
and bioavailability of glutathione-enriched baker´s yeast. Mucoadhesive delivery systems
have been recognized as effective in enhancing the intestinal absorption of peptides and
proteins (190). Other aspect which can also contribute to the high permeability observed is
the fact that some compounds in complex extracts, such as, BSY autolysate, could act as
permeability enhancers and cause partial opening of paracellular spaces between Caco-2
cells. These small changes in the diameter of paracellular spaces can significantly affect
the permeability of small hydrophilic molecules (180), (182). For instance, Fuller et al. (191)
investigated the effect of heat-killed yeast cell suspensions on Caco-2 cell monolayer tight
junction integrity in order to examine whether yeast suspension can act as a penetration
enhancer for proteins. These authors observed that heat-killed yeast cells suspensions
opened tight junctions in a reversible dose- and time-dependent manner without significant
cytotoxic effects being observed.
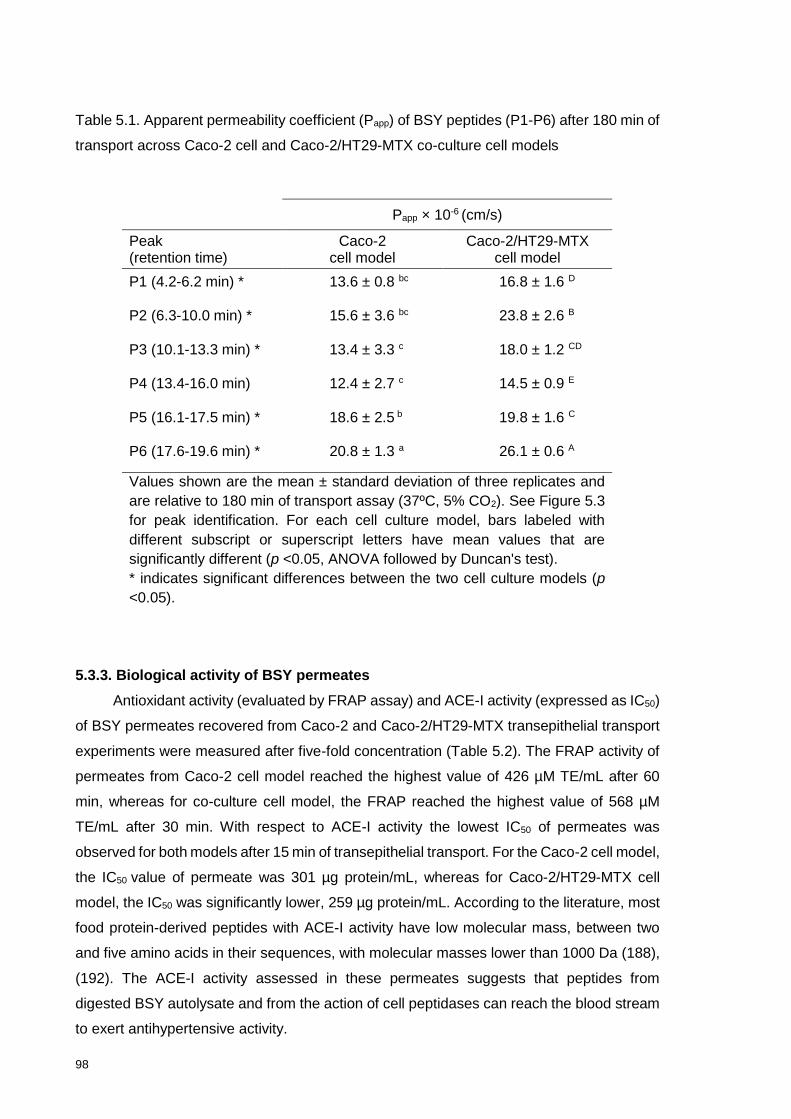
98
Table 5.1. Apparent permeability coefficient (Papp) of BSY peptides (P1-P6) after 180 min of
transport across Caco-2 cell and Caco-2/HT29-MTX co-culture cell models
5.3.3. Biological activity of BSY permeates
Antioxidant activity (evaluated by FRAP assay) and ACE-I activity (expressed as IC50)
of BSY permeates recovered from Caco-2 and Caco-2/HT29-MTX transepithelial transport
experiments were measured after five-fold concentration (Table 5.2). The FRAP activity of
permeates from Caco-2 cell model reached the highest value of 426 µM TE/mL after 60
min, whereas for co-culture cell model, the FRAP reached the highest value of 568 µM
TE/mL after 30 min. With respect to ACE-I activity the lowest IC50 of permeates was
observed for both models after 15 min of transepithelial transport. For the Caco-2 cell model,
the IC50 value of permeate was 301 µg protein/mL, whereas for Caco-2/HT29-MTX cell
model, the IC50 was significantly lower, 259 µg protein/mL. According to the literature, most
food protein-derived peptides with ACE-I activity have low molecular mass, between two
and five amino acids in their sequences, with molecular masses lower than 1000 Da (188),
(192). The ACE-I activity assessed in these permeates suggests that peptides from
digested BSY autolysate and from the action of cell peptidases can reach the blood stream
to exert antihypertensive activity.
Papp × 10-6 (cm/s)
Peak (retention time)
Caco-2 cell model
Caco-2/HT29-MTX cell model
P1 (4.2-6.2 min) * 13.6 ± 0.8 bc 16.8 ± 1.6 D
P2 (6.3-10.0 min) * 15.6 ± 3.6 bc 23.8 ± 2.6 B
P3 (10.1-13.3 min) * 13.4 ± 3.3 c 18.0 ± 1.2 CD
P4 (13.4-16.0 min) 12.4 ± 2.7 c 14.5 ± 0.9 E
P5 (16.1-17.5 min) * 18.6 ± 2.5 b 19.8 ± 1.6 C
P6 (17.6-19.6 min) * 20.8 ± 1.3 a 26.1 ± 0.6 A
Values shown are the mean ± standard deviation of three replicates and
are relative to 180 min of transport assay (37ºC, 5% CO2). See Figure 5.3
for peak identification. For each cell culture model, bars labeled with
different subscript or superscript letters have mean values that are
significantly different (p <0.05, ANOVA followed by Duncan's test).
* indicates significant differences between the two cell culture models (p
<0.05).

99
Table 5.2. FRAP and ACE-I activity of Caco-2 and Caco-2/HT29-MTX co-culture cell model
permeates at different times of transport, five-fold concentration of permeates
Sample FRAP
(µM TE/mL) IC50
(µg protein/mL)
Permeates of Caco-2 cell model
15 min 243 ± 10 c 301 ± 11 A
30 min 304 ± 17 b 367 ± 12 B
60 min 426 ± 11 a 826 ± 22 C
120 min 149 ± 8 d 1238 ± 42 D
180 min 37 ± 3 e 1981 ± 53 E
Permeates of Caco-2/HT20-MTX co-culture cell model
15 min 365 ± 11 c 259 ± 18 A
30 min 568 ± 15 a 285 ± 12 B
60 min 448 ± 8 b 669 ± 21 C
120 min 213 ± 12 d 1071 ± 26 D
180 min 85 ± 6 e 1821 ± 46 E
Results are expressed as mean ± standard deviation of triplicate experiments. For
each model, mean values with different subscript (FRAP) or superscript letters (IC50)
are significantly different (p <0.05, ANOVA followed by Duncan's test).
5.4. CONCLUSIONS
Data from in vitro GI digestion, cell cellular antioxidant assays and cell monolayer
permeation studies confirmed the potential of BSY autolysate obtained from inner yeast cell
content as functional food ingredient with antioxidant and ACE-I activities. GI digestion
enhanced both biological activities. No cytotoxic effects were observed on Caco-2 cells after
24 h exposition to the digested BSY autolysate within a concentration range of 0.5 to 3.0
mg protein/mL. Moreover, the response to oxidative stress induced by hydrogen peroxide
demonstrated the protective role of the autolysate within this concentration range, which is
relevant since GI tract is a major target for oxidative stress damage due to the constant
exposure to diet-derived oxidants, mutagens, and carcinogens. Additionally, high apparent
permeability coefficient (Papp) values for BSY peptides were observed in both models used
for transepithelial transport, 14.5-26.1x10⁻⁶ cm/s for Caco-2/HT29-MTX cell monolayer and
12.4-20.8x10⁻⁶ cm/s for Caco-2 cell monolayer model. Antioxidant and ACE-I activities were
also found in permeates, which suggests that bioactive compounds are well absorbed.

100
However, pharmacological efficacy may only be confirmed by in vivo studies and these
results indicate that such studies are justified.

101
PART II
“Sardine protein hydrolysates”
_____________________
Chapter 6
Literature review
Development of sardine protein hydrolysates and their health promoting ability
Chapter 7
Antioxidant and antihypertensive hydrolysates obtained from by-products of cannery
sardine and brewing industries
Chapter 8
Simulated gastrointestinal digestion and in vitro intestinal permeability of bioactive protein
hydrolysates obtained from canned sardine and brewing by-products
Chapter 9
Anti-inflammatory activity of a hydrolysate from canned sardine and brewing by-products
through inhibition of TNF-a-induced endothelial dysfunction in a co-culture model of Caco-
2 and endothelial cells
Chapter 10
Characterization of hydrolysates obtained from muscle and viscera proteins of canned
sardine by-products

102

103
CHAPTER 6
Literature review
Development of sardine protein hydrolysates and their
health promoting ability
_____________________
This chapter presents a literature overview of the canned sardine
by-product, it describes the characterization of sardine sarcoplasmic
proteins, the typical process adopted for the manufacturing of SPH and
the main biological activities reported.

104

PART II. Chapter 6 Literature review
Development of sardine protein hydrolysates and their health promoting ability
105
6.1. Canned sardine industry
Sardine (Sardine pilchardus) is a small pelagic fish highly consumed among
Mediterranean populations (13), (193). Great part of it is used by canned sardine industry.
The canning process of sardine produces more than 60% by-products, which includes head,
skin, trimmings, fins, viscera and frames (13), (102). This waste constitutes a serious
environmental problem for fisheries since their discharge requires convenient management,
and contains good amounts of protein rich material, which is currently processed into low
market-value products, such as, animal feed, fish meal and fertilizers (102). Therefore, the
recovery of added-value compounds from these materials can be of great economic
importance and practical interest to promote the sustainability and competitiveness of
sardine canning industry (12). Several techniques describing the recovery of essential
nutrients and bioactive compounds form sardine by-products to be applied as functional
food ingredients and nutraceuticals in human and animal nutrition, pharmaceutics and
cosmetics were published (1), (13), (194). Production of sardine protein hydrolysates (SPH)
is one of those techniques currently employed.
6.2. Nutritional composition of sardine by-product
The lipid content of sardines ranges between 0.5 and 20% dw, depending on the
season, stage of sexual maturity and body size. The n-3 polyunsaturated fatty acids
(PUFAs), especially eicosapentaenoic acid (EPA) and docosahexaenoic acid (DHA),
represent 40% of total fatty acids and are recognized to possess numerous health benefits
(195). The protein content ranges between 15 and 20% dw, depending on catch location
and species (195). Proteins can be divided into different groups based on their solubility: (i)
70-80% are myofibrillar proteins, being soluble in cold neutral salt solutions of fairly high
ionic strength; (ii) 20-30% are sarcoplasmic proteins, being soluble in water and dilute
buffers and (iii) 2-3% are structural proteins, being insoluble connective tissue proteins
(194). The myofibrillar protein complexes contain myosin (50-60%) and actin (15-30%).
Myosin is a large molecule containing two identical heavy chains (223 kDa) and four light
chains subunits ranging from 17 to 22 kDa (195). Among sarcoplasmic proteins, myoglobin
(15.3 kDa) is presumably the most important protein (196), (197). Karthikenyan et al. (198)
and Klomklao et al. (199) reported that sarcoplasmic proteins from sardine muscle showed
multiple bands with molecular weights between 29 and 97 kDa.
106
6.3. Potential applications of SPH
SPH are breakdown products of enzymatic hydrolysis of sardine proteins into smaller
peptides (2-20 amino acids), which present various physiological functions in the organism
(102). To date, SPH have been produced by enzymatic hydrolysis, autolysis (using
endogenous enzymes), fermentation or combined processes (194). SPH have been
reported as good nutritional supplements due to peptides composition, biological activity
and easy absorption. Thus, commercial preparations of SPH are currently used in many
countries as health food or nutraceuticals (194). Some examples of commercially available
nutraceutical brands are the Valtryon® and the Lapis Suport®, which contain
antihypertensive peptides (19).
SPH can be used as an excellent source of nitrogen for the growth of different
microorganisms. For example, Ghorbel et al. (200) used SPH as nitrogen source for the
production of extracellular lipase by the filamentous fungus Rhizopus oryzae. SPH have
also been used in aquaculture feeds in order to enhance the growth and survival of fish. For
instance, Kotzamanis et al. (201) reported growth performance and immunological status
improvement of sea bass larvae when SPH was incorporated in diet.
SPH have also been tested successfully for their application as antioxidant agents.
For instance, Khaled et al. (101) studied the effect of SPH on the oxidative status and blood
lipid profile of rats fed with hypercholesterolemic diet. SPH reduced the malondialdehyde
(MDA) concentration and increased the antioxidant enzyme (superoxide dismutase,
glutathione peroxidase and catalase) activities and the high density lipoprotein (HDL)
cholesterol. More recently, Athmani et al. (135) showed that supplementation of
hypercholesterolemic diet rats with SPH efficiently decrease the lipid peroxidation in serum
and target tissues, being related with the increased antioxidant enzymes activity.
Moreover, SPH have been used as techno-functional ingredients in food industry as
they possess numerous important properties, such as, water holding capacity, oil absorption
capacity, protein solubility, gelling activity, foaming capacity and emulsifying ability (20),
(194), (202-204). SPH have been successfully tested for incorporation into different food
systems, such as, cereal products, fish and meat products, desserts and crackers, as well
as, protein supplements, stabilizers in beverages and flavour enhancers (194).

PART II. Chapter 6 Literature review
Development of sardine protein hydrolysates and their health promoting ability
107
6.4. Preparation of SPH
The production of fish protein hydrolysates (as SPH) and bioactive peptides has been
described in several reviews (87), (102), (194), (205), (206). The process usually consists
in protein extraction, enzymatic hydrolysis, separation and purification of SPH, application
of in vitro methods to determine the biological activities, determination of the peptide
sequence and evaluation of possible structure-function relations. In vivo studies and
synthesis of purified peptides to validate their activities require high costs and are more
difficult to implement than in vitro studies. The main typical steps involved in producing of
SPH and bioactive peptides at laboratorial and industrial scale are outlined in Figure 6.1.
6.4.1. Preparation of Sardine Protein concentrate (SPC)
Different techniques can be used for extracting sarcoplasmic and/or myofibrillar
proteins from sardine muscle. These include the use of aqueous and organic solvents and
the conventional processes of cooking, pressing, drying and hot oil extraction (194). Sardine
protein concentrates (SPC) can be obtained by acidic or alkaline solubilisation followed by
isoelectric protein precipitation (207), (208). This technique concentrates protein fraction,
which represents 18-23% of fish muscle, and removes water and oil from the sardine muscle
(13). The recovery yield ranges between 42 and 90% (13). At the end of SPC preparation,
a lipid phase, an aqueous soluble phase that contains proteins, and an insoluble sediment
are separated, as observed in Figure 6.2. For removal of lipid phase, multiple steps of
filtration or centrifugation must be performed (194).
Figure 6.2. Different fractions obtained in the SPC preparation.
lipid
soluble protein
insoluble protein

108
Figure 6.1. Flow diagram for the preparation of fish protein hydrolysates (as SPH) and
bioactive peptides, at laboratorial and industrial scales. Adapted from (205) and (206).
* Biological activities and bioavailability can be performed in protein hydrolysate,
hydrolysate fractions and isolate peptides.
Step Laboratorial scale Industrial scale
Protein extraction
Enzymatic hydrolysis
Inactivation of hydrolysis
Centrifugation/Filtration
Supernatant collection
Dehydration
Separation
Purification
Peptide sequence
Peptide synthesis
Committe regulation
In vitro methods
- Stage I digestion - Stage II digestion In vivo animal model
Chemical synthesis (liquid phase) Recombinant DNA technology
Chemical synthesis (solid phase) Recombinant DNA technology Enzymatic synthesis
Edmam degradation Mass spectrometry
Ion exchange membrane Ion exchange chromatography Nanofiltration membrane Electromembranes
Size exclusion chromatography Ion exchange chromatography Affinity chromatography Reverse phase chromatography
Ultrafiltration membranes Ultrafiltration membranes
Digestive enzymes, Proteolytic enzymes, Fermentation, Ripening
Microbial enzymes, Fermentation Batch/ continuous reactor, Immobilized enzymes
Bioacessibility
Commercial product
assimilation
Hydrolysate
fraction*
Isolated peptide *
Protein source
Protein hydrolysate *
Synthesized peptide
Heat, pH adjustment Heat, pH adjustment
In vitro methods
- Stage I digestion - Stage II digestion In vivo animal model
PART II. Chapter 6 Literature review
Development of sardine protein hydrolysates and their health promoting ability
109
6.4.2. Protein hydrolysis
Hydrolysis of SPC can be performed by endogenous proteolytic enzymes already
present in muscle or viscera of sardine (4), (15), (16), (101), (209) and/or by adding
exogenous enzymes from other sources, which must present food grade requirements
(194). Several industrial food-grade proteases, such as, Alcalase® (12), (15), (16), (20),
(112), (134), (200), (202), (209-213); Neutrase® (202); Flavourzyme® (211); Protamex®
(211), (214) and Subtilisin® (215) have been widely used. Enzymes from animal sources,
such as, Pepsin® (17); Trypsin® (199), (213), (215), and Chymotrypsin® (15) have also
been used, although to a lesser extent. Moreover, crude enzyme preparations from other
microorganisms, namely, Bacillus licheniformis NH1 (15), (16); Aspergillus clavatus ES1
(15), (16); Bacillus pumilus A1 (101) and Bacillus mojavensis A21 (101) have also been
used. In general, the use of exogenous enzymes is preferred to the autolysis process due
to the reduction in time required to achieve similar degree of hydrolysis, as well as, better
control of the hydrolysis to obtain more consistent molecular weight profiles and peptide
composition (194). Besides biochemical hydrolysis, chemical hydrolysis (with either acid or
base to cleave the peptide bonds) can also be performed to produce SPH. However, this
method presents many limitations; the final SPH present reduced nutritional value, large
amount of salt; poor functionality and restrictions to be use as flavour enhancers. Another
disadvantage of acid hydrolysis is the destruction of the essential amino acid tryptophan
(194).
To obtain SPC by enzymatic treatment, the material should be first suspended in
water/ buffer, and then adjusted to the optimum pH and temperature of the enzyme. In some
cases, the raw material is first heated to inactivate endogenous proteases before adding
the exogenous enzyme. Hydrolysis reactions can occur with or without pH adjustment;
hydrolysis carried out without any pH adjustment are economically desirable from an
industrial point of view (216). The added acid and/ or base increase salt to the hydrolysate,
which may give undesirable effects and may be difficult and costly to remove further in a
process (217). The hydrolysis reaction is stopped either by using a heat treatment or by
adjusting the pH. More than one centrifugation step is often required to separate the soluble
proteins from the lipids and insoluble solids. The lipid content of SPH must be low to prevent
alteration of the lipid fraction during storage. After solids removal, the supernatant is often
adjusted to neutral pH and then dehydrated to obtain the powdered SPH (13).
Suitable enzyme and hydrolysis conditions, such as, enzyme to substrate (E/S) ratio,
time and temperature, are crucial to obtain SPH with desirable biological and techno-
110
functional properties. Response Surface Methodology (RSM) experimental design can be
used to optimize hydrolysis conditions, as well as, to predict SPH properties (102), (212).
Several RSM experimental designs have been employed, including the Central Composite
Design (CCD), Complete Randomized Factorial Design (CRFD), Box-Behnken Design, 2-
fold Rotation Plan Centered Design and Orthogonal Design (218).
The extent of enzymatic hydrolysis can be measured by several methods. The
degree of Hydrolysis (DH %) is the most commonly used, including the pH-stat technique,
which is more useful for industrial application, and the trichloroacetic acid (TCA) and
trinitrobenzenesulfonic acid (TNBS) methods, very useful when working at laboratorial scale
(194). The basic principle of the TNBS method is that free amino groups released by
proteolysis can be measured by the formation of a yellow coloured derivative measurable
by spectrophotometry. This method is more sensitive when several small peptides are
available (219). Other methods to measure the extent of protein degradation are RP-HPLC
and SDS-PAGE. In RP-HPLC analysis, peptides are separated by polarity; small hydrophilic
peptides elute first, whereas hydrophobic and/ or higher peptides are retained in the column
and take longer to elute (220). The SDS-PAGE is preferable to show larger fragments
resulting from proteolysis (219).
6.4.3. SPH concentration and purification
SPH contains a complex mixture of active and inactive peptides having various sizes
and different amino acid composition. Therefore, several enrichment methods need to be
applied to produce fractions with high concentration of bioactive peptides. SPH may be
concentrated through UF membranes to obtain a more uniform product with the desired
range of molecular mass (218). After enzyme inactivation, SPH is filtered through a
membrane with a specific MWCO value; common MWCO membranes used are 1, 3, 5 and
10 kDa. The UF process can contain more than one UF membrane, yielding several
molecular weight fractions depending on the product desired. This method is more effective
for highly purified and defatted SPH. Other possible separation methods are the suction
filtration of the sludge and filtering the slurry by passing it through a 2-mm mesh screen
(194) and the Fast Performance Liquid Chromatography (FPLC), which is usually used to
obtain peptides with molecular weights <3 kDa (218). Chromatographic techniques have
been used for fractionation of protein and peptide mixtures depending on their affinity to
either the mobile or stationary phases. Gel filtration chromatography (GFC) separates
proteins and peptides according to their size as they pass through a gel medium in a packed
PART II. Chapter 6 Literature review
Development of sardine protein hydrolysates and their health promoting ability
111
column. This technique has been used to fractionate and concentrate peptides in SPH (16)
and is often combined with other separation techniques (103).
6.4.4. Identification of bioactive peptides from SPH
Amino acid analysis is important to assess the nutritional value of SPH and to identify
the presence of specific amino acids with influence on the biological and techno-functional
properties of SPH (102). In order to identify the peptide sequences, Liquid chromatography
with tandem mass spectrometry detection (LC-MS/MS) followed by a database search, is
usually used. Also, the MALDI-TOF analysis is very useful to obtain the peptide profile of
protein hydrolysates or semi-purified fractions. A major limitation of this method is that the
peptides with molecular masses below 0.5 kDa are difficult to identify (221).
6.5. Nutritional composition of SPH
Chemical composition of SPH is crucial from a nutritional perspective (102). Table
6.1 summarizes the Degree of hydrolysis and proximate composition obtained for various
SPH reported in the literature.
The high protein content reported for SPH, which ranged between 66.4% and 87.0%
(dw), is due the solubilization of proteins during hydrolysis and removal of insoluble solid
matter by centrifugation. This content highlights the potential use of SPH for protein
supplements intended for human nutrition (102). The low fat content of SPH is because the
removal in the centrifugation step. As established by the Protein Advisory Groups of FAO,
the lipid content of a SPH suitable for human consumption should not exceed 0.5% dw
(194). The relatively high ash content of SPH may be due the added acid or base used for
pH adjustment during hydrolysis (102). SPH contains free amino acids and short chain
peptides. Its amino acid composition explains the nutritional value and the biological
activities exhibited by SPH and may depend on several factors, namely, raw material,
enzyme source and hydrolysis conditions.

112
Table 6.1. Degree of hydrolysis (DH %) and proximate composition (% dw) obtained for various SPH
Reference (20) (15) (222) (222) (222) (215) (223) (213) (213) (224)
Material Head and viscera
Head and viscera
Muscle Muscle Muscle Whole fish Muscle Muscle Muscle Muscle
Enzyme Alcalase Viscera proteasesa
Bacillus Pumilus A1b
Bacillus mojavensis A21b
Viscera proteasesa
Subtilisin + Trypsin
Bacillus subtilis A26b
Alcalase Trypsin Subtilisin
DH (%) 10.2 8.0 14.0 7.5 8.5 13.7 nr 5 5 3-6
Protein (% dw) 73.1 73.0 79.1 78.2 74.4 66.4 74.3 85.8 86.6 83.9-87.0
Fat (% dw) 10.2 7.3 1.4 0.9 1.0 19.7 0.6 0.3 0.5 1.3-2.0
Moisture (% dw) 4.6 nr 11.6 10.5 14.6 nr 14.7 3.0 5.3 2.5-3.7
Ash (% dw) 12.1 12.6 11.7 10.0 10.8 nr 10.2 12.7 10.9 13.6-16.5
a crude enzyme preparation from sardine viscera b crude enzyme preparation nr, not reported
PART II. Chapter 6 Literature review
Development of sardine protein hydrolysates and their health promoting ability
113
6.6. Bioactivities of SPH and derived peptides
SPH and derived bioactive peptides have been receiving special attention due to their
beneficial effects in the treatment of hypertension, particularly, due to its ACE-I and
antioxidant activities. Tables 6.2. and 6.3. summarize the recent research related with these
biological properties; some of these studies further fractionated the SPH in order to isolate
and identify individual active peptides. Other biological activities reported for SPH include
immunomodulating, anti-inflammatory, hypocholesterolemic and anticancer (101), (135),
(225-228).
6.7. Techno-functional properties of SPH
Techno-functional properties are the physicochemical properties of proteins in food
applications during processing, storage and consumption (20), (218). Enzymatic hydrolysis
of sardine proteins modifies the techno-functional characteristics of the native proteins,
generating a mixture of free amino acids, di-, tri- and oligopeptides with lower molecular
mass and increased exposure of hydrophobic groups and number of ionic groups (20),
(194). The control of the enzymatic reaction is very important as prolonged hydrolysis of
sardine proteins may result in the formation of highly soluble peptides, with complete
absence of the techno-functional properties of the native proteins. Extensive hydrolysis may
also promote the formation of undesirable bitter peptides (194). SPH had been reported to
possess good solubility over a wide range of pH levels, usually tolerate strong heat without
precipitating and contribute to water holding, texture and emulsifying properties when added
to food product (218). Table 6.4. summarizes the main techno-functional properties
exhibited by SPH, including solubility, emulsifying, foaming, water binding capacity and oil
binding capacity.
6.7.1. Solubility
Solubility is a good indicator of the SPH functionality and affects many of the other
techno-functional properties, such as, emulsifying and foaming capacities. The enhanced
solubility of the SPH over a wide pH range is due to their smaller molecular size compared
with the intact protein and to the new exposed ionizable amino and carboxyl groups of the
amino acids (194). Although high DH may lead to high solubility, extensive hydrolysis can
promote negative effects on the other techno-functional properties. Usually, to maintain or
improve functionality, low DH are required (194).

114
Solubility is generally measured by employing the nitrogen solubility index (NSI),
which is determined by suspending the sample in water, stirring and centrifuge the mixture.
The supernatant is then analyzed for nitrogen content and the NSI is calculated as the
percentage of the soluble nitrogen to the total nitrogen in the sample (194).
6.7.2. Emulsifying properties
The emulsifying properties of SPH are directly associated to surface properties; that
is the efficiency of the SPH to reduce the interfacial tension between the hydrophobic and
hydrophilic components in food products (194), (218). SPH are able to promote oil-in-water
emulsions because they possess hydrophilic and hydrophobic functional groups and are
water soluble. Emulsifying properties are affected by solubility, molecular size and amino
acid sequence of peptides, DH%, acetylation of the peptide and type(/s) of enzyme(/s) used
(218), (223). Emulsifying properties decreases with extensive hydrolysis (higher DH%,
lower molecular size proteins) due to the weak interfacial films around emulsion droplets
and increased with the high content of larger molecular weight peptides (or more
hydrophobic peptides). Generally, peptides presenting a minimum of ~20 residues are
required to promote good emulsifying properties (194), (218).
The ability of protein hydrolysates to form and stabilize emulsions are generally
measured by two methods: Emulsifying activity index (EAI) and Emulsifying stability index
(ESI). EAI is defined as the volume of oil that can be emulsified by the protein, while ESI
refers to the ability of an emulsion to resist changes in its properties over time. Measurement
involves blending the protein with oil and water, centrifuging, and measuring the total
volume of emulsion (194).
6.7.3. Foaming properties
The foaming properties of a protein hydrolysate are affected by transportation,
penetration and rearrangement of molecules at the air-water interface (218). The foaming
properties of SPH are also affected by DH%; several studies reported the decrease of
foaming properties with the increase of DH% (20), (218).
Several methods are used to measure the foaming properties of a protein hydrolysate;
results are usually expressed as Foam Expansion (FE) and Foam Stability (FS). FE is the
percentage of excess volume produced by whipping the protein solution compared with the
PART II. Chapter 6 Literature review
Development of sardine protein hydrolysates and their health promoting ability
115
initial volume of the liquid; FS is usually measured by whipping the protein solution and
measuring the time required to decrease half of the volume (194).
6.7.4. Water binding capacity
Water binding capacity (WBC) refers to the ability of the protein to imbibe water and
retain it against gravitational force within a protein matrix. This property is very important for
the food industry because improves texture to a food system (194). During SPH production,
enzymatic hydrolysis increase the polar groups, such as, COOH and NH2, which affects the
amount of adsorbed water (233). Therefore, extensive enzymatic hydrolysis (higher DH%,
low molecular weight peptides) appear to affect greater WBC because smaller peptide
fragments are more hydrophilic (218).
6.7.5. Oil binding capacity
Extensive enzymatic hydrolysis (higher DH%, low molecular weight peptides)
decrease the Oil binding capacity (OBC) of SPH (218). The ability of peptides to bind fat
influences food product taste, which is especially important in both meat and confectionery
industries (233). For OBC measurements, protein solutions are mixed with a specified
amount of fat for a particular time and then centrifuged at a low centrifugal force (194).
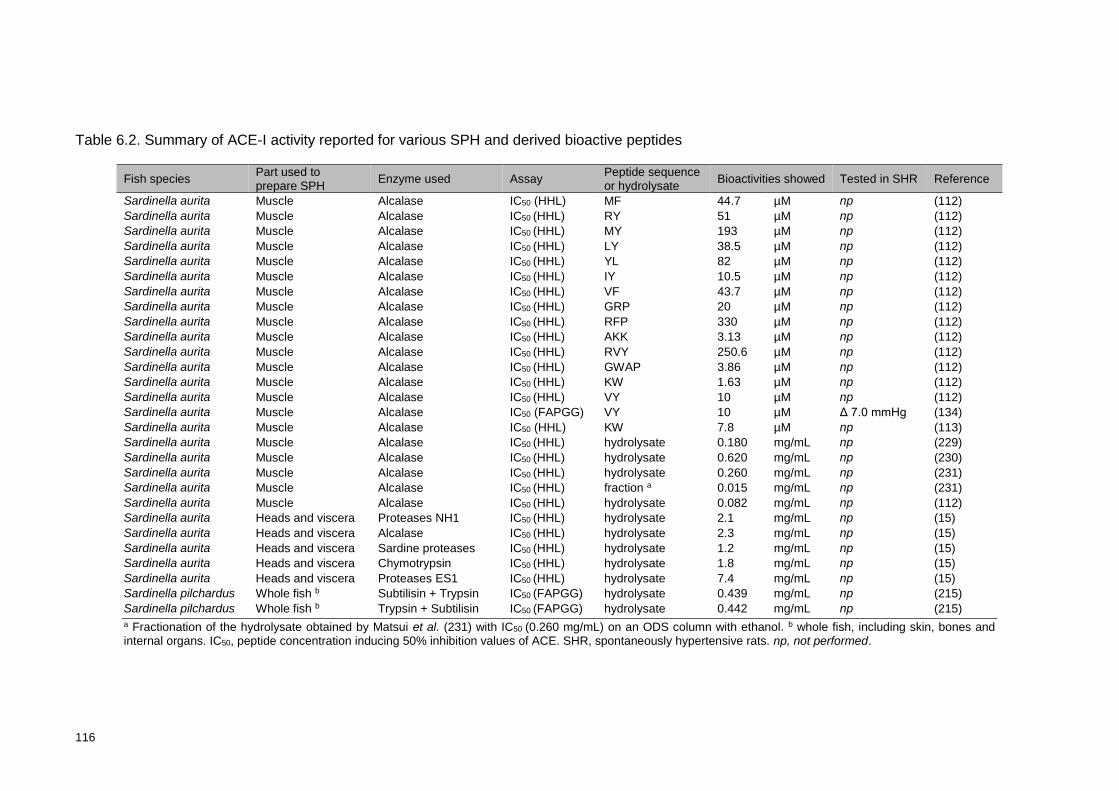
116
Table 6.2. Summary of ACE-I activity reported for various SPH and derived bioactive peptides
Fish species
Part used to prepare SPH
Enzyme used Assay Peptide sequence or hydrolysate
Bioactivities showed Tested in SHR Reference
Sardinella aurita Muscle Alcalase IC50 (HHL) MF 44.7 µM np (112)
Sardinella aurita Muscle Alcalase IC50 (HHL) RY 51 µM np (112)
Sardinella aurita Muscle Alcalase IC50 (HHL) MY 193 µM np (112)
Sardinella aurita Muscle Alcalase IC50 (HHL) LY 38.5 µM np (112)
Sardinella aurita Muscle Alcalase IC50 (HHL) YL 82 µM np (112)
Sardinella aurita Muscle Alcalase IC50 (HHL) IY 10.5 µM np (112)
Sardinella aurita Muscle Alcalase IC50 (HHL) VF 43.7 µM np (112)
Sardinella aurita Muscle Alcalase IC50 (HHL) GRP 20 µM np (112)
Sardinella aurita Muscle Alcalase IC50 (HHL) RFP 330 µM np (112)
Sardinella aurita Muscle Alcalase IC50 (HHL) AKK 3.13 µM np (112)
Sardinella aurita Muscle Alcalase IC50 (HHL) RVY 250.6 µM np (112)
Sardinella aurita Muscle Alcalase IC50 (HHL) GWAP 3.86 µM np (112)
Sardinella aurita Muscle Alcalase IC50 (HHL) KW 1.63 µM np (112)
Sardinella aurita Muscle Alcalase IC50 (HHL) VY 10 µM np (112)
Sardinella aurita Muscle Alcalase IC50 (FAPGG) VY 10 µM Δ 7.0 mmHg (134)
Sardinella aurita Muscle Alcalase IC50 (HHL) KW 7.8 µM np (113)
Sardinella aurita Muscle Alcalase IC50 (HHL) hydrolysate 0.180 mg/mL np (229)
Sardinella aurita Muscle Alcalase IC50 (HHL) hydrolysate 0.620 mg/mL np (230)
Sardinella aurita Muscle Alcalase IC50 (HHL) hydrolysate 0.260 mg/mL np (231)
Sardinella aurita Muscle Alcalase IC50 (HHL) fraction a 0.015 mg/mL np (231)
Sardinella aurita Muscle Alcalase IC50 (HHL) hydrolysate 0.082 mg/mL np (112)
Sardinella aurita Heads and viscera Proteases NH1 IC50 (HHL) hydrolysate 2.1 mg/mL np (15)
Sardinella aurita Heads and viscera Alcalase IC50 (HHL) hydrolysate 2.3 mg/mL np (15)
Sardinella aurita Heads and viscera Sardine proteases IC50 (HHL) hydrolysate 1.2 mg/mL np (15)
Sardinella aurita Heads and viscera Chymotrypsin IC50 (HHL) hydrolysate 1.8 mg/mL np (15)
Sardinella aurita Heads and viscera Proteases ES1 IC50 (HHL) hydrolysate 7.4 mg/mL np (15)
Sardinella pilchardus Whole fish b Subtilisin + Trypsin IC50 (FAPGG) hydrolysate 0.439 mg/mL np (215)
Sardinella pilchardus Whole fish b Trypsin + Subtilisin IC50 (FAPGG) hydrolysate 0.442 mg/mL np (215)
a Fractionation of the hydrolysate obtained by Matsui et al. (231) with IC50 (0.260 mg/mL) on an ODS column with ethanol. b whole fish, including skin, bones and internal organs. IC50, peptide concentration inducing 50% inhibition values of ACE. SHR, spontaneously hypertensive rats. np, not performed.

PART II. Chapter 6 Literature review
Development of sardine protein hydrolysates and their health promoting ability
117
Table 6.3. Summary of antioxidant activity reported for various SPH and derived bioactive peptides
Fish species Part used to prepare SPH
Enzyme used Peptide sequence or hydrolysate
Bioactivities showed Reference
Sardinella aurita Heads and viscera Alcalase hydrolysate DPPH (nr) 41% (20)
Sardinella aurita Heads and viscera Alcalase hydrolysate DPPH (0.3 mg/mL) RP (0.6 mg/mL) β-carotene
55% 0.87 39%
(209)
Sardinella aurita Heads and viscera Sardine proteases hydrolysate DPPH (0.3 mg/mL) RP (0.6 mg/mL) β-carotene
41% 0.54 38%
(209)
Sardinella pilchardus Whole fish a Subtilisin+Trypsin hydrolysate DPPH (EC50, mg/mL) RP (5 mg/mL ICA (EC50, mg/mL)
1.75 0.22 0.32
(215)
Sardinella aurita Heads and viscera Proteases NH1 hydrolysate DPPH (2 mg/mL) RP (2 mg/mL) LPIC (2 mg/mL)
26% 1.98 28%
(16)
Sardinella aurita Heads and viscera Alcalase hydrolysate DPPH (2 mg/mL) RP (2 mg/mL) LPIC (2 mg/mL)
54% 2.24 34%
(16)
Sardinella aurita Heads and viscera Sardine proteases hydrolysate DPPH (2 mg/mL) RP (2 mg/mL) LPIC (2 mg/mL)
27% 1.40 54%
(16)
Sardinella aurita Heads and viscera Proteases ES1 hydrolysate DPPH (2 mg/mL) RP (2 mg/mL) LPIC (2 mg/mL)
11% 1.75 15%
(16)
Sardinella aurita Muscle Pepsin LQPGQGQQ O2-, .OH, ESR nr (232)
a whole fish, including skin, bones and internal organs. (DPPH) 2,2-diphenyl-1- picrylhydrazyl; (RP) Reducing power; (LPIC) Lipid peroxidation inhibition capacity; (β-carotene) β-carotene bleaching method; (ICA) Iron (Fe2+) chelating activity; Electron Spin Resonance (ESR). nr, not reported.

118
Table 6.3. Summary of antioxidant activity reported for various SPH and derived bioactive peptides (continued)
Fish species Part used to prepare SPH
Enzyme used Peptide sequence or hydrolysate
Bioactivities showed Reference
Sardinella aurita Heads and viscera Sardine proteases LARL DPPH 51% (16)
Sardinella aurita Heads and viscera Sardine proteases GGQ DPPH 38% (16)
Sardinella aurita Heads and viscera Sardine proteases LHY DPPH 63% (16)
Sardinella aurita Heads and viscera Sardine proteases GAH DPPH nr (16)
Sardinella aurita Heads and viscera Sardine proteases GAWA DPPH 52% (16)
Sardinella aurita Heads and viscera Sardine proteases PHYL DPPH nr (16)
Sardinella aurita Heads and viscera Sardine proteases GALAAH DPPH 54% (16)
(DPPH) 2,2-diphenyl-1- picrylhydrazyl nr, not reported.

PART II. Chapter 6 Literature review
Development of sardine protein hydrolysates and their health promoting ability
119
Table 6.4. Summary of techno-functional properties reported for various SPH
Fish species Part used Enzyme used DH (%) Techno-functional properties Reference
Sardinella aurita Heads and viscera
Alcalase FPH1 (6.6%) FPH2 (9.3%) FPH3 (10.2%)
- Solubility (pH range 3-10): 55% - 100%, higher for FPH2 at pH 6 - Foaming (0.01%): higher for FPH1 and lower for FPH3 - Emulsifying: higher for FPH1 and lower for FPH3 - OBC (0.05%): higher for FPH2 and lower for FPH1
(20)
Sardinella aurita Muscle Bacillus subtilis A26 a
nr
- Solubility (pH range 1-10): higher than 70% - EAI, m2/g (0.5%, 1% and 2% w/v):47.6, 23.4, 8.2 - ESI, min (0.5%, 1% and 2% w/v, after 10 min): 47.8, 37.0, 6.3 - FE, % (0.5%, 1% and 2% w/v): 36.4, 50.4, 76.6 - FS, % (0.5%, 1% and 2% w/v, after 30 min): 23.5, 26.6, 47.0 - WBC, g/g (0.1% w/v): 7.5 - OBC, g/g (0.1% w/v): 6.0
(223)
Sardinella aurita Muscle
Bacillus pumilus A1 a
14%
- Solubility (pH range 2-12): 65%-95% - EAI, m2/g (0.1%, 0.5%, 1% and 2% w/v): 76.1, 20.1, 7.3, 5.1 - ESI, min (0.1%, 0.5%, 1% and 2% w/v, after 10 min): 30.0, 28.0, 17.0, 8.2 - FE, % (0.1% w/v): 80.1 - FS, % (0.1% w/v, after 15, 30 and 45 min): 78.2, 68.9, 55.2
(222)
Bacillus mojavensis
A21 a
7.5%
- Solubility (pH range 2-12): 65%-85% - EAI, m2/g (0.1%, 0.5%, 1% and 2% w/v): 81.6, 11.8, 9.9, 9.2 - ESI, min (0.1%, 0.5%, 1% and 2% w/v, after 10 min): 44.4, 40.2, 24.0, 11.4 - FE, % (0.1% w/v): 85.1 - FS, % (0.1% w/v, after 15, 30 and 45 min): 80.2, 62.1, 40.3
Viscera proteases b
8.5%
- Solubility (pH range 2-12): 65%-85% - EAI, m2/g (0.1%, 0.5%, 1% and 2% w/v): 86.6, 7.9, 11.1, 17.8 - ESI, min (0.1%, 0.5%, 1% and 2% w/v, after 10 min): 37.7, 24.0, 16.0, 15.1 - FE, % (0.1% w/v): 71.1 - FS, % (0.1% w/v, after 15, 30 and 45 min): 68.1, 59.0, 51.2
(EAI) Emulsifying activity index; (ESI) Emulsifying stability index; (FE) Foam expansion; (FS) Foam stability; (OBC) Oil binding capacity; (WBC) Water binding capacity. a crude enzyme preparation. b crude enzyme preparation from sardine viscera.

120

121
CHAPTER 7
Antioxidant and antihypertensive hydrolysates
obtained from by-products of brewing and cannery
sardine industry
_____________________
This chapter presents the hydrolysis optimization of the sardine
sarcoplasmic proteins by BSY proteases to produce a SPH with
antioxidant and ACE-I activities.

122
PART II. Chapter 7 Antioxidant and antihypertensive hydrolysates obtained from by-products of brewing and cannery sardine industry
123
ABSTRACT
Hydrolysates with antioxidant and ACE-I activities were obtained from sarcoplasmic
proteins of canned sardine by-product and proteases extracted from Brewer’s spent yeast.
Using Response surface methodology (RSM), hydrolysis time and temperature were
selected to achieve the maximum bioactivity. Hydrolysates produced using the E/S ratio
0.27:1 (U/mg), 7 h and 50ºC have shown potential use for food industry, presenting an ACE-
I activity of 164 µg protein/mL and an antioxidant activity of 291 μM TE/mL. Experimental
results agreed with predicted values within a 95% confidence interval. Within this work the
simultaneous valorisation of two agro-industrial by-products was successfully achieved.
7.1. INTRODUCTION
Sardine (Sardina pilchardus) is the main species caught off the Portuguese cost. The
vast majority of it is used in the canned sardine industry. Its by-products include head, tail,
viscera and muscle around the head. Although this waste is an excellent source of proteins,
it is usually processed into low market-value products, namely, fish meal and fertilizers.
Therefore, improving the value of this underutilized by-product is of major interest (13). One
potential application is the production of Sardine protein hydrolysates (SPH) with improved
physicochemical, techno-functional and sensorial properties when compared with the intact
proteins (20), (196). Additionally, similar to found for peptides derived from other marine
sources (234), (235), SPH may contain bioactive peptides with a broad spectrum of
pharmaceutical, cosmetic and food industry applications (87). The biological properties of
SPH bioactive peptides, and their use as antioxidant, antihypertensive, antithrombotic,
immunomodulatory, antimicrobial agents are now a major field of study, as reviewed
recently by several authors (13), (87). To date, SPH have been produced by (i) in vitro
enzymatic hydrolysis (Alcalase (20), (209), Protamex (211), Flavourzyme (211)); (ii)
autolytic process using endogenous enzymes (crude enzyme extract from sardine viscera)
(15), (16), (209); (iii) microbial fermentation (crude enzyme preparation from Bacillus
licheniformis NH1 (15), (16), Aspergillus clavatus ES1 (16), Bacillus pumilus A1 (222),
Bacillus mojavensis A21) (222) and (iv) simulated gastric digestion (pepsin (17), trypsin
(213), chymotrypsin (15), trypsin from skipjack tuna (Katsuwonus pelamis) spleen (199),
hepatopancreas of cuttlefish (Sepia officinalis)) (209). Enzymatic hydrolysis is the most
widely used method, although the high cost of enzymes can make this an expensive
process. Additionally, optimization of variables, namely the type of protease, pH,
temperature, time and E/S ratio are required to influence the extent of hydrolysis and, the
124
functionalities of the final SPH (236). RSM has been successfully used to investigate the
effect of these independent variables, alone and in combination, on enzymatic processes
(236).
BSY (Saccharomyces pastorianus) is the second major by-product from brewing
process and is usually used as a feed supplement after heat inactivation (5). However,
before thermal inactivation it can be an excellent source of proteases, which can be used
to obtain protein hydrolysates with optimum activity at pH 6 (11).
In this work, sarcoplasmic sardine proteins extracted from canned sardine by-product
were used as substrate to obtain SPH. These proteins are soluble in water, present an
isoelectric point around 5.0-5.5 and have low molecular weight (40-70 kDa) (207, 237).
Protein hydrolysis was performed using proteases extracted from BSY. The optimum time
and temperature conditions required to produce SPH with both antioxidant and ACE-I
activities were studied. Hydrolysis was monitored by chromatography and electrophoresis.
No previous studies were found describing the use of proteases extracted from BSY for
SPH production. Furthermore, as far as the authors are aware, this is the first work where
RSM methodology is used to optimize the best hydrolysis conditions to obtain in tandem
two biological properties in SPH, antioxidant and ACE-I activities. This work contributes to
obtain added-value for two industrial by-products.
7.2. MATERIAL AND METHODS
7.2.1. Standards and reagents
Acetonitrile HPLC grade, trifluoroacetic acid (TFA); Folin-Ciocalteu phenol reagent; 2,4,6-
trinitrobenzenesulfonic acid (TNBS); L-leucine; iron (III) chloride hexahydrate; potassium
ferrcyanide; 2,4,6-tripyridyl-s-triazine (TPTZ); commercial angiotensin-I-converting enzyme
(ACE) (EC 3.4.15.1, 5.1 U/mg); molecular weight standards from 14 to 97 kDa for SDS-
PAGE separations; bovine serum albumin (BSA) and 6-hydroxy-2,5,7,8-
tetramethylchroman-2-carboxylic acid (Trolox) were obtained from Sigma-Aldrich (St. Louis,
MO, USA). The o-aminobenzoylglycyl-p-nitro-phenylalanylproline (o-ABz-Gly-Phe(NO2)-
Pro) was purchased from Bachem Feinchemikalien (Bubendorf, Switzerland) and the
Millipore UF membranes with MWCO of 10 kDa were purchased from Sigma-Aldrich (St.
Louis, MO, USA).
PART II. Chapter 7 Antioxidant and antihypertensive hydrolysates obtained from by-products of brewing and cannery sardine industry
125
7.2.2. Equipment
The RP-HPLC analyses were carried out using an analytical HPLC system (Jasco, Tokyo,
Japan), equipped with a quaternary low pressure gradient HPLC pump (Jasco PU-1580), a
degasification unit (Jasco DG-1580-53 3-line degasser), an autosampler (Jasco AS-2057-
PLUS), a MD-910 multiwavelengh detector (Jasco) and a 7125 Rheodyne injector valve
(California, USA). Data acquisition was accomplished using Borwin Controller software,
version 1.50 (JMBS Developments, Le Fontanil, France). The SDS-PAGE separations were
achieved in a Multiple Gel Casters Hoefer® (Holliston, MA), Rect., Mightly Small For 8 x 9
cm Gels Hoefer® apparatus, coupled with a UniEquip Unipack 2000 electric source
(UniEquip, Munich, Germany). Spectrophotometric analyses were carried out using a BMG
LABTECH´s SPECTROstar Nano-microplate, cuvette UV/Vis absorbance reader
(Offenburg, Germany). Fluorimetric analyses were carried out using a fluorescence
microplate reader (FLUOstar Optima, BMG Labtech GmbH). Samples were freeze-dried
with a Telstar freeze dryer, Cryodos-80 model (Terrassa, Spain).
7.2.3. By-products
Flesh sardine by-product including head, scale, skin, blood, bone, viscera and muscle tissue
was provided by the portuguese company Conservas Ramirez & Cia (Filhos), SA
(Matosinhos, Portugal). Approximately 1 kg of this by-product was placed on ice during the
transportation to the laboratory and prepared in the same day under refrigerated conditions.
BSY (Saccharomyces pastorianus) was supplied as slurry by Unicer brewing (Leça do balio,
Portugal). This by-product was collected in transparent glass bottles, transported to the
laboratory under refrigerated conditions and stored at 4ºC until preparation procedure (1
day maximum).
7.2.4. Preparation of the Sardine Sarcoplasmic Protein extracts (SPE)
The whole muscle (ordinary and dark) removed manually from sardine by-product was used
for extraction of sarcoplasmic proteins, according to the method of Ren et al. (237), with
slight modifications. The sardine muscle tissue was washed twice with deionized water and
mixed with 0.2 M phosphate buffer pH 6.0, ratio of 1:3 (w/v). The mixture was homogenized
using an Ultra-Turrex grinder for about 2 min. Then, the homogenate was heated at 85ºC
for 20 min to inactivate endogenous enzymes and subsequently centrifuged at 16,000 x g
for 20 min, at 4°C. The upper lipid phase was removed manually and discarded; the
supernatant was collected and filtered through a Whatman No. 4 filter paper. The final clear
supernatant was coded as sardine sarcoplasmic protein extract (SPE). The pH of this
extract (pH 6.3) was adjusted to pH 6.0 by adding 0.2 M HCl with constant agitation. The

126
protein concentration of SPE, determined by Lowry method (163), was 2.40 mg/mL. This
extract was keep at -20ºC until used; the storage time was not more than 1 month.
7.2.5. Extraction of Brewer´s spent yeast (BSY) proteases
Saccharomyces cell wall was destroyed under refrigerated conditions to minimize enzyme
denaturation and obtain a protease rich extract. Firstly, biomass was washed three times
with 0.2 M phosphate buffer pH 6.0 at a ratio 1:3 (w/v) and centrifuged at 5,000 x g, 5 min,
4ºC, between each wash. Afterwards, cell wall was destroyed with glass beads at a ratio
1:1:1 (biomass: phosphate buffer pH 6.0: glass beads) (w/v/w) by vortexing 10 times (1 min
each) with 1 min cooling intervals on ice. Glass beads were removed and the homogenate
was centrifuged at 12,000 x g, 40 min, 4ºC. The resulting clear supernatant was freeze-
dried, resuspended in the same buffer (25% of the initial volume) and concentrated using a
UF membrane with a MWCO of 10 kDa. The protease activity of BSY extract, performed
according to Cupp-Enyard (164) protocol, was 0.725 U/mL. The BSY proteases extract was
keep at -20ºC until used.
7.2.6. Enzymatic hydrolysis
SPE (containing 2.40 mg protein/mL) was hydrolysed by BSY proteases (0.725 U/mL) using
an E/S ratio of 0.27:1 (U/mg) and pH 6.0. For example, considering a reaction volume of 1
mL, for each 500 µL of SPE (substrate), 450 µL of BSY proteases were added; the
remaining volume of 50 µL was 0.2 M sodium phosphate buffer, pH 6.0. Triplicate hydrolysis
were performed, using 2 mL eppendorf tubes, in a shaking incubator with constant agitation
(200 rpm) at different temperatures and times, according to the experimental model
described in sub-section 7.2.15. Control [S+E] was the mixture of SPE and BSY proteases
before hydrolysis. Inactivation of proteases to stop reaction was performed by heating at
95ºC for 15 min (216). The hydrolysates were cooled on ice and centrifuged at 3,000 x g at
4ºC for 10 min. The clear supernatants, containing soluble peptides and coded as H1 to
H13 were collected and stored at -20ºC for further analysis.
7.2.7. Hydrolysis Rate (HR%)
RP-HPLC, using the chromatographic conditions described by Ferreira et al. (185) was
used to follow protein degradation during hydrolysis. The column was a Chrompack P 300
RP (polystyrenedivinylbenzene copolymer, 8 µm, 300Å, 150 x 4.6 mm i.d.) (Middleburg,
The Netherlands). Hydrolysis rate (HR%) was based on the measurement of protein fraction
that remains intact, for this purpose the peak area of the protein fraction that eluted between
24 and 33 min was measured. The peak area of [S+E] protein fraction before hydrolysis
was the maximum intact protein.

PART II. Chapter 7 Antioxidant and antihypertensive hydrolysates obtained from by-products of brewing and cannery sardine industry
127
The following equation was applied:
HR (%) = 100 − [(peak area of protein fraction after hydrolysis
peak area of protein fraction before hydrolysis) × 100] (1)
7.2.8. Protein Recovery (PR%) and % of peptides formed
Protein recovery (PR %) was calculated as the amount of protein, determined by Bradford
method (171), in the hydrolysate in comparison with the initial amount of protein, using the
following equation:
PR (%) = 100 − [(protein content after hydrolysis
protein content before hydrolysis) × 100] (2)
Additionally, the % of peptides formed in the hydrolysates was measured by subtracting the
protein content evaluated by Bradford method to the total protein including peptides
evaluated by Lowry method (163), using the following equation:
% Peptides = [(Lowry−Bradford)
Lowry] × 100 (3)
For both assays, a calibration curve was performed with 2 mg/mL BSA and samples were
analysed in triplicate.
7.2.9. Degree of Hydrolysis (DH%)
Degree of Hydrolysis (DH%) was determined by measuring the increase in free amino
groups using a picrylsulfonic acid solution (TNBS), according to Hsu et al. (238); α-amino
acid group was expressed in terms of L-leucine and the DH% was determined as follows:
DH (%) = [(Lt − L0) (Lmax − L0)⁄ ] × 100 (4)
where (Lt) was the amount of amino acid released at time (t); (L0) was the amount of amino
acid in original SPE, and (Lmax) was the maximum amount of amino acid in SPE obtained
after acid hydrolysis. For (Lmax) determination, SPE (500 µL) was mixed with 4.5 mL of 6 M
HCl and the hydrolysis was run at 100°C for 24 h. Then, final acid-hydrolysed sample was
filtered through Whatman paper no. 1 to remove the non-hydrolysed fragments and the
supernatant was neutralized with 6 M NaOH before amino acid determination.
7.2.10. Ferric reducing ability (FRAP)
The measurement of FRAP was performed based on Jansen and Ruskovska (154)
procedure, slightly modified. Briefly, 25 μL of sample/ standard/ control (pure water) and
200 µL of working FRAP reagent were pipetted in the microplate in six replicates. After that,
the reaction mixture was incubated for 90 min at 37 °C, under constant agitation (200 rpm).
The absorbance was measured at 600 nm. Trolox was used as a standard at 50-500 μM to
generate a calibration curve (average R2 = 0.9929). Results were expressed as mean
values ± standard deviations, as µM TE (Trolox Equivalent)/mL SPH.
128
7.2.11. Reducing Power method (RP)
RP was measured according to the assay reported by Almeida et al. (156), slightly modified.
Briefly, 250 µL of samples/ control (pure water) were mixed with 250 µL of sodium
phosphate buffer (200 mM, pH 6.6) and 250 µL of potassium ferricyanide 1% (w/v). The
mixture was incubated at 50ºC for 20 min, and 250 µL of cold TCA 10% (w/v) was added to
stop the reaction. Eppendorfs were centrifuged at 650 rpm, 10 min. Then, 500 µL of
supernatant was incubated with 500 µL of deionized water and 100 µL of ferric chloride
0.1% (w/v). After 10 min reaction, the absorbance was measured at 700 nm. RP values
were expressed as µg/mL.
7.2.12. ACE-I activity
ACE-I activity was measured using the fluorimetric assay of Sentandreu and Toldrá (121)
with the modifications reported by Quiros et al. (122). ACE-I percentage (I %) was calculated
using the equation:
I % = (B − A)|(B − C) × 100 (5)
where B is the fluorescence of the ACE solution without the inhibitor (SPH); A is the
fluorescence of the tested sample of SPH; and C is the fluorescence of experimental blank,
o-ABz-Gly-Phe(NO2)-Pro dissolved in 150 mM Tris-base buffer (pH 8.3), containing 1.125
M NaCl. The percent inhibition curves (using a minimum of five determinations for each
sample peptide concentration) were plotted versus peptide concentration to estimate the
mean IC50 value, which is defined as the concentration required to decrease the ACE activity
by 50% (122).
7.2.13. SDS-Polyacrylamide gel electrophoresis (SDS-PAGE)
Proteolytic degradation of SPE was monitored by SDS-PAGE analysis. Separation gels
consisted of a 4% polyacrylamide stacking gel and a 15% polyacrylamide resolving gel and
were performed according to Laemmli (162) protocol. The molecular weight protein
standards used were: phosphorylase β (97 kDa), bovine serum albumin (66 kDa),
ovalbumin (45 kDa), carbonic anhydrase (30 kDa), trypsin inhibitor (20 kDa) and lysozyme
(14 kDa). Coomassie brilliant blue R-250 was used. The protein pattern separated on SDS-
PAGE was estimated for its molecular weight by plotting the logarithm of molecular weight
of the protein standards against relative mobility (Mr).
7.2.14. SPH amino acid composition
SPH presenting highest FRAP and ACE-I activities was lyophilized and amino acid analysis
was performed after hydrolysis with 6 M HCl at 110ºC for 24 h. Derivatization and GC/MS
PART II. Chapter 7 Antioxidant and antihypertensive hydrolysates obtained from by-products of brewing and cannery sardine industry
129
were carried out according to Pérez-Palacios et al. (148). Amino acid composition was
expressed as g/ 100 g of protein.
7.2.15. Experimental design, modelling and optimization of hydrolysis conditions
A central composite design (CCD) was built for optimization of the best hydrolysis conditions
to obtain simultaneously in tandem two biological properties in SPH, antioxidant and ACE-
I activities. The CCD variables under analysis were time (X1) and temperature (X2) at
ranged levels of time intervals (0.40; 1.50; 4.25; 7.00 and 8.00 h) and five temperatures (20;
25; 38; 50 and 55ºC), in a total of 13 runs with five centre points. CCD consisted of a
complete 22-factorial design as cubic points, with four axial points at a distance of α = 1.414
from the design centre and five centre points. The responses used in the experimental
designs were the HR % (Y1), antioxidant activity evaluated by FRAP assay (Y2) and ACE-
I activity as IC50 (Y3). The optimal values of response Y were obtained by solving the
regression equation and by analysing the response surface and contour plots using the
predictive equations of RSM. Then, the accuracy of the models was tested by conducting a
set of experiments using the critical values optimized; the t test was conducted to compare
the responses prepared under optimized conditions with those predicted by models. The
statistical analyses were performed by using the software Design Expert trial version 7
(Stat-Ease Inc., Minneapolis, MN, USA).
7.2.16. Statistical analysis
The data obtained for others assays were done by using SPSS statistical software, version
22.0 (SPSS Inc., Chicago, IL). One-way analysis of variance and Duncans’ test was
performed to determine the significant differences at the 5% probability level. A Pearson’s
correlation was also used to search for correlations between the parameters under study;
1% level was considered to be significant. The t test was conducted to compare the
responses prepared under optimized conditions with those predicted by models.
7.3. RESULTS AND DISCUSSION
Preliminary experiments were conducted by univariate method to study the pH
variation during hydrolysis, as well as, the influence of E/S ratio (0.10:1; 0.15:1; 0.20:1;
0.25:1 and 0.30:1 U/mg) on hydrolysis of SPE. Reactions were performed at constant
temperature (37ºC), while stirring at 200 rpm for 4 h. When the initial pH was 6.0 it remained
in the range of 5.8 to 6.5 during the entire hydrolysis period. For this reason it was decided
not adjust pH during SPE hydrolysis. From an industrial point of view, hydrolysis carried out

130
without any pH adjustment is economically desirable (216). Regarding to E/S ratio, 0.10:1
U/mg and 0.15:1 U/mg gave a significantly lower HR%, whereas no significant differences
were found (p >0.05) on the HR% obtained from hydrolysis using 0.25:1 U/mg and 0.30:1
U/mg. As a result, the ratio 0.27:1 U/mg was chosen, as it is the same reported by Bougatef
et al. (16).
The RP-HPLC profiles of SPE plus BSY proteases [S+E] without hydrolysis, and two
different SPH, one presenting HR = 9.3% (25ºC, 1.50 h) and another presenting HR = 83%
(50ºC, 7.00 h), are shown in Figure 7.1. The RP-HPLC chromatograms were divided into
three fractions: “Less hydrophobic peptides” (eluted between 4 and 12 min); “Hydrophobic
Polypeptides” (eluted between 12.1 and 23.9 min) and “Proteins” (eluted between 24 and
33 min). HR% determination was based on the measurement of “Proteins” fraction before
and after hydrolysis.
Figure 7.1. The RP-HPLC profiles of (i) SPE plus BSY proteases [S+E] without hydrolysis;
(ii) SPH presenting HR = 9.3% (25ºC, 1.50 h); and (iii) SPH presenting HR = 83% (50ºC,
7.00 h). RP-HPLC chromatograms are divided into three fractions: “Less hydrophobic
peptides” (eluted between 4 and 12 min); “Hydrophobic Polypeptides” (eluted between 12.1
and 23.9 min) and “Proteins” (eluted between 24 and 33 min). Hydrolysis rate (HR%)
determination was based on the measurement of “Proteins” fraction before and after
hydrolysis.

PART II. Chapter 7 Antioxidant and antihypertensive hydrolysates obtained from by-products of brewing and cannery sardine industry
131
7.3.1. Optimization of hydrolysis conditions
Optimization of the variables affecting the antioxidant and ACE-I activities of SPH was
carried out using a statistical design, by CCD. The experiments were performed in a random
manner at different combinations of temperature (X1) and time (X2). The HR% (Y1), FRAP
(Y2) and ACE-I activity (Y3) of SPH obtained by BSY proteases were used as responses
factors for CCD (Table 7.1). Regression analyses were performed to fit the response
functions. The parameters of the equations (6, 7 and 8) were explained by a quadratic model
for each response and are presented as follows:
Y1 = −20.31 + 0.29. X1 + 4.70. X2 + 0.02. X12 (6)
Y2 = 279.35 − 2.50. X1 − 10.21. X2 + 0.41. X1. X2 + 0.03. X1^2 − 0.42. X2^2 (7)
Y3 = −78.38 + 12.51. X1 − 0.30. X1. X2 − 0.16. X1^2 − 4.48. X2^2 (8)
where Y is the predicted response; X1 the uncoded value of variable temperature (ºC) and
X2 the uncoded value of variable time (h). Adequacy and significance of the quadratic model
was evaluated by analysis of the variance (ANOVA) by means of Fisher´s F-test. The
quadratic models were validated by two diagnostic residuals, the squared correlation
coefficient (R2) and the predictive squared correlation coefficient (Q2). Values of R2 >0.75
and Q2 >0.60 indicate adequacy of models (172). The R2 for checking the fitness of model
was very good (relatively close to 1), indicating that models explained 98.6%, 98.4% and
95.3% of the variation on the HR, FRAP and ACE-I activity of sardine sarcoplasmic proteins,
respectively. The Q2 values were respectively 0.9738; 0.9516 and 0.9804 for the three
responses, indicating the goodness of the model. The‘‘Adeq Precision’’ was higher than 4
(as desirable) for the three responses, indicating an adequate signal-to-noise ratio. The
statistical analysis also showed that the ‘‘lack of fit’’ was not significant (p >0.05), which
confirmed the adequacy of model to describe the experimental data and for the prediction
of the three studied parameters. The independent variable X1 had a significant effect on
Y1, Y2 and Y3 (p <0.05); X2 had significant effect on Y1 and Y2 (p <0.05), but not on Y3.
The interactions between X1.X2 influenced Y2 and Y3 (p <0.05). Therefore, this model
proved to be powerful for navigating the design space and describes the dependence of
HR%, FRAP and ACE-I activity on temperature and time.
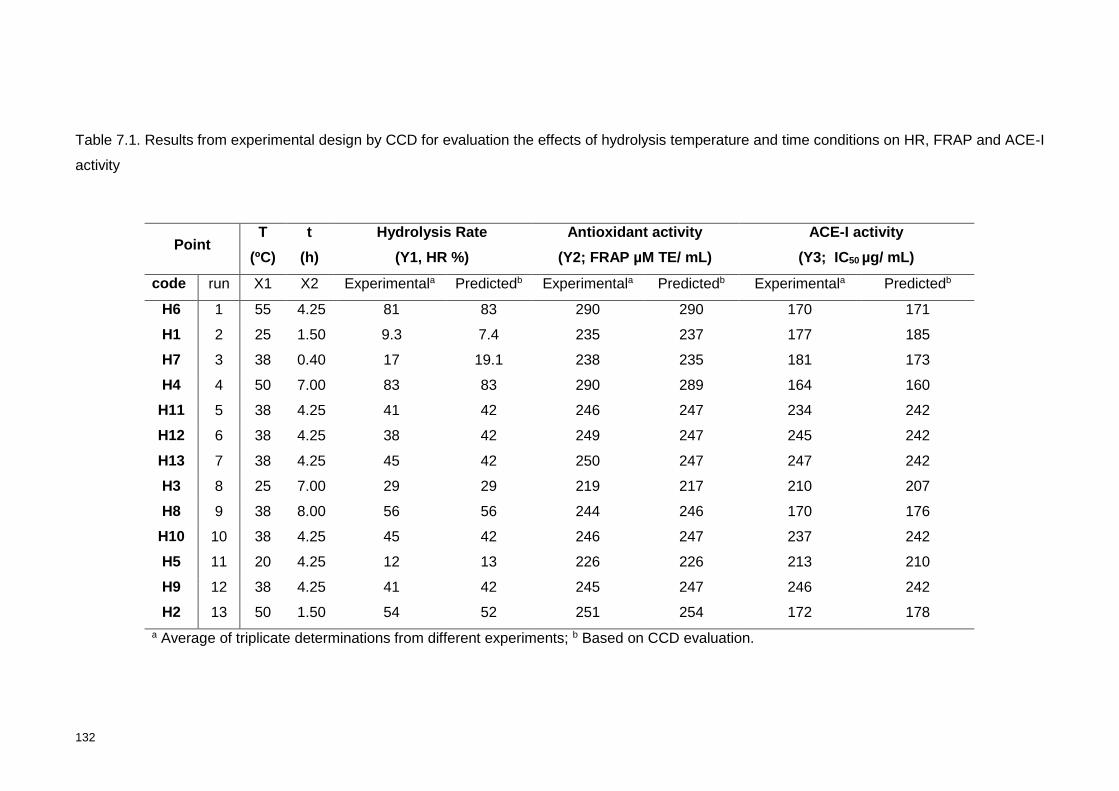
132
Table 7.1. Results from experimental design by CCD for evaluation the effects of hydrolysis temperature and time conditions on HR, FRAP and ACE-I
activity
Point T
(ºC)
t
(h)
Hydrolysis Rate
(Y1, HR %)
Antioxidant activity
(Y2; FRAP µM TE/ mL)
ACE-I activity
(Y3; IC50 µg/ mL)
code run X1 X2 Experimentala Predictedb Experimentala Predictedb Experimentala Predictedb
H6 1 55 4.25 81 83 290 290 170 171
H1 2 25 1.50 9.3 7.4 235 237 177 185
H7 3 38 0.40 17 19.1 238 235 181 173
H4 4 50 7.00 83 83 290 289 164 160
H11 5 38 4.25 41 42 246 247 234 242
H12 6 38 4.25 38 42 249 247 245 242
H13 7 38 4.25 45 42 250 247 247 242
H3 8 25 7.00 29 29 219 217 210 207
H8 9 38 8.00 56 56 244 246 170 176
H10 10 38 4.25 45 42 246 247 237 242
H5 11 20 4.25 12 13 226 226 213 210
H9 12 38 4.25 41 42 245 247 246 242
H2 13 50 1.50 54 52 251 254 172 178
a Average of triplicate determinations from different experiments; b Based on CCD evaluation.

PART II. Chapter 7 Antioxidant and antihypertensive hydrolysates obtained from by-products of brewing and cannery sardine industry
133
7.3.2. Analysis of response surfaces
Contour plots were employed to study the influence of temperature (ºC) and time (h)
on HR%, FRAP and ACE-I activity. HR% increased with the increasing of time and
temperature (Contour plot A, Figure 7.2). The minimum predicted value of HR% (7.4%) was
observed at 25ºC and 1.50 h, while the maximum predicted value of HR% (83%) was
observed at 50ºC and 7.00 h. Extensive time of hydrolysis and high temperatures also
enhanced the FRAP value of SPH (counter plot B of Figure 7.2). The minimum predicted
FRAP value was 217 µM TE/mL, observed at 25ºC and 7.00 h; whereas the maximum
predicted FRAP value was 289 µM TE/mL found at 50ºC and 7.00 h. Similar behaviour was
observed for HR% and FRAP, suggesting that the extension of proteolysis may be
favourable to enhance the antioxidant properties of SPH. Concerning to ACE-I activity, the
IC50 increased near to the centre point design and decreased for higher temperature and
extensive time of hydrolysis (counter plot C, Figure 7.2). Lower IC50 value (160 µg
protein/mL), which means higher ACE-I activity, was observed when hydrolysis was
performed at 50ºC and 7.00 h.
7.3.3. Validation of the RSM model
The optimal hydrolysis conditions to maximize the antioxidant and ACE-I activities of
SPH was predicted by using RSM. For that purpose, the optimization tool of the statistical
program was used, which explores the response surface and gave a point prediction as a
result of defined goals. The goals for each response were set to maximize the Y2 and Y3
responses to construct desirability indices. The optimal hydrolysis conditions to produce a
SPH with the highest antioxidant and ACE-I (minimum IC50) activities were temperature of
50ºC and hydrolysis time of 7.00 h. On these conditions, the predicted antioxidant activity
was 289 µM TE/mL and the IC50 was 160 µg protein/mL. The desirability analysis in
identifying the optimal conditions by the RSM was 99.2%. Results showed that there is no
statistically significant difference between the experimental and estimated values within a
95% confidence interval. Thereby, the adequacy of the models in predicting the optimum
hydrolysis conditions for SPH production using BSY proteases was confirmed.
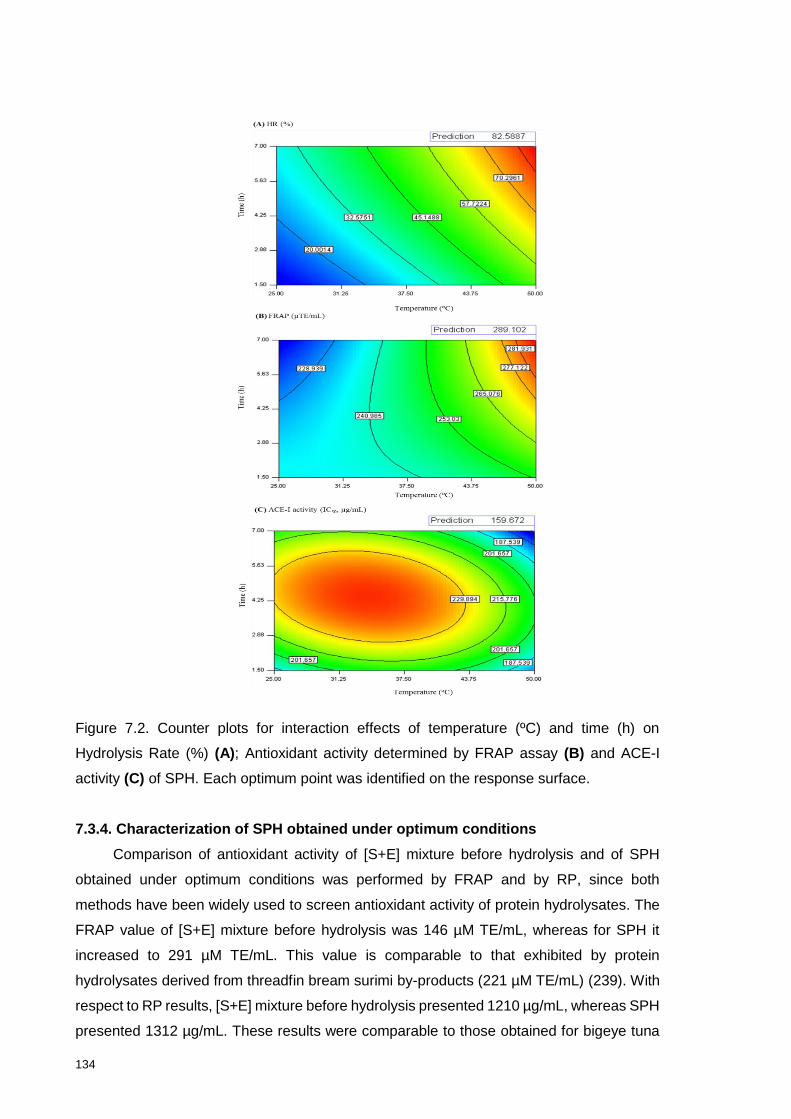
134
Figure 7.2. Counter plots for interaction effects of temperature (ºC) and time (h) on
Hydrolysis Rate (%) (A); Antioxidant activity determined by FRAP assay (B) and ACE-I
activity (C) of SPH. Each optimum point was identified on the response surface.
7.3.4. Characterization of SPH obtained under optimum conditions
Comparison of antioxidant activity of [S+E] mixture before hydrolysis and of SPH
obtained under optimum conditions was performed by FRAP and by RP, since both
methods have been widely used to screen antioxidant activity of protein hydrolysates. The
FRAP value of [S+E] mixture before hydrolysis was 146 µM TE/mL, whereas for SPH it
increased to 291 µM TE/mL. This value is comparable to that exhibited by protein
hydrolysates derived from threadfin bream surimi by-products (221 µM TE/mL) (239). With
respect to RP results, [S+E] mixture before hydrolysis presented 1210 µg/mL, whereas SPH
presented 1312 µg/mL. These results were comparable to those obtained for bigeye tuna

PART II. Chapter 7 Antioxidant and antihypertensive hydrolysates obtained from by-products of brewing and cannery sardine industry
135
protein hydrolysates, which ranged between 948 and 12500 µg/mL (240). The ACE-I activity
of [S+E] mixture before hydrolysis was IC50 604 µg protein/mL, whereas SPH presented an
IC50 of 164 µg protein/mL, which is comparable to the IC50 described in literature for other
fish protein hydrolysates. Matsui et al. (231) described an IC50 of 260 µg protein/mL for SPH
prepared using 0.3% Alcalase® at pH 9, 50ºC for 17 h and Cinq-Mars and Li-Cha (236)
reported a Pacific hake fillet hydrolysate with an IC50 of 165 µg protein/mL, by incubation
with 3.0% Protamex® at pH 6.5, 40ºC for 125 min. Electrophoresis was performed to
characterize the larger fragments resulting from proteolysis. SDS-PAGE of control sample
[S+E] showed bands in the range of 12 to 51 kDa (Figure 7.3).
Figure 7.3. SDS-PAGE profiles of sarcoplasmic proteins plus BSY proteases [S+E] without
hydrolysis and SPH. A total of 8 µL of sample was applied to each well.
Legend: Lane BSA shows bovine soro albumin (66 kDa); lane MW shows molecular weight
of standard markers (14-97 kDa); lane S (substract) shows SPE in the absence of the BSY
proteases; lane E (enzyme) shows BSY proteases in the absence of SPE; lane [S+E] shows
SPE and BSY proteases without hydrolysis (control). Lane H3 shows SPH with HR = 29%
(25ºC, 7.00 h); lane H4 shows SPH with HR = 83% (50ºC, 7.00 h); lane H11 shows SPH
with HR = 41 % (38ºC, 4.25 h).
These fractions are in agreement with the SDS-PAGE patterns of sardine
sarcoplasmic proteins described by other authors (241), (242). The most abundant bands
were 51 kDa, 47 KDa, 45 kDa (probably actin), 41-39 kDa a doublet band (probably from
creatine kinase and aldolase) and 39-41 kDa band probably from glyceraldehyde-3-
phosphate dehydrogenase. Additional bands were found at 17 and 15 kDa (242). The last

136
one could be from myoglobin, as observed by Chaijan et al. (196). Finally, two protein
bands, at 13 and 12 kDa could be parvalbumins (242). Some myofibrillar proteins (90 kDa
band) were also extracted during the SPE extract preparation. SDS-PAGE analysis
indicates that under prolonged time and increased temperature of hydrolysis, 50ºC, 7.00 h
(H4, Figure 7.3), sardine sarcoplasmic proteins were extensively hydrolysed. These results
are in good agreement with the results from assays that evaluate the extention of hydrolysis
or the peptides formation, since this SPH presented HR% of 83, DH% of 14, PR% of 86
and 63% of peptides formed.
Low-molecular-weight peptides are widely recognized as presenting higher
antioxidant and ACE-I activities, but the amino acid composition of peptides is also a crucial
aspect. ACE-I peptides usually contain a proline residue at the carboxyl terminal end,
whereas amino acids, such as, tyrosine, tryptophan, histidine, methionine and lysine have
been known to exhibit antioxidant activity (234). Amino acid analysis of SPH prepared under
the hydrolysis conditions optimized, revealed that it is rich in glutamic acid, glutamine,
aspartic acid an alanine, which accounted for 18.0%, 12.4%, 10.5% and 9.0% of the total
amino acids, respectively. It also presents relatively high content of hydrophobic amino
acids, such as, proline (3.1%), leucine (5.6%), glycine (4.2%), isoleucine (2.2%),
phenylalanine (3.2%) and valine (4.2%) and contained amino acids that exhibit antioxidant
activity, namely, tyrosine (2.0%), histidine (5.8%), methionine (2.2%) and lysine (2.6%);
tryptophan was not determined due to the acidic hydrolysis conditions.
7.4. CONCLUSIONS
Sardine sarcoplasmic proteins were hydrolysed by the proteases extracted from
brewer’s spent yeast to obtain hydrolysates with antioxidant and ACE-I activities.
Hydrolysates produced using the E/S ratio 0.27:1 U/mg, 7.00 h and 50ºC presented an
antioxidant activity of 291 μM TE/mL and an ACE-I activity (IC50) of 164 µg protein/mL.
These experimental FRAP and IC50 values agreed with the predicted values (289 μM TE/mL
and 160 µg protein/mL, respectively) within a 95% confidence interval, suggesting a good
fit between the models and the experimental data. Thus, RSM was an efficient statistical
tool in the optimization of hydrolysis conditions. SPH presents relatively high content of
hydrophobic amino acids, such as, proline, leucine, glycine, isoleucine, phenylalanine and
valine, and amino acids that exhibit antioxidant activity, namely, tyrosine, histidine,
methionine and lysine. Further work should be done to test antioxidant activity of this
hydrolysate in vivo, as well as, isolate and identify the specific peptides that are responsible
for these bioactive properties.
CHAPTER 8
Simulated gastrointestinal digestion and in vitro
intestinal permeability of bioactive protein hydrolysates
obtained from brewing and canned sardine industry by-
products
_____________________
This chapter describes the simulated GI digestion and the in vitro
intestinal cell permeability of the SPH with antioxidant and ACE-I
activities.

138

PART II. Chapter 8 Simulated gastrointestinal digestion and in vitro intestinal permeability of bioactive protein hydrolysates obtained from brewing and canned
sardine industry by-products
139
ABSTRACT
A sardine protein hydrolysate (SPH) was produced using sarcoplasmic proteins from
canned sardine by-product and proteases from brewer’s spent yeast (BSY), at an E/S ratio
of 0.27:1 U/mg, pH 6.0, 50°C for 7 h. The SPH presented in vitro ACE-I activity, IC50 169 μg
protein/mL and FRAP value of 288 µM TE/mL. Both activities were enhanced by UF through
a 10 kDa MWCO membrane. Simulated gastrointestinal (GI) digestion increased the FRAP
value, whereas the IC50 remained similar. The apparent permeability coefficient (180 min,
37ºC) of <10 kDa fraction across Caco-2 and Caco-2/HT29-MTX cell monolayers were
5.89x10⁻⁶ cm s-1 and 10.93×10⁻⁶ cm s-1, respectively. Permeates presented antioxidant
activity but no ACE-I activity was detected. Mass spectrometry revealed that molecules with
m/z between 1000 and 5000 were transported across Caco-2/HT29-MTX cell monolayer.
SPH prepared by BSY proteases is promising for the formulation of functional foods.
8.1. INTRODUCTION
Many food protein hydrolysates show in vitro antioxidant and/ or ACE-I activities.
However, the bioavailability of the bioactive peptides found in these protein hydrolysates
depends on several factors, such as, enzymatic degradation in GI tract, permeability
through intestinal epithelium and interaction with intracellular sources of oxidative stress
(181), (243-246). Simulated GI digestion and in vitro cell-based models allow for rapid and
inexpensive screening of potential bioactive compounds (181). Due to their similarity with
intestinal epithelium cells, the human colorectal adenocarcinoma Caco-2 cell line and
resulting cell monolayers have been widely accepted as in vitro models to predict the
cytotoxicity and intestinal absorption of drugs and bioactive compounds (127), (181), (246-
248). Different transport routes, namely paracellular, fluid phase and adsorptive transcytosis
may participate in peptide transport across Caco-2 cell monolayers (245). However, this
cell model has some limitations when compared with human small intestine, including the
absence of mucus-producing cells and the resulting mucus layer; higher tightness to
molecular diffusion; as well as, low expression of uptake transporters and overexpression
of P-glycoprotein (129), (249). To overcome some of these limitations, combinations of
Caco-2 cells with mucus-producing goblet cell, such as HT29-MTX cells, have been
proposed as co-culture models for permeation studies (130), (131). Co-culture of Caco-
2/HT29-MTX cells leads to the establishment of monolayers with intermediate properties
regarding transepithelial electrical resistance (TEER), peptide hydrolysis and absorption.
The proportion of 90:10, expressed as initial cell seeding for Caco-2/HT29-MTX cells, is the

140
most prevalent in the literature and accepted to better mimic the natural epithelial barrier
(129), (132), (133). The expression of goblet cells in HT29-MTX cell line increases
absorption of lipophilic compounds compared to Caco-2 monolayer (131), (133). Indeed,
some absorption enhancers have been recognized to be effective in increasing the intestinal
absorption of peptides and proteins (190), (250).
We have recently reported, for the first time, a SPH prepared by the action of BSY
proteases (251). Under optimum hydrolysis conditions (50ºC, pH 6.0, 7 h, E/S ration of
0.27:1 U/mg), the SPH revealed a FRAP value of 291 µM TE/mL and an ACE-I activity (IC50)
of 164 µg protein/mL. These properties suggest that SPH may be an interesting ingredient
for the formulation of functional foods, but further investigation, regarding its digestion and
intestinal permeability is required. To best of our knowledge, no studies on in vitro
permeability of SPH peptides produced by BSY proteases have been published. Therefore,
the present work aims to investigate: (i) the effects of UF membranes on the SPH biological
activities, (ii) the stability of SPH peptides to GI proteases in order to assess its adequacy
for oral administration, and (iii) the resistance of SPH peptides to brush-border peptidases
and its susceptibility to intestinal transport. For this last purpose, two cellular monolayer
models, comprising either a monoculture of Caco-2 cells or the co-culture (90/10) of Caco-
2/HT29-MTX cells, were compared. Both cells express different intestinal enzymes and
provide distinct functionality to the monolayers: Caco-2 cells (absorptive-type) partially
reproduce the characteristics of intestinal enterocytes, whereas HT29-MTX cells (goblet
type) are able to secrete mucin and thus replicate mucus-secreting goblet cells (130), (131).
8.2. MATERIAL AND METHODS
8.2.1. Materials and cells
Pepsin, pancreatin, commercial angiotensin-I-converting enzyme (ACE) (EC 3.4.15.1, 5.1
U/mg), captopril, 6-hydroxy-2,5,7,8-tetramethylchroman-2-carboxylic acid (Trolox),
trifluoroacetic acid (TFA), 3-(4,5-dimethylthiazol-2-yl)-2,5-diphenyltetrazolium bromide
(MTT) and dimethyl sulfoxide (DMSO) were purchased from Sigma-Aldrich (St. Louis, MO,
USA). The o-aminobenzoylglycyl-p-nitro-phenylalanylproline (o-ABz-Gly-Phe(NO2)-Pro)
was purchased from Bachem Feinchemikalien (Bubendorf, Switzerland). The Millipore UF
membranes with MWCO of 3 kDa and 10 kDa were purchased from Sigma-Aldrich (St.
Louis, MO, USA). GIBCO Dulbecco’s Modified Eagle Medium (DMEM), heat-inactivated
fetal bovine serum (FBS), non-essential amino acids, penicillin/streptomycin, trypsin-EDTA
and Hank’s Balanced Salt Solution (HBSS, pH 7.0-7.4) were purchased from Invitrogen
(Carlsbad, California, USA). Falcon® translucent polyethylene terephthalate (PET) cell
PART II. Chapter 8 Simulated gastrointestinal digestion and in vitro intestinal permeability of bioactive protein hydrolysates obtained from brewing and canned
sardine industry by-products
141
culture inserts (3.0 µm pore size, 24 mm diameter inserts, 4.2 cm2 effective growth area)
were acquired from BD Biosciences (Franklin Lakes, NJ, USA), and 6-well and 96-well
microplates were purchased from Corning® Costar® (Sigma-Aldrich, St. Louis, MO, USA).
Human colon carcinoma (Caco-2) cell line was obtained from the American Type Culture
Collection (ATCC) and mucus producing HT29-MTX cell line was kindly provided by Dr. T.
Lesuffleur (INSERM U178, Villejuif, France).
8.2.2. By-products
Flesh sardines (Sardina pilchardus) by-product including head, scale, skin, blood, bone,
viscera and muscle tissue was provided by the portuguese company Conservas Ramirez &
Cia (Filhos), SA (Matosinhos, Portugal). The whole muscle (ordinary and dark) was
removed manually from sardine and used for preparation of sarcoplasmic protein extract,
as described by Vieira and Ferreira (251). Protein concentration of sarcoplasmic protein
extract, determined by the Lowry method, was 2.4 mg/mL; this extract was kept at -20ºC
until use. BSY (Saccharomyces pastorianus) was supplied by the Unicer brewing (Leça do
Balio, Portugal). Cell wall was destroyed under refrigerated temperatures with glass beads
at a ratio of 1:1:1 (biomass: phosphate buffer pH 6.0: glass beads); (w/v/w) by vortexing 10
times (1 min each) with 1 min cooling intervals on ice. After removing the glass beads, the
homogenate was centrifuged at 12,000 x g, 40 min at 4ºC. The resulting clear supernatant
was freeze-dried, resuspended in the same buffer (to 25% of the initial volume) and
concentrated using a 10 kDa MWCO membrane. The protease activity of the retentate,
evaluated according to Cupp-Enyard (164) protocol, was 0.725 U/mL. This extract was keep
at -20ºC until use.
8.2.3. Preparation and fractionation of SPH
Sarcoplasmic protein extract was hydrolysed by BSY proteases using an E/S ratio of 0.27:1
(U/mg), pH 6.0, 50°C for 7 h. SPH was filtrated successively through 10 and 3 kDa MWCO
membranes. Fractions were collected and coded as SPH<10 kDa or SPH<3 kDa for
peptides permeating through the 10 kDa or 3 kDa membranes, respectively. The protein
recovery (PR%) upon UF was calculated as described by Picot et al. (244):
PR (%) = [protein of filtrate total protein of SPH⁄ ] × 100 (1)
Protein content was determined by the Lowry method (163).
8.2.4. In vitro Simulated GI Digestion
In vitro pepsin-pancreatin digestion of SPH<10 kDa was performed according to the method
described by Samaranayaka et al. (181). For this assay, SPH<10 kDa (50 mL) was used at
a final concentration of 5.0 mg protein/mL (based on Lowry method). In brief, the pH of

142
SPH<10 kDa solution was adjusted to 2 with 5 M HCl, then a solution of 1% (w/w) pepsin
was added in a E/S ratio of 1:35 (v/v) and the mixture was incubated in a shaking incubator
for 1 h, 300 rpm at 37ºC. Pepsin digestion was stopped by submerging in boiling water for
10 min. The pH was then adjusted to 5.3 with a saturated NaHCO3 solution and further to
pH 8 with 5 M NaOH. A solution of 1% (w/w) pancreatin was added to the mixture at an E/S
ratio of 1:25 (v/v), which was incubated again with shaking for 2 h, 300 rpm at 37ºC. To stop
the digestion by pancreatin, the solution was submerged in boiling water for 10 min. Control
treatment was prepared by inactivation (boiling for 10 min) of pepsin/pancreatin before
reaction with SPH<10 kDa. An aliquot of the digested samples (referred to as SPH.GI<10
kDa) was used directly for RP-HPLC analysis (performed as described in sub-section 8.2.9)
and for determining antioxidant and ACE-I activities (assessed as described in sub-sections
8.2.5 and 8.2.6, respectively). The remaining SPH.GI<10 kDa samples were freeze-dried
and stored at -25°C for further cell assays (described in sub-sections 8.2.7 and 8.2.8).
8.2.5. Ferric Reducing Antioxidant Potential (FRAP) assay
The antioxidant activity of SPH; <10 kDa and <3 kDa fractions; SPH.GI<10 kDa and cell
permeates (at 180 min of cell transport) were measured by FRAP, according to the method
described by Jansen and Ruskovska (154). The absorbance was measured at 600 nm,
using a BMG LABTECH´s SPECTROstar Nano-microplate (Offenburg, Germany). Trolox
was used as a standard at 50-500 µM to generate a calibration curve (average R2 = 0.9971)
and results were expressed as mean values ± standard deviations (n=3) as µM of Trolox
equivalent per mL of sample (µM TE/mL).
8.2.6. ACE-I activity assay
ACE-I activity of SPH; <10 kDa and <3 kDa fractions; SPH.GI<10 kDa and cell permeates
(at 180 min of cell transport) was assessed in triplicate using the fluorimetric assay
described by Sentandreu and Toldrá (121), with the modifications reported by Quiros et al.
(122). ACE-I percentage (I) was calculated using the equation:
I % = (B − A)|(B − C) × 100 (2)
where B is the fluorescence of the ACE solution without the inhibitor (SPH); A is the
fluorescence of the tested sample of SPH; and C is the fluorescence of experimental blank.
The percent inhibition curves were plotted versus peptide concentration to estimate the
mean IC50 value, which is defined as the concentration required to decrease the ACE activity
by 50% (122). Fluorimetric analysis was carried out using a fluorescence microplate reader
(FLUOstar Optima, BMG Labtech GmbH, Offenburg, Germany).
PART II. Chapter 8 Simulated gastrointestinal digestion and in vitro intestinal permeability of bioactive protein hydrolysates obtained from brewing and canned
sardine industry by-products
143
8.2.7. Cell viability study
The 3-(4,5-dimethylthiazol-2-yvl)-2,5-diphenyltetrazolium bromide (MTT) assay was used
to determine the cytotoxicity of SPH.GI<10 kDa in the viability of Caco-2 cell line. In this
assay, the MTT is reduced by mitochondrial dehydrogenases to a water-insoluble formazan
derivative, which can be measured at 570 nm (181). Briefly, cells (8×10⁴ cells/mL) were
seeded onto the central 60 wells of 96-well microplates in order to obtain confluent
monolayers within 2 days. After that, the medium was gently aspirated and the cells were
incubated for 24 h (37°C, 5% CO2) with SPH.GI<10 kDa at five different concentrations:
0.25; 0.50; 1.00; 2.00 and 4.00 mg protein/mL. Each individual plate included six replicates
of negative control (medium only) and six replicates of positive control (media with 1% Triton
X-100); peripheral wells on the plate were filled with sterile water to avoid evaporation of
the treatment solutions. After cell treatment with test samples, the culture medium was
aspirated and the attached cells were rinsed with 200 µL HBSS, followed by the addition of
fresh culture medium containing 0.25 mg/L MTT. After 30 min of incubation (37°C, 5% CO2),
the intracellular crystals of formazan were dissolved in 100 µL of DMSO and the absorbance
was measured at 570 nm. Each sample was tested in six replicates and three independent
experiments were performed. Cell viability was calculated as follows:
Cell viability (%) = (Abs sample
Abs control) x 100 (3)
where Abs control was the absorbance of formazan in negative control cells and Abs sample
was the absorbance of formazan in cells exposed to the test samples.
8.2.8. Permeability experiments
Caco-2 and HT29-MTX cell line cells were used at passages 28 and 44, respectively. The
two cell lines were maintained in culture separately, in DMEM supplemented with 10% FBS,
1% non-essential amino acids, 100 U/mL penicillin and 100 µg/mL streptomycin, at 37ºC
under a 5% CO2 water saturated atmosphere. Cells were harvested at 90% confluence with
trypsin-EDTA and seeded onto PET inserts mounted in 6-well plates, at a total density of
105 cells/mL. In the case of the Caco-2 cell model, cells were seeded at 2.8 x 10⁵ cells/mL,
while in the case of Caco-2/HT29-MTX cell co-culture model, cells of each type were mixed
prior to seeding to yield a concentration of 2.52 x 10⁵ cells/mL and 0.28 x 10⁵ cells/mL for
Caco-2 and HT29-MTX, respectively, as described by Antunes et al. (131). The culture
medium was replaced every other day and the monolayers allowed differentiating for 21
days. Caco-2 and Caco-2/HT29-MTX monolayers with an integrity equivalent to a TEER
higher than 200 Ω.cm2 were used for permeability experiments. Lyophilized SPH.GI<10 kDa
sample was dissolved in HBSS and recovered to a final concentration of 2.0 mg protein/mL
(based on Lowry assay). Caco-2 monolayer and Caco-2/HT29-MTX co-culture monolayer
144
were gently washed twice with HBSS solution and allowed to equilibrate for 30 min at 37ºC
in HBSS before permeability experiments. Then, the basolateral sides of the insert were
filled with 1.7 mL of HBSS solution, while 1.7 mL of SPH.GI<10 kDa (2.0 mg protein/mL in
HBSS) were placed on top (apical side) of the Caco-2 and Caco-2/HT29-MTX cells
monolayers. Permeability experiments were conducted at 37ºC, 5% CO2 water saturated
atmosphere, under static conditions (i.e. without stirring). Samples (0.7 mL) were collected
from the basolateral side after 15, 30, 60, 120 and 180 min of incubation and replaced with
the same volume of fresh HBSS. Collected samples were used directly for chromatographic
analysis (performed as described in sub-section 8.2.9) to evaluate the percentage
permeability, whereas an aliquot from each permeate was concentrated by freeze-drying
and then reconstituting in HBSS (20% the initial volume) in order to determine the
antioxidant and ACE-I activities (as previously described in sub-sections 8.2.5 and 8.2.6).
The efficiency of peptide transport, expressed as percentage of permeability for each peak
(P %), was calculated according to Cinq-Mars et al. (127) as follows:
P % = Ab
Aa. V X 100 (4)
where Ab and Aa correspond, respectively, to the RP-HPLC peak areas of the peptide
fraction detected in the basolateral and in the apical side and V (mL) is the volume of sample
loaded in the apical side.
The apparent permeability coefficient (Papp, cm s-1) was calculated according to Ferraro et
al. (184), as follows:
Papp = Q
A. C. t (5)
where Q is the total amount of permeated compounds during the 180 min of the experiment
in the basolateral side (mg), t (s) is the time of experiment, A is the monolayer area (4.52
cm2), and C (mg/mL) is the apical side concentration at time zero.
8.2.9. Reversed-phase high performance liquid chromatography
The RP-HPLC analysis of SPH.GI<10 kDa and respective permeates from Caco-2 cell and
Caco-2/HT29-MTX cell co-culture permeability assays were performed according to the
method described by Ferreira et al. (185). Solvent A was 0.1% TFA in water and solvent B
was acetonitrile-water-TFA (95:5:0.1, v/v/v). Peptides and proteins were eluted with the
following gradient: 0-5 min, 0% B; 5-9 min, 0-5% B; 9-15 min, 5-15% B; 15-25 min, 15-33%
B; 25-31 min, 33-40% B; 31-37 min, 40% B; 37-45 min, 40-50% B; 45-50 min (50-0% B), in
a total run time of 50 min. The flow-rate was 1.0 mL/min and the injection volume was 100
μL. UV detector absorbance was set at 214 nm. The equipment consisted of a Jasco HPLC
system (Tokyo, Japan) equipped with a quaternary low pressure gradient HPLC pump

PART II. Chapter 8 Simulated gastrointestinal digestion and in vitro intestinal permeability of bioactive protein hydrolysates obtained from brewing and canned
sardine industry by-products
145
(Jasco PU-1580), a degassing unit (Jasco DG-1580-53 3-line degasser), an autosampler
(Jasco AS-2057-PLUS), a MD-910 multiwavelengh detector (Jasco) and a 7125 Rheodyne
injector valve (California, USA). The column was a Chrompack P 300 RP
(polystyrenedivinylbenzene copolymer, 8 µm, 300 Å, 150 x 4.6 mm i.d.) (Chrompack,
Middleburg, The Netherlands). Data acquisition was accomplished using the Borwin
Controller software, version 1.50 (JMBS Developments, Le Fontanil, France).
8.2.10. Mass spectrometry
The molecular weight profiles of permeates after transport across Caco-2/HT29-MTX were
analysed by MALDI-TOF MS. Data were acquired using a 4800 MALDI-TOF/TOF (Applied
Biosystems, Darmstadt, Germany) mass spectrometer in the mass-to-charge ratio (m/z)
range from 1000 to 12000. Samples were cleaned with ZipTip C18 (Millipore) using the
manufacturer’s instructions. Then, the eluted samples were premixed with matrix [3 mg/mL
alpha-cyano-4-hydroxycinnamic acid (CHCA) in 50% (v/v) aqueous acetonitrile, 0.1%
trifluoroacetic acid (TFA)], spotted onto a target plate and dried at room temperature. The
4800 MALDI-TOF/TOF was calibrated using horse myoglobine [m/z 16952.56 (+1); m/z
8476.78 (+2); m/z 5651.85 (+3)] and cytochrome c [(m/z 12349.72 (+1); m/z 6177.94 (+2)].
The MS data was processed using the Data Explorer 4.8 software (ABSCIEX).
8.2.11. Statistical analysis
The statistical analysis was performed using the SPSS 22.0 software (SPSS, Chicago, IL,
USA). The student t-test was performed to compare the absorptive transport between the
two cell monolayer models; one-way analysis of variance (ANOVA) was carried out to allow
multi-comparison test, with Duncan’s post hoc test. The significance levels were set at an
overall α error of 5% (p <0.05).
8.3. RESULTS AND DISCUSSION
8.3.1. Effect of UF on biological activities of SPH
The antioxidant activity (FRAP assay) and ACE-I activity of SPH, <10 kDa and <3 kDa
fractions were assayed. Results are presented in Table 8.1. SPH showed a FRAP value of
287.7 µM TE/mL and an ACE-I activity (IC50) of 168.5 µg protein/mL. IC50 values of 260 µg
protein/mL have been previously reported for sardine muscle hydrolysates obtained by
Alcalase® (231). More recently, Bougatef et al. (15) reported IC50 values ranging from 1200
to 7400 µg protein/mL for sardine viscera hydrolysates obtained by treatment with different
microbial and visceral fish serine proteases. However, the direct comparison with the IC50
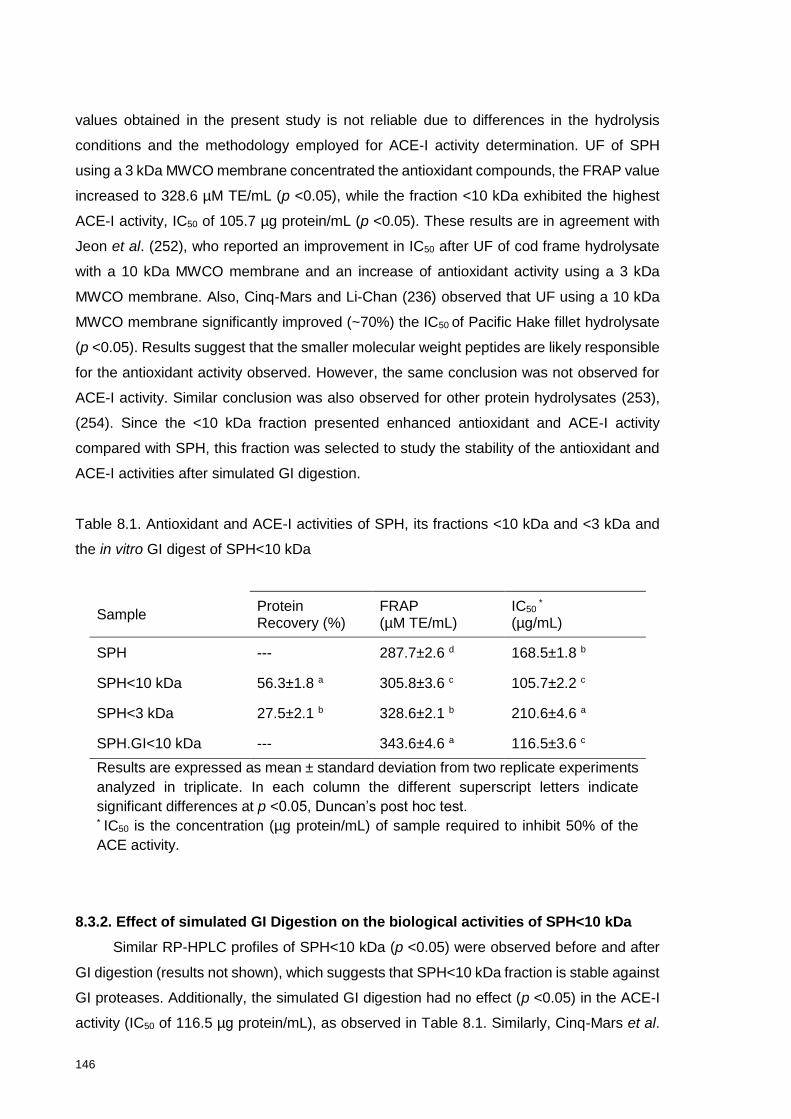
146
values obtained in the present study is not reliable due to differences in the hydrolysis
conditions and the methodology employed for ACE-I activity determination. UF of SPH
using a 3 kDa MWCO membrane concentrated the antioxidant compounds, the FRAP value
increased to 328.6 µM TE/mL (p <0.05), while the fraction <10 kDa exhibited the highest
ACE-I activity, IC50 of 105.7 µg protein/mL (p <0.05). These results are in agreement with
Jeon et al. (252), who reported an improvement in IC50 after UF of cod frame hydrolysate
with a 10 kDa MWCO membrane and an increase of antioxidant activity using a 3 kDa
MWCO membrane. Also, Cinq-Mars and Li-Chan (236) observed that UF using a 10 kDa
MWCO membrane significantly improved (~70%) the IC50 of Pacific Hake fillet hydrolysate
(p <0.05). Results suggest that the smaller molecular weight peptides are likely responsible
for the antioxidant activity observed. However, the same conclusion was not observed for
ACE-I activity. Similar conclusion was also observed for other protein hydrolysates (253),
(254). Since the <10 kDa fraction presented enhanced antioxidant and ACE-I activity
compared with SPH, this fraction was selected to study the stability of the antioxidant and
ACE-I activities after simulated GI digestion.
Table 8.1. Antioxidant and ACE-I activities of SPH, its fractions <10 kDa and <3 kDa and
the in vitro GI digest of SPH<10 kDa
Sample Protein Recovery (%)
FRAP (µM TE/mL)
IC50 *
(µg/mL)
SPH --- 287.7±2.6 d 168.5±1.8 b
SPH<10 kDa 56.3±1.8 a 305.8±3.6 c 105.7±2.2 c
SPH<3 kDa 27.5±2.1 b 328.6±2.1 b 210.6±4.6 a
SPH.GI<10 kDa --- 343.6±4.6 a 116.5±3.6 c
Results are expressed as mean ± standard deviation from two replicate experiments
analyzed in triplicate. In each column the different superscript letters indicate
significant differences at p <0.05, Duncan’s post hoc test. * IC50 is the concentration (µg protein/mL) of sample required to inhibit 50% of the
ACE activity.
8.3.2. Effect of simulated GI Digestion on the biological activities of SPH<10 kDa
Similar RP-HPLC profiles of SPH<10 kDa (p <0.05) were observed before and after
GI digestion (results not shown), which suggests that SPH<10 kDa fraction is stable against
GI proteases. Additionally, the simulated GI digestion had no effect (p <0.05) in the ACE-I
activity (IC50 of 116.5 µg protein/mL), as observed in Table 8.1. Similarly, Cinq-Mars et al.

PART II. Chapter 8 Simulated gastrointestinal digestion and in vitro intestinal permeability of bioactive protein hydrolysates obtained from brewing and canned
sardine industry by-products
147
(127) reported that UF<10 kDa fraction of Pacific Hake fillet hydrolysate had similar ACE-I
activity (IC50 of 90 μg protein/mL) before and after simulated GI digestion. Bougatef et al.
(15) concluded that a SPH with IC50 of 810 µg protein/mL was resistant to GI proteases
action, while Matsufuji et al. (112) reported that the IC50 of a sardine muscle hydrolysate (82
µg protein/mL) did not changed after GI digestion. According to the criteria of Iroyukifujita
et al. (109), hydrolysates and individual ACE-I peptides can be classified as “pro-drug type”,
“true-drug type” or “substrate type” based, respectively, on an increased, unchanged or
decreased ACE-I activity after simulated GI digestion. Therefore, based on our results,
ACE-I peptides present in SPH<10 kDa can be classified as “true-drug type”. Concerning
antioxidant activity, a significant (p <0.05) increase of the FRAP value was observed, 343.6
µM TE/mL, indicating that GI digestion produced peptides with higher antioxidant activity.
Wu and Ding (255) reported a similar effect of GI digestion in UF-10 kDa fraction of soy
protein hydrolysate.
8.3.3. Cellular viability of SPH.GI<10 kDa
Caco-2 cells were used to evaluate the cellular viability of SPH.GI<10 kDa. Results
of the MTT assay, which measures the mitochondrial succinate dehydrogenase activity, are
reported in Figure 8.1. SPH.GI<10 kDa did not present toxic effects in relation to
mitochondrial enzyme activity of Caco-2 cells at concentrations between 0.25 and 2.00 mg
protein/mL, whereas a significant (p <0.05) decrease on cell viability was observed for 4.00
mg protein/mL. Moreover, the SPH.GI<10 kDa at the concentrations of 1.0 and 2.0 mg
protein/mL significantly (p <0.05) prompted an increased cellular reactivity, reflecting higher
metabolic competence. Thus, the concentration of 2.00 mg protein/mL was selected for
permeability assays in order to not affect viability of cell monolayers during permeability
studies.
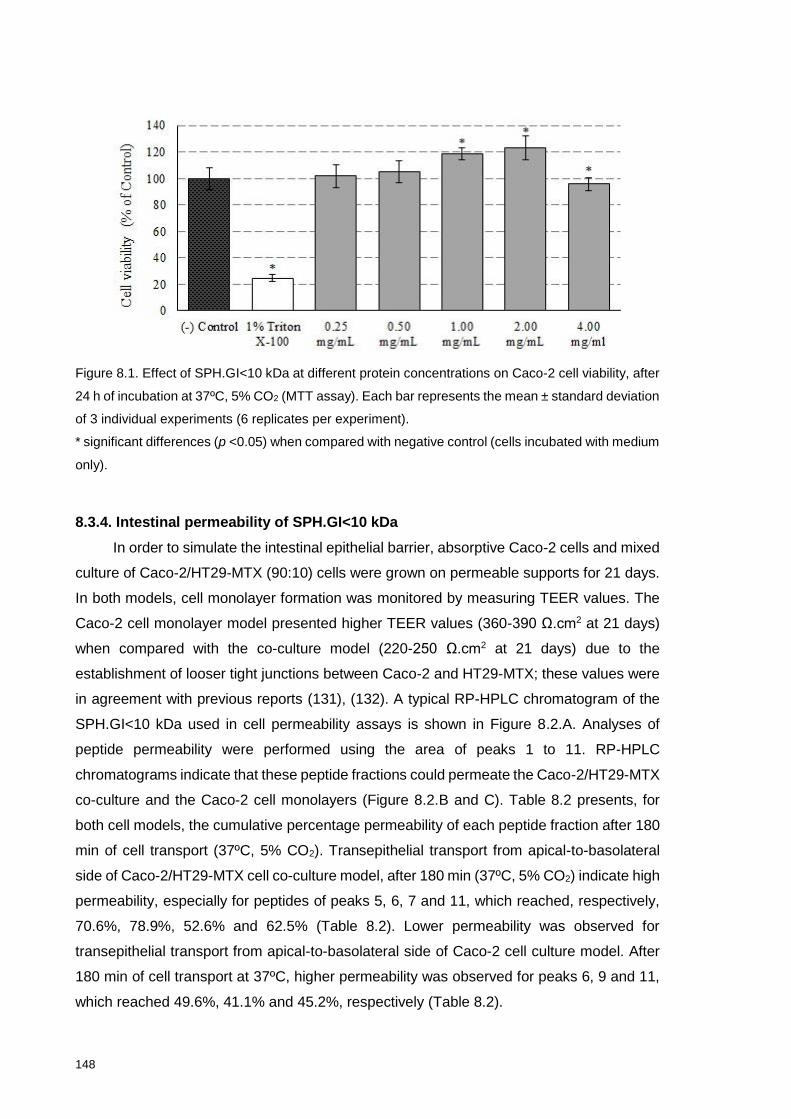
148
Figure 8.1. Effect of SPH.GI<10 kDa at different protein concentrations on Caco-2 cell viability, after
24 h of incubation at 37ºC, 5% CO2 (MTT assay). Each bar represents the mean ± standard deviation
of 3 individual experiments (6 replicates per experiment).
* significant differences (p <0.05) when compared with negative control (cells incubated with medium
only).
8.3.4. Intestinal permeability of SPH.GI<10 kDa
In order to simulate the intestinal epithelial barrier, absorptive Caco-2 cells and mixed
culture of Caco-2/HT29-MTX (90:10) cells were grown on permeable supports for 21 days.
In both models, cell monolayer formation was monitored by measuring TEER values. The
Caco-2 cell monolayer model presented higher TEER values (360-390 Ω.cm2 at 21 days)
when compared with the co-culture model (220-250 Ω.cm2 at 21 days) due to the
establishment of looser tight junctions between Caco-2 and HT29-MTX; these values were
in agreement with previous reports (131), (132). A typical RP-HPLC chromatogram of the
SPH.GI<10 kDa used in cell permeability assays is shown in Figure 8.2.A. Analyses of
peptide permeability were performed using the area of peaks 1 to 11. RP-HPLC
chromatograms indicate that these peptide fractions could permeate the Caco-2/HT29-MTX
co-culture and the Caco-2 cell monolayers (Figure 8.2.B and C). Table 8.2 presents, for
both cell models, the cumulative percentage permeability of each peptide fraction after 180
min of cell transport (37ºC, 5% CO2). Transepithelial transport from apical-to-basolateral
side of Caco-2/HT29-MTX cell co-culture model, after 180 min (37ºC, 5% CO2) indicate high
permeability, especially for peptides of peaks 5, 6, 7 and 11, which reached, respectively,
70.6%, 78.9%, 52.6% and 62.5% (Table 8.2). Lower permeability was observed for
transepithelial transport from apical-to-basolateral side of Caco-2 cell culture model. After
180 min of cell transport at 37ºC, higher permeability was observed for peaks 6, 9 and 11,
which reached 49.6%, 41.1% and 45.2%, respectively (Table 8.2).
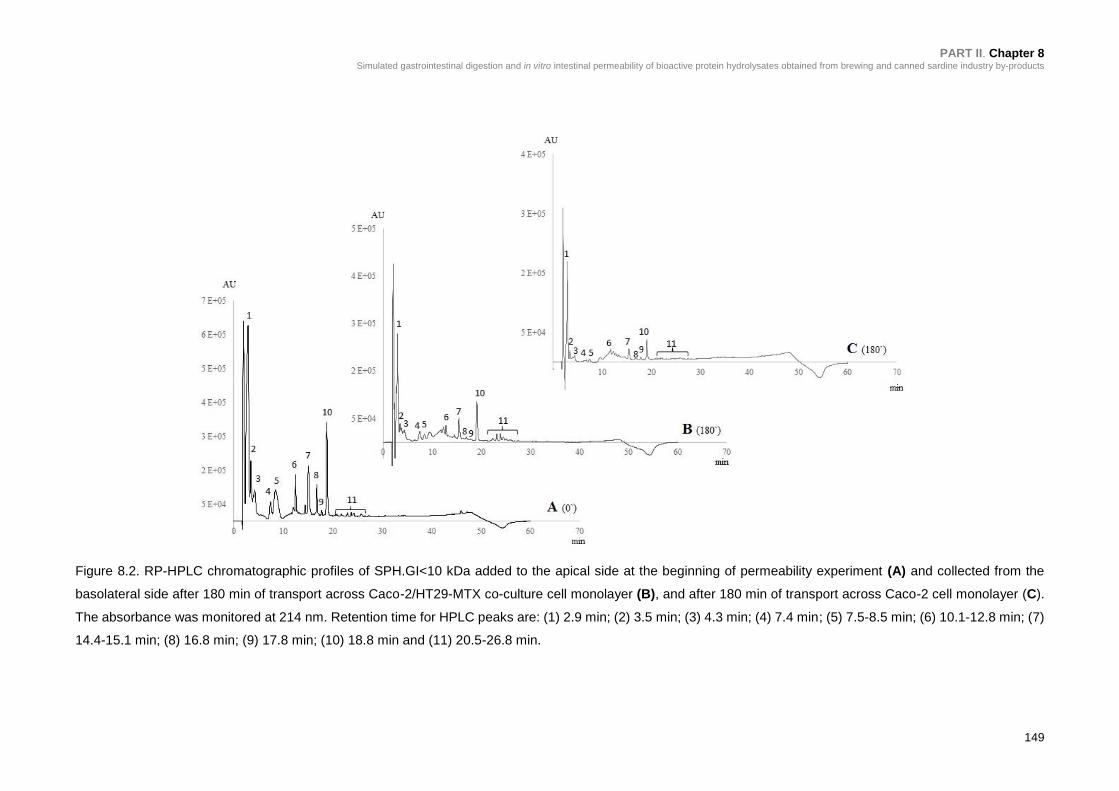
PART II. Chapter 8 Simulated gastrointestinal digestion and in vitro intestinal permeability of bioactive protein hydrolysates obtained from brewing and canned sardine industry by-products
149
Figure 8.2. RP-HPLC chromatographic profiles of SPH.GI<10 kDa added to the apical side at the beginning of permeability experiment (A) and collected from the
basolateral side after 180 min of transport across Caco-2/HT29-MTX co-culture cell monolayer (B), and after 180 min of transport across Caco-2 cell monolayer (C).
The absorbance was monitored at 214 nm. Retention time for HPLC peaks are: (1) 2.9 min; (2) 3.5 min; (3) 4.3 min; (4) 7.4 min; (5) 7.5-8.5 min; (6) 10.1-12.8 min; (7)
14.4-15.1 min; (8) 16.8 min; (9) 17.8 min; (10) 18.8 min and (11) 20.5-26.8 min.
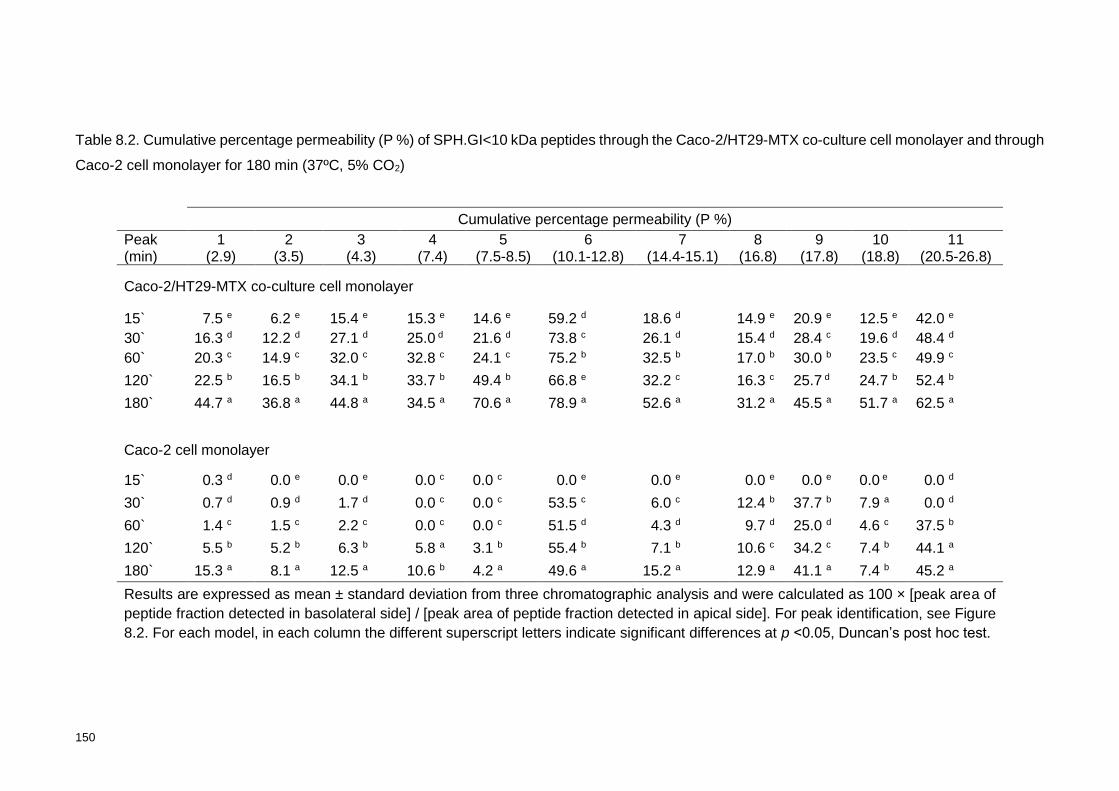
150
Table 8.2. Cumulative percentage permeability (P %) of SPH.GI<10 kDa peptides through the Caco-2/HT29-MTX co-culture cell monolayer and through
Caco-2 cell monolayer for 180 min (37ºC, 5% CO2)
Cumulative percentage permeability (P %)
Peak (min)
1 (2.9)
2 (3.5)
3 (4.3)
4 (7.4)
5 (7.5-8.5)
6 (10.1-12.8)
7 (14.4-15.1)
8 (16.8)
9 (17.8)
10 (18.8)
11 (20.5-26.8)
Caco-2/HT29-MTX co-culture cell monolayer
15` 7.5 e 6.2 e 15.4 e 15.3 e 14.6 e 59.2 d 18.6 d 14.9 e 20.9 e 12.5 e 42.0 e
30` 16.3 d 12.2 d 27.1 d 25.0 d 21.6 d 73.8 c 26.1 d 15.4 d 28.4 c 19.6 d 48.4 d
60` 20.3 c 14.9 c 32.0 c 32.8 c 24.1 c 75.2 b 32.5 b 17.0 b 30.0 b 23.5 c 49.9 c
120` 22.5 b 16.5 b 34.1 b 33.7 b 49.4 b 66.8 e 32.2 c 16.3 c 25.7 d 24.7 b 52.4 b
180` 44.7 a 36.8 a 44.8 a 34.5 a 70.6 a 78.9 a 52.6 a 31.2 a 45.5 a 51.7 a 62.5 a
Caco-2 cell monolayer
15` 0.3 d 0.0 e 0.0 e 0.0 c 0.0 c 0.0 e 0.0 e 0.0 e 0.0 e 0.0 e 0.0 d
30` 0.7 d 0.9 d 1.7 d 0.0 c 0.0 c 53.5 c 6.0 c 12.4 b 37.7 b 7.9 a 0.0 d
60` 1.4 c 1.5 c 2.2 c 0.0 c 0.0 c 51.5 d 4.3 d 9.7 d 25.0 d 4.6 c 37.5 b
120` 5.5 b 5.2 b 6.3 b 5.8 a 3.1 b 55.4 b 7.1 b 10.6 c 34.2 c 7.4 b 44.1 a
180` 15.3 a 8.1 a 12.5 a 10.6 b 4.2 a 49.6 a 15.2 a 12.9 a 41.1 a 7.4 b 45.2 a
Results are expressed as mean ± standard deviation from three chromatographic analysis and were calculated as 100 × [peak area of
peptide fraction detected in basolateral side] / [peak area of peptide fraction detected in apical side]. For peak identification, see Figure
8.2. For each model, in each column the different superscript letters indicate significant differences at p <0.05, Duncan’s post hoc test.

PART II. Chapter 8 Simulated gastrointestinal digestion and in vitro intestinal permeability of bioactive protein hydrolysates obtained from brewing and canned
sardine industry by-products
151
The values of Papp, which reflects the rate of passage through the intestinal epithelial
barrier, suggest that the peptide fractions 1 to 11 in SPH.GI<10 kDa are very likely to be
absorbed in humans (Figure 8.3). Papp values obtained in vitro using cell models can be
correlated with in vivo absorption profiles. For example, according to the criteria defined by
Yee (189), Papp values lower than 10−6 cm s-1 indicate poor in vivo absorption (<30%); Papp
values between 10−6 and 10−5 cm s-1 correspond to substances with moderate absorption
(30-70%); and Papp values higher than 10−5 cm s-1 suggest that substances are well
absorbed (>70%). The Papp values (at 180 min, 37ºC) for absorptive transport of SPH.GI<10
kDa peptides across Caco-2/HT29-MTX co-culture and Caco-2 cell monolayers were
11.0×10⁻⁶ cm s-1 and 5.9x10⁻⁶ cm s-1, respectively. These values are in accordance with
other studies, in which Paap of food-derived peptides varied in the range of 0.50-9.21×10⁻⁶
cm-1 (129), (133), (184) and support that SPH.GI<10 kDa may undergo moderate in vivo
absorption. The higher values of permeability and Papp of the co-culture model when
compared with the monoculture model (Table 8.2 and Figure 8.3) can be explained by the
tighter cell junctions among Caco-2 cells than between Caco-2/HT29-MTX, as previously
described (130), (131). As suggested by Calatayud et al. (133), the co-culture monolayer
presents higher number of paracellular pores per cm2 and is less resistant to compound
permeation. Furthermore, the mucus produced by HT29-MTX did not seem to delay the
permeation of SPH.GI<10 kDa peptides, suggesting a low level of interaction with mucins
and unimpaired diffusion. The modified HT29 cells are recognized for secreting gel-forming
mucins, mostly MUC5AC but also MUC2 (predominant in intestinal mucus) and MUC5B
(130), (256- 258). The Caco-2/HT29-MTX cell culture model, comprising mucus layer and
goblet-type cells, might represent a more physiological and realistic approach compared
with in vivo conditions and may give more accurate bioavailability predictions of the
SPH.GI<10 kDa peptides.

152
Figure 8.3. Comparative permeability (P %) as mean values ± standard deviation bars) for
sum of peptides fractions 1-11 (as present in Figure 8.2) from SPH.GI<10 kDa after 180
min (37ºC) of transport across Caco-2 cell monolayer and Caco-2/HT29 co-culture cell
monolayer. For both models, Papp values (10-6 cm s-1) are reported for peptide transport from
apical to basolateral chamber at 180 min (n=3) and were significantly different at p <0.05.
The analysis of mass spectra of SPH.GI<10 kDa permeates obtained after transport
from apical-to-basolateral side of Caco-2/HT29-MTX cell monolayer also confirmed that
compounds with m/z between 1000 and 5000 were transported (Figure 8.4). Althought the
bioavailability of large peptides with biological activity is of great interest, few studies have
studied the absorption of large peptides. The β-CN (193–209) peptide, a hydrophobic
peptide composed of 17 amino acid residues (molecular mass 1881 Da) was resistant to
the action of Caco-2 brush border peptidases and the main route involved in the
transepithelial transport was the transcytosis via internalized vesicles, although the
paracellular transport via tight-junctions was not excluded (259). Also, the tropomyosin (Pen
j 1), the major shrimp allergen with a molecular mass less than 20 kDa after GI digestion,
was rapidly degraded to small peptides (molecular mass <3.5 kDa) by Caco-2 brush border
peptidases and absorbed via a paracellular route (260).

PART II. Chapter 8 Simulated gastrointestinal digestion and in vitro intestinal permeability of bioactive protein hydrolysates obtained from brewing and canned sardine industry by-products
153
Figure 8.4. MALDI-TOF mass spectra of SPH.GI<10 kDa taken from the basolateral side after 180 min of a permeability experiment across Caco-
2/HT29-MTX co-culture cell monolayer.

154
8.3.5. Effect of intestinal transport on the biological activities of SPH.GI<10 kDa
Permeates of SPH.GI<10 kDa recovered after crossing Caco-2/HT29-MTX co-culture
monolayer presented a FRAP activity of 109.5 µM TE/mL, corresponding to a 70% decrease
of the previous antioxidant activity. However, no ACE-I activity was detected, even after 5
fold concentration of permeate by freeze-drying and further dissolution. Accordingly,
Samaranayaka et al. (181) did not observe ACE-I activity for GI-digested Pacific Hake
hydrolysate after 7 fold concentration. Vermeirssen et al. (261) also reported no ACE-I
activity for GI-digested pea proteins following transepithelial procedures using Caco-2 cell
monolayers. However, these authors referred that pea hydrolysate exerted a significant
blood pressure lowering effect after oral administration to SHR. Presumably, the permeate
concentration of ACE-I peptides was too low to be detected by the in vitro assay.
Vermeirssen et al. (261) detected the ACE-I of a pea hydrolysate using 50 mg protein/mL;
however this high concentration compromised the cell monolayer integrity. The initial
concentration of SPH.GI<10 kDa used in the present assays was significantly lower, 2 mg
protein/mL. Alternatively, the peptides that presented ACE-I activity were not those that
passed through Caco-2/HT29-MTX cell monolayers or were degraded by brush border
peptidases.
8.4. CONCLUSIONS
SPH produced by action of BSY proteases was tested after UF membrane separation
to assess the effect of in vitro simulated GI digestion and intestinal permeability across
Caco-2 culture and Caco-2/HT29-MTX cell co-culture monolayer models. UF using a 10
kDa MWCO resulted in a peptide mixture with enhanced ACE-I and antioxidant activities.
The ACE-I potential of SPH<10 kDa remained unchanged upon simulated GI digestion, but
no ACE-I activity was detected after cell transport, which indicates that probably the
peptides responsible for ACE inhibition suffered proteolysis by cellular peptidases.
Concerning antioxidant activity, the permeability assays showed that some peptide from
SPH.GI<10 kDa permeated across Caco-2 cell and Caco-2/HT29-MTX cell co-culture
monolayers, thereby providing further evidence of intestinal absorption and, at least, partial
resistance to brush border peptidases. The apical to basolateral transport of SPH.GI<10
kDa peptides was significantly higher in the physiologically relevant Caco-2/HT29-MTX cell
co-culture model. Further work is necessary to determine the sequences of peptides with
antioxidant capacity and to evaluate the mechanism of their biological activities.
Furthermore, studies using in vivo animal model systems are necessary to ascertain the
evidence for both antioxidant and ACE-I potential of bioactive peptides derived from Sardine
pilchardus by-product hydrolysate, before application as nutraceutical or functional food
product ingredient.
CHAPTER 9
Anti-inflammatory activity of a hydrolysate from canned
sardine and brewing by-products through inhibition of
TNF-a-induced endothelial dysfunction in a co-culture
model of Caco-2 and endothelial cells
_____________________
This chapter explores the potential anti-inflammatory properties of
the SPH prepared by action of the BSY proteases.

156

PART II. Chapter 9 Anti-inflammatory activity of a hydrolysate from canned sardine and brewing by-products through inhibition of TNF-a-induced endothelial
dysfunction in a co-culture model of Caco-2 and endothelial cells
157
ABSTRACT
Sardine protein hydrolysate (SPH), prepared by hydrolysis with proteases from brewing
yeast surplus, have been regarded as a bioactive hydrolysate with high antioxidant and
ACE-I activities. In this study, SPH was digested, fractionated with a 10 kDa-UF membrane
and desalted. The bioactivity of SPH<10 kDa was investigated on human endothelial cell
line during the inflammatory process (induced by TNF-α) in a co-culture model, which
combines intestinal absorption with changes in endothelial metabolism. Effects of SPH<10
kDa on NO production, ROS inhibition and secretion of monocyte chemoattractant protein
1 (MCP-1), vascular endothelial growth factor (VEGF), chemokine IL-8 (IL-8) and
intercellular adhesion molecule-1 (ICAM-1) were evaluated in TNF-α treated and untreated
cells.
Upon inflammation, levels of NO, MCP-1, VEGF, IL-8, ICAM-1 and endothelial ROS were
significantly increased in the co-culture and standard models. However, treatment with
SPH<10 kDa at a concentration of 2.0 mg protein/mL significantly decreased all the
inflammation markers when compared to TNF-α-treated control. This effect was more
pronounced in the co-culture model, suggesting that SPH<10 kDa Caco-2 cells metabolites
produced in the course of intestinal absorption may provide a more relevant protective effect
against endothelial dysfunction. Additionally, indirect cross-talk between two cell types was
established, suggesting that SPH<10 kDa may also bind to receptors on the Caco-2 cells,
thereby triggering a pathway to secrete the pro-inflammatory compounds. Overall, co-
culture model was indicated as a more physiological and realistic approach compared with
in vivo conditions to assess the anti-inflammatory activity of SPH<10 kDa.
9.1. INTRODUCTION
Inflammation is a normal immune response to infection and injury, which leads to the
up-regulation of a series of enzymes and signaling proteins in the affected tissues (99),
(262). However, a continuous condition of (low-grade) inflammation and oxidative stress
can contribute to the pathogenesis of several chronic diseases, such as, atherosclerosis,
hypertension, cancer, asthma and aging-related diseases (99), (263). The endothelial
barrier acts in the efficient regulation of the vascular tone, cell adhesion and vessel wall
inflammation (264), (265). Endothelial dysfunction is characterized by the expression of pro-
inflammatory compounds that attract white blood cells, which are converted to foam cells in
the atherosclerotic plaque. At the molecular level, Nitric oxide (NO) is released through
endothelial nitric oxide synthase (eNOS) and pro-inflammatory cytokines, including TNF-α,

158
interferon-γ (IFN-γ), interleukin-1 (IL-1), interleukin-8 (IL-8), monocyte chemoattractant
protein-1 (MCP-1), vascular endothelial growth factor (VEGF), among others cytokines,
enhance the expression levels of intercellular and vascular adhesion molecule 1 (ICAM-1
and VCAM-1) on the membrane of endothelial cells (265-268). Hence, the development of
anti-inflammatory compounds, has been proposed as the key therapeutic target for
preventing and treatment of chronic inflammation diseases (263), (269), (270).
Given the concerns about the side effects from prolonged usage of synthetic
compounds for the prevention and treatment of chronic diseases, there is a growing interest
in using natural compounds (271). Bioactive peptides of food origin may have an impact on
cardiovascular health through their anti-hypertensive, anti-oxidant, anti-thrombotic
anticholesterolemic effects (93). Likewise, several anti-inflammatory peptides with high
molecular weight have been isolated from different protein sources. For instance, lunasin
peptide (5 kDa molecular weight) (272) and lunasin-like peptide (with 8 and 14 kDa
molecular weight) (273) were isolated from defatted soybean flour. Also, the SALF55-76
cyclic peptide composed of 24 amino acid residues from black tiger shrimp, exhibited the
anti-inflammatory effect in LPS-stimulated RAW264.7 macrophage (274) and the >5 kDa
peptide fraction from Mytilus edulis protein hydrolysate inhibited the NO production by 92%
(275). Also, potent anti-inflammatory shellfish and fish peptides (276-278), as well as,
peptide-rich protein hydrolysates (269), (270), (275), (279-281) have been produced by
proteolysis of lower-quality food and underutilized materials. However, besides the efforts
to elucidate mechanisms of protective effects of these compounds, most in vitro studies
focus on their bioactivity towards endothelium (269), (270), (272-281), without taking into
account the intestinal barrier that selectively absorbs and converts the food compounds
(282). Recently, co-culture models of intestinal and endothelial cell cultures were
established and used for testing the beneficial effects of resveratrol and grape extracts on
endothelial dysfunction (268), (282). It was shown that these models were able to also
establish cell-cell communication, which led towards a more relevant response to bioactive
compounds at the endothelial level. Until present, only polyphenols were tested with this
model (268), (282).
In a previous work, a SPH prepared by hydrolysis of sarcoplasmic proteins by BSY
proteases, showed antioxidant and ACE-I activities, with promising application as a
functional food material (251). However, to the best of our knowledge no information is
reported about the anti-inflammatory properties of this SPH and its metabolites. In this work,
we will apply this SPH on the enterocyte-like Caco-2 and the endothelial-like EA.hy926 cell
culture, as well as, the Caco-2/EA.hy926 co-culture model to evaluate its beneficial effects
at the endothelial level under normal and inflammatory conditions, by measurement of cell

PART II. Chapter 9 Anti-inflammatory activity of a hydrolysate from canned sardine and brewing by-products through inhibition of TNF-a-induced endothelial
dysfunction in a co-culture model of Caco-2 and endothelial cells
159
viability, oxidative stress and the secretion of key endothelial markers (NO, MCP-1, VEGF,
IL-8 and ICAM-1).
9.2. MATERIAL AND METHODS
9.2.1. Reagents and standards and cells
Tumor necrosis factor-α (TNF-α); dimethyl sulfoxide (DMSO); 3-(4,5-dimethylthiazol-2-yl)-
2,5-diphenyltetrazoliumbromide (MTT); fluorescent reagent Lucifer yellow; fluorescente
probe 2`,7`-dichlorofluorescin diacetate (DCFH-DA); Triton X-100; Bradford Reagent;
Griess reagent, chicken egg albumin; Greiner 96-Well Multiwell Elisa plates and the
Millipore 10 kDa-UF membranes were purchased from Sigma-Aldrich (St. Louis, MO, USA).
The 12-well Transwell plates (0.4 µm pore diameter, 12 mm diameter, 1.12 cm2 insert
membrane growth area) were from Corning (Elscolab, Kruibeke, Belgium). Phosphate
Buffered Saline (PBS); Dulbecco’s modified Eagle’s growth medium (DMEM); glutamaxTM;
sodium pyruvate; fetal bovine serum; penicillin and streptomycin were from Gibco (Life
Technologies, Merelbeke, Belgium). ELISA Kits (ICAM-1, MCP-1, IL-8, VEGF) were
purchased from Peprotech (London, United Kingdom). All other chemicals and reagents
used in this study were of analytical grade.
9.2.2. By-products
Sardine (Sardina pilchardus) by-product including head, scale, skin, blood, bone, viscera
and muscle tissue was provided by the Portuguese company Conservas Ramirez
(Matosinhos, Portugal). Brewing spent yeast (BSY), Saccharomyces pastorianus, was
supplied by the brewing industry Unicer (Leça do Balio, Portugal).
9.2.3. Preparation of SPH
The preparation of sarcoplasmic protein extract from sardine by-product and the BSY
proteases extract were prepared as described by Vieira and Ferreira (251). Protein
concentration of sarcoplasmic protein extract, determined by the Bradford method (171)
was 2.4 mg/mL and the protease activity of the BSY proteases extract (>10 kDa fraction),
evaluated according to Cupp-Enyard protocol (164), was 0.725 U/mL. Sarcoplasmic protein
extract was hydrolyzed by BSY proteases using an E/S ratio of 0.27:1 (U/mg), pH 6.0, 50°C
for 7 h, as previously described by Vieira and Ferreira (251). Then, the SPH was submitted
to simulated GI digestion according to Samaranayaka et al. (181) and fractionated using a
10 kDa-UF membrane. The resulting fractions, SPH<10 kDa and SPH>10 kDa, were

160
lyophilized (Telstar freeze dryer, Cryodos-80 model, Terrassa, Spain) and stored at -20 °C
prior to further analysis.
9.2.4. Desalting of SPH
SPH<10 kDa and SPH>10 kDa fractions were prepared in pure water at the concentration
of 10 mg/mL and desalted by solid phase extraction using an Oasis® HLB cartridge (35 cc,
Waters, Waters, Milford, MA). Cartridge was first activated with methanol (0.1% formic acid)
and equilibrated with 50% acetonitrile in water according to the manufacturer’s protocol.
Then, sample was applied, washed 4 times with water and the peptides were eluted with
acetonitrile. The acetonitrile was subsequently evaporated in a rotary evaporator under
vacuum and the final residues were used for the following experiments.
9.2.5. Protein content
The protein content was measured by the microprotein Bradford assay (171), using chicken
egg albumin to construct the standard curve. Samples or standard (25 µL) were mixed with
Bradford reagent (250 µL) and the absorbance at 595 nm was measured after 5-10 min
against a reagent blank. The protein concentration in each sample was calculated based
on a standard curve. The analyses were performed in triplicate.
9.2.6. Cell culture routine
The continuous human colon adenocarcinoma cell line Caco-2 ATCC©HTB37™, that
differentiates into enterocyte-like cells upon confluence and the permanent human
endothelial cell line EA.hy926 CRL2922™ were obtained from ATCC (American Type
Culture Collection, Manassas, VA, USA). The Caco-2 cells (passage 8-20) and endothelial
cells (passage 5-10) were grown separately as adherent cultures in 25 cm2 tissue culture
flasks (Sarstedt, Essen, Belgium) and cultivated in DMEM, high glucose, supplemented with
glutamaxTM, sodium pyruvate, 10% (v/v) fetal bovine serum, penicillin (100 U/mL), and
streptomycin (100 mg/mL). Cells were subcultured once a week with 0.25% (v/v) trypsin-
EDTA and grown until 90% confluence. The culture medium was replaced every other day.
Cells were incubated at 37ºC and 10% CO2 in a water saturated atmosphere (Memmert,
VWR, Leuven, Belgium).
9.2.7. Cell viability experiments
In a first set of experiments, the effect of ultrafiltered and desalted SPH samples on Caco-
2 and EA.hy926 cell monolayers viability was evaluated through the MTT assay. Caco-2
and EA.hy926 cells were separately cultivated in growth medium until 90% confluency, and
subsequently seeded in 96-well plates at a concentration of 2x10⁴ cells per well. Upon 100%
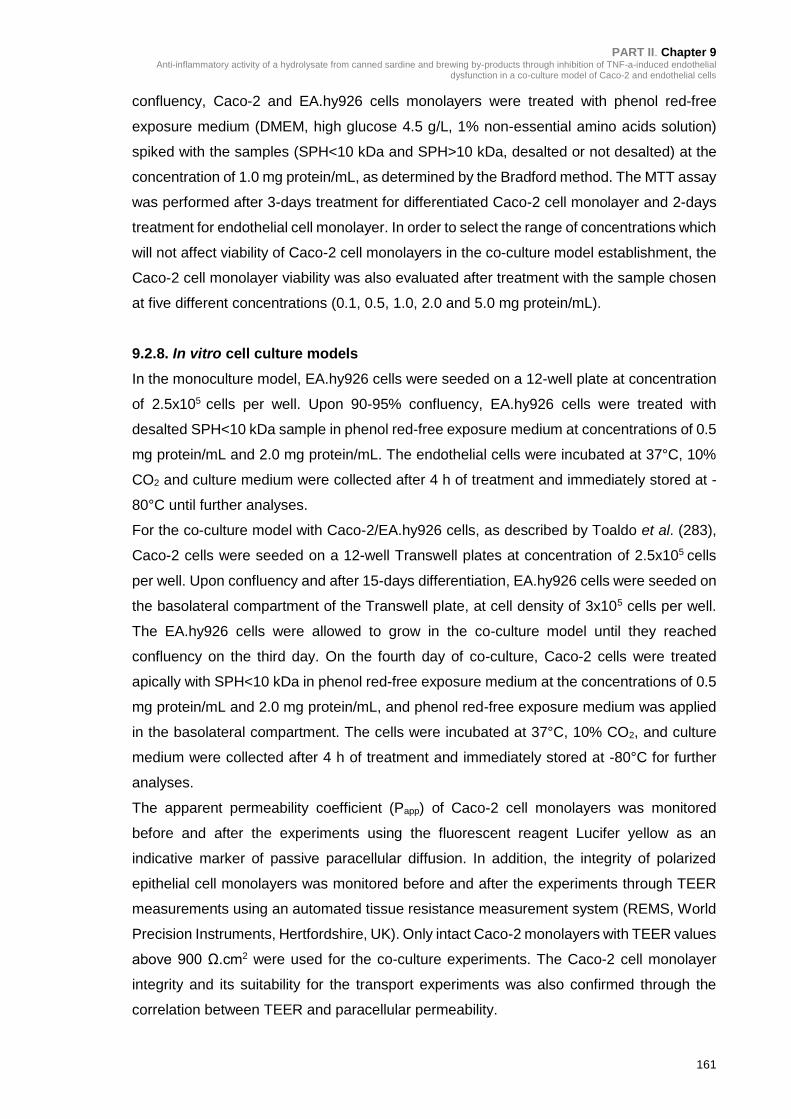
PART II. Chapter 9 Anti-inflammatory activity of a hydrolysate from canned sardine and brewing by-products through inhibition of TNF-a-induced endothelial
dysfunction in a co-culture model of Caco-2 and endothelial cells
161
confluency, Caco-2 and EA.hy926 cells monolayers were treated with phenol red-free
exposure medium (DMEM, high glucose 4.5 g/L, 1% non-essential amino acids solution)
spiked with the samples (SPH<10 kDa and SPH>10 kDa, desalted or not desalted) at the
concentration of 1.0 mg protein/mL, as determined by the Bradford method. The MTT assay
was performed after 3-days treatment for differentiated Caco-2 cell monolayer and 2-days
treatment for endothelial cell monolayer. In order to select the range of concentrations which
will not affect viability of Caco-2 cell monolayers in the co-culture model establishment, the
Caco-2 cell monolayer viability was also evaluated after treatment with the sample chosen
at five different concentrations (0.1, 0.5, 1.0, 2.0 and 5.0 mg protein/mL).
9.2.8. In vitro cell culture models
In the monoculture model, EA.hy926 cells were seeded on a 12-well plate at concentration
of 2.5x10⁵ cells per well. Upon 90-95% confluency, EA.hy926 cells were treated with
desalted SPH<10 kDa sample in phenol red-free exposure medium at concentrations of 0.5
mg protein/mL and 2.0 mg protein/mL. The endothelial cells were incubated at 37°C, 10%
CO2 and culture medium were collected after 4 h of treatment and immediately stored at -
80°C until further analyses.
For the co-culture model with Caco-2/EA.hy926 cells, as described by Toaldo et al. (283),
Caco-2 cells were seeded on a 12-well Transwell plates at concentration of 2.5x10⁵ cells
per well. Upon confluency and after 15-days differentiation, EA.hy926 cells were seeded on
the basolateral compartment of the Transwell plate, at cell density of 3x10⁵ cells per well.
The EA.hy926 cells were allowed to grow in the co-culture model until they reached
confluency on the third day. On the fourth day of co-culture, Caco-2 cells were treated
apically with SPH<10 kDa in phenol red-free exposure medium at the concentrations of 0.5
mg protein/mL and 2.0 mg protein/mL, and phenol red-free exposure medium was applied
in the basolateral compartment. The cells were incubated at 37°C, 10% CO2, and culture
medium were collected after 4 h of treatment and immediately stored at -80°C for further
analyses.
The apparent permeability coefficient (Papp) of Caco-2 cell monolayers was monitored
before and after the experiments using the fluorescent reagent Lucifer yellow as an
indicative marker of passive paracellular diffusion. In addition, the integrity of polarized
epithelial cell monolayers was monitored before and after the experiments through TEER
measurements using an automated tissue resistance measurement system (REMS, World
Precision Instruments, Hertfordshire, UK). Only intact Caco-2 monolayers with TEER values
above 900 Ω.cm2 were used for the co-culture experiments. The Caco-2 cell monolayer
integrity and its suitability for the transport experiments was also confirmed through the
correlation between TEER and paracellular permeability.

162
9.2.9. Exposure to TNF-α to induce endothelial inflammation
In order to investigate the cellular responses to desalted SPH<10 kDa samples under
stress-induced conditions in endothelial tissue, EA.hy926 cells from co-culture and standard
models were treated with TNF-α. In both monoculture and co-culture cell models, EA.hy926
cells were incubated for 1 h with 10 ng/mL TNF-α in phenol red-free exposure medium to
induce high-grade inflammation in endothelium.. Next, the culture medium was aspirated
and the EA.hy926 cells were rinsed twice with phenol red-free exposure medium, followed
by treatment with desalted SPH<10 kDa samples for 4 h (37ºC, 10% CO2). After treatment
in the monoculture and co-culture models, viability of EA.hy926 cell monolayers was
evaluated by the MTT assay, intracellular ROS was measured immediately and the culture
medium was collected, centrifuged at 15,000 x g for 10 min and kept at -80ºC until analysis,
which included the measurement of NO and secreted pro-inflammatory cytokines.
9.2.9.1. Cell viability study
In the 3-(4,5-dimethylthiazol-2-yvl)-2,5-diphenyltetrazolium bromide (MTT) assay, the MTT
is reduced by mitochondrial dehydrogenases to a water-insoluble formazan derivative,
which can be measured at 570 nm. Briefly, after cell treatment with test samples in the
monoculture and co-culture models, the culture medium was aspirated and the attached
cells were rinsed with 200 µL PBS, followed by the addition of the MTT solution (1 mg/mL
in phenol red-free exposure medium). After 30 min of incubation (37ºC, 10% CO2), the MTT-
formazan product was solubilized in 100 µL of DMSO and the absorbance was measured
at 570 nm on a Bio-Rad multiplate reader (Bio-Rad Laboratories, Hercules, CA, USA). Each
sample was tested in six replicates and three independent experiments were performed.
9.2.9.2. Determination of intracellular reactive oxygen species (ROS)
The formation of reactive oxygen species (ROS) was evaluated using the oxidation
sensitive dye 2`,7`-dichlorofluorescein-diacetate (H2-DCFDA). Briefly, after cell treatment
with test samples in the co-culture and standard models, EA.hy926 cells were loaded with
20 µM H2-DCFDA in phenol red-free exposure medium and incubated for 30 min (37°C,
10% CO2). The cells were then washed with PBS, lysed with 0.1% Triton X-100 and
centrifuged at 14,000 rpm for 10 min. The fluorescence of supernatants was immediately
read in black 96-well plates at an excitation wavelength of 485 nm and an emission
wavelength of 535 nm, using a Spectramax Fluorescent Plate Reader.
9.2.9.3. Inhibition of NO production
A spectrophotometric assay based on the Griess reaction was used to indirectly measure
the NO production in EA.hy926 cells. Briefly, test samples were mixed with equal volume

PART II. Chapter 9 Anti-inflammatory activity of a hydrolysate from canned sardine and brewing by-products through inhibition of TNF-a-induced endothelial
dysfunction in a co-culture model of Caco-2 and endothelial cells
163
of the Griess reagent. After 15 min at room temperature (18°C), absorbance was read at
540 nm on a Bio-Rad multiplate reader (Bio-Rad Laboratories, Hercules, CA, USA). The
nitrite concentration was determined by reference to a standard curve of sodium nitrite
(NaNO2) in a range of 0-20 µM.
9.2.9.4. Inhibition of pro-inflammatory cytokines production
The inhibitory effects of test samples on the expression of MCP-1, VEGF, IL-8 and ICAM-1
in the cell culture medium of co-culture and standard models was performed by enzyme
immunoassay, using commercially available ELISA kits according to the manufacturer’s
instructions. The endothelial markers were tested in both TNF-α-treated and untreated
EA.hy926 cells in order to determine the test samples effects on endothelium responses
under inflammatory and non-inflammatory conditions. The intra-assay and inter-assay
coefficients of variation for these ELISA assays were <6% and <10%, respectively. All
measurements were taken twice.
9.2.10. Statistical analysis
Results were expressed as mean ± standard deviation. Statistical analysis was performed
with SPSS 22.0 (SPSS Inc., Chicago, IL, USA), using One-way analysis of variance
(ANOVA) followed by Student’s t-test to assess statistical differences from control values
(no treated cells) and between inflammatory and non-inflammatory conditions. Differences
were accepted as statistically significant at p <0.05 or p <0.01.
9.3. RESULTS
9.3.1. Effect of UF, desalting and optimization of working concentrations
SPH was prepared according to the previous procedure reported (251) and submitted
to simulated GI digestion. According to the literature, anti-inflammatory peptides possess a
wide range of molecular weights (281). For this reason, in a first set of experiments, the
effect of 10 kDa-UF membrane of SPH digest on Caco-2 and EA.hy926 cells viability was
assessed. Caco-2 and EAhy926 cells were treated with the fractions SPH>10 kDa and
SPH<10 kDa at the same peptide concentration of 1.0 mg/mL for 24 h, (37°C, 10% CO2)
and cell viability was evaluated by the MTT assay. Results present in Figure 9.1 showed
that SPH>10 kDa significantly (p <0.05) decreased Caco-2 and EAhy.926 cells viability
when compared to SPH<10 kDa fraction. Regarding the effect of desalting process, results
showed that the desalted SPH<10 kDa fraction had a positive impact on both cell lines
viability in relation to the desalted SPH>10 kDa fraction significantly (p <0.05). As the MTT
protocol performed in the present study uses cells at confluency, the attained data is not

164
compatible with cell proliferation. These results suggest that desalting step not only
removed the excess of salt associated with hydrolysis, but also increased the relative
abundance of <10 kDa compounds within the SPH, thereby improving good cell viability
(284).
In a second set of experiments, the MTT assay was performed to evaluate the
cytotoxicity of the desalted SPH<10 kDa fraction at five peptide concentrations. As shown
in Figure 9.2, the highest Caco-2 cells and EAhy926 cell viability was observed in cells
treated with desalted SPH<10 kDa at the range of 0.1 to 2.0 mg protein/mL, with a slightly
decreased cell viability at the concentration of 5.0 mg protein/mL. Considering these results,
two different working concentrations, 0.5 mg protein/mL and 2.0 mg protein/mL, of desalted
SPH<10 kDa fraction were selected to further investigate its anti-inflammatory action in
TNF-α stimulated endothelial cells in the monoculture and co-culture systems.
9.3.2. Establishment of the co-culture model
Caco-2 cells have been extensively used to study the effects of bioactive ingredients
in both normal and inflammatory conditions (267), (268). In this work, the validated co-
culture model by Toaldo et al. (283), combining absorption by differentiated Caco-2 cells
and sequential effects on endothelial cells metabolism, was applied to evaluate the
response of SPH<10 kDa in both TNF-α-activated and non-activated EA.hy926 cells. The
permeability and integrity parameters of Caco-2 cell monolayer were examined before
transport experiments. Papp values of apical-to-basolateral direction were in the range of
5.01 ± 0.41 x 10⁻⁵ cm/s and the TEER values were in the range of 1008.87 ± 52.41 Ω.cm2,
indicating an intact epithelial monolayer, suitable to be used for the transport experiments.
9.3.3. Effects on viability of endothelial cells
The SPH<10 kDa cytotoxicity in EA.hy926 cells, under inflammatory and non-
inflammatory conditions, was assessed through the MTT assay in the monoculture and co-
culture models. Results present in Figure 9.3 showed that TNF-a treatment significantly
decreased mitochondrial activity in both models. Upon TNF-α induced inflammation in the
co-culture model, and when compared to TNF-α-treated control, a significant (p <0.05)
decrease of EA.hy926 cell mitochondrial activity was observed upon 4 h treatment with the
transported 0.5 mg protein/mL SPH<10 kDa fraction, while treatment with SPH<10 kDa at
the highest concentration (2.0 mg protein/mL) resulted in a slight but significant (p <0.05)
increase in mitochondrial activity. On the other hand, treatment with 2.0 mg protein/mL
SPH<10 kDa significantly (p <0.01) increased the EA.hy926 mitochondrial activity in both
models treated with TNF-α. These results show that under normal conditions, the extract
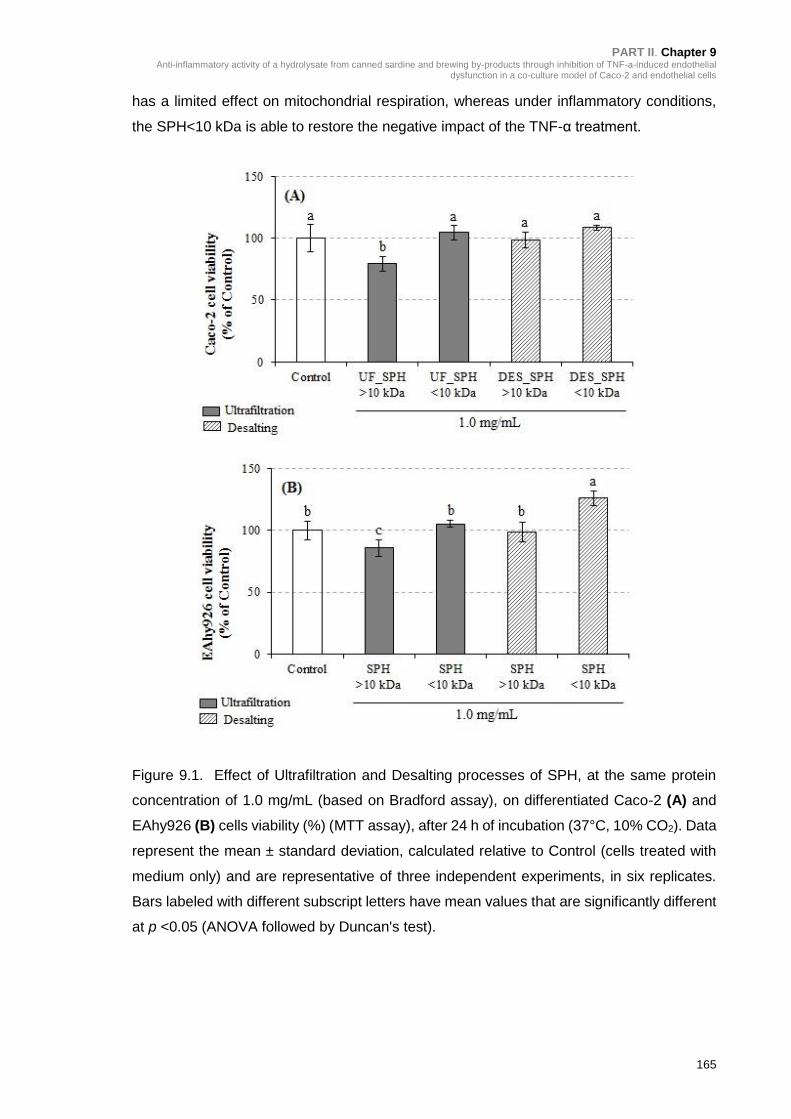
PART II. Chapter 9 Anti-inflammatory activity of a hydrolysate from canned sardine and brewing by-products through inhibition of TNF-a-induced endothelial
dysfunction in a co-culture model of Caco-2 and endothelial cells
165
has a limited effect on mitochondrial respiration, whereas under inflammatory conditions,
the SPH<10 kDa is able to restore the negative impact of the TNF-α treatment.
Figure 9.1. Effect of Ultrafiltration and Desalting processes of SPH, at the same protein
concentration of 1.0 mg/mL (based on Bradford assay), on differentiated Caco-2 (A) and
EAhy926 (B) cells viability (%) (MTT assay), after 24 h of incubation (37°C, 10% CO2). Data
represent the mean ± standard deviation, calculated relative to Control (cells treated with
medium only) and are representative of three independent experiments, in six replicates.
Bars labeled with different subscript letters have mean values that are significantly different
at p <0.05 (ANOVA followed by Duncan's test).
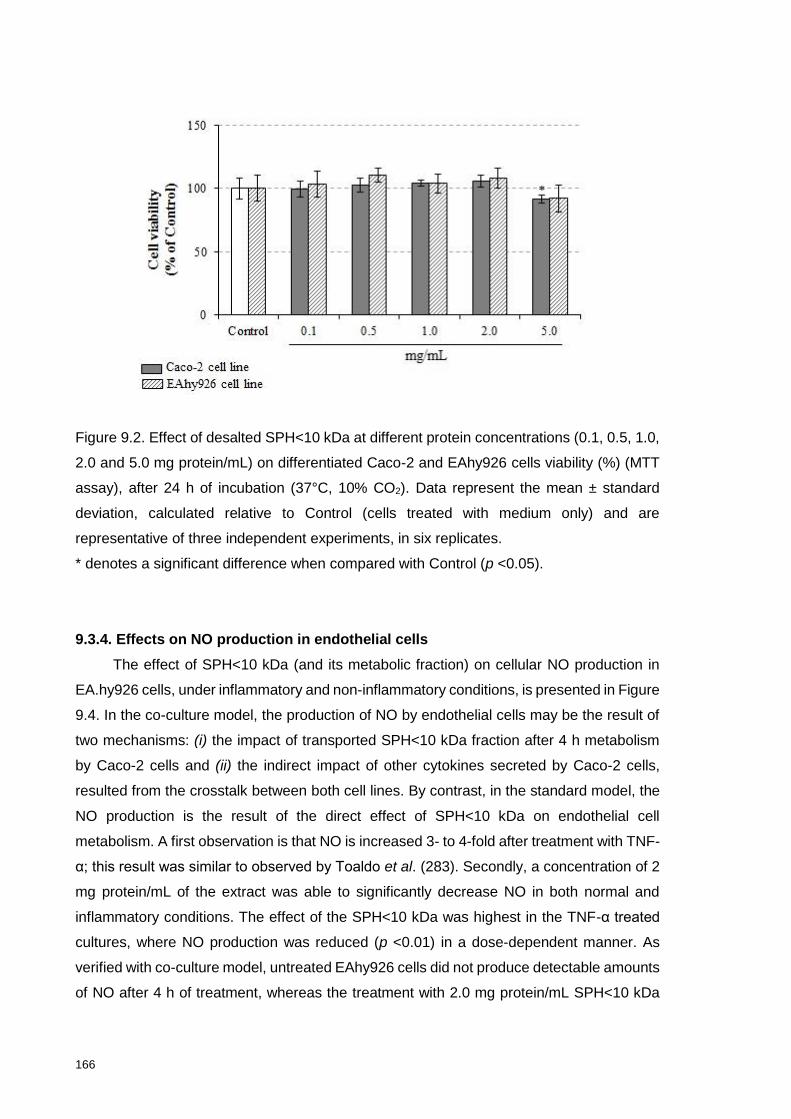
166
Figure 9.2. Effect of desalted SPH<10 kDa at different protein concentrations (0.1, 0.5, 1.0,
2.0 and 5.0 mg protein/mL) on differentiated Caco-2 and EAhy926 cells viability (%) (MTT
assay), after 24 h of incubation (37°C, 10% CO2). Data represent the mean ± standard
deviation, calculated relative to Control (cells treated with medium only) and are
representative of three independent experiments, in six replicates.
* denotes a significant difference when compared with Control (p <0.05).
9.3.4. Effects on NO production in endothelial cells
The effect of SPH<10 kDa (and its metabolic fraction) on cellular NO production in
EA.hy926 cells, under inflammatory and non-inflammatory conditions, is presented in Figure
9.4. In the co-culture model, the production of NO by endothelial cells may be the result of
two mechanisms: (i) the impact of transported SPH<10 kDa fraction after 4 h metabolism
by Caco-2 cells and (ii) the indirect impact of other cytokines secreted by Caco-2 cells,
resulted from the crosstalk between both cell lines. By contrast, in the standard model, the
NO production is the result of the direct effect of SPH<10 kDa on endothelial cell
metabolism. A first observation is that NO is increased 3- to 4-fold after treatment with TNF-
α; this result was similar to observed by Toaldo et al. (283). Secondly, a concentration of 2
mg protein/mL of the extract was able to significantly decrease NO in both normal and
inflammatory conditions. The effect of the SPH<10 kDa was highest in the TNF-α treated
cultures, where NO production was reduced (p <0.01) in a dose-dependent manner. As
verified with co-culture model, untreated EAhy926 cells did not produce detectable amounts
of NO after 4 h of treatment, whereas the treatment with 2.0 mg protein/mL SPH<10 kDa
PART II. Chapter 9 Anti-inflammatory activity of a hydrolysate from canned sardine and brewing by-products through inhibition of TNF-a-induced endothelial
dysfunction in a co-culture model of Caco-2 and endothelial cells
167
significantly (p <0.05) reduced the NO production. Under TNF-α-induced inflammation of
endothelial cells, treatment with 2.0 mg protein/mL SPH<10 kDa significantly (p <0.01)
reduced the NO production by 22%, when compared to TNF-α-treated control. This result
suggest that SPH<10 kDa Caco-2 cell metabolites may prevent inflammatory process via
regulation of the NO level.
9.3.5. Effects on ROS levels in endothelial cells
For intracellular ROS levels of the endothelial cells, similar observations as for NO
were observed (Figure 9.5). Upon TNF-α-induced endothelial inflammation for both cell
models, the levels of ROS were 2-fold increased (p <0.01) compared to untreated cells, and
this effect was higher for the co-culture model. In the co-culture model, compared to TNF-
α-treated control, a significant (p <0.01) decrease in ROS levels (46%) was observed in
response to 4 h treatment with 2.0 mg protein/mL SPH<10 kDa. For the monoculture model,
in response to TNF-α-induced endothelial inflammation, the protective effect was also
significantly (p <0.01) higher for SPH<10 kDa at the concentration of 2.0 mg protein/mL
(16%, when compared to compared to TNF-α-treated control). These results indicate a
dose-dependent protective effect of the SPH<10 kDa towards TNF-α induced oxidative
stress.
9.3.6. Effects on inflammation markers expression
The influence of SPH<10 kDa (and metabolites) on the secretion of the markers MCP-1,
VEGF, IL-8 and ICAM-1 was evaluated in the monoculture and co-culture models. The
results are presented in Figure 9.6. In TNF-α-treated cells, the secretion of pro-inflammatory
markers was significantly (p <0.01) higher in comparison with basal values of the non-
inflammatory conditions. Under non-inflammatory conditions, the SPH<10 kDa at the
concentration of 2.0 mg protein/mL resulted in a significant (p <0.05) decrease on the
secretion of the endothelial marker VEGF in the co-culture model and a significant decrease
on the secretion of VEGF (p <0.01) and IL-8 (p <0.05) in the monoculture model. As
observed in Figure 9.6, for the monoculture model, treatment of EA.hy926 cells with 2.0 mg
protein/mL SPH<10 kDa significantly (p <0.01) decreased TNF-α-induced MCP-1, VEGF,
IL-8 and ICAM-1 expression by 24%, 16%, 21% and 26%, respectively, when compared to
TNF-α-treated control. For the co-culture model, this reduction (p <0.01) was, respectively,
46%, 35%, 47% and 44%, when compared to TNF-α-treated control.

168
Figure 9.3. Effect of SPH<10 kDa (and metabolites) at the protein concentrations of 0.5 and 2.0 mg protein/mL on EAhy926 cells viability (%), after 4
h of incubation (37ºC, 10% CO2) in the co-culture and standard models, under TNF-α-induced inflammatory (1 h of TNF-α 10 ng/mL stimulation) and
non-inflammatory conditions. Data represent the mean ± standard deviation of three measurements in triplicates, in two independent experiments.
Results are expressed as percentage of respective control (cells treated with medium only or with medium with TNF 10 ng/mL). Controls of non-
inflammatory condition are normalized at 100% and values in the inflammatory condition are represented in comparison to the respective non-
inflammatory condition. Significance was determined at *p <0.05, **p <0.01 versus respective control and #p <0.05, ##p <0.01 versus respective non-
inflammatory condition.

PART II. Chapter 9 Anti-inflammatory activity of a hydrolysate from canned sardine and brewing by-products through inhibition of TNF-a-induced endothelial dysfunction in a co-culture model of Caco-2 and endothelial cells
169
Figure 9.4. Effect of SPH<10 kDa (and metabolites) at the protein concentrations of 0.5 and 2.0 mg/mL on NO production of EAhy926 cells after 4 h of
incubation (37ºC, 10% CO2) in the co-culture and standard models, under TNF-α-induced inflammatory (1 h of TNF-α 10 ng/mL stimulation) and non-
inflammatory conditions. Data represent the mean ± standard deviation of three measurements in triplicates, in two independent experiments. Results
are expressed as percentage of respective control (cells treated with medium only or with medium with TNF 10 ng/mL). Controls of non-inflammatory
condition are normalized at 100% and values in the inflammatory condition are represented in comparison to the respective non-inflammatory condition.
Significance was determined at *p <0.05, **p <0.01 versus respective control and #p <0.05, ##p <0.01 versus respective non-inflammatory condition.
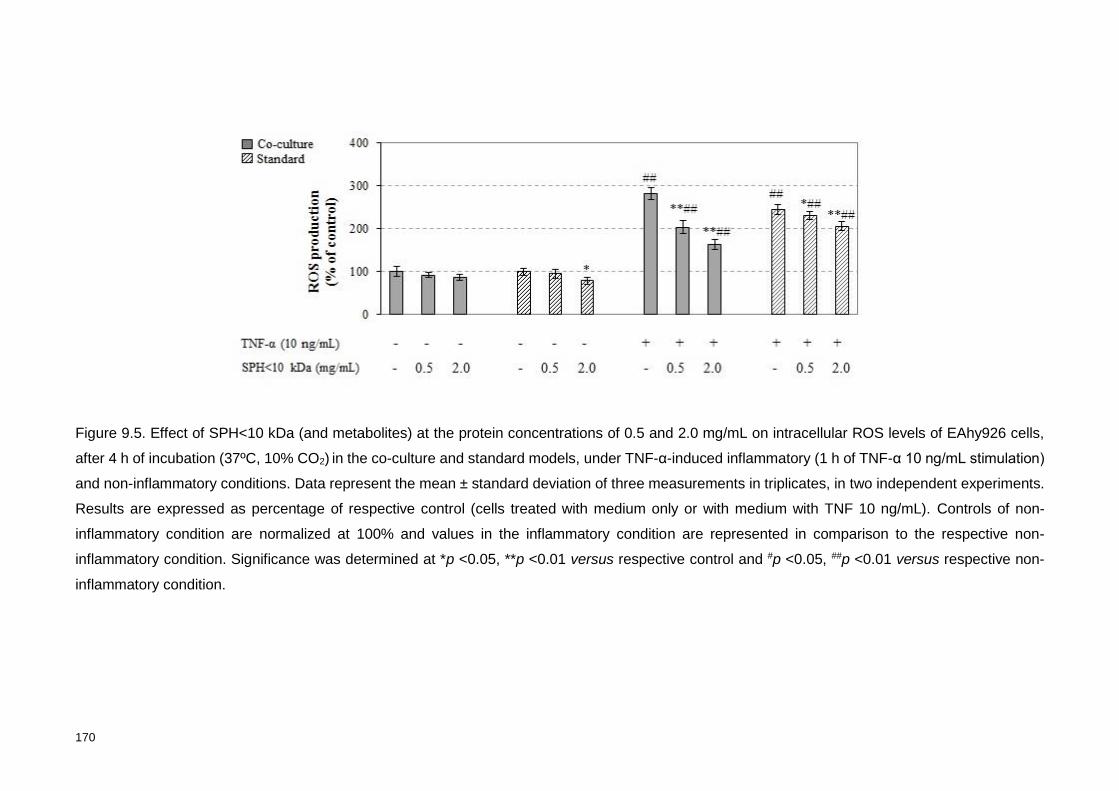
170
Figure 9.5. Effect of SPH<10 kDa (and metabolites) at the protein concentrations of 0.5 and 2.0 mg/mL on intracellular ROS levels of EAhy926 cells,
after 4 h of incubation (37ºC, 10% CO2) in the co-culture and standard models, under TNF-α-induced inflammatory (1 h of TNF-α 10 ng/mL stimulation)
and non-inflammatory conditions. Data represent the mean ± standard deviation of three measurements in triplicates, in two independent experiments.
Results are expressed as percentage of respective control (cells treated with medium only or with medium with TNF 10 ng/mL). Controls of non-
inflammatory condition are normalized at 100% and values in the inflammatory condition are represented in comparison to the respective non-
inflammatory condition. Significance was determined at *p <0.05, **p <0.01 versus respective control and #p <0.05, ##p <0.01 versus respective non-
inflammatory condition.

PART II. Chapter 9 Anti-inflammatory activity of a hydrolysate from canned sardine and brewing by-products through inhibition of TNF-a-induced endothelial dysfunction in a co-culture model of Caco-2 and endothelial cells
171
Figure 9.6. Effect of SPH<10 kDa (and metabolites) at protein concentrations of 0.5 and 2.0 mg/mL on the secretion of MCP-1 (A); VEGF (B); IL-8 (C) and ICAM-1
(D) in EAhy926 cells, after 4 h of incubation (37ºC, 10% CO2) in the co-culture and standard models, under TNF-α-induced inflammatory (1 h of TNF-α 10 ng/mL
stimulation) and non-inflammatory conditions. Data represent the mean ± standard deviation of three measurements in triplicates, in two independent experiments.
Results are expressed as percentage of respective control (cells treated with medium only or with medium with TNF 10 ng/mL). Controls of non-inflammatory condition
are normalized at 100% and values in the inflammatory condition are represented in comparison to the respective non-inflammatory condition. Significance was
determined at *p <0.05, **p <0.01 versus respective control and #p <0.05, ##p <0.01 versus respective non-inflammatory condition.

9.4. DISCUSSION
In this research, we demonstrated the antioxidant and anti-inflammatory effects of
SPH<10 kDa bioactive compounds on a monoculture and co-culture of an endothelial cell
line with an intestinal cell line. SPH<10 kDa bioactive compounds were prepared by
hydrolysis of sarcoplasmic proteins from sardine by-product with BSY proteases (251),
followed by simulated GI digestion. The UF and desalting steps of SPH digest were
necessary to remove background effects of the salts to the cells and to increase the peptide
content. In this work, the desalted SPH<10 kDa fraction was used to investigate its potential
anti-inflammatory activity through TNF-α stimulated cells. To date, the antioxidant and ACE-
I activities of SPH has been extensively studied (218), however, to our best knowledge, the
modulatory effects of these kind of hydrolysates against inflammatory reactions have not
yet been reported.
Endothelial dysfunction is an inflammatory process characterized by increased
oxidative stress and it is an important manifestation of cardiovascular diseases (285). In this
study, a validated in vitro co-culture model with epithelial and endothelial cells, representing
the intestinal epithelial layer and the adjacent endothelium (283), was used to investigate
the anti-inflammatory effects of SPH<10 kDa and compared with its impact on a
monoculture of endothelial cells. During the inflammatory process, NO was secreted by
eNOS over EA.hy926 cells in the co-culture and standard models. Excessive production of
NO by eNOS, which is up-regulated by inflammatory stimuli such as TNF-α, is considered
toxic and related to various inflammatory diseases (281), (286). Thus, inhibition of NO
secretion can attenuate inflammation and reduce cancer risk (286). The results obtained in
this work indicated enhanced bioactivity of SPH<10 kDa Caco-2 metabolites rather than the
compounds present in SPH<10 kDa. As suggested by other authors (282), in the course of
intestinal absorption, SPH<10 kDa may undergo metabolization by Caco-2 cells, resulting
in SPH<10 kDa metabolites at biological relevant concentrations and/ or with potential
higher anti-inflammatory activity. Moreover, changes in ROS and NO levels in the co-culture
model are the result of two important mechanisms: (i) direct impact by SPH<10 kDa
compounds that are transported (and metabolized) through Caco-2 cells and (ii) indirect
impact by cross-talk communication between intestinal and endothelial cell monolayers
(287).
The inflammatory processes is also regulated by the secretion of pro-inflammatory
mediators (263). NO may reduce endothelial expression of several inflammatory mediators
and adhesion molecules, whose up-regulation is linked to the pathogenesis of many
infectious and inflammatory diseases and cancer (285). In this work, ELISA was performed
to measure the concentrations of the pro-inflammatory cytokines MCP-1, VEGF, IL-8 and

173
ICAM-1. The inhibitory effects of SPH<10 KDa (and metabolites) on the expression of the
selected cytokines was evaluated in the co-culture and standard models, to further validate
the anti-inflammatory effects previously observed. Similar to observed by Toaldo et al.
(283), secretion of these pro-inflammatory molecules in the EAhy926 cells were largely
increased by induction of inflammation with TNF-α. For both cell culture models, treatment
with SPH<10 kDa inhibited the pro-inflammatory cytokines expression in a dose-dependent
manner. Treatment with 2.0 mg protein/mL SPH<10 kDa prompted a significant (p <0.01)
decrease in the expression of these inflammation markers. However, despite the significant
effect of 2.0 mg protein/mL SPH<10 kDa (and its metabolites) on the reducing secretion of
pro-inflammatory molecules in the co-culture and standard models, decreases on MCP-1,
VEGF, IL-8 and ICAM-1 concentrations in relation to TNF-α-treated control were markedly
higher in TNF-α treated cells controls. These findings suggest that SPH<10 KDa (and its
metabolites) operate through an inhibitory regulation of the inflammatory cascade in
endothelial cells. Direct incubation of endothelial cells with SPH<10 kDa (standard model)
reduced the expression of these pro-inflammatory molecules, but in a lesser extent. Thus,
it can be speculated that unknown intermediate metabolites with higher anti-inflammatory
potential were generated when SPH<10 kDa cross the Caco-2 cell monolayer.
9.5. CONCLUSIONS
Our findings demonstrated that besides the antioxidant and ACE-I activity previously
reported, the peptide fraction <10 kDa from sardine protein hydrolysate prepared by action
of brewer´s spent yeast proteases exhibited anti-inflammatory activity in TNF-α simulated
EAhy926 cells. This bioactivity was expressed through the inhibition of NO, ROS and pro-
inflammatory cytokines production (MCP-1, VEGF, IL-8 and ICAM-1). Results suggested
that the protective health effects of SPH<10 kDa may not only be due to bioactive
compounds composition, but also to their metabolites produced by the action of Caco-2 cell
peptidases in the course of intestinal absorption. Therefore, the co-culture model, which
combines the absorption by differentiated Caco-2 cells and sequential effects on endothelial
cells metabolism, may represent a more physiological and realistic approach compared with
in vivo conditions, allowing more accurate knowledge about the anti-inflammatory activity
of the SPH<10 kDa studied. To the best of our knowledge, this is the first report of the anti-
inflammatory activity exhibited by a SPH prepared by action of proteases extracted from
brewer´s spent yeast. This bioactive hydrolysate fraction could be used as an alternative
therapy for the prevention of inflammatory-related diseases. However, further exploration
174
of the SPH<10 kDa is required to fully explore its molecular composition, its mechanisms of
action and overall anti-inflammatory effects in vivo.
175
CHAPTER 10
Characterization of hydrolysates obtained from muscle
and viscera proteins of canned sardine by-products
_____________________
This chapter compares the biological activities and techno-
functional properties of different SPH prepared by BSY proteases and by
two commercial enzymes: Alcalase® and Neutrase®.

176

- PART II. Chapter 10 Characterization of hydrolysates obtained from muscle and viscera proteins of canned sardine by-products
177
ABSTRACT
Muscle and viscera proteins from canned sardine by-products were used as substrate to
obtain functional hydrolysates. Three enzymatic approaches, brewer´s spent yeast (BSY)
proteases, Alcalase® and Neutrase®, were applied to perform the hydrolysis at the same
proteolytic activity (1 U/mL), using an E/S ratio of 0.20:1 U/mg, at 50ºC and for 7 h.
Hydrolysis degree (DH), antioxidant and ACE-I activities, techno-functional properties and
colour were investigated. All hydrolysates presented a high protein content (52.7-83.2% dw)
and low fat content (0.9-3.9% dw). Alcalase® treatment of muscle and viscera proteins
resulted in higher DH (7.5 and 8.6%, respectively) and higher biological activities (p <0.05).
Although all hydrolysates had excellent solubility at pH 4-10 range (>52.7%) and possessed
techno-functional properties, treatment with BSY proteases was the approach that
promoted higher emulsion (80.1 m2/g), foaming (79.2%) and oil binding capacity (5.8 g/g)
of viscera sardine proteins. The hydrolysates produced in this study using the three
enzymatic treatments could potentially be used in food systems due to their improved
biological and techno-functional properties.
10.1. INTRODUCTION
Canned sardine by-products are commonly recognized as low-value resources, which
represent around 50% of the product catch (13), (213). Hence, sustainable exploitation of
these by-products is of major relevance. Production of SPH represents a good alternative
to obtain added value ingredients. Several efforts have been made in finding SPH with
antioxidant (16), (20), (209), (213), (215), (222), (223) and ACE-I activities (15), (288).
Additionally, SPH have also demonstrated excellent physicochemical and techno-functional
properties (20), (202), (213), (222), (223), (289). The nature of the protein substrate, the
specificity of the enzyme used and the conditions used during hydrolysis (time, temperature,
pH and E/S ratio), considerably influenced the molecular weight and amino acid
composition of bioactive peptides and thus, their biological and techno-functional properties
(103), (218).
Different SPH have been produced in recent years, the preferred commercial
enzymes for most researchers are industrial food-grade proteases, namely Alcalase® (5),
(6), (15), (20), (209), (211-213), (225); Flavourzyme® (211), Neutrase® (289) and
Protamex® (211), (214). Also, protease preparations of bacterial origin like Bacillus
licheniformis NH1 (15), (16), Aspergillus clavatus ES1 (15), (16), Bacillus pumilus A1 (222)
and Bacillus mojavensis A22 (222), as well as, crude enzyme extract from viscera of sardine
178
(209) have yielded good results. More recently, a SPH was also efficiently produced through
action of BSY proteases over sarcoplasmic proteins extracted from sardine by-products
(251). However, more studies are required concerning the hydrolysis of sardine muscle and
viscera proteins, because those proteins are more abundant in sardine by-products and
more resistant to hydrolysis. Comparison between biological and techno-functional
properties of SPH obtained by BSY proteases and from commercial proteases is also
required, since enzyme specificity has impact not only on molecular size of peptides and
DH, but also in the biological activities and techno-functional properties, such as solubility,
emulsifying, foaming and water binding capacity (218). Protein hydrolysates promote an oil-
in-water emulsion due their hydrophilic and hydrophobic groups and their charge (194).
However, extensive hydrolysis may result in poor techno-functional properties of
hydrolysates (218). Additionally, the colour of food hydrolysates is influenced by enzymatic
browning reactions and can influence the acceptability by consumers (194).
The objective of this work was to compare hydrolysates from muscle and viscera
sardine proteins obtained by BSY proteases and commercial Alcalase® and Neutrase®
with respect: (i) DH using the same proteolytic activity and hydrolysis conditions; (ii)
antioxidant and ACE-I activities; (iii) techno-functional properties, namely, solubility,
emulsifying, foaming, water-and oil-binding capacity and colour.
10.2. MATERIAL AND METHODS
10.2.1. Reagents and standards
Acetonitrile HPLC grade; trifluoroacetic acid (TFA); sodium dodecyl sulfate (SDS); bovine
serum albumin (BSA); 2,4,6-trinitrobenzenesulfonic acid (TNBS); L-leucine; 6-hydroxy-
2,5,7,8-tetramethylchroman-2-carboxylic acid (Trolox); iron (III) chloride hexahydrate; 2,4,6-
tripyridyl-s-triazine (TPTZ); 1,1-diphenyl-2-picrylhydrazyl (DPPH); commercial ACE (EC
3.4.15.1, 5.1 U/mg); Neutrase® (EC.3.4.24.28, ≥ 0.8 U/g); Alcalase® (EC 3.4.21.62, ≥ 2.4
U/g); soybean oil; low range of molecular weight standard (6.5-66 kDa) and the Millipore
UF membranes of 10 kDa were all obtained from Sigma-Aldrich (St. Louis, MO, USA). The
o-aminobenzoylglycyl-p-nitro-phenylalanylproline (o-ABz-Gly-Phe(NO2)-Pro) was
purchased from Bachem Feinchemikalien (Bubendorf, Switzerland). Ultrapure water was
obtained from a Seralpur Pro 90 CN water purification. All solutions were daily freshly
prepared.
- PART II. Chapter 10 Characterization of hydrolysates obtained from muscle and viscera proteins of canned sardine by-products
179
10.2.2. Equipments
SE-HPLC analysis were performed using a Gilson HPLC system (Gilson Medical
Electronics, France) equipped with a type 302 pump, a Gilson 118 variable wavelength
ultraviolet detector and a 7125 Rheodyne injector. The equipment was controlled by a
Gilson 712 software. Spectrophotometric analyses were carried out using a BMG
LABTECH´s SPECTROstar Nano-microplate, cuvette UV/Vis absorbance reader
(Offenburg, Germany). Fluorimetric analyses were carried out using a fluorescence
microplate reader (FLUOstar Optima, BMG Labtech GmbH). Samples were freeze-dried
with a Telstar® freeze dryer, Cryodos-80 model (Terrassa, Spain).
10.2.3. Sardine by-products and proteolytic enzymes
Sardines (Sardina pilchardus) by-products were provided by the canned industry Ramirez.
SA (Matosinhos, Portugal). By-products were immediately placed in ice and transported to
the laboratory, where flesh and viscera by-products were collected and separately washed
twice with cold pure water and stored in sealed plastic bags at -20°C.
Proteases from BSY (Saccharomyces pastorianus), supplied by Unicer Bebidas S.A.,
brewing (Leça do Balio, Portugal), were extracted as described by Vieira et al. (251).
Proteolytic activity, determined by Sigma’s non-specific protease assay method described
by Cupp-Enyard (164), was 1 U/mL. Commercially available enzymes were used at the
same activity levels of BSY proteases, 1 U/mL, to compare hydrolysis efficiencies. For this
purpose, Alcalase® and Neutrase® were diluted in the respective buffer, 100 mM Tris-HCl
pH 8.0 and sodium phosphate buffer pH 7.0, respectively.
10.2.4. Hydrolyses of muscle and viscera proteins
Muscle and viscera fractions were prepared separately. The muscle/ viscera (500 g) in 1000
mL pure water were first minced with an Ultraturax® for about 5 min and then cooked at
90°C for 20 min to inactivate the endogenous enzymes. This step was important to obtain
a partially defatted raw material and ensure the exclusively action of the added enzymes
and thus, the reproducibility of the process (225). After cold at room temperature and
centrifugation at 6,000 x g for 20 min; the upper lipid phase was removed manually and
discarded, and the suspensions were collected and filtered through a Whatman No. 4 filter
paper. The final clear supernatants were extracts of muscle proteins and viscera proteins.
For comparative effects, 50 mL of each muscle/ viscera protein extract was used for
enzymatic treatment, at the same protein concentration, 20 mg of protein/mL, based on
Bradford assay (171). The pH was adjusted to the pH optimum of each enzyme preparation:
BSY proteases (pH 6), Alcalase® (pH 8) and Neutrase® (pH 7). Hydrolysis was performed
using the E/S ratio of 0.20:1 U/mg (1 U/mL), at 50ºC for 7 h, under occasional stirring. No

180
pH control was chosen to avoid adding more salt to the hydrolysates (217). Control
experiments were also performed without enzyme addition and were referred as
MUSC.control and VISC.control. Hydrolyses were stopped at 80ºC for 15 min, 1 mL of each
hydrolysate was taken for determination of the DH. After cooling to room temperature, the
hydrolysates were centrifuged at 10,000 x g for 30 min to remove sludge and the oily fraction
and to collect the digested material. The clear supernatants were used for colour
measurements and further freeze-dried and stored at -20ºC for the other analysis. Triplicate
analyses were always performed. Muscle SPH were referred as MUSC.Bsy; MUSC.Alc and
MUSC.Ntr, according to the enzymatic preparation used (BSY protease extract, Alcalase®
and Neutrase®), respectively, whereas viscera SPH were referred as VISC.Bsy; VISC.Alc
and VISC.Ntr, respectively.
10.2.5. Determination of DH and molecular weight profile of hydrolysates
The degree of hydrolysis (DH), expressed as the percentage of peptides bonds hydrolysed,
was determined by the TNBS method described by Hsu et al. (238). Peptides molecular
weight distribution in muscle and viscera protein hydrolysates was analysed by SE-HPLC.
The column used was a PSS Proteema Analytical 100 Å column (Amersham Biosciences,
UK), equilibrated with 50 mM sodium phosphate buffer, 0.15 M NaCl, pH 6.6 at a flow rate
of 0.3 mL/min and calibrated using a standard mixture of 8 molecular weight markers, which
covered the range between 6.5 and 66 kDa. Aliquots of hydrolysates (0.1% w/v protein)
were dissolved in the mobile phase and an injection volume of 20 µL was used. Detection
was monitored at 214 nm and analyses were performed, at least, in triplicate.
10.2.6. Proximate Composition
The protein and fat composition of protein extracts (MUSC.control and VISC.control) and
lyophilized SPH was determined according to AOAC official methods (144). The total
nitrogen content was determined by Kjeldahl method and crude protein was estimated by
using the 6.25 factor. Fat content was determined by Soxhlet extraction with n-hexane for
12 h. All assays were performed in triplicate and the contents were expressed on a dry
weight basis (% dw).
10.2.7. Determination of antioxidant and ACE-I activities
Antioxidant and ACE-I activities of muscle and viscera SPH were evaluated using the same
protein concentration, 1.0 mg/mL. The DPPH radical-scavenging assay was performed as
described by Herald et al. (155) with slight modifications. Trolox was used as standard at
10-500 μM to generate a calibration curve. Results were expressed as micromole Trolox
equivalents per mL of hydrolysate (µM TE/mL). FRAP was performed according to the

- PART II. Chapter 10 Characterization of hydrolysates obtained from muscle and viscera proteins of canned sardine by-products
181
procedure of Jansen and Ruskovska (154). Trolox was also used as standard and results
were expressed as micromole Trolox equivalents per mL of hydrolysate (µM TE/mL). The
ACE-I activity was measured using the fluorimetric assay of Sentandreu and Toldrá (121)
with the modifications reported by Quiros et al. (122). IC50 was measured as the
concentration required to decrease the ACE activity by 50% (122).
10.2.8. Determination of techno-functional properties
The solubility of muscle and viscera SPH was evaluated over a wide range of pH value
(from pH 4 to 10) according to the procedure described by Tsumura et al. (290). The
emulsifying activity index (EAI) and the emulsion stability index (ESI) of the muscle and
viscera SPH were determined according to the method of Pearce and Kinsella (1978) (291),
with the modification of Khaled et al. (222). Soybean oil was used for emulsification and the
absorbance of the diluted solutions was measured at 500 nm. The absorbance of the diluted
samples measured immediately (A0) and 10 min after emulsion formation (A10) were used
to calculate the EAI and ESI, respectively, according to Pearce and Kinsella (291) and as
reported by Jemil et al. (223). The foam expansion (FE) and foam stability (FS) of the
muscle and viscera SPH were determined according to the method of Shahidi et al. (292),
with the modification of Khaled et al. (222). Water binding capacity (WBC) of the muscle
and viscera SPH was measured according to MacConnel et al. (293), as described by Jemil
et al. (223). Oil binding capacity (OBC) of the muscle and viscera SPH was measured
according to Lin et al. (294), as described by Jemil et al. (223).
10.2.9. Colour measurement
The colour parameters L*, a* and b* of muscle and viscera SPH were determined with a
tristimulus colorimeter (CR-400Chroma Meter, Konica Minolta, Japan), where L* defines
the lightness (0<L*<100) variation and parameters a* define the red (+) to green (-) and b*
the blue (-) to yellow (+) chromaticity. The equipment was set up for illuminant D65 with 10º
observer angle and calibrated using a standard white plate. Sample was filled in a 64 mm
glass sample cup with three readings in the same place and triplicate determinations were
taken per sample.
10.2.10. Statistical analysis
Data were presented as mean ± standard deviation values from three independent
experiments. Statistical comparisons were performed by one-way analysis of variance
(ANOVA) followed by the Duncan’s multiple comparison test. Difference was considered
significant at p <0.05. All statistical calculations were performed using SPSS 22.0 (SPSS
software, Chicago, U.S.A.).

182
10.3. RESULTS AND DISCUSSION
10.3.1. DH and molecular weight distribution profile of SPH
Alcalase® was the most efficient enzyme to hydrolyse muscle and viscera proteins.
The DH of MUSC.Alc and VISC.Alc were 7.5% and 8.6, respectively; whereas MUSC.Ntr
and VISC.Ntr presented DH of 6.5% and 7.8%, respectively. Lower DH was obtained when
hydrolyses were performed by BSY proteases, since DH were 5.0% and 5.8% for muscle
and viscera SPH, respectively. Concerning the Alcalase® treatments, the DH values
obtained in this work were in the same range of reported in the literature (15), (16), (20),
(213). Similarly to that observed by Quaglia et al. (289), Alcalase® exhibited higher
hydrolytic activities than Neutrase® although, the DH values reported in this study were
different because different procedures were used to prepare the protein substrates form
sardine by-products, and different hydrolysis conditions were applied.
Muscle and viscera proteins presented relatively large molecular mass proteins,
ranging from 29 and 97 kDa (results not shown), which was in agreement with Klomklao et
al. (199) and Chaijan et al. (196), that describe myosin (~96 kDa), myoglobin (~47 kDa) and
actin (~45 kDa) as the major proteins found in these extracts. As depicted in Figure 10.1,
different molecular weight distribution profiles were obtained depending on the protein
substrate and enzyme used. Alcalase® treatment produced MUSC.Alc and VISC.Alc SPH
with higher content of peptides with molecular weight below 14 kDa. Souissi et al. (20) also
reported the presence of peptides with a molecular mass below 14.2 kDa in SPH prepared
by Alcalase®. Neutrase® produced muscle and viscera SPH containing higher amount of
protein fragments with molecular weight between 24 and 36 kDa.
10.3.2. Protein and lipid content of SPH
All hydrolysates presented high protein content, although muscle SPH contained
higher protein content (MUSC.Bsy - 69.5%; MUSC.Alc -83.2% and MUSC.Ntr - 79.8%) than
viscera SPH (VISC.Bsy - 58.2%; VISC.Alc - 63.4% and VISC.Ntr - 52.7%). All hydrolysates
presented low lipid content (ranging between 0.9-3.9%). A reduced lipid content was also
reported for other SPH (20), (211), (222), (223). In general, the high protein content and low
fat content of all SPH may provide an incentive for use in commercial preparations.

- PART II. Chapter 10 Characterization of hydrolysates obtained from muscle and viscera proteins of canned sardine by-products
183
Figure 10.1. SE-HPLC profiles of muscle (MUSC) and viscera (VISC) SPH produced by
Brewer´s spent yeast proteases (Bsy), Alcalase® (Alc) and Neutrase® (Ntr) action.
Hydrolyses were performed at 50ºC for 7 h, using an E/S ratio of 0.20:1 U/mg (1 U/mL).
SPH were analyzed at same protein concentration (0.1% w/v protein), using 20 µL of this
solution to the column. Absorbance (214 nm) is expressed in arbitrary units (AU). Molecular
weight markers: Albumin (66 kDa), Ovalbumin (45 kDa), Glyceraldehyde-3-phosphate
dehydrogenase (36 kDa), Carbonic anhydrase (29 kDa), Trypsinogen (24 kDa), Trypsin
inhibitor (20 kDa), α-Lactalbumin (14.2 kDa) and Aprotinin (6.5 kDa).
184
10.3.3. Determination of antioxidant and ACE-I activities
According to Table 10.1, among the muscle SPH, MUSC.Alc exhibited the highest (p
<0.05) DPPH value (870 µM TE/mL), followed by MUSC.Ntr (780 µM TE/mL) and
MUSC.Bsy (360 µM TE/mL). Among the viscera SPH, VISC.Alc also exhibited the highest
(p <0.05) DPPH value (840 µM TE/mL), but VISC.BSY (780 µM TE/mL) presented highest
antioxidant activity than VISC.Ntr (660 µM TE/mL).
Regarding to FRAP results, Alcalase® and Neutrase® were more efficient to
hydrolyse the muscle sardine proteins, whereas Alcalase® was more efficient to hydrolyse
the viscera sardine proteins (p <0.05), leading to the different products with varying
antioxidant activity (Table 10.1). The results obtained suggest that all SPH contained some
peptides that were electron donors and could react with free radicals to convert them to
more stable products (213), (295). Similar to suggested by Medina et al. (213), the
differences in antioxidant activities between SPH from sardine by-products might be
associated with the differences in size of proteins or peptides, previously discussed based
on Figure 10.1, as well, with the high hydrophobic amino acid composition.
The ACE-I activity of muscle and viscera SPH was also analysed; the amount of
hydrolysate required to inhibit 50% of the ACE activity (IC50) is shown in Table 10.1.
Compared to respective unhydrolysed proteins (MUSC.control and VISC. control), all the
SPH presented enhanced ACE-I activity, although it was markedly different depending on
the enzyme used. Muscle SPH prepared by Alcalase® exhibited the highest (p <0.05) ACE-
I activity, IC50 of 619 µg/mL, followed by the Neutrase® hydrolysates (735 µg/mL) and the
BSY proteases hydrolysate (984 µg/mL). VISC.Ntr presented the highest (p <0.05) ACE-I
activity, 550 µg/mL, among the viscera SPH. Although values of IC50 for ACE-I activity of
muscle and viscera SPH had been previously reported by other authors, comparisons with
IC50 values in the present study were not fully possible due to the different methodology
employed for measuring this biological activity. However, Bougatef et al. (15) reported IC50
values in the concentration range of 1200-7400 µg/mL for SPH prepared with different
proteases, whereas the IC50 found for Alcalase® treatment was 2300 µg/mL. More recently,
Moreno et al. (288) reported IC50 values in the range of 439-442 µg/mL for SPH prepared
with combined enzymatic treatments of Subtilisin® and Trypsin®.
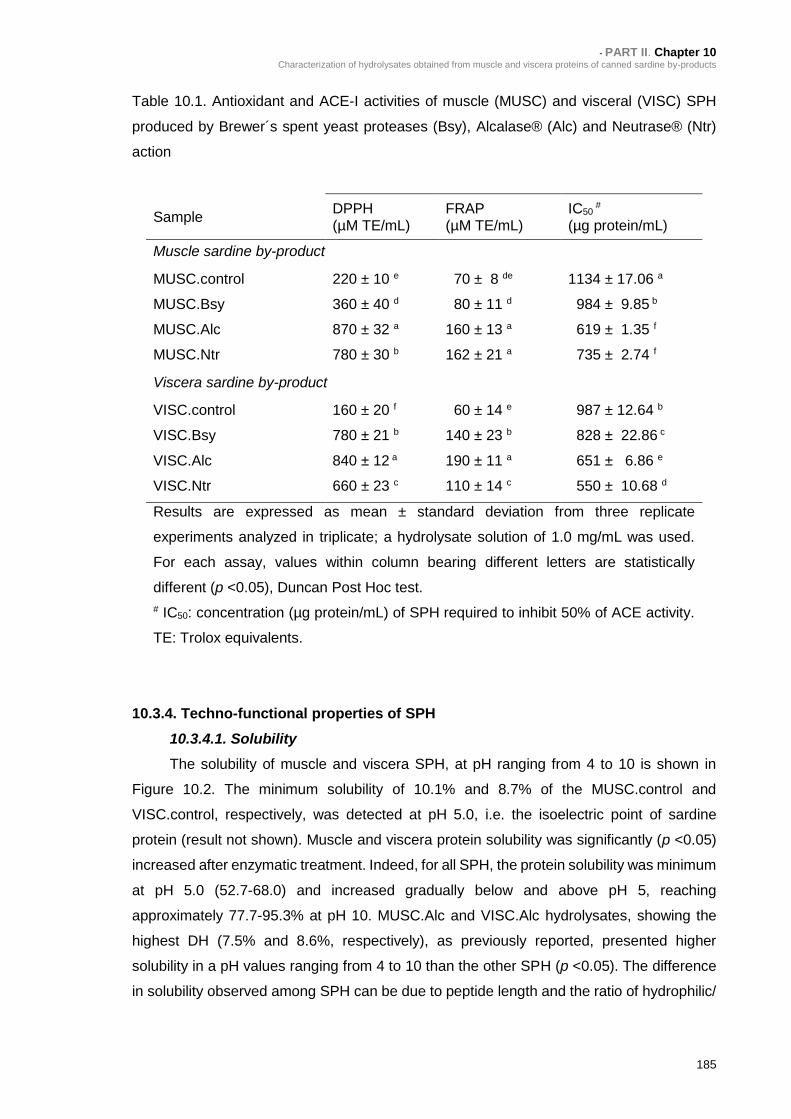
- PART II. Chapter 10 Characterization of hydrolysates obtained from muscle and viscera proteins of canned sardine by-products
185
Table 10.1. Antioxidant and ACE-I activities of muscle (MUSC) and visceral (VISC) SPH
produced by Brewer´s spent yeast proteases (Bsy), Alcalase® (Alc) and Neutrase® (Ntr)
action
Sample DPPH (µM TE/mL)
FRAP (µM TE/mL)
IC50 #
(µg protein/mL)
Muscle sardine by-product
MUSC.control 220 ± 10 e 70 ± 8 de 1134 ± 17.06 a
MUSC.Bsy 360 ± 40 d 80 ± 11 d 984 ± 9.85 b
MUSC.Alc 870 ± 32 a 160 ± 13 a 619 ± 1.35 f
MUSC.Ntr 780 ± 30 b 162 ± 21 a 735 ± 2.74 f
Viscera sardine by-product
VISC.control 160 ± 20 f 60 ± 14 e 987 ± 12.64 b
VISC.Bsy 780 ± 21 b 140 ± 23 b 828 ± 22.86 c
VISC.Alc 840 ± 12 a 190 ± 11 a 651 ± 6.86 e
VISC.Ntr 660 ± 23 c 110 ± 14 c 550 ± 10.68 d
Results are expressed as mean ± standard deviation from three replicate
experiments analyzed in triplicate; a hydrolysate solution of 1.0 mg/mL was used.
For each assay, values within column bearing different letters are statistically
different (p <0.05), Duncan Post Hoc test.
# IC50: concentration (µg protein/mL) of SPH required to inhibit 50% of ACE activity.
TE: Trolox equivalents.
10.3.4. Techno-functional properties of SPH
10.3.4.1. Solubility
The solubility of muscle and viscera SPH, at pH ranging from 4 to 10 is shown in
Figure 10.2. The minimum solubility of 10.1% and 8.7% of the MUSC.control and
VISC.control, respectively, was detected at pH 5.0, i.e. the isoelectric point of sardine
protein (result not shown). Muscle and viscera protein solubility was significantly (p <0.05)
increased after enzymatic treatment. Indeed, for all SPH, the protein solubility was minimum
at pH 5.0 (52.7-68.0) and increased gradually below and above pH 5, reaching
approximately 77.7-95.3% at pH 10. MUSC.Alc and VISC.Alc hydrolysates, showing the
highest DH (7.5% and 8.6%, respectively), as previously reported, presented higher
solubility in a pH values ranging from 4 to 10 than the other SPH (p <0.05). The difference
in solubility observed among SPH can be due to peptide length and the ratio of hydrophilic/

186
hydrophobic peptides (20). In general, the high solubility of SPH indicates potential
applications in formulated food systems (20), (218).
Figure 10.2. Solubility profiles of muscle (MUSC) and visceral (VISC) SPH as a function of
pH (4-10 range) obtained by treatment with Brewer´s spent yeast proteases (Bsy),
Alcalase® (Alc) and Neutrase® (Ntr) action. Results are expressed as means ± standard
deviation from triplicate determinations; a solution of 10 mg/mL was used.
10.3.4.2. Emulsifying properties
The EAI and ESI of MUSC.control and VISC.control and respective SPH at the
concentrations of 0.1% (m/v) are shown in Table 10.2. This concentration was chosen
because is referred to the minimum concentration needed to obtain reproducible results for
the emulsifying properties (291). All SPH present enhanced emulsion properties compared
to the respective undigested sardine proteins, MUSC.control (EAI=13.5 m2/g) and
VISC.control (EAI=15.2 m2/g). However, a different trend was observed when the hydrolysis

- PART II. Chapter 10 Characterization of hydrolysates obtained from muscle and viscera proteins of canned sardine by-products
187
was promoted for both protein sources, which indicate that emulsifying properties is
influenced by the enzyme used and the protein substrate, which affects the nature of
peptides produced during hydrolysis. Concerning to muscle SPH, MUSC.Alc and MUSC.Ntr
presented significantly (p <0.05) higher EAI (81.6 m2/g and 78.8 m2/g, respectively) than
MUSC.Bsy (54.5 m2/g), suggesting that commercial enzymes are more efficient in the
reducing of the hydrophobicity and changes in peptide size during hydrolysis to promote
higher oil-in-water emulsions of both substrates. It is reported that peptides should have a
minimum of 20 residues to exhibit good emulsifying and interfacial properties (218). Thus,
the higher emulsifying properties observed for MUSC.Alc and MUSC.Ntr are in agreement
with the higher levels of peptides with MW below 14 kDa (Figure 10.1), as previously
discussed. Regarding, viscera SPH, results suggest the emulsifying capacity decreased
with the increase in DH. VISC.Alc with the highest DH (8.6%) presented the lowest EAI
(78.8 m2/g), whereas VISC.Bsy with a DH of 5.8%, presented the highest EAI, 80.1 m2/g.
Quaglia and Orban (202) reported a 1.5- to 2-fold reduction in the emulsifying capacity of
the Alcalase® SPH by increasing DH from 5% to 20%. The turbidimetric method was also
used to evaluate the emulsion stability, expressed as ESI, results are present in Table 10.2.
The most stable emulsion of muscle and viscera SPH was obtained after hydrolysis with
Alcalase®, with a stability of 66.8% and 38.5%, respectively.
10.3.4.3. Foaming properties
The FE and FS of muscle and viscera SPH at the concentration of 0.1% (m/v) are
shown in Table 10.2. Results showed that all muscle and viscera SPH presented an
improved foaming activity when compared to respective unhydrolysed proteins (MUSC.
control and VISC.control). The foaming capacity of MUSC.bsy; MUSC.Alc and MUSC.Ntr
were 57.9%, 87.4% and 77.1%, respectively, whereas it was only 25.8% for MUSC.control.
The foaming capacity of VISC.Bsy; VISC.Alc and VISC.Ntr were 79.2%, 77.5% and 59.7%,
respectively, significantly (p <0.05) higher than VISC.control, 27.5%. Native muscle and
viscera sardine proteins have limited foaming due to its quaternary and tertiary structure,
whereas resulting hydrolysates may lost the tertiary structure, leading to improved foam
activity. Lower foaming properties of MUSC.Bsy and VISC.Ntr can be explained by the small
size of peptides and also by the apparition of hydrophilic peptides during hydrolysis. This is
in line with previous findings reporting decreasing foaming properties with reduced peptide
size (20), (218). Further experiment on foam expansion after whipping was monitored for
30 min to study the foam stability of muscle and viscera SPH. As shown in Table 10.2, the
FS was markedly decreased for all SPH. At a concentration of 0.1%, the foaming
capabilities after 30 min of MUSC.bsy; MUSC.Alc and MUSC.Ntr were 39.7%, 66.8% and
59.7%, respectively. The foam properties of VISC.Bsy; VISC.Alc and VISC.Ntr were 41.5%,

188
38.5% and 34.5%, respectively. The trend of increased foaming activity coupled with
decreased foaming stability has been reported in previous studies for other kind of SPH
(20), (222), (223).
10.3.4.4. Water Binding Capacity (WBC)
The WBC of muscle and viscera SPH is shown in Table 10.2. The WBC of all SPH
was significantly (p <0.05) higher compared to the unhydrolyzed substrates. For muscle
SPH, the WBC decreased from an initial value of 1.4 g/g (MUSC.control) for 4.3, 6.9 and
5.6 g/g after hydrolysis with BSY proteases, Alcalase® and Neutrase®, respectively. For
viscera SPH, VISC.Alc showed a significantly (p <0.05) higher WBC, 7.3 g/g, compared
with the other two enzymatic treatments. From these results, the higher DH, observed for
treatment with Alcalase®, appear to affect greater WBC. Other authors also showed
increased WBC of SPH as peptide molecular weights decreased (223), (218). In general,
the high WBC of muscle and viscera SPH prepared by action of BSY protease and
commercial enzymes, Alcalase® and Neutrase®, suggest that all SPH could be used as
techno-functional ingredients in food formulations to modify texture and viscosity, to reduce
dehydration during storage, and to reduce energetic value.
10.3.4.5. Oil Binding Capacity (OBC)
As shown in Table 10.2, muscle and viscera SPH exhibited OBC, greater than
undigested muscle and viscera proteins (MUSC.control and VISC.control). The higher OBC
values for SPH might be attributed to the exposure of hydrophobic groups after enzymatic
hydrolysis, allowing the physical entrapment of oil (296). MUSC.Bsy and VISC.Bsy
presented the highest (p <0.05) OBC, 5.4 and 5.8 g/g, respectively; while muscle and
viscera SPH prepared by the commercial enzymes Alcalase® and Neutrase®, showing the
highest DH, presented the lowest OBC. Some authors reported that OBC of protein
hydrolysates decreased with increasing DH (194) while others authors suggested no
correlation between the OBC and DH of protein hydrolysates (20). The ability of peptides to
bind fat influences food product taste, which is especially important in both meat and
confectionery industries (218).

- PART II. Chapter 10 Characterization of hydrolysates obtained from muscle and viscera proteins of canned sardine by-products
189
Table 10.2. Techno-functional properties and colour of muscle (MUSC) and visceral (VISC) SPH obtained by treatment with Brewer´s spent yeast
proteases (Bsy), Alcalase® (Alc) and Neutrase® (Ntr)
Parameter MUSC.control MUSC.Bsy MUSC.Alc MUSC.Ntr VISC.control VISC.Bsy VISC.Alc VISC.Ntr
EAI (m2/g) # 13.5 ± 0.30 g 54.5 ± 0.89 e 81.6 ± 0.75 a 77.0 ± 1.51 c 15.2 ± 0.30 f 80.1 ± 1.56 ab 78.8 ± 1.51 bc 66.3 ± 0.89 d
ES (min) # 0.7 ± 0.08 g 27.3 ± 1.34 e 68.4 ± 0.94 a 57.9 ± 1.16 b 1.5 ± 0.12 f 45.6 ± 4.25 d 50.4 ± 1.15 c 44.4 ± 0.30 d
FE (%) # 25.8 ± 0.35 f 57.9 ± 1.76 e 87.4 ± 0.60 a 77.1 ± 2.04 c 27.5 ± 0.35 f 79.2 ± 0.60 ab 77.5 ± 0.92 bc 59.7 ± 1.76 d
FS (%) # 4.5 ± 1.15 f 39.7 ± 0.88 e 66.8 ± 0.75 a 59.7 ± 1.36 b 5.8 ± 0.15 f 41.5 ± 0.89 d 38.5 ± 0.89 c 34.5 ± 4.30 d
WBC (g/g) 1.4 ± 0.07 h 4.3 ± 0.27 f 6.9 ± 0.12 b 5.6 ± 0.04 d 1.9 ± 0.15 g 4.8 ± 0.33 e 7.3 ± 0.08 a 6.1 ± 0.08 c
OBC (g/g) 0.8 ± 0.02 e 5.4 ± 0.19 b 4.8 ± 0.19 c 4.6 ± 0.05 c 1.4 ± 0.03 d 5.8 ± 0.23 a 5.5 ± 0.19 b 5.4 ± 0.20 b
L* 53.4 ± 0.02 b 49.5 ± 0.01 f 49.9 ± 0.10 ef 50.1 ± 0.01 de 55.1 ± 0.59 a 51.2 ± 0.08 c 50.1 ± 0.03 de 50.3 ± 0.05 d
a* 0.31 ± 0.01 b 0.32 ± 0.01 b 0.16 ± 0.02 d 0.37 ± 0.02 a 0.07 ± 0.00 e 0.09 ± 0.03 e 0.08 ± 0.02 e 0.26 ± 0.02 c
b* 3.23 ± 0.02 g 3.45 ± 0.02 f 4.31 ± 0.02 d 5.52 ± 0.01 b 3.46 ± 0.01 f 4.24 ± 0.01 e 5.35 ± 0.02 c 7.37 ± 0.01 a
Values are given as mean ± standard deviation from three replicate experiments analyzed in triplicate. For each parameter, values with different letters
in the same line are statistically different (p <0.05), Duncan Post Hoc test. Emulsifying activity index (EAI; m2/g); Emulsifying stability (ES; min);
Foaming Expansion (FE; %); Foaming Stability (FS, %), Water Binding Capacity (WBC; g/g); Oil binding capacity (OBC; g/g); MUSC.control,
undigested muscle protein from sardine by-product; VISC.control, undigested viscera protein from sardine by-product. Muscle (MUSC) and visceral
(VISC) SPH were obtained by treatment with brewer´s spent yeast extract proteases (Bsy), Alcalase® (Alc) and Neutrase® (Ntr) at 50ºC for 7 h, using
an E/S ratio of 0.20:1 U/mg (1 U/mL). # a solution at 0.1% (m/v) was used.

190
10.3.5. Colour of SPH
As presented in Table 10.2, all hydrolysis resulted in increased enzymatic browning
reactions which are assumed to have contributed to the reduction in the luminosity, giving
a darker colour in muscle and viscera SPH. These results indicate that colour of SPH is
influenced by the enzyme used, as well, the protein substrate. Among muscle SPH,
MUSC.Bsy was the darkest (L* = 49.5) and least yellowish (b* = 3.45), whereas among the
viscera SPH, VISC.Bsy was the lighter (L* = 51.2) and least yellowish (b* = 4.240).
Neutrase® with a dark colour contributed to the brownish colour of the resulting SPH:
MUSC.Ntr (b* = 5.52) and VISC.Ntr (b* = 7.37).
10.4. CONCLUSIONS
The results of this study indicate that muscle and viscera SPH obtained by different
proteases exhibited biological and techno-functional properties that make them useful
ingredients for food industry. Under similar hydrolysis conditions, Alcalase® was the most
appropriate protease to produce muscle and viscera SPH, presenting higher antioxidant
and ACE-I activities. By contrast, lower biological activity was found using BSY proteases.
Further work should be done to concentrate and identify the bioactive peptides from muscle
and viscera SPH and determine their biological activities in vivo. On the other hand, viscera
SPH obtained using BSY proteases presented higher emulsion, foaming and oil binding
properties, as well as, lighter colour, indicating that the use of two industry by-products,
BSY and viscera protein from sardine by-products, can be applied to obtain an ingredient
with specific techno-functional characteristics. However, the sensory evaluation of these
SPH is obligatory for the consumer acceptance and to find compatible food matrices to add
this functional ingredient.
191
PART III
“Brewer´s spent grain protein hydrolysates”
_____________________
Chapter 11
Literature review
Development of brewer´s spent grain protein hydrolysates and their health promoting
ability
Chapter 12
Valorisation of Brewers’ spent grain and spent yeast through protein hydrolysates with
antioxidant properties
Chapter 13
Antioxidant and ACE inhibitory activities of hydrolysates of brewers' spent grain proteins
by proteases from spent yeast or by commercial enzymes: protective capacity in Caco-2
and HepG2 cells

192

193
CHAPTER 11
Literature review
Development of brewer´s spent grain protein
hydrolysates and their health promoting ability
_____________________
This chapter presents a literature overview of the BSG nutritional
characteristics and applications, it also describes the typical enzymatic
process adopted for the manufacturing of BSG protein hydrolysates and
the main biological activities reported

194

PART III. Chapter 11 Literature review
Development of brewer´s spent grain protein hydrolysates and their health promoting ability
195
11.1. Brewer`s spent grain by-product: characteristics and potential applications
Barley malt is one of the main ingredients in the manufacturing of beer. The grain is
rich in starch and proteins and consists of three main parts: the embryo, the endosperm
(comprising the aleurone and starch) and the grain coverings (comprising the seed coat
layers, pericarp and husk), as presented in Figure 11.1.A. During brewing, the nutrients
from the malt necessary to produce the wort are solubilized, remaining the water insoluble
proteins and the cell wall residues of the husk, pericarp and seed coat, which are referred
as brewer´s spent grain (BSG). Thus, BSG is defined as the “husk-pericarp-seed coat layers
that covered the original barley grain”, essentially composed by cellulose and non-cellulosic
polysaccharides, lignin, proteins and some lipids (Figure 11.1.B). BSG also contains much
of the phenolic components of the barley grain, including ferulic acid, p-coumaric acid,
sinapic acid and caffeic acid (297), (298), (299).
Figure 11.1. Schematic structure of a barley grain (A) and the BSG (B).
Chemical composition of BSG is widely described in literature (2), (4), (297), (300-
302). It is influenced by several parameters, namely the barley variety, the harvest time, the
malting and mashing conditions, as well as, the quality and type of adjuncts added in the
brewing process (297). BSG is mainly composed by ~15 to 26% of proteins (rich in
glutamine and with high biological value) and ~70% of fibers (~15-25% of cellulose; ~28-
35% of hemicelluloses, mostly arabinoxylans, and ~28% of lignin). Lipids (3.9-10%), ash
(2.5-4.5%), vitamins, minerals (mainly calcium, phosphorus and selenium), amino acids and
(A) (B)
196
phenolic compounds (mainly hydroxycinnamic acids as ferulic and p-coumaric) are present
in lower quantities (22), (303), (304).
The use of BSG is still limited, being almost used as land fill or for animal feed
(providing all the essential amino acids and fiber). However, given its production in large
quantities throughout the year at relative low cost, and its nutritional and functional
characteristics, BSG is a by-product of great interest for the sectors of biotechnology, food
and pharmaceutical industries (4), (6), (302). Indeed, several efforts have been made in
using BSG for microorganism’s cultivation and extraction of added-value compounds,
namely sugars, proteins, amino acids and antioxidants. BSG was also found to be
applicable in enzymes production, as adsorbent for removing organic materials from
effluents and immobilization of various substances (2), (305). Moreover, BSG protein
isolates and hydrolysates can be used as food texture enhancers due to their emulsifying
properties (7), (8) and may present antimicrobial (306), antioxidant (307), (308), anti-
inflammatory (307) and ACE-I activities (253), (309). BSG is also considered a major
biomass resource for the production of second generation biofuels, it can be used for
ethanol production using a bioconversion process (305). Table 11.1 summarizes the
proximate composition of BSG and its potential applications.

PART III. Chapter 11 Literature review
Development of brewer´s spent grain protein hydrolysates and their health promoting ability
197
Table 11.1. Proximate composition (% dw) and potential applications of BSG
Compound % dwa Potential application Function Reference
Proteins - hordeins A,B,C - albumins - glutenins
~15-26 (~50) (~2)
- Animal feed
- addition of RUPc to lactating cows diet to increase milk yield
(305), (310)
- Human nutrition (dietary fibre-rich and protein-rich flours)
- promotion of nutritional value of bakery products - cholesterol decrease - intestinal digestion benefit
(301), 310), (311)
- Substrate for microorganisms` growth
- growth and sporulation enhancement
(312)
- Production of BSG protein concentrates/isolates
- phenolic source - antioxidant activity - ACE-I activity - techno-functional properties
(308), (309) (7), (8) (4), (299)
- Production of BSG protein hydrolysates with functional and bioactive properties
- antioxidant activity - anti-inflammatory activity - immunomodulatory activity - ACE-I activity
(307), (313) (306), (253)
Fiber - cellulose - hemicellulose - lignin
~70 (~15-25) (~28-35)b (~28)
- Extraction of arabinoxilans - immunomodulatory activity - prebiotic activities
(314), (315) (316)
a Chemical composition (% dw) as reported by (4) and (308). b Mostly represented by arabinoxilans. c Rumen undegradable protein.

198
Table 11.1. Proximate composition (% dw) and potential applications of BSG (continued)
Compound % dwa Potential application Function Reference
Polysaccarides - β glucan - starch
12 - Production of β glucan extracts
- cholesterol decrease - insulin response
(317), (318)
Phenolics - ferulic acid - p-coumaric acid - caffeic acid - sinapic acid
~1.7%
- Production o phenolic extracts - antioxidant activity
- anti-carcinogenic activity - anti-atherogenic activity - anti-inflammatory activity
(298), (303) (299), (302) (319), (320) (321)
Lipids 3.9-10 - Oil extraction (22)
Minerals 2.5-4.5 - Calcium, phosphorus, selenium supplements
(22)
Other applications
- Production of charcoal; production of lactic acid; production of xylitol and pullulan; substrate for enzyme production - Additive or carrier in brewing; production of energy and biogas; production of constructing bricks; paper manufacture; adsorbent
(297), (305) (100)
a Chemical composition (% dw) as reported by (4) and (308).
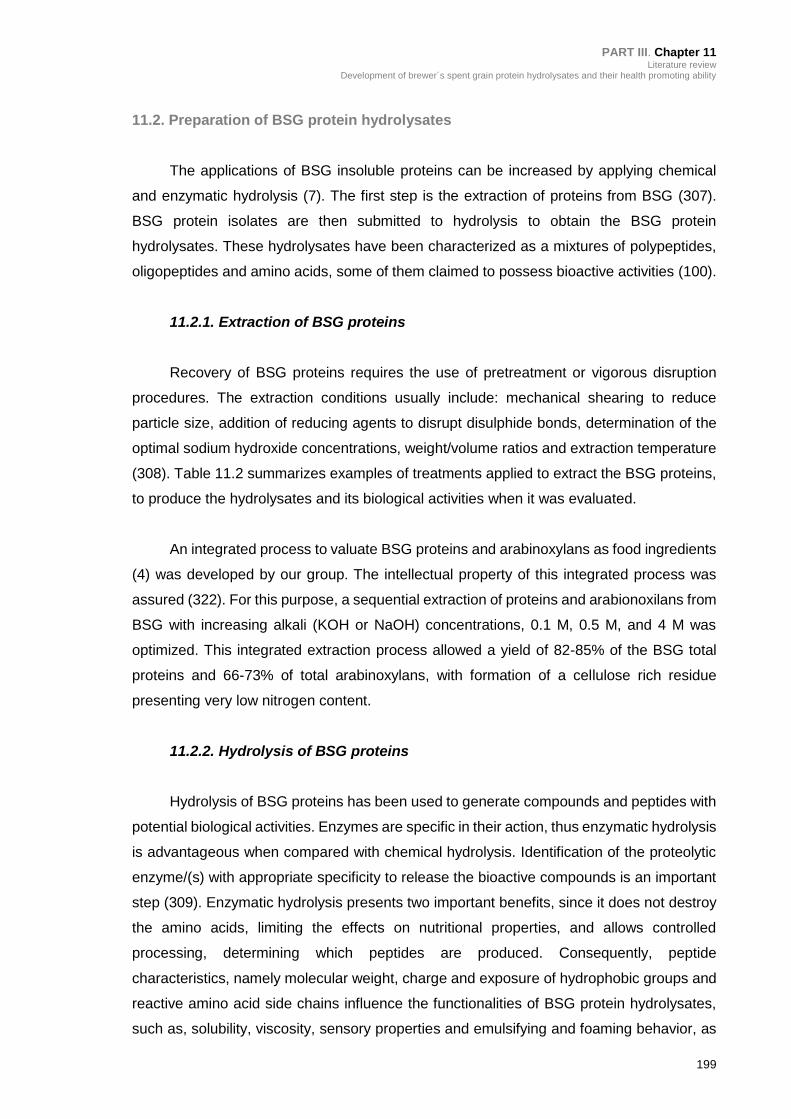
PART III. Chapter 11 Literature review
Development of brewer´s spent grain protein hydrolysates and their health promoting ability
199
11.2. Preparation of BSG protein hydrolysates
The applications of BSG insoluble proteins can be increased by applying chemical
and enzymatic hydrolysis (7). The first step is the extraction of proteins from BSG (307).
BSG protein isolates are then submitted to hydrolysis to obtain the BSG protein
hydrolysates. These hydrolysates have been characterized as a mixtures of polypeptides,
oligopeptides and amino acids, some of them claimed to possess bioactive activities (100).
11.2.1. Extraction of BSG proteins
Recovery of BSG proteins requires the use of pretreatment or vigorous disruption
procedures. The extraction conditions usually include: mechanical shearing to reduce
particle size, addition of reducing agents to disrupt disulphide bonds, determination of the
optimal sodium hydroxide concentrations, weight/volume ratios and extraction temperature
(308). Table 11.2 summarizes examples of treatments applied to extract the BSG proteins,
to produce the hydrolysates and its biological activities when it was evaluated.
An integrated process to valuate BSG proteins and arabinoxylans as food ingredients
(4) was developed by our group. The intellectual property of this integrated process was
assured (322). For this purpose, a sequential extraction of proteins and arabionoxilans from
BSG with increasing alkali (KOH or NaOH) concentrations, 0.1 M, 0.5 M, and 4 M was
optimized. This integrated extraction process allowed a yield of 82-85% of the BSG total
proteins and 66-73% of total arabinoxylans, with formation of a cellulose rich residue
presenting very low nitrogen content.
11.2.2. Hydrolysis of BSG proteins
Hydrolysis of BSG proteins has been used to generate compounds and peptides with
potential biological activities. Enzymes are specific in their action, thus enzymatic hydrolysis
is advantageous when compared with chemical hydrolysis. Identification of the proteolytic
enzyme/(s) with appropriate specificity to release the bioactive compounds is an important
step (309). Enzymatic hydrolysis presents two important benefits, since it does not destroy
the amino acids, limiting the effects on nutritional properties, and allows controlled
processing, determining which peptides are produced. Consequently, peptide
characteristics, namely molecular weight, charge and exposure of hydrophobic groups and
reactive amino acid side chains influence the functionalities of BSG protein hydrolysates,
such as, solubility, viscosity, sensory properties and emulsifying and foaming behavior, as
200
well, the biological activities (7). As summarized in Table 11.2., BSG has been hydrolyzed
by proteases from different sources: animal (Corolase PP, Trypsin, Pepsin); vegetal
(Corolase L10, Promod 144MG); and microbial (Alcalase 2.4L, Flavourzyme 500 L,
Protex6L, Protamex, Promod 24P, Promod 439, Prolyve 1000).
11.3. Biological properties of BSG protein hydrolysate
Due their biological activities, BSG protein isolates and BSG protein hydrolysates
have numerous applications in human nutrition, including protein supplementation of
geriatric and sports nutrition products, energy drinks and weight-loss diets for clinical
applications (as treatment of Crohn's disease, liver disease and ulcerative colitis) (307). The
composition of BSG isolates and hydrolysates in bioactive peptides, amino acids, vitamins
and phenolic compounds may explain the bioactivities observed.
Ferulic acid and p-coumaric acid are present at relatively high concentrations in BSG;
1860-1948 mg/g dw and 565-794 mg/g dw, respectively (323). These compounds are
mainly present in the bound form, requiring strong alkali or hydrolytic enzymes for their
solubilisation (304) and show antioxidant, anti-inflammatory, anti-atherogenic and anti-
cancer bioactivities (302). On the other hand, given the prevalence of proline and alanine
residues within the amino acid sequences of BSG proteins, it is likely that peptides with high
ACE and DPP-IV inhibitory activities could be released during BSG protein hydrolysis (309).
The most relevant properties recognized in BSG protein isolates and hydrolysates are:
antioxidant, anti-inflammatory, ACE-I, α-glucosidase inhibitory and DPP-IV inhibitory
activities. Table 11.2 also summarizes the main biological activities assessed in BSG
protein isolates and BSG protein hydrolysates.

PART III. Chapter 11 Literature review
Development of brewer´s spent grain protein hydrolysates and their health promoting ability
201
Table 11.2. Treatments applied to extract the BSG proteins, to produce the BSG protein hydrolysates and its biological activities when it was evaluated
BSG protein extraction BSG protein hydrolysis
Alkaline extraction Protein (% dw)
Enzyme Hydrolysis DH (%)
Assay Bioactivity assessed Reference
BSG protein isolates
Two sequential extractions using 0.1 M NaOH for 1 h at 25ºC, followed by acid precipitation at pH 3.8
59% np np np - TPC - FRAP - DPPH
- 0.0003-0.0046 mg GAE/mg dw - 0.16-4.33 mg TE/g dw - nd - 5.34%
(308)
Three sequential extractions using 0.1 M, 0.5 M and 4 M KOH for 24 h at 25ºC, followed by acid precipitation at pH 3.0
82-85% np np np np np (4)
Extraction with 0.1 M NaOH for 1 h at 60ºC, followed by acid precipitation at pH 4.0
60% Alcalase E/S ratio (2.5% v/w), 60ºC, pH 9, 2 h
13a np np (7)
Extraction with 0.1 M NaOH for 1 h at 60ºC, followed by acid precipitation at pH 4.0
60% Flavourzyme E/S ratio (5.0% v/w), 40ºC, pH 9, 3 h
6b np np (7)
Extraction with 0.1 M NaOH for 1 h at 60ºC, followed by acid precipitation at pH 4.0
60% Pepsin
E/S ratio (5.0% v/w), 60ºC, pH 3, 3 h
8b np np (7)
a Degree of hydrolysis (DH %) calculated by the pH-stat method. b Degree of hydrolysis (DH %) calculated by the o-phthaldialdehyde method. TPC, Total phenolic content; FRAP, Ferric ion reducing antioxidant power; DPPH, 2,2-diphenyl-1- picrylhydrazyl. np, not performed.

202
Table 11.2. Treatments applied to extract the BSG proteins, to produce the BSG protein hydrolysates and its biological activities when it was
evaluated (continued)
BSG protein extraction BSG protein hydrolysis
Alkaline extraction Protein (% dw)
Enzyme Hydrolysis DH (%)
Assay Bioactivity assessed Reference
BSG protein hydrolysates
Two sequential extractions using 0.1 M NaOH for 1 h at 50°C, followed by acid precipitation at pH 3.8
49% Alcalase E/S ratio (2.5% v/w), 50ºC, pH 7, 4 h
np
- TPC - SOD (U937 cell line) - IL-2 (U937 cell line) - IL-4 (U937 cell line) - IL-10 (U937 cell line) - IFN-γ (U937 cell line)
- 0.055 mg GAE/mg dw - 87.20% - 81.74% - 94.80% - 88.41% - 78.86%
(307)
Two sequential extractions using 0.1 M NaOH for 1 h at 50°C, followed by acid precipitation at pH 3.8
49% Flavourzyme
E/S ratio (2.5% v/w), 50ºC, pH 7, 4 h
np
- TPC - SOD (U937 cell line) - IL-2 (U937 cell line) - IL-4 (U937 cell line) - IL-10 (U937 cell line) - IFN-γ (U937 cell line)
- 0.046 mg GAE/mg dw - 76.71% - 93.73% - 99.86% - 97.42% - 81.89%
(307)
Two sequential extractions using 0.1 M NaOH for 1 h at 50°C, followed by acid precipitation at pH 3.8
49% Corolase PP
E/S ratio (2.5% v/w), 50ºC, pH 7, 4 h
np
- TPC - SOD (U937 cell line) - IL-2 (U937 cell line) - IL-4 (U937 cell line) - IL-10 (U937 cell line) - IFN-γ (U937 cell line)
- 0.034 mg GAE/mg dw - 66.25% - 89.74% - 89.54% - 92.40% - 73.22%
(307)
Two sequential extractions using 0.1 M NaOH for 1 h at 25ºC, followed by acid precipitation at pH 3.8
50% Trypsin 250 E/S ratio (1.0% w/w), 50ºC, pH 7, 4 h
4.7c - α-glucosidase - 66.81% (7.5 mg/mL) (309)
TPC, Total phenolic content; SOD, Superoxide dismutase activity assay; IL-2, Interleukin-2; IL-4, Interleukin-4; IL-10, Interleukin-10; IFN-γ, Interferon-γ. np, not performed.

PART III. Chapter 11 Literature review
Development of brewer´s spent grain protein hydrolysates and their health promoting ability
203
Table 11.2. Treatments applied to extract the BSG proteins, to produce the BSG protein hydrolysates and its biological activities when it was
evaluated (continued)
BSG protein extraction BSG protein hydrolysis
Alkaline extraction Protein (% dw)
Enzyme Hydrolysis DH (%)
Assay Bioactivity assessed Reference
BSG protein hydrolysates
Two sequential extractions using 0.1 M NaOH for 1 h at 25ºC, followed by acid precipitation at pH 3.8
50% Corolase PP E/S ratio (1.0% w/w), 50ºC, pH 7, 4 h
13.0c - DPP-IV - 70.96% (3.5 mg/mL) (309)
Two sequential extractions using 0.1 M NaOH for 1 h at 25ºC, followed by acid precipitation at pH 3.8
50% Prolyve 1000 E/S ratio (1.0% w/w), 50ºC, pH 7, 4 h
13.8c - ACE-I activity - 89.25% (1.0 mg/mL) (309)
Two sequential extractions using 0.1 M NaOH for 1 h at 25ºC, followed by acid precipitation at pH 3.8
44% Alcalase E/S ratio (1.0% w/w), 50ºC, pH 7, 4 h
12.1c - ACE-I activity (IC50)
- 0.32 mg/mL (253)
Two sequential extractions using 0.1 M NaOH for 1 h at 25ºC, followed by acid precipitation at pH 3.8
44% Corolase PP E/S ratio (1.0% w/w), 50ºC, pH 7, 4 h
16.4c - ACE-I activity (IC50)
- 0.69 mg/mL (253)
Two sequential extractions using 0.1 M NaOH for 1 h at 25ºC, followed by acid precipitation at pH 3.8
44% Flavourzyme E/S ratio (1.0% w/w), 50ºC, pH 7, 4 h
15.1c - ACE-I activity (IC50)
- 0.50 mg/mL (253)
c Degree of hydrolysis (DH %) calculated by the TNBS method. IC50, Protein concentration inducing 50% inhibition values for ACE.

204

205
CHAPTER 12
Valorisation of Brewers’ spent grain and spent yeast
through protein hydrolysates with antioxidant
properties
_____________________
This chapter presents the hydrolysis optimization of BSG proteins
by BSY proteases to produce BSG protein hydrolysates with enhanced
antioxidant activity.

206

PART III. Chapter 12 Valorisation of Brewers’ spent grain and spent yeast through protein hydrolysates with antioxidant properties
207
ABSTRACT
Brewers’ spent grain (BSG) and Brewer´s spent yeast (BSY) are the main by-products of
the brewing process, with currently limited valuable applications. However, BSG protein
fraction can be a valuable substrate for enzymatic hydrolysis to produce hydrolysates with
biological properties and BSY contains numerous vacuole proteases, which can be used to
obtain these hydrolysates. Thus, the objective of this work was to explore the valorisation
of these two brewing by-products, based on the production of BSG protein hydrolysates
that present antioxidant properties. Response surface methodology (RSM) was employed
to optimize the hydrolysis of BSG proteins using BSY proteases, based on degree of
hydrolysis (DH %), total phenolic content (TPC) and antioxidant activity (FRAP assay).
Reverse phase chromatography was also used to monitor the Hydrolysis Rate (HR %) and
the potential presence of endogenous and other inhibitors of BSY proteases was also
investigated.
BSG protein hydrolysate prepared at 50ºC, pH 6.0, during 6 h and using an E/S ratio of
0.29:1 U/mg presented maximum bioactivity with DH % of 17.1%, TPC of 1.65 mg GAE/mL
and FRAP value of 1.88 mg TE/mL. A good correlation was obtained between HR (%) and
DH (%) (R2 = 0.9281). The experimental values agreed with the predicted values (p <0.05),
suggesting a good fit between the models and the experimental data. BSY proteases
involved in the hydrolysis of BSG proteins were serine peptidases and metallopeptidases.
12.1. INTRODUCTION
BSG, the residual solid fraction of barley malt and other used grains remaining after
filtration of wort, and BSY comprises around 85% and 15% of brewing by-products,
respectively (3). Currently, their main application is limited to animal feed. However, due to
the fact that both by-products are available at low or no cost through the year and both
present high nutritional values, they are promising raw materials to be exploited for human
nutrition and biotechnological processes (7), (297). Hence, the development of
economically achievable technologies for valorisation of these two by- products should be
promoted.
BSG is a ligno-cellulosic material rich in proteins, approximately 15-26% (dw), as well,
in phenolic compounds (namely, hydroxycinnamic acids, ferulic acid, p-coumaric acid,
sinapic acid and caffeic acid), which exhibit antioxidant properties (299), (308), (319), (320).
In order to increase the potential applications of the BSG insoluble proteins, chemical or
enzymatic hydrolysis is commonly applied (308). The enzymes used determine the
208
composition of the peptides produced and, therefore, biological and technological
functionalities of the final BSG protein hydrolysates (8), (307), (309). Different approaches
have been conducted to reuse BSG proteins, using commercial enzymes, such as,
Alcalase, Flavourzyme, Pepsin, Corolase, Trypsin and Protamex. BSG hydrolysates
present a potential role as functional food ingredients in the management of type II diabetes,
hypertension and immunomodulatory effects (307), (309). Also, BSG protein hydrolysates
have been produced with good emulsifying and foaming properties (7), (8).
While several attempts have been conducted to prepare BSG protein hydrolysates
using expensive commercial enzymes, to our knowledge there are no published reports
related to utilization of proteases from BSY. BSY is considered a GRAS raw material,
containing several vacuole proteases (serine, aspartyl and metalloproteases), which act at
pH 6 (10), (11). In fact, proteases from other types of yeast have been used to obtain
hydrolysates with biological activity (64), (324), (325). BSY extract, rich in proteases, can
be produced cheaply by mechanic disruption using glass beads (50).
The focus of the present study was on the bioactive potential of BSG protein
hydrolysates prepared using proteases extracted from BSY. The first aim was to optimize
the best hydrolysis conditions through a RSM approach with the purpose of obtaining value-
added hydrolysates with antioxidant properties; and secondly, search for the potential
presence of endogenous inhibitors of BSY proteases on BSG protein hydrolysis. The total
phenolic content (TPC) and the antioxidant activity, using the ferricyanide reducing power
assay (FRAP) of the BSG protein hydrolysates was investigated. Results generated from
this study are expected to may economically benefit the brewing process, due to the reuse
of the two major by-products, spent grain and spent yeast surplus, as well as, to provide
the consumers with a new functional ingredient.
12.2. MATERIAL AND METHODS
12.2.1. By-products
Brewing by-products were kindly supplied by Unicer brewing (Leça do Balio, Portugal). A
composite sample of BSG (25% dw) was obtained from worts that had similar formulation
and manufacturing process, briefly, the milled barley malt was mixed with hot water at 60ºC
during 2 h to obtain the wort, the mashing temperature raised to about 75-78°C. Lautering
was performed using a mash filter, first wort run-off undiluted, and the extract that remains
with the grains was washed with hot water (75-78ºC). Syrup from maize grain was added
directly to the kettle containing the filtered wort to obtain wort of 15.5° Plato and produce

PART III. Chapter 12 Valorisation of Brewers’ spent grain and spent yeast through protein hydrolysates with antioxidant properties
209
lager beer. BSG samples were vacuum-packed and stored in polypropylene bags at -20 °C
until use.
BSY (Saccharomyces pastorianus) biomass was collected from a tank that contained the
yeast surplus, and transported in 1 L glass bottles to laboratory under refrigerated
conditions and stored at 4ºC until preparation procedure (1 day maximum). The BSY
resulted from harvesting and repitching the yeast 3 to 6 times, which is a common practice
in most breweries. Only yeast surplus from fermentations that exhibited normal fermentation
characteristics was collected in the tank. The yeast slurry was thick and creamy with very
little trub and no “off” flavours and “off” aromas. Yeast slurry viability was evaluated by
manual counting on a standard microscope using a hemacytometer and a methylene blue
solution (0.1%).
12.2.2. Reagents
Folin-Ciocalteu phenol reagent; trifluoroacetic acid (TFA); 2,4,6-tripyridyl-s-triazine (TPTZ);
iron (III) chloride hexahydrate; bovine serum albumin (BSA); 6-hydroxy-2,5,7,8-
tetramethylchroman-2-carboxylic acid (Trolox); 2,4,6-trinitrobenzenesulfonic acid (TNBS);
gallic acid; L-leucine; L-tyrosine and inhibitors of peptidases (Pepstatin A, E-64, PMSF,
EDTA and Bestatin) were all purchased from Sigma-Aldrich (St. Louis, MO, USA).
Acetonitrile HPLC grade, sodium acetate, aluminium chloride and sodium hydroxide were
purchased from Merck (Darmstad, Germany). Ultra-pure water was obtained from a Seral-
Seralpur Pro 90 CN water purifying system. The Millipore UF membranes with a MWCO of
10 kDa were purchased from Sigma-Aldrich (St. Louis, MO, USA).
12.2.3. Apparatus
The RP-HPLC analyses were carried out using an analytical HPLC system (Jasco, Tokyo,
Japan), equipped with a quaternary low pressure gradient HPLC pump (Jasco PU-1580), a
degasification unit (Jasco DG-1580-53 3-line degasser), an autosampler (Jasco AS-2057-
PLUS), a MD-910 multiwavelengh detector (Jasco) and a 7125 Rheodyne injector valve
(California, USA). Data acquisition was accomplished using Borwin Controller software,
version 1.50 (JMBS Developments, Le Fontanil, France). The column was a Chrompack P
300 RP (polystyrenedivinylbenzene copolymer, 8 μm, 300Å, 150 x 4.6 mm i.d.) (Middleburg,
The Netherlands). Spectrophotometric analyses were carried out using a BMG LABTECH´s
SPECTROstar Nano-microplate, cuvette UV/Vis absorbance reader (Offenburg, Germany).
12.2.4. Preparation of BSY proteases
The BSY extract rich in proteases was prepared according to a previous work from Vieira
et al. (50). After removing the glass beads, the homogenate was centrifuged at 12,000 x g,
210
40 min at 4ºC. The resulting clear supernatant was freeze-dried, resuspended in the same
buffer (to 25% of the initial volume) and concentrated using a 10 kDa MWCO membrane.
Protease activity, assayed by Sigma’s non-specific protease assay method described by
Cupp-Enyard (164), was 0.725 U/mL. This extract was kept at -20ºC until used.
12.2.5. Preparation of BSG protein fraction
BSG proteins were extracted according to a previous work with slightly modifications (4).
Briefly, BSG without pre-treatment (100 g) was added to 200 mL of 0.5 M KOH solution
(ratio 1:2, w/v) for 2 h, 40ºC, with continuous shaking. After decantation and centrifugation
at 15,000 x g, 4ºC during 15 min, the extract was acidified to pH 3 with a solution of 2 M
citric acid. Further centrifugation was proceeded to obtain a final residue of BSG protein
fraction. No protease activity was found in this protein fraction when evaluated by Cupp-
Enyard assay (164). The solubility of BSG protein fraction was determined by the method
of Celus et al. (7) at different pH levels. The same amount of extract (1 g) was dispersed in
10 mL of different buffers, at 4ºC.: (i) 100 mM citrate-phosphate (pH 5.0, 6.0 and 7.0), (ii)
100 mM Tris-HCl (pH 8.0 and 9.0) and (iii) 100 mM glycine-NaOH (pH 10.0). The pH was
adjusted and the dispersions were shaken for 1 h at 4ºC and then centrifuged at 12,000 x
g, at 4ºC for 30 min. Protein content of the supernatant was determined following Bradford
method (171), using BSA as standard. Protein solubility was expressed as percentage of
protein in the solution in comparison to that of total protein in the extract. Based on the best
pH results, the freeze-dried extract was dissolved with optimum pH buffer and stored at -
20ºC for further use.
12.2.6. Enzymatic Hydrolysis
12.2.6.1. Experimental Design
RSM, using a Design Expert software (version 7.0, trial Stat-Ease Inc., Minneapolis, MN,
USA), was used to investigate the influence of the independent variables (X): time,
temperature and enzyme-substrate ratio (U/mg) on the hydrolysis of BSG protein fraction
using a BSY protease extract, and to optimize them. The temperature ranged from 35ºC to
50ºC, time ranged from 2 h to 6 h and E/S ratio ranged from 0.11:1 U/mg to 0.29:1 U/mg.
The average of degree of hydrolysis (DH %); total phenolic content (TPC in mg GAE/mL)
and antioxidant activity (FRAP in mg TE/mL) were selected as the response (Y). The full
CCD method was applied and the experiments were conducted according to the
experimental design depicted in Table 12.1.
Totally, 20 runs containing six replicates at the centre point were carried out. All reactions
were performed in triplicate, using 2 mL eppendorf tubes, in a shaking incubator with
constant agitation (200 rpm). For all assays, 50 mL of a solution containing 5 mg of BSG
PART III. Chapter 12 Valorisation of Brewers’ spent grain and spent yeast through protein hydrolysates with antioxidant properties
211
proteins/mL dissolved in tris-HCl was used as substrate for BSY proteases and the pH of
hydrolysis reaction was fixed at pH 6.0. Hydrolysis experiments were performed without any
pH adjustment and controls were performed using the protein fractions from enzyme and
substrate, without any enzymatic treatment. Reactions were finished by heating the solution
to 95ºC for 15 min, assuring enzyme inactivation. Aliquots (50 µL) of final hydrolysates were
withdrawn for colorimetric determination of DH (%). The remaining material was centrifuged
at 3,000 x g at 4ºC for 10 min to separate the undigested substrate and to collect the
hydrolysate material. BSG protein hydrolysates (coded as H1-H20) were kept at -20ºC to
further studies.
12.2.6.2. Determination of Degree of Hydrolysis (DH %) and Hydrolysis Rate (HR %)
The degree of hydrolysis (DH%), expressed as the percentage of peptide bonds hydrolysed
was determined in triplicate using the TNBS method, as described by Hsu et al. (238). BSG
protein hydrolysis was also evaluated through RP-HPLC, using the chromatographic
conditions described by Ferreira et al. (185). HR (%) was calculated based on the
measurement of protein fraction (eluted between 40 and 50 min) that remains intact after
hydrolysis.
12.2.6.3. Determination of total phenolic content (TPC)
The TPC was measured using the Folin-Ciocalteu method, as previously described by
Herald et al. (155). This assay measures the ability of a compound to reduce the yellow
oxidising Folin-Ciocalteu reagent to a blue/green colour; absorbance is measured
spectrophotometrically at 765 nm. Gallic acid was used as a standard at 10-500 μM to
produce a calibration curve (average R2 = 0.9983) and results were expressed as mg of
Gallic Acid equivalent per mL of sample (mg GAE/ mL).
12.2.6.4. Ferric Ion Reducing Antioxidant Power (FRAP) assay
The antioxidant activity was estimated according to the procedure of Jansen and Ruskovska
method (154). This assay is based on the principle of the reduction of the ferric-
tripyridyltriazine complex to the ferrous form, upon which an intense blue colour develops
and the change of absorbance is measured at 595 nm. Trolox, a water-soluble analogue of
tocoferol, was used as standard at 10-500 μM to generate a calibration curve (average R2
= 0.9975) and results were expressed as mg of Trolox equivalent per mL of sample (mg
TE/mL).

212
12.2.7. Effect of potential inhibitors on BSG protein hydrolysis by BSY proteases
Since BSY proteases showed higher activity on BSG proteins at pH 6.0, the potential
presence of natural inhibitors was evaluated, according to the protocol described by
Bolumar et al. (326), with slight modifications. BSY protease extract was split into two
aliquots: the first was kept at pH 7.0, the second was adjusted to pH 5.0; both extracts were
incubated at 25ºC for 20 h. Then, the activity of BSY proteases on BSG proteins was
assessed at 50ºC and pH 6.0. Respective control of BSY proteases, kept at pH 5 and 6 and
incubated at 25°C for 20 h, without the addition of BSG protein were assayed
simultaneously. The reaction was stopped by adding 10% (w/v) trichloroacetic acid (TCA)
and the absorbance of the soluble TCA peptides was examined at 280 nm. The percentage
activity in inhibition assays was reported considering 100% activity in the absence of
inhibitor. Additionally, the effect of inhibitors of BSY proteases on BSG proteins was studied
in order to identify the type of catalytic peptidases responsible for the hydrolysis of BSG
proteins. The following inhibitors were used: phenylmethylsulfonyl fluoride (PMSF) for
serine peptidases; EDTA for metallopeptidases; bestatin for aminopeptidases
(metallopeptidases); pepstatin A for aspartic acid peptidases and E-64 for the cysteine
peptidases. The procedure used was according to Garcia-Carreño (327) and is outlined in
Table 12.2. Each inhibitor was added so that the final concentration was 0.01 and 0.05 mM
pepstatin A, E-64 and Bestatin; 1 and 2 and 10 mM PMSF and 20 mM EDTA. The
concentrations of each inhibitor was chosen according to the manufacturer's instructions.
The BSY peptidases activity in the absence of inhibitors was determined by adding buffer
instead of inhibitor. In order to investigate the potential inhibitory effect of the solvent on the
activity of BSY peptidases, a solvent control (methanol) was prepared. Additionally, to
eliminate the effect of absorption of the inhibitor and the enzyme extract, two blanks
(inhibition blank and blank activity) were prepared. The reaction was stopped by adding
10% (w/v) trichloroacetic acid (TCA) and the absorbance of the soluble TCA peptides was
examined at 280 nm. Residual activity was calculated as relative (%) considering control
treatments as 100%.
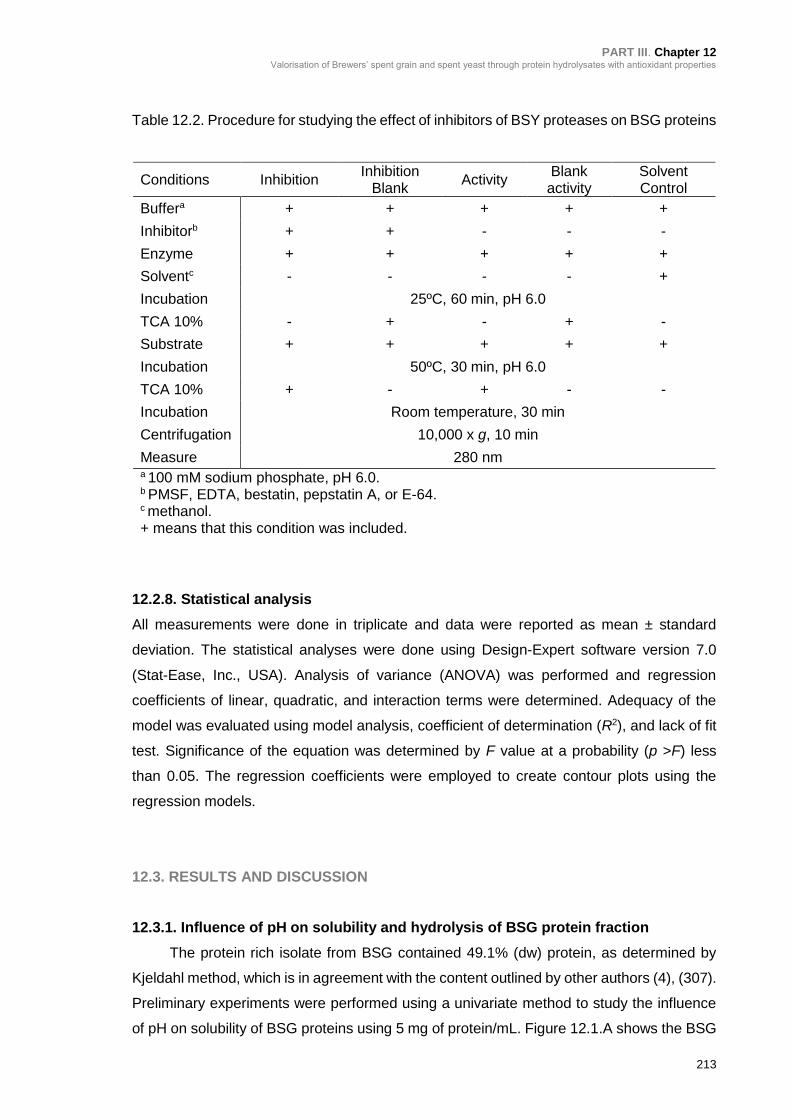
PART III. Chapter 12 Valorisation of Brewers’ spent grain and spent yeast through protein hydrolysates with antioxidant properties
213
Table 12.2. Procedure for studying the effect of inhibitors of BSY proteases on BSG proteins
Conditions Inhibition Inhibition
Blank Activity
Blank activity
Solvent Control
Buffera + + + + +
Inhibitorb + + - - -
Enzyme + + + + +
Solventc - - - - +
Incubation 25ºC, 60 min, pH 6.0
TCA 10% - + - + -
Substrate + + + + +
Incubation 50ºC, 30 min, pH 6.0
TCA 10% + - + - -
Incubation Room temperature, 30 min
Centrifugation 10,000 x g, 10 min
Measure 280 nm a 100 mM sodium phosphate, pH 6.0. b PMSF, EDTA, bestatin, pepstatin A, or E-64. c methanol. + means that this condition was included.
12.2.8. Statistical analysis
All measurements were done in triplicate and data were reported as mean ± standard
deviation. The statistical analyses were done using Design-Expert software version 7.0
(Stat-Ease, Inc., USA). Analysis of variance (ANOVA) was performed and regression
coefficients of linear, quadratic, and interaction terms were determined. Adequacy of the
model was evaluated using model analysis, coefficient of determination (R2), and lack of fit
test. Significance of the equation was determined by F value at a probability (p >F) less
than 0.05. The regression coefficients were employed to create contour plots using the
regression models.
12.3. RESULTS AND DISCUSSION
12.3.1. Influence of pH on solubility and hydrolysis of BSG protein fraction
The protein rich isolate from BSG contained 49.1% (dw) protein, as determined by
Kjeldahl method, which is in agreement with the content outlined by other authors (4), (307).
Preliminary experiments were performed using a univariate method to study the influence
of pH on solubility of BSG proteins using 5 mg of protein/mL. Figure 12.1.A shows the BSG

214
protein solubility at different pH levels. Low solubility (10%) was found at pH 6. The
isoelectric point is probably around pH 5. Solubility reached its maximum value between pH
8 and pH 9 (100). These results are in agreement with those reported by Celus et al. (7).
The effect of pH on the hydrolysis of BSG proteins by BSY proteases was determined at a
pH range of 5-10 and at a temperature of 37ºC, for 4 h. The results obtained are presented
in Figure 12.1.B and show that BSY proteases acted on BSG proteins on the studied pH
range. At pH 6-7, BSY proteases showed higher activity, being pH 6 the optimum pH for
BSG protein hydrolysis. Moreover, results showed that when hydrolysis was performed at
pH 6, the pH value remained in the range of 5.8 to 6.4 during the entire hydrolysis period.
The same range of pH variation was observed when hydrolysis was performed at pH 5 and
8. For this reason, in accordance with other authors, it was decided not to adjust the pH
during BSG protein hydrolysis, which constitutes an economical advantage.
Figure 12.1. Effect of pH on solubility of BSG protein fraction, at 25°C, (A). Effect of pH on
hydrolysis of BSG protein fraction by BSY proteases, at 37°C, (B). Relative Activity (%) was
estimated considering 100% the highest activity detected in this assay.
12.3.2. Central composite design and response surface method
The experimental conditions and values of DH%, TPC and FRAP assays of BSG
protein hydrolysates are reported in Table 12.1. Results showed that the DH (%) ranged
from 8.90% (H9: 30ºC, 4.0 h, E/S: 0.20:1) to 17.1% (H8: 50 ºC, 6.0 h, E/S: 0.29:1); TPC
ranged from 1.10 mg GAE/mL (H1: 35ºC, 2.0 h, E/S: 0.11:1) to 1.65 mg GAE/mL (H8: 50ºC,
6.0 h, E/S: 0.29:1) and the antioxidant activity, evaluated by FRAP assay, ranged from 0.55
mg TE/mL (H13: 43ºC, 4.0 h, E/S: 0.05:1) to 1.88 mg TE/mL (H8: 50ºC, 6.0 h, E/S: 0.29:1).
The model summary and the results obtained from ANOVA are detailed on Table
12.3. The adequacy of the 2FI model was evaluated by means of Fisher’s F-test. The model
F value for DH, TPC and FRAP responses were, respectively, 17.58, 46.25 and 123.22,
indicating the significance of the model. The linear terms (X1, X2, X3) and the quadratic
(A) (B)
(B) (A)

PART III. Chapter 12 Valorisation of Brewers’ spent grain and spent yeast through protein hydrolysates with antioxidant properties
215
terms (X12, X22, X32) had a significant effect (p <0.01) on the three responses. The cross-
product (X1.X2 and X1.X3) terms presented values of prob > F less than 0.05, that denotes
that they are significant terms for the Y1 and Y3 responses; the cross-product X2.X3 had a
significant effect on Y2 response. The quadratic models can be used for monitoring the
effects of hydrolysis conditions on the DH, TPC and FRAP of BSG proteins digested by
BSY proteases. Coefficient of determination (R2) for checking the fitness of model were
close to 1, which indicated that models explained, respectively, 88.7%, 95.5%, and 98.3%
of the variation in the hydrolysis conditions on the DH, TPC and FRAP of BSG proteins.
‘‘Adeq Precision’’ was higher than 4 for the three responses, indicating an adequate signal-
to-noise ratio. Moreover, the statistical analysis of variance also revealed that there was a
non-significant (p >0.05) lack of fit, which further validates the model. Thus, the response
surface 2FI model is adequate and significant. Equations (1), (2) and (3) shows the
dependence of DH (Y1), TPC (Y2) and FRAP (Y3) on temperature (X1), time (X2) and E/S
ratio (X3), respectively. The parameters of the equation were obtained by multiple
regression analysis of the experimental data.
Y1 = −307.41 + 0.60. X1 − 0.96. X2 − 1.29. X3 + 0.05. X1. X2 +
100.00. X1. X3 − 877. X12 − 0.11. X22 − 5.44. X32 (1)
Y2 = −215.34 + 0.11. X1 + 0.11. X2 + 625.76. X3 − 99.8. X12 − 471. X22 −
706.34. X32 (2)
Y3 = −228.15 + 0.11. X1 + 0.02. X2 − 0.20. X3 + 303. X1. X2 + 0.12. X1. X3 +
0.28. X2. X3 − 131. X12 − 0.01. X22 − 735.11. X3^2 (3)
12.3.3. The effect of temperature, time and E/S ratio on the response value
Curve analysis of response surfaces for experimental design allowed prediction of
response function of the effects of the temperature, time and E/S ratio. Model equations are
visualized in the form of three-dimensional surface plots, which are constructed by plotting
the response on the Z-axis against any two independent variables, while maintaining other
variables at their optimal levels. As shown in Figure 12.2, the DH, TPC and FRAP increased
at hydrolysis conditions at pH 6.0 until temperature, time and E/S ratio reached an optimum
point of 50ºC, 6 h and an E/S ratio of 0.29:1 U/mg. BSG protein hydrolysate prepared under
these conditions (H8, Table 12.1) presented DH % of 17.10%, TPC of 1.65 mg GAE/mL
and FRAP value of 1.88 mg TE/ mL. In terms of antioxidant activity, surface plots indicated
that the same optimum conditions for higher DH may be favourable to enhance the

216
antioxidant properties of the BSG protein hydrolysate. Since some free amino acids and
small peptides have been found to possess antioxidant activity, it seems that extension of
hydrolysis may be favourable to enhance the antioxidant properties of the hydrolysate (328).
Table 12.1. Experimental design for evaluation of the effects of hydrolysis conditions at pH
6.0 on Hydrolysis Degree (DH %), total phenolic content (TPC) and FRAP assay of BSG
protein fraction by BSY proteases
Pointa T
(ºC) t
(h) E/S ratio
DH (Y1, %)
TPC (Y2, mg GAE/mL)
FRAP (Y3, mg TE/mL)
code
run
X1 X2 X3 Expb Predc Expb Predc Expb Predc
H3 1 35.0 6.0 0.11 9.50 9.86 1.27 1.24 0.75 0.69
H2 2 50.0 2.0 0.11 10.50 11.20 1.35 1.34 0.80 0.77
H6 3 50.0 2.0 0.29 14.20 14.25 1.59 1.59 1.31 1.36
H4 4 50.0 6.0 0.11 13.10 13.72 1.52 1.50 1.12 1.11
H12 5 43.0 7.4 0.20 13.90 13.51 1.60 1.60 1.35 1.36
H13 6 43.0 4.0 0.05 11.60 10.72 1.12 1.17 0.55 0.62
H7 7 35.0 6.0 0.29 11.10 10.82 1.52 1.50 1.14 1.15
H10 8 55.0 4.0 0.20 16.20 15.42 1.59 1.58 1.46 1.44
H8 9 50.0 6.0 0.29 17.10 17.38 1.65 1.67 1.88 1.90
H17 10 43.0 4.0 0.20 13.50 13.65 1.57 1.54 1.26 1.23
H20 11 43.0 4.0 0.20 13.80 13.65 1.58 1.54 1.20 1.23
H15 12 43.0 4.0 0.20 13.90 13.65 1.54 1.54 1.25 1.23
H16 13 43.0 4.0 0.20 14.50 13.65 1.53 1.54 1.20 1.23
H11 14 43.0 0.6 0.20 11.40 11.20 1.34 1.38 0.76 0.77
H9 15 30.0 4.0 0.20 8.90 9.09 1.14 1.19 0.56 0.60
H5 16 35.0 2.0 0.29 10.80 10.59 1.41 1.40 0.80 0.79
H18 17 43.0 4.0 0.20 12.40 13.65 1.52 1.54 1.25 1.23
H14 18 43.0 4.0 0.35 13.80 14.09 1.61 1.60 1.55 1.50
H1 19 35.0 2.0 0.11 10.10 10.24 1.10 1.05 0.56 0.52
H19 20 43.0 4.0 0.20 13.70 13.65 1.52 1.54 1.21 1.23 a Experiments were conducted in a random order; b Average of triplicate determinations from different experiments; c Predicted values based on CCD evaluation.
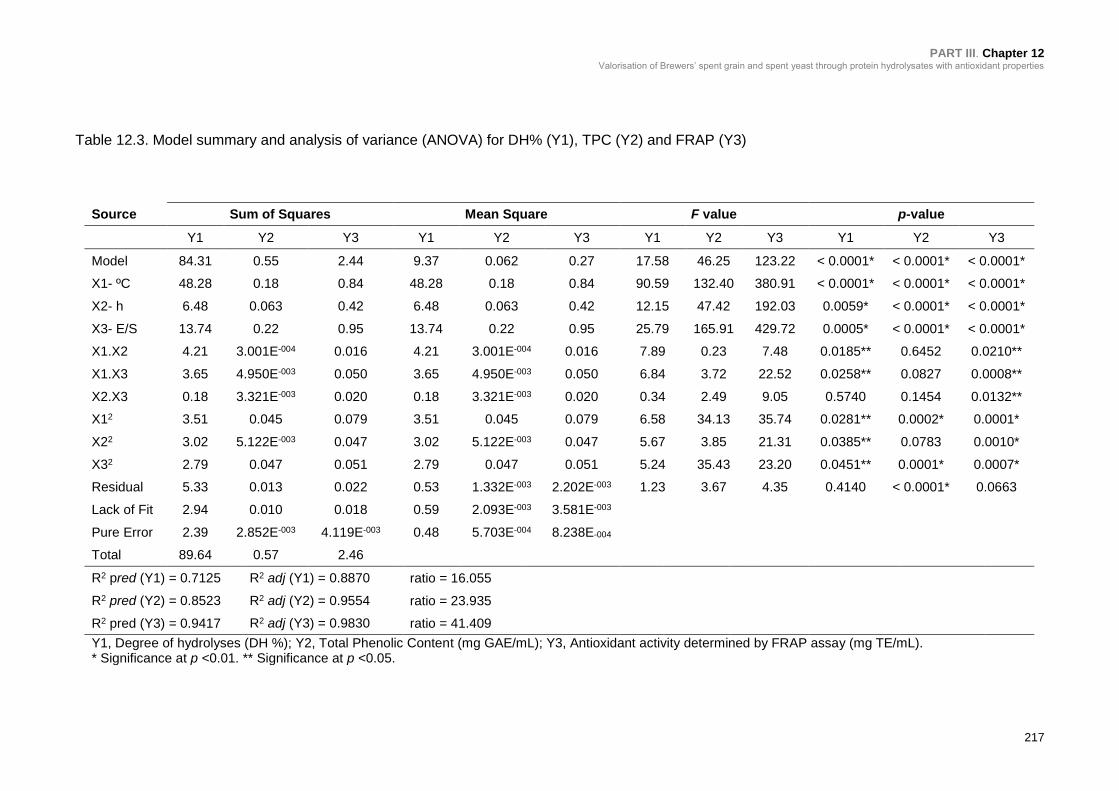
PART III. Chapter 12 Valorisation of Brewers’ spent grain and spent yeast through protein hydrolysates with antioxidant properties
217
Table 12.3. Model summary and analysis of variance (ANOVA) for DH% (Y1), TPC (Y2) and FRAP (Y3)
Source Sum of Squares Mean Square F value p-value
Y1 Y2 Y3 Y1 Y2 Y3 Y1 Y2 Y3 Y1 Y2 Y3
Model 84.31 0.55 2.44 9.37 0.062 0.27 17.58 46.25 123.22 < 0.0001* < 0.0001* < 0.0001*
X1- ºC 48.28 0.18 0.84 48.28 0.18 0.84 90.59 132.40 380.91 < 0.0001* < 0.0001* < 0.0001*
X2- h 6.48 0.063 0.42 6.48 0.063 0.42 12.15 47.42 192.03 0.0059* < 0.0001* < 0.0001*
X3- E/S 13.74 0.22 0.95 13.74 0.22 0.95 25.79 165.91 429.72 0.0005* < 0.0001* < 0.0001*
X1.X2 4.21 3.001E-004 0.016 4.21 3.001E-004 0.016 7.89 0.23 7.48 0.0185** 0.6452 0.0210**
X1.X3 3.65 4.950E-003 0.050 3.65 4.950E-003 0.050 6.84 3.72 22.52 0.0258** 0.0827 0.0008**
X2.X3 0.18 3.321E-003 0.020 0.18 3.321E-003 0.020 0.34 2.49 9.05 0.5740 0.1454 0.0132**
X12 3.51 0.045 0.079 3.51 0.045 0.079 6.58 34.13 35.74 0.0281** 0.0002* 0.0001*
X22 3.02 5.122E-003 0.047 3.02 5.122E-003 0.047 5.67 3.85 21.31 0.0385** 0.0783 0.0010*
X32 2.79 0.047 0.051 2.79 0.047 0.051 5.24 35.43 23.20 0.0451** 0.0001* 0.0007*
Residual 5.33 0.013 0.022 0.53 1.332E-003 2.202E-003 1.23 3.67 4.35 0.4140 < 0.0001* 0.0663
Lack of Fit 2.94 0.010 0.018 0.59 2.093E-003 3.581E-003
Pure Error 2.39 2.852E-003 4.119E-003 0.48 5.703E-004 8.238E-004
Total 89.64 0.57 2.46
R2 pred (Y1) = 0.7125 R2 adj (Y1) = 0.8870 ratio = 16.055
R2 pred (Y2) = 0.8523 R2 adj (Y2) = 0.9554 ratio = 23.935
R2 pred (Y3) = 0.9417 R2 adj (Y3) = 0.9830 ratio = 41.409
Y1, Degree of hydrolyses (DH %); Y2, Total Phenolic Content (mg GAE/mL); Y3, Antioxidant activity determined by FRAP assay (mg TE/mL). * Significance at p <0.01. ** Significance at p <0.05.
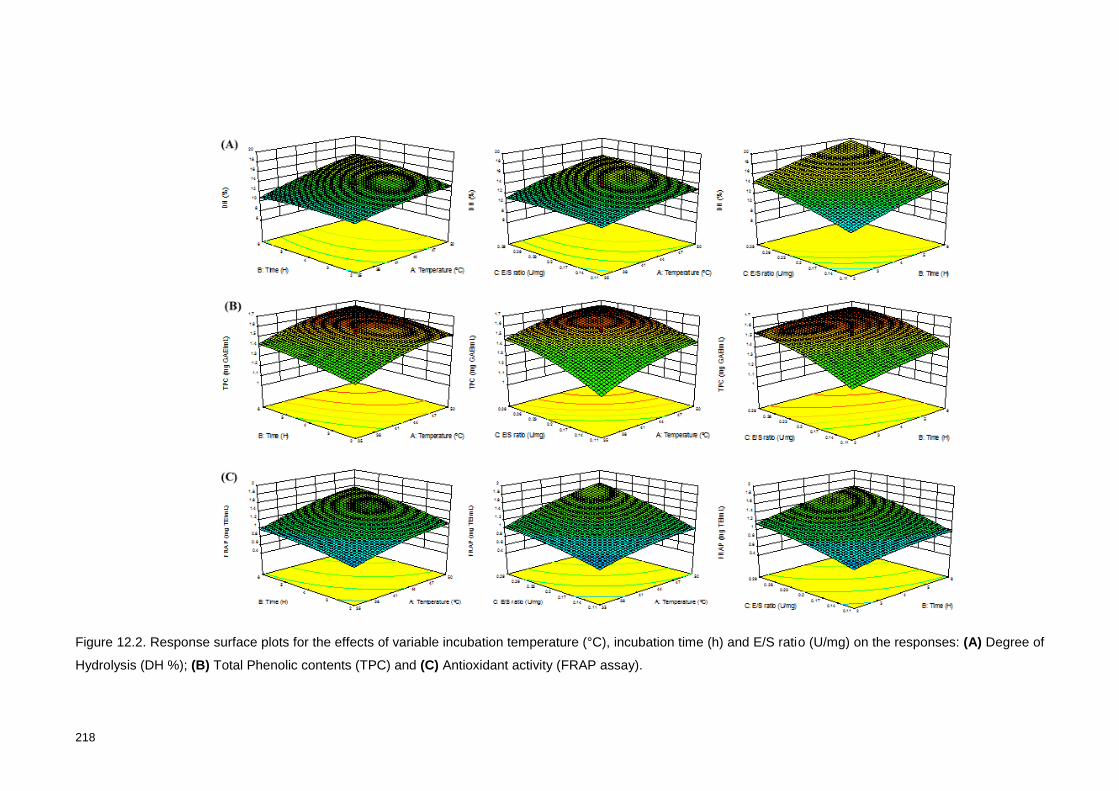
218
Figure 12.2. Response surface plots for the effects of variable incubation temperature (°C), incubation time (h) and E/S ratio (U/mg) on the responses: (A) Degree of
Hydrolysis (DH %); (B) Total Phenolic contents (TPC) and (C) Antioxidant activity (FRAP assay).
PART III. Chapter 12 Valorisation of Brewers’ spent grain and spent yeast through protein hydrolysates with antioxidant properties
219
12.3.4. Validation of the RSM model
Desirability indices were constructed to obtain the optimum experimental conditions
to maximize the bioactivities of BSG protein hydrolysate. The confirmatory experiments
were conducted with the parameters suggested by experimental model, in three different
runs, and the t test was applied to compare the DH, TPC and FRAP values of BSG protein
hydrolysates prepared under optimized conditions at pH 6.0 with those predicted by models.
BSG protein hydrolysate prepared at 50ºC, 6.0 h and E/S ratio of 0.29:1 U/mg showed the
maximum results for the three responses. Under these hydrolysis conditions, the
experimental values of DH, TPC and FRAP were, respectively, 17.6%, 1.68 mg GAE/mL
and 1.84 mg TE/mL; and the predicted values, were respectively, 17.4%, 1.67 mg GAE/mL
and 1.90 mg TE/mL. These results showed that there is no statistically significant difference
between the experimental and estimated values within a 95% confidence interval for the
three responses. Thereby, the adequacy of the models in predicting the optimum hydrolysis
condition was confirmed.
12.3.5. Hydrolysis monitoring by RP-HPLC
Hydrolysis was also monitored by RP-HPLC. Figure 12.3 shows the RP-HPLC profiles
of BSG protein hydrolysates with different DH. As elution was monitored at 214 nm, this
implies that the level of smallest peptides is underestimated. Chromatographic profiles
showed that peak area of “Polypeptide fraction” increased with increasing DH, being
significantly higher (p <0.05) for H8, prepared at 50ºC, 6.0 h, E/S: 0.29:1 U/mg.
Furthermore, strong correlations were found between measurements from HR (%) and DH
(%) (R2 = 0.8861).
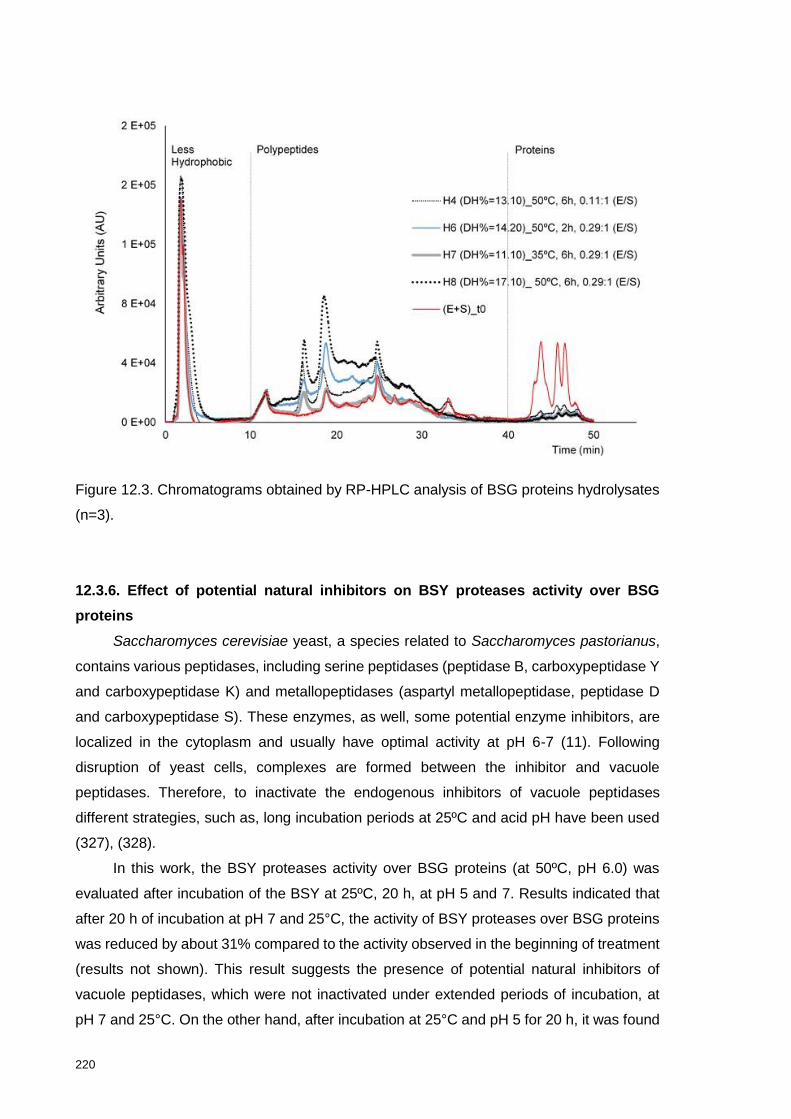
220
Figure 12.3. Chromatograms obtained by RP-HPLC analysis of BSG proteins hydrolysates
(n=3).
12.3.6. Effect of potential natural inhibitors on BSY proteases activity over BSG
proteins
Saccharomyces cerevisiae yeast, a species related to Saccharomyces pastorianus,
contains various peptidases, including serine peptidases (peptidase B, carboxypeptidase Y
and carboxypeptidase K) and metallopeptidases (aspartyl metallopeptidase, peptidase D
and carboxypeptidase S). These enzymes, as well, some potential enzyme inhibitors, are
localized in the cytoplasm and usually have optimal activity at pH 6-7 (11). Following
disruption of yeast cells, complexes are formed between the inhibitor and vacuole
peptidases. Therefore, to inactivate the endogenous inhibitors of vacuole peptidases
different strategies, such as, long incubation periods at 25ºC and acid pH have been used
(327), (328).
In this work, the BSY proteases activity over BSG proteins (at 50ºC, pH 6.0) was
evaluated after incubation of the BSY at 25ºC, 20 h, at pH 5 and 7. Results indicated that
after 20 h of incubation at pH 7 and 25°C, the activity of BSY proteases over BSG proteins
was reduced by about 31% compared to the activity observed in the beginning of treatment
(results not shown). This result suggests the presence of potential natural inhibitors of
vacuole peptidases, which were not inactivated under extended periods of incubation, at
pH 7 and 25°C. On the other hand, after incubation at 25°C and pH 5 for 20 h, it was found
PART III. Chapter 12 Valorisation of Brewers’ spent grain and spent yeast through protein hydrolysates with antioxidant properties
221
that the activity of BSY peptidases was doubled compared to activity observed in the
beginning of treatment (results not shown), suggesting no effect of natural inhibitors of
vacuole peptidases in the hydrolysis of BSG proteins, presumably due to its inactivation at
pH 5 and 25 °C during 20 h.
12.3.7. Effect of potential inhibitors on BSY proteases activity over BSG proteins
The effect of inhibitors on the BSY proteases activity over BSG proteins was also
evaluated in order to ascertain which type of catalytic peptidases are responsible for the
hydrolysis under optimal conditions of temperature and pH (50ºC and pH 6.0). Results
presented in Table 12.4 show that none of the inhibitors reduced more than 50% of BSY
proteases activity over BSG proteins and no inhibition was observed in the presence of
Pepstatin A and E-64 at concentrations of 0.01 mM and 0.05 mM. The weak inhibition
caused by these two inhibitors at the higher concentration used, which suggest that the
enzymes present in BSY responsible for hydrolysis of BSG proteins under the assay
conditions are not cysteine peptidases and aminopeptidases (type catalytic
metallopeptidases). On the other hand, EDTA, at a concentration of 20 mM, reduced 50%
the activity of BSY proteases and PMSF, at a concentration of 2 mM, reduced by
approximately 31% of BSY activity over BSG proteins. The main BSY proteases responsible
for the hydrolysis of BSG proteins, under the optimum conditions, can belong to the class
of serine peptidases and metallopeptidases. However, as BSY contain a mixture of various
peptidases and compounds, this can lead to erroneous conclusions. In fact, some
components of the BSY may affect the enzyme-inhibitor binding and, moreover, the active
site of the peptidases may not be truly accessible to binding of the inhibitor (329). Thus, it
would be necessary to purify the BSY proteases in order to confirm the catalytic type (s) of
peptidase (s) that is (are) responsible (s) for its hydrolysis.
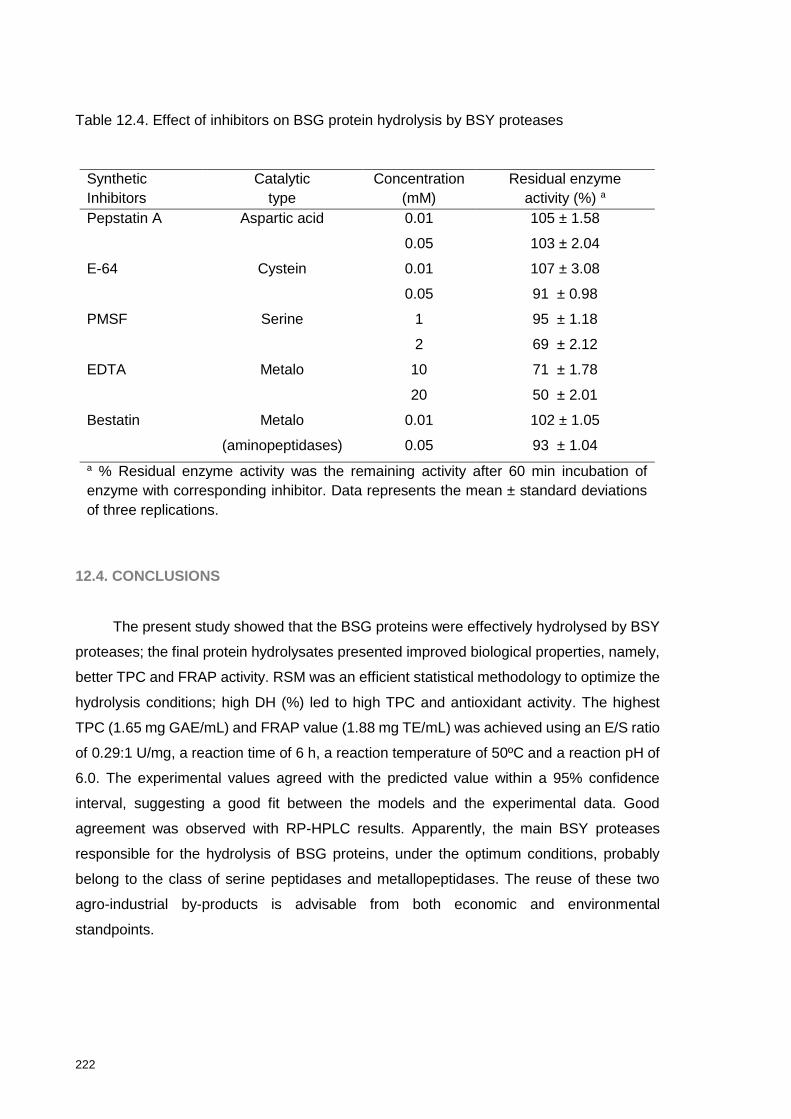
222
Table 12.4. Effect of inhibitors on BSG protein hydrolysis by BSY proteases
12.4. CONCLUSIONS
The present study showed that the BSG proteins were effectively hydrolysed by BSY
proteases; the final protein hydrolysates presented improved biological properties, namely,
better TPC and FRAP activity. RSM was an efficient statistical methodology to optimize the
hydrolysis conditions; high DH (%) led to high TPC and antioxidant activity. The highest
TPC (1.65 mg GAE/mL) and FRAP value (1.88 mg TE/mL) was achieved using an E/S ratio
of 0.29:1 U/mg, a reaction time of 6 h, a reaction temperature of 50ºC and a reaction pH of
6.0. The experimental values agreed with the predicted value within a 95% confidence
interval, suggesting a good fit between the models and the experimental data. Good
agreement was observed with RP-HPLC results. Apparently, the main BSY proteases
responsible for the hydrolysis of BSG proteins, under the optimum conditions, probably
belong to the class of serine peptidases and metallopeptidases. The reuse of these two
agro-industrial by-products is advisable from both economic and environmental
standpoints.
Synthetic
Inhibitors
Catalytic
type
Concentration
(mM)
Residual enzyme
activity (%) a
Pepstatin A Aspartic acid 0.01 105 ± 1.58
0.05 103 ± 2.04
E-64 Cystein 0.01 107 ± 3.08
0.05 91 ± 0.98
PMSF Serine 1 95 ± 1.18
2 69 ± 2.12
EDTA Metalo 10 71 ± 1.78
20 50 ± 2.01
Bestatin Metalo
(aminopeptidases)
0.01 102 ± 1.05
0.05 93 ± 1.04
a % Residual enzyme activity was the remaining activity after 60 min incubation of
enzyme with corresponding inhibitor. Data represents the mean ± standard deviations
of three replications.

CHAPTER 13
Antioxidant and ACE inhibitory activities of
hydrolysates of brewers' spent grain proteins by
proteases from spent yeast or by commercial
enzymes: protective capacity in Caco-2 and HepG2
cells
_____________________
This chapter compares the biological activities of different BSG
protein hydrolysates prepared by BSY proteases and two commercial
enzymes: Alcalase® and Neutrase®.

224
PART III. Chapter 13 Antioxidant and ACE inhibitory activities of hydrolysates of brewers' spent grain proteins by proteases from spent yeast or by commercial
enzymes: protective capacity in Caco-2 and HepG2 cells
225
ABSTRACT
Protein fraction of Brewers’ spent grain (BSG) was used as substrate to obtain bioactive
hydrolysates. Three enzymatic approaches were applied to perform the hydrolysis:
Brewer´s spent yeast (BSY) proteases, Neutrase® and Alcalase®, at the same proteolytic
activity (1 U/mL), using an E/S of 0.10:1 U/mg, at 50ºC, for 4 h. BSG hydrolysates DH%,
PR%, proximate composition, molecular weight distribution and hydrophobicity were
compared. Moreover, hydrolysates and their <10 kDa and <3 kDa fractions were tested for
antioxidant and ACE-I activities. The effect of <10 kDa fractions on Caco-2 and HepG2 cell
lines viability, mitochondrial membrane potential and oxidative stress was also investigated.
Hydrolysates produced by Alcalase® presented significantly (p <0.05) higher ACE-I activity
(IC50 0.385 mg protein/mL) and antioxidant capacity by TPC and FRAP assays (0.083 mg
GAE/mg dw; 0.101 mg TE/mg dw, respectively) than other hydrolysates. Fractions <3 kDa
of hydrolysates from BSY proteases and from Neutrase® presented enhanced ACE-I
activities, whereas <10 kDa fraction presented increased TPC and FRAP values (p <0.05).
The fraction <10 kDa of BSG protein hydrolysates exerted a protective effect against free-
radical induced cytotoxicity in Caco-2 and HepG2 cells. Therefore, these BSG protein
hydrolysates may be useful functional ingredients.
13.1. INTRODUCTION
Brewers' spent grain (BSG) is the insoluble fraction of wort separated after the
mashing phase of beer production. It is the major by-product from brewing process and is
mainly composed by a lignocellulosic material and proteins, with high glutamine and proline
contents (7). The protein content of BSG is approximately 20% (dw basis) and hordeins
account for over 50% of the total proteins (4), (309). Although BSG main use is for animal
feeding, other possible applications have been studied, because it presents high potential
to be used for production of protein hydrolysates with biological properties (7), (307-309).
The conditions employed on enzymatic hydrolysis, mainly the type of protease and
the degree of hydrolysis, affect the peptides composition, as well as, the hydrolysates
bioactivity (330). Commercially available enzymes have been commonly employed to
undertake the hydrolytic process; these include Alcalase, Pepsine, Trypsin, Flavourzyme,
Protamex, Prolyve, Promod, Corolase PP, among others (253), (307), (309). Our group has
experience on the hydrolysis of BSG protein fraction using an enzyme extract from BSY.
These hydrolysates present a DH of 17.6%, TPC of 1.65 mg GAE/mL and FRAP of 1.88
mg TE/mL. However, besides conventional chemical assays for screening the antioxidant
226
activity of BSG protein hydrolysates, it is important to study the biological effects using in
vitro cell models, which mimic the target site of oxidative stress in vivo. The human intestinal
epithelial cell line (Caco-2) and the human hepatocarcinoma cell line (HepG2) have been
considered reliable models widely used for biochemical and nutritional studies (331-337).
Although BSG protein hydrolysates exhibit in vitro antioxidant activity in chemical assays,
little information is available regarding their antioxidant ability on cell-based models.
BSG protein hydrolysates exhibiting antioxidant potential may also contain peptides
with other biological activities, such as, ACE-I activity. ACE inhibition plays a key role in the
treatment of hypertension and ACE-I peptides are generally small sized peptides, less than
3 or 5 kDa, often carrying polar amino acid residues, such as, proline (253), (330). Few
studies have focused on the production of BSG hydrolysates with ACE-I effects. In fact,
Connolly et al. (253) reported for the first time the ability of BSG protein hydrolysates to
inhibit ACE; BSG proteins hydrolyzed with Alcalase, Flavourzyme and Corolase resulted in
an IC50 of 0.32 mg protein/mL, 0.69 mg protein/mL and 0.50 mg protein/mL, respectively.
No studies have yet reported the ability of BSG protein hydrolysates produced by BSY
proteases to inhibit ACE.
The aims of the present study were (i) to compare the capacity of proteases extracted
from BSY to hydrolyze the BSG protein substrate with that of two commercially available
proteases, Neutrase® and Alcalase®; (ii) to assess the potential bioactivity of the
hydrolysates obtained by measuring the in vitro antioxidant and ACE-I activities and (iii) to
measure the ability of these hydrolysates to protect Caco-2 and HepG2 cell lines regarding
cell viability, mitochondrial integrity and oxidative stress.
13.2. MATERIAL AND METHODS
13.2.1. Reagents and cells
Unless otherwise stated, all chemicals were purchased from Sigma-Aldrich (St. Louis, MO,
USA) and the cell culture reagents were purchased from Gibco® (Invitrogen Corporation,
Paisley, UK). Neutrase® (EC.3.4.24.28) and Alcalase® (EC 3.4.21.62) were purchased
from Sigma-Aldrich (St. Louis, MO, USA) and ABz-Gly-Phe(NO2)-Pro was purchased from
Bachem Feinchemikalien (Bubendorf, Switzerland). The Millipore UF membranes with a
MWCO of 3 and 10 kDa were purchased from Sigma-Aldrich (St. Louis, MO, USA).
Ultrapure water was obtained from a Seralpur Pro 90 CN water purification. Caco-2 and
HepG2 cell lines were obtained from the American Type Culture Collection (ATCC).
Dulbecco’s modified eagle’s medium (DMEM) with high glucose, heat-inactivated fetal
bovine serum (FBS), 0.25% trypsin/1 mM EDTA, antibiotic solution (10,000 U/mL penicillin,

PART III. Chapter 13 Antioxidant and ACE inhibitory activities of hydrolysates of brewers' spent grain proteins by proteases from spent yeast or by commercial
enzymes: protective capacity in Caco-2 and HepG2 cells
227
10,000 µg/mL streptomycin), Hanks balanced salt solution (HBSS) were purchased from
Invitrogen Corporations (Paisley, UK).
13.2.2. Equipments
The RP-HPLC analysis was carried out using an analytical HPLC system (Jasco, Tokyo,
Japan), equipped with a quaternary low pressure gradient HPLC pump (Jasco PU-1580), a
degasification unit (Jasco DG-1580-53 3-line degasser), an autosampler (Jasco AS-2057-
PLUS), a MD-910 multiwavelengh detector (Jasco) and a 7125 Rheodyne injector valve
(California, USA). The data acquisition was accomplished using Borwin Controller software,
version 1.50 (JMBS Developments, Le Fontanil, France). SE-HPLC analyses were
performed using a Gilson HPLC system (Gilson Medical Electronics, France), equipped with
a type 302 pump, a Gilson 118 variable wavelength ultraviolet detector and a 7125
Rheodyne injector. The equipment was controlled by a Gilson 712 software.
Spectrophotometric analyses were carried out using a BMG LABTECH´s SPECTROstar
Nano-microplate, cuvette UV/Vis absorbance reader (Offenburg, Germany). Fluorimetric
analyses were carried out using a fluorescence microplate reader (FLUOstar Optima, BMG
Labtech GmbH).
13.2.3. BSG protein extraction
BSG was supplied by Unicer brewing (Leça do Balio, Portugal). BSG protein substrate was
prepared by alkaline extraction and subsequent acid precipitation, as previously described
by Vieira et al. (4). Briefly, BSG (100 g) was added to 200 mL of 0.5 M KOH solution (ratio
1:2, w/v) for 2 h at 40ºC, with continuous shaking. After centrifugation at 15,000 x g, at 4ºC
during 15 min, the extract was acidified to pH 3 with a solution of 2 M citric acid. The final
residue of BSG presented a protein content of 49.13% dw (based on the Kjeldahl method)
and maximum solubility in Tris-HCl buffer, pH 8.0.
13.2.4. BSY proteases and commercial enzymes
BSY, supplied by Unicer brewing (Leça do Balio, Portugal), was collected from the brewery
with four reuses in the fermentation process. The BSY extract rich in proteases was
prepared according to a previous work (177). Proteolytic activity, determined by Sigma’s
non-specific protease method described by Cupp-Enyard (164), was 1 U/mL. Commercially
available enzymes Neutrase® and Alcalase® were used at the same activity levels to
compare hydrolysis efficiencies. For this purpose, Neutrase® and Alcalase® were diluted
in the respective buffer, sodium phosphate buffer pH 7.0 and 100 mM Tris-HCl pH 8.0, to
have the same proteolytic activity of 1 U/mL.
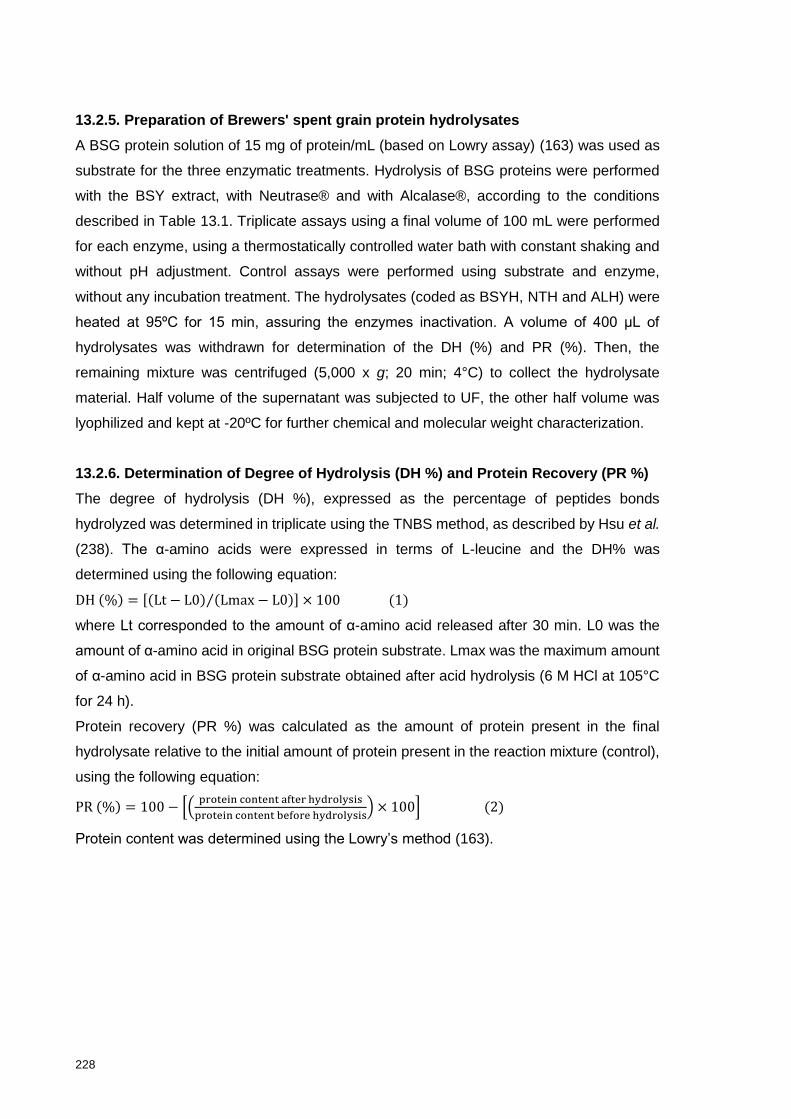
228
13.2.5. Preparation of Brewers' spent grain protein hydrolysates
A BSG protein solution of 15 mg of protein/mL (based on Lowry assay) (163) was used as
substrate for the three enzymatic treatments. Hydrolysis of BSG proteins were performed
with the BSY extract, with Neutrase® and with Alcalase®, according to the conditions
described in Table 13.1. Triplicate assays using a final volume of 100 mL were performed
for each enzyme, using a thermostatically controlled water bath with constant shaking and
without pH adjustment. Control assays were performed using substrate and enzyme,
without any incubation treatment. The hydrolysates (coded as BSYH, NTH and ALH) were
heated at 95ºC for 15 min, assuring the enzymes inactivation. A volume of 400 μL of
hydrolysates was withdrawn for determination of the DH (%) and PR (%). Then, the
remaining mixture was centrifuged (5,000 x g; 20 min; 4°C) to collect the hydrolysate
material. Half volume of the supernatant was subjected to UF, the other half volume was
lyophilized and kept at -20ºC for further chemical and molecular weight characterization.
13.2.6. Determination of Degree of Hydrolysis (DH %) and Protein Recovery (PR %)
The degree of hydrolysis (DH %), expressed as the percentage of peptides bonds
hydrolyzed was determined in triplicate using the TNBS method, as described by Hsu et al.
(238). The α-amino acids were expressed in terms of L-leucine and the DH% was
determined using the following equation:
DH (%) = [(Lt − L0) (Lmax − L0)⁄ ] × 100 (1)
where Lt corresponded to the amount of α-amino acid released after 30 min. L0 was the
amount of α-amino acid in original BSG protein substrate. Lmax was the maximum amount
of α-amino acid in BSG protein substrate obtained after acid hydrolysis (6 M HCl at 105°C
for 24 h).
Protein recovery (PR %) was calculated as the amount of protein present in the final
hydrolysate relative to the initial amount of protein present in the reaction mixture (control),
using the following equation:
PR (%) = 100 − [(protein content after hydrolysis
protein content before hydrolysis) × 100] (2)
Protein content was determined using the Lowry’s method (163).

PART III. Chapter 13 Antioxidant and ACE inhibitory activities of hydrolysates of brewers' spent grain proteins by proteases from spent yeast or by commercial enzymes: protective capacity in Caco-2 and HepG2 cells
229
Table 13.1. Conditions used for preparation of BSG protein hydrolysates
Enzyme Activity (U/mL)
Optimum Conditions Enzyme
composition Enzyme Source pH
T (ºC)
Time (h)
E/S ratio (iii)
BSY proteases
1 (i) 6.0 50 6 10 Serine and
Metaloproteases Saccharomyces
pastorianus
Neutrase® 1 (ii) 7.0 50 6 10 Metaloprotease Bacillus
amyloliquefaciens
Alcalase® 1 (ii) 8.0 50 6 10 Alkaline serine endopeptidase
Bacillus licheniformis
(i) Proteolytic activity determined by the Sigma’s non-specific protease assay. (ii) Proteolytic activity obtained after dilution of the commercially available enzyme with respective buffer: 100 mM sodium
phosphate buffer (pH 7); 100 mM Tris-HCl (pH 8.0). (iii) E/S ratio of 0.10:1 U/mg (10 mL enzyme for 100 mL of BSG protein solution of 15 mg of protein/mL (based on the Lowry
method).

13.2.7. Characterization of BSG protein hydrolysates
13.2.7.1. Proximate composition analysis
Lyophilized BSG protein hydrolysates were analyzed in terms of protein content (total
nitrogen was determined by the Kjeldahl method x 6.25), fat content (Soxhlet extraction with
n-hexane for 12 h), ash content (incineration in a muffle furnace at 550ºC until the ash had
a white appearance) and dry matter (oven at 105ºC until constant weight), determined
according to AOAC official methods (144). All assays were performed in triplicate and the
contents were expressed on a dry weight basis (% dw).
13.2.7.2. Molecular weight distribution profile
Molecular weight distributions of BSG protein hydrolysates were determined by SE-HPLC.
The column used was a PSS Proteema Analytical 100 Å column (Amersham Biosciences,
UK), equilibrated with 50 mM sodium phosphate buffer, 0.15 M NaCl, pH 6.6 at a flow rate
of 0.5 mL/min and calibrated using a standard mixture of eleven molecular weight markers:
Myosin (205 kDa), β-Galactosidase (116 kDa), Phosphorilase β (97 kDa), Transferrin (80
kDa), BSA (66 kDa), Glutamate dehydrogenase (55 kDa), Ovalbumin (45 kDa), Carbonic
anhydrase (30 kDa), Trypsin inhibitor (21 kDa), Lysozyme (14 kDa) and Aprotinin (6.6 kDa).
Aliquots of samples (0.1 % w/v protein) were dissolved in the mobile phase and an injection
volume of 20 µL was used. Detection was monitored at 214 nm and analyses were
performed in triplicate.
13.2.7.3. Proteins and peptides profile
RP-HPLC was carried out according to the method of Ferreira et al. (185). Gradient elution
was carried out at a flow‐rate of 1 mL/min, using a mixture of two solvents. Solvent A was
0.1% (v/v) TFA in water and solvent B was acetonitrile‐water‐trifluoracetic acid 95∶5∶0.1
(v/v/v). Aliquots of samples (0.1% w/v protein) were dissolved in solvent A, filtered through
0.2 μm syringe filters and injected (50 µL) on a Chrompack P 300 RP
(polystyrenedivinylbenzene copolymer, 8 µm, 300Å, 150 x 4.6 mm i.d.) (Chrompack,
Middleburg, The Netherlands) column maintained at room temperature. Detector response
was monitored at 214 nm and analyses were performed in triplicate.
13.2.8. Ultrafiltration of BSG protein hydrolysates
BSG protein hydrolysates were fractionated through UF membranes with MWCO of 10 and
3 kDa. Unfractionated hydrolysates and respective fractions <10 kDa and <3 kDa were
lyophilized and stored at -20°C. ACE-I activity, chemical antioxidant activity, and cell-based
antioxidant activity assays were further performed.

PART III. Chapter 13 Antioxidant and ACE inhibitory activities of hydrolysates of brewers' spent grain proteins by proteases from spent yeast or by commercial
enzymes: protective capacity in Caco-2 and HepG2 cells
231
13.2.9. ACE-I activity
The ACE-I activity of hydrolysates and their <10 kDa and <3 kDa fractions were determined
at the concentration of 1.0 mg/mL. ACE was extracted from rabbit lung acetone powder with
100 mM sodium borate buffer (pH 8.3) containing 300 mM NaCl, according to the procedure
described by Minervini et al. (165). Prior to assay, the supernatant was diluted 10-fold with
50 mM potassium phosphate buffer, pH 8.3, so that it would have the same ACE activity as
the commercial preparation (3 U/mg of protein). ACE-I activity was measured using the
fluorimetric assay of Sentandreu and Toldrá (121), with the modifications reported by Quirós
et al. (122). ACE-I percentage (I) was calculated using the equation:
I % = (B − A)|(B − C) × 100 (3)
where B is the fluorescence of the ACE solution without the inhibitor (BSG hydrolysate); A
is the fluorescence of the tested sample of BSG hydrolysate; and C is the fluorescence of
experimental blank, o-ABz-Gly-Phe(NO2)-Pro dissolved in 150 mM Tris-base buffer (pH
8.3), containing 1.125 M NaCl. The percent inhibition curves (using a minimum of five
determinations for each sample peptide concentration) were plotted versus protein
concentration to estimate the mean IC50 value, which is defined as the concentration
required to decrease the ACE activity by 50% (122). Protein content was determined using
the Lowry’s method (163).
13.2.10. Chemical antioxidant activities
The chemical antioxidant activities of hydrolysates and their <10 kDa and <3 kDa fractions
were determined at the concentration of 1.0 mg/mL. The TPC was measured using the
Folin-Ciocalteu method as previously described by Herald et al. (155). Gallic acid was used
as standard at 10-500 μM to produce a calibration curve (average R2 = 0.9899) and
absorbance was measured at 765 nm. Results were expressed as mg of Gallic acid
equivalent per mg of sample (mg GAE/mg dw). The FRAP was estimated according to the
procedure of Jansen and Ruskovska (154). Trolox was used as standard at 10-500 μM to
generate a calibration curve (average R2 = 0.9968) and absorbance was measured at 595
nm. Results were expressed as mg of Trolox equivalent per mg of sample (mg TE/mg dw).
13.2.11. Cell-based antioxidant activities
13.2.11.1. Cell culture routine
Caco-2 (human colon adenocarcinoma cell line) and HepG2 (human hepatocarcinoma cell
line) cells were routinely cultured in 75 cm2 flasks (BD Biosciences, Oxford, UK) using
DMEM with high glucose medium, supplemented with 10% FBS and 1% antibiotic solution
(10,000 U/mL penicillin, 10,000 µg/mL streptomycin). The cells were incubated at 37ºC
under a humidified atmosphere condition that contained 5% CO2. The medium was changed

232
every other day. When cells reached 70-80% confluent monolayer cells, cells were
detached by trypsinization (0.25% trypsin) and subcultured over a maximum of 10
passages.
13.2.11.2. Samples preparation to cell culture studies
For all BSG protein hydrolysates, <10 kDa lyophilized fractions were dissolved in HBSS to
obtain two final concentrations: 0.1 mg/mL and 1.0 mg/mL.
13.2.11.3. Cell viability determination
Cell viability was determined using the MTT (3-(4,5-dimethylthiazol-2-yl)-2,5-
diphenyltetrazolium bromide) assay, as previously reported by Dias da Silva et al. (183).
Caco-2 and HepG2 cells at the same density of 8x10⁴ cells/well were seeded onto the
central 60 wells of 96-well plates (BD Biosciences, Oxford, UK) to obtain confluent
monolayers within 2 days. Then, the cells were incubated for 24 h at 37°C with the <10 kDa
samples at the concentrations of 0.1 mg/mL and 1.0 mg/mL. Peripheral wells on the plate
were filled with sterile water to avoid evaporation of the treatment solutions. A media blank
(no cells) to account for the color of the samples; a negative control (NEGc, cells treated
with medium only) and a positive control (POSc, cells treated with medium and 1% Triton
X-100) were also included in the plate. After cell treatment with the test samples, the culture
medium was aspirated and the attached cells were rinsed with 200 µL HBSS, followed by
the addition of fresh culture medium containing 0.25 mg/L MTT. After 30 min of incubation
(37°C, 5% CO2), the formed intracellular crystals of formazan were dissolved in 100 µL
100% dimethyl sulfoxide (DMSO). The quantity of formazan crystals was determined by
measuring the absorbance at 570 nm. Cell viability (%) was calculated relative to the
maximum viability of NEGc. Data were obtained from three independent experiments, with
each plate containing six replicates of each test sample.
13.2.11.4. Mitochondrial integrity determination
Mitochondrial integrity was performed by measuring the tetramethylrhodamine ethyl ester
perchlorate (TMRE) inclusion, as previously reported by Dias da Silva et al. (183). TMRE is
a cell permeable fluorescent dye that specifically stains live mitochondria and accumulates
in proportion to mitochondrial membrane potential (Dcm). Maintenance of Dcm is extremely
important for normal cell function (183). For both cell lines, 8x10⁴ cells were seeded onto
96-well black plates. After 24 h, the media was gently aspirated and the cells were incubated
with each <10 kDa samples at concentrations of 0.1 mg/mL and 1.0 mg/mL (at 37ºC, 5%
CO2). At the end of the 24 h incubation period, the cells were rinsed twice with HBSS and
incubated at 37ºC with 100 µL of 2 mM TMRE for 30 min. Then, the media was gently
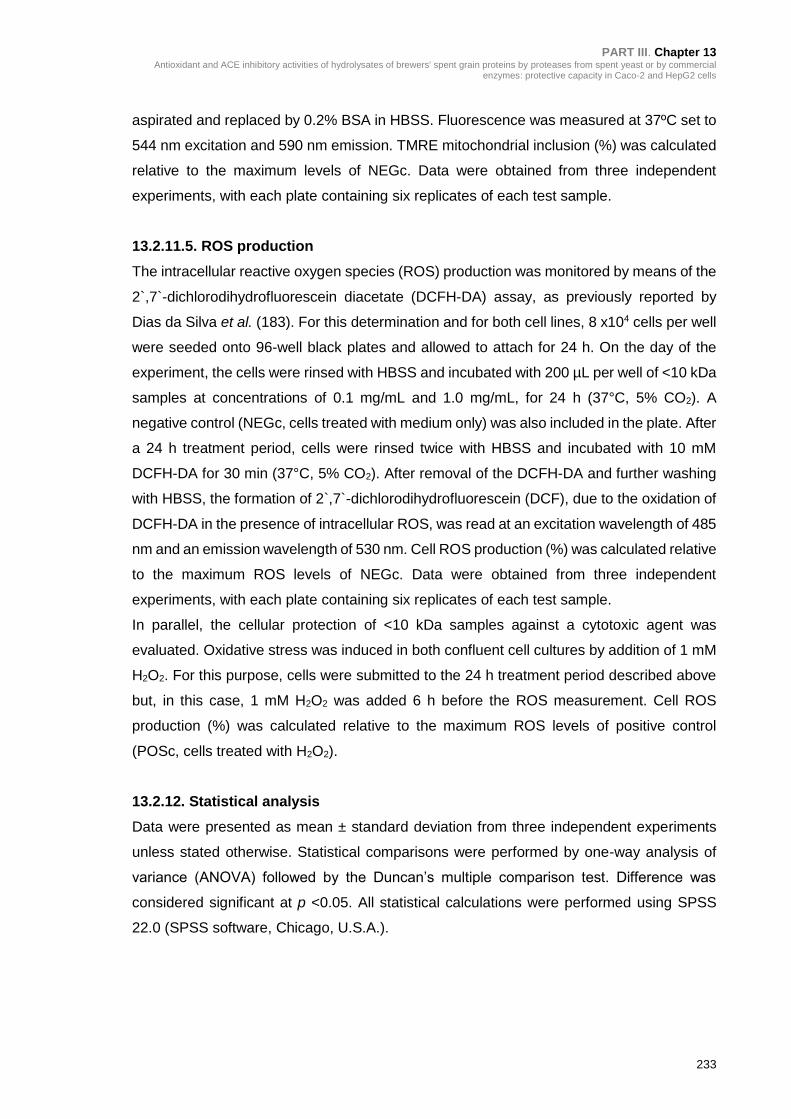
PART III. Chapter 13 Antioxidant and ACE inhibitory activities of hydrolysates of brewers' spent grain proteins by proteases from spent yeast or by commercial
enzymes: protective capacity in Caco-2 and HepG2 cells
233
aspirated and replaced by 0.2% BSA in HBSS. Fluorescence was measured at 37ºC set to
544 nm excitation and 590 nm emission. TMRE mitochondrial inclusion (%) was calculated
relative to the maximum levels of NEGc. Data were obtained from three independent
experiments, with each plate containing six replicates of each test sample.
13.2.11.5. ROS production
The intracellular reactive oxygen species (ROS) production was monitored by means of the
2`,7`-dichlorodihydrofluorescein diacetate (DCFH-DA) assay, as previously reported by
Dias da Silva et al. (183). For this determination and for both cell lines, 8 x10⁴ cells per well
were seeded onto 96-well black plates and allowed to attach for 24 h. On the day of the
experiment, the cells were rinsed with HBSS and incubated with 200 µL per well of <10 kDa
samples at concentrations of 0.1 mg/mL and 1.0 mg/mL, for 24 h (37°C, 5% CO2). A
negative control (NEGc, cells treated with medium only) was also included in the plate. After
a 24 h treatment period, cells were rinsed twice with HBSS and incubated with 10 mM
DCFH-DA for 30 min (37°C, 5% CO2). After removal of the DCFH-DA and further washing
with HBSS, the formation of 2`,7`-dichlorodihydrofluorescein (DCF), due to the oxidation of
DCFH-DA in the presence of intracellular ROS, was read at an excitation wavelength of 485
nm and an emission wavelength of 530 nm. Cell ROS production (%) was calculated relative
to the maximum ROS levels of NEGc. Data were obtained from three independent
experiments, with each plate containing six replicates of each test sample.
In parallel, the cellular protection of <10 kDa samples against a cytotoxic agent was
evaluated. Oxidative stress was induced in both confluent cell cultures by addition of 1 mM
H2O2. For this purpose, cells were submitted to the 24 h treatment period described above
but, in this case, 1 mM H2O2 was added 6 h before the ROS measurement. Cell ROS
production (%) was calculated relative to the maximum ROS levels of positive control
(POSc, cells treated with H2O2).
13.2.12. Statistical analysis
Data were presented as mean ± standard deviation from three independent experiments
unless stated otherwise. Statistical comparisons were performed by one-way analysis of
variance (ANOVA) followed by the Duncan’s multiple comparison test. Difference was
considered significant at p <0.05. All statistical calculations were performed using SPSS
22.0 (SPSS software, Chicago, U.S.A.).

234
13.3. RESULTS AND DISCUSSION
13.3.1. Measuring the extent of hydrolysis
BSG proteins were hydrolyzed by three different enzyme approaches: a BSY extract
rich in proteases, Neutrase® and Alcalase®. Hydrolyses were carried out under the same
conditions: 50ºC, 4 h and using the same E/S ratio of 0.10:1 U/mg; enzymes were compared
at the same proteolytic activity (1 U/mL). Few studies have been conducted comparing
enzymes on the basis of their proteolytic activity, usually researchers compare enzyme
activity on a weight basis of enzymes used in the reaction mixture, which constitutes a
limitation (194). The DH (%) was used as an indicator of the hydrolysis progress and PR
(%) as an indicator of the hydrolysis yield (219), (295). The hydrolysis yield (%) of BSG
protein hydrolysates (% dw) is present in Table 13.2. Results show that the DH % for BSYH,
NTH and ALH were 8.27%, 4.63% and 10.4%, respectively. Higher hydrolysis was observed
for ALH. Results from PR % were 58.9%, 37.2% and 62.2% for BSYH, NTH and ALH,
respectively. Similar to observed by other authors (194), (338), Alcalase® exhibited higher
hydrolytic activities than Neutrase®, although these values are different from those
observed by other authors, in which Alcalase® treatment was used to produce BSG protein
hydrolysates (253), (309). For instance, Connolly et al. (309) reported a DH (%) of ~12%
when BSG protein was hydrolyzed at 50ºC, pH 9, using an E/S ratio of 2.5% (v/w) for 4 h.
These differences can be explained by the different procedures used to prepare the BSG
protein substrate, different hydrolysis conditions applied, namely, the proteolytic activity of
enzyme and reaction time, as well as, the different methods employed to evaluate the DH
%.
13.3.2. Proximate composition of BSG protein hydrolysates
The proximate composition of BSG protein hydrolysates (% dw) obtained by the three
enzymatic treatments is presented in Table 13.2. The protein content was similar in the
three hydrolysates, ranging between 68.0-76.6% (dw). The nutritional composition of ALH
was different from that reported by Celus et al. (8). This difference may be attributed to the
difference in raw materials and the processes involved in preparing the Alcalase
hydrolysates. BSYH presented the highest content of ash (8.12%), presumably due to the
buffer required for the preparation of the BSY extract rich in proteases, but a significantly (p
<0.05) lower content in fat (2.42%). In general, the high protein content and low fat content
of all hydrolysates may provide an incentive for use in commercial preparations.

PART III. Chapter 13 Antioxidant and ACE inhibitory activities of hydrolysates of brewers' spent grain proteins by proteases from spent yeast or by commercial
enzymes: protective capacity in Caco-2 and HepG2 cells
235
Table 13.2. Hydrolysis yield (%) and proximate composition (% dw) of BSG protein
hydrolysates
13.3.3. Molecular weight distribution and peptides/proteins profile
The BSG protein substrate consisted of relatively large molecular mass proteins,
containing hordeins D (~96 kDa) and mostly hordeins C (~55-80 kDa) and hordeins B (~35-
50 kDa), as reported by Vieira et al. (4) and Celus et al. (339) (results not shown). In
agreement with Connolly et al. (253), 54.6% of the large mass components of the BSG
protein substrate were higher than ~15 kDa. After enzymatic treatments, proteins were
broken down into smaller molecular weight peptides; the distribution profiles obtained are
presented in Figure 13.1.A. Results showed that BSG protein hydrolysates were composed
of a wide range of protein/peptide bands with molecular weight less than ~62 kDa for BSYH;
less than ~60 kDa for NTH and less than ~50 kDa for ALH. BSYH was composed of major
protein bands with molecular weight of ~45 and ~21 kDa and the highest (p <0.05) quantity
of low molecular weight peptides (< 6.6 kDa). ALH showed a major protein band with
molecular weights between ~21 and 6.6 kDa. Of the three enzymes, NTH had the lowest
percentage of low molecular weight peptides (< 6.6 kDa) and an appreciable protein band
with molecular weight between ~60 kDa and ~52 kDa, denoting the lowest efficiency in
protein breakdown. In general, the molecular weight profiles of these hydrolysates are in
agreement with the values of DH% and PR% obtained for the three treatments.
The RP-HPLC profiles of BSG protein hydrolysates with different DH% are presented
in Figure 13.1.B, which demonstrated considerable variation in peptide composition. RP-
HPLC profiles were divided into three fractions: fraction I consisted of the “less hydrophobic
fragments” eluting between 4 and 12.5 min, fraction II contained the “hydrophobic
Sample
code
Hydrolysis Yield (%) Proximate Composition (% dw)
DH (i) PR (ii) Protein Ash Fat
BSYH 8.27±0.97 a 58.9±1.71 a 76.7±4.10 a 8.12±3.30 a 2.42±0.75 b
NTH 4.63±0.62 b 37.2±1.49 b 68.0±4.97 a 6.53±0.38 b 3.84±0.50 a
ALH 10.4±1.42 a 62.2±2.15 a 71.3±3.30 a 6.87±0.14 b 4.59±0.35 a
(i) Degree of hydrolysis (DH %) determined with TNBS. (ii) Protein recovery (PR %) determined by Lowry method.
Results are expressed as mean ± standard deviation of triplicate experiments. For
each assay, means that do not share a letter are significantly different at p <0.05.
Statistical analysis were performed by ANOVA followed by Duncan's multiple
comparison test.

236
polypeptides” that eluted between 12.5 and 25 min and fraction III contained the “protein
fractions” with elution between 25 and 55 min. Proteins eluted mainly in fraction III, similarly
to what was already observed in our previous study (4). Comparing the percentage area of
the three fractions relative to the total area of the RP-HPLC chromatogram, results show
that with increasing DH, the level of fraction I increased, while the proportions of fractions II
and III decreased. The higher percentage area of fraction I was observed for ALH, which
had also higher DH%. In opposite, NTH presented the smallest area of fraction I, suggesting
that this enzyme is not very efficient in the BSG protein hydrolysis.
Figure 13.1. SE-HPLC (A) and RP-HPLC (B) profiles of BSG protein hydrolysates with
different DH (%), obtained after enzymatic hydrolysis with BSY extract (BSYH), Neutrase®
(NTH) and Alcalase® (ALH). Absorbance (214 nm) is expressed in arbitrary units (AU). In
the SE-HPLC profile, elution times of molecular weight markers with molecular weight
between 6.6 and 66 kDa are indicated from left to right. BSG protein hydrolysates were
analyzed at same protein concentration (1 mg/mL), using 20 µL of this solution to the
column. RP-HPLC profiles are divided into three fractions: I- “Less hydrophobic”; II-
“Polypeptides” and III- “Proteins”.
(A)
(B)

PART III. Chapter 13 Antioxidant and ACE inhibitory activities of hydrolysates of brewers' spent grain proteins by proteases from spent yeast or by commercial
enzymes: protective capacity in Caco-2 and HepG2 cells
237
13.3.4. Effect of UF on ACE-I activity of BSG protein hydrolysates
BSG protein hydrolysates were fractionated using two kinds of UF membranes (10
and 3-kDa MWCO membranes) and two kinds of permeates were obtained, the fractions
<10 kDa and the fractions <3 kDa. It should be highlighted that the molecular weight
distributions of these fractions was similar, although the relative proportions of the peaks
varied according to the MWCO size of the membrane used, meaning that the UF technique
enriched the fractions of their respective size rather than accurately separated the proteins
and peptides according to size (340). The BSG protein substrate, the hydrolysates and <10
kDa and <3 kDa fractions were screened for their ACE-I potential at 1.0 mg/mL. The ACE-
I activities obtained are presented in Figure 13.2.A. The results show that the IC50 of BSG
protein substrate (coded as NT; no treatment) was 1.45 mg protein/mL, meaning that some
peptides with ACE-I could be naturally present in BSG protein substrate, as a result of the
alkaline procedure employed for extraction of protein fraction. ALH showed the strongest
ACE-I activities (p <0.05) among the three hydrolysates tested, with an IC50 of 0.385 mg
protein/mL. This result is correlated with the higher DH observed for this enzymatic
treatment. Other authors also obtained a good correlation between the DH and the IC50
(253), (309), (341). Moreover, this result is in agreement with that reported recently by
Connolly et al. (253), in which the ACE-I activity of BSG protein hydrolysates using
Alcalase® was evaluated using the fluorimetric assay, and an IC50 of 0.340 mg protein/mL
was observed. Small differences with the IC50 values obtained in this work may be due to
the differences in temperature, E/S ratio and time conditions employed in the generation of
the hydrolysates, as well as, with some differences in the method used to determine the
ACE-I activity. The IC50 values of BSYH and NTH were 0.820 mg protein/mL and 0.615 mg
protein/mL, respectively. In order to determine if the observed ACE-I activities are due to
specific molecular mass fractions in the protein hydrolysate, UF was performed. ACE-I
activity tends to increase with the decrease of molecular weight. In the case of BSYH and
NTH, using a 3 kDa MWCO, this activity was enhanced. The IC50 values of the <3 kDa
fractions were respectively, 0.652 and 0.512 mg protein/mL, corresponding to an increase
of 20% and 17% of ACE-I activity. These results are in accordance with previously studies,
which reported that ACE-I peptides are composed of a small number of amino acids, less
than 3 kDa (342), (330). For BSYH, no statistical differences (p <0.05) were observed
between the ACE-I activity obtained for <10 kDa and <3 kDa fractions. In opposite, for ALH,
the <10 kDa fraction allowed an enhancement of 19% on the ACE-I activity (IC50 of 0.312
mg protein/mL). This result is in agreement with Connolly et al. (253), who reported that the
IC50 values of the unfractionated hydrolysate were lower than the respective 5 kDa and 3
kDa fractions.

238
Figure 13.2. Comparison of ACE-I activity (A), Total Phenolic Content (B) and FRAP (C) of
BSG protein starting material (NT, no treatment), full BSG protein hydrolysates (BSYH,
NTH, ALH) and respective <10 kDa and <3 kDa fractions. Each bar represents the mean ±
standard deviation of triplicate experiments. For each assay, bars labeled with different
letters have mean values that are significantly different at p <0.05. Statistical analysis were
performed by ANOVA followed by Duncan's multiple comparison test.
13.3.5. Effect of UF on antioxidant activity of BSG protein hydrolysates
Chemically based antioxidant activities of the BSG protein substrate, hydrolysates
and fractions <10 kDa and <3 kDa were investigated based on the TPC and FRAP assays.
Results are presented in Figure 13.2.B and 13.2.C, respectively. Results show that all
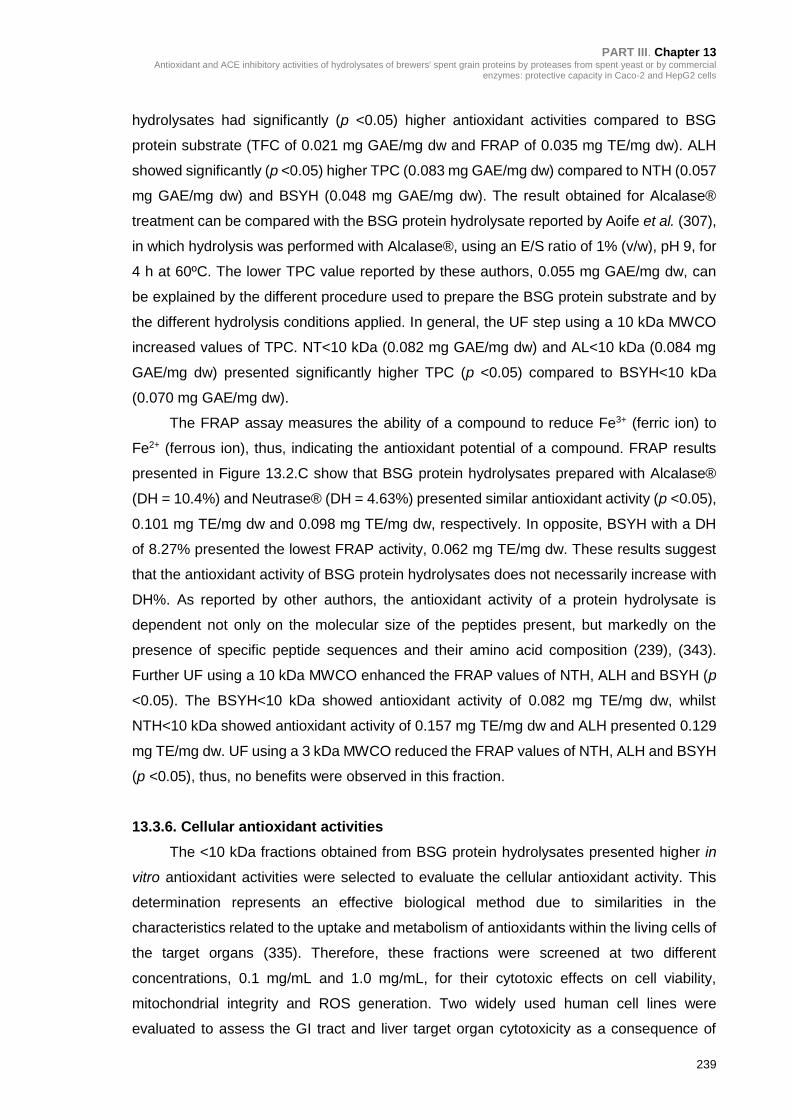
PART III. Chapter 13 Antioxidant and ACE inhibitory activities of hydrolysates of brewers' spent grain proteins by proteases from spent yeast or by commercial
enzymes: protective capacity in Caco-2 and HepG2 cells
239
hydrolysates had significantly (p <0.05) higher antioxidant activities compared to BSG
protein substrate (TFC of 0.021 mg GAE/mg dw and FRAP of 0.035 mg TE/mg dw). ALH
showed significantly (p <0.05) higher TPC (0.083 mg GAE/mg dw) compared to NTH (0.057
mg GAE/mg dw) and BSYH (0.048 mg GAE/mg dw). The result obtained for Alcalase®
treatment can be compared with the BSG protein hydrolysate reported by Aoife et al. (307),
in which hydrolysis was performed with Alcalase®, using an E/S ratio of 1% (v/w), pH 9, for
4 h at 60ºC. The lower TPC value reported by these authors, 0.055 mg GAE/mg dw, can
be explained by the different procedure used to prepare the BSG protein substrate and by
the different hydrolysis conditions applied. In general, the UF step using a 10 kDa MWCO
increased values of TPC. NT<10 kDa (0.082 mg GAE/mg dw) and AL<10 kDa (0.084 mg
GAE/mg dw) presented significantly higher TPC (p <0.05) compared to BSYH<10 kDa
(0.070 mg GAE/mg dw).
The FRAP assay measures the ability of a compound to reduce Fe3+ (ferric ion) to
Fe2+ (ferrous ion), thus, indicating the antioxidant potential of a compound. FRAP results
presented in Figure 13.2.C show that BSG protein hydrolysates prepared with Alcalase®
(DH = 10.4%) and Neutrase® (DH = 4.63%) presented similar antioxidant activity (p <0.05),
0.101 mg TE/mg dw and 0.098 mg TE/mg dw, respectively. In opposite, BSYH with a DH
of 8.27% presented the lowest FRAP activity, 0.062 mg TE/mg dw. These results suggest
that the antioxidant activity of BSG protein hydrolysates does not necessarily increase with
DH%. As reported by other authors, the antioxidant activity of a protein hydrolysate is
dependent not only on the molecular size of the peptides present, but markedly on the
presence of specific peptide sequences and their amino acid composition (239), (343).
Further UF using a 10 kDa MWCO enhanced the FRAP values of NTH, ALH and BSYH (p
<0.05). The BSYH<10 kDa showed antioxidant activity of 0.082 mg TE/mg dw, whilst
NTH<10 kDa showed antioxidant activity of 0.157 mg TE/mg dw and ALH presented 0.129
mg TE/mg dw. UF using a 3 kDa MWCO reduced the FRAP values of NTH, ALH and BSYH
(p <0.05), thus, no benefits were observed in this fraction.
13.3.6. Cellular antioxidant activities
The <10 kDa fractions obtained from BSG protein hydrolysates presented higher in
vitro antioxidant activities were selected to evaluate the cellular antioxidant activity. This
determination represents an effective biological method due to similarities in the
characteristics related to the uptake and metabolism of antioxidants within the living cells of
the target organs (335). Therefore, these fractions were screened at two different
concentrations, 0.1 mg/mL and 1.0 mg/mL, for their cytotoxic effects on cell viability,
mitochondrial integrity and ROS generation. Two widely used human cell lines were
evaluated to assess the GI tract and liver target organ cytotoxicity as a consequence of

240
exposure to these fractions. Cell viability, defined as the potential of a compound to induce
cell death (336), was assessed using the MTT assay. In this study, a clear difference
between the HepG2 cell line (human liver) and the Caco-2 cell line (human intestine) was
observed regarding the exposure to <10 kDa fractions. Results showed a significantly (p
<0.05) concentration-dependent decrease (maximum of 26%) in Caco-2 cell viability
compared with the NEGc, after 24 h of exposure to <10 kDa fractions (Figure 13.3.A). This
result indicates a relatively low cytotoxic effect for Caco-2 cell model at concentrations of
1.0 mg/mL, which is in agreement to the observed by other kind of hydrolysates (337), (181),
(344). In the case of HepG2 cell line, the ALH<10 kDa fraction, at the concentration of 0.1
mg/mL, significantly (p <0.05) decreased the viability below 35% of the NEGc (p <0.05). On
the other hand, the BSYH< 10 kDa fraction, at the concentration of 1.0 mg/mL, showed a
significant increase (p <0.05) in HepG2 cells viability (Figure 13.3.B).
In order to investigate whether the <10 kDa fractions could disturb the mitochondrial
function, the mitochondrial membrane potential was evaluated through the TMRE inclusion.
Results present in Figure 13.3.A showed that, except for ALH<10 kDa at the concentration
of 1.0 mg/mL, all fractions were not effective in generating significant mitochondrial
disruption in Caco-2 cell line, with decreases less than ~6% compared to NEGc. Regarding
the HepG2 cell line (Figure 13.3.B), as observed for cell viability, the TMRE inclusion was
significantly (p <0.05) lower for ALH<10 kDa at both test concentrations, 0.1 and 1.0 mg/mL.
These results support the view of differential sensitivity of BSG protein hydrolysates among
HepG2 and Caco-2 cellular models, but further investigation is needed.
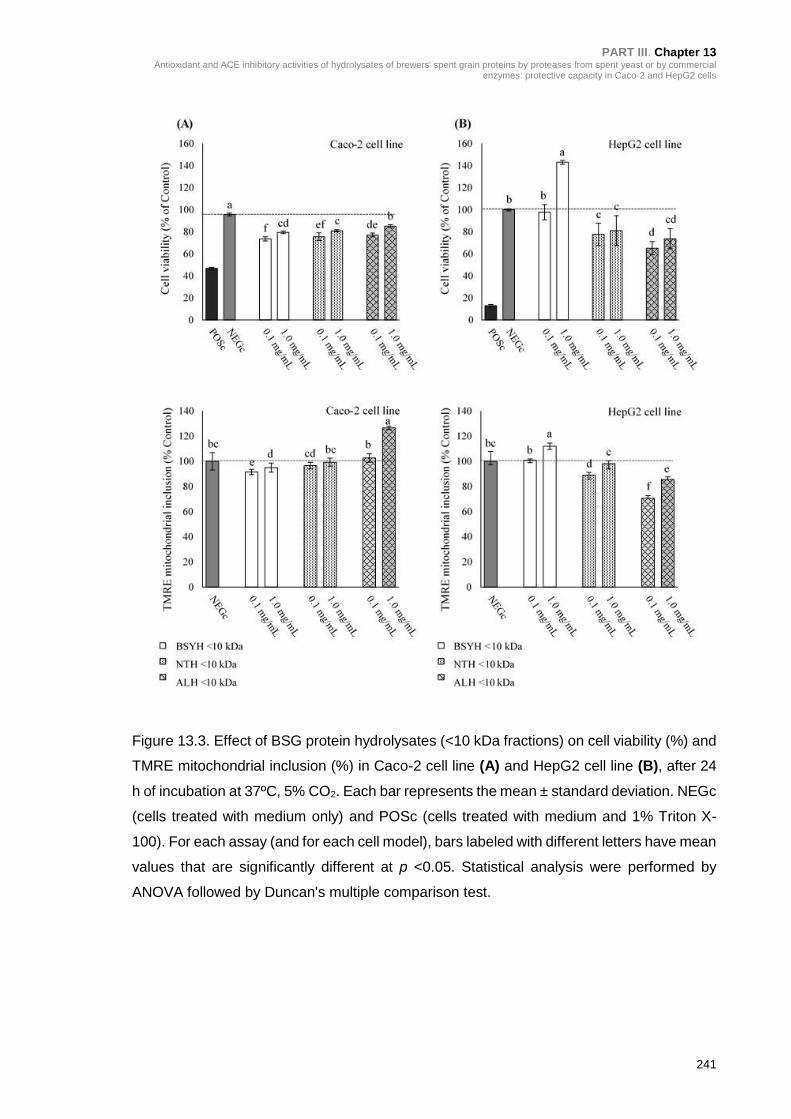
PART III. Chapter 13 Antioxidant and ACE inhibitory activities of hydrolysates of brewers' spent grain proteins by proteases from spent yeast or by commercial
enzymes: protective capacity in Caco-2 and HepG2 cells
241
Figure 13.3. Effect of BSG protein hydrolysates (<10 kDa fractions) on cell viability (%) and
TMRE mitochondrial inclusion (%) in Caco-2 cell line (A) and HepG2 cell line (B), after 24
h of incubation at 37ºC, 5% CO2. Each bar represents the mean ± standard deviation. NEGc
(cells treated with medium only) and POSc (cells treated with medium and 1% Triton X-
100). For each assay (and for each cell model), bars labeled with different letters have mean
values that are significantly different at p <0.05. Statistical analysis were performed by
ANOVA followed by Duncan's multiple comparison test.

242
Figure 13.4. Protective effect of BSG protein hydrolysates (<10 kDa fractions at
concentrations of 0.1 and 1.0 mg/mL) for 24 h against oxidative stress induced by H2O2 (6
h of exposure) in Caco-2 cell line (A) and HepG2 cell line (B). Each bar represents the
mean ± standard deviation. NEGc (cells treated with medium only); POSc (cells treated with
medium and H2O2). (#) indicates respective differences between “no oxidative stress” and
“oxidative stress” treatments at p <0.05. For “no oxidative stress” treatment (and for each
cell model), bars labeled with different subscript letters have mean values that are
significantly different at p <0.05. For “oxidative stress” treatment (and for each cell model),
bars labeled with different superscript letters have mean values that are significantly
different at p <0.05. Statistical analysis were performed by ANOVA followed by Duncan's
multiple comparison test.
13.4. CONCLUSIONS
In conclusion, the <3 kDa fraction of ALH displayed the highest ACE-I activity,
whereas <10 kDa fractions presented increased in vitro antioxidant potential and inhibited
the intracellular ROS generation, as well, exerted a protective ability against H2O2 induced
oxidative damage in Caco-2 and HepG2 cell lines. While much evidence exists with regard
to BSG protein hydrolysates obtained from commercial enzymes, to our knowledge, this is
the first study on the bioactivity of BSG protein hydrolysates prepared by a BSY extract rich
in proteases. Therefore, the results obtained in this work suggest that these kind of
hydrolysates may be useful functional ingredients to be used in food or pharmaceutical
industries. Further work must be undertaken to identify the peptides that are responsible for
exerting these activities.

General conclusions and
future prospects
____________________

244

General conclusions and Future prospects
245
GENERAL CONCLUSIONS
The experimental work presented in this Ph.D. thesis is an effort to find a scientific
basis for the valorisation of the main agro-industrial by-products from brewing and canned
sardine industry. The sustainable exploitation of these by-products is of major relevance for
both industries, in terms of economic and environmental perspectives. Brewer´s spent yeast
(BSY) autolysates, sardine protein hydrolysates (SPH) and brewer´s spent grain (BSG)
protein hydrolysates were prepared through RSM optimization and presented enhanced in
vitro antioxidant and/ or ACE-I activities, when compared to the initial raw materials,
suggesting its potential use as new bioactive ingredients. The major findings of the research
undertaken are briefly discussed as follows.
Part I of this dissertation was focused on the potential reuse of BSY (Saccharomyces
pastorianus), the second major by-product of the brewing process. A mechanic disruption
method (using glass beads, under refrigerated conditions) of yeast cells and removal of the
cell wall fraction was applied to produce a BSY extract, which comprises the inner content
of yeast cells. Usually, autolysis is the conventional process applied to produce BSY
extracts and recover the β-glucans and fibre fractions. Autolytic process involves incubation
of cell suspensions of BSY at temperatures ranging from 45 to 60°C with a reaction time
between 8 and 72 h; the final autolysate is a mixture of the cell wall and the inner yeast cell
content. By contrast, the adoption of mechanic disruption before autolysis allowed the
effective separation of two important cell fractions: (i) yeast cell wall rich in β-glucans and
fibre and (ii) the intracellular content (BSY extract) composed by proteins, proteases, RNA,
minerals and vitamins - both potential ingredients to be used in the formulation of functional
foods and nutraceuticals.
The nutritional composition, antioxidant activity and phenolic compounds profile of
BSY extract obtained by mechanic disruption was described in Chapter 2. Data showed
that BSY extract presented high content of proteins (64%) with an amino acid profile well-
balanced for human consumption (PER of 2.4), RNA (4%), vitamins (B3, B6 and B9),
macrominerals and trace elements. Additionally, BSY extract presented in vitro antioxidant
activity and phenolic compounds in both the free and bounded forms, namely, gallic acid,
protocatechuic acid, (±)catechin, p-coumaric, ferulic and cinnamic acids. Besides these
compounds explain the antioxidant activity of the BSY extract, others that were not
evaluated, namely, glutathione, maillard reaction products, sulfur-containing amino acids,

246
peptides as the peptide cyclo(His-Pro), and polysaccharides may also contribute to the
observed activity.
The brewer’s yeast is reused in the fermentation process several times until its
disposal, therefore the influence of serial repitching on the bioactivity of the BSY extract
was investigated in Chapter 3. BSY extracts were prepared from yeast biomass with 2, 3,
4 reuses, as well as, from a mixture of yeast biomass with different number of reuses in the
brewing process. The TPC, TFC, antioxidant properties, ACE-I and proteolytic activities
were in the range of 255-304 µM GAE/mL; 187-308 µM CE/mL; 255-304 µM TE/mL (FRAP
assay), 255-304 µM TE/mL (DPPH assay); 255-304 µM TE/mL (RP assay), 266-468 µg
protein/mL (IC50) and 0.14-0.22 U/mL, respectively. The antioxidant activity of BSY extract
was comparable to the conventional synthetic antioxidant ascorbic acid, tested at the
concentration of 500 µM, suggesting that BSY extract has potential application as a natural
antioxidant ingredient in food systems. Additionally, the proteolytic activity of the BSY
extracts indicated that in opposite to the conventional autolytic process, which applies high
temperatures, the mechanic disruption process under refrigerated conditions employed in
this work presents the advantage of recovery of native enzyme fraction. Hence, BSY extract
was found to be a promising source of proteases to be used in the production of protein
hydrolysates from different food matrices. Data of this experimental work also showed that
the number of the yeast reuses in the brewing process does not influence significantly the
antioxidant activity of BSY extracts; exhibiting, however, a negative effect in the proteolytic
and ACE-I activities. Moreover, TPC, TFC, antioxidant properties and ACE-I activity
presented good stability during a storage period of 6 months at -25ºC, although the
proteolytic activity of BSY extracts decreased of approximately 50% after 4 months of
storage at -25ºC. This last result indicated that the use of BSY extract as a source of
proteases implies correct management and storage period for less than 4 months.
In Chapter 4, the BSY extract (rich in proteins and proteases) was submitted to
autolysis, with the aim to enhance the antioxidant and ACE-I activities. RSM was the
statistical methodology applied to optimize the autolysis conditions (temperature and time).
Optimum autolysis conditions were 36.0ºC, 6.0 h, pH of 6.0 by which, the BSY autolysate
presented TPC, FRAP and ACE-I activity of 385 µM GAE/mL, 374 µM TE/mL and 379 µg
protein/mL, respectively. Those activities were significantly higher than the biological
activities of the original BSY extract. In comparison with the conventional autolytic process,
the autolysis process optimized in this work employs mild conditions (lower temperatures
and reduced autolysis time), which can be economically advantageous from an industrial
point of view. On the other hand, this process overcomes some limitations associated with

General conclusions and Future prospects
247
conventional autolytic process, such as, the low extraction yield, difficult separation of cell
debris, production of several off-favour compounds and risk of deterioration due the
microbial contamination.
As described in Chapter 5, the low-molecular-weight fraction of BSY autolysate was
concentrated through 5 kDa MWCO - UF membrane and its bioactivity was investigated
after simulated GI digestion; resistance to brush-border peptidases and transepithelial
transport across Caco-2 and Caco-2/HT29-MTX co-culture cell monolayers. Data obtained
after simulated GI digestion showed enhanced biological activity of BSY autolysate and
protective effect against oxidative stress induced by hydrogen peroxide in Caco-2 cells.
These results are of great relevance since GI tract is a major target for oxidative stress
damage due to the constant exposure to diet-derived oxidants, mutagens, and carcinogens.
Additionally, the antioxidant and ACE-I activities found in cell permeates indicate that
bioactive compounds present in the BSY autolysate were well absorbed. In comparison with
Caco-2 cell model, higher permeability was found in the Caco-2/HT29-MTX co-culture cell
model, which is recognized as more physiological and a realistic approach of the in vivo
intestinal conditions. Antioxidant and ACE-I activities of permeates suggest that bioactive
peptides from digested BSY autolysate and from the action of brush-border peptidases were
well absorbed. Mass spectrometry revealed that peptides with m/z between 1000 and 5000
were transported across Caco-2/HT29-MTX co-culture cell monolayer, presumably via
transcytosis mechanisms. Permeability of those oligopeptides was suggested to be related
to the presence of permeability enhancers in BSY extract.
The Parts II and III of this dissertation were addressed to the potential utilization of
BSY proteases over two different protein substrates, proteins extracted from sardine by-
products (animal origin) and BSG proteins (vegetal origin), in order to produce protein
hydrolysates with enhanced antioxidant and/ or ACE-I activities. For this purpose, the BSY
extract prepared by mechanic disruption under refrigerated temperatures was freeze-dried,
resuspended in the same buffer (25% of the initial volume) and concentrated using a UF
membrane with a UF MWCO of 10 kDa. Through this procedure, the proteolytic activity of
the BSY extract increased around 4 fold. No enzyme purification was performed, hence the
production of SPH and the BSG protein hydrolysates resulted from the action of a mixture
of several BSY proteases.
Considering that the sarcoplasmic proteins represent 20-30% of total sardine proteins
and are characterized for its higher solubility and digestion compared to the myofibrillar
proteins, the first attempt to produce SPH by action of BSY proteases was performed in this
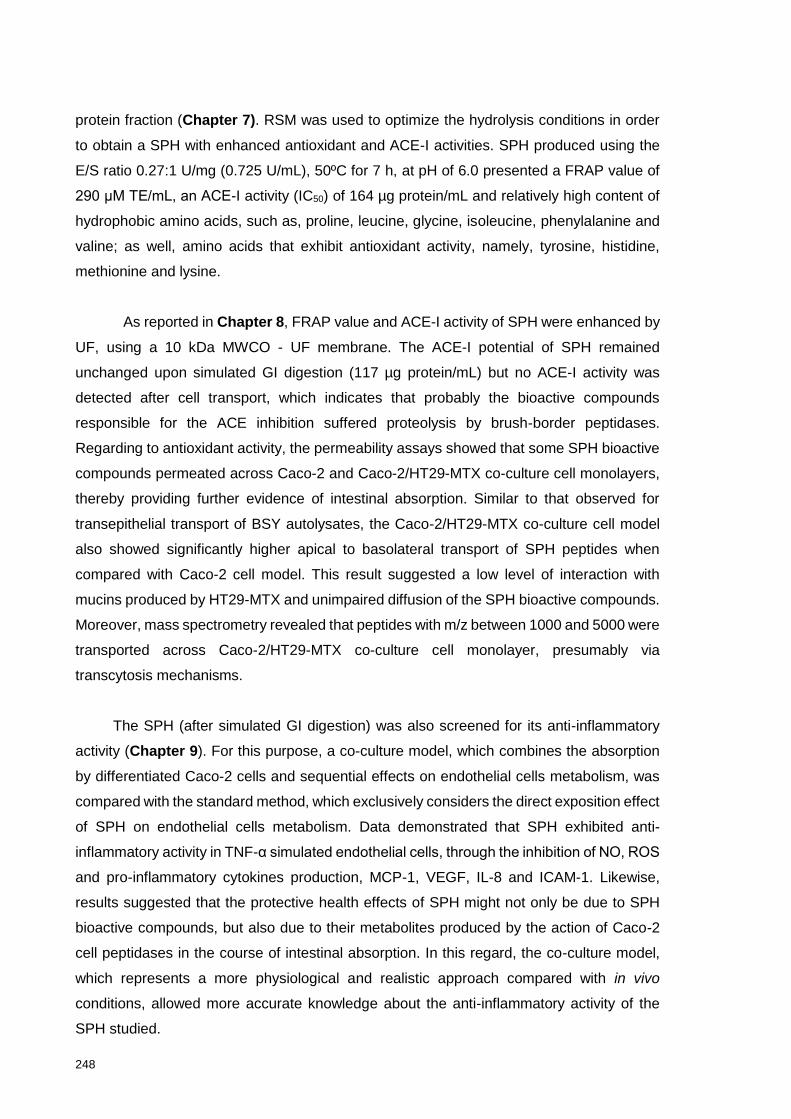
248
protein fraction (Chapter 7). RSM was used to optimize the hydrolysis conditions in order
to obtain a SPH with enhanced antioxidant and ACE-I activities. SPH produced using the
E/S ratio 0.27:1 U/mg (0.725 U/mL), 50ºC for 7 h, at pH of 6.0 presented a FRAP value of
290 μM TE/mL, an ACE-I activity (IC50) of 164 µg protein/mL and relatively high content of
hydrophobic amino acids, such as, proline, leucine, glycine, isoleucine, phenylalanine and
valine; as well, amino acids that exhibit antioxidant activity, namely, tyrosine, histidine,
methionine and lysine.
As reported in Chapter 8, FRAP value and ACE-I activity of SPH were enhanced by
UF, using a 10 kDa MWCO - UF membrane. The ACE-I potential of SPH remained
unchanged upon simulated GI digestion (117 µg protein/mL) but no ACE-I activity was
detected after cell transport, which indicates that probably the bioactive compounds
responsible for the ACE inhibition suffered proteolysis by brush-border peptidases.
Regarding to antioxidant activity, the permeability assays showed that some SPH bioactive
compounds permeated across Caco-2 and Caco-2/HT29-MTX co-culture cell monolayers,
thereby providing further evidence of intestinal absorption. Similar to that observed for
transepithelial transport of BSY autolysates, the Caco-2/HT29-MTX co-culture cell model
also showed significantly higher apical to basolateral transport of SPH peptides when
compared with Caco-2 cell model. This result suggested a low level of interaction with
mucins produced by HT29-MTX and unimpaired diffusion of the SPH bioactive compounds.
Moreover, mass spectrometry revealed that peptides with m/z between 1000 and 5000 were
transported across Caco-2/HT29-MTX co-culture cell monolayer, presumably via
transcytosis mechanisms.
The SPH (after simulated GI digestion) was also screened for its anti-inflammatory
activity (Chapter 9). For this purpose, a co-culture model, which combines the absorption
by differentiated Caco-2 cells and sequential effects on endothelial cells metabolism, was
compared with the standard method, which exclusively considers the direct exposition effect
of SPH on endothelial cells metabolism. Data demonstrated that SPH exhibited anti-
inflammatory activity in TNF-α simulated endothelial cells, through the inhibition of NO, ROS
and pro-inflammatory cytokines production, MCP-1, VEGF, IL-8 and ICAM-1. Likewise,
results suggested that the protective health effects of SPH might not only be due to SPH
bioactive compounds, but also due to their metabolites produced by the action of Caco-2
cell peptidases in the course of intestinal absorption. In this regard, the co-culture model,
which represents a more physiological and realistic approach compared with in vivo
conditions, allowed more accurate knowledge about the anti-inflammatory activity of the
SPH studied.

General conclusions and Future prospects
249
Due to the fact that BSY proteases efficiently hydrolysed the sarcoplasmic proteins
from sardine by-products, the action of this enzymatic preparation was also evaluated on
muscle and viscera proteins, recognized as proteins more resistant to hydrolysis. The bio-
functional and techno-functional properties of the muscle and viscera SPH were compared
with properties obtained by SPH produced using commercial enzymes, Alcalase® and
Neutrase®, which are widely used in the SPH preparation (Chapter 10). Muscle and viscera
SPH were produced at the same hydrolysis conditions, using the same protein substrate
concentration, 20 mg of protein/mL, an E/S ratio of 0.20:1 U/mg (1 U/mL), 50ºC and 7 h of
treatment. The results obtained in this chapter indicated that the type of enzyme used
influenced the bio-functional and techno-functional properties of SPH. Among all treatments
Alcalase® produced SPH with higher DH% and higher antioxidant and ACE-I activities for
both muscle [DPPH of 870 µM TE/mL and ACE-I (IC50) of 619 µg protein/mL] and viscera
proteins [DPPH of 840 µM TE/mL and ACE-I (IC50) of 651 µg protein/mL]. BSY enzymatic
approach produced muscle and viscera SPH with lower DH% and lower bio-functional
activities. However, viscera SPH prepared by BSY proteases presented significantly higher
emulsion (80.1 m2/g), foaming (79.2%) and oil binding capacity (5.8 g/g) compared with
other viscera SPH. All SPH were considered potential ingredients to be incorporated into
various food formulations to improve rheological properties.
BSG protein fraction was another substrate investigated for BSY proteases action.
BSG hydrolysates with improved biological activities can be an alternative approach for
valorisation of the second major brewing by-product. As described in Chapter 12, the
hydrolysis conditions optimized by RSM were: E/S ratio of 0.29:1 U/mg (0.725 U/mL), 50ºC,
6 h, pH of 6.0; which allowed the maximum DH of 17.1%, TPC of 1.65 mg GAE/mL and
FRAP value of 1.88 mg TE/mL. The main BSY proteases responsible for the BSG protein
hydrolysis were indicated as belonging to the class of serine peptidases and
metallopeptidases.
Afterwards, the efficiency of the BSY proteases for production of BSG protein
hydrolysates was compared with two commercial enzymes: Alcalase® and Neutrase®
(Chapter 13). The same proteolytic activity (1 U/mL), protein substrate concentration (15
mg of protein/mL), E/S ratio of 0.10:1 U/mg, 50ºC and 4 h treatment were applied to prepare
BSG protein hydrolysates. Additionally, the effect of UF using 10 and 3 kDa MWCO
membranes on antioxidant and ACE-I activities of these hydrolysates was investigated.
Data showed that among the three enzymatic approaches, Alcalase® BSG protein
hydrolysate presented the highest ACE-I activity (385 µg protein/mL), whereas the IC50
values of BSG protein hydrolysates prepared by BSY proteases and Neutrase® action were

250
820 and 615 µg protein/mL, respectively. UF with 10 kDa MWCO membrane increased the
ACE-I activity of Alcalase® BSG protein hydrolysate (312 µg protein/mL), as well, the in
vitro antioxidant potential (TPC of 0.084 mg GAE/mg dw and FRAP of 0.129 mg TE/mg dw).
In general, all the three <10 kDa UF fractions of BSG protein hydrolysates inhibited the
intracellular ROS generation and exerted a protective ability against hydrogen peroxide
induced oxidative damage in Caco-2 and HepG2 cell lines at concentrations of 1 mg
protein/mL, suggesting its potential use in food systems as natural additives possessing
antioxidant properties.
In this work, the biological activities (antioxidant, ACE-I and anti-inflammatory)
reported were screened exclusively through in vitro assays. Therefore, it is important to
highlight the limitations associated to the in vitro assays, since they are less representative
of the physiological situation and no conclusions can be made in the long term. However,
in a first attempt to screen the biological activities of new potential bioactive ingredients, in
vitro models reveal several advantages over in vivo experiments with laboratory animals
and clinical trials in humans. For instance, they pose no ethical restrictions, are more
reproducible and suited for standard operation, have lower costs, allow fast screening of
numerous samples and are easier to investigate underlying mechanisms.
Compared to literature, where emphasis is put on the isolation of antioxidant and
ACE-I peptide(s) and their in vitro biological activities and in vivo pharmacological effects,
this dissertation addressed the in vitro antioxidant and ACE-I activities of complex
autolysates/ hydrolysates. Accordingly, the antioxidant and ACE-I activities exhibited by
BSY autolysates, SPH and BSG protein hydrolysates resulted from the synergistic effect of
a mixture of several compounds, such as, peptides, amino acids and phenolic compounds.
As GI digestion and intestinal transport are the major barriers in the bioavailability of
antioxidant and ACE-I bioactive compounds, research was focused on the effects of
simulated GI proteases/peptidases in the formation and degradation of bioactive
compounds and its susceptibility to intestinal transport. The ACE-I activity after simulated
GI digestion was more pronounced for sarcoplasmic SPH (IC50 of 117 µg protein/mL) than
for BSY autolysate (IC50 of 345 µg protein/mL). This result could suggest that SPH produced
from action of BSY proteases on sarcoplasmic proteins from sardine by-products presented
higher and potential to exert biological activity in vivo.
The comparison of ACE-I activities of BSY autoysates, SPH and BSG protein
hydrolysates with other results reported in the literature is a difficult task due the use of
different in vitro assays. However, the new bioactive ingredients produced in this work have
General conclusions and Future prospects
251
potential to be used in the prevention of hypertension or as initial treatment in mild
hypertensive individuals.
In conclusion, this Ph.D. thesis revealed that BSY, the second major by-product from
brewing process is a valuable source of proteins and proteases for the production of protein
autolysates and hydrolysates. The promising antioxidant and ACE-I activities of BSY
autolysates, SPH and BSG protein hydrolysates produced during the present study makes
them potential ingredients to be explored in functional foods, cosmetic and pharmaceutical
products. Hence, the results from this experimental work will contribute for the sustainability
of brewing and canned sardine industry through the development of value-added products
with greater commercial market.
FUTURE PROSPECTS
As aforementioned in Chapter 6, several scientific, technological and regulatory
issues should be comprehensively addressed if the major goal is the development of new
bioactive ingredients to be incorporate in food chain or used as pharmaceutical agents in
human nutrition and health. Thus, considering the conclusions obtained within this Ph.D.
thesis, additional studies should be undertaken before application of BSY autolysate, SPH
and BSG protein hydrolysates as nutraceutical or functional food ingredients, namely:
(i) the purification and identification of the bioactive compounds responsible for the
in vitro biological activities;
(ii) the confirmation of the in vivo biological activities through animal model systems;
(iii) the sensory evaluation of the potential new ingredients for the consumer
acceptance.
The major barriers in the bioavailability of antioxidant compounds and ACE-I peptides
are GI digestion and intestinal transport. In this work, permeability studies using the Caco-
2 cell and Caco-2/HT28-MTX co-culture cell models provided evidence to support the
possibility that antioxidant compounds present in the BSY autolysate and sarcoplasmic SPH
were transported through the intestinal epithelium and may exert antioxidant activity in vivo.
However, the identification of antioxidant peptides was not assessed during the present
study and hence the mechanism of antioxidant action, the fate of antioxidant compounds
during GI digestion and intestinal transport, as well as, the mechanisms of cell transport are
need to be elucidated.

252
On the other hand, although the ACE-I activity of BSY autolysate was detected in the
Caco-2 and Caco-2/HT28-MTX co-culture cell permeates, in case of sarcoplasmic SPH
permeates no ACE-I activity was detected at the concentration tested, 2.0 mg proteins/mL.
Although it was suggested that ACE-I peptides were degraded by brush border peptidases,
there is also a possibility that sarcoplasmic SPH peptides present ACE-I activity if higher
concentrations were used in this assay. Furthermore, as discussed in Chapter 7, the
inhibition of ACE-I activity is not the only mechanism by which bioactive peptides can act
as antihypertensive agents; bioactive peptides can also exhibit opiate and/ or vasorelaxing
properties. Furthermore, since the sarcoplasmic SPH also presents high antioxidant
potential, the antioxidant compounds could contribute to reduce the oxidative stress-related
damage and, thereby, still reduce hypertension. Thus, it would be interesting to assess
other possible antihypertensive mechanisms of sarcoplasmic SPH peptides. Moreover, the
efficacy of BSY autolysate and sarcoplasmic SPH in cardiovascular diseases should be
tested via in vivo animal model systems, firstly with spontaneously hypertensive rats (SHR)
and further through clinical trials with human volunteers to validate the effective biological
activity in vivo. Studies with sarcoplasmic SHR can involve measurement of systolic arterial
blood pressure and determination of ACE activity and angiotensin II levels in plasma, after
BSY autolysate or sarcoplasmic SPH oral administration (by gavage using a ball ended
feeding needle). Additionally, the effect of chronic (oral) administration of BSY autolysate
or sarcoplasmic SPH on structural patophysiological changes can be performed.
Once the potential biological activities of BSY autolysate and sarcoplasmic SPH
peptides are established through clinical trials, further research is needed to identify
appropriate functional food applications, as well as, to overcome problems during
incorporating of these potential bioactive ingredients into food matrices. One possible
problem is the bitterness associated with low molecular weight peptides and amino acids,
probably present in BSY autolysate and sarcoplasmic SPH. In this case, the application of
exo- and endo-peptidases to remove bitter amino acids without losing intended activity
could be done. Other alternative is to mask the bitter taste via encapsulation of the
compounds of interest, thus avoiding bitter taste perception and bioactive peptide
degradation during digestion. Sensory studies will be required for this step.
Another problem to face is the possible interactions of bioactive compounds with other
components in the food matrix during processing and storage period. Encapsulation of
bioactive compounds is an effective strategy to overcome this limitation. Also, possible
allergic reactions by incorporating bioactive compounds into functional foods may occur.
Although BSY autolysate and sarcoplasmic SPH were non-toxic to Caco-2 cells when
incubated for 24 h, at concentrations lower than 4.0 mg protein/mL, the present study did

General conclusions and Future prospects
253
not look into the possible allergenicity associated with these potential nutraceuticals. Thus,
considering these potential limitations, more research work is need in order to develop a
functional food acceptable by consumers and without adverse effects.
Concerning the main findings obtained in Chapter 9, relative to the potential anti-
inflammatory activity of sarcoplasmic SPH, further investigation of the sarcoplasmic SPH is
required regarding its molecular composition, mechanisms of action and overall anti-
inflammatory effects in vivo. With respect to the potential techno-functional properties
observed for viscera SPH prepared by BSY proteases treatment (Chapter 10), its potential
use as a multi-functional ingredient in emulsion-type food formulations should be also
investigated. Finally, concerning to BSG protein hydrolysates (Chapter 12) further assays
should be undertaken to evaluate the effects of simulated GI digestion and in vitro
permeability transport on the biological activities. Moreover, before its exploitation as
nutraceutical or a functional ingredient, its biological efficacy should be ascertain through in
vivo assays.

254

Bibliografic references
____________________

256

Bibliografic references
257
BIBLIOGRAFIC REFERENCES
1. He S, Franco C, Zhang W. Functions, applications and production of protein
hydrolysates from fish processing co-products (FPCP). Food Res Int.
2013;50(1):289-97.
2. Mussatto SI. Biotechnological potential of brewing industry by-products. In: Singh
nee’ Nigam P, Pandey A, editors. Biotechnology for agro-industrial residues
utilisation: Springer; 2009. p. 313-326.
3. Unicer Bebidas de Portugal, SGPS. S.A. Management report. Portugal; 2013
4. Vieira E, Rocha MAM, Coelho E, Pinho O, Saraiva JA, Coimbra MA. Valuation of
brewer's spent grain using a fully recyclable integrated process for extraction of
proteins and arabinoxylans. Ind Crops Prod. 2014;52:136-43.
5. Ferreira IMPLVO, Pinho O, Vieira E, Tavarela JG. Brewer's Saccharomyces yeast
biomass: characteristics and potential applications. Trends Food Sci Technol.
2010;21(2):77-84.
6. Bekatorou A, Plessas S, Mantzourani I. Biotechnological exploitation of brewery
solid wastes for recovery or production of value-added products. In: R Rai V, editor.
Advances in Food Biotechnology: John Wiley & Sons Ltd; 2015. p. 393-414.
7. Celus I, Brijs K, Delcour JA. Enzymatic hydrolysis of brewers' spent grain proteins
and technofunctional properties of the resulting hydrolysates. J Agric Food Chem.
2007;55(21):8703-10.
8. Celus I, Brijs K, Delcour JA. Fractionation and characterization of brewers' spent
grain protein hydrolysates. J Agric Food Chem. 2009;57(12):5563-70.
9. Hassan HMM. Antioxidant and immunostimulating activities of yeast
(Saccharomyces cerevisiae) autolysates. World Appl Sci J. 2011;15(8):1110-9.
10. Yeast Handling/Processing. Technical Evaluation Report Compiled by OMRI for the
USDA National Organic Program. United States Department of Agriculture; 2014.
11. Hecht KA, O'Donnell AF, Brodsky JL. The proteolytic landscape of the yeast
vacuole. Cell Logist. 2014;4(1):e28023.
12. Castro-Ceseña AB, del Pilar Sánchez-Saavedra M, Márquez-Rocha FJ.
Characterisation and partial purification of proteolytic enzymes from sardine by-
products to obtain concentrated hydrolysates. Food Chem. 2012;135(2):583-9.
13. Ferraro V, Carvalho AP, Piccirillo C, Santos MM, Castro PM, Pintado ME. Extraction
of high added value biological compounds from sardine, sardine-type fish and
mackerel canning residues - a review. Mater Sci Eng C Mater Biol Appl.
2013;33(6):3111-20.
258
14. Instituto Nacional de Estatística, IP. Estatísticas da Pesca 2010. Portugal; 2010.
15. Bougatef A, Nedjar-Arroume N, Ravallec-Plé R, Leroy Y, Guillochon D, Barkia A,
Nasri M. Angiotensin I-converting enzyme (ACE) inhibitory activities of sardinelle
(Sardinella aurita) by-products protein hydrolysates obtained by treatment with
microbial and visceral fish serine proteases. Food Chem. 2008;111(2):350-6.
16. Bougatef A, Nedjar-Arroume N, Manni L, Ravallec R, Barkia A, Guillochon D, Nasri
M. Purification and identification of novel antioxidant peptides from enzymatic
hydrolysates of sardinelle (Sardinella aurita) by-products proteins. Food Chem.
2010;118(3):559-65.
17. Benhabiles MS, Abdi N, Drouiche N, Lounici H, Pauss A, Goosen MFA, Mameri N.
Fish protein hydrolysate production from sardine solid waste by crude pepsin
enzymatic hydrolysis in a bioreactor coupled to an ultrafiltration unit. Mater Sci Eng
C. 2012;32(4):922-8.
18. EFSA Panel on Dietetic Products, Nutrition and Allergies (NDA); Scientific opinion
on the safety of 'sardine peptide product’ as a novel food ingredient. EFSA Journal
2010; 8(5):1684. [17 pp.].
19. Harnedy PA, FitzGerald RJ. Bioactive peptides from marine processing waste and
shellfish: a review. J Funct Foods. 2012;4(1):6-24.
20. Souissi N, Bougatef A, Triki-Ellouz Y, Nasri M. Biochemical and functional properties
of Sardinella (Sardinella aurita) by-product hydrolysates. Food Technol Biotechnol.
2007;45(2):187.
21. Bokulich NA, Bamforth CW. The microbiology of malting and brewing. Microbiol Mol
Biol Rev. 2013;77(2):157-72.
22. dos Santos Mathias TR, de Mello PPM, Ervulo EFC. Solid wastes in brewing
process: a review. J. Brew. Distilling. 2014;5(1):1-9.
23. Hellborg L, Piškur J. Yeast diversity in the brewing industry. In: Preedy VR, editor.
Beer in health and disease prevention. New York: Elsevier: Academic Press; 2011.
p. 1068-73.
24. Northern Arizona University. Yeast diagram [image on the Internet]. 2008 [cited 2016
Jan 10]. Available from: http://www4.nau.edu/biology/bio205/handouts.htm.
25. Caballero‐Córdoba GM, Sgarbieri VC. Nutritional and toxicological evaluation of
yeast (Saccharomyces cerevisiae) biomass and a yeast protein concentrate. J Sci
Food Agric. 2000;80(3):341-51.
26. Saksinchai S, Suphantharika M, Verduyn C. Application of a simple yeast extract
from spent brewer's yeast for growth and sporulation of Bacillus thuringiensis subsp.
kurstaki: a physiological study. World J Microbiol Biotechnol. 2001;17(3):307-16.

Bibliografic references
259
27. Suphantharika M, Khunrae P, Thanardkit P, Verduyn C. Preparation of spent
brewer's yeast beta-glucans with a potential application as an immunostimulant for
black tiger shrimp, Penaeus monodon. Bioresour Technol. 2003;88(1):55-60.
28. Alvim ID, Vilela ESD, Baldini VLS, Bragagnolo N, Sgarbieri VC. Produção piloto de
derivados de levedura (Saccharomyces sp.) para uso como ingrediente na
formulação de alimentos. Braz J Food Technol. 1999;2(1, 2):119.
29. Chae HJ, Joo H, In MJ. Utilization of brewer's yeast cells for the production of food-
grade yeast extract. Part 1: Effects of different enzymatic treatments on solid and
protein recovery and flavour characteristics. Bioresour Technol. 2001;76(3):253-8.
30. Yamada EA, Sgarbieri VC. Yeast (Saccharomyces cerevisiae) protein concentrate:
preparation, chemical composition, and nutritional and functional properties. J Agric
Food Chem. 2005;53(10):3931-6.
31. Bekatorou A, Psarianos C, Koutinas AA. Production of food grade yeasts. Food
Technol. Biotechnol. 2006;44(3):407-415.
32. Pinto L, Lopes M, Carvalho Filho C, Alves L, Benevides C. Determinação do valor
nutritivo de derivados de levedura de cervejaria (Saccharomyces spp.). Revista
Brasileira de Produtos Agroindustriais. 2013;15(1):7-17.
33. Herrero E, Ros J, Bellí G, Cabiscol E. Redox control and oxidative stress in yeast
cells. BBA. 2008;1780(11):1217-35.
34. Moradas‐Ferreira P, Costa V, Piper P, Mager W. The molecular defences against
reactive oxygen species in yeast. Mol Microbiol. 1996;19(4):651-8.
35. Jamieson DJ. Oxidative stress responses of the yeast Saccharomyces cerevisiae.
Yeast. 1998;14(16):1511-27.
36. Abbas CA. Production of antioxidants, aromas, colours, flavours, and vitamins by
yeasts. In: Querol A, Fleet G, editors. Yeasts in food and beverages: Springer Berlin
Heidelberg; 2006. p. 285-334.
37. Iliev A, Aleksandrov S, Kozarekova-Yovkova D. Changes of antioxidant activities of
baker`s and active dry yeasts during incubation. First national conference of
Biotechnology; Sofia 2015. p. 49-62.
38. Carocho M, Ferreira IC. A review on antioxidants, prooxidants and related
controversy: natural and synthetic compounds, screening and analysis
methodologies and future perspectives. Food Chem Toxicol. 2013;51:15-25.
39. Salar RK, Certik M, Brezova V, Brlejova M, Hanusova V, Breierová E. Stress
influenced increase in phenolic content and radical scavenging capacity of
Rhodotorula glutinis CCY 20-2-26. 3 Biotech. 2013;3(1):53-60.

260
40. Moreira M. Extraction and characterization of natural antioxidants from brewing
industry by-products [dissertation]. Porto: Faculty of Sciences: University of Porto;
2013.
41. Hancock RD, Galpin JR, Viola R. Biosynthesis of L-ascorbic acid (vitamin C) by
Saccharomyces cerevisiae. FEMS Microbiol Lett. 2000;186(2):245-50.
42. Jones EW. Three proteolytic systems in the yeast Saccharomyces cerevisiae. J Biol
Chem. 1991;266(13):7963-6.
43. Kato M, Kuzuhara Y, Maeda H, Shiraga S, Ueda M. Analysis of a processing system
for proteases using yeast cell surface engineering: conversion of precursor of
proteinase A to active proteinase A. Appl Microbiol Biotechnol. 2006;72(6):1229-37.
44. Roy MK, Watanabe Y, Tamai Y. Induction of apoptosis in HL-60 cells by skimmed
milk digested with a proteolytic enzyme from the yeast Saccharomyces cerevisiae.
J Biosci Bioeng. 1999;88(4):426-32.
45. Jung EY, Lee HS, Choi JW, Ra KS, Kim MR, Suh HJ. Glucose tolerance and
antioxidant activity of spent brewer's yeast hydrolysate with a high content of Cyclo-
His-Pro (CHP). J Food Sci. 2011;76(2):C272-8.
46. Zhang L, Jin Y, Xie Y, Wu X, Wu T. Releasing polysaccharide and protein from yeast
cells by ultrasound: selectivity and effects of processing parameters. Ultrason
Sonochem. 2014;21(2):576-81.
47. Lamoolphak W, Goto M, Sasaki M, Suphantharika M, Muangnapoh C, Prommuag
C, Shotipruk A. Hydrothermal decomposition of yeast cells for production of proteins
and amino acids. J Hazard Mater. 2006;137(3):1643-8.
48. In M-J, Kim DC, Chae HJ. Downstream process for the production of yeast extract
using brewer's yeast cells. Biotechnol Bioprocess Eng. 2005;10(1):85-90.
49. Champagne CP, Gaudreau H, Conway J. Effect of the production or use of mixtures
of baker`s or brewer`s yeast extracts on their ability to promote growth of lactobacilli
and pediococci. Electron J Biotechnol. 2003;6(3):185-97.
50. Vieira E, Brandão T, Ferreira IMPLVO. Evaluation of brewer’s spent yeast to
produce flavour enhancer nucleotides: influence of serial repitching. J Agric Food
Chem. 2013;61(37):8724-9.
51. Gaspar L, Camargo F, Gianeti M, Campos PM. Evaluation of dermatological effects
of cosmetic formulations containing Saccharomyces cerevisiae extract and vitamins.
Food Chem Toxicol. 2008;46(11):3493-500.
52. Hatoum R, Labrie S, Fliss I. Antimicrobial and probiotic properties of yeasts: from
fundamental to novel applications. Front Microbiol. 2012;3:421.
Bibliografic references
261
53. Hosseinzadeh P, Djazayery A, Mostafavi S-A, Javanbakht MH, Derakhshanian H,
Rahimiforoushani A, Djalali M. Brewer’s yeast improves blood pressure in type 2
diabetes mellitus. Iran J Public Health. 2013;42(6):602.
54. Chemical composition and biochemistry of yeast biomass. In: Halasz A, Lasztity R,
editors. Use of yeast biomass in food production. USA: CRC Press, Inc; 1991. p. 23-
41.
55. RingØ E, Olsen RE, Gifstad TØ, Dalmo RA, Amlund H, Hemre GI, Barke AM.
Prebiotics in aquaculture: a review. Aquac Nutr. 2010;16(2):117-36.
56. Robbins E, Seeley R. Cholesterol lowering effect of dietary yeast and yeast
fractions. J Food Sci. 1977;42(3):694-8.
57. Bell S, Goldman VM, Bistrian BR, Arnold AH, Ostroff G, Forse RA. Effect of β-glucan
from oats and yeast on serum lipids. Crit Rev Food Sci Nutr. 1999;39(2):189-202.
58. Nakamura T, Hitomi Y, Yoshida M, Shirasu Y, Tsukui T, Shimasaki H. Effect of
yogurt supplemented with brewer's yeast cell wall on levels of blood lipids in normal
and hypercholesterolemic adults. J Oleo Sci. 2002;51(5):323-34.
59. Nakamura T, Agata K, Nishida S, Shirasu Y, Iino H. Effects of yogurt supplemented
with brewer's yeast cell wall on intestinal environment and defecation in healthy
female adults. Biosci Microflora. 2001;20(1):27-34.
60. Pacheco MTB, Sgarbieri VC. Hydrophilic and rheological properties of brewer's
yeast protein concentrates. J Food Sci. 1998;63(2):238-43.
61. de Melo ANF, de Souza EL, da Silva Araujo VB, Magnani M. Stability, nutritional
and sensory characteristics of French salad dressing made with mannoprotein from
spent brewer's yeast. LWT- Food Sci Technol. 2015;62(1, Part 2):771-4.
62. Vetriselvi J, Saravanamuthu R, Dhivaharan V. Biotechnological potential and
industrial application of yeast. In: DK Maheshwari, Dubey RC, Saravanamurthu R,
editors. Industrial exploitation of microorganisms. New Delhi IK International
Publishing House Pvt. Ltd; 2010. p. 1-11.
63. Liu H, Lin JP, Cen PL, Pan YJ. Co-production of S-adenosyl-l-methionine and
glutathione from spent brewer’s yeast cells. Process Biochem. 2004;39(12):1993-7.
64. Roy MK, Watanabe Y, Tamai Y. Yeast protease B-digested skimmed milk inhibits
angiotensin-I-converting-enzyme activity. Biotechnol Appl Biochem. 2000;31(Pt
2):95-100.
65. Sánchez B, Reverol L, Galindo-Castro I, Bravo A, Rangel-Aldao R, Ramírez JL.
Brewer's yeast oxidoreductase with activity on Maillard reaction intermediates of
beer. Tech. Q. Master Brew. Assoc. Am. 2003;40(3):204-21.
66. Liu D, Zeng X-A, Sun D-W, Han Z. Disruption and protein release by ultrasonication
of yeast cells. Innov Food Sci Emerg Technol. 2013;18(0):132-7.

262
67. Shynkaryk M, Lebovka N, Lanoisellé J-L, Nonus M, Bedel-Clotour C, Vorobiev E.
Electrically-assisted extraction of bio-products using high pressure disruption of
yeast cells (Saccharomyces cerevisiae). J Food Eng. 2009;92(2):189-95.
68. Liu D, Lebovka N, Vorobiev E. Impact of electric pulse treatment on selective
extraction of intracellular compounds from Saccharomyces cerevisiae yeasts. Food
Bioproc Tech. 2013;6(2):576-84.
69. Geciova J, Bury D, Jelen P. Methods for disruption of microbial cells for potential
use in the dairy industry - a review. Int Dairy J. 2002;12(6):541-53.
70. Klimek-Ochab M, Brzezińska-Rodak M, Żymańczyk-Duda E, Lejczak B, Kafarski P.
Comparative study of fungal cell disruption - scope and limitations of the methods.
Folia Microbiol. 2011;56(5):469-75.
71. Agrawal PB, Pandit AB. Isolation of α-glucosidase from Saccharomyces cerevisiae:
cell disruption and adsorption. Biochem Eng J. 2003;15(1):37-45.
72. Tanguler H, Erten H. Utilisation of spent brewer's yeast for yeast extract production
by autolysis: the effect of temperature. Food Bioprod Process. 2008;86(4):317-21.
73. Hernawan T, Fleet G. Chemical and cytological changes during the autolysis of
yeasts. J Ind Microbiol. 1995;14(6):440-50.
74. Kim D, Chae H, Oh N, In M. Effect of cell lytic enzyme on the production of yeast
extract. J Kor Soc Agric Chem Biotechnol. 2001;44:273-5.
75. Kim. Jae-Ho; Lee D-HJ, Seoung-Chan; Chung, Kun-Sub; Lee, Jong-Soo
Characterization of antihypertensive angiotensin I-converting enzyme inhibitor from
Saccharomyces cerevisiae. J Microbiol Biotechnol. 2004;14(6):1318-23.
76. Bayarjargal EM, Ariunsaikhan T, Odonchimeg M, Uurzaikh T, Gan-Erdene T, Regdel
D. Utilization of spent brewer’s yeast Saccharomyces cerevisiae for the production
of yeast enzymatic hydrolysate. Mong J Chem. 2011;12(38):88-91.
77. Bayarjargal EM, Ariunsaikhan T, Lkhagvamaa E, Ankhtsetseg B, Gan-Erdene T,
Regdel D. Antioxidant properties of pancreatic hydrolysates from various protein
sources. Mong J Chem. 2014;15:43-6.
78. Chung Y, Chae H, Kim D, Oh N, Park M, Lee Y, In M-J. Selection of commercial
proteolytic enzymes for the production of brewer’s yeast extract. Food Eng Progr.
1999;3:159-63.
79. Estevez PMM, inventor; Google Patents, assignee. Process for obtaining bioactive
peptide and polysaccharide extracts from spent brewer`s yeast and uses thereof.
Patent WO2014102757 A1. 2014 Jul 3.
80. Dzogbefia V, Amoke E, Oldham J, Ellis W. Production and use of yeast pectolytic
enzymes to aid pineapple juice extraction. Food Biotechnol. 2001;15(1):25-34.

Bibliografic references
263
81. Dzogbefia V, Djokoto D. Combined effects of enzyme dosage and reaction time on
papaya juice extraction with the aid of pectic enzymes - a preliminary report. J Food
Biochem. 2006;30(1):117-22.
82. Rakin M, Vukasinovic M, Siler-Marinkovic S, Maksimovic M. Contribution of lactic
acid fermentation to improved nutritive quality vegetable juices enriched with
brewer’s yeast autolysate. Food Chem. 2007;100(2):599-602.
83. Dzogbefia V, Ofosu G, Oldham J. Evaluation of locally produced Saccharomyces
cerevisiae pectinase enzyme for industrial extraction of starch from cassava in
Ghana. Sci. Res. Essays. 2008;3(8):365-9.
84. Păucean A, Pârlog RM, Vodnar DC, Socaciu C, Mudura E. HPLC Analysis of vitamin
B3 and vitamin C from a dairy product containing brewer’s yeast. J Agroaliment Proc
Technol. 2010;16(2):136-40.
85. Smith E-A, Myburgh J, Osthoff G, de Wit M. Acceleration of yoghurt fermentation
time by yeast extract and partial characterisation of the active components. J Dairy
Res. 2014;81(04):417-23.
86. Kanauchi O, Igarashi K, Ogata R, Mitsuyama K, Andoh A. A yeast extract high in
bioactive peptides has a blood-pressure lowering effect in hypertensive model. Curr
Med Chem. 2005;12(26):3085-90.
87. Bhat ZF, Kumar S, Bhat H. Bioactive peptides of animal origin: a review. J Food Sci
Technol. 2015:1-16.
88. Samaranayaka AGP, Li-Chan ECY. Food-derived peptidic antioxidants: a review of
their production, assessment, and potential applications. J Funct Foods.
2011;3(4):229-54.
89. Vercruysse L, Van Camp J, Smagghe G. ACE inhibitory peptides derived from
enzymatic hydrolysates of animal muscle protein: a review. J Agric Food Chem.
2005;53(21):8106-15.
90. Huang D, Ou B, Prior RL. The chemistry behind antioxidant capacity assays. J Agric
Food Chem. 2005;53(6):1841-56.
91. Prior RL, Wu X, Schaich K. Standardized methods for the determination of
antioxidant capacity and phenolics in foods and dietary supplements. J Agric Food
Chem. 2005;53(10):4290-302.
92. Elias RJ, Kellerby SS, Decker EA. Antioxidant activity of proteins and peptides. Crit
Rev Food Sci Nutr. 2008;48(5):430-41.
93. Erdmann K, Cheung BW, Schröder H. The possible roles of food-derived bioactive
peptides in reducing the risk of cardiovascular disease. J Nutr Biochem.
2008;19(10):643-54.

264
94. Badarinath A, Rao KM, Chetty CMS, Ramkanth S, Rajan T, Gnanaprakash K. A
review on in-vitro antioxidant methods: comparisons, correlations and
considerations. Int J Pharmtech Res. 2010;2(2):1276-85.
95. Kim S-K, Wijesekara I. Development and biological activities of marine-derived
bioactive peptides: a review. J Funct Foods. 2010;2(1):1-9.
96. Pisoschi AM. Methods for total antioxidant activity determination: a review. Biochem
Anal Biochem. 2011;1(1).
97. Gulcin I. Antioxidant activity of food constituents: an overview. Arch Toxicol.
2012;86(3):345-91.
98. Alam MN, Bristi NJ, Rafiquzzaman M. Review on in vivo and in vitro methods
evaluation of antioxidant activity. Saudi Pharm J. 2013;21(2):143-52.
99. Chakrabarti S, Jahandideh F, Wu J. Food-derived bioactive peptides on
inflammation and oxidative stress. Biomed Res Int. 2014;2014.
100. McCarthy AL, O'Callaghan YC, O'Brien NM. Protein hydrolysates from agricultural
crops - bioactivity and potential for functional food development. Agriculture.
2013;3(1):112-30.
101. Ben Khaled H, Ghlissi Z, Chtourou Y, Hakim A, Ktari N, Fatma MA, Barkia A,
Sahnoun Z, Moncef Nasri M. Effect of protein hydrolysates from sardinelle
(Sardinella aurita) on the oxidative status and blood lipid profile of cholesterol-fed
rats. Food Res Int. 2012;45(1):60-8.
102. Chalamaiah M, Dinesh kumar B, Hemalatha R, Jyothirmayi T. Fish protein
hydrolysates: Proximate composition, amino acid composition, antioxidant activities
and applications: a review. Food Chem. 2012;135(4):3020-38.
103. Sila A, Bougatef A. Antioxidant peptides from marine by-products: Isolation,
identification and application in food systems: a review. J Funct Foods. 2016;21:10-
26.
104. Ruiz-Gimenez P, Marcos JF, Torregrosa G, Lahoz A, Fernandez-Musoles R, Valles
S, Alborch E, Manzanares P, Salom JB. Novel antihypertensive hexa- and
heptapeptides with ACE-inhibiting properties: from the in vitro ACE assay to the
spontaneously hypertensive rat. Peptides. 2011;32(7):1431-8.
105. Udenigwe CC, Mohan A. Mechanisms of food protein-derived antihypertensive
peptides other than ACE inhibition. J Funct Foods. 2014;8(0):45-52.
106. Wijesekara I, Kim SK. Angiotensin-I-converting enzyme (ACE) inhibitors from
marine resources: prospects in the pharmaceutical industry. Mar Drugs.
2010;8(4):1080-93.
107. Chen J, Wang Y, Ye R, Wu Y, Xia W. Comparison of analytical methods to assay
inhibitors of angiotensin I-converting enzyme. Food Chem. 2013;141(4):3329-34.
Bibliografic references
265
108. Ben Henda Y, Labidi A, Arnaudin I, Bridiau N, Delatouche R, Maugard T, Piot JM,
Sannier F, Thiéry V, Bordenave-Juchereau S. Measuring angiotensin-I converting
enzyme inhibitory activity by micro plate assays: comparison using marine cryptides
and tentative threshold determinations with captopril and losartan. J Agric Food
Chem. 2013;61(45):10685-90.
109. Iroyukifujita H, Eiichiyokoyama K, Yoshikawa M. Classification and antihypertensive
activity of angiotensin I-converting enzyme inhibitory peptides derived from food
proteins. J Food Sci. 2000;65(4):564-9.
110. Wu J, Aluko RE, Nakai S. Structural requirements of angiotensin I-converting
enzyme inhibitory peptides: quantitative structure-activity relationship study of di-
and tripeptides. J Agric Food Chem. 2006;54(3):732-8.
111. Nakano D, Ogura K, Miyakoshi M, Ishii F, Kawanishi H, Kurumazuka D, Kwak CJ,
Ikemura K, Takaoka M, Moriguchi S, Iino T, Kusumoto A, Asami S, Shibata H, Kiso
Y, Matsumura Y. Antihypertensive effect of angiotensin I-converting enzyme
inhibitory peptides from a sesame protein hydrolysate in spontaneously
hypertensive rats. Biosci Biotechnol Biochem. 2006;70(5):1118-26.
112. Matsufuji H, Matsui T, Seki E, Osajima K, Nakashima M, Osajima Y. Angiotensin I-
converting enzyme inhibitory peptides in an alkaline protease hydrolyzate derived
from sardine muscle. Biosci Biotechnol Biochem. 1994;58(12):2244-5.
113. Terashima M, Oe M, Ogura K, Matsumura S. Inhibition strength of short peptides
derived from an ACE inhibitory peptide. J Agric Food Chem. 2011;59(20):11234-7.
114. Cushman D, Cheung H. Spectrophotometric assay and properties of the
angiotensin-converting enzyme of rabbit lung. Biochem Pharmacol.
1971;20(7):1637-48.
115. Wu J, Aluko RE, Muir AD. Improved method for direct high-performance liquid
chromatography assay of angiotensin-converting enzyme-catalyzed reactions. J
Chromatogr A. 2002;950(1):125-30.
116. Watanabe T, Mazumder TK, Nagai S, Tsuji K, Terabe S. Analysis method of the
angiotensin-I converting enzyme inhibitory activity based on micellar electrokinetic
chromatography. Anal Sci. 2003;19(1):159-61.
117. Cushman DW, Cheung H, Sabo E, Ondetti M. Design of potent competitive inhibitors
of angiotensin-converting enzyme. Carboxyalkanoyl and mercaptoalkanoyl amino
acids. Biochem. 1977;16(25):5484-91.
118. Vermeirssen V, Van Camp J, Verstraete W. Optimisation and validation of an
angiotensin-converting enzyme inhibition assay for the screening of bioactive
peptides. J Biochem Biophys Methods. 2002;51(1):75-87.

266
119. Murray BA, Walsh DJ, FitzGerald RJ. Modification of the furanacryloyl-l-
phenylalanylglycylglycine assay for determination of angiotensin-I-converting
enzyme inhibitory activity. J Biochem Biophys Methods. 2004;59(2):127-37.
120. Lahogue V, Réhel K, Taupin L, Haras D, Allaume P. A HPLC-UV method for the
determination of angiotensin I-converting enzyme (ACE) inhibitory activity. Food
Chem. 2010;118(3):870-5.
121. Sentandreu MÁ, Toldrá F. A rapid, simple and sensitive fluorescence method for the
assay of angiotensin-I converting enzyme. Food Chem. 2006;97(3):546-54.
122. Quiros A, del Mar Contreras M, Ramos M, Amigo L, Recio I. Stability to
gastrointestinal enzymes and structure-activity relationship of beta-casein-peptides
with antihypertensive properties. Peptides. 2009;30(10):1848-53.
123. Carbonell‐Capella JM, Buniowska M, Barba FJ, Esteve MJ, Frígola A. Analytical
methods for determining bioavailability and bioaccessibility of bioactive compounds
from fruits and vegetables: a review. Compr Rev Food Sci Food Saf.
2014;13(2):155-71.
124. Power O, Jakeman P, FitzGerald R. Antioxidative peptides: enzymatic production,
in vitro and in vivo antioxidant activity and potential applications of milk-derived
antioxidative peptides. Amino Acids. 2013;44(3):797-820.
125. van Breemen RB, Li Y. Caco-2 cell permeability assays to measure drug absorption.
Expert Opin Drug Metab Toxicol. 2005;1(2):175-85.
126. Shimizu M, Tsunogai M, Arai S. Transepithelial transport of oligopeptides in the
human intestinal cell, Caco-2. Peptides. 1997;18(5):681-7.
127. Cinq-Mars CD, Hu C, Kitts DD, Li-Chan EC. Investigations into inhibitor type and
mode, simulated gastrointestinal digestion, and cell transport of the angiotensin I-
converting enzyme-inhibitory peptides in Pacific hake (Merluccius productus) fillet
hydrolysate. J Agric Food Chem. 2008;56(2):410-9.
128. Kleiveland, CR. Co-cultivation of Caco-2 and HT-29MTX. In: Verhoeckx K, Cotter P,
López-Expósito I, Kleiveland C, Lea T, Mackie A, Requena T, Swiatecka D, Wichers
H, editors. The impact of food bioactives on health, in vitro and ex vivo models:
Springer International Publishing; 2015. p. 135-140.
129. del Mar Contreras M, Sancho A, Recio I, Mills C. Absorption of casein
antihypertensive peptides through an in vitro model of intestinal epithelium. Food
Dig. 2012;3(1-3):16-24.
130. Hilgendorf C, Spahn-Langguth H, Regardh CG, Lipka E, Amidon GL, Langguth P.
Caco-2 versus Caco-2/HT29-MTX co-cultured cell lines: permeabilities via diffusion,
inside- and outside-directed carrier-mediated transport. J Pharm Sci. 2000;89(1):63-
75.
Bibliografic references
267
131. Antunes F, Andrade F, Araujo F, Ferreira D, Sarmento B. Establishment of a triple
co-culture in vitro cell models to study intestinal absorption of peptide drugs. Eur J
Pharm Biopharm. 2013;83(3):427-35.
132. Araujo F, Sarmento B. Towards the characterization of an in vitro triple co-culture
intestine cell model for permeability studies. Int J Pharm. 2013;458(1):128-34.
133. Calatayud M, Vazquez M, Devesa V, Velez D. In vitro study of intestinal transport of
inorganic and methylated arsenic species by Caco-2/HT29-MTX cocultures. Chem
Res Toxicol. 2012;25(12):2654-62.
134. Kawasaki T, Seki E, Osajima K, Yoshida M, Asada K, Matsui T, Osajima Y.
Antihypertensive effect of valyl-tyrosine, a short chain peptide derived from sardine
muscle hydrolyzate, on mild hypertensive subjects. J Hum Hypertens.
2000;14(8):519-23.
135. Athmani N, Dehiba F, Allaoui A, Barkia A, Bougatef A, Lamri-Senhadji MY, Nasri M,
Boualga A. Sardina pilchardus and Sardinella aurita protein hydrolysates reduce
cholesterolemia and oxidative stress in rat fed high cholesterol diet. J Exp Integr
Med, Jan-Mar. 2015;5(1):47.
136. Liu X-Y, Wang Q, Cui SW, Liu H-Z. A new isolation method of β-D-glucans from
spent yeast Saccharomyces cerevisiae. Food Hydrocoll. 2008;22(2):239-47.
137. Aimanianda V, Clavaud C, Simenel C, Fontaine T, Delepierre M, Latgé J-P. Cell wall
β-(1, 6)-glucan of Saccharomyces cerevisiae structural characterization and in situ
synthesis. J Biol Chem. 2009;284(20):13401-12.
138. Petravić-Tominac V, Zechner-Krpan V, Berković K, Galović P, Herceg Z, Srečec S,
Srečec S, Špoljarić I. Rhelogical properties, water-holding, and oil-binding capacities
of particulate beta-glucans, isolated from spent brewer`s yeast by three different
procedures. Food Technol Biotechnol. 2011;49(1):56-64.
139. Martins ZE, Erben M, Gallardo AE, Silva R, Barbosa I, Pinho O, Ferreira IMPLVO.
Effect of spent yeast fortification on physical parameters, volatiles and sensorial
characteristics of home‐made bread. Int J Food Sci Technol. 2015;50(8):1855-63.
140. Vieira E, Moura C, Almeida T, Meireles S, Brandão T, Pinho O, Ferreira IMPLVO.
Influence of serial repitching on beer polypeptide profiles. J Am Soc Brew Chem.
2012;70(4):275-9.
141. Rizzo M, Ventrice D, Varone MA, Sidari R, Caridi A. HPLC determination of
phenolics adsorbed on yeasts. J Pharm Biomed Anal. 2006;42(1):46-55.
142. Edens NK, Reaves LA, Bergana MS, Reyzer IL, O'Mara P, Baxter JH, Snowden MK.
Yeast extract stimulates glucose metabolism and inhibits lipolysis in rat adipocytes
in vitro. J Nutr. 2002;132(6):1141-8.

268
143. EFSA Panel on Dietetic Products, Nutrition and Allergies. Scientific Opinion on the
safety of ‘yeast beta-glucans’ as a Novel Food ingredient. EFSA Journal.
2011;9(5):2137-59.
144. Gaithersburg MD. Official methods of analysis of AOAC International. 17th ed. USA:
Association of Analytical Communities; 2000.
145. Schmitt MR, Budde AD. Wort free amino nitrogen analysis adapted to a microplate
format. J Am Soc Brew Chem. 2012;70(2):95.
146. Liwarska-Bizukojc E, Ledakowicz S. RNA assay as a method of viable biomass
determination in the organic fraction of municipal solid waste suspension. Biotechnol
Lett. 2001;23(13):1057-60.
147. Herbert D, Phipps P, Strange R. Chemical analysis of microbial cells. Methods
Microbiol. 1971;5(Part B):209-344.
148. Pérez-Palacios T, Melo A, Cunha S, Ferreira IMPLVO. Determination of free amino
acids in coated foods by GC-MS: optimization of the extraction procedure by using
statistical design. Food Anal Methods. 2014;7(1):172-80.
149. Energy and protein requirements. Report of a joint FAO/WHO/UNU Expert
Consultation technical report FAO/WHO and United Nations University, Geneva.
1990;724:116-29.
150. Lee YB, Elliott JG, Rickansrud DA, Hagberg EYC. Predicting protein efficiency ratio
by the chemical determination of connective tissue content in meat. J Food Sci
1978;43(5):1359-62.
151. Parlog RM, Nicula A, Nicula T, Socaciu C. The optimization of extraction and HPLC
analysis of vitamins B from yeast products. Bulletin UASVM Agriculture. 2008;65(2).
152. Grotzkyj Giorgi M, Howland K, Martin C, Bonner AB. A novel HPLC method for the
concurrent analysis and quantitation of seven water-soluble vitamins in biological
fluids (plasma and urine): a validation study and application. Sci World J.
2012;2012:359721.
153. Ciulu M, Solinas S, Floris I, Panzanelli A, Pilo MI, Piu PC, Spano N, Sanna G. RP-
HPLC determination of water-soluble vitamins in honey. Talanta. 2011;83(3):924-9.
154. Jansen E, Ruskovska T. Comparative analysis of serum (anti)oxidative status
parаmeters in healthy persons. Int J Mol Sci. 2013;14(3):6106-15.
155. Herald TJ, Gadgil P, Tilley M. High-throughput micro plate assays for screening
flavonoid content and DPPH-scavenging activity in sorghum bran and flour. J Sci
Food Agric. 2012;92(11):2326-31.
156. Almeida IMC, Barreira JCM, Oliveira MBPP, Ferreira ICFR. Dietary antioxidant
supplements: benefits of their combined use. Food Chem Toxicol.
2011;49(12):3232-7.
Bibliografic references
269
157. Khanam UKS, Oba S, Yanase E, Murakami Y. Phenolic acids, flavonoids and total
antioxidant capacity of selected leafy vegetables. J Funct Foods. 2012;4(4):979-87.
158. Institute of Medicine (US) Committee to Review Dietary Reference Intakes for
Vitamin D and Calcium. In: Ross AC, Taylor CL, Yaktine AL, Del Valle, editors.
Dietary Reference Intakes for Calcium and Vitamin D. Washington (DC): National
Academies Press (US); 2011. Summary Tables. Available from:
http://www.ncbi.nlm.nih.gov/books/NBK56068/
159. Hjortmo S, Patring J, Jastrebova J, Andlid T. Inherent biodiversity of folate content
and composition in yeasts. Trends Food Sci Technol. 2005;16(6):311-6.
160. Jang J-H, Lee J-S. Antihypertensive angiotensin I-converting enzyme inhibitory
activity and antioxidant activity of Vitis hybrid-Vitis coignetiae red wine made with
Saccharomyces cerevisiae. Mycobiology. 2011;39(2):137-9.
161. Lee BH. Yeast-based processes and products. Fundamentals of food
biotechnology: John Wiley & Sons, Ltd; 2015. p. 205-39.
162. Laemmli UK. Cleavage of structural proteins during the assembly of the head of
bacteriophage T4. Nature. 1970;227(5259):680-5.
163. It’s Fast IsE, Blue IT. Determination of total protein by the Lowry method using the
BioTek Instruments’ ELx808 Microplate Reader. 2006.
164. Cupp-Enyard C. Sigma’s non-specific protease activity assay - casein as a
substrate. JoVE. 2008;19(899).
165. Minervini F, Algaron F, Rizzello C, Fox P, Monnet V, Gobbetti M. Angiotensin I-
converting-enzyme-inhibitory and antibacterial peptides from Lactobacillus
helveticus PR4 proteinase-hydrolyzed caseins of milk from six species. Appl Environ
Microbiol. 2003;69(9):5297-305.
166. Yamada EA, Alvim ID, Santucci MCC, Sgarbieri VC. Composição centesimal e valor
protéico de levedura residual da fermentação etanólica e de seus derivados. Rev
nutr. 2003;16(4):423-32.
167. Slaughter JC, Nomura T. Activity of the vacuolar proteases of yeast and the
significance of the cytosolic protease inhibitors during the post-fermentation decline
phase. J Inst Brew. 1992;98(4):335-8.
168. Rodarte MP, Dias DR, Vilela DM, Schwan RF. Proteolytic activities of bacteria,
yeasts and filamentous fungi isolated from coffee fruit (Coffea arabica L.). Acta Sci
Agron. 2011;33(3):457-64.
169. Mirzaei M, Mirdamadi S, Ehsani MR, Aminlari M, Hosseini E. Purification and
identification of antioxidant and ACE-inhibitory peptide from Saccharomyces
cerevisiae protein hydrolysate. J Funct Foods. 2015;19, Part A:259-68.

270
170. Jang J-H, Jeong S-C, Lee J-K, Lee J-S. Digestion pattern of antihypertensive
Angiotensin I-converting enzyme inhibitory peptides from Saccharomyces
cerevisiae in a successive simulated gastrointestinal bioreactor. Mycobiology.
2011;39(1):67-9.
171. Bradford Protein Assay. Bio-protocol Bio101: e45 http://wwwbio-protocolorg/e45
2011.
172. Mandenius CF, Brundin A. Bioprocess optimization using design-of-experiments
methodology. Biotechnol Prog. 2008;24(6):1191-203.
173. Goudarzi M, Madadlou A, Mousavi M, Emam-Djomeh Z. Optimized preparation of
ACE-inhibitory and antioxidative whey protein hydrolysate using response surface
method. Dairy Sci Technol. 2012;92(6):641-53.
174. Guo Y, Pan D, Tanokura M. Optimisation of hydrolysis conditions for the production
of the angiotensin-I converting enzyme (ACE) inhibitory peptides from whey protein
using response surface methodology. Food Chem. 2009;114(1):328-33.
175. Thammakiti S, Suphantharika M, Phaesuwan T, Verduyn C. Preparation of spent
brewer's yeast β‐glucans for potential applications in the food industry. Int J Food
Sci Technol. 2004;39(1):21-9.
176. Boonyeun P, Shotipruk A, Prommuak C, Suphantharika M, Muangnapoh C.
Enhancement of amino acid production by two-step autolysis of spent brewer's
yeast. Chem Eng Commun. 2011;198(12):1594-602.
177. Vieira EF, Teixeira J, Ferreira IMPLVO. Valorisation of brewer’s spent grain and
spent yeast through protein hydrolysates with antioxidant properties. Eur Food Res
Technol. 2016. DOI: 10.1007/s00217-016-2696-y.
178. Gallego M, Grootaert C, Mora L, Aristoy MC, Van Camp J, Toldrá F. Transepithelial
transport of dry-cured ham peptides with ACE inhibitory activity through a Caco-2
cell monolayer. J Funct Foods. 2016;21:388-95.
179. Musatti A, Devesa V, Calatayud M, Vélez D, Manzoni M, Rollini M. Glutathione‐
enriched baker's yeast: production, bioaccessibility and intestinal transport assays.
J Appl Microbiol. 2014;116(2):304-13.
180. Kosińska A, Andlauer W. Modulation of tight junction integrity by food components.
Food Res Int. 2013;54(1):951-60.
181. Samaranayaka AG, Kitts DD, Li-Chan EC. Antioxidative and angiotensin-I-
converting enzyme inhibitory potential of a Pacific Hake (Merluccius productus) fish
protein hydrolysate subjected to simulated gastrointestinal digestion and Caco-2 cell
permeation. J Agric Food Chem. 2010;58(3):1535-42.

Bibliografic references
271
182. Laitinen LA, Galkin A, Vuorela HJ, Marvola ML, Vuorela PM. Effects of extracts of
commonly consumed food supplements and food fractions on the permeability of
drugs across Caco-2 cell monolayers. Pharmaceu Res. 2004;21(10):1904-16.
183. da Silva DD, Silva E, Carmo H. Combination effects of amphetamines under
hyperthermia - the role played by oxidative stress. J Appl Toxicol. 2014;34(6):637-
50.
184. Ferraro V, Ferreira Jorge R, Cruz IB, Antunes F, Sarmento B, Castro PML, Pintado
ME. In vitro intestinal absorption of amino acid mixtures extracted from codfish
(Gadus morhua L.) salting wastewater. Int J Food Sci Technol. 2014;49(1):27-33.
185. Ferreira IMPLVO, Eça R, Pinho O, Tavares P, Pereira A, Cecília Roque A.
Development and validation of an HPLC/UV method for quantification of bioactive
peptides in fermented milks. J Liq Chromatogr Relat Technol. 2007;30(14):2139-47.
186. Putnam KP, Bombick DW, Doolittle DJ. Evaluation of eight in vitro assays for
assessing the cytotoxicity of cigarette smoke condensate. Toxicol In Vitro.
2002;16(5):599-607.
187. Ward MW, Huber HJ, Weisova P, Dussmann H, Nicholls DG, Prehn JH.
Mitochondrial and plasma membrane potential of cultured cerebellar neurons during
glutamate-induced necrosis, apoptosis, and tolerance. J Neurosci.
2007;27(31):8238-49.
188. Ding L, Wang L, Zhang Y, Liu J. Transport of antihypertensive peptide RVPSL,
ovotransferrin 328–332, in human intestinal Caco-2 cell monolayers. J Agric Food
Chem. 2015;63(37):8143-50.
189. Yee S. In vitro permeability across Caco-2 cells (colonic) can predict in vivo (small
intestinal) absorption in man - fact or myth. Pharm Res. 1997;14(6):763-6.
190. Jin Y, Song Y, Zhu X, Zhou D, Chen C, Zhang Z, Huang Y. Goblet cell-targeting
nanoparticles for oral insulin delivery and the influence of mucus on insulin transport.
Biomaterials. 2012;33(5):1573-82.
191. Fuller E, Duckham C, Wood E. Disruption of epithelial tight junctions by yeast
enhances the paracellular delivery of a model protein. Pharmaceu Res.
2007;24(1):37-47.
192. Escudero E, Mora L, Toldrá F. Stability of ACE inhibitory ham peptides against heat
treatment and in vitro digestion. Food Chem. 2014;161:305-11.
193. Silva A, Carrera P, Massé J, Uriarte A, Santos MB, Oliveira PB, Soares E, Porteiro
C. Geographic variability of sardine growth across the northeastern Atlantic and the
Mediterranean Sea. Fish Res. 2008;90(1–3):56-69.
194. Kristinsson HG, Rasco BA. Fish protein hydrolysates: production, biochemical, and
functional properties. Crit Rev Food Sci Nutr. 2000;40(1):43-81.

272
195. Park JD, Yongsawatdigul J, Choi YJ, Park JW. Biochemical and conformational
changes of myosin purified from Pacific sardine at various pHs. J Food Sci.
2008;73(3):C191-7.
196. Chaijan M, Benjakul S, Visessanguan W, Faustman C. Characterisation of
myoglobin from sardine (Sardinella gibbosa) dark muscle. Food Chem.
2007;100(1):156-64.
197. Park JD. Characterization of myosin, myoglobin, and phospholipids isolated from
Pacific Sardine (Sadinops Sagax). [dissertation]. Oregan: Food Science and
Technology: Oregon State University; 2008.
198. Karthikeyan M, Mathew S, Shamasundar BA, Rakash VP. Fractionation and
properties of sarcoplasmic proteins from oil sardine (Sardinella longiceps): influence
on the thermal gelation behavior of washed meat. J Food Sci. 2004;69(3):79-84.
199. Klomklao S, Benjakul S, Visessanguan W, Kishimura H, Simpson BK. Proteolytic
degradation of sardine (Sardinella gibbosa) proteins by trypsin from skipjack tuna
(Katsuwonus pelamis) spleen. Food Chem. 2006;98(1):14-22.
200. Ghorbel S, Souissi N, Triki-Ellouz Y, Dufossé L, Guérard F, Nasri M. Preparation
and testing of Sardinella protein hydrolysates as nitrogen source for extracellular
lipase production by Rhizopus oryzae. World J Microbiol Biotechnol. 2005;21(1):33-
8.
201. Kotzamanis Y, Gisbert E, Gatesoupe F, Infante JZ, Cahu C. Effects of different
dietary levels of fish protein hydrolysates on growth, digestive enzymes, gut
microbiota, and resistance to Vibrio anguillarum in European sea bass
(Dicentrarchus labrax) larvae. Comp Biochem Physiol A Mol Integr Physiol.
2007;147(1):205-14.
202. Quaglia G, Orban E. Influence of enzymatic hydrolysis on structure and emulsifying
properties of sardine (Sardina pilchardus) protein hydrolysates. J Food Sci.
1990;55(6):1571-3.
203. Shahidi F. Seafood processing by-products. In: Shahidi F, Botta JR, editors.
Seafoods: chemistry, processing technology and quality: Springer US; 1994. p. 320-
34.
204. Chaijan M, Benjakul S, Visessanguan W, Faustman C. Physicochemical properties,
gel-forming ability and myoglobin content of sardine (Sardinella gibbosa) and
mackerel (Rastrelliger kanagurta) surimi produced by conventional method and
alkaline solubilisation process. Eur Food Res Technol. 2006;222(1-2):58-63.
205. Ryan JT, Ross RP, Bolton D, Fitzgerald GF, Stanton C. Bioactive peptides from
muscle sources: meat and fish. Nutrients. 2011;3(9):765-91.

Bibliografic references
273
206. Carrasco-Castilla J, Hernández-Álvarez AJ, Jiménez-Martínez C, Gutiérrez-López
GF, Dávila-Ortiz G. Use of proteomics and peptidomics methods in food bioactive
peptide science and engineering. Food Eng Reviews. 2012;4(4):224-43.
207. Batista I, Pires C, Nelhas R. Extraction of sardine proteins by acidic and alkaline
solubilisation. Food Sci Technol Int. 2007;13(3):189-94.
208. Cortes-Ruiz JA, Pacheco-Aguilar R, Garciasanchez G, Lugo-Sanchez ME.
Functional characterization of a protein concentrate from bristly sardine made under
acidic conditions. J Aquat Food Prod. 2001;10(4):5-23.
209. Barkia A, Bougatef ALI, Khaled HB, Nasri M. Antioxidant activities of sardinelle
heads and/or viscera protein hydrolysates prepared by enzymatic treatment. J Food
Biochem. 2010;34:303-20.
210. Matsui T, Matsufuji H, Seki E, Osajima K, Nakashima M, Osajima Y. Inhibition of
angiotensin I-converting enzyme by Bacillus licheniformis alkaline protease
hydrolyzates derived from sardine muscle. Biosci Biotechnol Biochem.
1993;57(6):922-5.
211. Kechaou ES, Dumay J, Donnay-Moreno C, Jaouen P, Gouygou J-P, Bergé J-P,
Amar RB. Enzymatic hydrolysis of cuttlefish (Sepia officinalis) and sardine (Sardina
pilchardus) viscera using commercial proteases: effects on lipid distribution and
amino acid composition. J Biosci Bioeng. 2009;107(2):158-64.
212. Taheri A, Abedian Kenari A, Motamedzadegan A, Habibi Rezaie M. Optimization of
goldstripe sardine (Sardinella gibbosa) protein hydrolysate using Alcalase® 2.4L by
response surface methodology. CyTA - J Food. 2011;9(2):114-20.
213. Morales-Medina R, Tamm F, Guadix AM, Guadix EM, Drusch S. Functional and
antioxidant properties of hydrolysates of sardine (S. pilchardus) and horse mackerel
(T. mediterraneus) for the microencapsulation of fish oil by spray-drying. Food
Chem. 2016;194:1208-16.
214. Dumay J, Allery M, Donnay‐Moreno C, Barnathan G, Jaouen P, Carbonneau ME,
Pascal J, Bergé JP. Optimization of hydrolysis of sardine (Sardina pilchardus) heads
with Protamex: enhancement of lipid and phospholipid extraction. J Sci Food Agric.
2009;89(9):1599-606.
215. García-Moreno PJ, Batista I, Pires C, Bandarra NM, Espejo-Carpio FJ, Guadix A,
Guadixa EM. Antioxidant activity of protein hydrolysates obtained from discarded
Mediterranean fish species. Food Res Int. 2014;65, Part C(0):469-76.
216. Aristotelis T. Himonides AKDT, Anne J. Morris. A study of the enzymatic hydrolysis
of fish frames using model systems. Food Nutr Sci. 2011;2(6):575-85.
217. Aspmo SI, Horn SJ, H. Eijsink VG. Enzymatic hydrolysis of Atlantic cod (Gadus
morhua L.) viscera. Process Biochem. 2005;40(5):1957-66.

274
218. Halim NRA, Yusof HM, Sarbon NM. Functional and bioactive properties of fish
protein hydolysates and peptides: a comprehensive review. Trends Food Sci
Technol. 2016,51:24-33.
219. Chove LM, Grandison AS, Lewis MJ. Comparison of methods for analysis of
proteolysis by plasmin in milk. J Dairy Res. 2011;78(2):184-90.
220. Toldrá F, Sentandreu MA, Aristoy M-C. Determination of Proteolysis. In: Nollet LML,
Toldra F, editors. Handbook of processed meats and poultry analysis. USA: CRC
Press; 2008. p. 163-171.
221. Léonil J, Gagnaire V, Mollé D, Pezennec S, Bouhallab Sd. Application of
chromatography and mass spectrometry to the characterization of food proteins and
derived peptides. J Chromatogr A. 2000;881(1):1-21.
222. Khaled HB, Ktari N, Ghorbel-Bellaaj O, Jridi M, Lassoued I, Nasri M. Composition,
functional properties and in vitro antioxidant activity of protein hydrolysates prepared
from sardinelle (Sardinella aurita) muscle. J Food Sci Technol. 2014;51(4):622-33.
223. Jemil I, Jridi M, Nasri R, Ktari N, Ben Slama-Ben Salem R, Mehiri M, Hajji M, Nasria
M. Functional, antioxidant and antibacterial properties of protein hydrolysates
prepared from fish meat fermented by Bacillus subtilis A26. Process Biochem.
2014;49(6):963-72.
224. García-Moreno PJ, Guadix A, Guadix EM, Jacobsen C. Physical and oxidative
stability of fish oil-in-water emulsions stabilized with fish protein hydrolysates. Food
Chem. 2016;203:124-35.
225. Ravallec‐Plé R, Charlot C, Pires C, Braga V, Batista I, Van Wormhoudt A, Le Gal Y,
Fouchereau-Péron M. The presence of bioactive peptides in hydrolysates prepared
from processing waste of sardine (Sardina pilchardus). J Sci Food Agric.
2001;81(11):1120-5.
226. Fitzgerald A, Rai P, Marchbank T, Taylor G, Ghosh S, Ritz B, Playford RJ.
Reparative properties of a commercial fish protein hydrolysate preparation. Gut.
2005;54(6):775-81.
227. Erdmann K, Grosser N, Schipporeit K, Schröder H. The ACE inhibitory dipeptide
Met-Tyr diminishes free radical formation in human endothelial cells via induction of
heme oxygenase-1 and ferritin. J Nutr. 2006;136(8):2148-52.
228. Louala S, Hamza-Reguig S, Benyahia-Mostefaoui A, Boualga A, Lamri-Senhadji
MY. Effects of highly purified sardine proteins on lipid peroxidation and reverse
cholesterol transport in rats fed a cholesterol-rich diet. J Funct Foods.
2011;3(4):321-8.
Bibliografic references
275
229. Sugiyama K, Egawa M, Onzuka H, Oba K. Characteristics of sardine muscle
hydrolysates prepared by various enzymic treatments. Bull Jpn Soc Sci Fish.
1991;75:475-9.
230. Ukeda H, Matsuda H, Kuroda H, Osajima K, Matsufuji H, Osajima Y. Preparation
and separation of angiotensin I converting enzyme inhibitory peptides. J Agric Chem
Soc of Japan. 1991; 65:1223-1228.
231. Matsui T, Matsufuji H, Seki E, Osajima K, Nakashima M, Osajima Y. Inhibition of
angiotensin I-converting enzyme by Bacillus licheniformis alkaline protease
hydrolyzates derived from sardine muscle. Biosci Biotechnol Biochem.
1993;57(6):922-5.
232. Suetsuna K, Ukeda H. Isolation of an octapeptide which possesses active oxygen
scavenging activity from peptic digest of sardine muscle. Nippon Suisan Gakkaishi.
1999;65(6):1096-9.
233. Taheri A, Anvar S, Ahari H, Fogliano V. Comparison the functional properties of
protein hydrolysates from poultry byproducts and rainbow trout (Onchorhynchus
mykiss) viscera. Iran J Fish Sci. 2013;12(1):154-69.
234. Nazeer R, Deeptha R. Antioxidant activity and amino acid profiling of protein
hydrolysates from the skin of Sphyraena barracuda and Lepturacanthus savala. Int
J Food Prop. 2013;16(3):500-11.
235. Zhang L, Liu Y, Lu D, Han J, Lu X, Tian Z, Wang Z. Angiotensin converting enzyme
Inhibitory, antioxidant activities, and antihyperlipidaemic activities of protein
hydrolysates from Scallop Mantle (Chlamys Farreri). Int J Food Prop. 2015;18(1):33-
42.
236. Cinq-Mars CD, Li-Chan EC. Optimizing angiotensin I-converting enzyme inhibitory
activity of Pacific hake (Merluccius productus) fillet hydrolysate using response
surface methodology and ultrafiltration. J Agric Food Chem. 2007;55(23):9380-8.
237. Ren J, Zhao M, Shi J, Wang J, Jiang Y, Cui C, Kakuda Y, Xue SJ. Optimization of
antioxidant peptide production from grass carp sarcoplasmic protein using response
surface methodology. Food Sci Technol. 2008;41(9):1624-32.
238. Hsu K-C. Purification of antioxidative peptides prepared from enzymatic
hydrolysates of tuna dark muscle by-product. Food Chem. 2010;122(1):42-8.
239. Wiriyaphan C, Chitsomboon B, Yongsawadigul J. Antioxidant activity of protein
hydrolysates derived from threadfin bream surimi byproducts. Food Chem.
2012;132(1):104-11.
240. Yang P, Ke H, Hong P, Zeng S, Cao W. Antioxidant activity of bigeye tuna (Thunnus
obesus) head protein hydrolysate prepared with Alcalase. Int J Food Sci Technol.
2011;46(12):2460-6.

276
241. Yongsawatdigul J, Hemung B-O. Structural changes and functional properties of
Threadfin Bream sarcoplasmic proteins subjected to pH-shifting treatments and
lyophilization. J Food Sci. 2010;75(3):C251-C7.
242. Ladrat C, Verrez-Bagnis V, Noël J, Fleurence J. In vitro proteolysis of myofibrillar
and sarcoplasmic proteins of white muscle of sea bass (Dicentrarchus labrax L.):
effects of cathepsins B, D and L. Food Chem. 2003;81(4):517-25.
243. Miguel M, Davalos A, Manso MA, de la Pena G, Lasuncion MA, Lopez-Fandino R.
Transepithelial transport across Caco-2 cell monolayers of antihypertensive egg-
derived peptides. PepT1-mediated flux of Tyr-Pro-Ile. Mol Nutr Food Res.
2008;52(12):1507-13.
244. Picot L, Ravallec R, Fouchereau-Peron M, Vandanjon L, Jaouen P, Chaplain-
Derouiniot M, Guérard F, Chabeaud A, Legal Y, Alvarez OM, Bergé JP, Piot JM,
Batista I, Pires C, Thorkelsson G, Delannoy C, Jakobsen G, Johansson I, Bourseau
P. Impact of ultrafiltration and nanofiltration of an industrial fish protein hydrolysate
on its bioactive properties. J Sci Food Agric. 2010;90(11):1819-26.
245. Ding L, Zhang Y, Jiang Y, Wang L, Liu B, Liu J. Transport of egg white ACE-inhibitory
peptide, Gln-Ile-Gly-Leu-Phe, in human intestinal Caco-2 cell monolayers with
cytoprotective effect. J Agric Food Chem. 2014;62(14):3177-82.
246. Wiriyaphan C, Xiao H, Decker EA, Yongsawatdigul J. Chemical and cellular
antioxidative properties of threadfin bream (Nemipterus spp.) surimi byproduct
hydrolysates fractionated by ultrafiltration. Food Chem. 2015;167:7-15.
247. Pérez-Vega JA, Olivera-Castillo L, Gómez-Ruiz JÁ, Hernández-Ledesma B.
Release of multifunctional peptides by gastrointestinal digestion of sea cucumber
(Isostichopus badionotus). J Funct Foods. 2013;5(2):869-77.
248. Sarmento B, Andrade F, Silva SBd, Rodrigues F, das Neves J, Ferreira D. Cell-
based in vitro models for predicting drug permeability. Expert Opin Drug Metab
Toxicol. 2012;8(5):607-21.
249. Sambuy Y, De Angelis I, Ranaldi G, Scarino M, Stammati A, Zucco F. The Caco-2
cell line as a model of the intestinal barrier: influence of cell and culture-related
factors on Caco-2 cell functional characteristics. Cell Biol Toxicol. 2005;21(1):1-26.
250. Renukuntla J, Vadlapudi AD, Patel A, Boddu SHS, Mitra AK. Approaches for
enhancing oral bioavailability of peptides and proteins. Int J Pharm. 2013;447(0):75-
93.
251. Vieira EF, Ferreira IMPLVO. Antioxidant and antihypertensive hydrolysates obtained
from by-products of cannery sardine and brewing industries. Int J Food Prop. 2016.
DOI:10.1080/10942912.2016.1176036.
Bibliografic references
277
252. Jeon Y-J, Byun H-G, Kim S-K. Improvement of functional properties of cod frame
protein hydrolysates using ultrafiltration membranes. Process Biochem.
1999;35(5):471-8.
253. Connolly A, O'Keeffe MB, Piggott CO, Nongonierma AB, FitzGerald RJ. Generation
and identification of angiotensin converting enzyme (ACE) inhibitory peptides from
a brewers' spent grain protein isolate. Food Chem. 2015;176:64-71.
254. Lee S-H, Qian Z-J, Kim S-K. A novel angiotensin I converting enzyme inhibitory
peptide from tuna frame protein hydrolysate and its antihypertensive effect in
spontaneously hypertensive rats. Food Chem. 2010;118(1):96-102.
255. Wu J, Ding X. Characterization of inhibition and stability of soy-protein-derived
angiotensin I-converting enzyme inhibitory peptides. Food Res Int. 2002;35(4):367-
75.
256. Gouyer V, Wiede A, Buisine MP, Dekeyser S, Moreau O, Lesuffleur T, Hoffmann W,
Huet G. Specific secretion of gel-forming mucins and TFF peptides in HT-29 cells of
mucin-secreting phenotype. Biochim Biophys Acta. 2001;1539(1-2):71-84.
257. Behrens I, Stenberg P, Artursson P, Kissel T. Transport of lipophilic drug molecules
in a new mucus-secreting cell culture model based on HT29-MTX cells. Pharm Res.
2001;18(8):1138-45.
258. Pontier C, Pachot J, Botham R, Lenfant B, Arnaud P. HT29-MTX and Caco-2/TC7
monolayers as predictive models for human intestinal absorption: role of the mucus
layer. J Pharm Sci. 2001;90(10):1608-19.
259. Regazzo D, Mollé D, Gabai G, Tomé D, Dupont D, Leonil J, Boutrou R. The (193–
209) 17‐residues peptide of bovine β‐casein is transported through Caco‐2
monolayer. Mol Nutr Food Res. 2010;54(10):1428-35.
260. Kunimoto A, Yokoro M, Murota K, Yamanishi R, Suzuki-Yamamoto T, Suzuki M,
Yutani C, Doi S, Hiemori M, Yamashita H, Takahashi Y, Tsuji H, Kimoto M.
Gastrointestinal digestion and absorption of Pen j 1, a major allergen from Kuruma
prawn, Penaeus japonicus. Biosci Biotechnol Biochem. 2011;75(7):1249-58.
261. Vermeirssen V, Van Camp J, Verstraete W. Fractionation of angiotensin I converting
enzyme inhibitory activity from pea and whey protein in vitro gastrointestinal digests.
J Sci Food Agric. 2005;85(3):399-405.
262. Millán-Linares MdC, Bermúdez B, Yust MdM, Millán F, Pedroche J. Anti-
inflammatory activity of lupine (Lupinus angustifolius L.) protein hydrolysates in THP-
1-derived macrophages. J Funct Foods. 2014;8:224-33.
263. Kim YS, Ahn CB, Je JY. Anti-inflammatory action of high molecular weight Mytilus
edulis hydrolysates fraction in LPS-induced RAW264.7 macrophage via NF-kappaB
and MAPK pathways. Food Chem. 2016;202:9-14.

278
264. Hsu W-H, Lee B-H, Lu I-J, Pan T-M. Ankaflavin and monascin regulate endothelial
adhesion molecules and endothelial NO synthase (eNOS) expression induced by
tumor necrosis factor-α (TNF-α) in human umbilical vein endothelial cells (HUVECs).
J Agric Food Chem. 2012;60(7):1666-72.
265. Zhang W-c, Wang Y-g, Zhu Z-f, Wu F-q, Peng Y-d, Chen Z-y, Yang J-h, Wu J-j,
Lian Y-t, He M-a, Wu T-c, Cheng L-x. Regulatory T cells protect fine particulate
matter-induced inflammatory responses in human umbilical vein endothelial cells.
Mediators Inflamm. 2014;2014.
266. Chao PY, Huang YP, Hsieh WB. Inhibitive effect of purple sweet potato leaf extract
and its components on cell adhesion and inflammatory response in human aortic
endothelial cells. Cell Adh Migr. 2013;7(2):237-45.
267. Mukhopadhya A, Noronha N, Bahar B, Ryan MT, Murray BA, Kelly PM, O'Loughlin
IB, O'Doherty JV, Sweeney T. The anti-inflammatory potential of a moderately
hydrolysed casein and its 5 kDa fraction in in vitro and ex vivo models of the
gastrointestinal tract. Food Funct. 2015;6(2):612-21.
268. Grootaert C, Kamiloglu S, Capanoglu E, Van Camp J. Cell systems to investigate
the impact of polyphenols on cardiovascular health. Nutrients. 2015;7(11):9229-55.
269. Cheng M-L, Wang H-C, Hsu K-C, Hwang J-S. Anti-inflammatory peptides from
enzymatic hydrolysates of tuna cooking juice. Food Agric Immunol. 2015, 26(6):
770-781.
270. Ko S-C, Jeon Y-J. Anti-inflammatory effect of enzymatic hydrolysates from Styela
clava flesh tissue in lipopolysaccharide-stimulated RAW 264.7 macrophages and in
vivo zebrafish model. Nutr Res Pract. 2014;9(3):219-26.
271. Chakrabarti S, Wu J. Bioactive peptides on endothelial function. Food Science and
Human Wellness. 2016;5(1):1-7.
272. de Mejia EG, Dia VP. Lunasin and lunasin-like peptides inhibit inflammation through
suppression of NF-κB pathway in the macrophage. Peptides. 2009;30(12):2388-98.
273. Dia VP, Wang W, Oh V, De Lumen B, De Mejia EG. Isolation, purification and
characterisation of lunasin from defatted soybean flour and in vitro evaluation of its
anti-inflammatory activity. Food Chem. 2009;114(1):108-15.
274. Lin MC, Lin SB, Lee SC, Lin CC, Hui CF, Chen JY. Antimicrobial peptide of an anti-
lipopolysaccharide factor modulates of the inflammatory response in RAW264.7
cells. Peptides. 2010;31(7):1262-72.
275. Park SY, Ahn CB, Je JY. Antioxidant and anti‐inflammatory activities of protein
hydrolysates from Mytilus edulis and ultrafiltration membrane fractions. J Food
Biochem 2014;38(5):460-8.

Bibliografic references
279
276. Hwang JW, Lee SJ, Kim YS, Kim EK, Ahn CB, Jeon YJ, Moon SH, Jeon BT, Park
PJ. Purification and characterization of a novel peptide with inhibitory effects on
colitis induced mice by dextran sulfate sodium from enzymatic hydrolysates of
Crassostrea gigas. Fish Shellfish Immunol. 2012;33(4):993-9.
277. Lee S-J, Kim E-K, Kim Y-S, Hwang J-W, Lee KH, Choi D-K, Choi DK, Kang H, Moon
SH, Jeon BT, Park PJ. Purification and characterization of a nitric oxide inhibitory
peptide from Ruditapes philippinarum. Food Chem Toxicol. 2012;50(5):1660-6.
278. Kim E-K, Kim Y-S, Hwang J-W, Kang SH, Choi D-K, Lee K-H, Lee JS, Moon SH,
Jeon BT, Park PJ. Purification of a novel nitric oxide inhibitory peptide derived from
enzymatic hydrolysates of Mytilus coruscus. Fish & Shellfish Immunol.
2013;34(6):1416-20.
279. Kangsanant S, Thongraung C, Jansakul C, Murkovic M, Seechamnanturakit V.
Purification and characterisation of antioxidant and nitric oxide inhibitory peptides
from Tilapia (Oreochromis niloticus) protein hydrolysate. Int J Food Sci Technol.
2015;50(3):660-5.
280. Rho H-S, Kim H, Kim J, Karadeniz F, Ahn B-N, Nam K-H, Seo Y, Kong C-S. Anti-
inflammatory effect of by-products from Haliotis discus hannai in RAW 264.7 cells.
J Chem. 2015;2015.
281. Ahn CB, Cho YS, Je JY. Purification and anti-inflammatory action of tripeptide from
salmon pectoral fin byproduct protein hydrolysate. Food Chem. 2015;168:151-6.
282. Kuntz S, Asseburg H, Dold S, Römpp A, Fröhling B, Kunz C, Rudloff S. Inhibition of
low-grade inflammation by anthocyanins from grape extract in an in vitro epithelial-
endothelial co-culture model. Food Funct. 2015;6(4):1136-49.
283. Toaldo IM, Grootaert C, Gonzales GH, Kamiloglu S, Bordignon-Luiz MT, Van Camp
J. Resveratrol and its metabolites synergistically improve TNF- α-induced
endothelial dysfunction in a co-culture model of Caco-2 and endothelial cells – A
targeted metabolomics study. 2016. (under review).
284. Sun X, Chakrabarti S, Fang J, Yin Y, Wu J. Low molecular-weight fractions of
Alcalase hydrolyzed egg ovomucin extract exert anti-inflammatory activity in Human
dermal fibroblasts through the inhibition of TNF mediated NF-κB pathway. Nutr Res.
2016. (in press).
285. Hadi HA, Carr CS, Suwaidi J. Endothelial dysfunction: cardiovascular risk factors,
therapy, and outcome. Vasc Health Risk Manag. 2005;1(3):183.
286. Ndiaye F, Vuong T, Duarte J, Aluko RE, Matar C. Anti-oxidant, anti-inflammatory
and immunomodulating properties of an enzymatic protein hydrolysate from yellow
field pea seeds. Eur J Nutr. 2012;51(1):29-37.
280
287. Maaser C, Schoeppner S, Kucharzik T, Kraft M, Schoenherr E, Domschke W,
Luegering N. Colonic epithelial cells induce endothelial cell expression of ICAM-1
and VCAM-1 by a NF-kappaB-dependent mechanism. Clin Exp Immunol.
2001;124(2):208-13.
288. García-Moreno PJ, Espejo-Carpio FJ, Guadix A, Guadix EM. Production and
identification of angiotensin I-converting enzyme (ACE) inhibitory peptides from
Mediterranean fish discards. J Funct Foods. 2015;18:95-105.
289. Quaglia GB, Orban E. Enzymic solubilisation of proteins of sardine (sardina
pilchardus) by commercial proteases. J Sci Food Agric. 1987;38(3):263-9.
290. Tsumura K, Saito T, Tsuge K, Ashida H, Kugimiya W, Inouye K. Functional
properties of soy protein hydrolysates obtained by selective proteolysis. LWT-Food
Sci Technol. 2005;38(3):255-61.
291. Pearce KN, Kinsella JE. Emulsifying properties of proteins: evaluation of a
turbidimetric technique. J Agric Food Chem. 1978;26(3):716-23.
292. Shahidi F, Han X-Q, Synowiecki J. Production and characteristics of protein
hydrolysates from capelin (Mallotus villosus). Food chem. 1995;53(3):285-93.
293. McConnell A, Eastwood M, Mitchell W. Physical characteristics of vegetable
foodstuffs that could influence bowel function. J Sci Food Agric. 1974;25(12):1457-
64.
294. Lin MJ-Y, Humbert E, Sosulski F. Certain functional properties of sunflower meal
products. J Food Sci. 1974;39(2):368-70.
295. Benjakul S, Morrissey MT. Protein hydrolysates from Pacific whiting solid wastes. J
Agric Food Chem. 1997;45(9):3423-30.
296. Ktari N, Jridi M, Bkhairia I, Sayari N, Ben Salah R, Nasri M. Functionalities and
antioxidant properties of protein hydrolysates from muscle of zebra blenny (Salaria
basilisca) obtained with different crude protease extracts. Food Res Int.
2012;49(2):747-56.
297. Mussatto SI, Dragone G, Roberto IC. Brewers' spent grain: generation,
characteristics and potential applications. J Cereal Sci. 2006;43(1):1-14.
298. Szwajgier D, Waśko A, Targoński Z, Niedźwiadek M, Bancarzewska M. The use of
a novel ferulic acid esterase from Lactobacillus acidophilus K1 for the release of
phenolic acids from brewer's spent grain. J Inst Brew. 2010;116(3):293-303.
299. McCarthy AL, O’Callaghan YC, Connolly A, Piggott CO, FitzGerald RJ, O’Brien NM.
Phenolic extracts of brewers’ spent grain (BSG) as functional ingredients –
Assessment of their DNA protective effect against oxidant-induced DNA single
strand breaks in U937 cells. Food Chem. 2012;134(2):641-6.
Bibliografic references
281
300. Fukuda M, Kanauchi O, Araki Y, Andoh A, Mitsuyama K, Takagi K, Toyonaga A,
Sata M, Fujiyama Y, Fukuoka M, Matsumoto Y, Bamba T. Prebiotic treatment of
experimental colitis with germinated barley foodstuff: a comparison with probiotic or
antibiotic treatment. Int J Mol Med. 2002;9(1):65-70.
301. Kanauchi O, Mitsuyama K, Araki Y. Development of a functional germinated barley
foodstuff from brewer's spent grain for the treatment of ulcerative colitis. J Am Soc
Brew Chem. 2001;59(2):59-62.
302. McCarthy AL, O'Callaghan YC, Piggott CO, FitzGerald RJ, O'Brien NM. Brewers'
spent grain; bioactivity of phenolic component, its role in animal nutrition and
potential for incorporation in functional foods: a review. Proc Nutr Soc.
2013;72(1):117-25.
303. Santos M, Jiménez J, Bartolomé B, Gómez-Cordovés C, Del Nozal M. Variability of
brewer’s spent grain within a brewery. Food Chem. 2003;80(1):17-21.
304. Liyana-Pathirana C, Shahidi F. Importance of insoluble-bound phenolics to
antioxidant properties of wheat. J Agric Food Chem. 2006;54(4):1256 - 64.
305. Aliyu S, Bala M. Brewer’s spent grain: a review of its potentials and applications. Afr
J Biotechnol. 2013;10(3):324-31.
306. Kotlar C, Ponce A, Roura S. Improvement of functional and antimicrobial properties
of brewery byproduct hydrolysed enzymatically. Food Sci Technol. 2013;50(2):378-
85.
307. McCarthy AL, O'Callaghan YC, Connolly A, Piggott CO, FitzGerald RJ, O'Brien NM.
In vitro antioxidant and anti-inflammatory effects of brewers' spent grain protein rich
isolate and its associated hydrolysates. Food Res Int. 2013;50(1):205-12.
308. Connolly A, Piggott CO, FitzGerald RJ. Characterisation of protein-rich isolates and
antioxidative phenolic extracts from pale and black brewers' spent grain. Int J Food
Sci Technol. 2013;48(8):1670-81.
309. Connolly A, Piggott CO, FitzGerald RJ. In vitro α-glucosidase, angiotensin
converting enzyme and dipeptidyl peptidase-IV inhibitory properties of brewers'
spent grain protein hydrolysates. Food Res Int. 2014;56:100-7.
310. Hassona H. High fibre bread containing brewer's spent grains and its effect on lipid
metabolism in rats. Food/Nahrung. 1993;37(6):576-82.
311. Öztürk S, Özboy Ö, Cavidoğlu İ, Köksel H. Effects of brewer's spent grain on the
quality and dietary fibre content of cookies. J Inst Brew. 2002;108(1):23-7.
312. Szponar B, Pawlik KJ, Gamian A, Dey ES. Protein fraction of barley spent grain as
a new simple medium for growth and sporulation of soil actinobacteria. Biotechnol
Lett. 2003;25(20):1717-21.

282
313. McCarthy AL, O'Callaghan YC, Connolly A, Piggott CO, FitzGerald RJ, O'Brien NM.
Brewers' spent grain (BSG) protein hydrolysates decrease hydrogen peroxide
(H2O2)-induced oxidative stress and concanavalin-A (con-A) stimulated IFN-gamma
production in cell culture. Food Funct. 2013;4(11):1709-16.
314. Van Craeyveld V, Swennen K, Dornez E, Van de Wiele T, Marzorati M, Verstraete
W, Delaedt Y, Onagbesan O, Decuypere E, Buyse J, De Ketelaere B, Broekaert
WF, Delcour JA, Courtin CM. Structurally different wheat-derived
arabinoxylooligosaccharides have different prebiotic and fermentation properties in
rats. J Nutr. 2008;138(12):2348-55.
315. Delcour J, Courtin C, Broekaert W, Swennen K, Verbeke K, Rutgeers P, inventors,
Google Patents, assignee. Prebiotic preparation. CA 2569856 C. 2014 Set 16.
316. Broekaert W, Courtin C, Damen B, Delcour J, inventors, Google Patents, assignee.
Nutriment containing arabinoxylan and oligosaccharides. US 8741376 B2. 2014 Jun
3.
317. Cho SS, Samuel P. Fiber ingredients: Food applications and health benefits. USA:
CRC Press; 2009.
318. Roos AA, Persson T, Krawczyk H, Zacchi G, Stålbrand H. Extraction of water-
soluble hemicelluloses from barley husks. Bioresour Technol. 2009;100(2):763-9.
319. Meneses NGT, Martins S, Teixeira JA, Mussatto SI. Influence of extraction solvents
on the recovery of antioxidant phenolic compounds from brewer’s spent grains. Sep
Purif Technol. 2013;108(0):152-8.
320. Moreira MM, Morais S, Carvalho DO, Barros AA, Delerue-Matos C, Guido LF.
Brewer's spent grain from different types of malt: Evaluation of the antioxidant
activity and identification of the major phenolic compounds. Food Res Int.
2013;54(1):382-8.
321. Piggott CO, Connolly A, FitzGerald RJ. Application of ultrafiltration in the study of
phenolic isolates and melanoidins from pale and black brewers' spent grain. Int J
Food Sci Technol. 2014;49(10):2252-9.
322. Coimbra MA, Ferreira, IMPLVO, Rocha, MAM, Vieira, EMF, Saraiva, JMA, Pinho,
OMC, inventors; Google Patents, assignee. Integrated process for extracting
proteins and arabinoxylans from brewer's spent grain. Patent WO 2012069889 A1.
2012 Mai 31.
323. Hernanz D, Nuñez V, Sancho AI, Faulds CB, Williamson G, Bartolomé B, Gómez-
Cordovés C. Hydroxycinnamic acids and ferulic acid dehydrodimers in barley and
processed barley. J Agric Food Chem. 2001;49(10):4884-8.
Bibliografic references
283
324. Kuwabara Y, Nagai S, Yoshimitsu N, Nakagawa I, Watanabe Y, Tamai Y.
Antihypertensive effect of the milk fermented by culturing with various lactic acid
bacteria and a yeast. J Ferment Bioeng. 1995;80(3):294-5.
325. Chaves-Lopez C, Tofalo R, Serio A, Paparella A, Sacchetti G, Suzzi G. Yeasts from
Colombian Kumis as source of peptides with Angiotensin I converting enzyme (ACE)
inhibitory activity in milk. Int J Food Microbiol. 2012;159(1):39-46.
326. Bolumar T, Sanz Y, Aristoy MC, Toldrá F. Protease B from Debaryomyces hansenii:
purification and biochemical properties. Int J Food Microbiol. 2005;98(2):167-77.
327. García-Carreño FL. Protease inhibition in theory and practice. Biotechnol Educ.
1992;3(4):145-50.
328. Fang Y-Z, Yang S, Wu G. Free radicals, antioxidants, and nutrition. Nutrition.
2002;18(10):872-9.
329. Hayashi R, Oka Y, Doi E, Hata T. Activation of intracellular proteinases of yeast:
Part I. Occurrences of inactive precursors of proteinases B and C and their activation
Part II. Activation and some properties of pro-proteinase C. Agric Biol Chem.
1968;32(3):359-66.
330. Pokora M, Eckert E, Zambrowicz A, Bobak Ł, Szołtysik M, Dąbrowska A,
Chrzanowska J, Polanowski A, Trziszka T. Biological and functional properties of
proteolytic enzyme-modified egg protein by-products. Food Sci Nutr. 2013;1(2):184-
95.
331. Goya L, Martín MÁ, Ramos S, Mateos R, Bravo L. A cell culture model for the
assessment of the chemopreventive potential of dietary compounds. Curr Nutr Food
Sci. 2009;5(1):56-64.
332. Cheli F, Baldi A. Nutrition‐Based Health: Cell‐based bioassays for food antioxidant
activity evaluation. J Food Sci. 2011;76(9):197-205.
333. Kannan A, Hettiarachchy NS, Marshall M, Raghavan S, Kristinsson H. Shrimp shell
peptide hydrolysates inhibit human cancer cell proliferation. J Sci Food Agric.
2011;91(10):1920-4.
334. Serra AT, Duarte RO, Bronze MR, Duarte CMM. Identification of bioactive response
in traditional cherries from Portugal. Food Chem. 2011;125(2):318-25.
335. Shi Y, Kovacs-Nolan J, Jiang B, Tsao R, Mine Y. Antioxidant activity of enzymatic
hydrolysates from eggshell membrane proteins and its protective capacity in human
intestinal epithelial Caco-2 cells. J Funct Foods. 2014;10:35-45.
336. Sahu SC, Zheng J, Graham L, Chen L, Ihrie J, Yourick JJ, Sprando RL. Comparative
cytotoxicity of nanosilver in human liver HepG2 and colon Caco2 cells in culture. J
Appl Toxicol. 2014;34(11):1155-66.
284
337. Yarnpakdee S, Benjakul S, Kristinsson HG, Bakken HE. Preventive effect of Nile
tilapia hydrolysate against oxidative damage of HepG2 cells and DNA mediated by
H2O2 and AAPH. J Food Sci Technol. 2015;52(10):6194-205.
338. Shamloo M, Bakar J, Mat Hashim D, Khatib A. Biochemical properties of red tilapia
(Oreochromis niloticus) protein hydrolysates. Int Food Res J. 2012;19(1):183-8.
339. Celus I, Brijs K, Delcour JA. The effects of malting and mashing on barley protein
extractability. J Cereal Sci. 2006;44(2):203-11.
340. Mukhopadhya A, Noronha N, Bahar B, Ryan MT, Murray BA, Kelly PM, Kelly PM,
O'Loughlin IB, O'Doherty JV, Sweeney T. Anti‐inflammatory effects of a casein
hydrolysate and its peptide‐enriched fractions on TNFα‐challenged Caco‐2 cells and
LPS‐challenged porcine colonic explants. Food Sci Nutr. 2014;2(6):712-23.
341. Forghani B, Ebrahimpour A, Bakar J, Abdul Hamid A, Hassan Z, Saari N. Enzyme
hydrolysates from Stichopus horrens as a new source for Angiotensin-converting
enzyme inhibitory peptides. Evid Based Complement Alternat Med. 2012: 2012:
236384.
342. Di Bernardini R, Mullen AM, Bolton D, Kerry J, O'Neill E, Hayes M. Assessment of
the angiotensin-I-converting enzyme (ACE-I) inhibitory and antioxidant activities of
hydrolysates of bovine brisket sarcoplasmic proteins produced by papain and
characterisation of associated bioactive peptidic fractions. Meat Sci.
2012;90(1):226-35.
343. Alemán A, Pérez-Santín E, Bordenave-Juchereau S, Arnaudin I, Gómez-Guillén
MC, Montero P. Squid gelatin hydrolysates with antihypertensive, anticancer and
antioxidant activity. Food Res Int. 2011;44(4):1044-51.
344. Zhang Q-X, Ling Y-F, Sun Z, Zhang L, Yu H-X, Kamau SM, Lu RR. Protective effect
of whey protein hydrolysates against hydrogen peroxide-induced oxidative stress on
PC12 cells. Biotechnol Lett. 2012;34(11):2001-6.