valorization of glycerol for commodity chemicals through ...valorization of glycerol for commodity...
TRANSCRIPT

Valorization of Glycerol for Commodity Chemicals through Vapour Phase
Hydrogenolysis over Supported Platinum Catalysts
A thesis submitted in fulfilment of the requirements for the degree of Doctor of
Philosophy
Samudrala Santhi Priya
M.Sc. Chemistry
School of Applied Sciences
College of Science Engineering and Health
RMIT University
May 2016

Declaration
I certify that except where due acknowledgement has been made, the work is that of the
author alone; the work has not been submitted previously, in whole or in part, to qualify for
any other academic award; the content of the thesis is the result of work which has been
carried out since the official commencement date of the approved research program; any
editorial work, paid or unpaid, carried out by a third party is acknowledged; and, ethics
procedures and guidelines have been followed.
Samudrala Santhi Priya
06/10/2016

iii | P a g e
Acknowledgements
First, I thank almighty for his grace and blessings to help me achieve of what I am today.
It gives me a great delight to express my gratitude to many people whom, without the
support and inspiration from them, this thesis work would not have been possible.
I would like to express my sincere thanks and indebtedness to my supervisors Prof.
Suresh Bhargava, Dr. K. V. R. Chary, & Dr. M. Lakshmi Kantam for their invaluable
guidance, suggestions and able supervision throughout my research work. I would like to
thank them for being such a tremendous source of inspiration, and truly appreciate the
freedom given to me to explore new ideas, and for having confidence in my abilities and me.
Your unwavering encouragement and affection gave me confidence and purpose.
At the outset, I wish to owe deep debts of thanks and regards to Prof Suresh
Bhargava & Dr. M. Lakshmi Kantam for giving me an opportunity to work in RMIT-
IICT joint research programme. I greatly acknowledge the financial support provided by
RMIT-IICT research scholarship, RMIT University.
I extend my profound regards to all faculty and staff members of Inorganic and
Physical Chemistry Division, IICT-Hyderabad. My cordial appreciation goes to my lab
member, Dr. Pavan Kumar, for his valuable assistance during experiments, assorted help
and encouragement. I also thank all my colleagues and lab mates in IICT, R. Kishore,
Mounika, Rammohan, Bharat, Venkatesh, P. Bhanuchander, Hussain, G. Sailaja,
Ashishkumar, G. Srinivasarao, A. Srikanth, B. Viswanadham, B. Putrakumar, N.
Pethanrajan, M. Harishekar, Y. Harikrishna, K. Ramu, N. Nagaraju, S. Ammaji, Mrs.
Rohita for their support and motivation during my research work.
I would like to thank my friends Vishali, Gayatri, Swetha, Pavan, Bhavani for
their amusing and refreshing company at IICT. I thank all my friends at RMIT University,
Shalini, Parvati, Radha, Vijay, Srinivas, Jampaiah, Praveen, Suresh, Srinivas reddy,
Hitesh, Pooja and Anushri for making my stay a pleasant experience at RMIT University,
Melbourne.

iv | P a g e
I owe my heartfelt gratitude and regards to Dr. Selvakannan and Dr. Deepa for
their valuable advice and care who were always available to answer a question and offer
help. I take this opportunity to extend my thanks to Prof. Andrew Smith, Former Dean,
School of Applied Sciences, Prof. Peter Coloe, Pro Vice-Chancellor & Vice President, School
of Science, Engineering & Health, Prof. Russel Crawford, Executive Dean, School of
Applied Sciences for giving me an opportunity to work in RMIT University. I also thank
Prof. Gary Bryant, Director of Graduate Research and all staff members of School of
Applied Sciences, RMIT University, Mrs. Zahra Homan, Mr. Karl Lang, Mrs. Diane
Mileo, Mr. Frank Antolasic, Dr. Lisa Dias, Dr. Emma Goethals, Dr. Hailey Reynolds, Dr.
Theola Louie, and Piyumi Wickramaarachchi who have been kind enough to give advice
and help in their respective roles. I thank staff at RMIT microscopy and microanalysis
facilities, RMIT University for training and giving assistance in using the instruments.
This thesis would have been simply impossible without the indefatigable love and
support of my family. I have no word that can fully describe my mother, Yashoda. Her love
and affection, sacrifices she made, and her everlasting support gave me the strength and
courage to complete this project successfully. I owe my gratitude to my father, Hanumantha
Rao, for his unconditional support and love. Thanks to my elder brother Kiran for his
utmost care and encouragement during my studies. My younger brother Arun’s light hearted
chats always served as a booster of rejuvenation and my special thanks to him for showing
the advertisement of RMIT-IICT research programme.
Many thanks go to my husband, Ramesh, who has always encouraged me to follow
my heart and always being on my side as a best friend throughout my life and career. You
have always let me know that you are proud of me, which has motivated me to do my best.
Your love, patience, understanding and personal sacrifices made an everlasting impression
on my life.
Thanks to my little angel, my daughter Akshaya Nidhi, who brightens up my life
and who cheered me up during my PhD. This thesis is dedicated to you.
.…Shanthi Priya

v | P a g e
ABSTRACT
The global demand for energy, fuels and chemicals, along with the decline in fossil
fuel resources has significantly led to the rise of renewable energy sources. In this regard,
biomass represents one of the most promising, alternative resources for the sustainable
production of fuels and chemicals. Biodiesel derived from plant biomass is a renewable fuel
produced on a large scale over the past decade by the transesterification of oils. Glycerol is
considered to be a promising three carbon feedstock, obtained in large quantities as a by-
product during biodiesel production. Since glycerol can be obtained from renewable sources,
it clearly emerged as a versatile feedstock instead of petroleum based chemicals. This
generated a lot of interest in developing new valorisation technologies to produce high value
tonnage chemicals from glycerol by sustainable processes. One such attractive application is
the catalytic hydrogenolysis of glycerol to value-added chemicals such as propanediols and
propanols. Due to the broad applications of these compounds, glycerol hydrogenolysis has
been extensively studied in the past decade, both in liquid phase and in vapour phase, for
which various metal-based catalysts have been explored, including supported Rh, Ni, Ru, Pt
and Cu.
Present research work is mainly focussed on the selective production of 1,3-
propanediol and propanols through glycerol hydrogenolysis over platinum-based catalysts in
vapour phase at moderate reaction temperatures and atmospheric pressure. In this work,
various supported platinum catalysts have been synthesised by wet impregnation method. The
supports used in the study include zirconia, sulphated zirconia, gamma alumina, aluminium
phosphate, activated carbon, Y-zeolite, H-mordenite and SBA-15. In addition, metal acid
bifunctional catalysts such as Pt-HPAs/ZrO2 and Pt-WO3/SBA-15 have been synthesized via
sequential and co-impregnation methods. The prepared catalysts were well characterized by

vi | P a g e
various spectro-analytical techniques and the catalytic properties were evaluated for selective
hydrogenolysis of glycerol to 1,3-propanediol and propanols in vapour phase under
atmospheric pressure. A detailed study investigated the influence of metal loading, reaction
temperature, reduction temperature, glycerol concentration, hydrogen flow rate, feed flow
rate, catalyst amount and time on stream studies. In addition, structural aspects of spent
catalysts were also evaluated to study possible catalyst deactivation. The investigated
catalysts exhibited moderate to high activity towards glycerol hydrogenolysis with optimal
conversion and selectivity. Metal dispersion and acidity of the catalysts were found to be the
key parameters for the catalytic performance of various supported platinum catalysts in
glycerol hydrogenolysis as evidenced by the results obtained from various characterization
techniques.
It is proposed that glycerol hydrogenolysis proceeds via a two-step mechanism
involving the dehydration of glycerol to 3-hydroxy propionaldehyde over acidic sites and
further hydrogenation into 1,3-propanediol over metal sites. The sequential hydrogenolysis of
propanediols over strong acidic sites leads to the formation of lower alcohols such as 1-
propanol and 2-propanol. The present study was successful in providing a sustainable and
economically viable methodology to convert biomass-derived glycerol into value-added
chemicals, such as 1,3-propanediol and propanols. The supported platinum catalysts were
proven to be highly efficient catalysts for selective glycerol hydrogenolysis with excellent
conversions and selectivities towards the desired products.

vii | P a g e
List of contents
Acknowledgements……………………………………………………………… iii
Abstract………………………………………………………………………….. v
List of Figures…………………………………………………………………… xvi
List of Tables……………………………………………………………………. xix
List of Schemes………………………………………………………………….. xxi
List of Abbreviations……………………………………………………………. xxii
CHAPTER 1 1
General Introduction
1.1 Potential for Renewable energy sources…………………………………… 2
1.2 Biomass – ‘Sustainable Energy Source’…………………………………… 3
1.3 Biodiesel - Direct fuel production from biomass………………………….. 4
1.4 Glycerol as versatile feedstock……………………………………………. 6
1.5 Utilization of Glycerol to produce value added products…………………. 9
1.6 Hydrogenolysis of Glycerol……………………………………………….. 12
1.7 Propanediols: Significance………………………………………………… 13
1.8 Propanols: Significance…………………………………………………….. 15
1.9 Reaction pathways and mechanistic studies of glycerol hydrogenolysis….. 15
1.10 Hydrogenolysis of glycerol for the selective formation of propanediols…. . 18
1.11 Catalysts employed in glycerol hydrogenolysis…………………………… 20
1.12 Platinum catalysts………………………………………………………….. 24
1.13 Vapour phase reaction process……………………………………………... 26
1.14 Objectives of the thesis…………………………………………………….. 28
1.15 Thesis structure…………………………………………………………….. 30

viii | P a g e
References………………………………………………………………….. 33
CHAPTER 2 41
Supported Platinum Catalysts for Vapour-phase Hydrogenolysis of Glycerol: Effect of
supports towards 1,3-propanediol selectivity
2.1 Introduction …………………….……………………………………….. 43
2.2 Experimental section…………………………………………………….. 46
2.2.1 Preparation of catalysts………………………………………….. 46
2.2.1.1 Preparation of Zirconia………………………………… 46
2.2.1.2 Preparation of Sulphated zirconia……………………… 46
2.2.1.3 Preparation of Aluminium Phosphate…………………… 46
2.2.1.4 Preparation of Supported Platinum catalysts…………… 47
2.2.2 Catalyst characterization………………………………………… 47
2.2.3 Catalyst testing…………………………………………………… 50
2.3 Results and Discussion…………………………………………………… 51
2.3.1 Characterization of catalysts……………………………………… 51
2.3.1.1 X-ray diffraction (XRD)………………………………… 51
2.3.1.2 Fourier Transformed Infrared Spectroscopy (FTIR)…….. 53
2.3.1.3 Scanning Electron Microscopy (SEM)…………………… 54
2.3.1.4 BET Surface Area…………………………………………. 55
2.3.1.5 Temperature Programmed Desorption of ammonia (NH3-TPD).. 56
2.3.1.6 Pyridine adsorbed Fourier Transform Infrared Spectroscopy
(PyrFTIR)……………………………………………………………………... 58
2.3.1.7 CO chemisorption measurements…………………………….. 60
2.3.1.8 Transmission Electron Microscopy (TEM)………………….. 61
2.3.1.9 Temperature Programmed Reduction (TPR)………………… 63
2.3.2 Catalytic performance ………………………………………………… 64

ix | P a g e
2.3.2.1 Effect of hydrogen flow rate on glycerol hydrogenolysis……. 67
2.3.2.2 Effect of reaction temperature on glycerol hydrogenolysis…… 69
2.3.2.3 Time on stream studies………………………………………. 71
2.4 Conclusions…………………………………………………………………. 73
References…………………………………………………………………… .. 74
CHAPTER 3 78
Aluminium phosphate supported Platinum catalysts for selective hydrogenolysis of
glycerol to 1,3-propanediol
3.1 Introduction ……………..…………………………………………………... 80
3.2 Experimental section………………………………………………………… 82
3.2.1 Catalyst preparation…………………………………………………. 82
3.2.1.1 Synthesis of AlPO4 support………………………………… 82
3.2.1.2 Synthesis of Pt/AlPO4 catalyst……………………………... 82
3.2.2 Catalyst characterization…………………………………………….. 82
3.2.3 Catalyst testing ……………………………………………………….. 84
3.3 Results and Discussion………………………………………………………. 85
3.3.1 Characterisation techniques………………………………………... 85
3.3.1.1 X-ray diffraction (XRD)…………………………………….. 85
3.3.1.2 BET surface area…………………………………………….. 86
3.3.1.3 Fourier Transformed Infrared Spectroscopy (FTIR)………… 87
3.3.1.4 Scanning Electron Microscopy (SEM)………………………. 87
3.3.1.5 CO chemisorption measurments…………………………….. 88
3.3.1.6 Transmission Electron Microscopy (TEM)………………….. 89
3.3.1.7 Temperature programmed desorption of ammonia (NH3-TPD).. 91
3.3.1.8 Pyridine adsorbed Fourier Transform Infrared Spectroscopy
(Pyr-FTIR)……………………………………………………. 92

x | P a g e
3.3.2 Catalytic activity studies……………………………………………….. 94
3.3.2.1 Effect of Platinum loading on glycerol hydrogenolysis……... 94
3.3.2.2 Effect of reaction temperature……………………………….. 96
3.3.2.3 Effect of glycerol concentration……………………………… 98
3.3.2.4 Effect of H2 flow rate…………………………………………. 99
3.3.2.5 Effect of time on stream……………………………………… 100
3.3.3 Structural aspects of spent catalysts……………………………………. 101
3.4 Conclusions…………………………………………………………………….. 103
References……………………………………………………………………… 104
CHAPTER 4 107
A Platinum-Tungsten catalyst supported on SBA-15 for high efficiency conversion of
glycerol to 1, 3-propanediol
4.1 Introduction …………………….……………………………………………… 109
4.2 Experimental section…………………………………………………………… 112
4.2.1 Catalyst preparation……………………………………………………. 112
4.2.1.1 Synthesis of SBA-15support………………………………….. 112
4.2.1.2 Synthesis of Pt-WO3/SBA-15 catalyst………………………... 113
4.2.2 Catalyst characterization……………………………………………….. 113
4.2.3 Catalyst testing………………………………………………………… 115
4.3 Results and Discussion………………………………………………………… 116
4.3.1 Characterisation techniques……………………………………………. 116
4.3.1.1 Low angle XRD………………………………………………. 116
4.3.1.2 Wide angle XRD……………………………………………… 117
4.3.1.3 Pyridine adsorbed FTIR……………………………………… 118
4.3.1.4 CO chemisorption measurments……………………………… 119
4.3.1.5 BET Surface Area and Pore Size Distribution Studies……….. 120

xi | P a g e
4.3.1.6 Temperature programmed desorption of ammonia (NH3-TPD).. 122
4.3.1.7 Temperature Programmed Reduction (TPR)…………………. 124
4.3.1.8 Transmission Electron Microscopy (TEM)…………………... 125
4.3.2 Catalyst Evaluation…………………………………………………….. 127
4.3.2.1 Effect of impregnation method………………………………. 128
4.3.2.2 Influence of WO3 loading……………………………………. 129
4.3.2.3 Influence of Pt loading………………………………………. 130
4.3.2.4 Influence of reaction temperature…………………………… 131
4.3.2.5 Influence of H2 flow rate…………………………………….. 133
4.3.2.6 Influence of glycerol concentration…………………………. 134
4.3.2.7 Influence of contact time (W/F)……………………………… 135
4.3.2.8 Influence of weight hourly space velocity (WHSV)………… 136
4.3.2.9 Influence of reaction time …………………………………… 137
4.3.3 Structural aspects of spent catalysts……………………………………. 138
4.3.4 Reaction mechanism of glycerol hydrogenolysis over
Pt-WO3/SBA-15 catalyst.…………………………………………….. 140
4.4 Conclusions……………………………………………………………………. 141
References……………………………………………………………………... 143
CHAPTER 5 147
A highly efficient H-mordenite supported Platinum catalyst for selective hydrogenolysis
of glycerol to 1,3-propanediol
5.1 Introduction …………………….……………………………………………... 149
5.2 Experimental section…………………………………………………………… 152
5.2.1 Preparation of catalysts………………………………………………… 152
5.2.2 Characterization of catalysts…………………………………………… 152
5.2.3 Reaction procedure…………………………………………………….. 154
xii | P a g e
5.3 Results and Discussion………………………………………………………… 154
5.3.1 Characterisation techniques…………………………………………… 154
5.3.1.1 Structural characterizations of the catalysts (XRD)………….. 154
5.3.1.2 Temperature programmed desorption of ammonia (NH3-TPD).. 156
5.3.1.3 FTIR of adsorbed Pyridine……………………………………. 157
5.3.1.4 Physicochemical properties of catalysts………………………. 159
5.3.1.5 CO chemisorption measurments………………………………. 159
5.3.1.6 TEM analysis………………………………………………… 160
5.3.1.7 Surface chemical states analysis by XPS…………………….. 161
5.3.2 Reaction Results-Evaluation of catalytic activity…………………….. 163
5.3.2.1 Effect of Pt loading…………………………………………. 163
5.3.2.2 Effect of reaction temperature……………………………… 164
5.3.2.3 Effect of H2 flow rate……………………………………….. 165
5.3.2.4 Effect of contact time (W/F)………………………………… 167
5.3.2.5 Effect of weight hourly space velocity (WHSV)……………. 168
5.3.2.6 Catalyst stability…………………………………………….. 169
5.3.3 Regeneration of catalyst………………………………………………. 170
5.3.4 Mechanism of glycerol hydrogenolysis to 1,3-PDO over Pt/HM catalyst… 171
5.4 Conclusions……………………………………………………………………. 173
References……………………………………………………………………… 175
CHAPTER 6 178
Catalytic performance of Pt-HPA/ZrO2 catalysts for Selective Hydrogenolysis of
Glycerol to Propanols under atmospheric pressure
6.1 Introduction …………………….…………………………………………….. 180
6.2 Experimental section…………………………………………………………. 183
6.2.1 Catalyst preparation………………………………………………….. 183

xiii | P a g e
6.2.1.1 Preparation of ZrO2 support…………………………………. 183
6.2.1.2 Preparation of HPA/ZrO2 catalyts…………………………… 183
6.2.1.3 Preparation of Pt-HPA/ZrO2 catalyts………………………… 184
6.2.2 Catalyst characterization ……………………………………………... 184
6.2.3 Catalyst testing………………………………………………………… 185
6.3 Results and Discussion………………………………………………………... 186
6.3.1 Characterisation techniques…………………………………………… 186
6.3.1.1 X-ray diffraction (XRD)……………………………………. 186
6.3.1.2 Fourier transform infrared spectroscopy (FTIR)…………….. 187
6.3.1.3 Raman spectroscopy………………………………………… 188
6.3.1.4 Temperature programmed desorption of ammonia studies….. 189
6.3.1.5 BET surface area……………………………………………. 191
6.3.1.6 CO chemisorption measurements…………………………… 192
6.3.2 Catalytic performance of catalysts……………………………………. 192
6.3.2.1 Effect of heteropolyacids (HPA)……………………………. 192
6.3.2.2 Effect of reaction temperature………………………………. 195
6.3.2.3 Effect of PTA loading……………………………………….. 197
6.3.2.4 Effect of catalyst reduction temperature…………………….. 198
6.3.2.5 Effect of glycerol concentration…………………………….. 199
6.3.2.6 Effect of H2 flow rate……………………………………….. 200
6.3.2.7 Effect of partial pressure of glycerol………………………... 201
6.3.2.8 Effect of contact time (W/F)………………………………… 202
6.3.2.9 Time on stream studies……………………………………… 203
6.3.3 Studies on the spent catalyst………………………………………….. 204
6.4 Conclusions…………………………………………………………………… 205
References……………………………………………………………………. 207

xiv | P a g e
CHAPTER 7 211
Summary
7.1 Overall Conclusions……………………………………………………………… 212
7.2 Scope for future study……………………………………………………………. 216
List of Publications…………………………………………………………………… 217
List of Conferences & Workshops………………………………………………….... 218

xv | P a g e
List of Figures
Figure 1.1 The rise of renewable energy 4
Figure 1.2 Biomass to value added chemicals through glycerol valorisation 6
Figure 1.3 Flow diagram representing the hydrogenolysis of glycerol reaction
setup
27
Figure 2.1 XRD patterns of various supported platinum catalysts 52
Figure 2.2 FTIR spectra of various supported platinum catalysts 54
Figure 2.3 SEM images of various supported platinum catalysts 55
Figure 2.4 NH3-TPD profiles of various supported platinum catalysts 58
Figure 2.5 Ex-situ pyridine adsorbed FTIR of various supported platinum
catalysts
59
Figure 2.6 TEM images of various supported platinum catalysts 61
Figure 2.7 TPR profiles of various supported platinum catalysts 64
Figure 2.8 Effect of various supported platinum catalysts on glycerol
hydrogenolysis
65
Figure 2.9 Effect of H2 Flow rate on hydrogenolysis of glycerol over various
supported platinum catalysts
68
Figure 2.10 Effect of Temperature on hydrogenolysis of glycerol over various
supported platinum catalysts
70
Figure 2.11 Time on stream studies of 2Pt/AlPO4 catalyst on glycerol
hydrogenolysis
72
Figure 3.1 XRD patterns of pure AlPO4 and various Pt/AlPO4 catalysts 86
Figure 3.2 FTIR spectra of pure AlPO4 and various Pt/AlPO4 catalysts 87
Figure 3.3 SEM images of (a) Pure AlPO4 (b) 0.5 Pt/AlPO4 (c) 1 Pt/AlPO4 (d) 2
Pt/AlPO4 (e) 3 Pt/AlPO4 catalysts
88
Figure 3.4 TEM images of pure AlPO4 and various Pt/AlPO4 catalysts 90
Figure 3.5 TPD of ammonia profiles of pure AlPO4 and various Pt/AlPO4
catalysts
92
Figure 3.6 Ex-situ pyridine adsorbed FTIR of pure AlPO4 and various Pt/AlPO4
catalysts
93
Figure 3.7 Effect of metal loading of various Pt/AlPO4 catalysts on conversion 95

xvi | P a g e
of glycerol hydrogenolysis reaction
Figure 3.8 Effect of Temperature on hydrogenolysis of glycerol to propanediols 97
Figure 3.9 Effect of Glycerol concentration on hydrogenolysis of glycerol to
propanediols
99
Figure 3.10 Effect of H2 Flow rate on hydrogenolysis of glycerol to propanediols 100
Figure 3.11 TOS on hydrogenolysis of glycerol to propanediols 101
Figure 3.12 (a) XRD pattern and (b) SEM images of spent 2 wt% Pt/AlPO4
catalysts
102
Figure 4.1 (A) Low angle XRD patterns of pure SBA-15 and Pt-WO3/SBA-15
catalysts
117
Figure 4.1 (B) Wide angle XRD patterns of pure SBA-15 and Pt-WO3/SBA-15
catalysts
118
Figure 4.2 Pyridine adsorbed FTIR patterns of pure SBA-15, WO3/SBA-15 and
Pt-WO3/SBA-15 catalysts
119
Figure 4.3 (A) Nitrogen adsorption-desorption isotherms and (B) BJH pore size
distribution of pure SBA-15 and various Pt-WO3/SBA-15 catalysts
122
Figure 4.4 NH3-TPD profiles of pure SBA-15, Pt-SBA-15 and various 2Pt-
YWO3/SBA-15 catalysts
123
Figure 4.5 H2-TPR profiles of various Pt-WO3/SBA-15 catalysts 124
Figure 4.6 TEM images of various Pt-WO3/SBA-15 catalysts 126
Figure 4.7 Effect of Reaction temperature on hydrogenolysis of glycerol to 1,3-
PDO
132
Figure 4.8 Effect of H2 Flow rate on hydrogenolysis of glycerol to 1,3-PDO 133
Figure 4.9 Effect of Glycerol concentration on hydrogenolysis of glycerol to
1,3-PDO
134
Figure 4.10 Effect of Contact time on hydrogenolysis of glycerol to 1,3-PDO 135
Figure 4.11 Effect of WHSV on hydrogenolysis of glycerol to propanediols 136
Figure 4.12 TOS on hydrogenolysis of glycerol to 1,3-PDO 137
Figure 4.13 A. Wide angle XRD pattern of spent 2Pt-WO3/SBA-15; B. TEM
image of spent 2Pt-WO3/SBA-15 catalyst
139
Figure 5.1 XRD patterns of various Pt/HM catalysts 155
Figure 5.2 TPD of ammonia profiles of various Pt/HM catalysts 156

xvii | P a g e
Figure 5.3 Pyr FTIR spectra of various Pt/HM catalysts 159
Figure 5.4 TEM images of various Pt/HM catalysts 161
Figure 5.5 XPS of HM and various Pt/HM catalysts 162
Figure 5.6 Effect of Reaction temperature on hydrogenolysis of glycerol to 1,3-
PDO
165
Figure 5.7 Effect of hydrogen flow rate on hydrogenolysis of glycerol to 1,3-
PDO
166
Figure 5.8 Effect of contact time (W/F) on hydrogenolysis of glycerol to 1,3-
PDO
167
Figure 5.9 Effect of WHSV on hydrogenolysis of glycerol to 1,3-PDO 168
Figure 5.10 Time on stream studies of hydrogenolysis of glycerol to 1,3-PDO
over 2Pt/HM catalyst
169
Figure 5.11 XRD and NH3-TPD patterns of spent 2Pt/HM catalyst 170
Figure 6.1 XRD patterns of Pure ZrO2, Pt/ZrO2 and various Pt-HPA/ZrO2
catalysts
187
Figure 6.2 FTIR spectra of Pt/ZrO2 and various Pt-HPA/ZrO2 catalysts 188
Figure 6.3 Raman spectra of Pt/ZrO2 and various Pt-HPA/ZrO2 catalysts 189
Figure 6.4 NH3-TPD profiles of Pt/ZrO2 and various Pt-HPA/ZrO2 catalysts 191
Figure 6.5 Effect of PTA loading on glycerol hydrogenolysis reaction to
propanols
197
Figure 6.6 Effect of Reduction temperature on hydrogenolysis of glycerol to
propanols
198
Figure 6.7 Effect of Glycerol concentration on hydrogenolysis of glycerol to
propanols
199
Figure 6.8 Effect of H2 flow rate on hydrogenolysis of glycerol to propanols 200
Figure 6.9 Effect of partial pressure of glycerol on hydrogenolysis of glycerol to
propanols
201
Figure 6.10 Effect of contact time (W/F) on glycerol hydrogenolysis 202
Figure 6.11 TOS on hydrogenolysis of glycerol to propanols over Pt-PTA/ZrO2
catalyst
203
Figure 6.12 XRD, NH3-TPD and SEM images of spent Pt-PTA/ZrO2 catalyst 204

xviii | P a g e
List of Tables
Table 1.1 Physical properties and applications of glycerol 7
Table 1.2 Some examples of catalytic systems employed in glycerol
hydrogenolysis
22
Table 2.1 Results of Temperature-Programmed Desorption and BET surface area
of various supported platinum catalysts
56
Table 2.2 Results of CO uptake, dispersion, metal area and average crystallite size
of various supported platinum catalysts
60
Table 2.3 Results of Temperature Programmed Reduction of various supported
platinum catalysts
64
Table 3.1 Results of Temperature-Programmed Desorption and BET surface area
of various Pt/AlPO4 Catalysts
86
Table 3.2 Results of CO uptake, dispersion, metal area and average particle size of
various Pt/AlPO4 catalysts
89
Table 3.3 Effect of metal loading of various Pt/AlPO4 catalysts on conversion or
selectivity of glycerol hydrogenolysis
94
Table 3.4 Effect of Temperature on conversion or selectivity of glycerol
hydrogenolysis
98
Table 3.5 Studies of the spent catalyst 2 wt% Pt/AlPO4 103
Table 4.1 Platinum-tungsten catalysts for glycerol hydrogenolysis to 1,3-PDO 110
Table 4.2 Results of CO uptake, dispersion, metal area and average particle size of
Pt-WO3/SBA-15 catalysts
120
Table 4.3 Physicochemical properties and acidities of various catalysts 121
Table 4.4 Results of temperature programmed reduction of various Pt-WO3/SBA-
15 catalysts
125
Table 4.5 Effect of WO3 loading on glycerol hydrogenolysis to 1,3-PDO 130
Table 4.6 Effect of Pt loading on glycerol hydrogenolysis to 1,3-PDO 131
Table 4.7 Studies of the spent catalyst 2Pt-10WO3/SBA-15 138
Table 5.1 Physicochemical properties and acidities of pure HM and Pt/HM
catalysts
157
Table 5.2 Brønsted and Lewis acidities of Pt/HM catalysts measured by FTIR with 158

xix | P a g e
adsorption of pyridine
Table 5.3 Results of CO uptake, dispersion, metal area and average particle size of
Pt/HM catalysts
160
Table 5.4 Effect of Pt loading on glycerol hydrogenolysis to 1,3-PDO 164
Table 5.5 Studies of the spent catalyst 2Pt/HM 171
Table 6.1 Results of NH3-TPD and BET surface area of Pt/ZrO2 and Pt-HPA/ZrO2
catalysts
190
Table 6.2 Results from CO chemisorption studies of Pt/ZrO2 and Pt-HPA/ZrO2
catalysts
192
Table 6.3 Catalytic performance of Pt/ZrO2 and Pt-HPA/ZrO2 catalysts for the
production of propanols from glycerol
194
Table 6.4 Performance of glycerol hydrogenolysis over Pt-HPA/ZrO2 catalysts 195
Table 6.5 Effect of Reaction temperature on glycerol hydrogenolysis over Pt-
PTA/ZrO2 catalyst under atmospheric pressure
196
Table 6.6 Studies of the spent catalyst Pt-PTA/ZrO2 204

xx | P a g e
List of Schemes
Scheme 1.1 Biodiesel production through transesterification of triglyceride 5
Scheme 1.2 Glycerol production by saponification and biodiesel processes 7
Scheme 1.3 Different chemical transformations of glycerol to value-added
chemicals
10
Scheme 1.4 Pathways of hydrogenolysis 12
Scheme 1.5 Products from glycerol hydrogenolysis 13
Scheme 1.6 Dehydration-hydrogenation (two-step) mechanism of glycerol
hydrogenolysis
16
Scheme 1.7 Dehydrogenation-dehydration-hydrogenation (three-step) mechanism
of glycerol hydrogenolysis
17
Scheme 1.8 Direct hydrogenolysis mechanism of glycerol hydrogenolysis 17
Scheme 1.9 Selective production of propanediols from glycerol 18
Scheme 1.10 Selective production of propanediols directed by the nature of acidic
sites
20
Scheme 2.1 Reaction scheme for production of 1,3-propanediol from glycerol
hydrogenolysis
67
Scheme 3.1 Glycerol hydrogenolysis to 1,3-PDO over Pt/AlPO4 catalysts 96
Scheme 4.1 Hydrogenolysis of glycerol to various products 127
Scheme 4.2 Selective hydrogenolysis of glycerol to 1,3-PDO over Pt-WO3/SBA-15 140
Scheme 5.1 Reaction Pathways of Glycerol hydrogenolysis 150
Scheme 5.2 Reaction mechanism of Glycerol hydrogenolysis to 1,3-PDO over
Pt/HM catalyst
172
Scheme 6.1 Hydrogenolysis of glycerol to various products 182
Scheme 6.2 Hydrogenolysis of glycerol to propanols over Pt-HPA/ZrO2 catalysts 183
Scheme 6.3 Glycerol hydrogenolysis to propanols 193

xxi | P a g e
List of Abbreviations
1,3-PDO : 1,3-propanediol
1,2-PDO : 1,2-propanediol
1-PrOH : 1-propanol
2-PrOH : 2-propanol
3-HPA : 3-hydroxypropionaldehyde
HA : Hydroxyacetone
EG : Ethylene glycol
XRD : X-ray Diffraction
SEM : Scanning Electron Microscopy
FTIR : Fourier Transform Infrared Spectroscopy
TEM : Transmission electron Microscopy
NH3 : Ammonia
TPD : Temperature Programmed Desorption
TPR : Temperature Programmed Reduction
XPS : X-ray Photoelectron Spectroscopy
BET SA : Brunauer–Emmett–Teller Surface area
JCPDS : Joint Committee on Powder Diffraction Standards
Pt : Platinum
AlPO4 : Aluminium phosphate
ZrO2 : Zirconia
ZrOCl2 : Zirconium oxychloride
S-ZrO2 : Sulphated zirconia
Al2O3 : Alumina
AC : Activated carbon
YZ : Y-zeolite
HPAs : Heteropolyacids
STA : Silicotungstic acid
PTA : Phosphotungstic acid
PMA : Phosphomolybdic acid
SMA : Silicomolybdic acid
WO3 : Tungsten trioxide

xxii | P a g e
SBA-15 : Santa Barbara Amorphous-15
HM : H-Mordenite
WHSV : Weight hourly space velocity
TOS : Time on stream
US : United States
NaOH : Sodium hydroxide
NaOMe : Sodium methoxide
FAME : Fatty acid methyl esters
Pa. s : Pascal second
g : gram
mol-1 : inverse of mole
cm : centimetre
mm : millimetre
Hg : Mercury
HIV : Human Immunodeficiency Virus
CO : Carbon monoxide
H2 : Hydrogen
CH4 : Methane
C2H4 : Ethane
[M] : Metal
Ir : Iridium
ReOx : Rhenium oxide
SiO2 : Silica
C : Carbon
Cu : Copper
Ni : Nickel
Co : Cobalt
Pd : Palladium
Re : Rhenium
Ru : Ruthenium
Au : Gold
Rh : Rhodium

xxiii | P a g e
OH : Hydroxy
Ce : Cerium
Zn : Zinc
TiO2 : Titania
Pd : Palladium
Re : Rhenium
Ru : Ruthenium
Au : Gold
Rh : Rhodium
ZnO : Zinc oxide
CoO : Cobalt oxide
Fe2O3 : Ferric oxide
MCM-41 : Mobil Composition of Matter No. 41
Mo : Molybdenum
W : Tungsten
Cr : Chromium
Mn : Manganaese
K : Potassium
Cs : Cesium
Li : Lithium
Rb : Rubidium
W : Tungsten
Cr : Chromium
H4SiW12O40 : Silicotungstic acid
AlOOH : Boehmite
Hβ : Beta zeolite
HZSM-5 : Zeolite Socony Mobil-5
HY : Zeolite Y
13X : Zeolite X (13X)
MgO : Magnesium oxide
HT : Hydrotalcite
ZrO(NO3)2 : Zirconyl nitrate

xxiv | P a g e
Zr(OCH2CH2CH3)4 : Zirconium propoxide
(NH4)2HPO4 : Diammonium hydrogen phosphate
M : Molar
mL : millilitre
Al(NO)3 : Aluminium nitrate
H2PtCl6 : Chloro Platinic acid
He : Helium
KBr : Potassium bromide
TCD : Thermal Conductivity Detector
mg : milligram
min-1 : inverse of minute
N2 : Nitrogen
kV : kilo Volt
GC : Gas Chromatograph
FID : Flame Ionization Detector
θ : Theta
nm : nanometer
MPa : MegaPascal
Pt (NH3)4Cl2 : Tetrammine Platinum chloride
STP : Standard Temperature Pressure
Tmax : Temperature maximum
CTMABr : Cetyl trimethyl ammonium bromide
TEOS : Tetraethyl ortho silicate
(NH4)6 H2W12O40 : Ammonium meta tungstate
µ : micro
eV : electron volt
h : hour

Chapter 1
1 | P a g e
CHAPTER 1
General Introduction

Chapter 1
2 | P a g e
1.1 Potential for Renewable Energy Sources
Identifying renewable energy resources as well as environmentally cleaner processes
for producing energy are the two major research focus areas of this century. Since 200 years,
an ever-increasing demand for energy has been obtained from non-renewable fossil fuels
such as coal, oil and natural gas. Fossil fuels are a mixture of hydrocarbons with different
ratios and chain lengths depending upon the type of fuel. In the present scenario, the world’s
energy demands for domestic, industrial and various transport means are mainly utilized from
fossil fuels [1, 2]. Nevertheless, burning fossil fuels to generate energy produces significant
amounts of greenhouse gases, which is the main contributing factor to global warming. This
creates an imbalance between carbon dioxide released into the environment and carbon
dioxide to be absorbed by plants because it takes hundreds of millions of years for the fossil
fuel source to be replenished. In addition, fossil fuel refineries and crude oil extraction
produce other kinds of organic by-products that are usually discharged in the air and water,
contributing towards environmental air and water pollution.
Despite the depletion of oil resources and fossil fuels, and their escalating prices, the
energy demands of the world continue to increase. Therefore, to address the impacts of global
warming, it is very important and necessary to shift the focus of energy resources from non-
renewable fossil fuels towards renewable and permanent sources such as solar, wind,
geothermal, hydroelectric and biomass. In fact, it is evident that non-renewable fossil fuels
will run out sooner and relying on them for energy generation is not a sustainable approach.
Hence, exploration of the potential renewable sources for future energy needs has attracted
significant attention by researchers. Consequently, there is an urgent need to develop
alternative processes to sustainably produce fuels and chemicals. In this regard, utilizing
“Biomass as feed stock” is considered as an outstanding sustainable renewable energy source
for fuels and chemicals, and an alternative to fossil fuel sources [3, 4].

Chapter 1
3 | P a g e
1.2 Biomass – ‘Sustainable Energy Source’
Biomass is the most common form of a renewable energy source emerging as a
potential alternative to fossil fuels, which is widely used as a building block for fuels, fuel
additives and fine chemicals until recently. Unlike fossil fuels, biomass is considered as
renewable source mainly because they can be regenerated in a short period of time. Biomass
is a term used to describe all biological material derived from plants and animals. It includes
all agricultural residues, water- and land-based vegetation and trees, waste biomass such as
municipal solid waste, sewage, manures, forestry and certain types of industrial wastes. Few
examples of biomass fuels are derived from wood, crops, garbage, landfill gas, and alcohol
fuels [5, 6]. Biomass resources can be converted to fuels and chemicals via a number of
processes, like thermal, chemical, biological and electrochemical conversion processes [7].
Biomass is a major source of chemical energy like fossil fuels, which is originally
derived from the solar energy stored by the plants and animals during their life cycle. During
the process of photosynthesis, plants convert solar energy into chemical energy in the form of
sugars composed of carbon, hydrogen and oxygen. Biomass can be chemically converted to
other usable forms of energy like methane gas or transportation fuels like ethanol and
biodiesel. While the transportation fuel, ‘ethanol’ is produced by the fermentation of crops
like corn and sugar cane, ‘Biodiesel’ can be produced from unused food products like
vegetable oils and animal fats. Similar to fossil fuels, burning of biomass also releases carbon
dioxide into the atmosphere, however an equivalent amount of carbon dioxide is quickly
recaptured by the plants as the biomass crops can be regrown and replenished in a relatively
short period of time. When considering a closed biomass carbon cycle, it has been shown
that there is virtually zero net carbon emission, making organic biomass one of the only
naturally occurring clean and efficient renewable energy sources and a better substitute for

Chapter 1
4 | P a g e
fossil fuels (Figure 1.1) [8, 9]. The major non-hydroelectric renewable resource of electricity
in US during the period 2000 to 2020 is anticipated to be derived from biomass energy [10].
Figure 1.1: The rise of renewable energy (source:http://www.wfpa.org/forest-
products/biomass/)
1.3 Biodiesel - Direct fuel production from biomass
Biodiesel is a renewable, potentially viable environmental friendly diesel fuel which
can be directly replaced with conventional petroleum diesel. It is biodegradable and non-toxic
with various advantages. Biodiesel has a more favourable combustion emission profile,
resulting in substantial reductions in greenhouse gas emissions. With its improved lubricating
properties that can lengthen engine life, material compatibility and relatively high flash point
(150 oC), biodiesel is considered to be a safer transportation fuel and an overall good
alternative to petroleum based fuel. Biodiesel can be used directly in diesel engines in its
original form, or can be blended with petroleum in varied proportions. Biodiesel is typically
produced from vegetable oils such as canola oil/soyabean oil, animal fats or recycled greases
such as used cooking oil through a chemical process called transesterificaton. All these
oils/fats fall under the category of triglycerides and base catalysed transesterification with

Chapter 1
5 | P a g e
alcohol converts the triglycerides into methyl esters (biodiesel) and glycerol (valuable by-
product). Triglyceride (triacylglycerol) is the main component of vegetable/animal oil, made
up of three long chain fatty acids esterified to a glycerol backbone. When the triglyceride
reacts with an alcohol (e.g., methanol), over a base catalyst (such as NaOH or NaOMe), the
three fatty acid chains from triglyceride combine with the methanol to yield fatty acid methyl
esters (FAME) referred to as Biodiesel (Scheme 1.1). A three carbon molecule from
triglyceride is released as glycerol, a major by-product of the transesterification process [11].
Scheme 1.1: Biodiesel production through transesterification of triglyceride
The production of biodiesel has steadily grown over the past decade, rising from less
than one million tons in 2000 to 10 million tons in 2010. The global biodiesel markets are
estimated to reach double digit growth in the United States and Asia, particularly in India and
China, where the government target is 15% replacement of petroleum by 2020 and the
projected production would be nearly 12 billion gallons [12]. For every 1 tonne of biodiesel
synthesised, 100 kg of glycerol is cogenerated, approximately 10 wt% of total product. The
quantity of glycerol formed during biodiesel production is considerably greater than that
produced from soap manufacturing process. Formerly, there was a valued market for the
glycerol, which aided the economics of the process as a whole. Due to the rapid growth in
biodiesel production, a large surplus of glycerol has been created and subsequently the
market value of glycerol has been dropped abruptly [13]. Moreover, the disposal process of

Chapter 1
6 | P a g e
excess glycerol is quite expensive and is considered to be one of the key problems confronted
by biodiesel companies. The foremost apprehension regarding biodiesel production is how to
separate biodiesel from glycerol and valorise this by-product? Therefore, it is imperative to
develop ways of making value added chemicals from glycerol for sustainable development
and economic viability that would contribute to the cost affordability of biodiesel processes.
In this regard, research worldwide is being directed to utilize excess glycerol derived from
biodiesel processes as a chemical building block, substituting non-renewable fossil fuels as
the energy source (Figure 1.2) [14].
Figure 1.2: Biomass to value added chemicals through glycerol valorisation
1.4 Glycerol as versatile feedstock
Glycerol or glycerine also known as propane-1, 2, 3-triol is a simple trihydroxy sugar
alcohol primarily used as a sweetening agent, solvent, pharmaceutical agent and emollient.
The name glycerol has been derived from the Greek word ‘glykys’ which means sweet. It is a
colorless, odourless, viscous liquid miscible in water. Glycerol is non-toxic and hygroscopic
in nature. Purified glycerin is known to be a high value commercial chemical predominantly
used in the production of various foods, beverages, pharmaceuticals, cosmetics and other
personal care products [15]. The physical properties and applications of glycerol are listed in
Table 1.1. Glycerol can be produced through saponification process (traditional soap
manufacture) and obtained as a main by-product in biodiesel process (fattyacid ester

Chapter 1
7 | P a g e
production) (Scheme 1.2). Biological fermentation and hydrogenolysis of glucose or other
saccharides is a different expedient method for the production of glycerol. Synthetic glycerol
is prepared from propylene; however with the escalating crude oil prices, this synthetic route
is at present economically unattractive [16].
Scheme 1.2: Glycerol production by saponification and biodiesel processes
Table 1.1: Physical properties and applications of glycerol [15]
Structure
Applications of glycerol
Chemical formula C3H8O3 Humectant, Thickening agent,
Sweetener, Solvent, Antioxidant,
Filler, Pharmaceutical, personal
care, Cosmetics, Preserving
agent, Cryoprotective agent,
Antifreeze, Enzymatic reagents,
Automotive applications, Soap
making (glycerin), Catalysts,
Waste water treatment.
Molar mass 92.09 g·mol−1
Density 1.261 g/cm3
Boiling point 290 °C
Melting point 17.8 °C
Viscosity 1.412 Pa·s
Vapour pressure 0.003 mmHg

Chapter 1
8 | P a g e
The overall projection in glycerol production is estimated to be more than 35,000 tons
per year in the United States, and production has increased three times in Europe during the
past 10 years [17]. It is projected that by the year 2020, production of glycerol will increase
six times more than demand. Biomass derived glycerol obtained via hydrolysis or
methanolysis of triglycerides to trimethyl esters (biodiesel) has been known for over a
century. The crude glycerol from the biodiesel process is of variable quality with an
estimated 50% purity and has a low selling price. As such, crude glycerol usually comprises a
mixture of methanol, unreacted mono-, di- and triglycerides, fatty acids, water, inorganic
salts, methyl esters, and a range of organic constituents. The crude glycerol from the
hydrolysis of triglycerides can be purified by removal of organic impurities through treatment
with activated carbon, unreacted glycerol esters by alkali treatment, and removal of salts by
ion exchange.
The highly refined glycerol can be further purified up to > 99.5% by means of multi-
step vacuum distillation process. Nevertheless, the purification processes are quite expensive
and consequently, a good portion of glycerol is being disposed as a waste by small biodiesel
plants. However, disposal remains furthermore problematic as per the methanol content of
glycerol is considered as harmful waste. At present, removal of excess glycerol involves
producing energy by burning. Also, it is noteworthy that there exists no equilibrium between
the production processes and subsequent utilization of glycerol, as a result, the price of
glycerol has become volatile [18]. Hence, by converting the glycerol into value added
chemicals rather than simply burning the excess will be of great significance in terms of both
environmental protection and economic benefit which would add to the cost efficacy of
biodiesel processes as well. In addition, the development of novel refining methodologies for
high purity glycerol is essential, as it has been recognized as a main building block for future
refineries.

Chapter 1
9 | P a g e
1.5 Utilization of Glycerol to produce value added products
With glycerol available as a low cost, large-volume bio-feedstock, consumption of
surplus glycerol is a prerequisite for the commercial sustainability of biodiesel processes.
Driven by its non-toxic, edible, biodegradable properties as well as multifunctional structure,
glycerol holds the potential of being one of the top 12 platform chemicals from biomass [19].
In the recent past, glycerol has emerged as a highly fascinating molecule for the production of
biofuel additives and variety of chemical intermediates. In fact, chemical catalysis has
proven to be a critical approach to green chemical processes in order to provide new
applications for glycerol valorisation. In this context, significant research has been developed
in the past for the chemical transformation of glycerol into high value added specialty
chemicals [20]. In spite of exploiting highly potential catalytic processes and product lines
from glycerol, new strategies to develop/improve catalytic materials and processes for the
effective conversion of glycerol to valued chemicals still remains a challenge.
Glycerol with its unique properties and highly functionalized nature makes it an
attractive starting material for production of a wide range of commodity chemicals such as
dihyroxy acetone, glyceric acid, acrolein, propanediols, propanols, ethylene glycol,
hydrocarbons, syngas, hydrogen, glyceryl ethers, glyceryl esters, glycerol carbonate, 1,3-
dichloro propanol, polyglycerols as well as acetals and ketals of glycerol by means of several
different methods such as fermentation, hydrogenolysis, pyrolysis, oxidation, etherification,
dehydration, esterification, carboxylation, halogenation, polymerization and glycerol
acetalization [21-31] (Scheme 1.3).
Catalytic oxidation of glycerol in the presence of hydrogen peroxide, air or oxygen
that act as inexpensive environmentally friendly oxidizing agents leads to the formation of
various compounds such as oxalic acid, mesooxalic acid, glyceraldehyde, glyceric acid,

Chapter 1
10 | P a g e
tartronic acid, hydroxypyruvic acid and dihydroxyacetone. These products are used as
intermediates for the production of polymers and fine chemicals. They are also employed as
valuable chelating agents, tanning agents, anti HIV agents and in food industry.
The dehydration of glycerol gives rise to acrolein which is a useful raw material for
production of pharmaceutical compounds and acrylic acid. Acrolein is also employed in the
fibre treatment. It is an important chemical with significant application as herbicide to
regulate the aquatic plant growth.
Scheme 1.3: Different chemical transformations of glycerol to value-added chemicals
1,3-propanediol and 1,2-propanediol are the main products obtained from the
hydrogenolysis of glycerol. 1,2-propanediol is used in pharmaceuticals, paints, personal care,

Chapter 1
11 | P a g e
liquid detergents, antifreeze and cosmetics whereas 1,3-Propanediol is a speciality chemical
used in polyester fibres, films and coatings.
Pyrolysis and gasification of glycerol could yield liquid fuels and gaseous products
such as syngas (CO+H2), H2, C2H4, and CH4.
Selective etherification reactions with either alcohols or alkenes convert glycerol into
valuable diesel fuel additives. Polyglycerols resulted from glycerol etherification offer greater
flexibility and functionality which can be used as biodegradable surfactants, food additives,
cosmetics and lubricants.
Monoglycerides, diglycerides and polyglyceryl esters resulted from esterification and
transesterification of glycerol with carboxylic acids finds varied uses in pharmaceuticals,
cosmetics, food emulsifiers and as surfactants.
Carboxylation reaction of glycerol with organic carbonates or urea or phosgene
produces glycerol carbonate, an interesting molecule in the chemical production. It was
explored as an important component in coatings, paints, detergents, gas separation
membranes and a non-volatile solvent. Also used in the production of polycarbonates and
polyurethanes.
Acetalisation of glycerol with aldehydes and ketones is a promising approach to
synthesise five membered (1,3-dioxane) and six membered (1,3-dioxalane) isomeric cyclic
products that can be subsequently used as fine chemical intermediates. Acetals and ketals of
glycerol were found to be excellent components for the preparation of gasoline, diesel and
biodiesel fuels.
Through halogenation of glycerol, 1,3-dichloropropanol a key intermediate in the
production of epichlorohydrin could be obtained. Epichlorohydrin has been identified as an
important precursor in the synthesis of epoxide resins and elastomers. It is also used as sizing
agent in the paper manufacturing industries.

Chapter 1
12 | P a g e
On the other hand, glycerol has received great attention as a green solvent in synthetic
organic chemistry because of its unique physical and chemical properties. Its compatibility
with most organic/inorganic compounds, high boiling point, negligible vapour pressure, easy
dissolution and non-hazardous nature, simple handling and storage provides a new way to
revalorize glycerol and to be used as sustainable reaction media [32-35].
1.6 Hydrogenolysis of Glycerol
Hydrogenolysis reaction is a class of reduction which involves dissociation of
chemical bonds (C-C or C-O) in an organic compound and subsequent addition of hydrogen
to the resultant molecular fragments [36]. C-C Hydrogenolysis reactions have gained
commercial importance in petroleum refineries, in an effort to produce lower hydrocarbons.
On the other hand, C-O hydrogenolysis reduces the oxygen content, and is an important area
of research for understanding biomass conversion to fuels and chemicals (Scheme 1.4).
Scheme 1.4: Pathways of hydrogenolysis
Since glycerol is richer in oxygen content than other classes of chemicals, C–O
hydrogenolysis stands as the utmost favoured industrial relevant routes for the conversion of
glycerol among various chemical conversion processes of glycerol. Glycerol hydrogenolysis
in the presence of catalyst and hydrogen leads to the formation of propanediols, propanols,
ethylene glycol and some degradation products. The reaction routes and products from
glycerol hydrogenolysis are shown in Scheme 1.5.

Chapter 1
13 | P a g e
Glycerol hydrogenolysis is a composite reaction involving potential reaction
pathways and valuable products. Initially, C–O hydrogenolysis of glycerol yields
propanediols (1,2-propanediol and 1,3-propanediol). Subsequent C–O hydrogenolysis gives
rise to propanols (1-propanol and 2-propanol) and finally propane. Whereas C–C
hydrogenolysis of glycerol or the C-C hydrogenolysis of the products derived from C–O
hydrogenolysis gives degradation products such as ethylene glycol, ethanol, methanol, ethane
and methane. Among the various products obtained during glycerol hydrogenolysis, 1,2-
propanediol (1,2-PDO), 1,3-propanediol (1,3-PDO), ethylene glycol (EG), 1-propanol (1-
PrOH) and 2-propanol (2-PrOH) are industrially important [36]. Therefore, catalytic
hydrogenolysis of glycerol is an alternative route to increase the cost-effectiveness of
biodiesel industry. Furthermore the products of glycerol hydrogenolysis can certainly replace
the chemical compounds, which are usually produced from non-renewable sources.
Scheme 1.5: Products from glycerol hydrogenolysis
1.7 Propanediols: Significance
Propanediols are the most important value-added chemicals obtained from glycerol
hydrogenolysis. 1,2-propanediol (1,2-PDO) also called Propylene glycol is a medium value
commodity chemical used as a component in paints, liquid detergents, cosmetics, food,

Chapter 1
14 | P a g e
tobacco humectants, animal feed, personal care products, flavors and fragrances. It can be
used as a de-icing agent and an antifreeze coolant [37]. It shows real promise as raw material
for the synthesis of polyester resins used for films, in pharmaceutical production and in the
fibre manufacture. Industrially, 1,2-propanediol is produced from propylene derived
propylene oxide obtained from hydro peroxide process or the chlorohydrin process.
1,3-Propanediol (1,3-PDO) is another commodity chemical known for its versatile
application as an important monomer in the manufacturing of polymethylene terephthalate
(PTT) [38]. PTT, also called polypropylene terephthalate (PPT) is biodegradable polyester
which is profusely used in textile and carpet manufacturing. It is a valuable chemical
intermediate potentially used in the manufacture of cosmetics, personal care, cleaning,
lubricants, medicines, and in the synthesis of heterocyclic compounds. The other applications
include engine coolants, food and beverages, deicing fluids, water-based inks, heat transfer
fluids and unsaturated polyester resins [39]. The expanding use of 1,3-PDO is expected to
register the highest growth and in turn has created an increasing demand.
The global 1,3-PDO production is estimated to reach $621.2 million by 2021 growing
at an annual growth rate of 10.4%. Conventionally, 1,3-PDO is produced by fermentation of
glucose and chemically synthesized from petroleum derivatives, by the hydration of acrolein
(Degussa-Dupont route), or by the hydroformylation of ethylene oxide (Shell route) to afford
3-hydroxypropionaldehyde (3-HPA) [40]. The aldehyde is hydrogenated to give 1,3-PDO.
The latter two petroleum-based methods, however, have many disadvantages such as the
hazardous nature of acrolein, the use of high pressure, high temperature and low selectivity.
However, the major limitation of the fermentation route is the relatively high cost of glucose
feedstock. The economically attractive solution would be to develop a new, cost-competitive
process that utilizes renewable resources as feed stocks for green and sustainable chemical
technologies. Introduction of such processes not only represent milestones toward the goal of

Chapter 1
15 | P a g e
reducing fossil fuel dependency and greenhouse gas emissions, but also has the potential to
provide substantial energy savings.
1.8 Propanols: Significance
1-propanol (1-PrOH) and 2-propanol (2-PrOH) are also valuable chemicals obtained
from excessive hydrogenolysis of glycerol. The hydroformylation of ethylene followed by
hydrogenation gives 1-PrOH. It is primarily used as a solvent, as a chemical intermediate for
n-propyl acetate production and in printing ink. The hydration of propylene leads to the
formation of 2-PrOH which is mainly used as a solvent and finds applications in
pharmaceuticals, as a disinfectant and a de-icer [41]. The annual production of 1-PrOH and 2-
PrOH world-wide varies in the range of 0.2-2 million tons. Ethylene glycol (EG), the C-C
cleavage product of glycerol hydrogenolysis, is enormously synthesised by the hydration
process of ethylene oxide. It is mostly used as a precursor for synthesis of polyethylene
terephthalate and as an antifreeze agent.
1.9 Reaction pathways and mechanistic studies of glycerol hydrogenolysis
As glycerol (also called propane-1,2,3-triol) is a trihydroxy containing compound
with two terminal (primary) hydroxyl groups and middle (secondary) hydroxyl group, the
hydrogenolysis usually involves C-O or C-C chemical bond cleavage with added hydrogen.
Scheme 1.5 presents different reaction pathways of glycerol hydrogenolysis. 1,2-PDO is
produced by the hydrogenolysis of primary (1o) hydroxyl groups of glycerol, whereas the
hydrogenolysis of secondary (2o) hydroxyl group gives 1,3-PDO. Successive hydrogenolysis
of 1,2-PDO will produce monohydroxy 1-PrOH and 2-PrOH, and eventually propane. The
consecutive removal of the remaining OH from 1,3-PDO could yield 1-PrOH first and then
propane [42].
Typically, two types of reaction mechanisms consistent to glycerol hydrogenolysis
have been suggested and generally accepted, namely dehydration-hydrogenation and

Chapter 1
16 | P a g e
dehydrogenation–dehydration–hydrogenation routes. However, the reaction mechanisms of
glycerol hydrogenolysis clearly depend on the operating conditions of the reaction systems,
nature of catalytic materials like metal properties and acidity or basicity of the catalysts [40].
The dehydration-hydrogenation route is a two-step mechanism of glycerol
hydrogenolysis which involves initial acid catalysed dehydration of glycerol and subsequent
hydrogenation of intermediates in the presence of metallic sites to yield the final product
(Scheme 1.6). This route is considered as a favourable route under acidic conditions.
Dehydration of 1o hydroxyl groups of glycerol in the presence of acid generates
hydroxyacetone (acetol) followed by hydrogenation over metal to 1,2-PDO. Similarly, 1,3-
PDO is formed by the acid catalysed dehydration of the 2o hydroxyl group of glycerol to form
3-hydroxy propionaldehyde (3-HPA) and subsequent hydrogenation over metal. However
hydroxyacetone is thermodynamically more stable than 3-hydroxy propionaldehyde. Double
dehydration of glycerol will produce acrolein whereas double dehydration followed by
hydrogenation gives rise to the formation of 1-PrOH and 2-PrOH [36, 43].
Scheme 1.6: Dehydration-hydrogenation (two-step) mechanism of glycerol
hydrogenolysis
Chapter 1
17 | P a g e
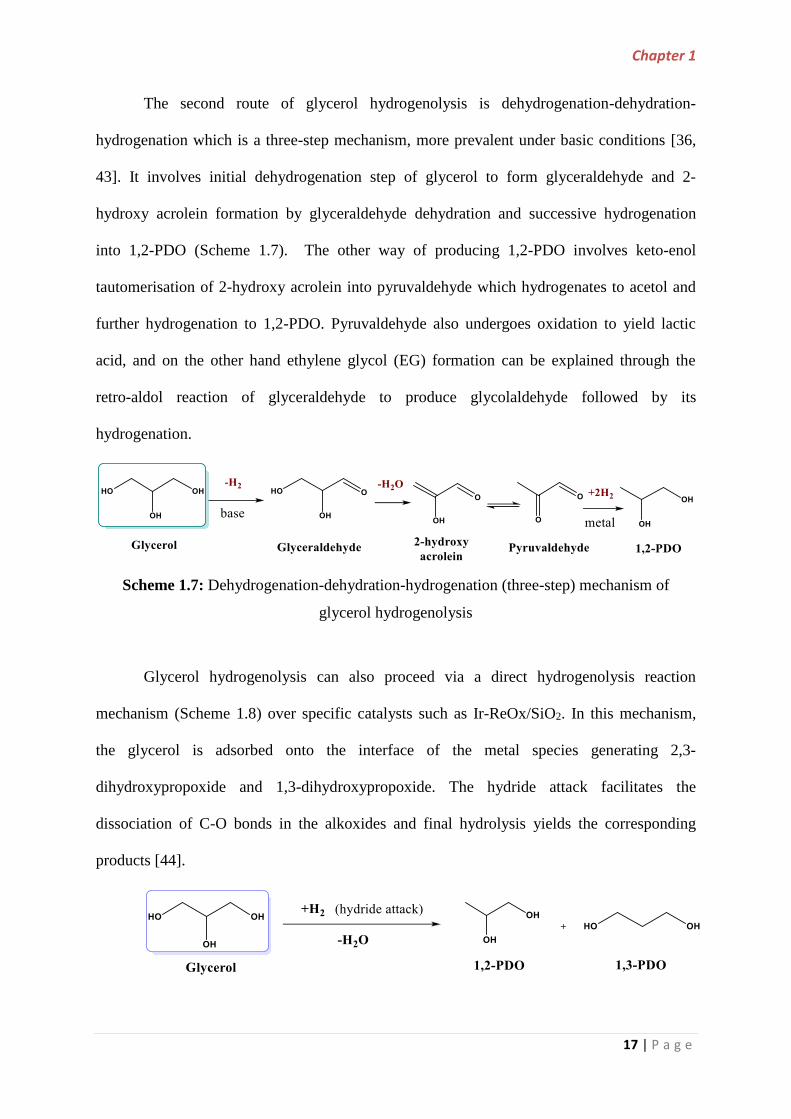
The second route of glycerol hydrogenolysis is dehydrogenation-dehydration-
hydrogenation which is a three-step mechanism, more prevalent under basic conditions [36,
43]. It involves initial dehydrogenation step of glycerol to form glyceraldehyde and 2-
hydroxy acrolein formation by glyceraldehyde dehydration and successive hydrogenation
into 1,2-PDO (Scheme 1.7). The other way of producing 1,2-PDO involves keto-enol
tautomerisation of 2-hydroxy acrolein into pyruvaldehyde which hydrogenates to acetol and
further hydrogenation to 1,2-PDO. Pyruvaldehyde also undergoes oxidation to yield lactic
acid, and on the other hand ethylene glycol (EG) formation can be explained through the
retro-aldol reaction of glyceraldehyde to produce glycolaldehyde followed by its
hydrogenation.
Scheme 1.7: Dehydrogenation-dehydration-hydrogenation (three-step) mechanism of
glycerol hydrogenolysis
Glycerol hydrogenolysis can also proceed via a direct hydrogenolysis reaction
mechanism (Scheme 1.8) over specific catalysts such as Ir-ReOx/SiO2. In this mechanism,
the glycerol is adsorbed onto the interface of the metal species generating 2,3-
dihydroxypropoxide and 1,3-dihydroxypropoxide. The hydride attack facilitates the
dissociation of C-O bonds in the alkoxides and final hydrolysis yields the corresponding
products [44].

Chapter 1
18 | P a g e
Scheme 1.8: Direct hydrogenolysis mechanism of glycerol hydrogenolysis
1.10 Hydrogenolysis of glycerol for the selective formation of propanediols
The selective cleavage of primary or secondary hydroxyl group from glycerol
depends on the properties of catalyst systems and the reaction conditions employed. Previous
reports show that 1,2-propanediol (1,2-PDO) and 1,3-propanediol (1,3-PDO) are produced
from glycerol hydrogenolysis by acid catalyzed dehydration of glycerol to form acetol and 3-
hydroxypropaldehyde (3-HPA) intermediates and successive hydrogenation on metal sites
[45]. Strong acid sites cause double dehydration of glycerol leading to the formation of
acrolein. Hence surface acidity or acid strength of the catalyst is an important parameter in
directing the product distribution. Accordingly, the choice of catalyst is mainly based upon
the incorporation of appropriate acid sites, active hydrogen species and metals sites, so as to
improve the selectivity towards propanediols formation. Indeed, the nature of acid sites also
plays a vital role in determining the selective formation of propanediols from glycerol.
Brønsted acid sites favour the abstraction of 2o hydroxyl group of glycerol to generate 1,3-
PDO via 3-HPA while Lewis acid sites assist in the dehydration of 1o hydroxyl group of
glycerol to form 1,2-PDO through the acetol intermediate (Scheme 1.9) [46].
Scheme 1.9: Selective production of propanediols from glycerol

Chapter 1
19 | P a g e
The reaction mechanism of selective glycerol conversion to propanediols governed by
the nature of acidic sites is quite interesting and important in designing the suitable catalyst
systems (Scheme 1.10). Brønsted acidic sites (proton donor) of the catalyst generates H+,
which is simplest electrophile that can be received by any nucleophilic centre (i.e., by any
negative charge or by lone pairs of electrons). The proton from a Brønsted acidic site
(Scheme 1.10A) can be transferred to primary or secondary -OH groups of glycerol as there
is no steric hindrance in case of proton (H+) to attack either primary or secondary -OH
groups of glycerol. However, protonation at a secondary –OH group of glycerol generates
secondary carbocation which is more stable than primary carbocation resulted from
protonation of primary –OH group. It should be noted that, 3-HPA is thermodynamically
unstable; however its formation is kinetically more favourable over the formation of acetol.
Hence reaction proceeds via secondary –OH group protonation followed by dehydration to
form highly unstable 3-HPA intermediate that quickly hydrogenates on metallic sites to
produce 1,3-PDO [47]. The immediate hydrogenation of 3-HPA is essential to stop further
dehydration of 3-HPA to yield acrolein as final product.
Catalysts possessing Lewis acid sites have empty orbitals to accommodate the lone
pair of electrons through coordinate covalent bond (CCB) from the primary and secondary-
OH groups of glycerol. This CCB seems to appear like a complex due to the direct interaction
of the metal empty orbital (from the catalyst surface) with –OH groups of glycerol. However,
the complex is preferentially formed with the less steric hindered primary –OH group of
glycerol than that of the secondary –OH group. Therefore, the interaction of Lewis acid site
with primary-OH groups, followed by dehydration results in a thermodynamically stable
hydroxyacetone intermediate which is further hydrogenated to produce 1,2-PDO (Scheme
1.10B). The mechanism of glycerol hydrogenolysis based on the nature of acidic sites is in
accordance with the reaction mechanism proposed in the previous literature. [48, 49].

Chapter 1
20 | P a g e
Scheme 1.10: Selective production of propanediols directed by the nature of acidic sites [49]
1.11 Catalysts employed in glycerol hydrogenolysis
The most prominent feature of glycerol hydrogenolysis is the ability of catalysts to
activate H2 molecules, as hydrogen is one of the reactants in the reaction. Catalysts based on
various transition and noble metals such as Cu, Ni, Co, Pd, Ru, Rh, Ir, Re, Ag, Au and Pt
have previously been tested in glycerol hydrogenolysis [50-56]. As glycerol hydrogenolysis
proceeds via a two stage mechanism, the ability to catalyse the hydrogenolysis of glycerol is
a prerequisite to exhibit dual catalytic functions, wherein the metal components of catalysts
are known to help in activating hydrogen and metal oxide supports (acidic/basic) facilitates
removal of an –OH group. In the recent years, several homogeneous and heterogeneous

Chapter 1
21 | P a g e
catalytic systems have been actively investigated for glycerol hydrogenolysis either in the
liquid phase or gas phase. Wide-ranging reaction parameters on temperature (around 180–350
oC) and hydrogen pressure (1–9 MPa) are typically applied.
In 1985, Celanese Corporation prepared a homogeneous rhodium complex
(Rh(CO)2(acac))+tungstic acid catalyst and tested in hydrogenolysis of aqueous glycerol
solution at 200 °C and 300 bar of syngas. The reaction resulted in 20 and 23% yield of 1,3-
PDO and 1,2-PDO respectively [57]. A homogeneous complex of palladium in a mixture of
water–sulfolane was developed by Shell for glycerol hydrogenolysis. The major products
obtained were 1-propanol, 1,2-propanediol and 1,3-propanediol after 10 h reaction time [58].
Later, Bullock et al. described the dehydroxylation of glycerol in sulfolane at 110 °C and 52
bar pressure over a ruthenium catalyst but 1,2-PDO and 1,3-PDO were produced in very low
yields (<5%) [59].
Nevertheless, glycerol hydrogenolysis using homogeneous catalysts leads to a range
of by-products along with the major products (1,2- & 1,3-PDO). In general, the
heterogeneous catalysts are usually preferred for industrial applications in view of its
recyclability or easily separable properties. The difficult separation of homogeneous catalysts
from their products and rather their instability led to the development of successful,
industrially applicable heterogeneous catalysts with high levels of activity, selectivity and
catalyst stability. Different classical heterogeneous metal catalysts Cu, Ru, Rh, Pt and Pd
supported on a wide range of qualitatively different carriers and at times in presence of
Brønsted acids or bases as co-catalysts were, so far, widely employed for direct
hydrogenolysis of glycerol to obtain propanediols. Few examples are listed in Table 1.2.

Chapter 1
22 | P a g e
Table 1.2: Some examples of catalytic systems employed in glycerol hydrogenolysis
Entry Catalyst T
(oC)
H2
(MPa)
Gly
Conv
(%)
Products (Selectivity %) [Ref]
1. Cu/SiO2 200 9 73.4 1,2-PDO (91.3), EG (3.6) [60]
2. Ni-Ce/active
carbon
200 5 90.4 1,2-PDO (65.7), EG (10.7) [61]
3. Co-Zn/Al2O3 200 2 67.7 1,2-PDO (50.5) [62]
4. Pd/C 200 1.38 5 1,2-PDO (72.0) [50]
5. Ru/C+Amberlyst 180 8 48.8 1,2-PDO (70.2), 1,3-PDO (1.3),
1-PrOH (7.1), 2-PrOH (1.0)
[63]
6. Rh/SiO2
+Amberlyst
120 8 14.3 1,2-PDO (26.0), 1,3-PDO (9.8),
1-PrOH (42.2), 2-PrOH (12.9)
[64]
7. Ir-ReOx/SiO2 120 8 81.0 1,2-PDO (10), 1,3-PDO (49), 1-
PrOH (33), 2-PrOH (8.0)
[65]
8. Ag/Al2O3 220 1.5 46 1,2-PDO (96) [66]
9. Au-Ru/C 200 4 100 1,2-PDO (12), lactate (38),
formate (44)
[67]
10. Pt/SiO2-Al2O3 220 4.5 19 1,2-PDO (31.9), 1,3-PDO (4.5),
PrOHs (53.8), acetol (12)
[47]
1,2-PDO was found to be the main product of glycerol hydrogenolysis over most
catalysts. Cu catalysts are reported to produce the highest yield of 1,2-PDO, while less
selective towards cleavage of C-C bonds to produce ethylene glycol [68]. Several copper
catalysts prepared either by co-precipitation method [68-73], impregnation method [74-77] or
sol-gel method [78-80] exhibited high activity in glycerol hydrogenolysis and an impressive
catalytic performance with 1,2-PDO yields. Chary et al. [81] investigated vapour phase
hydrogenolysis of glycerol to propanediols over Cu/SBA-15 catalysts and found that
5Cu/SBA-15 catalysts were highly selective to 1,2-PDO (84%) at 90% glycerol conversion
which was due to highly dispersed copper and acidity of catalyst. In a study reported by Feng

Chapter 1
23 | P a g e
et al. [82] Cu/ZnO/MOx (MOx=Al2O3, TiO2 and ZrO2) catalysts presented excellent activity
in glycerol hydrogenolysis reaction carried out in gas phase. The results suggested that the
support material of the catalyst greatly influenced the reaction routes and product distribution
during the reaction.
In comparison to copper (Cu-) catalysts, much less research has been carried out on
cobalt (Co-) and nickel (Ni-) based catalysts [83-90] which are evident in the formation of C2
compounds (from C-C bond cleavage of glycerol), however 1,2-PDO was found to be the
major product of glycerol hydrogenolysis although displayed low selectivities [40].
Pietropaolo et al. [91] reported supported palladium systems (Pd/CoO, Pd/Fe2O3) as the
suitable catalytic materials for glycerol hydrogenolysis. The results showed that the best
performance in terms of glycerol conversion and selectivity to 1,2-PDO over Pd based
catalysts was obtained by the choice of appropriate catalyst preparation method which
resulted in good palladium-support interaction.
Although the transition metal based catalysts are less expensive and highly resistant to
poisoning, the noble metals are known to possess high hydrogenation activity than that of
transition metals. Noble metal catalysts (Pt- Ru-, Ag-, Rh-, and Ir- based catalysts combined
with an acidic/basic component) are the frequently utilized metal components in glycerol
hydrogenolysis as these are well known in its ability to activate H2 molecules. Ag-based
catalysts [92, 93] are also applied in glycerol hydrogenolysis and are prone to attain high
selectivity towards 1,2-PDO. Ru-based catalysts are well known active components and
commonly used in the hydrogenolysis of glycerol. Several Ru-based catalysts supported on
solid acids exhibited better performance and is greatly influenced by the Ru precursor used,
metal particle size, dispersion and acidity of the catalyst [39, 94-97].
Vasiliadou et al. [98] elucidated the effect of precursor used in the preparation of Ru
based catalysts (Ru/γ-Al2O3, Ru/SiO2, Ru/ZrO2), and found that a Ru catalyst prepared using

Chapter 1
24 | P a g e
chloride precursor displayed the maximum activity in glycerol hydrogenolysis. Chary et al.
have tested various Ru-based catalysts supported on SBA-15 [99], MCM-41 [100], TiO2
[101], γ-Al2O3 [102] in the vapour phase glycerol hydrogenolysis reaction and the results
showed that the catalysts were highly selective to 1,2-PDO.
As shown in the mechanism of glycerol hydrogenolysis via dehydration-
hydrogenation and dehydrogenation–dehydration–hydrogenation routes, the formation of 1,
2-PDO involves glycerol activation in presence of simple acids or bases. But for the
production of 1,3-PDO selectively from glycerol, addition of a suitable co-catalyst or a
Brønsted acid is highly essential. However, Pt and Ir catalysts are the most effective catalysts
for hydrogenolysis of glycerol to 1,3-PDO as demonstrated through extensive investigation
for long periods [103, 44]. A number of Pt catalysts comprising Re or WOx type as a co-
catalyst are highly potential to produce highly valued 1,3-PDO [104-106]. In addition,
iridium and rhodium- based catalysts have been widely explored for selective production of
1, 3-PDO by glycerol hydrogenolysis [107-109]. Furthermore, rhenium-oxide-modified
supported iridium catalysts, are proven to provide new opportunities for achieving high
selectivity to 1,3-PDO. The catalyst Ir–ReOx/SiO2 catalyst was found to be the most effective
one for hydrogenolysis of glycerol into 1,3-PDO when compared with various M1-ReOx/SiO2
(M1 = Pt, Pd, Ru, Ir, and Rh) and Ir-M2Ox/SiO2 (M2 = Mo, Re, W, Cr, Ag and Mn) catalysts.
The investigations concluded that Ir–ReOx/SiO2 catalyst achieved the highest 1,3-PDO yield
(38%) at 81% glycerol conversion [65]. Therefore, bifunctional metal–acid catalysts
employed in the selective hydrogenolysis of glycerol usually contain noble-metals in
combination with acid or base components.
1.12 Platinum catalysts
Platinum metal is a well-known hydrogenation catalyst and is considered as the
catalyst of preferential choice in glycerol hydrogenolysis. Supported Pt catalysts on solid acid

Chapter 1
25 | P a g e
or base are known to exhibit high activity and selectivity in glycerol hydrogenolysis [110-
112]. Quite a lot of research groups revealed the importance of Brønsted acidity in the
selective production of 1,3-PDO from glycerol. The selective conversion of glycerol to 1,3-
PDO was highly successful on Platinum deposited on sulphated zirconia, where the Brønsted
acid sites were highly advantageous in promoting glycerol hydrogenolysis to 1,3-PDO [113].
Zhu et al. reported the catalysis of Pt–H4SiW12O40/ZrO2 in glycerol hydrogenolysis focussing
on the production of propanols, however obtained good 1,3-PDO selectivity (40%) at 60%
conversion of glycerol [114]. Alkali metal doped (K, Li, Cs and Rb) Pt–H4SiW12O40/ZrO2
catalyst displayed higher activity with about 43.5% glycerol conversion and 53.6% selectivity
to 1,3-PDO at 180 oC than unmodified catalyst [115]. Pt/WO3/ZrO2 catalyst presented the
highest activity, with 24.2% yield of 1,3-PDO among various noble metal supported on
tungsten and different metal oxide support catalysts tested for glycerol hydrogenolysis [116].
Qin et al. described that Pt/WO3/ZrO2 catalysts (2 wt% Pt and 10 wt% W) attained
32% yield of 1,3-PDO in the hydrogenolysis of aqueous glycerol [117]. In order to improve
1,3-PDO selectivity, SiO2 promoted Pt/WO3/ZrO2 catalysts were prepared by Zhu et al. [118]
and tested in glycerol hydrogenolysis where in the catalyst 5PtW/ZrSi reached maximum 1,3-
propanediol selectivity, up to 52.0%. Gong et al. explored that 50.5% of 1,3-PDO selectivity
was attained at 15.3% glycerol conversion in the hydrogenolysis of aqueous glycerol over
Pt/WO3/TiO2/SiO2 catalysts [119]. The highest 1,3-PDO yield (66–69%) from
hydrogenolysis of aqueous glycerol was reported by Kaneda et al. using a platinum catalyst
on boehmite (AlOOH) support [120]. Liu et al. pointed out that Pt catalyst supported on
mesoporous WO3 was highly active and selective for glycerol hydrogenolysis than
Pt/commercial WO3 catalyst which resulted in 39.3% 1,3-PDO selectivity at 18% glycerol
conversion [121]. The promoting effect of WOx on glycerol hydrogenolysis for the selective
production of 1,3-PDO over Pt-WOx/Al2O3 catalysts was investigated by Zhu and co-workers

Chapter 1
26 | P a g e
[46] and revealed that high selectivity towards 1,3-PDO was ascribed to the presence of
Brønsted acid sites and electronic interaction between Pt and WO3 species.
In addition to this, various bimetallic catalysts including supported Ru-Re [122, 123],
Pt-Re [124], Ru-Cu [125], Pt-Ru [126] catalysts has been investigated in the past decade for
the catalytic production of propanediols from glycerol hydrogenolysis.
Considerable research work has been carried out towards glycerol hydrogenolysis to
propanediols but production of lower alcohols, such as 1-propanol and 2-propanol from
glycerol has been less reported [127, 128]. Strong acidic catalysts are likely to produce more
of propanols resulted from the excessive hydrogenolysis of propanediols [43].
It is clearly evident from the aforementioned glycerol hydrogenolysis reactions that
the metal and acidic/basic solid oxides carrier along with an efficient modifier or additive are
the key components to determine the reaction route and obtain good performance with
respect to 1,3-PDO and PrOHs selectivity. High surface area, greater stability, and suitable
acidic/basic property of the support material are essential to achieve best performance. In an
endeavour to understand the process better, the focus of the study was thus to continue the
development of highly efficient and precise catalytic systems in order to obtain high activity
and selectivity in glycerol hydrogenolysis. The objective of the study was preparation and
evaluation of supported platinum catalysts in combination with and without solid
acids/additives, for the vapour phase hydrogenolysis of glycerol with the aim to produce 1,3-
PDO and lower alcohols, in particular (1-propanol & 2-propanol).
1.13 Vapour phase reaction process
Vapour phase reactions carried out under atmospheric pressure are of great
importance in several chemical processes. Absence of solvent, easy purification and
simplicity of procedure constitute the major advantages [129]. The vapour phase reaction
process comprises passing a reaction mixture in the form of vapour over a prescribed solid
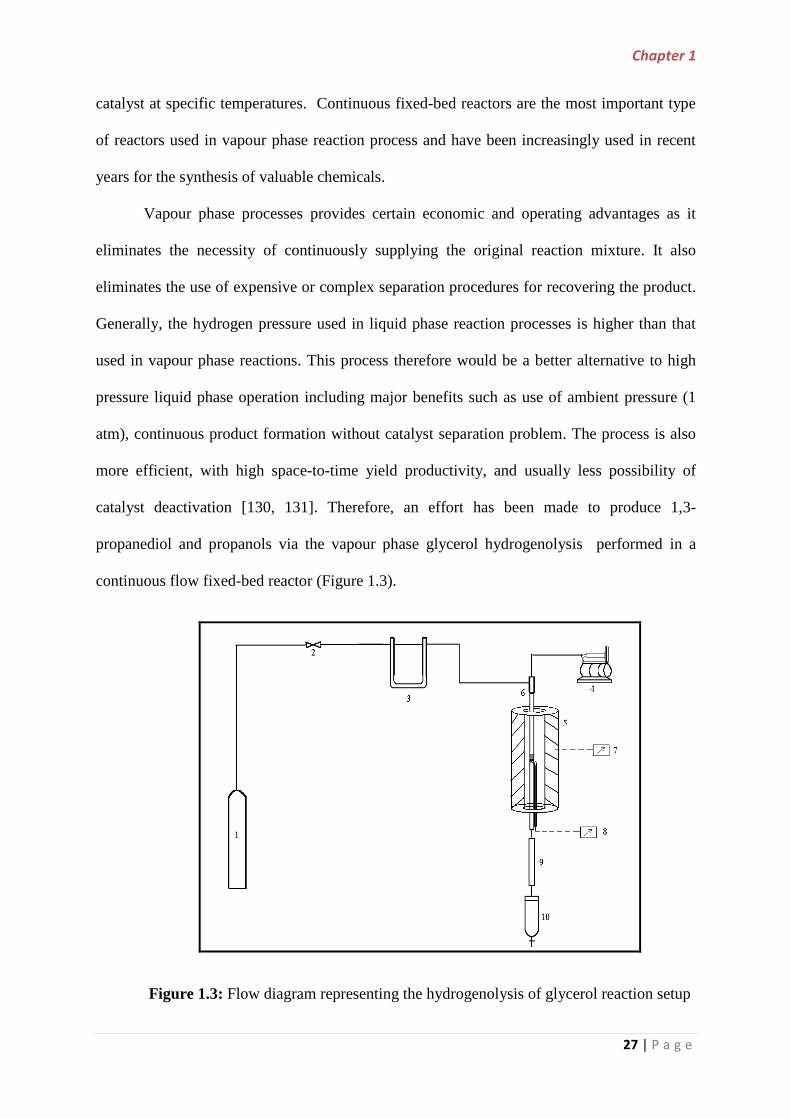
Chapter 1
27 | P a g e
catalyst at specific temperatures. Continuous fixed-bed reactors are the most important type
of reactors used in vapour phase reaction process and have been increasingly used in recent
years for the synthesis of valuable chemicals.
Vapour phase processes provides certain economic and operating advantages as it
eliminates the necessity of continuously supplying the original reaction mixture. It also
eliminates the use of expensive or complex separation procedures for recovering the product.
Generally, the hydrogen pressure used in liquid phase reaction processes is higher than that
used in vapour phase reactions. This process therefore would be a better alternative to high
pressure liquid phase operation including major benefits such as use of ambient pressure (1
atm), continuous product formation without catalyst separation problem. The process is also
more efficient, with high space-to-time yield productivity, and usually less possibility of
catalyst deactivation [130, 131]. Therefore, an effort has been made to produce 1,3-
propanediol and propanols via the vapour phase glycerol hydrogenolysis performed in a
continuous flow fixed-bed reactor (Figure 1.3).
Figure 1.3: Flow diagram representing the hydrogenolysis of glycerol reaction setup

Chapter 1
28 | P a g e
1. Hydrogen Cylinder
2. Stopcock
3. Flow meter
4. Syringe pump
5. Electrical split type furnace
6. Reactor
7. Temperature indicator controller (TIC)
8. Temperature indicator (TI)
9. Condenser
10. Sample collector
1.14 Objectives of the thesis
Despite significant research studies on glycerol hydrogenolysis reported till date,
there are still numerous issues to be investigated. A major drawback has been the use of high
reaction pressure for hydrogenolysis reaction which requires excellent operational safety,
high investment costs and violates environment protection. An additional disadvantage is the
fact that most research efforts have employed the use of hazardous reaction medium. The
catalyst separation becomes problematic by the use of liquid acids and might result in
corrosion of reactor where as a strong acidic catalyst quickly deactivates as the catalyst
surface might be blocked by carbonaceous deposits. Moreover, the presence of organic
solvents in the reaction will significantly decrease the environmental and economic viability.
Hence development of new innovative and economically feasible catalytic processes
is of great interest. Therefore, it is challenging to study environmentally benign alternate
process for the production of 1,3-PDO which is based on sustainable feedstock glycerol
derived from biomass. The present research work is mainly focussed on the selective
production of 1,3-PDO and propanols through hydrogenolysis of glycerol over platinum
based catalysts carried out in vapour phase at moderate reaction temperatures and

Chapter 1
29 | P a g e
atmospheric pressure. In this work, various supported platinum catalysts have been
synthesised, well characterized and tested with an attention to investigate the nature of
support responsible for the selective formation of desired products. The supports used in the
study include zirconia, sulphated zirconia, gamma alumina, aluminium phosphate, activated
carbon, Y-zeolite, SBA-15, H-mordenite along with acid additives such as tungstate and
heteropolyacids. Detailed reaction parametric study has been carried out.
The present work aims at:
Development of highly efficient supported Platinum catalysts for selective
hydrogenolysis of glycerol.
Detailed characterization of the catalysts to draw the relation between physico-
chemical properties of catalysts and their activities in glycerol hydrogenolysis.
Evaluation of catalytic activity of various supported platinum catalysts for selective
glycerol hydrogenolysis performed in vapour phase under atmospheric pressure.
To understand the surface and structural properties of supported Platinum catalysts
and their role in catalytic activity for the selective hydrogenolysis of glycerol with
focus on the production of 1,3-propanediol and propanols (1-propanol+2-propanol).
To investigate the factors influencing the activity and selectivity of catalysts such as
nature of support, dispersion of metal and the reaction conditions in order to better
understand the reasons for catalytic activity during selective hydrogenolysis of
glycerol to selectively produce 1,3-propanediol and propanols.
To study the role of Brønsted acid sites in the catalyst and their activity in the
selective formation of 1,3-propanediol.
A comprehensive wide-range reaction parametric study using most active catalysts in
order to unveil the optimized reactions conditions for glycerol hydrogenolysis.

Chapter 1
30 | P a g e
Assessing the reasons for stability and reusability of catalysts as well as the reaction
mechanism of glycerol hydrogenolysis.
The ultimate challenge is to successfully develop the most promising environmental
benign and economic viable catalytic process of glycerol hydrogenolysis.
1.15 Thesis structure
The research work carried out has been compiled in the form of a thesis entitled
“Valorization of Glycerol for commodity chemicals through Vapour phase
Hydrogenolysis over Supported Platinum catalysts”. The thesis is organized in seven
chapters as shown below.
CHAPTER 1: This chapter gives a brief introduction on biomass, biodiesel production and
the problem of glycerol accumulation as a byproduct. The need to find new applications of
glycerol with various methods available for conversion of glycerol to value-added
compounds is discussed. Glycerol hydrogenolysis and importance of propanediols were also
discussed in this study. A detailed account of the mechanism and the development of
heterogeneous catalysts for hydrogenolysis of glycerol are illustrated. Finally, the aim and
objectives of the thesis are elucidated.
CHAPTER 2: This chapter describes an initial study on hydrogenolysis of glycerol over
various supported platinum catalysts (Pt/ZrO2, Pt/S-ZrO2, Pt/Al2O3, Pt/AlPO4, Pt/C, Pt/Y-
zeolite) in order to screen the most effective catalyst. The detailed synthesis and
characterizations of the various supported platinum catalysts are discussed. The effect of
nature of support material towards hydrogenolysis of glycerol for selective formation of 1,3-
PDO is studied. The factors influencing the glycerol conversion and selectivity to 1,3-PDO
based on different reaction parameters and catalyst performance on glycerol hydrogenolysis
are discussed.

Chapter 1
31 | P a g e
CHAPTER 3: This chapter presents a more detailed investigation on aluminium phosphate
supported platinum catalyst (Pt/AlPO4) for selective glycerol hydrogenolysis to 1,3-PDO
which was found to the best performed catalyst among various other supported platinum
catalysts investigated in the previous chapter. The effect of metal loading on the catalytic
performance towards glycerol conversion and selectivity to products is described. The role of
acidity and its correlation with catalytic activity is presented. Detailed parametric study to
find the optimized conditions and further the reusability of the catalyst is illustrated.
CHAPTER 4: The development of highly selective Pt-WO3/SBA-15 catalyst for selective
conversion of glycerol to 1,3-PDO is described. The use of tungstate species as additive or
co-catalyst in enhancing the catalytic performance to selective formation of 1,3-PDO by
generation of Brønsted acid sites is described. The importance of Brønsted acidity for the
selective formation of 1,3-PDO during glycerol hydrogenolysis is verified. The effect of
various reaction parameters on glycerol hydrogenolysis, reaction mechanism and reusability
of the catalyst is explained.
CHAPTER 5: This chapter presents the preparation, characterization and performance
evaluation of H-mordenite supported platinum catalysts for hydrogenolysis of glycerol. The
conversion of glycerol and selectivity to 1,3-PDO under various reaction parameters is
elucidated correlating the surface and structural properties of catalysts with the catalytic
activity. The Brønsted acid sites provided by the zeolite support is an added advantage in
improving the selectivity to 1,3-PDO without the use of an external additive. The catalyst
stability along with the detailed reaction mechanism is presented.
CHAPTER 6: This chapter presents a study related to selective production of propanols
from glycerol over bifunctional Pt-heteropolyacid catalysts supported on zirconia. This study
provides an insight into the role of acidity on product formation during glycerol
hydrogenolysis. The Brønsted acidity of the catalyst played a major role in selective

Chapter 1
32 | P a g e
formation of 1,3-PDO which is evident from the previous chapters; however the present study
describes that the presence of too strong acid sites in the catalyst promotes double
dehydration-hydrogenation of glycerol to produce lower alcohols (1-proapnol and 2-
propanol). Optimisation of various reaction parameters to understand the catalytic activity is
discussed in detail.
CHAPTER 7: This chapter summarizes the overall conclusions drawn from the results
obtained in the present research work. To end with, some recommendations for future works
are also given.

Chapter 1
33 | P a g e
References
[1] K. Biernat, A. Malinowski, M. Gnat, in: Z. Fang (Ed.), Biofuels - Economy, Environment
and Sustainability, (2013) 123-172.
[2] O. Morton, Nature. 444 (2006) 669.
[3] L. Prati, P. Spontoni, A. Gaiassi, Top. Catal. 52 (2009) 288-296.
[4] N. Dimitratos, J. A. Lopez-Sanchez, G. J. Hutchings, Top. Catal. 52 (2009) 258-268.
[5] R. A. Sheldon, Catal. Today. 167 (2011) 3-13.
[6] J. C. Serrano-Ruiz, R. Luque, A. Sepulveda-Escribano, Chem. Soc. Rev. 40 (2011) 5266-
5281.
[7] A. V. Bridgwater, Biomass Bioenergy. (2011) 1-27.
[8] C. H. Zhou, X. Xia, C. X. Lin, D. S. Tong, J. Beltramini, Chem. Soc. Rev. 40 (2011)
5588-5617.
[9] Department of Primary Industries Office of Water accessed on 02/2012, available from:
http://www.water.nsw.gov.au/.
[10] EU Directive 2003/30/EC, The promotion of the use of biofuels or related other
renewable fuels for transport, 2003.
[11] Biodiesel Magazine accessed on 02/2012, available from:
http://www.biodieselmagazine.com/article.jsparticle_id=4080.
[12] L. He, J. M. S. Parra, E. A. Blekkan, D. Chen, Energy Environ. Sci. 3 (2010) 1046-1056.
[13] B. Katryniok, S. Paul, V. Belliere-Baca, P. Rey, F. Dumeignil, Green Chem. 12 (2010)
2079-2098.
[14] C. H. C. Zhou, J. N. Beltramini, Y. X. Fan, G. Q. M. Lu, Chem. Soc. Rev. 37 (2008)
527-549.
[15] M. Pagliaro, M. Rossi, The Future of Glycerol, The Royal Society of Chemistry,
Cambridge, UK (2010).

Chapter 1
34 | P a g e
[16] J. A. Kenar, Lipid Technol. 19 (2007) 249-253.
[17] C. A. G. Quispe, C. J. R. Coronado, J. A. Carvalho, Renewable and Sustainable Energy
Reviews. 27 (2013) 475–493.
[18] A. Behr, J. Eilting, K. Irawadi, J. Leschinski, F. Lindner, Green Chem. 10 (2008) 13-30.
[19] M. Pagliaro, R. Ciriminna, H. Kimura, M. Rossi, C. Della Pina, Angew. Chem. Int. Ed.
46 (2007) 4434-4440.
[20] T. Werpy, G. Petersen, US Department of Energy (USDOE), 1 (2004).
[21] Y. Zheng, X. Chen, Y. Shen, Chem. Rev. 108 (2008) 5253–5277.
[22] B. N. Zope, D. D. Hibbitts, M. Neurock, R. J. Davis, Science. 330 (2010) 74-78.
[23] A. Villa, G. M. Veith, L. Prati, Angew. Chem. Int. Ed. 49 (2010) 4499-4502.
[24] M. Goula, N. D. Charisiou, O.A. Bereketidou, World Bioenergy 2012: Conference &
Exhibition on Biomass for Energy, Sweden, (2012).
[25] J. ten Dam, U. Hanefeld, ChemSusChem. 4 (2011) 1017–1034.
[26] A. B. Leoneti, V. Aragão-Leoneti, S.V. Walter, Renewable Energy. 45 (2012) 138-145.
[27] T. Werpy, G. Petersen, Pacific Northwest National Laboratory (PNNL) and National
Renewable Energy Laboratory (NREL), United States of America (2004).
[28] J. H. Sinfelt, John Wiley & Sons, Inc, United States of America (1931).
[29] S. H. Chai, H. P. Wang, Y. Liang, B. Q. Xu, Green Chem. 9 (2007) 1130.
[30] M. Stelmachowski, Ecol. Chem. Eng. S. 18 (2011) 9-30.
[31] A. M. Ruppert, K. Weinberg, R. Palkovits, Angew. Chem. Int. Ed. 51 (2012) 2564–
2601.
[32] A. Wolfson, G. Litvak, C. Dlugy, Y. Shotland, D. Tavor, Ind. Crop. Prod. 30 (2009) 78–
81.
[33] A. Wolfson, C. Dlugy, Y. Shotland, Environ. Chem. Lett. 5 (2007) 67–71.
[34] A. Wolfson, C. Dlugy, Y. Shotland, D. Tavor, Tetrahedron Lett. 50 (2009) 5951–5953.

Chapter 1
35 | P a g e
[35] G. Perin, L. G. Mello, C. S. Radatz, L. Savegnago, D. Alves, R. G. Jacob, E. J.
Lenardao, Tetrahedron Lett. 51 (2010) 4354–4356.
[36] Y. Nakagawa, M. Tamura, K. Tomishige, J. Mater. Chem. A. 2 (2014) 6688–6702.
[37] A. Behr, J. Eilting, K. Irawadi, J. Leschinski, F. Lindner, Green Chem. 10 (2008) 13–30.
[38] H. J. Liu, D. J. Zhang, Y. H. Xu, Y. Mu, Y. Q. Sun, Z. L. Xiu, Biotechnol. Lett. 29
(2007) 1281-1285.
[39] A. Drozdzynska, K. Leja, K. Czaczyk, BioTechnologia, J. Biotech. Comp. Biol.
Bionanotech. 92 (2011) 92-100.
[40] Y. Nakagawa, K. Tomishige, Catal. Sci. Technol. 1 (2011) 179–190.
[41] J. E. Logsdon, R. A. Loke, Kirk-Othmer Encyclopedia of Chemical Technology, John
Wiley & Sons, 2000.
[42] M. Schlaf, Dalton Trans. 2006, 4645-4653.
[43] Y. Wang, J. Zhou, X. Guo, RSC Adv. 5 (2015) 74611–74628.
[44] Y. Amada, Y. Shinmi, S. Koso, T. Kubota, Y. Nakagawa and K. Tomishige, Appl.
Catal., B. 105 (2011) 117-127.
[45] S. Zhu, Y. Qiu, Y. Zhu, S. Hao, H. Zheng, Y. Li, Catal. Today, 212 (2013) 120-126.
[46] S. Zhu, X. Gao, Y. Zhu, Y. Li, J. Mol. Catal. A: Chem. 398 (2015) 391-398.
[47] I. Gandarias, P. L. Arias, J. Requies, M. B. Güemez, J. L. G. Fierro, Appl. Catal., B. 97
(2010) 248–256.
[48] A. Alhanash, E. F. Kozhevnikova, I. V. Kozhevnikov, Appl. Catal., A. 378 (2010) 11–
18.
[49] B. Katryniok, S. Paul, V. Belliere-Baca, P. Reye, F. Dumeignil, Green Chem., 12 (2010)
2079–2098.
[50] M. A. Dasari, P. P. Kiatsimkul, W. R. Sutterlin, G. J. Suppes, Appl. Catal., A. 281
(2005) 225-231.
Chapter 1
36 | P a g e
[51] W. Q. Yu, J. Xu, H. Ma, C. Chen, J. Zhao, H. Miao, Q. Song, Catal. Commun. 11 (2010)
493-497.
[52] X. Y. Guo, A. Y. Yin, X. D. Guo, X. Y. Guo, W. L. Dai, K. N. Fan, Chin. J. Chem. 29
(2011) 1563-1566.
[53] Z. L. Yuan, P. Wu, J. Gao, X. Y. Lu, Z. Y. Hou, X. M. Zheng, Catal. Lett. 130 (2009)
261-265.
[54] Y. Nakagawa, X. H. Ning, Y. Amada, K. Tomishige, Appl. Catal., A. 433 (2012) 128-
134.
[55] E. G. Suarez, M. P. Cadenas, A. G. Ruiz, I. R. Ramos, A. Arcoya, Appl. Surf. Sci. 287
(2013) 108-116.
[56] S. X. Xia, Z. L. Yuan, L. N. Wang, P. Chen, Z. Y. Hou, Appl. Catal., A. 403 (2011) 173-
182.
[57] T. M. Che, Patent US 4 642 394 Celanese Corp. (1987).
[58] E. Drent, W. W. Jager, Patent US 6080898 Shell Oil Co. (2000).
[59] M. Schlaf, P. Ghosh, P. J. Fagan, E. Hauptman, R. M. Bullock, Angew. Chem. Int.
Ed. 40 (2001) 3887-3890.
[60] Z. Huang, F. Cui, H. Kang, J. Chen, X. Zhang, C. Xia, Chem. Mater. 20 (2008) 5090–
5099.
[61] W. Yu, J. Zhao, H. Ma, H. Miao, Q. Song, J. Xu, Appl. Catal., A. 383 (2010) 73–78.
[62] X. H. Guo, Y. Li, W. Song, W. J. Shen, Catal. Lett. 141 (2011) 1458-1463.
[63] T. Miyazawa, S. Koso, K. Kunimori, K. Tomishige, Appl. Catal., A. 329 (2007) 30–35.
[64] I. Furikado, T. Miyazawa, S. Koso, A. Shimao, K. Kunimori, K. Tomishige, Green
Chem. 9 (2007) 582-588.
[65] Y. Nakagawa, Y. Shinmi, S. Koso, K. Tomishige, J. Catal. 272 (2010) 191–194.

Chapter 1
37 | P a g e
[66] J. X. Zhou, J. Zhang, X. W. Guo, J. B. Mao, S. G. Zhang, Green Chem. 14 (2012) 156-
163.
[67] E. P. Maris, R. J. Davis, J. Catal. 249 (2007) 328–337.
[68] S. Bagheri, N. M. Julkaplin, W. A. Yehye, Renewable and Sustainable Energy Reviews.
41 (2015) 113–127.
[69] D. Duran-Martin, M. Ojeda, M. L. Granados, J. L. G. Fierro, R. Mariscal, Catal. Today.
210 (2013) 98-105.
[70] R. B. Mane, A. A. Ghalwadkar, A. M. Hengne, Y. R. Suryawanshi, C. V. Rode, Catal.
Today. 164 (2011) 447-450.
[71] N. D. Kim, J. R. Park, D. S. Park, B. K. Kwak, J. H. Yi, Green Chem. 14 (2012) 2638-
2646.
[72] M. Balaraju, V. Rekha, P. S. Sai Prasad, R. B. N. Prasad, N. Lingaiah, Catal. Lett. 126
(2008) 119-124.
[73] R. B. Mane, A. M. Hengne, A. A. Ghalwadkar, S. Vijayanand, P. H. Mohite, H. S.
Potdar, C. V. Rode, Catal. Lett. 135 (2010) 141-147.
[74] E. S. Vasiliadou, A. A. Lemonidou, Appl. Catal. A. 396 (2011) 177-185..
[75] S. H. Zhu, X. Q. Gao, Y. L. Zhu, Y. F. Zhu, H. Y. Zheng, Y. W. Li, J. Catal. 303 (2013)
70-79.
[76] L. Y. Guo, J. X. Zhou, J. B. Mao, X. W. Guo, S. G. Zhang, Appl. Catal. A. 367 (2009)
93-98.
[77] J. X. Zhou, L. Y. Guo, X. W. Guo, J. B. Mao, S. G. Zhang, Green Chem. 12 (2010)
1835-1843.
[78] Z. H. Xiao, J. H. Xiu, X. K. Wang, B. S. Zhang, C. T. Williams, D. S. Su, C. H. Liang,
Catal. Sci. Technol. 3 (2013) 1108-1115.
[79] Z. H. Xiao, S. H. Jin, X. K. Wang, W. Z. Li, J. H. Wang, C. H. Liang, J. Mater. Chem.
22 (2012) 16598-16605.

Chapter 1
38 | P a g e
[80] B. K. Kwak, D. S. Park, Y. S. Yun, J. Yi, Catal. Commun. 24 (2012) 90-95.
[81] M. Harisekhar, V. P. Kumar, S. S. Priya, K. V. R. Chary, J. Chem. Technol. Biotechnol.
90 (2015) 1906–1917.
[82] Y. Feng, H. Yin, A. Wang, L. Shen, L. Yu, T. Jiang, Chem. Eng. J. 168 (2011) 403-408.
[83] W. Q. Yu, J. Xu, H. Ma, C. Chen, J. Zhao, H. Miao, Q. Song, Catal. Commun. 11 (2010)
493-497.
[84] A. Marinoiu, G. Ionita, C.-L. Gaspar, C. Cobzaru, S. Oprea, React. Kinet. Catal. Lett. 97
(2009) 315-320.
[85] J. H. Huang, J. X. Chen, Chin. J. Catal. 33 (2012) 790-796.
[86] A. Marinoiu, G. Ionita, C.-L. Gaspar, C. Cobzaru, D. Marinescu, C. Teodorescu, S.
Oprea, React. Kinet. Mech. Catal. 99 (2010)111-118.
[87] X. H. Guo, Y. Li, Q. Y. Liu, W. J. Shen, Chin. J. Catal. 33 (2012) 645-650.
[88] X. Y. Guo, A. Y. Yin, X. D. Guo, X. Y. Guo, W. L. Dai, K. N. Fan, Chin. J. Chem.
2011, 29, 1563-1566.
[89] X. H. Guo, Y. Li, W. Song, W. J. Shen, Catal. Lett. 141 (2011) 1458-1463.
[90] Y. B. Cao, X. Zhang, J. M. Fan, P. Hu, L.-Y. Bai, H.-B. Zhang, F.-L. Yuan, Y.-F. Chen,
Cryst. Growth Des. 11 (2011) 472–479.
[91] M. G. Musolino, L. A. Scarpino, F. Mauriello, R. Pietropaolo, ChemSusChem. 4 (2011)
1143–1150.
[92] G. D. Yadav, P. A. Chandan, D. P. Tekale, Ind. Eng. Chem. Res. 51 (2012) 1549-1562.
[93] J. X. Zhou, J. Zhang, X. W. Guo, J. B. Mao, S. G. Zhang, Green Chem. 14 (2012) 156-
163.
[94] P. Centomo, V. Nese, S. Sterchele, M. Zecca, Top. Catal. 56 (2013) 822-830.
[95] J. Feng, W. Xiong, B. Xu, W. D. Jiang, J. B. Wang, H. Chen, Catal. Commun. 46 (2014)
98-102.
[96] S.-H. Lee, D. J. Moon, Catal. Today. 174 (2011) 10-16.
[97] T. Jiang, Y. X. Zhou, S. G. Liang, H. Z. Liu, B. X. Han, Green Chem. 11 (2009) 1000-
1006.

Chapter 1
39 | P a g e
[98] E. S. Vasiliadou, E. Heracleous, I. A. Vasalos, A. A. Lemonidou, Appl. Catal., B 92
(2009) 90-99.
[99] V. P. Kumar, C. H. S. Srikanth, A. Nageswara Rao, K. V. R. Chary, J. Nanosci.
Nanotech. 14 (2014) 3137-3146.
[100] V. P. Kumar, A. Kumar, G. S. Rao, K. V. R. Chary, Catal. Today. DOI
10.1016/j.cattod.2014.03.036.
[101] V. P. Kumar, Y. H. Krishna, N. Nagaraju, K. V. R. Chary, Indian J. Chem., Sect. A 53
A (2014) 516-523.
[102] V. P. Kumar, S. S. Priya, Y. Harikrishna, A. Kumar, K. V. R. Chary, Journal of
Nanoscience and Nanotechnology. 15 (2015) 1–9.
[103] Y. Nakagawa, X. H. Ning, Y. Amada, K. Tomishige, Appl. Catal., A 433 (2012) 128-
134.
[104] C. H. Deng, X. Z. Duan, J. H. Zhou, D. Chen, X. G. Zhou, W. K. Yuan, Catal. Today.
234 (2014) 208-214.
[105] Y. H. Zhang, X.-C. Zhao, Y. Wang, L. K. Zhou, J. Y. Zhang, J. Wang, A. Q. Wang, T.
Zhang, J. Mater. Chem. A. 1 (2013) 3724-3732.
[106] S. G. Fernández, I. Gandarias, J. Requies, M. B. Güemez, S. Bennici, A. Auroux, P. L.
Arias, J. Catal. 323 (2015) 65–75.
[107] A. Shimao, S. Koso, N. Ueda, Y. Shinmi, I. Furikado, K. Tomishige, Chem. Letters. 38
(2009) 540-541.
[108] Y. Shinmi, S. Koso, T. Kubota, Y. Nakagawa, K. Tomishige, Appl. Catal., B 94 (2010)
318-326.
[109] Y. Amada, H. Watanabe, M. Tamura, Y. Nakagawa, K. Okumura, K. Tomishige, J.
Phys. Chem. C. 116 (2012) 23503-23514.
[110] M. Checa, F. Auneau, J. H. Carrillo, A. Marinas, J. M. Marinas, C. Pinel, F. J. Urbano,
Catal. Today. 196 (2012) 91-100.
[111] Z. L. Yuan, P. Wu, J. Gao, X. Y. Lu, Z. Y. Hou, X. M. Zheng, Catal. Lett. 130 (2009)
261-265.
[112] R. Rodrigues, N. Isoda, M. Gonçalves, F. C. A. Figueiredo, D. Mandelli, W. A.
Carvalho, Chem. Eng. J. 198 (2012) 457-467.

Chapter 1
40 | P a g e
[113] J. Oh, S. Dash, H. Lee, Green Chem. 13 (2011) 2004−2007.
[114] S. Zhu, Y. Zhu, S. Hao, H. Zheng, T. Mo, Y. Li, Green Chem. 14 (2012) 2607–2616.
[115] S. Zhu, X. Gao, Y. Zhu, Y. Zhu, X. Xiang, C. Hu, Y. Li, Appl. Catal., B 140–141
(2013) 60–67.
[116] T. Kurosaka, H. Maruyama, I. Naribayashi, Y. Sasaki, Catal. Commun. 9 (2008) 1360–
1363.
[117] L.-Z. Qin, M.-J. Song, C.-L. Chen, Green Chem. 12 (2010) 1466–1472.
[118] S. Zhu,, X. Gao, Y. Zhu, J. Cui, H. Zheng, Y. Li, Appl. Catal., B 158–159 (2014) 391–
399
[119] L. Gong, Y. Lu, Y. Ding, R. Lin, J. Li, W. Dong, T. Wang, W. Chen, Appl. Catal., A
390 (2010) 119–126.
[120] R. Arundhathi, T. Mizugaki, T. Mitsudome, K. Jitsukawa, K. Kaneda, ChemSusChem,
6 (2013) 1345–1347.
[121] L. Liu, Y. Zhang, A. Wang, T. Zhang, Chin. J. Catal. 33 (2012) 1257–1261.
[122] L. Ma, D. He, Top. Catal. 52 (2009) 834-844.
[123] L. Ma, Y. Li, D. He, Chin. J. Catal. 32 (2011) 872-876.
[124] O. M. Daniel, A. DeLaRiva, E. L. Kunkes, A. K. Datye, J. A. Dumesic, R. J. Davis,
ChemCatChem. 2 (2010) 1107-1114.
[125] T. Jiang, Y. Zhou, S. Liang, H. Liu, B. Han, Green Chem. 11 (2009) 1000-1006.
[126] E. P Maris, W. C Ketchie, M. Muroyama, R. J. Davis, J. Catal. 251 (2007) 281-294.
[127] E. van Ryneveld, A. S. Mahomed, P. S. van Heerden, M. J. Green, H. B. Friedrich,
Green Chem. 13 (2011) 1819-1827.
[128] M. Schlaf, P. Ghosh, P. J. Fagan, E. Hauptman, R. M. Bullock, Adv. Synth. Catal. 351
(2009) 789-800.
[129] J.-M Denis, A.-M. Goumant https://books.google.com.au/books?isbn=9056990810.
[130] C. Moreno-Marrodan, P. Barbaro, Green Chem. 16 (2014) 3434-3438.
[131] L. Huang, Y. L. Zhu, H. Y. Zheng, Y. W. Li, Z. Y. Zeng, J. Chem. Technol.
Biotechnol. 83 (2008) 1670–1675.

Chapter 2
41 | P a g e
CHAPTER 2 Supported Platinum Catalysts for Vapour-phase
Hydrogenolysis of Glycerol: Effect of supports
towards 1,3-propanediol selectivity

Chapter 2
42 | P a g e
This chapter presents a primary investigation on evaluating the effect of nature of
support on the catalytic performance of various supported platinum catalysts during glycerol
hydrogenolysis. Zirconia, sulfated zirconia, γ–alumina, aluminium phosphate, activated
carbon, and Y-zeolite supported Platinum (2 wt%) catalysts have been prepared by wet
impregnation method and characterized by various techniques such as X-ray Diffraction
(XRD), Fourier Transform Infrared Spectroscopy (FTIR), BET surface area, Scanning
Electron Microscopy (SEM), Temperature Programmed Desorption (TPD) of NH3, Ex-situ
pyridine adsorbed FTIR analysis, Transmission Electron Microscopy (TEM), CO-
chemisorption methods and Temperature Programmed Reduction (TPR) experiments to study
the physico-chemical properties of the catalysts. Vapour phase hydrogenolysis of glycerol
over the supported platinum catalysts was studied at moderate reaction temperature and
atmospheric pressure. The catalysts and the role of supports were screened mainly towards
glycerol conversion and 1,3-propanediol selectivity. Among the different supported platinum
catalysts, aluminium phosphate supported platinum catalyst presented 100% glycerol
conversion and 35.4% 1,3-propanediol selectivity. It was observed that the glycerol
conversion and 1,3-propanediol selectivity depended upon the nature of the support and in
particular its surface acidity. The dispersion of platinum on the support and the platinum-
support interaction were other key parameters considered to assess the catalyst performance
during glycerol hydrogenolysis.
The work presented in this chapter has been published:
S. Shanthi Priya, V. P. Kumar, M. L. Kantam, S. K. Bhargava and K. V. R. Chary, Vapour-
phase Hydrogenolysis of Glycerol to 1, 3-propanediol Over Supported Pt Catalysts: The
Effect of Supports on the Catalytic Functionalities. Catal. Lett. 144 (2014) 2129–2143.

Chapter 2
43 | P a g e
2.1 Introduction
Exploration of renewable energy sources for the development of cleaner alternatives
to liquid fuels and chemicals produced from petroleum is of intense interest because of
depleting fossil fuel reserves and continuously increasing environmental issues. Biomass
appears to be a promising alternative renewable feedstock wherein biomass-derived
compounds can be effectively used in the production of specialty chemicals and fuels.
Glycerol due to its nontoxic, biodegradable and multifunctional structure, finds the
prospective to be one among the top 12 platform chemicals from biomass. Large amount of
glycerol is produced as a by-product during biodiesel production from transesterification of
oils and is available at a relatively low cost [1]. Therefore, utilization of glycerol as a three
carbon feed-stock to produce fuel additives and other value-added chemicals received a lot of
attention in the recent past for sustainable development. There are a number of valuable
commodity chemicals that include mesoxalic acid, solketal, acrolein, propanediols, hydrogen
that can be produced from glycerol using oxidation, acetalization, reduction, hydrogenolysis
and reforming reactions [2-8]. Among the various probable commodity chemicals derived
from glycerol, 1, 2-propanediol (1, 2-PDO) and 1, 3-propanediol (1, 3-PDO) are important
value-added products due to their significance as fuel additives and in polymer industries.
As discussed in the introduction chapter, 1,2-propanediol and 1,3-propanediol are
considered as important specialty chemicals with several uses. While 1,2-PDO is mainly used
as precursor in the production of polyester resins, detergents, cosmetics, antifreeze, flavors,
pharmaceuticals and paints [9]; 1,3-PDO, is even more significant, as an important monomer
used to fabricate polyester fibers, films and coatings [10, 11]. In general, propanediols are
synthesized by selective oxidation and subsequent hydration of propylene or ethylene [12].
Alternatively, catalytic hydrogenolysis of glycerol offers a potential pathway to produce
propanediols and this process was demonstrated both in liquid and vapor phase over

Chapter 2
44 | P a g e
supported Rh [13-15], Ni [16], Ru [17-21], Pt [22, 23] and Cu [24-29] based catalysts. The
selective production of 1,3-propanediol from glycerol is highly challenging process and in
this regard, noble metals, such as Ru, Rh, Ir and Pt exhibited high catalytic activity [30] and
hydrothermal stability [31] during glycerol hydrogenolysis. Moreover, the use of Pt metal
catalysts for selective production of 1,3-PDO have been extensively investigated by several
researchers and proven to be ideal catalytic active components for hydrogenolysis of glycerol
[32-41].
The influence of nature of the support on glycerol hydrogenolysis has been well
demonstrated in some previous studies and emphasized that support has a significant role on
the catalytic performance. In a study by Zhou et.al, Cu/γ-Al2O3 exhibited high selectivity
(85%) towards 1,2-PDO among Cu supported on ZrO2, SiO2, HZSM-5, γ-Al2O3 screened for
glycerol hydrogenolysis at 240 oC and 6 MPa H2. The superior performance of Cu/γ-Al2O3
was attributed to the moderate acidic strength of the support [42]. Similarly, among the
Al2O3, HY, HZSM-5, 13X, Hβ zeolite supported copper catalysts, Cu/Al2O3 exhibited 95%
selectivity towards propanediols during glycerol hydrogenolysis carried out at 220 oC and 1.5
MPa H2 [43]. Delgado et. al. investigated Al2O3, Al2O3-SiO2, TiO2 supported Pt catalysts
for glycerol hydrogenolysis and found that surface acid sites were responsible for high
selectivity towards propanediols [44]. In another study, among the Hβ, HZSM-5, Al2O3,
MgO, HT supported Pt catalysts, Pt/HT showed high conversion and selectivity towards
propanediols as a result of basicity of the support material [45]. However, all the afore-
mentioned glycerol hydrogenolysis processes depended on the use of toxic organic solvents
and liquid acids, which significantly reduce the environmental and economic viability of the
process.
Above all, the commercial prospective of the glycerol hydrogenolysis reaction
process was mainly restricted by the use of high reaction pressure. Therefore, vapour phase

Chapter 2
45 | P a g e
hydrogenolysis of glycerol is considered as viable alternative to the high pressured liquid
phase processes especially in reducing the process cost and improving the process safety. Cu-
STA/SiO2 catalyst resulted in 32.1% and 22.2% selectivity to 1,3-PDO and 1,2-PDO
respectively during the vapour phase hydrogenolysis of glycerol [46]. In another study,
Cu/ZnO/MOx (MOx =Al2O3, TiO2, and ZrO2) catalysts displayed only 10% selectivity
towards 1,3-PDO during glycerol hydrogenolysis carried out at 240-300 oC, 0.1 MPa H2 [47].
Even though some reported methods on vapour phase glycerol hydrogenolysis addresses the
process issues of the liquid phase reactions, selectivity of 1,3-propanediol was found to be
quite low and remains as the major limitation. Therefore, it is desirable to develop an active
catalyst material to improve the selectivity of 1,3-propanediol under mild reaction conditions.
In this chapter, the synthesis of various supported platinum catalysts and its
evaluation for vapour phase glycerol hydrogenolysis for the selective formation of 1,3-PDO
is presented. 2 wt% Pt supported on Aluminium phosphate (AlPO4), activated carbon (C),
gamma alumina (γ-Al2O3) zirconia (ZrO2), sulphated zirconia (S-ZrO2), and Y-zeolite (YZ)
were prepared by wet impregnation method and thoroughly investigated by XRD, FTIR,
SEM, CO-chemisorption, TPR, TEM, NH3-TPD and Pyridine adsorbed FTIR spectroscopic
techniques. The as-prepared catalysts were screened for glycerol hydrogenolysis reaction
performed in vapour phase and atmospheric pressure. The objective of the present study was
to explore the role of support in regulating the activity and product selectivity during
hydrogenolysis of glycerol with focus on the production of 1, 3-PDO. The effect of reaction
parameters including the reaction temperature and H2 flow rate were investigated in order to
optimize the glycerol conversion and 1,3-PDO selectivity. Subsequently, the surface acidity
of the catalysts and the extent of dispersion of Pt on different supports were estimated and its
correlation with the catalytic activity results has been elucidated.

Chapter 2
46 | P a g e
2.2 Experimental section
2.2.1 Preparation of catalysts
All the supported Platinum catalysts were prepared by means of incipient wetness
impregnation method. The supports used in this study included ZrO2 (lab made, BET surface
area 95 m2/g), S-ZrO2 (lab made, BET surface area 63 m2/g), γ-Al2O3 (Engelhard
Corporation, Al-3996, BET surface area 154 m2/g), AlPO4 (lab made, BET surface area 173
m2/g), Activated carbon (NORIT, BET surface area 1212 m2/g) and Y-zeolite (Conteka, BET
surface area 730 m2/g).
2.2.1.1 Preparation of Zirconia
Zirconia support used in the present study was synthesised by the addition of an
aqueous solution (10% v/v) of ammonia to the saturated aqueous solution of zirconyl nitrate
hydrate ZrO(NO3)2. xH2O (Aldrich), until the pH of the solution is stabilized at 9. The
resulting precipitate was washed thoroughly with water to remove the excess base. The
precipitate was dried at 110 oC for 12 h and the resulting hydroxide was calcined in air at
500 oC for 5 h.
2.2.1.2 Preparation of Sulfated zirconia
Sulfated zirconia was synthesized using sol-gel method as reported earlier [39]. In 6.6
mL of 1-propanol (Aldrich, 99.5%), 5 mL of Zr(OCH2CH2CH3)4 solution (Aldrich, 70 wt%
in 1-propanol) was added. 9.7 mL of the aqueous sulfuric acid solution (0.5 M) was added
drop wise to the solution of Zr(OCH2CH2CH3)4 in 1-propanol under vigorous stirring which
resulted in the formation of the gel. The gel thus obtained was stirred, dried at 100 ºC, and
calcined at 625 ºC for 4 h.
2.2.1.3 Preparation of Aluminium Phosphate

Chapter 2
47 | P a g e
Amorphous aluminium phosphate with a P/Al ratio of 0.9 was synthesised from
aluminium nitrate (Al(NO)3·6H2O) and diammonium hydrogen phosphate ((NH4)2HPO4)
precursors. Both precursors were dissolved in deionized water (400 mL of 0.5 M of Al nitrate
solution and 350 mL of 0.5 M of (NH4)2HPO4 solution) and acidified subsequently with
nitric acid. Addition of 700 mL of 10% solution of ammonia to the acidified solutions of Al
and P precursors resulted in the formation of a hydrogel. After 1 h, hydrogel was washed with
twice its volume of distilled water to remove any free base. The hydrogel was dried at 110 oC
for 16 h and calcined at 500 oC in air for 0.5 h.
2.2.1.4 Preparation of Supported Platinum catalysts
Chloroplatinic acid hexahydrate (H2PtCl6. 6H2O) was used as the platinum precursor
for the preparation of supported platinum catalysts. Incipient wetness impregnation method
was followed to impregnate the aqueous solutions of platinum precursor on the afore-
mentioned supports. The loading amount of platinum was fixed to 2 wt%. The supports were
crushed and sieved to the powder form. After impregnation, the catalysts were dried at 110 ᵒC
overnight and calcined at 350 ᵒC for 5 h in air. The as-prepared catalysts in the present
chapter are designated as 2Pt/ZrO2, 2Pt/S-ZrO2, 2Pt/γ-Al2O3, 2Pt/AlPO4, 2Pt/C and 2Pt/YZ.
2.2.2 Catalyst characterization
X-ray diffraction (XRD) patterns of all the catalysts were recorded using the Rigaku
Miniflex Diffractometer using graphite filtered Cu Kα (λ = 0.15406 nm) radiation. Every
XRD pattern was collected in steps of 0.045ᵒ in the 2θ range ranging between 2ᵒ to 65ᵒ with a
count time of 0.5 s. Joint Committee on Powder Diffraction Standards (JCPDS) files were
used to identify the crystalline phases of these catalysts.
The surface areas of the calcined catalysts were calculated from N2 adsorption
isotherms measured at −196 °C by the multipoint BET method using Autosorb 1
(Quantachrome instruments, USA).

Chapter 2
48 | P a g e
Temperature programmed desorption of ammonia (NH3-TPD) analysis of the
catalysts was studied using AutoChem 2910 (Micromeritics, USA) instrument. To obtain a
TPD profile of the catalyst, 100 mg of dried sample was taken in a U shaped quartz sample
tube and pretreated by passage of high purity (99.995%) helium (50 mL min−1) at 200 °C for
1 h. Later, the sample was saturated with highly pure anhydrous ammonia (50 mL min−1)
with a mixture of 10% NH3–He at 80 °C for 1 h and subsequently flushed with He flow (50
mL min−1) at 80 °C for 30 min to remove physisorbed ammonia. TPD analysis was carried
out from ambient temperature to 800 °C at a heating rate of 10 °C/min. The amount of NH3
desorbed was calculated using GRAMS/32 software.
CO chemisorption technique was carried out on AutoChem 2910 (Micromeritics,
USA) instrument. Prior to adsorption measurements, 100 mg of the dried sample was reduced
in a flow of hydrogen (50 mL/min) at 300 °C for 3 h and flushed out subsequently in a pure
helium gas flow for an hour at 300 °C. The sample was subsequently cooled to ambient
temperature in the same He stream. CO uptake was determined by injecting pulses of 9.96%
CO balanced helium from a calibrated on-line sampling valve into the helium stream passing
over the reduced samples at 300 °C.
The Dispersion (D) of the active fraction of a catalyst, metal surface area of catalyst (Scat),
metal area of platinum (Spd) and mean particle size (d) can be expressed by the following
equations 1, 2, 3 and 4 respectively,
D = Ns/Ntot …………………………………………….. (1)
Where Ns represent the number of active atoms exposed at the catalyst surface and Ntot is the
total number of active atoms present in the catalyst.
Scat (m2/gcat) = MolCO . NA . SF/A . 103 …………………. (2)
Where MolCO represents molecules of CO experimentally consumed per unit mass of catalyst
(MolCO = μmolCO/gcat),

Chapter 2
49 | P a g e
NA is Avogadro’s number (NA = 6.023 x 10²³/mol),
SF is stoichiometric factor (SF = 1),
A represents number of surface atoms per square meter of the poly crystalline platinum
surface (A = 1.54 x 10¹⁹)
Spd (m2/gpd) = Scat .100/Wpd …………………………… (3)
Where Wpd represents percentage of platinum (Wpd = wt%)
d (nm) = 6000/Spd . ρ …………………………………… (4)
Where ρ denotes the density of platinum (ρ = 21.4 gm/cm3).
Metal surface area, percentage dispersion of platinum and Pt average particle size
were calculated assuming the stoichiometric factor (CO/Pt) as 1. Adsorption was deemed to
be complete after three successive runs showed similar peak areas. The difference between
the area of the peak at saturation and the area of the peaks prior to saturation was attributed to
the irreversible uptake of CO by the sample.
Temperature programmed reduction (TPR) experiments were carried out on
AutoChem 2910 (Micromeritics, USA) instrument. In a typical experiment ca. 100 mg of
oven dried sample (dried at 100 °C for 12 h) was taken in a U-shaped quartz sample tube.
Prior to TPR studies, the catalyst sample was pretreated in an inert gas (Argon, 50 mL/min) at
200 °C. After pretreatment, the sample was cooled to ambient temperature and the carrier gas
consisting of 5% hydrogen balance argon (50 mL/min) was allowed to pass over the sample
raising the temperature from ambient to 400 °C heating at the rate of 10 °C /min. The vapours
produced during the reduction were condensed in a cold trap immersed in liquid nitrogen and
isopropanol slurry. The hydrogen concentration in the effluent stream was monitored with the
TCD and the areas under the peaks were integrated using GRAMS/32 software.
The FTIR spectral analysis of pyridine adsorbed catalysts was carried out to identify
the Brønsted and Lewis acid sites. Prior to pyridine adsorption, the catalysts were flushed

Chapter 2
50 | P a g e
with N2 flow at 300 °C for 1 h to remove moisture from the samples. Pyridine was adsorbed
on these activated catalysts at 120 °C until saturation. After such activation the samples were
cooled to room temperature. The IR spectra were recorded using a IR (model: GC-FTIR
Nicolet 670) spectrometer by KBr disc method under ambient condition.
Transmission electron microscopy (TEM) images were taken on a JEOL model of
1010 microscope operated at 100 kV. Samples for TEM analysis were prepared by adding 1
mg of reduced sample to 5 mL of methanol followed by sonication for 10-20 min. A few
drops of suspension were placed on a carbon coated copper grid for TEM imaging.
Surface morphology of the catalyst materials was imaged using scanning electron
microscopy (SEM). The samples were prepared by mounting the catalyst on an aluminium
support using a double adhesive tape, coated with gold and observed in Hitachi S-520 SEM
instrument.
2.2.3 Catalyst Testing
Hydrogenolysis of glycerol (> 99% MERCK Chemicals) was carried out over the
catalysts in a vertical down-flow glass reactor with an inner diameter of 9 mm operating
under normal atmospheric pressure. In the typical reaction ca. 500 mg of the catalyst, diluted
with double the amount of quartz grains was packed between the layers of quartz wool. The
upper portion of the reactor was filled with glass beads, which served as pre-heater for the
reactants. Prior to the reaction, the catalyst was reduced in a flow of hydrogen (100 mL/min)
at 350 ᵒC for 2 h. After cooling down to the reaction temperature (260 ᵒC), hydrogen (140
mL/min) and an aqueous solution of 10 wt% glycerol were introduced into the reactor
through a heated evaporator. The liquid products were collected in a condenser in order to be
analysed every 60 min by GC fed. The reaction products were analysed by Shimadzu-GC
2014 gas chromatograph equipped with a DB-wax capillary column with a flame-ionization

Chapter 2
51 | P a g e
detector (FID). The conversion of glycerol and selectivity of products were calculated as
follows:
Conversion (%) =moles of glycerol (in) − moles of glycerol (out)
moles of glycerol (in) × 100
Selectivity (%) =moles of one productmoles of all products
× 100
2.3 Results and discussion
2.3.1 Characterization of catalysts
2.3.1.1 X-ray diffraction (XRD) studies
XRD patterns of all the catalysts were collected to identify the crystalline phases
present in the samples and the results are shown in Figure 2.1. All the XRD patterns exhibit
the diffraction peaks corresponding to both Pt as well as the support, but it was found that the
Pt peaks were quite intense on few supports and less prominent on other supports even
though the amount of platinum was nearly the same. 2Pt/ZrO2 catalyst synthesized in the
present study exhibited monoclinic and tetragonal phases of ZrO2. X-Ray reflections
observed (2θ) at 24.2o (3.676 Å), 28.2 (3.16 Å), 31.5 (2.84 Å), and 55.65°(1.65 Å)
corresponds to the monoclinic phase of zirconia, while the X-Ray reflections observed at 2θ
34.46o (2.96 Å), 35.3° (2.60 Å), 50.37° (2.54 Å), and 55.65°(1.81 Å) corresponds to the
tetragonal zirconia [48]. In contrast, S-ZrO2 displayed diffraction peaks at 24.1°, 28.3°,
31.5°, 34.3°, 49.4°, 51.3°, and 61.5° characteristic of tetragonal phase, while the peaks
corresponding to the monoclinic phase were not identified. These results demonstrated that
sulphate ions played a vital role in modifying the type of zirconia phase formation and tend to
stabilize zirconia in the tetragonal phase, similar to the previous reports [49].

Chapter 2
52 | P a g e
Figure 2.1: XRD patterns of various supported platinum catalysts
In the case of 2Pt/Al2O3, the X-ray reflections observed at 39.4° (2.39 Å) and 45.86°
(2.28 Å) were assigned to (311) and (400) crystalline planes of γ–Al2O3 respectively as can
be seen from Figure 2.1 [50]. AlPO4 exist mainly as an amorphous phase which was
confirmed by a broad peak at 2θ=21° (4.226 Å) [51]. XRD pattern of 2Pt/C confirms the
existence of crystalline phases of platinum on carbon by the X-ray reflections observed at
2θ=39.7°, 46.1° and 67.4°corresponding to the (111), (200) and (220) crystalline planes of
platinum respectively. The XRD pattern of Y-Zeolite exhibits its most intense diffraction
peaks between 2θ=2° to 25°, thus confirms its crystalline nature and found to be in agreement
with standard XRD pattern reported earlier [52]. However, X-ray reflections that correspond
to metallic platinum observed at 39.7° (111) and 46.1° (200) were smaller and broad.
Therefore, the XRD results suggest that the size of the platinum crystallites on various
supports was found to be non-uniform. The crystallite sizes (nm) of all catalysts estimated by
using Debye-Scherer equation are presented in Table 2.2.

Chapter 2
53 | P a g e
2.3.1.2 Fourier Transform Infrared spectroscopy (FTIR)
FTIR spectroscopic analyses of various supported platinum catalysts were carried out
to study the nature of surface oxide/hydroxyl groups and the results are shown in Figure 2.2.
The broad peaks observed at 3,419 cm−1 and 1630 cm-1 were assigned to the O-H stretching
and bending vibrations in 2Pt/ZrO2 catalyst. In case of 2Pt/S-ZrO2, the peak observed at 1360
cm-1 was attributed to the S=O asymmetric stretching vibration and this clearly shows the
presence of sulphated zirconia. Gamma alumina supported platinum catalysts exhibit a broad
band centred around 3461 cm-1, which was due to the surface hydroxyl groups OH stretching
vibration. Few additional peaks were seen in the region between 1100 to 1700 cm-1, which
may be due to the physisorbed water within the mesopores of alumina [53]. FTIR spectral
data of carbon supported platinum also exhibit a broad band at 3450 cm-1 as a result of O-H
stretching vibration present in the hydroxyl groups and adsorbed water. The carbon–carbon
stretching vibration from the carbon support appeared at 1500 cm-1 and this spectrum is
characteristic for activated carbon [54]. 2Pt/YZ catalyst exhibit multiple vibrational peaks at
1020, 791, 573 cm-1 due to the zeolite crystalline structure and O-H stretching frequencies
observed at 3594 cm-1.

Chapter 2
54 | P a g e
Figure 2.2: FT-IR spectra of various supported platinum catalysts
2.3.1.3 Scanning electron microscopy (SEM)
SEM imaging of all the supported platinum catalysts was carried out to study the
morphology and surface topography of the catalysts. As shown in Figure 2.3, SEM images
of 2Pt/ZrO2 catalyst showed that the particles are non-uniform, spherical in shape and the size
of the particles are smaller than the supports. In contrast, the particles in 2Pt/S-ZrO2 catalyst
were much smaller and appear as smooth agglomerates. SEM images of 2Pt/γ–Al2O3 and
2Pt/AlPO4 showed larger size agglomerated fine particulate matter. In case of 2Pt/AC
catalyst, it is clearly seen the fibrous structure with spherical edges and different variation of
pores. SEM images of 2Pt/YZ catalyst exhibited evenly distributed spherical crystallites
along with some intergrowth.

Chapter 2
55 | P a g e
a. 2Pt/ZrO2 b. 2Pt/S-ZrO2
c. 2Pt/Al2O3 d. 2Pt/AlPO4
e. 2Pt/AC f. 2Pt/YZ
Figure 2.3: SEM images of various supported platinum catalysts
2.3.1.4 BET surface area
The surface area and other textural properties of all the supported platinum catalysts
were measured from nitrogen physisorption and the results are given in Table 2.1. The BET
surface areas of the catalysts follow the order: Pt/C > Pt/YZ > Pt/AlPO4 > Pt/γ–Al2O3 >
Pt/ZrO2 > Pt/S-ZrO2. As compared to the pure supports, surface areas of the platinum
impregnated catalysts were found to be decreased due to the fact that the impregnation of
platinum caused the blockage of the pores of the support. Since platinum and the support are
the two major active sites for the glycerol hydrogenolysis, its distribution and dispersion on
the support tends to provide increased metal-support interaction. As the loading amount of

Chapter 2
56 | P a g e
platinum was kept constant at 2 wt%, the support essentially played a key role in controlling
the particle size of Pt and uniform dispersion. Thus, it is anticipated that the superior
performance of catalyst would be related to the small Pt particle size with more number of Pt
active species on the catalyst surface. Furthermore, the surface acidity of the support,
distribution of the acidic sites on the surface and the interaction of these sites with platinum
plays a key role in glycerol hydrogenolysis as it proceeds via two step dehydration–
hydrogenation mechanism [55].
Table 2.1: Results of Temperature-Programmed Desorption and BET surface area of various supported platinum catalysts
* Calculated from temperature programmed desorption of NH3; A= due to weak acidic sites; B = due
to moderate acidic sites; C = due to strong acidic sites.
2.3.1.5 Temperature-programmed desorption of ammonia (NH3-TPD)
Since surface acidity of the catalysts play a key role in glycerol hydrogenolysis
reaction, it is very important to estimate the strength of surface acidic sites. Temperature
programmed desorption of base molecules like ammonia and pyridine provide a method to
determine the acidity of solid catalysts as well as acid strength. This method is reliable and
provides a better understanding of the catalysts. Ammonia is the common probe molecule
used in these studies due to its high basicity (pKa = 9.2), small molecular size and thermal
stability [56]. The results of the ammonia TPD profiles of the supported platinum catalysts
Catalyst
(2wt %)
BET surface
area (m2/g)
NH3 uptake* (µmol/g)
A B C Total NH3
uptake*(µmol/g)
Pt/ZrO2 85 5.67 82.75 -- 88
Pt/S-ZrO2 50 44.52 -- 110.82 155
Pt/ γ–Al2O3 132 176.22 146.33 -- 322
Pt/AlPO4 165 1529 -- -- 1529
Pt/C 1126 4.01 36.49 -- 40
Pt/YZ 677 157.71 117.15 -- 274

Chapter 2
57 | P a g e
are presented in Figure 2.4 and NH3 uptake volumes are given in Table 2.1. Depending upon
the temperature range of NH3 desorption, classification of the type of acidic sites present on
the surface is usually made. In general, the strength of acidic sites can be categorized into
weak, moderate and strong acid sites when the NH3 desorption temperature ranges between
150–300 oC, 300–450 oC and 450–650 oC respectively [57]. The desorbed ammonia (µmol/g)
in each specific range will be estimated and this parameter corresponds to the number of
weak, moderate and strongly acidic sites. It can be seen from Table 2.1 that 2Pt/ZrO2, 2Pt/γ–
Al2O3, 2Pt/C and 2Pt/YZ exhibit weak acidic sites and moderate acidic sites distributed in
two different temperature regions. However, 2Pt/S-ZrO2 possesses stronger acidic sites in
addition to the weak acidic sites. In contrast, 2Pt/AlPO4 was found to have only weak acidic
sites, but the number of acid sites was much higher than any other material. NH3-TPD results
clearly indicate that there is variation of the kind of acidic sites observed in each catalyst as
well as their strength. Therefore, these results provides an insight about how different acid
sites as well as their strength of various catalyst supports effects the glycerol hydrogenolysis
for the selective formation of 1,3-PDO.

Chapter 2
58 | P a g e
Figure 2.4: NH3-TPD profiles of various supported platinum catalysts
2.3.1.6 Pyridine adsorbed Fourier Transform Infrared spectroscopy (Pyr FTIR)
NH3-TPD method generally provides the type of acid sites as well its strength,
but it cannot distinguish Brønsted (B) and Lewis (L) acid sites. Pyridine is a probe molecule
that can bind with both these acid sites, and their binding on each site can be discriminated by
recognizing the adsorption bonds formed between the site and pyridine molecule using FTIR
spectroscopy which can be further quantified. Prior to FTIR analysis, all the supported Pt
catalysts were kept in a flow of pyridine atmosphere, so as to adsorb pyridine on each acidic
site and FTIR analysis of these materials was carried out. The resultant spectra are shown in
Figure 2.5. Pyridine adsorption at Brønsted acid sites usually appear in the region of 1540–
1548 cm−1, while pyridine adsorption on Lewis acid sites appear in the region of 1445–1460
cm−1 [55]. As can be seen from Figure 2.5, 2Pt/ZrO2 catalyst showed high concentration of
Lewis acid sites as compared to the Brønsted acid sites. In contrast, 2Pt/S-ZrO2 exhibited
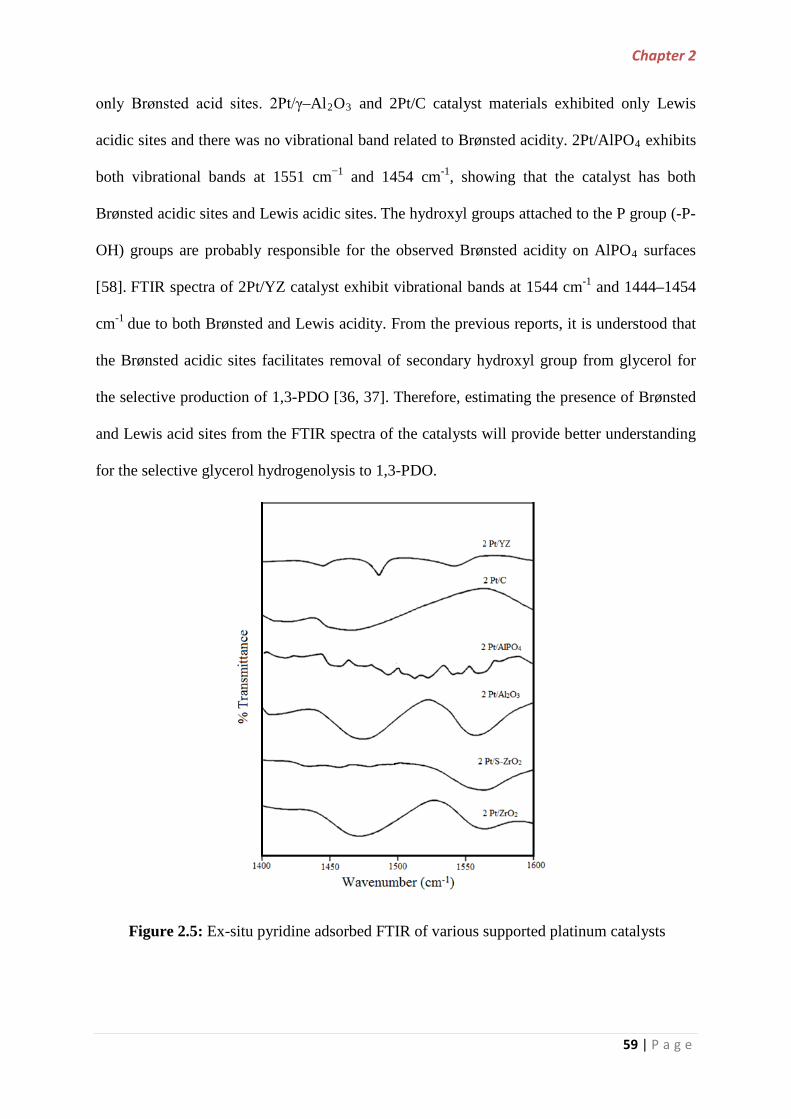
Chapter 2
59 | P a g e
only Brønsted acid sites. 2Pt/γ–Al2O3 and 2Pt/C catalyst materials exhibited only Lewis
acidic sites and there was no vibrational band related to Brønsted acidity. 2Pt/AlPO4 exhibits
both vibrational bands at 1551 cm−1 and 1454 cm-1, showing that the catalyst has both
Brønsted acidic sites and Lewis acidic sites. The hydroxyl groups attached to the P group (-P-
OH) groups are probably responsible for the observed Brønsted acidity on AlPO4 surfaces
[58]. FTIR spectra of 2Pt/YZ catalyst exhibit vibrational bands at 1544 cm-1 and 1444–1454
cm-1 due to both Brønsted and Lewis acidity. From the previous reports, it is understood that
the Brønsted acidic sites facilitates removal of secondary hydroxyl group from glycerol for
the selective production of 1,3-PDO [36, 37]. Therefore, estimating the presence of Brønsted
and Lewis acid sites from the FTIR spectra of the catalysts will provide better understanding
for the selective glycerol hydrogenolysis to 1,3-PDO.
Figure 2.5: Ex-situ pyridine adsorbed FTIR of various supported platinum catalysts

Chapter 2
60 | P a g e
2.3.1.7 CO-chemisorption
CO chemisorption studies of the supported platinum catalysts were carried out to
estimate the Pt dispersion, active platinum surface area and active particle size of various
supported platinum catalysts and the results are given in Table 2.2. As mentioned earlier,
metal dispersion on different supports play a vital role in controlling the catalytic activity,
therefore this study provides an insight on how each support controls the dispersion of
platinum and its size. Moreover, smaller size and better dispersion provide much metal–
support interaction, which has its significant effect in reaction like glycerol hydrogenolysis.
Table 2.2: Results of CO uptake, dispersion, metal area and average crystallite size of
various supported platinum catalysts
Catalyst
(2 wt%)
Dispersion
(%)
CO uptake
(µmol/g)
Metal area
(m2/g)cat
Particle
sizea (nm)
Particle
sizeb (nm)
Crystallite
sizec (nm)
Pt/ZrO2 4.9 5.11 0.246 22.6 20.4 16.5
Pt/S-ZrO2 6.5 6.71 0.323 17.2 18.3 14.7
Pt/ γ–Al2O3 19.6 20.12 0.969 5.7 6.5 11.0
Pt/AlPO4
Pt/C
Pt/YZ
58
12.3
22.4
39.9
12.66
23.06
2.74
0.610
1.111
4.8
9.1
5.0
5.02
8.8
5.3
8.2
10.2
11.0
a=determined from CO uptake values; b= determined from TEM analysis; c=determined from XRD.
Among all the catalysts, 2Pt/AlPO4 catalyst showed very high metal dispersion when
the loading of Pt was kept at 2 wt%. 2Pt/YZ and 2Pt/γ–Al2O3 showed reasonable dispersion,
while 2Pt/ZrO2 and 2Pt/S-ZrO2 showed very poor dispersion. NH3-TPD analysis showed that
smaller size platinum particles and very high dispersion of 2Pt/AlPO4 catalyst allow it to be
the most active catalyst for glycerol hydrogenolysis. The low dispersion of platinum on the
supports might result in the poor catalytic activity. The results suggest show that a good
correlation exists between CO-chemisorption capacities of the catalysts and the activities of
glycerol hydrogenolysis. Thus CO-chemisorption is found to be a valuable method to study

Chapter 2
61 | P a g e
the metal-support interaction of these catalysts and the obtained results are in agreement with
the BET surface area measurements. The correlation will become significant if 2Pt/AlPO4
catalyst displays high selectivity towards 1, 3-PDO formation from glycerol.
2.3.1.8 Transmission electron microscopy (TEM)
To estimate the particle size of platinum on each support, TEM imaging of all the
catalysts was carried out and the images are shown in Figure 2.6. As can be seen from Figure
2.6, the particle size of platinum varied on different supports. 2Pt/ZrO2 catalyst has larger
size platinum particles with an average size of up to 20.4 nm.
2Pt/ZrO2 0 10 20 30 40 50 60
Pl
atin
um (%
)
Pt particles
2Pt/ZrO2Mean size (20.4 nm)
2Pt/S-ZrO2 10 15 20 25 30
Plati
num
(%)
Pt particles
2Pt/S-ZrO2Mean size (18.3 nm)
2Pt/Al2O3 0 2 4 6 8 10 12 14
Plati
num
(%)
Pt particles
2Pt/Al2O3Mean size (6.5 nm)

Chapter 2
62 | P a g e
Figure 2.6: TEM images of various supported platinum catalysts
The average particle sizes estimated from the TEM images of the 2Pt/S-ZrO2, 2Pt/γ-
Al2O3 2Pt/AlPO4, 2Pt/C and 2Pt/YZ materials were found to be 18.3 nm, 6.5 nm, 8.8 nm
respectively. Smaller size platinum particles were observed in case of 2Pt/AlPO4 and 2Pt/YZ
catalysts, with an average size around 5 and 5.3 nm suggesting that Pt particles are in highly
dispersed state. The increase in the particle size indicates the decrease in the dispersion and
2Pt/AlPO4
2Pt/C
2Pt/YZ
0 2 4 6 8
Platinum
(%)
Pt particles
2Pt/AlPO4Mean size (5.02 nm)
0 2 4 6 8 10 12 14
Plat
inum
(%)
Pt particles
2Pt/CMean size (8.8 nm)
0 2 4 6 8 10
Plat
inum
(%)
Pt particles
2Pt/YZMean size (5.3 nm)

Chapter 2
63 | P a g e
formation of bigger particles. The TEM data correlate with results of XRD and CO
chemisorption measurements.
2.3.1.9 Temperature programmed reduction experiments (TPR)
Temperature-programmed reduction of supported platinum catalysts was carried out
to understand the reducible temperature of platinum on the catalysts and the results are shown
in Figure 2.7. The hydrogen uptake values are presented in Table 2.3. The TPR results give
an insight about the effect of metal loading on the reducibility and to understand the degree of
interaction between platinum and the various supports. In addition, the hydrogen
consumption for pure platinum is also evaluated from TPR and included as a reference in
Table 2.3. All the catalyst materials exhibit a major reduction peak between 270 oC to 485 oC.
However, Tmax was found to be well within the range reported for the complete reduction of
PtO2 into platinum [59]. 2Pt/ZrO2, 2Pt/C and 2Pt/YZ catalysts exhibit their reduction peaks
at 328 oC, 274 oC and 394 oC respectively, which was attributed to the reduction of anionic Pt
precursor to metallic Pt [60, 61].
TPR analysis of 2Pt/AlPO4 exhibited a reduction peak observed at 359 oC [62]. In
case of 2Pt/γ-Al2O3 catalyst, Tmax was observed at 396 oC, which was probably due to the
reduction of Pt oxychlorinated species that is usually reduced at high temperature. [63].
Among all the catalysts, Pt on sulfated zirconia required very high temperature to be reduced,
which was probably due to the passivation of platinum surface by the sulphate ions.
However, a smaller reduction peak observed below 484 oC may be attributed to H2S
evolution by the hydrogen reduction of sulfate species [64]. It is interesting to note that a shift
of Tmax position towards low temperature region was observed in case of 2Pt/C and
2Pt/AlPO4 catalysts which indicate strong metal-support interaction. Therefore, the reduction
temperatures obtained from H2-TPR profiles imply that the nature of support had a strong
effect on the reducibility of platinum species.

Chapter 2
64 | P a g e
Figure 2.7: TPR profiles of various supported platinum catalysts
Table 2.3: Results of Temperature Programmed Reduction of various supported platinum
catalysts
Catalyst
(2 wt %)
T max
(oC)
H2 Consumption
µ mol/g
Pt/ZrO2 328 86.9
Pt/S-ZrO2 484 602.4
Pt/Al2O3 396 220.5
Pt/AlPO4 359 130.5
Pt/C 274 236.9
Pt/YZ
Pt
394
154
88.2
1262
2.3.2 Catalytic performance
The catalytic performance of all the supported Pt catalysts synthesized in the
present work were screened for hydrogenolysis of glycerol in vapour phase and in particular
their performance towards 1,3-PDO selectivity. Support material plays a significant role in

Chapter 2
65 | P a g e
Pt/ZrO2 Pt/S-ZrO2 Pt/Al2O3 Pt/AlPO4 Pt/C Pt/YZ0
20
40
60
80
100
0
20
40
60
80
100
Reaction conditions: Reaction temperature = 230 oC; H2 Flow rate = 60 mL/min, WHSV - 2.09 h-1.1,2-PDO=1,2-propanediol;1,3-PDO=1,3-propanediol;HA=hydroxyacetone;1-PrOH=1-propanol;2-PrOH=2-propanol;Others include methanol, ethanol and acetone.
Selec
tivity
(%)
Conv
ersio
n (%
)
Catalysts
Conversion of glycerol selectivity of 1,3-PDO Selectivity of 1,2-PDO Selectivity of 1-PrOH Selectivity of 2-PrOH Selectivity of HA Selectivity of Others
regulating the activity of the catalyst. As discussed in the previous section, it is clearly seen
that all the support materials interacted with the platinum particles in a different manner,
which surely plays an important role in defining the activity of the catalyst. Figure 2.8 present
the results of the glycerol hydrogenolysis including glycerol conversion and product
selectivity at the reaction condition of 230 ºC, 60 mL/min H2 flow rate and atmospheric
pressure (0.1 MPa). All catalysts have presented moderate to high activity during glycerol
hydrogenolysis. The conversion of glycerol was increased up to 100% in the case of
2Pt/AlPO4 and 2Pt/YZ whereas 2Pt/ γ-Al2O3 showed low conversion of 55%. In terms of
product selectivity, the obtained results were significantly different. The major products of
glycerol hydrogenolysis are mainly 1, 2-PDO, 1,3-PDO, hydroxyacetone, propanols and
degradation products such as methanol, ethanol, propane and acetone.
Figure 2.8: Effect of various supported platinum catalysts on glycerol hydrogenolysis

Chapter 2
66 | P a g e
From the detailed kinetic studies, it was reported that glycerol hydrogenolysis to
produce 1,3-PDO usually proceed via a two-step mechanism, consisting of dehydration and
hydrogenation [8, 38, 46, 65]. Acidic sites from the support catalyse the dehydration of
glycerol to produce 3-hydroxypropionaldehyde (3-HPA), while metal sites catalyse the
hydrogenation of 3-HPA to give 1,3-PDO. Among all the catalysts 2Pt/S-ZrO2 and
2Pt/AlPO4 exhibited high activity towards glycerol hydrogenolysis as well as 1,3-PDO
selectivity under the present reaction conditions. Between these two catalysts, the activity of
2Pt/S-ZrO2 was not as high as that of 2Pt/AlPO4 probably because of the low dispersion of
platinum over S-ZrO2 as compared to AlPO4 support. Both 2Pt/ZrO2 and 2Pt/γ-Al2O3
catalysts exhibited poor activity towards glycerol conversion and achieved 6.7 and 7.8%
selectivities towards 1,3-PDO respectively. In addition, 2Pt/C (86%) and 2Pt/YZ (100%)
attained high glycerol conversions but showed less 1,3-PDO selectivity.
It was observed that aluminium phosphate supported platinum catalyst possessing
high strength weak acidic sites resulted in highest selectivity towards 1, 3-propanediol (9.5%)
compared with the other catalysts. Interestingly, it was evidenced from NH3-TPD results that
2Pt/AlPO4 catalysts contain weak acid sites dominantly and no strong acid sites were present
as compared to those of other catalysts. Therefore, it is understood that the dehydration of
glycerol to 3-hydroxypropanal was favoured by the weak acid sites of the support and further
hydrogenation of the resultant 3-hydroxypropanal over platinum gives 1, 3-propanediol. The
obtained results in the present study are in good agreement with the findings of Feng et. al.
mentioning that the weak acid sites of Cu/ZnO/MOx catalysts favoured the production of
1,3-PDO during gas phase glycerol hydrogenolysis performed at 240–300 ºC and 0.1 MPa of
H2 [47]. The better dispersion of platinum on aluminium phosphate support as revealed from
the results of BET surface area, TEM and CO-chemisorption studies also accounts for the
high activity of 2Pt/AlPO4 catalyst towards the glycerol hydrogenolysis (Figure 2.8).

Chapter 2
67 | P a g e
However, the collective results show that the reaction temperature 230 ºC and a H2 flow rate
of 60 mL/min was not effective enough to promote this reaction in order to achieve good
glycerol conversions and high selectivities towards the desired product.
Scheme 2.1: Reaction scheme for production of 1, 3-propanediol from glycerol
hydrogenolysis
2.3.2.1 Effect of hydrogen flow rate on glycerol hydrogenolysis
In an effort to improve the activity of glycerol hydrogenolysis over supported
platinum catalysts with respect to conversions and product selectivities, further experiments
were conducted at constant temperature (230 ºC) and increasing H2 flow rate from 60
mL/min to 140 mL/min. The effect of H2 flow rate on glycerol conversion and selectivity
towards various products during glycerol hydrogenolysis is presented in Figure 2.9. There
was a gradual increase in the glycerol conversion with increase in H2-flow rate [66]. When
H2-flow rate was increased to 140 mL/min, 2Pt/ZrO2, 2Pt/S-ZrO2, 2Pt/γ-Al2O3 and 2Pt/C
catalysts resulted in increase in the glycerol conversions from 68% to 85%, 75% to 100%,
55% to 68% and 86% to 89% respectively. But glycerol conversion intensely decreased from
100% to 61% and 76%, respectively in case of 2Pt/AlPO4 and 2Pt/Y-zeolite catalysts.

Chapter 2
68 | P a g e
Figure 2.9: Effect of H2 Flow rate on hydrogenolysis of glycerol over various supported
platinum catalysts.
With respect to selectivity, 2Pt/AlPO4 catalyst displayed high 1, 3-PDO selectivity
(16.7%), (Figure 2.9) and hindered the formation of 1-PrOH/2-PrOH by sequential
hydrogenolysis. As hydrogen is one of the reactants in glycerol hydrogenolysis reaction, its
concentration is an important factor in controlling the catalytic performance. Therefore, it is
obvious that increase in H2-flow rate results in high glycerol conversion and 1,3-PDO
selectivity due to the availability of more number of Pt sites for the hydrogenolysis of
glycerol during the reaction. All the other supported platinum catalysts favoured the
formation of large amounts of propanols and showed moderate activity towards 1,3-PDO
selectivity. A possible elucidation for the difference in product selectivities observed for the
various supported platinum catalysts depend on the nature of support materials which is
related to metal-support interaction and the difference in acidity of the support. Moreover, the
Pt/ZrO2 Pt/S-ZrO2 Pt/Al2O3 Pt/AlPO4 Pt/C Pt/YZ0
20
40
60
80
100
0
20
40
60
80
100
Reaction conditions: Reaction temperature = 230 oC; H2 Flow rate =140 mL/min, WHSV - 2.09 h-1.1,2-PDO=1,2-propanediol;1,3-PDO=1,3-propanediol;HA=hydroxyacetone;1-PrOH=1-propanol;2-PrOH=2-propanol; Others include methanol, ethanol and acetone
Selec
tivity
(%)
Conv
ersio
n (%
)
Catalysts
Conversion of glycerol Selectivity of 1,3-PDO Selectivity of 1,2-PDO Selectivity of 1-PrOH Selectivity of 2-PrOH Selectivity of HA Selectivity of Others

Chapter 2
69 | P a g e
results from BET surface area, CO-chemisorption and NH3-TPD studies are well correlated
with the catalytic performance of various supported platinum catalysts during glycerol
hydrogenolysis reaction.
2.3.2.2 Effect of reaction temperature on glycerol hydrogenolysis
In addition, the reaction of glycerol hydrogenolysis was further investigated by
increasing the reaction temperature to 260 ºC under normal atmospheric pressure (0.1MPa)
and 140 mL/min H2 flow rate over various supported platinum catalysts. The results
demonstrated a significant effect of reaction temperature on the catalytic activity and shown
in Figure 2.10. Among all other supported platinum catalysts, the performance of 2Pt/AlPO4
catalyst was comparatively high. Substantially, the glycerol conversion gradually increased
from 61% to 100% and the selectivity of 1, 3-PDO has remarkably increased from 16.7% to
35.4% when the reaction temperature was increased from 230 ºC to 260 ºC. In a previous
study reported by Feng et. al. an increase in the selectivity of 1,3-propanediol was observed
with rise in reaction temperature [47]. Therefore, it can be concluded that the high
performance of 2Pt/AlPO4 catalyst over other catalysts was probably due to the higher
dispersion of Pt on AlPO4 (Table 2.2) and also due to the presence of weak acidic sites
brought by the support required for the dehydration of glycerol (i.e. for C-O cleavages).

Chapter 2
70 | P a g e
Figure 2.10: Effect of Temperature on hydrogenolysis of glycerol over various supported
platinum catalysts.
In comparison, all the other supported platinum catalysts showed decreased selectivity
towards propanediols but increased formation of over hydrogenolysis products (1-PrOH/2-
PrOH) was observed. These results suggested that excessive hydrogenation was favoured at
higher temperatures by reducing the production of 1, 2-PDO and 1, 3-PDO. In general, it is
known that acidity of catalyst in particular, Brønsted acidity is necessary for optimal
conversion glycerol to 1, 3-PDO. However, sulfated zirconia and Y-zeolite supported
platinum catalysts resulted in decreased 1,3-PDO selectivity and glycerol conversion even
though the catalysts possessed Brønsted acidic sites. This can be attributed to the reduced
dispersion of platinum and appropriate interaction between support and metal as well as the
Pt/ZrO2 Pt/S-ZrO2 Pt/Al2O3 Pt/AlPO4 Pt/C Pt/YZ0
20
40
60
80
100
0
20
40
60
80
100
Reaction conditions: Reaction temperature = 260 oC; H2 Flow rate =140 mL/min, WHSV - 2.09 h-1.1,2-PDO=1,2-propanediol;1,3-PDO=1,3-propanediol;HA=hydroxyacetone;1-PrOH=1-propanol;2-PrOH=2-propanol; Others include methanol, acetone and ethanol.
Selec
tivity
(%)
Co
nver
sion
(%)
Catalysts
Conversion of glycerol Selectivity of 1,3-PDO Selectivity of 1,2-PDO Selectivity of 1-PrOH Selectivity of 2-PrOH Selectivity of HA Selectivity of Others

Chapter 2
71 | P a g e
Pt agglomeration, as evidenced from the XRD, TEM, BET-surface area analysis, and CO-
chemisorption measurements.
From the previous literature it is well understood that the selective formation of 1, 3-
PDO is highly favoured by the presence of weak acidic sites [47] and Brønsted acidity of the
catalyst [38]. In the present study, the catalytic activity of supported platinum catalysts is well
correlated with the Pt dispersion and acidity of the catalysts. Among various supported Pt
catalysts investigated, 2Pt/AlPO4 exhibited superior activity towards the selective formation
of 1, 3-PDO under same reaction conditions which significantly contributes to the fine
dispersion of Pt as well as high strength weak acid sites and Brønsted acidity of the catalyst.
This is clearly evident from the various characterization results such as CO-chemisorption,
NH3-TPD and Pyr-FTIR measurements.
On the other hand, all the other supported platinum catalysts are comparatively less
selective towards 1,3-PDO because of poor dispersion of Pt over the support materials,
although appropriate weak acidic sites are present in the catalysts. Therefore, it is clear that
the combined properties of a catalyst such as high surface area, greater stability, well
dispersed metal over support and appropriate acid/base property are essential in achieving
best performance in the glycerol hydrogenolysis. Hence, the synergy between Pt and AlPO4
in view of its appropriate acid property, well dispersed Pt and strong metal support
interaction has enabled the hydrogenolysis of glycerol to produce 1, 3-PDO.
2.3.2.3 Time on stream studies
All the supported platinum catalysts except 2Pt/AlPO4 displayed less activity towards
1, 3-propanediol. 35.4% selectivity to 1, 3-propanediol was achieved over 2Pt/AlPO4 catalyst
at 100% glycerol conversion and further a time-on stream study has been carried out on
aluminium phosphate supported platinum catalyst to better understand the catalytic

Chapter 2
72 | P a g e
performance. As presented in Figure 2.11, the activity of 2Pt/AlPO4 catalyst in terms of
glycerol conversion and 1, 3-propanediol selectivity was studied over a period of 6 hours
reaction time. It is observed that there was increase in glycerol conversion during the second
hour, remained stable until 5th hour and there after decreased. However, 1,3-propanediol
selectivity gradually increased with increase in the reaction time, reached maximum (35.4%)
at 4th hour and there by declined after 4 hours. The decreased activity of 2Pt/AlPO4 catalyst
might be due to the possible catalyst deactivation caused by coke formation after certain
period of reaction time.
Figure 2.11: Time on stream studies of 2Pt/AlPO4 catalyst on glycerol hydrogenolysis

Chapter 2
73 | P a g e
2.4 Conclusions
The present chapter described vapour phase hydrogenolysis of glycerol over a series
of Pt loaded on zirconia, sulphated zirconia, alumina, aluminium phosphate, activated carbon
and Y-zeolite supported catalysts under atmospheric pressure.
• The role of catalyst support during glycerol hydrogenolysis was studied in detail and
confirmed that support acidity and metal dispersion are important in directing the
catalytic activity.
• From the screening of various supported platinum catalysts, 2 wt% Pt/AlPO4 was
found to be the most promising catalyst in terms of glycerol conversion and 1, 3-
propanediol production under the reaction parameters investigated.
• A selectivity of 35.4% towards 1,3‐PDO at 100% glycerol conversion was obtained
over 2Pt/AlPO4 catalyst under the optimized reaction conditions of 260 °C, 0.1 MPa
initial H2 pressure.
• The presence of weak acidic sites and Brønsted acidity in the catalyst remarkably
favoured the formation of 1, 3-propanediol, evidenced from NH3-TPD and Pyr-FTIR
studies.
• The good dispersion of platinum, small particle size and strong metal-support
interaction, revealed from CO-chemisorption, TEM and TPR studies sites facilitated
in the superior catalytic performance of 2Pt/AlPO4.
Taken together the influence of the support on the conversion of glycerol and the results
of the catalyst characterization, it can be concluded that AlPO4 was found to be the best
support for Platinum for glycerol hydrogenolysis under the conditions used in this study.

Chapter 2
74 | P a g e
References
[1] C. Chiu, M. A. Dasari, W. R. Sutterlin, G. J. Suppes, Ind. Eng. Chem. Res. 45 (2006)
791-795.
[2] A. Behr, J. Eilting, K. Irawadi, J. Leschinski, F. Lindner, Green Chem. 10 (2008) 13-30.
[3] A. Corma, G. W. Huber, L. Sauvanauda, P. O. Connor, J. Catal. 257 (2008) 163-171.
[4] T. Hirai, N. Ikenaga, T. Miyake, T. Suzuki, Energy Fuels. 19 (2005) 1761-1762.
[5] H. Atia, U. Armbrusterb, A. Martin, J. Catal. 258 (2008) 71-82.
[6] T. Miyazawa, Y. Kusunoki, K. Kunimori, K. Tomishige, J. Catal. 240 (2006) 213-221.
[7] Y. Nakagawa, K. Tomishige, Catal. Sci. Technol. 1 (2011) 179–190.
[8] Y. Nakagawa, M. Tamura, K. Tomishige, J. Mater. Chem. A. 2 (2014) 6688-6702.
[9] M. Balaraju, V. Rekha, B. L. A. P. Devi, R. B. N. Prasad, P. S. S. Prasad, N. Lingaiah,
Appl. Catal. A. 384 (2010) 107-114.
[10] P. N. Caley, R. C. Everett, US Pat (1967) 3 350 871 (DuPont).
[11] D. Zimmerman, R. B. Isaacson, US Pat (1974) 3 814 725 (Celanese Corp).
[12] M. Besson, P. Gallezot, A. Pigamo, S. Reifsnyder, Appl. Catal., A. 250 (2003) 117-124.
[13] J. Chaminand, L. A. Djakovitch, P. Gallezot, P. Marion, C. Pinel, C. Rosier, Green
Chem. 6 (2004) 359-361.
[14] D. G. Lahr, B. H. Shanks, J. Catal. 232 (2005) 386-394.
[15] I. Furikado, T. Miyazawa, S. Koso, A. Shimao, K. Kunimori, K. Tomishige, Green
Chem. 9 (2007) 582–588.
[16] A. Perosa, P. Tundo, Ind. Eng. Chem. Res. 44 (2005) 8535-8537.
[17] Y. Kusunoki, T. Miyazawa, K. Kunimori, K. Tomishige, Catal. Commun. 6 (2005) 645-
649.
[18] J. Feng, H. Fu, J. Wang, R. Li, H. Chen, X. Li, Catal. Commun. 9 (2008) 1458-1464.

Chapter 2
75 | P a g e
[19] V. P. Kumar, Y. Harikrishna, N. Nagaraju, K. V. R. Chary, Ind. J. Chem., Sect A. 53
(2014) 516-523.
[20] L. Ma, D. He, Z. Li, Catal. Commun. 9 (2008) 2489-2495.
[21] V. P. Kumar, A. Kumar, G. S. Rao, K. V. R. Chary, Cat. Today. DOI
10.1016/j.cattod.2014.03.036.
[22] T. Kurosaka, H. Maruyama, I. Naribayashi, Y. Sasaki, Catal. Commun. 9 (2008) 1360-
1363.
[23] Z. Yuan, P. Wu, J. Gao, X. Lu, Z. Hou, X. Zheng, Catal. Lett, 130 (2009) 261-265.
[24] M. A. Dasari, P. P. Kiatsimkul, W. R. Sutterlin, G. J. Suppes Appl. Catal., A. 281(2005)
225-231.
[25] L. C. Meher, R. Gopinath, S. N. Naik, A. K. Dalai, Ind. Eng. Chem. Res. 48 (2009)
1840-1846.
[26] C. Liang, Z. Ma, L. Ding, J. Qiu, Catal. Lett. 130 (2009) 169-176.
[27] S. Wang, H. C. Liu, Catal. Lett. 117 (2007) 62-67.
[28] Z. Huang, F. Cui, H. Kang, J. Chen, X. Zhang, C. Xia, Chemistry of Materials. 20
(2008) 5090-5099.
[29] S. Sato, M. Akiyama, K. Inui, M. Yokota, Chem. Letters. 38 (2009) 560-561.
[30] J. Dam, U. Hanefeld, ChemSusChem 4 (2011) 1017-1034.
[31] J. Sun, H. Liu, Green Chem. 13 (2011) 135-142.
[32] R. R. Davda, J. W. Shabaker, G. W. Huber, R. D. Cortright, J. A. Dumesic, Appl. Catal.,
B. 43 (2003) 13-26.
[33] J. Oh, S. Dash, H. Lee, Green Chem. 13 (2011) 2004-2007.
[34] L. Gong, Y. Lu, Y. Ding, R. Lin, J. Li, W. Dong, T. Wang, W. Chen, Appl. Catal. A.
390 (2010) 119-126.
[35] J. Dam, K. Djanashvili, F. Kapteijn, U. Hanefeld, ChemCatChem. 5 (2013) 497-505.

Chapter 2
76 | P a g e
[36] R. Arundhathi, T. Mizugaki, T. Mitsudome, K. Jitsukawa, K. Kaneda, ChemSusChem. 6
(2013) 1345-1347.
[37] L. Longjie, Z. Yanhua, W. Aiqin, Z. Tao, Chin. J. Catal. 33 (2012) 257-1261.
[38] S. Zhu, Y. Qiu, Y. Zhu, S. Hao, H. Zheng, Y. Li, Catal. Today. 212 (2013) 120-126.
[39] L. Z. Qin, M. J. Song, C. L. Chen, Green Chem. 12 (2010) 1466-1472.
[40] S. Zhu, X. Gao, Y. Zhua, J. Cui, H. Zheng, Y. Li, Appl. Catal., B. 158–159 (2014) 391-
399.
[41] O. M. Daniel, A. DeLaRiva, E. L. Kunkes, A. K. Datye, J. A. Dumesic, R. J. Davis,
ChemCatChem. 2 (2010) 1107-1114.
[42] J. Zhou, S. Hao, N. Zhao, F. Xiao, W. Wei, Y. Sun, J. Chem. Soc. Pak. 34 (2012) 807-
814.
[43] L. Guo, J. Zhou, J. Maoa, X. Guo, S. Zhang, App. Catal., A. 367 (2009) 93-98.
[44] S. N. Delgado, D. Yap, L. Vivier, C. Especel, J. Mol. Catal., A. 367 (2013) 89-98.
[45] Z. Yuan, P. Wu, J. Gao, X. Lu, Z. Hou, X. Zheng, Catal. Lett. 130 (2009) 261-265.
[46] L. Huang, Y. Zhu, H. Zheng, G. Ding, Y. Li, Catal. Lett. 131(2009) 312-320.
[47] Y. Feng, H. Yin, A. Wang, L. Shen, L. Yu, T. Jiang, Chem. Eng. Journal. 168 (2011)
403-412.
[48] K. V. R. Chary, G. V. Sagar, C. S. Srikanth, V. V. Rao, J. Phys. Chem. B. 111 (2007)
543-550.
[49] W. H. Chen, H. H. Ko, A. Sakthivel, S. J. Huang, S. H. Liu, A.Y. Lo, T. C. Tsai, S. B.
Liu, Catal. Today. 116 (2006) 111-120.
[50] N. V. Parizotto, K. O. Rocha, S. Damyanova, F. B. Passos, D. Zanchet, C. M. P.
Marques, J. M. C. Bueno, Appl. Catal., A. 330 (2007) 12-22.
[51] T. Lindblad, B. Rebenstorf, Z. G. Yan, S. L. T. Andersson, Appl. Catal. 112 (1994) 187-
198.

Chapter 2
77 | P a g e
[52] M. M. J. Treacy, J. B. Higgins, 4 ed (2001) Elsevier Amsterdam.
[53] Z. Jian, J. Yu, Z. X. Guo, Macromol. Chem. Phys. 206 (2005) 1558-1567.
[54] A. A. El-Hendawy, Carbon. 41 (2003) 713-722.
[55] S. Zhu, Y. Zhu, S. Hao, H. Zheng, T. Mo, Y. Li Green Chem. 14 (2012) 2607-2616.
[56] A. Satsuma, Y. Kamiya, Y. Westi, T. Hattori, Appl. Catal., A. 194 (2000) 253-263.
[57] A. S. Oliveira, S. J. S. Vasconcelos, J. R. Sousa, F. F. Sousa, J. M. Filho, A. C. Oliveira
Chem. Eng. Journal. 168 (2011) 765-774.
[58] J. M. Campelo, A. Garcia, J. F. Herencia, D. Luna, J. M. Marinas, A. A. Romero, J.
Catal. 151 (1995) 307-314.
[59] K. Ebitani, H. Hattori, Bull. Chem. Soc. Jpn. 64 (1991) 2422-2427.
[60] L. Zhu, J. Q. Lu, P. Chen, X. Hong, G. Q. Xie, G. S. Hu, M. F. Luo, J. Mol. Cat., A.
361-362 (2012) 52-57.
[61] S. R. Miguel, O. A. Sceiza, M. C. Martinez, C. S. M. Lecea, D. C. Amoros, A. L.
Solano, Appl. Catal. A. 170 (1998) 93-103.
[62] M. Kacimia, M. Ziyada, L. F. Liotta Catal. Today. (2014) DOI
10.1016/j.cattod.2014.04.003.
[63] P. Ciambelli, V. Palma, A. Ruggiero, G. Iaquaniello, (2009) AIDIC Conference Series, 9
ISBN 978-88-95608-10-5 ISSN 2036-5969.
[64] A. Dicko, X. Song, A. Adnot, A. Sayari, J. Catal. 150 (1994) 254-261.
[65] Y. Nakagawa, K. Mori, K. Chen, Y. Amada, M. Tamura, K. Tomishige, Appl. Catal., A.
468 (2013) 418.
[66] V. P. Kumar, Ch. S. Srikanth, A. N. Rao, K. V. R. Chary, J. Nanosci. Nanotechnol. 13
(2013) 1-10.

Chapter 3
78 | P a g e
CHAPTER 3
Aluminium phosphate supported Platinum
catalysts for selective hydrogenolysis of glycerol
to 1, 3-propanediol

Chapter 3
79 | P a g e
In this chapter, the catalytic evaluation of Platinum catalysts supported on Aluminium
phosphate has been presented in detail. A series of Pt/AlPO4 catalysts with varying platinum
content (0.5 to 3 wt%) was investigated for glycerol hydrogenolysis for selective production
of 1,3-propanediol in vapour phase. The catalysts were prepared by wet impregnation method
and characterized by various techniques such as XRD, FTIR, BET surface area, SEM, TEM
and CO-chemisorption methods, Pyridine adsorbed FTIR analysis and NH3-TPD to
investigate the structural and acidic properties of the catalysts. The reaction parametric study
by varying the reaction temperature, hydrogen flow rate, glycerol concentration and the effect
of platinum loading has been studied to determine the optimized reaction conditions.
Amongst series of (0.5-3 wt%) Pt/AlPO4 catalysts, 2 wt% Pt/AlPO4 displayed high
performance with above 35% selectivity to 1, 3-propanediol and complete conversion of
glycerol at 260 oC under atmospheric pressure. The well dispersed platinum on AlPO4
revealed from XRD, TEM and CO-chemisorption studies contributed to higher catalytic
activity for glycerol hydrogenolysis. The high strength weak acidic sites and Brønsted acidity
of the catalyst measured by NH3-TPD and Pyr-FTIR were concluded to play a key role in
selective formation of 1, 3-propanediol.
The work presented in this chapter has been published:
S. Shanthi Priya, V. P. Kumar, M. L. Kantam, S. K. Bhargava and K. V. R. Chary, Catalytic
performance of Pt/AlPO4 catalysts for selective hydrogenolysis of glycerol to 1, 3-
propanediol in vapour phase. RSC Advances, 4 (2014) 51893-51903.

Chapter 3
80 | P a g e
3.1 Introduction
In the previous chapter, different supported platinum catalysts (Pt/ZrO2, Pt/S-ZrO2,
Pt/γ-Al2O3, Pt/AlPO4, Pt/Y-zeolite, Pt/activated carbon) were chosen and screened for
glycerol hydrogenolysis in vapour phase in order to find the best of them. The effect of nature
of support and the factors governing the catalytic performance for the selective formation of
1,3-PDO were identified. Among various supported platinum catalysts screened, Pt/AlPO4
was found to be the most effective catalyst for selective glycerol hydrogenolysis to 1,3-PDO.
Therefore, the present chapter focussed on a more detailed investigation of catalytic
properties of Pt/AlPO4 catalysts for the hydrogenolysis of glycerol to selectively produce 1,3-
PDO.
Selective conversion of glycerol to 1,3-PDO is regarded as a challenging process and
in this context, several studies have been reported on the conversion of glycerol into 1,3-PDO
through homogeneous [1, 2] or heterogeneous processes [3-8]. Homogeneous processes
reported so far suffered from the common problem of catalyst separation and thus direct
hydrogenolysis of glycerol over heterogeneous catalysts is a preferred route. Feng et. al. [9]
demonstrated gas phase glycerol hydrogenolysis over Cu/ZnO/MOx (MOx =Al2O3, TiO2,
and ZrO2) catalysts and found that weak acidic sites of the support favoured 1,3-propanediol
formation, however the selectivity of 1,3-PDO was found to be 10%. Pt/Al2O3 with tungsten
additive for the selective formation of 1,3-PDO in a batch process was investigated recently
and the selectivity of 1,3-PDO was found to be 28% [10]. A reusable Pt-AlOx/WO3 catalyst
was employed for the selective hydrogenolysis of glycerol to 1, 3-PDO in water; through the
process 1,3-PDO was produced with 66% yield at 180 oC and 5 MPa H2 [11]. The major
disadvantages of existing heterogeneous processes arise from use of organic solvents and
high reaction pressure which will greatly reduce the environmental and economic viability.

Chapter 3
81 | P a g e
Despite several reports, there is a need for eco-friendly and catalytically efficient
practical alternative for this important transformation which might work under mild and
cheaper conditions. Hence the most promising alternative is to perform hydrogenolysis
reaction in vapour phase at moderate temperature and atmospheric pressure to achieve fairly
good conversions and selectivities. Vapour phase transformation is a continuous process and
a lower reaction time is necessary for a given conversion hence vapour phase reaction is
economically viable and eco-friendly process.
Aluminium phosphates have found increasing interest as catalysts or catalyst supports
for a variety of catalytic reactions in the last three decades [12]. Amorphous aluminium
phosphate is built of tetrahedral units of AlO4 and PO4 and is structurally similar to silica.
Aluminium phosphate has been studied extensively due to its high surface area, large average
pore size, thermal stability and surface acid-base properties [13-17]. The acid-base properties
of AlPO4 play an important role in catalytic reactions. The close relationship between silica
and aluminium phosphate, which are isoelectronic and isostructural, has prompted many
others to examine the use of AlPO4 as either a catalytic material or as a support for numerous
catalytic applications [18, 19].
In the present chapter, a catalytic strategy for vapour phase hydrogenolysis of glycerol
to 1,3-propanediol over a series of platinum catalysts (0.5-3 wt %) supported on aluminium
phosphate is presented. The catalysts were characterized by BET surface area, XRD, FTIR,
NH3-TPD, Pyr-FTIR, SEM, TEM and CO-chemisorption methods. The objective of this
study is to estimate the dispersion of platinum on AlPO4, to study the acidic properties of the
catalyst and its contribution to vapour phase hydrogenolysis of glycerol to 1,3-PDO. In
addition, the reaction is optimized under various reaction parameters such as effect of metal
loading, effect of temperature, effect of H2 flow rate and time-on-stream studies. The

Chapter 3
82 | P a g e
research work described in this chapter is the first of its kind in successful use of AlPO4 as a
catalyst support for 1, 3-PDO production from glycerol.
3.2 Experimental section
3.2.1 Catalyst Preparation
3.2.1.1 Synthesis of AlPO4 support
Amorphous aluminium phosphate with a P/Al ratio of 0.9 was prepared from
aluminium nitrate hexahydrate (Al(NO)3.6H2O) and diammonium hydrogen phosphate
((NH4)2HPO4) by following the procedure reported earlier [19-21]. The starting materials
were dissolved in deionized water (400 mL of 0.5M of Aluminium nitrate solution and 350
mL of 0.5M of (NH4)2HPO4 solution) and acidified with nitric acid. A hydrogel was then
formed by adding 700 mL of 10% solution of ammonia to the acidified solutions of Al and P
precursors until a pH of 8.0 was achieved. After 1 h, the contents were filtered and the
hydrogel was washed with twice its volume of distilled water. The hydrogel was dried at
110 oC for 16 h and calcined at 500 oC in air for 0.5 h.
3.2.1.2 Synthesis of Pt/AlPO4 catalyst
A series of platinum catalysts with Pt loadings varying from 0.5 to 3 wt % were
prepared by impregnation with requisite amount of Tetrammine platinum chloride (Pt
(NH3)4Cl2 xH2O) (Aldrich, 98%) solution on AlPO4 support. The catalysts were dried at
110 oC for 16 h and subsequently calcined at 450 oC for 3 h in air at a heating rate of 10 °C
/min. The same sets of catalysts were used for all characterization and evaluation studies.
3.2.2 Catalyst characterization
X-ray diffraction patterns were obtained on Rigaku miniflex diffractometer using
graphite filtered Cu Kα (λ = 0.15406 nm) radiation. Measurements were recorded in steps of

Chapter 3
83 | P a g e
0.045° with a count time of 0.5 s in the 2θ range of 2-65°. Identification of the phase was
made with the help of the Joint Committee on Powder Diffraction Standards (JCPDS) files.
Morphology of the catalyst samples was investigated by scanning electron
microscopy (SEM) by mounting the sample on an aluminium support using a double
adhesive tape coated with gold and observed in Hitachi S-520 SEM instrument.
The surface area of the calcined catalysts were analysed using N2 adsorption at −196
°C by the multipoint BET method taking 0.0162 nm2 as its cross-sectional area using
Autosorb 1 (Quantachrome instruments, USA).
Transmission electron microscopy (TEM) images were taken on a JEOL model of
1010 microscope operated at 100 kV. Samples for TEM analyses were prepared by adding 1
mg of reduced sample to 5 mL of methanol followed by sonication for 10 min. A few drops
of suspension were placed on a hollow copper grid coated with a carbon film made in the
laboratory.
TPD experiments were also conducted on AutoChem 2910 (Micromeritics, USA)
instrument. In a typical experiment for TPD studies, 100 mg of oven dried sample was taken
in a U shaped quartz sample tube. The catalyst was mounted on a quartz wool plug. Prior to
TPD studies, the sample was pre-treated by passage of high purity (99.995%) helium (50 mL
min−1) at 200 °C for 1 h. After pre-treatment, the sample was saturated with highly pure
anhydrous ammonia (50 mL min−1) with a mixture of 10% NH3–He at 80 °C for 1 h and
subsequently flushed with He flow (50 mL min−1) at 80 °C for 30 min to remove physisorbed
ammonia. TPD analysis was carried out from ambient temperature to 800 °C at a heating rate
of 10 °C min−1. The amount of NH3 desorbed was calculated using GRAMS/32 software.
The ex-situ experiments of FTIR spectra of pyridine adsorbed samples were carried
out to find the Brønsted and Lewis acid sites. Pyridine adsorption was carried out in a vertical
fixed bed reactor. Initially, the catalyst samples were activated in N2 flow at 300 °C for 1 h to

Chapter 3
84 | P a g e
remove moisture from the samples. This is followed by pyridine adsorption at 120 °C by
sending pyridine vapours over the activated catalysts in N2 flow until saturation. After such
activation and pyridine adsorption, the samples were cooled to room temperature. The IR
spectra were recorded using a IR (model: GC-FT-IR Nicolet 670) spectrometer by KBr disc
method under ambient conditions
CO chemisorption measurements were carried out on AutoChem 2910
(Micromeritics, USA) instrument. Prior to adsorption measurements, ca. 100 mg of the
sample was reduced in a flow of hydrogen (50 mL/min) at 300 °C for 3 h and flushed out
subsequently in a pure helium gas flow for an hour at 300 °C. The sample was subsequently
cooled to ambient temperature in the same He stream. CO uptake was determined by
injecting pulses of 9.96% CO balanced helium from a calibrated on-line sampling valve into
the helium stream passing over the reduced samples at 300 °C. Metal surface area, percentage
dispersion and Pt average particle size were calculated assuming the stoichiometric factor
(CO/Pt) as 1. Adsorption was deemed to be complete after three successive runs showed
similar peak areas. Total carbon content in used catalysts was determined by CHNS
Analyzer- ELEMENTAR Vario micro cube model.
3.2.3 Catalyst testing
Vapour phase glycerol hydrogenolysis (> 99% MERCK Chemicals) was carried out
in a vertical down-flow glass reactor with an inner diameter of 9 mm operating under normal
atmospheric pressure. In the typical reaction ca. 500 mg of the catalyst, diluted with double
the amount of quartz grains was packed between the layers of quartz wool. The upper portion
of the reactor was filled with glass beads, which served as pre-heater for the reactants. Prior
to the reaction, the catalyst was reduced in a flow of hydrogen (100 mL/min) at 350 °C for 2
h. After cooling down to the reaction temperature (260 °C), hydrogen (140 mL/min) and an
aqueous solution of 10wt% glycerol were introduced into the reactor through a heated

Chapter 3
85 | P a g e
evaporator. The liquid products were collected in a condenser in order to be analysed every
60 min by GC fed. The reaction products were analyzed by Shimadzu-GC 2014 gas
chromatograph equipped with a DB-wax capillary column with a flame-ionization detector
(FID). The carbon mass balance is found to be >98% unless otherwise stated. The conversion
of glycerol and selectivity of products were calculated as follows.
Conversion (%) =moles of glycerol (in) − moles of glycerol (out)
moles of glycerol (in) × 100
Selectivity (%) =moles of one productmoles of all products
× 100
3.3 Results and discussion
3.3.1 Characterization techniques
3.3.1.1 X-ray diffraction (XRD)
Figure 3.1 shows the X-ray diffraction patterns of pure aluminium phosphate support
and various Pt/AlPO4 catalysts with Pt loadings ranging from 0.5 to 3 wt%. XRD results
suggest that the synthesized aluminium phosphate was found to be X-ray amorphous. A
broad peak in the range of 2θ between 15 and 30o which is centred at 26o is due to amorphous
AlPO4. This observation is in good agreement with XRD results of previous literature [21-
23]. At higher Pt loadings (3 wt%), peaks due to crystalline Pt phase at 2θ =39.7° and 46.1°
were found to be less intense. These peaks corresponds to the (111), (200) lattice planes of
crystalline Pt. However, at lower Pt loadings the peaks were smaller and broader which is a
clear indication that the active phase is present in highly dispersed form or the crystallite size
might be less than 4 nm in size, which is beyond the detection capacity of the XRD technique
[24].

Chapter 3
86 | P a g e
Figure 3.1: XRD patterns of pure AlPO4 and various Pt/AlPO4 catalysts
3.3.1.2 BET surface area
Nitrogen adsorption desorption measurements have been performed to measure the BET
surface area and the results are presented in Table 3.1. As evident from the results presented
in Table 3.1, platinum loadings have shown a clear impact on the surface area of the
aluminium phosphate support. The surface area of the pure aluminium phosphate support was
found to be 251 m2g−1 and decreases as a function of platinum content (Table 3.1). The
decrease in surface area with increasing Pt loading can be attributed to blocking of the pores
of the support by crystallites of platinum as evidenced from XRD.
Table 3.1: Results of Temperature-Programmed Desorption and BET surface area of various
Pt/AlPO4 Catalysts
Catalyst
TPD analysis BET S.A. (m2/g)
NH3 uptake (μmol/g STP)
Tmax (0C)
Pure AlPO4 354 184.7 251
0.5 Pt/AlPO4 961 (892) 198.2 196
1 Pt/AlPO4 1130 (1061) 210.0 178
2 Pt/AlPO4 1529 (1453) 216.4 165
3 Pt/AlPO4 967 (905) 187.5 139

Chapter 3
87 | P a g e
3.3.1.3 Fourier Transform Infrared spectroscopy (FTIR)
The FTIR analysis of all the Pt/AlPO4 catalysts was carried out to investigate the
interaction of surface hydroxyl and phosphate groups of AlPO4 and the spectral results are
shown in Figure 3.2. A broad band centred at ∼3500 cm−1 is attributed to the isolated OH
stretching vibration and the broad band appeared at ∼1640cm−1 is due to the OH bending
vibration. The band at around 1118 and 492 cm−1 could be attributed to the triply degenerate
P–O stretching vibration mode and to the triply degenerate O–P–O bending vibration mode
of tetrahedral (PO4)3−, respectively [25-27].
Figure 3.2: FTIR spectra of pure AlPO4 and various Pt/AlPO4 catalysts
3.3.1.4 Scanning Electron Microscopy (SEM)
To investigate the surface morphology of AlPO4 and Pt/AlPO4 catalysts, SEM
imaging was carried out and the results are shown in Figure 3.3. SEM analysis of AlPO4
material (Figure 3.3a) showed micron sized irregular shaped agglomerates of many smaller

Chapter 3
88 | P a g e
particles. In the case of Pt/AlPO4 materials, it was seen that small granular type platinum
particles were deposited on these aggregates.
Figure 3.3: SEM images of (a) Pure AlPO4 (b) 0.5 Pt/AlPO4 (c) 1 Pt/AlPO4 (d) 2 Pt/AlPO4
(e) 3 Pt/AlPO4 catalysts
3.3.1.5 CO-chemisorption
The Pt dispersion, metal surface area, and average particle size were calculated from the
irreversible CO-chemisorption on various aluminium phosphate supported platinum catalysts
and the results are illustrated in Table 3.2. The results have shown that the CO uptake value
increases with increase in Pt loading on AlPO4 support. From Table 3.2 it is evident that the
particle size of Pt increases with loading on AlPO4, due to agglomeration of Pt particles on
the support. The platinum dispersion was found to decrease from 74.1% to 28.9% with
increase in platinum loading from 0.5 to 3 wt% on AlPO4. This is probably because as the
platinum loading increases, the deposition of excess platinum on the external surface of
AlPO4 leads to decrease in the distance between the metal particles and thereby promotes the
agglomeration. These results are in good agreement with the results obtained from the TEM
(e)
(b) (c)
(d)
(a)

Chapter 3
89 | P a g e
and XRD studies. Previous studies also reported a systematic study on the dispersion of
platinum by CO-chemisorption method [8, 28].
Table 3.2: Results of CO uptake, dispersion, metal area and average particle size of various
Pt/AlPO4 catalysts
Pt
(wt%)
Dispersion
(%)
CO uptake
(µmol/g)
Metal surface
area (m2/g)cat
Particle sizea
(nm)
Particle sizeb
(nm)
0.5 74.1 18.9 0.74 1.88 2.76
1 54.4 27.8 1.09 2.56 3.65
2 38.9 39.9 1.56 3.59 5.02
3 28.9 44.6 1.74 4.82 6.55
a=determined from CO uptake values; b= determined from TEM analysis.
3.3.1.6 Transmission Electron Microscopy (TEM)
TEM imaging was used to determine the size and morphology of various AlPO4
supported Pt catalysts. The TEM images of 0.5, 1, 2 and 3 wt% Pt/AlPO4 catalysts are
presented in Figure 3.4 and corresponding particle sizes are given in Table 3.2. The TEM
images of Pt/AlPO4 catalysts show that platinum particles are spherical in shape. The average
particle size of Pt in 0.5 wt% and 1 wt% catalysts was found to be around 2.76 nm and 3.65
nm respectively. 2Pt/AlPO4 catalyst particle size is 5.02 nm and for 3 wt% it is around 6.55
nm. As shown in Figure 3.4, the TEM images of Pt/AlPO4 samples reveal that the platinum
particles were highly dispersed on the surface of AlPO4. The small size of Pt particles at
lower loadings is due to the well-dispersed state of Pt metal particles. The large particles for
3Pt/AlPO4 catalysts are due to agglomeration of platinum particles i.e., decreasing in the
dispersion of platinum. The average particle size of platinum particles estimated from TEM
results is in good agreement with that estimated from CO-chemisorption results.

Chapter 3
90 | P a g e
Figure 3.4: TEM images of pure AlPO4 and various Pt/AlPO4 catalysts
0.5 Pt/AlPO4
1 Pt/AlPO4
0 2 4 6 8
Number
of Parti
cles
Particle size (nm)
0.5 Pt/AlPO4Mean size (2.76 nm)
0 2 4 6
Number
of Parti
cles
Particle size (nm)
1 Pt/AlPO4Mean size (3.65 nm)
2 Pt/AlPO4
3 Pt/AlPO4
0 2 4 6 8
Number
of Parti
cles
Particle size (nm)
2 Pt/AlPO4Mean size (5.02 nm)
0 2 4 6 8 10
Number
of Parti
cles
Particle size (nm)
3 Pt/AlPO4Mean size (6.55 nm)

Chapter 3
91 | P a g e
3.3.1.7 Temperature-programmed desorption of ammonia (NH3-TPD)
NH3-TPD measurements were performed to determine acid sites on catalyst surface,
and their strength, using ammonia as an adsorbate. Ammonia is used frequently as a probe
molecule because of its small molecular size, stability and strong basic strength. The
ammonia desorption peaks observed in the range of 180-250 °C, 260-330 °C and 340-500 °C
in the NH3-TPD pattern are commonly attributed to NH3 that has been chemisorbed on weak,
moderate and strong acid sites, respectively [29, 30]. If there is more than one binding site for
a molecule on a surface, then this will result in multiple peaks in the TPD spectrum. The
NH3-TPD spectra of pure AlPO4 and different wt% loadings of Pt/AlPO4 catalysts are
presented in Figure 3.5. This figure clearly demonstrated the effect of acidic properties of
different wt% of platinum loadings on aluminium phosphate support. The temperatures of
desorption maxima (Tmax) and the volume of NH3 desorbed on the catalysts are summarized
in Table 3.1. The pure aluminium phosphate support exhibits one broad peak in the
temperature range of 180 °C-250 °C and these results clearly indicate the absence of strong
acid sites on the catalyst surface. The NH3-TPD spectra of all Pt/AlPO4 catalysts (Figure 3.5)
exhibited a broad peak in low temperature region, which correspond to weak acid sites. It is
clearly observed that the intensity of the desorption peak for samples 0.5Pt/AlPO4,
1Pt/AlPO4 and 3Pt/AlPO4 were found to be much smaller than that in 2Pt/AlPO4 sample;
therefore, the total amount of acid sites of 2Pt/AlPO4 is much larger than that of the other
catalysts.

Chapter 3
92 | P a g e
Figure 3.5: TPD of ammonia profiles of pure AlPO4 and various Pt/AlPO4 catalysts
3.3.1.8 Pyridine adsorbed Fourier Transform Infrared spectroscopy (Pyr-FTIR)
FTIR after pyridine adsorption is a useful tool to determine the nature and amount of
acid sites. Figure 3.6 illustrates the FTIR spectra after pyridine adsorption on pure aluminium
phosphate and Pt/AlPO4 catalysts with different platinum loadings. Pyridine adsorption at
Brønsted (B) acid sites and Lewis (L) acid sites exhibited typical bands centering at 1540–
1548 cm−1 and 1445–1460 cm−1, respectively [31]. Furthermore, the bands corresponding to
combination of both Brønsted and Lewis (B + L) acid sites appear at 1490–1500 cm−1. All
the catalysts have shown bands at 1454 cm−1 corresponding to Lewis acid sites and the other
band appeared at 1551 cm−1 is attributed to Brønsted acid sites (Figure 3.6). Although the
surface acidity is low, Brønsted acid sites are significantly observed in AlPO4 catalysts. One
possible explanation would be that pyridine adsorption on AlPO4 catalysts leads to the

Chapter 3
93 | P a g e
formation of protonated (bands at 1551 and 1493cm-1) and coordinated (bands at 1493 and
1454 cm-1) species. Weaker acidity has been associated with aluminium atoms while P–OH
sites have been associated to stronger acidity. P-OH groups are most probably responsible for
Brønsted acidity on AlPO4 surfaces and are quite stable [32, 33]. In addition, P-OH acidity
may be further enhanced by hydrogen bonding to Al-OH groups, as stated by Moffat et. al
[34]. However, the acid properties of AlPO4 can be modified by introducing elements
different from Al and P in the framework at different loading. Thus, it is evident from Figure
3.6 that the incorporation of Pt to AlPO4 results in increase in the number of both Brønsted
and Lewis acid sites with increase in loading (0.5 to 3 wt%).
Figure 3.6: Ex-situ pyridine adsorbed FTIR of pure AlPO4 and various Pt/AlPO4 catalysts

Chapter 3
94 | P a g e
3.3.2 Catalytic activity studies
3.3.2.1 Effect of Platinum loading on glycerol hydrogenolysis
Glycerol hydrogenolysis over Pt/AlPO4 catalysts was performed in vapour phase at
260 °C under atmospheric pressure and the results of the effect of platinum loading on the
catalytic performance towards glycerol hydrogenolysis are summarized in Table 3.3. In
general, 1, 2-PDO and 1, 3-PDO are the primary products of glycerol hydrogenolysis whereas
EG, 1-PrOH and 2-PrOH are the minor products. It is well known that the dispersion of
active metal and acidity of catalyst play a key role in the bi-functional hydrogenolysis
mechanism of glycerol. The catalytic activity exhibited by various Pt/AlPO4 catalysts (0.5-3
wt%) showed superior performance in vapour phase hydrogenolysis reaction of glycerol at
260 °C and low hydrogen flow rates [140 mL/min] under atmospheric pressure (Scheme 3.1).
Interestingly, 1, 3-PDO was exclusively produced as a major product over Pt/AlPO4 catalyst
eliminating the formation of 1, 2-PDO.
Table 3.3: Effect of metal loading of various Pt/AlPO4 catalysts on conversion or selectivity
of glycerol hydrogenolysis
Selectivity (%)
Pt
wt%
Conversion
(%)
1,3-
PDO
1,2-
PDO
1-
PrOH
2-
PrOH
Acetone Methanol Others aC
(wt%)
0.5 100 19.7 -- 21.7 14.2 24 16 4.4 1.64
1 100 27.8 -- 23.4 12 15.1 12.9 8.8 1.51
2 100 35.4 -- 13.5 21.3 14.8 10.2 4.8 1.49
3 75 15.7 -- 15.9 18.7 25.4 14.6 9.7 2.03
Reaction conditions: Catalyst: Pt/AlPO4 (0.5g); Reaction temperature=260 oC; H2 flow rate:
140 mL/min; WHSV= 1.02 h-1. 1,2-PDO=1,2-propanediol; 1,3-PDO=1,3-propanediol; 1-
PrOH=1-propanol; 2-PrOH=2-propanol; Others include ethanol, acetaldehyde and propane. aCarbon estimated after the 10 h continuous operation on the used catalysts.
From Table 3.3, it was found that the conversion of glycerol was remarkably 100% with
increase in platinum loading from 0.5 to 2 wt%. This can be explained by the high dispersion

Chapter 3
95 | P a g e
of platinum and increase in the number of platinum active sites at 2 wt% which accelerated
the reaction process, Further increase in platinum loading (3wt %) decreased the conversion
of glycerol from 100% to 75%.The selectivity of 1, 3-PDO increased from 19.7 to 35.4%
with increase in platinum loading from 0.5-2 wt% further decreased to 15.7% at 3 wt%. This
may be caused by that excess Pt generated agglomerates, which blocked the acid sites and
reduced the dispersion of Pt as evidenced from XRD, TEM and CO-chemisorption results.
The results of carbon content estimated on used catalysts are shown in Table 3.3.
Figure 3.7: Effect of metal loading of various Pt/AlPO4 catalysts on conversion of glycerol
hydrogenolysis reaction Reaction conditions: Reaction temperature = 260 oC; H2 Flow rate =140 mL/min, WHSV – 1.02 h-1.
Based on the literature, it is believed that the formation of 1, 3-propanediol involves
two steps: dehydration of glycerol to 3-hydroxypropionaldehyde on acid sites and
subsequently rapid hydrogenation of 3-hydroxypropionaldehyde to 1, 3-propanediol over
metal catalyst [35-38]. Feng et.al. [9] suggested that weak acid sites favoured the formation
0.5 1.0 1.5 2.0 2.5 3.010
20
30
40
50
60
70
80
90
100
Conv
ersio
n an
d Se
lectiv
ity (%
)
Effect of Pt loading
Conversion of glycerol Selectivity of 1,3-PDO

Chapter 3
96 | P a g e
of 1, 3-PDO whereas strong acid sites lead to the formation of 1, 2-PDO through
hydroxyacetone. Interestingly, weak acid sites dominantly presented in Pt/AlPO4 catalyst,
evidenced from NH3-TPD results, favoured the dehydration of glycerol to 3-
hydroxypropionaldehyde, and further hydrogenation to 1, 3-propanediol. However significant
amounts of degradative products such as ethanol, methanol, acetone, acetaldehyde and
propane were observed. Evidently these results have demonstrated that 2Pt/AlPO4 can be a
good catalyst for the selective hydrogenolysis of glycerol to 1, 3-PDO (Figure 3.7) which
offers a promising alternative route.
Reaction Scheme:
Scheme 3.1: Glycerol hydrogenolysis to 1,3-PDO over Pt/AlPO4 catalysts
3.3.2.2 Effect of reaction temperature
Since the Pt/AlPO4 catalyst with 2 wt% Pt loading exhibited superior catalytic
performance, the following investigations were conducted on this sample. The reaction
temperature (150 °C-280 °C) dependence of glycerol hydrogenolysis over 2 wt% Pt/AlPO4 is
illustrated in Figure 3.8. Increasing the reaction temperature has a positive effect on the
conversion of glycerol (Table 3.4). As expected, glycerol conversion improved dramatically
from 37.5% (180 °C) to 61% (230 °C) and then remained at 100% as the temperature
elevated (250, 260 and 280 °C).

Chapter 3
97 | P a g e
Figure 3.8: Effect of Temperature on hydrogenolysis of glycerol to propane diols
Reaction conditions: Reaction temperature = 150-280 oC ; H2 Flow rate =140 mL/min; WHSV – 1.02
h-1.
However, conversion of glycerol was found to be remarkably minuscale at lower
temperature (150 °C) indicating that it was not favourable to promote hydrogenolysis of
glycerol. While, the selectivity to 1, 3-PDO increased from 16.7% to 35.4% when the
temperature increased from 230 °C to 260 °C. Notably, 1, 3-PDO formation was not observed
at lower temperatures (150 °C, 180 °C) and elevated temperature (280 °C) which is related to
the formation of large amounts of undesired by-products, such as over hydrogenolysis
products 1-PrOH, 2-PrOH, and the degradative products methanol, ethanol, acetone and
propane. So the optimal reaction temperature to perform vapour phase glycerol
hydrogenolysis to 1, 3-PDO selectively over 2 wt% Pt/AlPO4 catalyst is 260 °C.
140 160 180 200 220 240 260 280
0
20
40
60
80
100
Conv
ersio
n an
d Se
lectiv
ity (%
)
Temperature (oC)
Conversion of glycerol Selectivity of 1,3-PDO

Chapter 3
98 | P a g e
Table 3.4: Effect of Temperature on conversion or selectivity of glycerol hydrogenolysis
Selectivity (%)
Reaction
Temp
(oC)
Conversion
(%)
1,3-
PDO
1,2-
PDO
1-
PrOH
2-
PrOH
HA Acetone Methanol Others
150 -- -- -- -- -- -- -- -- --
180 37.5 -- -- -- -- 12.5 32 28 27.5
230 61 16.7 -- -- -- 54 11.8 8.2 9.3
250 100 26.4 -- 18.6 28.7 -- 12.8 7.2 6.3
260 100 35.4 -- 13.5 21.3 -- 14.8 10.2 4.8
280 100 -- -- -- 100 -- -- -- --
Reaction conditions Catalyst: 2 wt% Pt/AlPO4 (0.5g), H2 flow rate: 140 mL/min, WHSV= 1.02 h-1;
1,2-PDO=1,2-propanediol; 1,3-PDO=1,3-propanediol; 1-PrOH=1-propanol; 2-PrOH=2-propanol;
HA=Hydroxyacetone; Others include acetaldehyde, ethanol and propane
3.3.2.3 Effect of glycerol concentration
The effect of glycerol concentration on glycerol hydrogenolysis was investigated in the
range of 5-20 wt%. The results presented in Figure 3.9 clearly show that a considerable
decline in glycerol conversion from 100% to 84% is noticed with increase in glycerol
concentration from 5 wt% to 20 wt% in the feed. This is probably due to adsorption of
reactant molecules on the surface of catalyst significantly decreasing the surface area of the
catalyst as a result of blockage of the pores. Earlier studies suggest that higher glycerol
conversion is favourable at low glycerol concentration [39, 40]. The selectivity of 1, 3-PDO
also increased to 35.4% at 10 wt% glycerol concentration and further decreased to 18.4% at
20 wt %. For 20 wt% glycerol solution, higher viscosity lowers the rate of reaction. The
maximum conversion of glycerol and selectivity of 1, 3-PDO was obtained at 10 wt%
glycerol concentration. Miyazawa et al. also reported a high glycerol conversion when the
glycerol concentration was 10% [41].
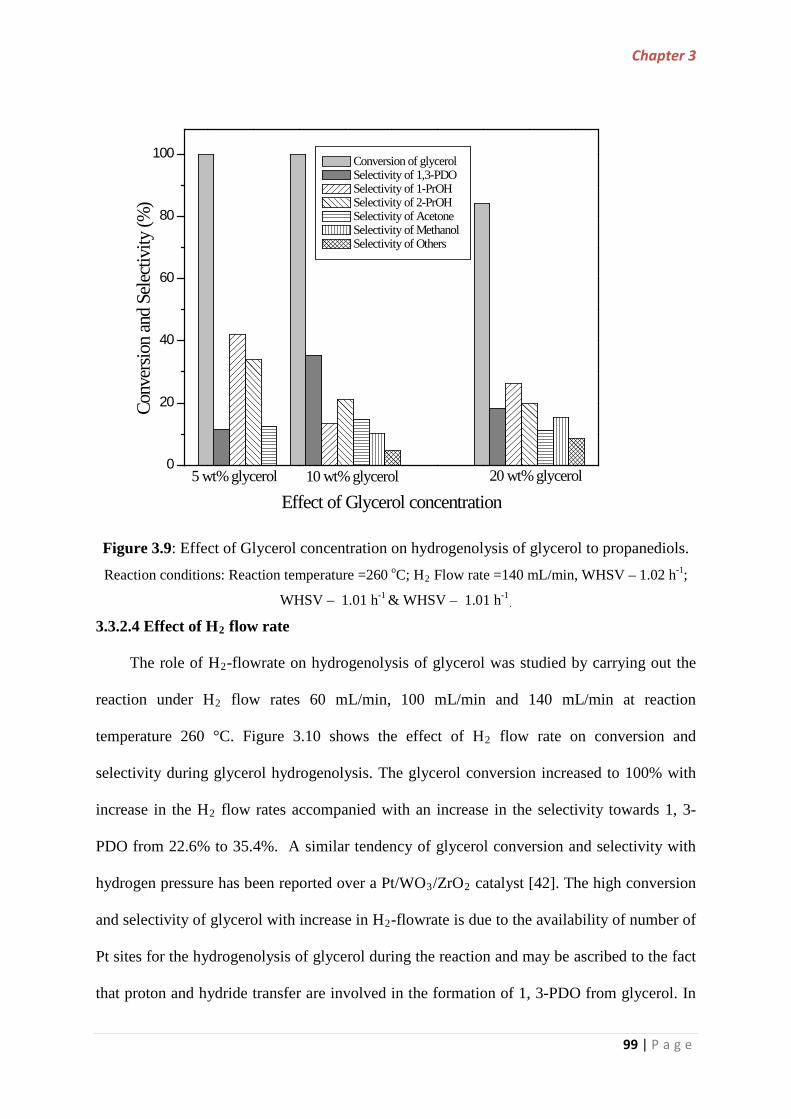
Chapter 3
99 | P a g e
Figure 3.9: Effect of Glycerol concentration on hydrogenolysis of glycerol to propanediols.
Reaction conditions: Reaction temperature =260 oC; H2 Flow rate =140 mL/min, WHSV – 1.02 h-1;
WHSV – 1.01 h-1 & WHSV – 1.01 h-1.
3.3.2.4 Effect of H2 flow rate
The role of H2-flowrate on hydrogenolysis of glycerol was studied by carrying out the
reaction under H2 flow rates 60 mL/min, 100 mL/min and 140 mL/min at reaction
temperature 260 °C. Figure 3.10 shows the effect of H2 flow rate on conversion and
selectivity during glycerol hydrogenolysis. The glycerol conversion increased to 100% with
increase in the H2 flow rates accompanied with an increase in the selectivity towards 1, 3-
PDO from 22.6% to 35.4%. A similar tendency of glycerol conversion and selectivity with
hydrogen pressure has been reported over a Pt/WO3/ZrO2 catalyst [42]. The high conversion
and selectivity of glycerol with increase in H2-flowrate is due to the availability of number of
Pt sites for the hydrogenolysis of glycerol during the reaction and may be ascribed to the fact
that proton and hydride transfer are involved in the formation of 1, 3-PDO from glycerol. In
0
20
40
60
80
100
20 wt% glycerol10 wt% glycerol5 wt% glycerol
Conv
ersio
n an
d Se
lectiv
ity (%
)
Effect of Glycerol concentration
Conversion of glycerol Selectivity of 1,3-PDO Selectivity of 1-PrOH Selectivity of 2-PrOH Selectivity of Acetone Selectivity of Methanol Selectivity of Others

Chapter 3
100 | P a g e
contrast, considerable decline in the selectivities of overhydrogenolysis and degradative
products is also noticed with increase in H2 flow rate.
Figure 3.10: Effect of H2 Flow rate on hydrogenolysis of glycerol to propanediols.
Reaction conditions: Reaction temperature = 260 oC; H2 Flow rate =60 mL/min, 100 mL/min & 140
mL/min, WHSV – 1.02 h-1.
3.3.2.5 Effect of time on stream
The time on stream experiments for glycerol hydrogenolysis were carried out over 0.5-3
wt% Pt/AlPO4 catalysts to understand the stability of catalysts and the results are presented in
Figure 3.11. These results show that 2Pt/AlPO4 catalyst exhibit higher conversion (100%)
and showed stability compared to other catalysts. The catalysts prepared by impregnation
method exhibited better conversions and good selectivities towards 1, 3-propanediol. The
results suggest that 3Pt/AlPO4 show slightly lower conversion and selectivity than
2Pt/AlPO4, due to their increased crystallite sizes. Although the initial activity is better for
3Pt/AlPO4 catalysts, the activity abruptly dropped from 72% to 63 % within 10 h of
0
20
40
60
80
100
140 mL/min100 mL/min60 mL/min
Conv
ersio
n an
d Se
lectiv
ity (%
)
Effect of H2 flow rate
Conversion of glycerol Selectivity of 1,3-PDO Selectivity of 1-PrOH Selectivity of 2-PrOH Selectivity of Acetone Selectivity of Methanol Selectivity of Others

Chapter 3
101 | P a g e
operation. The catalysts 0.5Pt/AlPO4 and 1Pt/AlPO4 exhibited higher conversions 92% and
100% but their activity decreased with time compared to 2Pt/AlPO4 catalyst, suggesting that
2Pt/AlPO4 was a best catalyst for the glycerol hydrogenolysis in the present investigation.
The catalytic activity is correlated with the particle size of Pt on different catalysts. The
3Pt/AlPO4 catalyst is attributed to increase in the particle size of platinum on AlPO4 due to
agglomeration as evident from XRD, TEM, BET-SA and CO- chemisorption results.
Figure 3.11: TOS on hydrogenolysis of glycerol to propane diols (A. 0.5-3wt% Pt/AlPO4; B.
2wt% Pt/AlPO4 catalysts)
Reaction conditions: Reaction temperature = 260 oC; H2 Flow rate =140mL/min, WHSV – 1.02 h-1.
3.3.3 Structural aspects of spent catalysts
The spent catalyst of 2 wt % Pt/AlPO4 was characterized by XRD, SEM, BET surface
area and the results were compared with those of the fresh catalyst. As shown in Figure
3.12a, the spent and fresh catalysts showed similar XRD patterns in which no crystalline
phase related to the Pt species was observed in the spent catalyst. This can be ascribed to the
fact that the Pt species were homogeneously dispersed on the support surface and did not
agglomerate during the reaction. The BET surface area result also confirmed that the surface
1 2 3 4 5 6 7 8 9 10
65
70
75
80
85
90
95
100
105
Conv
ersio
n (%
)
Time on stream (hour)
0.5Pt/AlPO4 1Pt/AlPO4 2Pt/AlPO4 3Pt/AlPO4
1 2 3 4 5 6 7 8 9 10
20
30
40
50
60
70
80
90
100
Conv
ersio
n an
d Se
lect
ivity
(%)
Time on stream (hour)
Conversion of glycerol Selectivity of 1,3-PDO
A B

Chapter 3
102 | P a g e
area of catalyst had no remarkable change during the reaction. The SEM (Figure 3.12b)
images of the fresh and spent samples showed similar morphologies, which implies that the
structure of this catalyst was rather stable. The conversion of glycerol and selectivity of 1, 3-
PDO was also studied over the spent catalyst of 2 wt% Pt/AlPO4 while maintaining the same
reaction conditions (260 °C, 0.1MPa). The results are presented in Table 3.5.
Figure 3.12: (a) XRD pattern and (b) SEM images of spent 2 wt% Pt/AlPO4 catalysts
The used catalyst achieved 100% conversion same as that of fresh catalyst however the
selectivity of 1, 3-PDO slightly dropped to 34.2%. These results suggest that the structural
features of spent catalyst did not change appreciably and the efficiency of the catalyst
remained during glycerol hydrogenolysis reaction.
(b) Fresh Spent

Chapter 3
103 | P a g e
Table 3.5: Studies of the spent catalyst 2 wt% Pt/AlPO4
Catalyst Conversion
(%)
Selectivity of
1, 3-PDO (%)
BET surface area
(m2/g)
Fresh 100 35.4 165
Spent 100 34.2 154
3.4 Conclusions
Aluminium phosphate supported platinum catalysts prepared by impregnation method
were identified as the most efficient catalysts for the selective hydrogenolysis of glycerol to
1, 3-propanediol in vapour phase.
• XRD results clearly demonstrate the presence of amorphous aluminium phosphate
and crystalline platinum at higher loadings.
• Well dispersed platinum on AlPO4 is revealed from CO-chemisorption studies and
the platinum particle size distribution with an average particle size of 2 nm-7 nm was
evident from TEM analysis.
• The structural and morphological features of Pt/AlPO4 catalysts have been studied
from FTIR and SEM techniques.
• Pt/AlPO4 catalysts predominantly showed the presence of weak acid sites and
Brønsted acidity which is illustrated from NH3-TPD and Pry FTIR results.
Under the reaction condition of 260 °C and atmospheric pressure (0.1MPa) 100%
conversion of glycerol with 35.4% selectivity to 1, 3‐PDO were achieved over 2wt%
Pt/AlPO4 catalyst. This was attributed to the appropriate acidity of the catalyst and good
dispersion of Pt. The appropriate interaction between the weak acidic sites of AlPO4 and
highly dispersed active species Pt promoted the selective production of 1, 3-propanediol from
glycerol over Pt/AlPO4 catalyst.

Chapter 3
104 | P a g e
References
[1] T. M. Che, US Patent. (1987) 4,642,394.
[2] E. Drent, W. Jager, US Patent. (2000) 6,080,898.
[3] J. Chaminand, L. Djakovitch, P. Gallezot, P. Marion, C. Pinel, C. Rosier, Green Chem. 6
(2004) 359-361.
[4] T. Kurosaka, H. Maruyama, I. Naribayashi, Y. Sasaki, Catal. Commun. 9 (2008) 1360-
1363.
[5] L. Huang, Y. Zhu, H. Zheng, G. Ding, Y. Li, Catal. Lett. 131 (2009) 312-320.
[6] Y. Nakagawa, Y. Shinmi, S. Koso, K. Tomishige, J. Catal. 272 (2010) 191-194.
[7] J. Oh, S. Dash, H. Lee, Green Chem. 13 (2011) 2004-2007.
[8] S. Zhu, Y. Qiu, Y. Zhu, S. Hao, H. Zheng, Y. Li, Cat. Today. 212 (2013) 120-126.
[9] Y. Feng, H. Yin, A. Wang, L. Shen, L. Yu, T. Jiang, Chem. Eng. J. 168 (2011) 403-412.
[10] J. Dam, K. Djanashvili, F. Kapteijn, U. Hanefeld, ChemCatChem. 2013, 5, 497-505.
[11] R. Arundhathi, T. Mizugaki, T. Mitsudome, K. Jitsukawa, K. Kaneda, ChemSusChem.
2013, 6, 1345-1347.
[12] J. B. Moffat, Catal. Rev-Sci. Eng. 18 (1978) 199-258.
[13] Y. Sakai, H. Hattori, J. Catal. 42 (1976) 37-47.
[14] R. F. Vogel, G. Marcelin, J. Catal. 80 (1983) 492-493.
[15] A. Schmidmeyer, J. B. Moffat, J. Catal. 96 (1985) 242-250.
[16] H. Itoh, A. Tada, H. Hattori, K. Tanabe, J. Catal. 115 (1989) 244-246.
[17] B. Rebenstorf, T. Lindblad, S. L. T. Andersson, J. Catal. 128 (1991) 293-302.
[18] S. A. El-Hakam, M. R. Mostafa, A. M. Youssef, Adsorp. Sci. Technol. 2 (1995) 345-
348.
[19] J. M. Campelo, A. Garcia, J. M. Gutirez, D. Luna, J. M. Marinas, Colloids Surf. 8 (1984)
353-360.

Chapter 3
105 | P a g e
[20] T. Lindblad, B. Rebenstorf, Z. G. Yan, S. L. T. Anderson, Appl. Catal., A 112 (1994)
187-208.
[21] J. W. Bae, S. M. Kim, S. H. Kang, K.V.R. Chary, Y. J. Lee, H. J. Kim, K. W. Jun, J.
Mol. Catal. 311 (2009) 7-16.
[22] K. V. R. Chary, G. Kishan, K. Ramesh, Ch. Praveen Kumar, G. Vidyasagar, Langmuir.
19 (2003) 4548-4554.
[23] Ch. Srilakshmi, P. S. Sai Prasad, S. K. Rajusth, A. K. Shukla, JEST-M. 2 (2013) 25-33.
[24] P. Ramudu, N. Anand, V. Mohan, G. Muralidhar, P. S. SaiPrasad, B. D. Raju, K. S.
RamaRao, J. Chem. Sci. 2015, 127, 701–709.
[25] V. S. Kumar, A. H. Padmasri, C. V. V. Satyanarayana, A. K. Reddy, B. D. Raju, K. S. R.
Rao, Catal. Commun. 2006, 7, 745-751.
[26] T. Gjervan, R. Prestvik, B. Totdal, C.E. Lyman, A. Holmen, Catal. Today. 2001, 65,
163-169.
[27] F. M. Bautista, J. M. Campelo, A. Garcia, D. Luna, J. M. Marinas, A. A. Romero, G.
Colon, J. A. Navio, M. Macias, J. Catal. 179 (1998) 483-494.
[28] Y. Takitaa, T. Ohkumaa, H. Nishiguchia, K. Nagaokaa, T. Nakajo, App. Catal., A 283
(2005) 47-52.
[29] F. Yaripour, M. Mollavali, Sh. Mohammadi Jam, H. Atashi, Energy Fuels. 23 (2009)
1896-1900.
[30] F. Arena, R. Dario, A. Pamalina, Appl. Catal., A 170 (1998) 127-137.
[31] S. Zhu, Y. Zhu, S. Hao, H. Zheng, T. Mo, Y. Li, Green Chem. 14 (2012) 2607-2616.
[32] J. M. Campelo, A. Garcia, J. F. Herencia, D. Luna, J. M. Marinas, A. A. Romero, J.
Catal. 151 (1995) 307-314.
[33] A. A. Said, K. M. S. Khalil, J. Chem. Technol. Biotechnol. 75 (2000) 196-204.
[34] J.B. Moffat, R. Vetrivel, B. Viswanathan, J. Mol. Catal. 30 (1986) 171-180.

Chapter 3
106 | P a g e
[35] E. van Ryneveld, A. S. Mahomed, P. S. van Heerden, M. J. Green, H. B. Friedrich,
Green Chem. 13 (2011) 1819-1827.
[36] E. S. Vasiliadou, A. A. Lemonidou, Org. Process Res. Dev. 15 (2011) 925-931.
[37] I. Gandarias, P. L. Arias, J. Requies, M. B. Guemez, J. L. G. Fierro, Appl. Catal., B 97
(2010) 248-256.
[38] V. Pavan Kumar, A. Kumar, G. Srinivasa Rao, K. V. R. Chary, Catal. Today. 2014,
doi.org/10.1016/j.cattod.2014.03.036
[39] N. Hamzah, N. M. Nordin, A. H. A. Nadzri, Y. A. Nik, Md. B. Kassim, Md. A. Yarmo,
Appl. Catal., A 419 (2012) 133-141.
[40] V. Pavan Kumar, Y. Harikrishna, N. Nagaraju, K. V. R. Chary, Ind. J. Chem., Sect. A 53
(2014) 516-523.
[41] T. Miyazawa, Y. Kusunoki, K. Kunimori, K. Tomishige, J. Catal. 240 (2006) 213-221.
[42] L. Z. Qin, M. J. Song, C. L. Chen, Green Chem. 12 (2010) 1466-1472.

Chapter 4
107 | P a g e
CHAPTER 4
A Platinum-Tungsten catalyst supported on SBA-
15 for high efficiency conversion of glycerol to 1,3-
propanediol

Chapter 4
108 | P a g e
In this chapter, the efficiency of bifunctional Pt-WO3/SBA-15 catalysts towards selective
conversion of glycerol to 1,3-propanediol has been illustrated. The hydrogenolysis of glycerol to
1,3-propanediol was conducted over a series of Pt-WO3/SBA-15 catalysts with Pt content
ranging from 0.5-3wt% and WO3 content of 10 wt% in vapor phase under atmospheric pressure.
The catalysts prepared via sequential impregnation method were systematically characterized
using XRD, NH3-TPD, Py-FTIR, CO chemisorption, TPR, TEM and surface area measurements.
The catalysts exhibited unprecedented activity for selective formation of 1,3-propanediol via
hydrogenolysis of glycerol. The effect of various reaction parameters such as catalyst loading,
reaction temperature, hydrogen flow rate, glycerol concentration and reaction time were studied.
The optimized reaction conditions showed that a high glycerol conversion (86%) and 1, 3-
propanediol selectivity (42%) was obtained over 2Pt-10WO3/SBA-15 catalyst illustrating the
potential of SBA-15 supported platinum-tungsten catalyst to be highly active and efficient. The
Brønsted acid sites of the catalyst formed due to addition of WO3 enhanced selective formation
of 1,3-propanediol.
The work presented in this chapter has been published:
S. Shanthi Priya, V. P. Kumar, M. L. Kantam, S. K. Bhargava, A. Srikanth and K. V. R. Chary,
High Efficiency Conversion of Glycerol to 1,3-propanediol using a novel Platinum-tungsten
catalyst supported on SBA-15. Ind. Eng. Chem. Res. 54 (2015) 9104−9115.

Chapter 4
109 | P a g e
4.1 Introduction
In the previous chapter, the catalytic performance of AlPO4 supported Pt catalysts
towards selective glycerol hydrogenolysis to 1,3-PDO was studied in detail. The observed
efficiency towards glycerol hydrogenolysis was 35.4% selectivity to 1,3-PDO at 100% glycerol
conversion performed in vapour phase at 230 oC and atmospheric pressure (0.1 MPa). It was
perceived that Brønsted acidity of the catalyst had a significant role in directing the glycerol
hydrogenolysis towards selective formation of 1,3-PDO. In order to verify and understand the
importance of Brønsted acidity of the catalyst in improving the catalytic efficiency and
selectivity to 1,3-PDO in glycerol hydrogenolysis, SBA-15 with no Brønsted acidity was chosen
as support and modified the SBA-15 supported platinum catalyst by introduction of Brønsted
acidic tungsten oxide (WO3) as a promoter/additive. The influence of WO3 loading on the
selective formation of 1,3-PDO by the generation of Brønsted acidic sites in comparison to the
Pt/SBA-15 catalyst is discussed in this chapter.
Hydrogenolysis of glycerol for the selective formation of 1,3-PDO, which is considered
to be an important monomer in the manufacture of polyester fibers, is not easy and extensive
research has been carried out in recent years to develop efficient catalysts for the production of
1,3-PDO [1-4]. Various heterogeneous catalysts based on Ru, Pt, Cu and Ni has been
investigated in the recent past for the glycerol hydrogenolysis to propanediols [5-9]. In view of
the catalytic activity of supported monometallic catalysts, the modified monometallic
catalysts/bifunctional catalysts are unique and assist in improving the catalytic activity due to
new structural and chemical characteristics.
Among all catalysts investigated, tungsten based catalysts were mostly used for selective
glycerol hydrogenolysis to 1,3-propanediol. The combination of Platinum and tungsten based
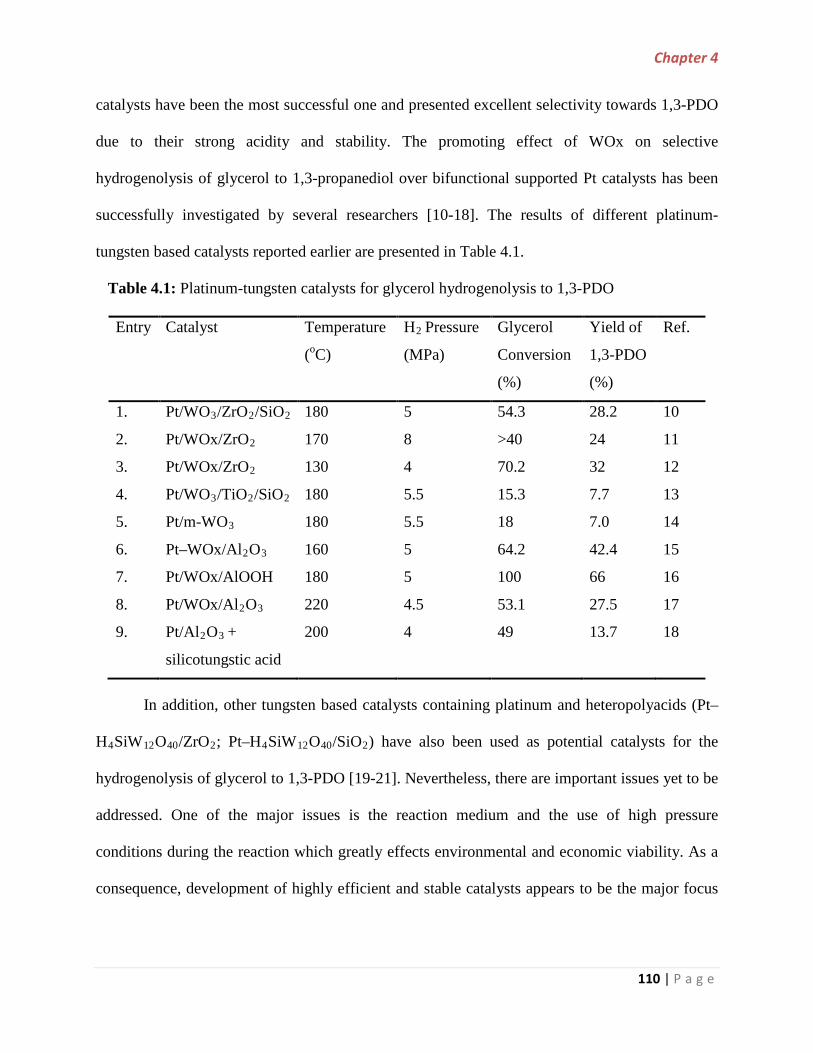
Chapter 4
110 | P a g e
catalysts have been the most successful one and presented excellent selectivity towards 1,3-PDO
due to their strong acidity and stability. The promoting effect of WOx on selective
hydrogenolysis of glycerol to 1,3-propanediol over bifunctional supported Pt catalysts has been
successfully investigated by several researchers [10-18]. The results of different platinum-
tungsten based catalysts reported earlier are presented in Table 4.1.
Table 4.1: Platinum-tungsten catalysts for glycerol hydrogenolysis to 1,3-PDO
Entry Catalyst Temperature
(oC)
H2 Pressure
(MPa)
Glycerol
Conversion
(%)
Yield of
1,3-PDO
(%)
Ref.
1. Pt/WO3/ZrO2/SiO2 180 5 54.3 28.2 10
2. Pt/WOx/ZrO2 170 8 >40 24 11
3. Pt/WOx/ZrO2 130 4 70.2 32 12
4. Pt/WO3/TiO2/SiO2 180 5.5 15.3 7.7 13
5. Pt/m-WO3 180 5.5 18 7.0 14
6. Pt–WOx/Al2O3 160 5 64.2 42.4 15
7. Pt/WOx/AlOOH 180 5 100 66 16
8. Pt/WOx/Al2O3 220 4.5 53.1 27.5 17
9. Pt/Al2O3 +
silicotungstic acid
200 4 49 13.7 18
In addition, other tungsten based catalysts containing platinum and heteropolyacids (Pt–
H4SiW12O40/ZrO2; Pt–H4SiW12O40/SiO2) have also been used as potential catalysts for the
hydrogenolysis of glycerol to 1,3-PDO [19-21]. Nevertheless, there are important issues yet to be
addressed. One of the major issues is the reaction medium and the use of high pressure
conditions during the reaction which greatly effects environmental and economic viability. As a
consequence, development of highly efficient and stable catalysts appears to be the major focus

Chapter 4
111 | P a g e
of interest for selective hydrogenolysis of glycerol to 1,3-PDO in order to provide a sustainable
reaction system.
Initiated by the promising performance of the Pt/WO3 based catalysts described in the
literature, the present chapter focused on the investigation of the novel Pt-WO3 catalyst
supported on SBA-15 for selective formation of 1,3-PDO, in vapor phase under atmospheric
pressure. SBA-15 (Santa Barbara Amorphous) is a well ordered hexagonal mesoporous silica
structure characterized by uniform cylindrical structure, thick walls, and non-intersecting pores
with a pore width to length aspect ratio of 1:1000 [22, 23]. These silica structures exhibit narrow
pore size distributions, large surface areas typically ranging from 600 to 1000 m2/g and pore
diameters in the range of 40 to 80 Å. However the surface areas and pore diameters of SBA-15
depend on wide range of factors such as duration, reaction temperature, and use of swelling
agents or co-solvents. SBA-15 is synthesized using a nonionic tri-block copolymer poly
(ethylene oxide)–poly(propylene oxide)–poly(ethylene oxide) PEO20-PPO70-PEO20,
commercially known as P123 [23]. The most important feature of SBA-15 is its remarkable
hydrothermal stability and finds great prospective use in both nanotechnology and macroscopic
applications [24, 25]. They also find applications in nano based targeted cancer therapy, as
therapeutic agents for drug delivery and as effective carriers for separation and storage [26, 27].
SBA-15 has received considerable attention in catalysis and extensively employed as
catalyst support in recent years because of its unique properties. Various catalysts have been
prepared by using noble metals, and their oxides incorporated into the channels of SBA-15 [28,
29]. Tungsten is one of the most-studied transition metal ions introduced into SBA-15, due to its
appreciable catalytic activity in various reactions. Thus, incorporating tungsten or tungsten oxide
materials into mesoporous materials had displayed significant interest as of their multifarious

Chapter 4
112 | P a g e
compositions with a potential to be applied in catalysis [30]. The selective production of 1,3-
PDO from glycerol involves two reaction steps [17, 19, 31] (1) dehydration of glycerol to 3-
hydroxypropanal over acid sites and (2) hydrogenation of 3-hydroxypropanal to 1,3-PDO over
metal sites. Therefore, coexistence of metal with appropriate acidic component is indispensable
for selective formation of 1,3-PDO from glycerol. In this regard, WO3 can act an active acid
component for glycerol dehydration and Platinum as an effective catalyst for aldehyde
hydrogenation.
Considering this scenario, Pt-WO3/SBA-15 bifunctional catalysts with different amounts
of WO3 (5, 10, 15, 20 wt %) and different loadings of Platinum (0.5, 1, 2, 3 wt%) have been
synthesized by sequential impregnation method and detailed characterization using XRD, NH3-
TPD, Py-IR, CO chemisorption, TEM, TPR, surface area measurements has been performed to
study the structural and chemical properties of catalysts. The performance evaluation of Pt-
WO3/SBA-15 catalysts for the selective hydrogenolysis of glycerol to 1, 3-propanediol in vapor
phase under mild reaction conditions has been carried out. In detail, the effect of reaction
parameters, i.e., catalyst loading, reaction temperature, H2 pressure, feed flow rate and reaction
time, has been studied for the exploration of the reaction performance.
4.2 Experimental section 4.2.1 Catalyst Preparation
4.2.1.1 Synthesis of SBA-15 support
SBA-15 was prepared by the procedure described in the literature [32]. SBA-15 silica
was prepared using P123 block copolymer polyethylene glycol–block-polypropylene glycol–
block-polyethylene glycol, (average molecular mass - 5800, Aldrich) as a template. Initially, in a
mixture of 15 g of water and 45 g of 2 M HCl, 2 g of P123 copolymer was dissolved while

Chapter 4
113 | P a g e
stirring which is followed by the addition of 0.2 g of cetyl trimethyl ammonium bromide
(CTMABr) and 5.9 g of tetraethylorthosilicate (TEOS). The final molar ratio was 1TEOS:
0.02CTMABr: 3.1 HCl: 115H2O: 0.012 Polymer. The as prepared mixture was transferred into a
plastic bottle, sealed and kept at 100 oC for 24 h; it was later cooled down, filtered by washing
with deionized water and ethanol to remove the excess of template prior to calcination. The
obtained product was dried overnight at room temperature, and then subjected to calcination
under nitrogen and oxygen at 550 oC.
4.2.1.2 Synthesis of Pt-WO3/SBA-15 catalyst
The W precursor and Pt precursor of the catalysts were the ammonium metatungstate
hydrate ((NH4)6 (H2W12O40) H2O) and chloroplatinic acid hexahydrate (H2PtCl6 .6H2O)
(analytical grade, produced by Sigma Aldrich Co., Ltd), respectively. The catalysts were
prepared by co-impregnation or sequential impregnation on the SBA-15. For the catalysts
prepared by sequential impregnation method, SBA-15 was first impregnated with W precursor
salt solution, followed by the introduction of Pt precursor salt solution. For the catalysts prepared
by co-impregnation method, a solution containing a mixture of W and Pt precursors salts was
impregnated on SBA-15. The resulting solids were dried at 110 oC and calcined at 500 oC for 3 h
in air after each impregnation step. The amounts of WO3 and Pt were 10 wt% and 0.5-3wt%,
respectively. The prepared catalysts were designated as XPt-YWO3/SBA-15 where X for Pt
loading and Y refers to WO3 loading.
4.2.2 Catalyst characterization
X-ray diffraction (XRD) patterns of the samples were obtained from Rigaku miniflex X-
ray diffractometer and Ni filtered Cu Kα radiation (λ=0.15406 nm). The scans were recorded

Chapter 4
114 | P a g e
from 2θ=2 to 65°, at a scan rate of 2° min−1 at a beam current of 15 mA and a beam voltage of 30
kV respectively.
N2 adsorption-desorption experiments were performed to investigate the surface area and
pore size distribution analysis of the catalysts at −196 °C by the multipoint Brunauer- Emmett-
Teller (BET) and BJH methods using a Autosorb 1 (Quantachrome Instruments, USA).
The temperature-programmed desorption of ammonia (NH3-TPD) was conducted on
AutoChem 2910 unit (Micromeritics, USA) equipped with a thermal conductivity detector
(TCD). Prior to each experiment, 0.1 g of sample was taken in a Quartz U-tube reactor and
initially treated in He (50 mL min−1) at 200 °C for 1 h. The sample was treated in 10 % NH3/He
(50 mL min−1) at 80 oC for 1hr, and then in order to remove physisorbed ammonia the catalyst
was flushed with He (50 mL min−1) for about half an hour at 80 °C. The NH3-TPD analysis was
performed by heating the sample from ambient temperature to 800 °C at a heating rate of
10 oC/min while monitoring the TCD signals.
In order to find the role of Brønsted and Lewis acid sites on the catalytic properties, the
pyridine adsorbed FTIR spectral experiments were carried out in which the catalysts were
initially subjected to activation in N2 flow for 1 h at 300 °C to eliminate moisture content from
the samples. Then the activated catalysts are adsorbed by pyridine at 120 °C up to saturation. The
samples were cooled to room temperature after such activation. FTIR spectra were recorded on
GC-FTIR Nicolet 670 spectrometer by KBr pellet method.
CO-chemisorption experiments were performed on the same instrument as NH3-TPD.
Prior to adsorption measurements, about 0.1 g of the catalyst sample was first reduced at 400 °C
for 3 h in a flow of hydrogen (50 mL/min), then flushing out in a flow of pure helium gas at the
same temperature for 1h. The sample was finally cooled down to ambient temperature in the

Chapter 4
115 | P a g e
same He stream. CO chemisorption was measured by pulse injection of 9.96% CO balanced
helium over the reduced samples at 400 °C. Adsorption of one CO molecule per surface Pt atom
gives the Pt dispersion and average particle size assuming stoichiometric factor CO/Pt as 1.
TPR experiments were carried out on AutoChem 2910 (Micromeritics, USA) instrument
equipped with a thermal conductivity detector (TCD). Initially, the samples were pretreated
under inert gas (Argon, 50 mL/min) at 200 oC for 1 h followed by cooling down to ambient
temperature and the carrier gas consisting of 5% hydrogen balance argon (50 mL/min) was
allowed to pass over the sample increasing the temperature from ambient to 400 oC at a heating
rate of 10 oC/min. The vapors were condensed in a cold trap immersed in liquid nitrogen and
isopropanol slurry. TCD monitors the hydrogen concentration in the effluent stream and the
areas under the peaks were integrated using GRAMS/32 software.
TEM analysis was carried out by dispersing 1mg of catalyst sample in 5 mL of methanol
in an ultrasonic bath for 10-20 min. The suspension was added drop wise onto to a holey carbon
coated copper grid and was allowed to dry in air. Transmission electron microscopy analyses
were performed using a JEOL 2010 microscope.
4.2.3 Catalyst testing
The vapor phase glycerol hydrogenolysis was carried out in a continuous vertical fixed
bed quartz reactor (40 cm length, 9 mm i.d.) under atmospheric pressure. Prior to the reaction,
0.5 g of the catalyst loaded in the reactor was pretreated at 350 °C for 2 h in flowing H2 (60 mL
min−1). After reduction, the reaction system is cooled down to the desired reaction temperature
(210 °C). An aqueous solution of 10 wt% glycerol along with a flow of hydrogen (80 mL/min)
was continuously fed into the reactor through a heated evaporator. The reaction products
condensed in an ice–water trap were collected hourly for analysis on a gas chromatograph

Chapter 4
116 | P a g e
(Shimadzu) equipped with a DB-wax 123-7033 (Agilent) capillary column and equipped with
flame ionization detector. Additionally, the content of carbon in spent catalysts was determined
by CHNS Analyzer- ELEMENTAR Vario micro cube model (results shown in Table 4.3). The
carbon mass balance was found to be >98%. The glycerol conversion and selectivity of products
were calculated according to the following equations:
Conversion (%) =moles of glycerol (in) − moles of glycerol (out)
moles of glycerol (in) × 100
Selectivity (%) =moles of one productmoles of all products
× 100
4.3 Results and discussion 4.3.1 Characterization of catalysts
4.3.1.1 Low Angle XRD
The low angle XRD patterns of pure SBA-15, WO3/SBA-15 and 0.5-3 wt% Pt-
WO3/SBA-15 samples are presented in Figure 4.1(A). The XRD patterns of the all synthesized
materials exhibit three peaks well resolved at low angle 2θ of 0.9°, 1.7°, and 1.9° corresponding
to the (100), (110), and (200) planes respectively. The Braggs reflections, confirm the hexagonal
symmetry (P6mm) of the SBA-15 material. The observation is found to be in accordance with
the x-ray diffraction patterns of pure SBA-15 material described in the previous studies [33, 34]
demonstrating that the synthesized Pt-WO3/SBA-15 materials retain a two-dimensional well-
ordered mesoporous structure with a hexagonal symmetry.

Chapter 4
117 | P a g e
Figure 4.1 (A): Low angle XRD patterns of pure SBA-15 and various Pt-WO3/SBA-15 catalysts
(a) SBA-15 (b) WO3/SBA-15 (c) 0.5Pt-WO3/SBA-15 (d) 1Pt-WO3/SBA-15 (e) 2Pt-
WO3/SBA-15 (f) 3Pt-WO3/SBA-15
4.3.1.2 Wide Angle XRD
The wide angle XRD patterns of pure SBA-15, WO3/SBA-15 and various Pt-WO3/SBA-
15 catalysts in the 2θ range of 10–75°are presented in Figure 4.1(B). All the samples show a
broad peak ranging from 2θ = 15°–30°due to the presence of amorphous silica [35]. As shown in
Figure 4.1(B), WO3/SBA-15 and Pt-WO3/SBA-15 catalysts show peaks in 2θ region 23.08°,
23.58°, 24.26°, 26.54°, 28.75°, 33.28°, 41.66°, 49.74°, and 55.71° characteristic of monoclinic
WO3 [36, 37] which are not seen in the pattern of the SBA-15 itself. It clearly indicates that those
are the representative peaks of monoclinic WO3. The intensity of the peaks is not altered which
is a clear indication that the tungsten content (10 wt %) remained constant in all the samples. The
Pt crystalline planes (111) and (200) corresponding to 2θ= 39.8° and 46.1° are revealed in the
(A)

Chapter 4
118 | P a g e
catalysts and the intensity of the peaks increases with loading which implies the crystallization of
Pt at higher loadings.
(B) Wide angle XRD patterns of pure SBA-15 and various Pt-WO3/SBA-15 catalysts
(a) SBA-15 (b) WO3/SBA-15 (c) 0.5Pt-WO3/SBA-15 (d) 1Pt-WO3/SBA-15 (e) 2Pt-
WO3/SBA-15 (f) 3Pt-WO3/SBA-15
4.3.1.3 Pyridine adsorbed FTIR
Pyridine adsorbed FTIR spectroscopy was used for characterization of surface acidity and
to assess the types of acid sites of the Pt-WO3/SBA-15 catalysts. Figure 4.2 displays the FTIR
spectra of pure SBA-15 and 0.5-3 wt% Pt-WO3/SBA-15 catalysts recorded after the pyridine
adsorption. All spectra contained bands at 1545 cm−1 due to the presence of pyridinium ions on
Brønsted acid sites; at 1455 cm−1 characteristic of Lewis site and at 1490 cm−1 which is
associated with both Brønsted and Lewis sites. It is observed that pure SBA-15 possessed only
Lewis acidic sites (a band at 1455 cm-1). Existence of the characteristic bands of the pyridinium
(B)

Chapter 4
119 | P a g e
ion at 1545 cm−1 indicates the presence of Brønsted acid sites on the surface [38]. The generation
of Brønsted acidity is related to the tungsten oxide incorporation and the generation of surface
Lewis acid sites at 1450cm−1 is related to the silica structure of SBA-15 support.
Figure 4.2: Pyridine adsorbed FTIR patterns of pure SBA-15, WO3/SBA-15 and various Pt-
WO3/SBA-15 catalysts
(a) SBA-15 (b) WO3/SBA-15 (c) 0.5Pt-WO3/SBA-15 (d) 1Pt-WO3/SBA-15 (e) 2Pt-
WO3/SBA-15 (f) 3Pt-WO3/SBA-15
4.3.1.4 CO-chemisorption
The percentage of platinum dispersion, and average particle size of platinum were
measured from the irreversible CO-chemisorption on Pt-WO3/SBA-15 catalysts with varying Pt
loadings (0.5-2 wt %) and the results are illustrated in Table 4.2. The results demonstrate that
there is an increase in CO uptake value with rise in Pt loading on SBA-15 support. It is also
observed that the increase in the particle size of Pt with loading is due to the fact that Pt particles

Chapter 4
120 | P a g e
agglomerate on the support. With increase in platinum loading from 0.5 to 3 wt% on SBA-15, it
was found that the platinum dispersion decreases from 14.5% to 3.7%. The incorporation of
tungstate species into the catalyst substantially led to a decrease in the Pt dispersion. In contrast,
Zhu et al. [10] found that the incorporation of SiO2 into Pt/WO3/ZrO2 catalyst decreased particle
size of platinum markedly and Pt dispersion has been improved simultaneously. The results from
CO chemisorption are well consistent with those obtained from TEM and XRD.
Table 4.2: Results of CO-chemisorption on Pt-WO3/SBA-15 catalysts
Catalyst Dispersion (%)
CO uptake (µmol/g)
Metal area (m2/gcat)
Particle sizea (nm)
Particle sizeb (nm)
0.5Pt-10WO3/SBA-15 14.5 0.083 0.17 7.7 8.0
1Pt-10WO3/SBA-15 10.1 0.116 0.25 11.1 12.8
2Pt-10WO3/SBA-15 5.7 0.132 0.28 19.5 20.3
3Pt-10WO3/SBA-15 3.7 0.130 0.28 29.9 28.2
2Pt-10WO3/SBA-15c 2.9 0.068 0.12 46.8 -- a Determined from CO uptake values; b Determined from TEM analysis; c Co-impregnated catalyst.
4.3.1.5 BET Surface Area and Pore Size Distribution Studies
The pore size distributions and the N2 adsorption-desorption isotherms of pure SBA-15,
10WO3/SBA-15 and XPt-10WO3/SBA-15 catalysts with varying Pt contents are illustrated in
Figure 4.3 (A&B). The parameters describing pore structure of all the samples including BET
surface area (SBET), total pore volume (VP) and pore diameter (DBJH) obtained from N2
adsorption-desorption measurements are listed in Table 4.3. The results show that the surface
area of pure SBA-15 is 758 m2/g and decreased further with the introduction of WO3 and
platinum onto the support. The considerable decrease in the surface area is attributed to the
blockage of pores of SBA-15 by the deposition of tungstate species and platinum. SBA-15 shows
a mesopore diameter (DBJH) of 6.60 nm, while samples of WO3/SBA-15 and Pt-WO3/SBA-15

Chapter 4
121 | P a g e
exhibit smaller pore diameters and pore volumes (Table 4.3). The surface area, pore diameter
and pore volume decreased drastically in 3Pt-WO3/SBA-15 compared to other samples. From
Scherrer equation using X-ray line broadening method, the size of particles of WO3 crystallites
having an average diameter of 70-83 nm was determined. From the results of CO-
Chemisorption, the particle size of Pt was found to be in the range of 7.7-29.9 nm depending on
the Pt content. Therefore it is clearly evident that the Pt and WO3 show uniform distribution
within the SBA-15 channels, and there is partial tungsten and Pt incorporation into the
framework of SBA-15.
Table 4.3: Physicochemical properties and acidities of various catalysts
Catalyst SBET (m2/g)
DBJH(nm) Vp (cc/g) aCarbon (%) from CHNS analysis
bAcidity
(µmol/g)
Pure SBA-15 758 6.60 1.77 -- 22
10WO3/SBA-15 616 6.59 1.75 -- 75
0.5Pt-10WO3/SBA-15
586 6.53 1.69 1.54 89
1Pt-10WO3/SBA-15 550 6.45 1.66 1.46 112
2Pt-10WO3/SBA-15 504 (486) 5.63 (4.02) 1.62 1.39 102
3Pt-10WO3/SBA-15 442 3.46 1.40 1.83 84 SBET: BET surface area; DBJH: Average pore diameter; Vp : Total pore volume. aCarbon estimated after
the 7 h continuous operation on the used catalysts. bAcidity measurements from NH3-TPD analysis. In
Parentheses, surface area & pore diameter of 2Pt-10WO3/SBA-15 catalyst prepared by co-impregnation
method.
For higher active species content, no uniform distribution of Pt and WO3 within the
channels and on intrachannel surfaces of SBA-15 was observed, and a higher proportion of
framework Pt and tungsten oxide species was there on the exterior of the support. The decrease
of the surface area can be ascribed to formation of large platinum particles, evidenced from XRD
results. This might be due to blockage of the pores of SBA-15 support and the presence of a

Chapter 4
122 | P a g e
layer of WO3 on the surface walls of SBA-15 [39]. As can be seen from Figure 4.3 (A), the
isotherms of SBA-15, WO3/SBA-15 and Pt-WO3/SBA-15 demonstrate typical type IV features
with H1 hysteresis loop [40]. Taken together, the results suggest that samples possess a well-
ordered mesoporous structure. The pore size distribution results are well in agreement with the
results of X-ray diffraction studies.
Figure 4.3: (A) Nitrogen adsorption-desorption isotherms and (B) BJH pore size distribution of
pure SBA-15 and various Pt-WO3/SBA-15 catalysts
(a) SBA-15 (b) WO3/SBA-15 (c) 0.5Pt-WO3/SBA-15 (d) 1Pt-WO3/SBA-15 (e) 2Pt-
WO3/SBA-15 (f) 3Pt-WO3/SBA-15
4.3.1.6 Temperature programmed desorption of ammonia (NH3-TPD)
The ammonia TPD method was employed to assess the strength of acid sites present on
the catalyst surface, along with the total acidity. The NH3 desorption profiles for the catalysts
with different WO3 loadings are presented in Figure 4.4, and the values of total acidity
(corresponding amounts of adsorbed NH3) are given in Table 4.3. Generally, the NH3-TPD
peaks can be classified into different strength of acid sites, weak acid sites at 150-300 oC,
medium acid sites at 300-400 oC and strong acid sites at 450-650 oC, respectively [41]. As shown
0.0 0.2 0.4 0.6 0.8 1.0
f
e
d
c
b
a
Volu
me (
cc/g
)
Relative Pressure (P/P0)
(A
0 50 100 150 200 250 300 350 400
f
e
d
c
b
a
Deso
rptio
n Dv
(logd
)(cc/g
)
Pore diameter (Ao)
(B

Chapter 4
123 | P a g e
in Figure 4.4, the TPD profile of SBA-15 and Pt/SBA-15 material showed no evident peaks,
indicating that the samples had no acid sites. On the contrary, the Pt-WO3/SBA-15 samples
presented broad NH3-TPD profiles in the interval 200-270 oC and 570-640 oC, implying that the
catalysts show a narrow distribution of sites with weak and strong acidic strength. This result
demonstrates that the introduction of WO3 contributed increased acid strength of the catalysts
[36]. Moreover, with the increasing WO3 loading, the total amount of acid sites increased
gradually, reached maximum over 2Pt-10WO3/SBA-15, and then declined slightly. Thus, the
NH3-TPD results revealed that 10 wt% WO3 species contributed sufficient acid sites which are
known to be necessary for 1,3-PDO formation.
Figure 4.4: NH3-TPD profiles of pure SBA-15, Pt-SBA-15 and various 2Pt-YWO3/SBA-15
catalysts
(a) SBA-15 (b) Pt/SBA-15 (c) 2Pt-5WO3/SBA-15 (d) 2Pt-10WO3/SBA-15 (e) 2Pt-
15WO3/SBA-15 (f) 2Pt-20WO3/SBA-15

Chapter 4
124 | P a g e
4.3.1.7 Temperature programmed reduction (H2-TPR)
TPR profiles of various Pt-WO3/SBA-15 catalysts are shown in Figure 4.5 and the H2
uptake values are reported in Table 4.4. All of the samples exhibited peaks around 630 oC and
790 oC which are associated with the reduction of the supported WO3 species. From the
literature, it is known that bulk WO3 exhibits three main peaks in the TPR profile with maxima
at 630, 790, and 910 oC [38, 42]. The peaks could be due to the sequential reduction of WO3 to
W(0). The first reduction peak at 630 oC is related to the partial reduction of WO3 to tungsten-
oxide (WO2.9), whereas simultaneous reduction of WO2.9 oxide and of remaining WO3 to WO2
phase occurs at approximately 790 oC. The last reduction peak corresponds to reduction of WO2
to form metallic tungsten (W0).
Figure 4.5: H2 TPR profiles of various Pt-WO3/SBA-15 catalysts
(a) SBA-15 (b) 0.5Pt-WO3/SBA-15 (c) 1Pt-WO3/SBA-15 (d) 2Pt-WO3/SBA-15 (e)
3Pt-WO3/SBA-15

Chapter 4
125 | P a g e
The reduction peak at higher temperatures was not revealed due to experimental
conditions. Moreover, Horsley et al. [42] observed that the reduction of isolated tungsten oxide
species was not easy. The reduction to the metallic phase occurred in a temperature range
comprised between 300-400 oC for the Pt-WO3 catalysts supported on SBA-15. de Lucas et al.
[43] found that the reduction behavior of the tungsten-based silica catalysts increased with
decrease in the degree of metal oxide interaction with the support surface. No TPR peaks were
noticed below 700 oC in pure SBA-15; hence, the reduction peaks observed could be assigned
only to the reduction of Pt and WO3 only.
Table 4.4: Results of temperature programmed reduction of various Pt-WO3/SBA-15 catalysts
Pt (wt%) Tmax1 H2 uptake
(µmol/g) Tmax
2 H2 uptake (µmol/g)
Total H2 uptake (µmol/g)
0.5Pt-10WO3/SBA-15 309 19.6 619 38.0 57.6
1.0Pt-10WO3/SBA-15 326 45.8 633 29.1 74.9
2.0Pt-10WO3/SBA-15 328 31.7 640 74.1 105.8
3.0Pt-10WO3/SBA-15 321 23.1 626 25.5 48.6 1Temperature maximum (T max
1) at peak 1; 2Temperature maximum (T max2) at peak 2.
4.3.1.8 Transmission electron microscopy (TEM)
TEM images of 2Pt-10WO3/SBA-15 catalysts reveal that the samples attain the
hexagonally ordered porous structure. The channels of SBA-15 are found to be distorted in some
respects. Therefore, it is evident that tungsten content significantly affected the mesoporous
structure of SBA-15, and is consistent with the pore size distribution and XRD pattern [37]. The
morphology of platinum particles is determined by using TEM analysis.

Chapter 4
126 | P a g e
Figure 4.6: TEM images of various Pt-WO3/SBA-15 catalysts
(a) 0.5Pt-WO3/SBA-15 (b) 1Pt-WO3/SBA-15 (c) 2Pt-WO3/SBA-15 (d) 3Pt-WO3/SBA-15
4 5 6 7 8 9 10 11 120
1
2
3
4
5
6
7
Plati
num
(%)
Platinum particles
0.5Pt-WO3/SBA-15Mean size:8.0 nm
9 10 11 12 13 14 15 16 170
1
2
3
4
5
6
Plati
num
(%)
Platinum particles
1Pt-WO3/SBA-15Mean size:12.8 nm
16 18 20 22 240
1
2
3
4
5
Plati
num
(%)
Platinum particles
2Pt-WO3/SBA-15Mean size:20.1 nm
20 25 30 350
1
2
3
4
5
6
7
Plati
num
(%)
Platinum particles
3 Pt-WO3/SBA-15Mean size:28.2 nm

Chapter 4
127 | P a g e
The TEM pictures of 0.5, 1, 2 and 3 wt% Pt-WO3/SBA-15 catalysts are presented in
Figure 4.6. It can be clearly seen that the platinum particles are uniformly distributed in all the
samples. The particle size of platinum for 0.5 wt% was found to be 8.0 nm, however, at high
platinum loadings the particle size tend to increase and were found to be 12.8 nm, 20.3 and 28.2
nm for 1, 2, and 3 wt% respectively (Table 4.2). The increased crystallite size indicates the
formation of bigger particles and results in decrease in the dispersion. The results from TEM are
well correlated with those obtained from XRD and CO chemisorption studies.
4.3.2 Catalyst Evaluation
Glycerol hydrogenolysis is a complex process that involves many reactions. Therefore, to
achieve high selectivity towards the desired product, promoting the target reactions and
inhibiting the side reactions were proved to be very important. The hydrogenolysis of glycerol in
vapor phase was performed over Pt-WO3/SBA-15 catalysts in a fixed-bed reactor at 210 oC and
atmospheric pressure. The predominant products were 1,3-propanediol (1,3-PDO), 1,2-
propanediol (1,2-PDO), hydroxyacetone (HA) and propanols (1-PrOH + 2-PrOH). Other
products such as ethanol, acetone, methanol, and acetaldehyde have also been detected in trace
amounts (Scheme 4.1). The propanediol selectivity depends on a wide number of factors such as
the catalyst components, operating conditions and additives.
Scheme 4.1: Hydrogenolysis of glycerol to various products

Chapter 4
128 | P a g e
4.3.2.1 Effect of impregnation method
Initially, the effects of impregnation methods (co-impregnation and sequential
impregnation) on the catalytic performance of SBA-15 supported Pt-WO3 catalysts for glycerol
hydrogenolysis were investigated under the reaction condition of 210 oC and atmospheric
pressure. Generally, the preparation method of catalysts is one of the basic factors that play an
prominent role in the activity of catalysts. The changes in impregnation strategy lead to
pronounced changes in the catalytic activities. It is interesting to note that a drastic activity
increase occurred over the catalysts prepared by sequential impregnation than those prepared by
co-impregnation method. The increase in glycerol conversion and selectivities to various
products was remarkably high (86 % glycerol conversion) over sequentially impregnated
catalysts when compared with those prepared by co-impregnation method (19% glycerol
conversion) (Table 4.6). This behavior may be attributed to the good interaction of active species
with support during sequential impregnation which can enhance the performance of the catalysts.
The results of CO-chemisorption show that the metal dispersion (Table 4.2) has been
decreased and in turn the particle size increased to a larger extent than that of the sequentially
impregnated catalyst. This means that co-impregnated catalyst has Pt crystallites with relatively
large sizes because of agglomeration of Pt particles on the support. It is believed that the low
dispersion of Pt and poor interaction between active species and support resulted in the lower
activities of the co-impregnated catalysts. Also, a considerable decrease in the surface area and
average pore diameter (Table 4.3) has been observed in co-impregnated catalysts, than the
sequential impregnated catalysts which might be due to pore blockage by active species.
The catalytic activity is therefore considerably enhanced over a high surface area and
well dispersed catalyst prepared via sequential impregnation method as the catalytic action takes

Chapter 4
129 | P a g e
place on specific sites on the catalyst surface, called active sites. This agrees with the results of
Kurosaka et al. [22]. Figueiredo et al. [44] found that the catalyst prepared by sequential
impregnation method of bimetallic Pt and Sn catalysts supported on activated carbon was more
active than those prepared by co-impregnation method for Benzene hydrogenation. Therefore,
the Pt-WO3/SBA-15 catalysts prepared by sequential impregnation method were chosen for
further optimization studies.
In a bi-functional process, hydrogenolysis reaction involves two crucial steps to
transform glycerol to 1, 3-PDO: the dehydration of glycerol to 3-hydroxy propionaldehyde (3-
HPA) over acidic sites (tungsten oxide species) followed by hydrogenation of intermediates on
active sites of metal (Pt). Therefore, the optimized ratio of metal Pt to WO3 appears to be more
essential in order to achieve a high selectivity towards 1,3-PDO.
4.3.2.2 Influence of WO3 loading
The effect of WO3 loading (5 wt %-20 wt %) on the conversion of glycerol over Pt–
WO3/SBA-15 was examined and the results obtained were listed in Table 4.5. Generally, the
tungsten component is necessary to promote the selectivity to 1,3-PDO because it is probably
beneficial for the dehydration of the secondary –OH group in glycerol to produce 3-HPA. For the
WO3-free catalyst, the main product obtained was 1,2-PDO with a selectivity of 21%, and only
6.8% 1,3-PDO selectivity was obtained. On contrary, with the introduction of WO3, the
selectivity of 1,3-PDO was elevated greatly, up to 22% with simultaneous increase in the
conversion of glycerol from 52% to 74%. The enhancement in the selectivity of 1,3-PDO with
the incorporation of WO3 into the catalyst can be ascribed to the generation of Bronsted acid
sites by WO3 species, evidenced from Pyr FTIR results, significant for the dehydration of
glycerol to 3-HPA which leads to the formation of 1,3-PDO [24]. Moreover, the selectivity of

Chapter 4
130 | P a g e
1,3-PDO has been increased with the rise of WO3 loading, attaining maximum (42%) when the
WO3 loading was 10wt%. But further increasing the WO3 loading to 15 wt % and 20 wt %, the
glycerol conversion remained almost unchanged but the selectivity to 1,3-PDO declined to
27%.This implied that 10 wt% WO3 loading was appropriate for selective conversion of glycerol
to 1,3-PDO. These results are in well agreement with NH3-TPD studies.
Table 4.5: Effect of WO3 loading on glycerol hydrogenolysis to 1,3-PDOa
Selectivity (%)
WO3 loading Conversion (%)
1,3-PDO 1,2-PDO HA 1-PrOH 2-PrOH Others
SBA-15 -- -- -- -- -- -- --
2Pt/SBA-15 52 6.8 24 12 21 18 18.2
2Pt-5WO3/SBA-15 74 22 19 15 22 18 4
2Pt-10WO3/SBA-15 86 42 11 17 17 10 3
2Pt-15WO3/SBA-15 88 34 20 12 15 13 6
2Pt-20WO3/SBA-15 88 27 23 19 15 9 7 aReaction conditions: 0.5 g catalyst; Reaction temperature: 210 oC, 0.1 MPa H2; H2 flow rate: 80 mL/min;
WHSV-1.02 h-1; 1,3-PDO: 1,3-propanediol, 1,2-PDO: 1,2-propanediol, 1-PrOH: 1-propanol, 2-PrOH: 2-
propanol, HA: Hydroxyacetone, Others include methanol, acetone, ethanol, and acetaldehyde.
4.3.2.3 Influence of Pt loading
Table 4.6 explains the effect of Pt loading (0.5-3 wt %) on the catalytic performance of
Pt-WO3/SBA-15 catalysts during glycerol hydrogenolysis. With increase in Pt content from 0.5-
3wt %, there was a steady growth in the conversion of glycerol from 70% to 89%. As shown in
Table 4.6, with the rise of Pt loading the selectivity to 1,3-PDO increased, and reached the
highest (42%) at 2 wt% loading. Chary et al. [45] demonstrated the selective hydrogenolysis of
glycerol to 1,3-PDO over Pt/AlPO4 catalyst and attained maximum selectivity (35.4%) to 1,3-
PDO at 2 wt% Pt loading. However, further increase in Pt loading to 3 wt% led to a slight

Chapter 4
131 | P a g e
reduction in the selectivity towards 1,3-PDO. The other hydrogenolysis product 1,2-PDO is also
produced in lesser amounts. In addition, significant amounts of excessive hydrogenolysis
products such as 1-propanol and 2-propanol have been detected in good amounts at higher
loadings which imply that higher Pt loadings generate more hydrogenolysis active sites. Hence,
an optimal amount of platinum (2 wt%) should be loaded on 10WO3/SBA-15 in order to attain
high selectivity to 1,3-PDO.
Table 4.6: Effect of Pt loading on glycerol hydrogenolysis to 1,3-PDOa
Selectivity (%)
Pt loading
(wt%)
Conversion (%)
1,3-PDO 1,2-PDO HA 1-PrOH 2-PrOH Others
0.5 70 28 7 23 20 12 10
1.0 74 30 12 19 24 10 5
2.0 86 (19) 42 (12) 11 (23) 17 (16) 17 (10) 10 (18) 3 (21)
3.0 89 35 10 15 18 14 8 aReaction conditions: 0.5 g XPt-10WO3/SBA-15 catalyst (X = 0.5 to 3.0 wt%); Reaction temperature:
210 oC, 0.1 MPa H2; H2 flow rate: 80 mL/min; WHSV-1.02 h-1; 1,3-PDO: 1,3-propanediol, 1,2-PDO:
1,2-propanediol, 1-PrOH: 1-propanol, 2-PrOH: 2-propanol, HA: Hydroxyacetone, Others include
methanol, acetone, ethanol, and acetaldehyde. In Parentheses, conversion and selectivity over 2Pt-
10WO3/SBA-15 catalyst prepared by co-impregnation method is presented.
4.3.2.4 Influence of reaction temperature
The effect of reaction temperature on glycerol hydrogenolysis was studied over Pt-
WO3/SBA-15 catalyst (optimal loading of 2 wt% Pt and 10 wt% WO3) within the temperature
range 150 oC-250 oC under atmospheric pressure. The related experimental results are
summarized in Figure 4.7. The conversion of glycerol monotonically increased from 65% to
91% along with rise in temperature from 150 oC to 250 oC. Previous studies also suggest that
increasing reaction temperature had a positive influence on the glycerol conversion [10, 16]. The

Chapter 4
132 | P a g e
highest 1,3-PDO selectivity of 42% was obtained at reaction temperature of 210 oC but further
increase in temperature resulted in decrease of 1,3-PDO selectivity together with an increase of
1,2-PDO and HA selectivity. The increasing temperature would accelerate the glycerol
hydrogenolysis to 1,2-PDO with promoted C–O bond scission. At the temperature higher than
210 oC, the selectivity of other products showed negligible variation while a sharp decline in 1,3-
PDO selectivity was observed. From the results, it is suggested that the reaction temperature
210 oC is more favorable for the dehydration of secondary hydroxyl group of glycerol and allow
the hydrogenolysis reaction more selective to 1,3-PDO.
Figure 4.7: Effect of Reaction temperature on hydrogenolysis of glycerol to 1,3-PDO Reaction conditions: Reaction temperature = 150, 180, 210, 230 & 250 oC; H2 Flow rate = 80 mL/min; WHSV – 1.02h-1
150 160 170 180 190 200 210 220 230 240 2500
10
20
30
40
50
60
70
80
90
0
10
20
30
40
50
60
70
80
90
Selec
tivity
(%)
Conv
ersio
n (%
)
Reaction Temperature (oC)
Conversion of glycerol Selectivity of 1,3-PDO Selectivity of 1,2-PDO Selectivity of HA Selectivity of 1-PrOH Selectivity of 2-PrOH Selectivity of Others

Chapter 4
133 | P a g e
4.3.2.5 Influence of hydrogen flow rate
Figure 4.8 shows the influence of hydrogen flow rate on glycerol hydrogenolysis over the
Pt-WO3/SBA-15 catalyst. Since hydrogen is one of the reactants in hydrogenolysis reaction,
hydrogen flow rate would essentially enhance the glycerol conversion and product selectivity. A
steady growth in glycerol conversion from 70% to 88% was observed with increase of hydrogen
flow rate in the range of 40 mL/min to 100 mL/min, along with an increase in the selectivity to
1,3-PDO reaching maximum (42%) at 80 mL/min hydrogen flow rate with simultaneous
decrease in the selectivity of propanols. A similar observation has been reported over a
Pt/WO3/ZrO2 catalyst [23]. However further increase of hydrogen flow rate leads to increase in
the selectivity to propanols which may be ascribed to increase in the concentration of H+ and H-
on the catalyst surface and promote excessive hydrogenation.
Figure 4.8: Effect of H2 Flow rate on hydrogenolysis of glycerol to 1,3-PDO. Reaction conditions: Reaction temperature = 210 oC; H2 Flow rate = 40, 60, 80 & 100 mL/min, WHSV – 1.02 h-1.
40 60 80 1000
10
20
30
40
50
60
70
80
90
0
10
20
30
40
50
60
70
80
90
Selec
tivity
(%)
Conv
ersio
n (%
)
H2 flow rate (mL/min)
Conversion 1,3-PDO 1,2-PDO HA 1-PrOH 2-PrOH Others

Chapter 4
134 | P a g e
4.3.2.6 Influence of glycerol concentration
Experiments were performed by varying the glycerol concentration (5 wt % to 20 wt %)
over the optimized catalyst 2Pt-10WO3/SBA-15 and the results are shown in Figure 4.9.
Increased glycerol concentration shows a negative influence on glycerol conversion and the
selectivity to 1,3-PDO. The maximal 1,3-PDO selectivity was achieved with 10 wt% glycerol
feed. Miyazawa et al. [46] also observed similar findings. Besides the major product, glycerol
concentration influenced the product distribution of 1,2-PDO, HA and propanols with
comparable differences in the selectivities. These results are in accordance with the previous
reports [47, 48] according to which the decrease in the glycerol conversion is expected with the
increase in the glycerol content.
Figure 4.9: Effect of Glycerol concentration on hydrogenolysis of glycerol to 1,3-PDO Reaction conditions: Reaction temperature = 210 oC; H2 Flow rate = 80 mL/min; WHSV – 1.01 h-1, 1.02 h-1, 1.03 h-1& 1.04 h-1.
5 10 15 200
10
20
30
40
50
60
70
80
90
0
10
20
30
40
50
60
70
80
90
Selec
tivity
(%)
Conv
ersio
n (%
)
Glycerol concentration (wt%)
Conversion of glycerol Selectivity of 1,3-PDO Selectivity of 1,2-PDO Selectivity of HA Selectivity of 1-PrOH Selectivity of 2-PrOH Selectivity of Others

Chapter 4
135 | P a g e
4.3.2.7 Influence of contact time (W/F)
In order to exploit the potential effect of the 2Pt-10WO3/SBA-15 catalyst on glycerol
conversion and selectivity towards desired product, the hydrogenolysis reaction was examined
by varying the contact time at a constant temperature of 210 oC. The W/F was varied from 0.4 to
1.0 g mL−1 h by changing the catalyst weight at a fixed glycerol feed rate and the results are
shown in Figure 4.10. With rise in contact time from 0.4 to 1.0 g mL-1 h, it is evident that
glycerol conversion increased from 66% to 86%, while the selectivity to 1,3-PDO elevated to
42% from 20%. However the selectivity of 1,2-PDO slightly decreased with prolonged contact
time and does not affect the selectivity of other products to a greater extent. As has been noted,
the results specify that longer contact time favors the maximum glycerol conversion with
increased 1,3-PDO selectivity.
Figure 4.10: Effect of Contact time on hydrogenolysis of glycerol to 1,3-PDO Reaction conditions: Reaction temperature = 210 oC; H2 Flow rate = 80 mL/min, Glycerol feed: 0.5 mL/hr; W/F = 0.4, 0.6, 0.8,
1.0 g ml-1 h.
0.4 0.6 0.8 1.00
20
40
60
80
0
20
40
60
80
Selec
tivity
(%)
Conv
ersio
n (%
)
W/F (g ml-1 h)
Conversion 1,3-PDO 1,2-PDO HA 1-PrOH 2-PrOH Others

Chapter 4
136 | P a g e
4.3.2.8 Influence of Weight hourly space velocity (WHSV)
The effect of WHSV on the conversion of glycerol and selectivity of 1,3-PDO was
investigated and the results are depicted in Figure 4.11. It was found that the glycerol conversion
and 1,3-PDO selectivity decreased from 86% to 68% and from 42% to 15%, with increase in
WHSV from 1.021 h-1 to 4.084 h-1 respectively. In contrast, the selectivity of other products such
as 1,2-PDO, HA, propanols has been enhanced. These results demonstrate that maximum 1,3-
PDO selectivity was obtained at lower WHSV owing to the longer contact time. Since the
available number of active sites remain unchanged the decrease in the glycerol conversion and
product selectivities at higher WHSV (high feed flow rate) is as expected [49].
Figure 4.11: Effect of WHSV on hydrogenolysis of glycerol to propanediols. Reaction conditions: Reaction temperature = 210 oC; H2 Flow rate =80 mL/min; WHSV – 1.02 h-1, 2.04 h-1, 3.06 h-1& 4.08 h-1
1 2 3 40
20
40
60
80
0
20
40
60
80
Selec
tivity
(%)
Conv
ersio
n (%
)
WHSV (h-1)
Conversion 1,3-PDO 1,2-PDO HA 1-PrOH 2-PrOH Others

Chapter 4
137 | P a g e
4.3.2.9 Influence of reaction time
As the reaction progressed, both the glycerol conversion and the selectivity of 1,3-PDO
gradually increased (Figure 4.12). At 3 h, the highest glycerol conversion of 86% and 1,3-PDO
selectivity of 42% was acquired. However, the maximum conversion and selectivity remained
stable till 4 h, and subsequently dropped with time. Later on when the reaction time was
extended, the glycerol conversion slightly dipped to 84% whereas considerable decrease in the
selectivity of 1,3-PDO from 42% to 36% was observed at the end of 7 h. It is therefore
concluded that a reaction time of 4h was sufficient to provide sufficient active sites for glycerol
conversion and 1,3-PDO formation, but the too long reaction time might lead to the aggregation
of active Pt species, thus allowing coke formation. This could lower the probability of C-O
hydrogenolysis and increase the formation of degradation products in greater amounts, which
could be due to rapid deactivation of acid sites in the catalyst system.
Figure 4.12: TOS on hydrogenolysis of glycerol to 1,3-PDO Reaction conditions: Reaction temperature = 210 oC; H2 Flow rate = 80 mL/min, WHSV – 1.02 h-1.
1 2 3 4 5 6 730
40
50
60
70
80
90
30
40
50
60
70
80
90
Selec
tivity
(%)
Conv
ersio
n (%
)
Time (h)
Conversion of Glycerol Selectivity of 1,3-PDO

Chapter 4
138 | P a g e
4.3.3 Structural aspects of spent catalyst
Besides the catalytic performance, the reusability of catalyst is also a very important
matter to evaluate the stability of the catalyst. In this regard, the best activity shown catalyst 2Pt-
10WO3/SBA-15 was repeated for glycerol hydrogenolysis in order to investigate the catalytic
performance and to study the possible reasons for deactivation. The spent catalyst was first
treated in air at 300 °C for 3 h followed by reduction in flow of H2 (60 mL min−1) at 350 °C for 2
h in order to consider the reusability of catalyst. The regenerated catalyst was then tested in the
hydrogenolysis of glycerol under similar reaction conditions and the results are shown in Table
4.6.The spent catalyst was characterized by various techniques such as XRD, TEM, BET surface
area, CHNS analysis and NH3-TPD. The obtained results are compared with the fresh samples to
determine the performance and behavior in terms of stability. As shown in Table 4.7, the results
depict that the selectivity to 1,3-PDO declined to 34% from 42% although decrease in the
glycerol conversion was not much distinct. The surface area and acidity of the spent catalyst
slightly altered as compared with the fresh sample. The amount of carbon deposited on the used
catalysts was deduced from CHNS analysis (Table 4.3) and caused a decrease in the surface area
due to the formation of carbon on surface acid sites and blockage of mesopores.
Table 4.7: Studies of the spent catalyst 2Pt-10WO3/SBA-15
Catalyst Conversion (%) Selectivity of 1,3-PDO
BET SA aAcidity (µmol/g)
Fresh 86 42 504 112
Spent 81 34 487 98 aAcidity from NH3-TPD analysis
In addition, the wide angle XRD pattern for 2Pt-10WO3/SBA-15 (spent) reveals sharp
diffraction lines at 2θ=39.7° indicating the presence of large Pt particles on the exterior of the
support (Figure 4.13). This is further supported by TEM of spent 2Pt-10WO3/SBA-15 catalyst

Chapter 4
139 | P a g e
which provided additional information on the morphology of the sample. As can be seen from
Figure 4.13, the difference in the size distribution of Pt particles of the samples is evident. The
spent catalyst displayed larger particles (Mean size Pt= 22 nm), a distinct change compared with
the fresh sample (Mean size Pt= 20 nm). Therefore, the results suggest that slight deactivation of
catalyst was likely the result of coke deposition and aggregation of Pt particles which resulted in
the decreased BET surface area and acidity of the catalyst.
A. B.
Figure 4.13: A. Wide angle XRD pattern of spent 2Pt-WO3/SBA-15; B. TEM image of spent 2Pt-WO3/SBA-15 catalyst
14 16 18 20 22 24 26 28 30
Plati
num
(%)
Platinum particles
Spent 2Pt-WO3/SBA-15 Mean size (22.5 nm)
A
B

Chapter 4
140 | P a g e
4.3.4 Reaction mechanism of glycerol hydrogenolysis over Pt-WO3/SBA-15 catalyst.
The possible reaction mechanism of glycerol hydrogenolysis to 1,3-PDO over Pt-
WO3/SBA-15 is proposed based on our experimental investigations (shown in Scheme 4.2).
According to the previous studies [16, 19, 50] formation of propanediols proceeds through
dehydration-hydrogenation route which involves acid catalyzed dehydration of glycerol to acetol
and 3-HPA and subsequent hydrogenation over metal catalysts to give 1,2-PDO and 1,3-PDO
respectively. The formation of dehydrated intermediate usually depends on the type of acidic
sites that exist in the catalytic system. Previous researches [19, 50, 51] suggest that Lewis acidic
sites favor the dehydration of glycerol to acetol whereas 3-HPA is formed on Brønsted acidic
sites. This scenario is in good corroboration with our results. It is worth mentioning that the main
product was 1,2-PDO in of Pt/SBA-15 catalyst (Table 4.5), due to its large Lewis acidic sites.
Scheme 4.2: Selective hydrogenolysis of glycerol to 1,3-PDO over Pt-WO3/SBA-15
In contrast, addition of WO3 to Pt/SBA-15 catalysts enhanced the activity of catalyst and
selectivity of 1,3-PDO remarkably because of the increased Brønsted acidic sites. First, glycerol
was adsorbed on the surface of WO3 species anchoring on SBA-15 support with simultaneous
protonation of secondary hydroxyl group of glycerol on Brønsted acidic sites generated by

Chapter 4
141 | P a g e
tungsten component. The dehydration of secondary hydroxyl group produces carbenium ion and
further leads to the formation of 3-HPA intermediate via keto-enol tautomerism. The hydrogen
activated on the Pt metal facilitates the hydrogenation of 3-HPA to release 1,3-propanediol. On
the other hand, HA is also formed due to the presence of Lewis acidic sites generated by SBA-15
and subsequent hydrogenation to 1,2-PDO. These mechanisms further lead the side-reactions of
glycerol hydrogenolysis such as over hydrogenolysis into propanols. Additionally, acetaldehyde
is formed by the decomposition of 3-HPA whereas trace amounts of ethanol, acetone and
methanol are produced by degradation of propanediols. Therefore, the vapor phase glycerol
hydrogenolysis over Pt-WO3/SBA-15 is a two-step process involving acid catalyzed dehydration
followed by successive hydrogenation. The predominant product 1,3-PDO is considered to be
formed mainly by Brönsted acid sites of the catalyst.
4.4 Conclusions
A simple and facile approach for the selective production of 1,3-PDO have been
successfully demonstrated effectively via hydrogenolysis of glycerol, in the vapor phase over Pt-
WO3/SBA-15 catalysts. The Pt-WO3/SBA-15 catalysts with varying Pt loadings were
synthesized by sequential impregnation, systematically characterized and their catalytic
performance has been evaluated.
• XRD studies show that the synthesized Pt-WO3/SBA-15 catalysts possess well-ordered
crystalline mesoporous structure and WO3 exists in the monoclinic phase.
• NH3-TPD and Pyr FTIR studies reveal that the incorporation of WO3 species into the
catalyst remarkably increased the acid strength of the catalysts and led to the generation
of Brønsted acid sites which improved the selective formation of 1,3-PDO.

Chapter 4
142 | P a g e
• CO-chemisorption results suggest that the incorporation of tungstate species into the
catalyst substantially led to a decrease in the Pt dispersion.
• The high surface area of SBA-15 and hexagonal ordered mesoporous structure is well
established from N2 adsorption-desorption studies and the particle size of platinum was
found to be in the range of 8 nm-30 nm from TEM analysis.
• The reducibility of Pt and WO3 species and its interaction with SBA-15 is understood
from the TPR studies.
In comparison to monometallic Pt/SBA-15 catalyst, the bifunctional Pt-WO3/SBA-15
catalyst resulted in greater activity and 1,3-PDO selectivity which can be ascribed to the
Brønsted acidity of the catalyst, good dispersion of Pt, high surface area, unique large pore
diameters and the increased interaction between active species and support. The catalyst with
optimal loadings of 2 wt% Pt and 10 wt% WO3 on SBA-15 presented the highest activity and
selectivity under the reaction condition of 210 oC and atmospheric pressure. 86% conversion of
glycerol with 42 % selectivity to 1,3-PDO was achieved. The results suggest that Brønsted acid
sites for dehydration and the active sites for hydrogenation were provided by WO3 species and
Pt respectively, in the bifunctional dehydration-hydrogenation reaction mechanism.

Chapter 4
143 | P a g e
References [1] Y. Amada, Y. Shinmi, S. Koso, T. Kubota, Y. Nakagawa, K. Tomishige, Appl. Catal., B. 105
(2011) 117–127.
[2] L. Huang, Y. Zhu, H. Zheng, G. Ding, Y. Li, Catal. Lett. 131 (2009) 312-320.
[3] Y. Nakagawa, Y. Shinmi, S. Koso, K. Tomishige, J. Catal. 272 (2010) 191-194.
[4] J. Oh, S. Dash, H. Lee, Green Chem. 13 (2011) 2004-2007.
[5] V. P. Kumar, S. S. Priya, Y. Harikrishna, A. Kumar, K. V. R. Chary, J. Nanosci. Nanotech.
15 (2015) 1–9.
[6] Y. Kusunoki, T. Miyazawa, K. Kunimori, K. Tomishige, Catal. Commun. 6 (2005) 645–649.
[7] S. S. Priya, V. P. Kumar, M. L. Kantam, S. K. Bhargava, K. V. R. Chary, RSC Adv. 4 (2014)
51893-51903.
[8] M. A. Dasari, P.P. Kiatsimkul, W. R. Sutterlin, G. J. Suppes, Appl. Catal., A. 281 (2005)
225–231.
[9] A. Perosa, P. Tundo, Ind. Eng. Chem. Res. 44 (2005) 8535-8537.
[10] S. Zhu, X. Gao, Y. Zhu, J. Cui, H. Zheng, Y. Li, Appl. Catal., B. 158–159 (2014) 391–399.
[11] T. Kurosaka, H. Maruyama, I. Naribayashi, Y. Sasaki, Catal. commun. 9 (2008) 1360-1363.
[12] L. Z. Qin, M. J. Song, C. L. Chen, Green Chem. 12 (2010) 1466-1472.
[13] L. Gong, Y. Lu, Y. Ding, R. Lin, J. Li, W. Dong, T. Wang, W. Chen, Appl.Catal., A. 390
(2010) 119–126.
[14] L. Longjie, Z. Yanhua, W. Aiqin, Z. Tao, Chin. J. Catal. 33 (2012) 1257–1261.
[15] S. Zhu, X. Gao, Y. Zhu, Y. Li, J. Mol. Catal., A. 398 (2015) 391–398.
[16] R. Arundhathi, T. Mizugaki, T. Mitsudome, K. Jitsukawa, K. Kaneda, ChemSusChem. 6
(2013) 1345-1347.

Chapter 4
144 | P a g e
[17] S. G. Fernandez, I. Gandrias, J. Requies, M. B. Guemez, S. Bennici, A. Auroux, P. L. Arias,
323, (2015) 65-75.
[18] J.t. Dam, K. Djanashvili, F. Kapteijn, U. Hanefeld, ChemCatChem. 5 (2013) 497-505.
[19] S. Zhu, Y. Qiu, Y. Zhu, S. Hao, H. Zheng, Y. Li, Catal. Today. 212 (2013) 120-126.
[20] S. Zhu, X. Gao, Y. Zhu, Y. Zhu, X. Xiang, C. Hu, Y. Li, Appl. Catal., B. 140–141, 2013,
60–67.
[21] S. Zhu, Y. Zhu, S. Hao, L. Chen, B. Zhang, Y. Li, Catal. Lett. 142 (2012) 267-274.
[22] P. Yang, D. Zhao, D. I. Margolese, B. F. Chmelka, G. D. Stucky, Nature. 396 (1998) 152-
155.
[23] F. Jiao, P. G. Bruce, Angew. Chem. Int. Ed. 43 (2004) 5958-5961.
[24] K. Ariga, A. Vinu, Y. Yamauchi, Q. Ji, J. P. Hill, Bull. Chem. Soc. Jpn. 85 (2012) 1-32.
[25] Z. Li, J. C. Barnes, A. Bosoy, J. F. Stoddart, J. I. Zink, Chem. Soc. Rev. 41 (2012) 2590-
2605.
[26] W. Xuan, C. Zhu, Y. Liu, Y. Cui, Chem. Soc. Rev. 41 (2012) 1677-1695.
[27] F. Tang, L. Li, D. Chen, Adv. Mater. 24 (2012) 1504-1534.
[28] J. Guo, R. Ruan, Y. Zhang, Ind. Eng. Chem. Res. 51 (2012) 6599-6604.
[29] V. P. Kumar, Ch. S. Srikanth, A. N. Rao, K. V. R. Chary, J. Nanosci. Nanotech. 13 (2013)
1–10.
[30] U. Ciesla, D. Demuth, R. Leon, P. Petroff, G. Stucky, K. Unger, F. Schuth, J. Chem. Soc.
Chem. Commun. (1994) 1387-1388.
[31] Y. Nakagawa, M. Tamura, K. Tomishige, J. Mater. Chem. A. 2 (2014) 6688-6702.
[32] D. Y. Zhao, J. Feng, Q. Huo, N. Melosh, G. H. Fredrickson, B. F. Chmelka, G. D. Stucky,
Science. 279 (1998) 548-552.
Chapter 4
145 | P a g e
[33] D. Zhao, Q. Huo, J. Feng, B. F. Chmelka, G. D. Stucky, J. Am. Chem. Soc. 120 (1998)
6024- 6036.
[34] V. Mazzieri, N. Figoli, F. Pascual, P. L. Argentiere, Catal. Lett. 102 (2005) 79-82.
[35] J. Barbier, Jr. F. Delanoe, F. Jabouille, D. Duprez, J. B. G. Isnard, J. Catal. 177 (1998) 378-
385.
[36] A. Bordoloi, S. B. Halligudi, Appl. Catal., A. 379 (2010) 141–147.
[37] L. Hu, S. Ji, Z. Jiang, H. Song, P. Wu, Q. Liu, J. Phys. Chem. C. 111 (2007) 15173-15184.
[38] E. P. Parry, J. Catal. 2 (1963) 371–379.
[39] A. S. de. Oliveira, S. J. S. Vasconcelos, J. R. de. Sousa, F. F. de. Sousa, J. M. Filho, A. C.
Oliveira, Chem. Eng. Journal. 168 (2011) 765–774.
[40] A. Bordoloi, S. B. Halligudi, J. Catal. 257 (2008) 283–290.
[41] X. L. Yang, W. L. Dai, R. Gao, K. Fan, J. Catal. 249 (2007) 278–288.
[42] J. A. Horsley, I. E. Wachs, J. M. Brown, G. H. Via, F. D. Hardcastle, J. Phys. Chem. 91
(1987) 4014-4020.
[43] A. de. Lucas, J. L. Valverde, P. Canizares, L. Rodriguez, Appl. Catal., A. 172 (1998) 165-
176.
[44] A. E. Aksoylu, M. Madalena, A. Freitas, J. L. Figueiredo, Appl. Catal., A. 192 (2000) 29–
42.
[45] S. S. Priya, V. P. Kumar, M. L. Kantam, S. K. Bhargava, K. V. R. Chary, Catal. Lett. 144
(2014) 2129–2143.
[46] T. Miyazawa, Y. Kusunoki, K. Kunimori, K. Tomishige, J. Catal. 240 (2006) 213-221.
[47] N. Hamzah, N. M. Nordin, A. H. A. Nadzri, Y. A. Nik, Md. B. Kassim, Md. A. Yarmo,
Appl. Catal., A. 419 (2012) 133-141.

Chapter 4
146 | P a g e
[48] S. S. Priya, V. P. Kumar, M. L. Kantam, S. K. Bhargava, S. Periasamy, K. V. R. Chary,
Appl. Catal., A. 498 (2015) 88–98.
[49] V. P. Kumar, Y. Harikrishna, N. Nagaraju, K. V. R. Chary, Indian J. Chem., Sect. A. 53
(2014), 516-523.
[50] S. G. Fernandez, I. Gandarias, J. Requies, M. B. Guemez, S. Bennici, A. Auroux, P. L.
Arias, J. Catal. 323 (2015) 65-75.
[51] A. Alhanash, E. F. Kozhevnikova, I. V. Kozhevnikov, Appl. Catal., A. 378 (2010) 11–18.

Chapter 5
147 | P a g e
CHAPTER 5 A highly efficient H-mordenite supported
Platinum catalyst for selective hydrogenolysis of
glycerol to 1,3-propanediol

Chapter 5
148 | P a g e
This chapter describes a detailed study on catalytic performance of mordenite
supported platinum catalysts. A highly selective catalyst consisting of platinum supported on
mordenite zeolite was employed for the first time in glycerol hydrogenolysis to produce 1,3-
propanediol performed in vapour phase under atmospheric pressure. The catalysts with
varying Pt content (0.5-3wt%) were prepared by wet impregnation method and thoroughly
characterized by X-ray Diffraction (XRD), Temperature Programmed Desorption of
Ammonia (NH3-TPD), FTIR of adsorbed pyridine CO chemisorption, Transmission Electron
Microscopy (TEM), X-ray photoelectron spectroscopy (XPS) and BET surface area. The
influence of metal loading, reaction temperature, hydrogen flow rate, contact time and weight
hourly space velocity (WHSV) has been studied to reveal the optimized reaction conditions.
A high 1,3-propanediol selectivity (48.6%) was obtained over 2 wt% Pt/H-mordenite catalyst
with 94.9% glycerol conversion under the conditions of 10% glycerol content, 225 °C
reaction temperature and normal atmospheric pressure. The efficiency of glycerol
hydrogenolysis mainly depends on the acidity of the support and Pt dispersion. The
selectivity towards 1,3-propanediol depends on the concentration of Brønsted acid sites in the
catalyst. A plausible reaction mechanism has been proposed. The spent catalyst exhibited
consistent activity and selectivity towards the desired product during glycerol hydrogenolysis
reaction.
The work presented in this chapter has been published:
S. Shanthi Priya, , P. Bhanuchander, V.P. Kumar, D. Deepa, PR. Selvakannan, M. L.
Kantam, S. K. Bhargava, K. V. R. Chary, Platinum supported on H-Mordenite: A highly
efficient catalyst for selective hydrogenolysis of glycerol to 1,3-PDO. ACS Sustainable
Chemistry & Engineering 4 (2016) 1212−1222.
Chapter 5
149 | P a g e
5.1 Introduction
In the previous chapter, the efficiency of a bifunctional Pt-WO3/SBA-15 catalyst
towards glycerol hydrogenolysis was presented in detail. In particular, the effect of
introduction of WO3 into the supported platinum catalyst particularly in enhancing the
selective formation of 1,3-PDO was described. The Brønsted acid sites provided by WO3
played a key role in improving the selectivity of 1,3-PDO to 42% at 86% glycerol
conversion. To further verify the role of Brønsted acidic sites in controlling the 1,3-PDO
selectivity, a support containing strong Brønsted acidity was chosen to disperse Pt without
adding any external Brønsted acid additive. The present chapter deals with the catalytic
performance of H-mordenite supported platinum (Pt/HM) catalyst for selective conversion of
glycerol to 1,3-PDO. The potential use of H-mordenite as a Brønsted acidic catalyst support
in enhancing the selectivity of 1,3-PDO without the use of an additive/promoter is discussed
in this chapter.
As described in the introduction chapter, glycerol hydrogenolysis to propanediols
generally proceeds via dehydration-hydrogenation route over a typical bifunctional catalyst
system consisting of a metal for hydrogenation and an acid component for dehydration [1, 2].
Moreover, the type of propanediol produced depends on the selective cleavage of primary or
secondary hydroxyl group of glycerol. As aforementioned, there are two possible pathways in
hydroxyl group selective removal, namely, the hydroxyacetone (HA) pathway and the 3-
hydroxypropionaldehyde (3-HPA) pathway, of which the 3-HPA pathway has been most
challenging. HA could be produced by the coordination of Lewis acid to primary hydroxyl
group of glycerol and further hydrogenation gives 1,2-PDO. According to the theory of 3-
HPA pathway, the secondary hydroxyl group of glycerol is dehydrated by Brønsted acid to
form 3-HPA, followed by catalytic hydrogenation to 1,3-PDO. Therefore, the presence of a
Brønsted acid in the catalyst is necessary to selectively produce 1,3-PDO [3].

Chapter 5
150 | P a g e
The acidic strength and textural properties significantly influence the selectivity to
1,3-PDO through the hydrogenolysis of glycerol. A number of homogeneous and
heterogeneous bifunctional metal-acid catalysts, combining acid sites for dehydration and
metal sites for hydrogenation reaction, have been attempted for the conversion of glycerol to
1,3-PDO either in the liquid phase or gas phase [4-8]. While metals including Cu, Pt, Ru, Ir,
Re and Rh have been extensively used as the active components for hydrogenolysis of
glycerol [9-12], platinum stand in the forefront of the metals presenting a high activity for
glycerol hydrogenolysis. Most effective catalysts for 1,3-PDO production contain a noble
metal with tungsten or rhenium as an acid additive [13-17]. Nevertheless, the inherent
disadvantage of existing processes ascends from the usage of liquid acids and organic
solvents accompanied with high reaction pressure which violates environment protection.
Accordingly, careful design of alternative heterogeneous solid acid catalyst and its usage
under mild reaction conditions is highly desirable for practical application.
HO OH
OH
Glycerol
HO
O
O OH
HO
OH
HO OH
Acetol
3-HPA
1,2-Propanediol
1,3-Propanediol
H2
H2
Lewis acid
Bronsted acid
-H2O
Metal
Metal
Scheme 5.1: Reaction Pathways of Glycerol hydrogenolysis
Protonic zeolites are one of the most widely used acidic catalysts in industry [18].
They are microporous crystalline materials that exhibit an outstanding catalytic performance
because of their explicit properties such as high Brønsted acidity, shape selectivity, facile
regeneration and thermal stability [19, 20]. Most of the research work in gas phase
dehydration of glycerol to acrolein was focused on the use of zeolites due to their versatility.
HY zeolite supported Ru catalysts employed for the hydrogenolysis of glycerol exhibited the
Chapter 5
151 | P a g e
best catalytic performance with 60.1% glycerol conversion and 81.3% selectivity to 1,2-PDO
at 220 oC and 3 MPa H2 pressure [21].
Mordenite, composed of Na8Al8Si40O96∙nH2O, is one of the most important protonic
zeolites applied in catalysis and various reactions such as alkylation, hydroisomerization, and
dewaxing processes [22, 23]. As a Brønsted acidic zeolite with a multiple pore system, H-
mordenite has received much attention in both industrial and academic research [24, 25].
Platinum is known for its high dispersion on zeolite supports. The interaction of metal
particles with the acid sites of the mordenite provides promising possibilities for the design of
bifunctional catalysts. Therefore, a bifunctional catalyst having Brønsted acidity and
hydrogenation properties would be beneficial for the catalytic conversion of glycerol to 1, 3-
PDO. Undeniably, there is also a necessity to develop innovative, novel, and greener catalytic
processes to convert glycerol into more valuable 1,3-PDO over a highly efficient catalyst.
In an endeavour to develop an environmentally benign and economically viable
method of glycerol hydrogenolysis, the present chapter aimed at investigating the catalytic
performance of various loadings of Pt/HM catalysts for vapour phase selective conversion of
glycerol to 1,3-PDO in a continuous fixed bed reactor under atmospheric pressure. The
product distribution as a function of different reaction variables, viz. metal loading, the
reaction temperature, hydrogen flow rate, WHSV and the contact time, is also presented to
determine the favourable reaction conditions. In addition, the coke deposition on a spent
catalyst is also studied that could give a deeper understanding of the changes in the catalytic
performance and catalyst deactivation. There is no study in the literature so far on
hydrogenolysis of glycerol to 1,3-PDO over Pt/HM catalyst and the research work described
herein is the first of its type in effective use of H-mordenite as a catalyst support for selective
production of 1,3-PDO via glycerol hydrogenolysis. In the never ending search for new and
highly efficient catalysts, H-mordenite supported platinum catalyst was found to be highly

Chapter 5
152 | P a g e
active for selective glycerol hydrogenolysis to 1,3-PDO where in the support itself provides
appropriate Brønsted acid sites required for dehydration of glycerol without the use of an
external additive/promoter in the catalyst.
5.2 Experimental section
5.2.1 Preparation of catalysts
Protonated form of the mordenite zeolite with SiO2/Al2O3 ratio of 20 was obtained
from Conteka, The Netherlands (BET-surface area~540 m2/g). Chloroplatinic acid
hexahydrate (H2PtCl6.6H2O) (analytical grade, produced by Sigma Aldrich Co., Ltd) was
used as a precursor on the support. A series of platinum catalysts with varying platinum
loading from 0.5-3.0 wt% was prepared by wet impregnation method. The prepared catalysts
were dried overnight at 110 oC and subsequently calcined at 550 oC for 4 h in air. The
prepared catalysts were designated as XPt/HM where X refers to Pt loading.
5.2.2. Characterization of catalysts
The crystallinity of the zeolite structure was verified by X-ray diffraction (XRD)
analysis on a Rigaku miniflex X-ray diffractometer instrument operating with Ni filtered Cu
Kα radiation (λ=0.15406 nm) generated at 30 kV and 15 mA. The diffraction scans were
measured from 2θ=2 to 65°, at a scan rate of 2°min−1.
The acidity of the catalysts was measured by TPD of ammonia on AutoChem 2910
(Micromeritics, USA) instrument. 100 mg of each sample was flushed with high purity
helium (50 mL min−1) at 200 °C for 1 h after which the sample was saturated with a mixture
of 10% NH3–He (50 mL min−1) at 80 °C for 1 h. The physisorbed ammonia was
subsequently removed from the sample in a He flow (50 mL min−1) at 80 °C for 30 min.
During the TPD analysis, temperature was raised to 700 °C at a heating rate of 10 °C min−1
and the amount of desorbed NH3 was measured using GRAMS/32 software.

Chapter 5
153 | P a g e
FTIR study of pyridine adsorbed samples was also carried out to analyse the nature of
acidic sites. In a typical experiment, the catalysts were first activated in N2 flow at 300 °C for
1 h to remove moisture from the samples followed by adsorption of pyridine on the activated
catalysts at 120 °C until reaching saturation, after which the samples were cooled to room
temperature. FTIR spectra of the catalysts were recorded on the GC-FTIR Nicolet 670
spectrometer by KBr disc method under ambient condition.
Nitrogen adsorption–desorption experiments were performed at −196 °C using
Autosorb 1 (Quantachrome instruments) by the multipoint BET method with 0.0162 nm2 as
its cross-sectional area in order to determine the textural properties.
CO-chemisorption measurements were performed on AutoChem 2910
(Micromeritics, USA) instrument equipped with a TCD detector. Prior to adsorption, 0.1 g of
the sample was reduced in flowing hydrogen (50 mL/min) at 300 °C for 3 h, flushed with
helium gas at 300 °C for 1 h and then cooled to ambient temperature. CO uptake was
measured by injecting several pulses of 9.96% CO balanced helium over the reduced samples
at 300 °C in regular intervals. Platinum dispersion and average particle size were calculated
assuming the stoichiometric factor (CO/Pt) as 1.
The morphologies of Pt as well as mordenite were evaluated by Transmission
Electronic Microscopy (TEM) on a high resolution JEOL 2010 microscope for which the
1mg of reduced sample is allowed to disperse in 5ml of methanol for 10 min by sonication. A
drop of suspension was then mounted onto to a carbon film coated holey copper grid.
X-ray photoelectron spectroscopy was employed to study the surface chemical
composition of catalysts. XPS measurements were obtained with a Thermo K-5 Alpha XPS
instrument at a pressure better than 1 × 10⁻⁹ torr with core levels aligned with C 1s binding
energy of 285 eV.

Chapter 5
154 | P a g e
5.2.3 Reaction procedure
Glycerol hydrogenolysis was performed in a vertical fixed bed quartz reactor (40 cm
length, 9 mm i.d.) in vapor phase under atmospheric pressure. In a typical run, 0.5 g of
catalyst was loaded in the constant temperature zone of the reactor. Prior to the reaction, the
catalysts were reduced in flowing H2 (40 mL min−1) at 350 °C for 2 h. After cooling down to
the reaction temperature (225 °C), 10 wt% aqueous glycerol solution combined with a flow
of hydrogen (60 mL/min) was continuously fed into the reactor through syringe perfusor. The
condensed reaction mixture collected in an ice–water trap was analysed every hour on a gas
chromatograph GC-2014 (Shimadzu) equipped with a DB-wax 123-7033 (Agilent) capillary
column and FID. CHNS Analyzer- ELEMENTAR Vario micro cube model was used to
determine the carbon content in catalysts (results shown in Table 3). Generally, carbon mass
balance was found to be >98% during the steady state. The percentage of glycerol converted
and selectivity of products were obtained by the following expressions:
Conversion (%) = moles of glycerol (in)−moles of glycerol (out)moles of glycerol (in) × 100
Selectivity (%) = moles of one productmoles of all products
× 100
5.3 Results and discussion
5.3.1 Characterization techniques
5.3.1.1 Structural characterizations of the catalysts (XRD)
XRD analyses of the calcined Pt/HM samples were used to study the bulk crystallinity
and framework structure of mordenite zeolite. The XRD patterns of Pt/HM samples with
various platinum contents (0.5-3wt %) are shown in Figure 5.1. The typical diffraction peaks
of mordenite-type zeolites mainly located at 2θ = 9.76°, 13.52°, 19.70°, 22.42°, 25.73°,
26.44° and 27.64° were clearly observed in all the samples, agreeing with the diffraction
patterns reported in the literature [26, 27] and which agree to the respective mordenite pattern

Chapter 5
155 | P a g e
quoted in JCPDS File Card No. 80-0645. In addition, the Pt [111] reflection appeared at 2θ =
39.76° and the intensity of the Pt peak increased with loading. However, in Figure 5.1 one
can observe that there was no change in the crystallinity of zeolite structure in spite of
introduction of different percent of Pt loading. Platinum deposition didn’t alter the basic
structure of the HM zeolite, which is a clear indication that textural properties of zeolite
remain the same even after the platinum deposition. The average crystallite sizes are
calculated from Scherer equation using X-ray line broadening method and the results are
presented in Table 5.3. The (111) crystallite of platinum nanoparticles increases marginally
with platinum loadings up to 2 wt % and increased significantly in the case of 3 wt% Pt/HM.
Figure 5.1: XRD patterns of various Pt/HM catalysts
Acidity measurements
Surface acidity and its strength is considered to be a key factor for the hydrogenolysis
of glycerol to 1,3-propanediol, as this reaction occurs on the surface acid sites of catalysts.
NH3-TPD and Py FTIR are the two important techniques generally employed to evaluate the
acidity of the catalysts; the former to determine the acidic strength and amount of acid sites,
the latter method is to find the nature of acidic sites in the catalysts.

Chapter 5
156 | P a g e
5.3.1.2 Temperature programmed desorption of ammonia (NH3–TPD)
The temperature programmed desorption of ammonia (NH3-TPD) profiles of H-
mordenite and various loadings of Pt/H-mordenite catalysts are presented in Figure 5.2. The
the desorption peak area gives the amount of acid sites (Table 5.1) and maximum TPD peak
position can be used to estimate the acid strength. In general, the ammonia desorption peak
maxima can be differentiated at three temperature regions to denote the type of acidic sites as
weak acid sites centered at 150-300 oC, moderate at 300–450 oC and strong acid sites in the
range 450–650 oC respectively [28].
Figure 5.2: TPD of ammonia profiles of various Pt/HM catalysts
The NH3-TPD results of HM and Pt/HM catalysts displayed well resolved desorption
peaks in the low temperature region (157 oC) and high temperature region (470 oC) which
were attributed to weak acid sites and strong acid sites respectively. It indicates that the TPD
peak in low temperature resulted due to non-framework Al sites or possibly the terminal
silanol groups present on the external surface of the zeolite structure whereas the TPD peak
in high temperature region is due to framework Al sites [29]. Peak position did not vary

Chapter 5
157 | P a g e
substantially with the increase in metal loading; however the amount of NH3 adsorbed on the
catalyst decreased with increasing metal loading.
Table 5.1: Physicochemical properties and acidities of pure HM and Pt/HM catalysts
Catalyst SA (m2/g) DBJH(nm) Vp (cc/g) Total acidity
(µmol NH3/g)
Pure HM 527 3.29 0.35 1011.3
0.5Pt/HM 496 3.21 0.33 612.3
1Pt/HM 445 3.08 0.29 535.9
2Pt/HM 398 2.71 0.24 645.5
3Pt/HM 312 2.01 0.19 442.6
SA : BET surface area; DBJH : Average pore diameter; Vp : Total pore volume
5.3.1.3 FTIR of adsorbed Pyridine
To explore further the acidity of catalysts, FTIR spectroscopy is applied to detect
adsorbed pyridine on the catalyst to investigate the nature of acid sites present on the catalyst
and further to quantify them. Pyridine is a useful basic probe molecule to distinguish
accessible Brønsted and Lewis acid sites. Figure 5.3 shows the pyridine adsorbed FTIR
spectra of on HM and Pt/HM catalysts in the region 1400−1600 cm−1. As shown in Figure
5.3, all of the samples exhibit an absorption band at 1448 cm−1 when pyridine coordinates
Lewis acid sites, whereas pyridinium ion adsorbed on Brønsted acid sites shows an
absorption band at 1547 cm−1. On the other hand, a characteristic band corresponding to both
Brønsted and Lewis acid sites appeared at 1490 cm−1 [30, 31]. Furthermore, the absorption
band at 1547 cm−1 was found to be more intense than the band located at 1452 cm−1.
Therefore, these results allow us to conclude that the Brønsted acid sites are predominant in
Pt/HM catalysts than the Lewis acidic sites, as evidenced by pyridine adsorption and IR
spectroscopy. The amount of Brønsted and Lewis acid sites were calculated from the
corresponding spectral band absorbance intensities by using the molar extinction coefficients
[32]. The concentration or number of acidic sites from Pyr FTIR can be calculated using

Chapter 5
158 | P a g e
Lambert-Beer Law. According to the Lambert–Beer law, the concentration c(Y) [μmol cm−3]
of an acidic site Y, i.e. the concentration of pyridine molecules adsorbed at each site
(Brønsted or Lewis), can be calculated from the signal area AY [cm−1] of a related signal.
AY = c(Y) × d × εY
Here, d [cm] is the thickness of the self-supporting disc
εY [cm μmol−1] is the molar extinction coefficient of the pyridine signal at the
acidic sites Y. The results obtained are shown in Table 5.2.
Table 5.2: Brønsted and Lewis acidities of Pt/HM catalysts measured by FTIR with
adsorption of pyridine
Catalyst Brønsted acid sites
(µmol/gcat)a
Lewis acid sites
(µmol/gcat) a
B/L ratio Total acidity
(µmol/gcat) a
Pure HM 334 28 11.9 362
0.5Pt/HM 249 46 5.41 295
1Pt/HM 262 43 6.09 305
2Pt/HM 285 39 7.30 324
3Pt/HM 290 35 8.28 325 aThe amount of acid sites determined by quantifying the desorbed pyridine from Pyr-FTIR.
From the results it is observed that there is a decrease in the total acidity of Pt/HM
samples as compared to that of pure H-mordenite. This could be ascribed to a partial pore
blockage of acidic sites of support by Pt particles, which prevent the interaction of pyridine
molecules with the acidic sites. This result is well correlated with the results of surface area
measurements and NH3-TPD studies (Table 5.1).

Chapter 5
159 | P a g e
Figure 5.3: Pyr FT-IR spectra of various Pt/HM catalysts
Furthermore, it is interesting to observe the changes in acid site distributions in various (0.5-3
wt%) Pt/HM catalysts arising due to interactions between platinum crystallites and acid sites.
This is in accordance with the previous literature which demonstrates that acidity of a zeolite
support can be altered by incorporating Pt particles [33].
5.3.1.4 Physicochemical properties of catalysts
The BET surface areas and pore volumes of pure HM and various loadings of Pt/HM
catalysts are summarized in Table 5.1. The pure H-mordenite sample (HM) had a total
surface area of 527 m2/g with a pore diameter of 3.29 nm. It is observed that the surface area
of all the Pt/HM catalysts was reduced when compared to the pure support as the Pt content
increased. This could be possibly attributed to the blocking or filling of H-mordenite pores by
extra-framework species or by the incorporation of Pt species. The reduction in pore volume
of the catalysts in comparison with the pure support can be explained through the same
assumption.

Chapter 5
160 | P a g e
5.3.1.5 CO-Chemisorption
The irreversible CO-chemisorption on various Pt/HM catalysts was used to measure
the Pt dispersion, average particle size and metal surface area. The results are illustrated in
Table 5.3. The results suggest that there is an increase in the CO uptake value with increase
in Pt loading on HM support up to 2 wt% and decreased slightly in the case of 3 wt% Pt/HM.
This is probably due to the aggregation of platinum particles at higher loadings. From Table
5.3 it is evident that increasing the platinum loading, the metal size notably increased, from
2.9 to 6.7 nm respectively, and with the resultant decline in platinum dispersion (from 48.2%
to 20.7%, respectively). This is for the reason that, at higher loadings, Pt particles
agglomerate on the support due to the increased deposition of platinum on the surface of HM.
Table 5.3: Results of CO Chemisorption and XRD studies
Catalyst Dispersion
(%)
CO uptake
(µmol/g)
Metal area
(m2/gcat)
Particle
sizea (nm)
Avg. size of
crystallitesb (nm)
0.5Pt/HM 48.2 12.34 0.48 2.9 3.1
1Pt/HM 36.9 18.86 0.73 3.8 3.4
2 Pt/HM 31.4 32.18 1.26 4.4 3.9
3 Pt/HM 20.7 31.8 1.24 6.7 6.2 aDetermined from CO uptake values; b Determined from XRD.
5.3.1.6. TEM Analysis
The size and morphology of various HM supported Platinum catalysts (0.5, 1, 2 and 3
wt%) are determined by Transmission Electron Microscopy and are presented in Figure 5.4.
The average particle size of platinum varies from 3 nm to 10 nm with highly dispersed
spherical particles of platinum. The results imply that the platinum particles were largely
found on the exterior of mordenite surface and a small portion of platinum appears to be
placed within the channels of zeolite structure [34]. This indicates the presence of well

Chapter 5
161 | P a g e
dispersed platinum particles on the zeolite surface and is in accordance with the results of
CO-chemisorption and XRD.
Figure 5.4: TEM images of various Pt/HM catalysts
5.3.1.7 Surface chemical states analysis by XPS
XPS analysis of mordenite and mordenite supported platinum catalysts were carried
out to understand the chemical states of platinum and its interaction with the zeolite support.
Figure 5.5 shows the XPS core level spectra of Al 2p, Si 2p and O 1s core levels. Since Al 2p
(present in the mordenite support) and Pt 4f core levels appear (71 eV-76 eV) in the same
region, it’s difficult to decouple the spectra of both levels [35]. In the case of mordenite
support, Al 2p binding energy was observed around 74.4 eV, characteristic of aluminosilicate
materials (Figure 5.5A). However, the binding energy of this Al 2p level shifted to higher

Chapter 5
162 | P a g e
binding energies (75.1 eV) with the significant broadening, as the loading of platinum was
increased. The formation of zero-valent platinum was clearly observed in the case of 2Pt/HM
and 3Pt/HM and their 4f7/2 binding energies were centred on 71.2 eV. In contrast, 0.5Pt/HM
and 1Pt/HM didn’t exhibit the formation of metallic platinum. In addition, the shift in Al 2p
binding energies after platinum impregnation was a clear indication of the metal-support
interaction. Figure 5.5B shows the Si 2p core level spectra and it was deconvoluted into three
chemically distinct silicon oxide species including aluminosilicate, silica and surface silanol
groups. Similar to Al 2p spectra, Si 2p spectra showed significant broadening and shift in
binding energies after platinum loading and this may be the direct consequence of platinum-
mordenite interaction. O1s core level spectra of mordenite support was deconvoluted into
three chemically distinct components and platinum loading exhibit significant broadening
towards lower binding energy region (Figure 5.5C). This is a characteristic feature of metal-
oxygen bond formation and become prominent at higher Pt loading, which may be formed at
the interface of platinum nanoparticles and zeolite oxygen.
Figure 5.5: XPS of HM and various Pt/HM catalysts

Chapter 5
163 | P a g e
5.3.2 Reaction Results -Evaluation of catalytic activity
Catalyst Screening
The catalytic evaluation of glycerol hydrogenolysis over a series of Pt/HM (0.5
wt%-3 wt%) catalysts was performed in vapour phase continuous fixed-bed reactor at
225 oC and atmospheric pressure. The primary products were 1,3-propanediol (1,3-PDO),
1,2-propanediol (1,2-PDO), ethylene glycol (EG) and hydroxyacetone (HA). In addition,
propanols and few degradation products such as ethanol, acetone and methanol were also
detected in small amounts. All the Pt/HM catalysts exhibited higher glycerol conversion and
1,3-PDO selectivity during glycerol hydrogenolysis. In order to selectively produce the
desired products and minimize the negative effects of hydrogenolysis, the reaction
conditions have to be subtly adjusted. Therefore, the present research work was aimed at
systematic optimization of the reaction parameters in order to achieve good conversion and
1,3-PDO selectivity.
5.3.2.1 The effect of Pt loading
In order to determine the optimum catalyst required to obtain maximum selectivity
to 1,3-PDO, the glycerol hydrogenolysis was studied using Pt/HM catalysts with varying Pt
loading (0.5-3 wt%). The results obtained from the effect of Pt loading on the glycerol
conversion and 1,3-PDO selectivity are presented in Table 5.4. With 0.5 wt% platinum
loaded on H-mordenite, 80.5% glycerol was converted, and 1,3-PDO selectivity was 32.4%.
With increase of Pt loading to 2 wt% a linear increase in the glycerol conversion and 1,3-
PDO selectivity was observed, but further increase in Pt loading to 3 wt % shows a
tempered influence on both glycerol conversion and 1,3-PDO selectivity. In addition a
substantial increase in the selectivity of 1,2-PDO and EG was noticed with increase in Pt
loading. Therefore, it can be concluded that 2 wt% Pt/HM catalyst possessed appropriate
number of Pt metal sites required for hydrogenation of reaction intermediate to 1,3-PDO

Chapter 5
164 | P a g e
during glycerol hydrogenolysis. Thereby, the optimal catalyst dosage was chosen to be 2
wt% for further tests.
Table 5.4: Effect of Pt loading on glycerol hydrogenolysis to 1,3-PDOa
Selectivity (%)
Pt
loading
Conversion
(%)
1,3-
PDO
1,2-
PDO
EG HA Others bCarbon
(%)
0.5 80.5 32.4 14 29 9.8 14.8 1.66
1.0 90.4 40.1 11 22 8.3 18.6 1.53
2.0 94.9 48.6 12 25 7.5 6.9 1.47
3.0 77.2 29.9 16 33 5.8 15.3 1.93 aReaction conditions: 0.5 g catalyst; Reaction temperature: 225 oC, 0.1 MPa H2; H2 flow rate: 60
mL/min; WHSV-1.02 h-1; 1,3-PDO: 1,3-propanediol, 1,2-PDO: 1,2-propanediol, EG: Ethylene
glycol, HA: Hydroxyacetone, Others include methanol, acetone, ethanol, 1-propanol and 2-
propanol; aCarbon estimated from CHNS analysis after 8 h continuous operation on the used
catalysts.
5.3.2.2 The effect of reaction temperature
The reaction was investigated at different reaction temperatures ranging from 150 to
250 oC to evaluate the influence of reaction temperature on glycerol conversion and 1,3-
PDO selectivity and the results are shown in Figure 5.6. Previous studies suggested that rise
in reaction temperature showed a positive impact on the glycerol conversion [6]. As
anticipated, conversion of glycerol monotonically increased from 46.2% up to 94.9% with
increase in the temperature from 150 oC to 225 oC. The maximal 1,3-PDO selectivity of
48.6% was achieved at reaction temperature of 225 oC. Noteworthy, the product distribution
varied considerably as temperature raised from 150 oC to 225 oC, but further increase of
temperature to 250 oC caused a decline in glycerol conversion and 1,3-PDO selectivity. This
is because the increase in reaction temperature will accelerate the coking rate of the
catalysts which results in the availability of less number of catalytically active sites to allow
efficient conversion of glycerol [36]. Also higher reaction temperatures would promote

Chapter 5
165 | P a g e
excessive C-O and C-C bond scission resulting in other by-products with decreased 1,3-
PDO selectivity.Therefore, it is suggested that 225 oC reaction temperature was sufficient
enough to promote glycerol hydrogenolysis which might allow activation of secondary
hydroxyl group of glycerol making the hydrogenolysis reaction highly selective to 1,3-
PDO with maximum glycerol conversion.
Figure 5.6: Effect of Reaction temperature on hydrogenolysis of glycerol to 1,3-PDO Reaction conditions: Reaction temperature = 150-250 oC, Reduction temperature = 350 oC ; H2 flow
rate = 60 mL/min; WHSV – 1.02 h-1.
5.3.2.3 The effect of hydrogen flow rate
The influence of the hydrogen flow rate on glycerol hydrogenolysis was investigated
by varying the hydrogen flow rate at 20, 40, 60 and 80 mL/min over 2 wt % of Pt/HM
catalyst at 225 °C under atmospheric pressure. It can be observed from Figure 5.7 that the
glycerol conversion and selectivity of 1,3-PDO increased with hydrogen flow rate up to 60
mL/min. It is obvious that hydrogen being one of the reactants in the glycerol
hydrogenolysis, increase in the hydrogen flow rate results an increase in the glycerol
conversion. This is because the increased amount of protons and hydride ions formed from
150 175 200 225 2500
20
40
60
80
100
0
20
40
60
80
100
Selec
tivity
(%)
Conv
ersio
n (%
)
Reaction temperature (oC)
Conversion Sel of 1,3-PDO Sel of 1,2-PDO Sel of EG Sel of HA Sel of Others
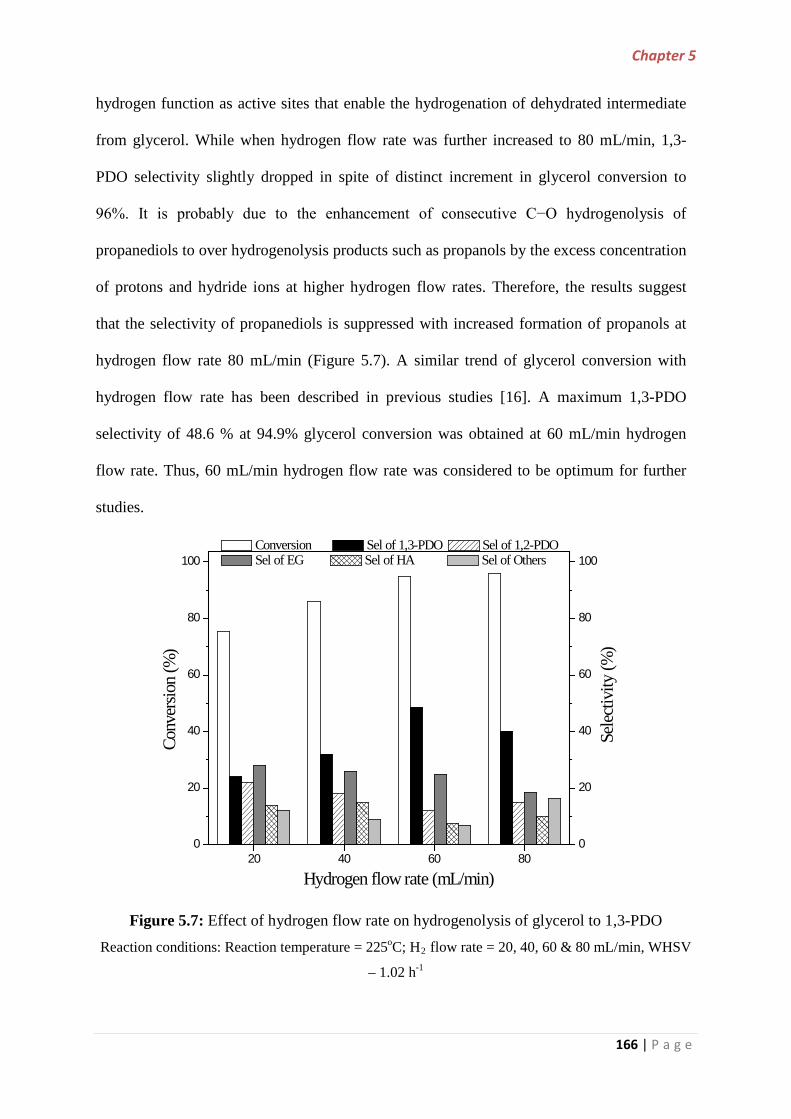
Chapter 5
166 | P a g e
hydrogen function as active sites that enable the hydrogenation of dehydrated intermediate
from glycerol. While when hydrogen flow rate was further increased to 80 mL/min, 1,3-
PDO selectivity slightly dropped in spite of distinct increment in glycerol conversion to
96%. It is probably due to the enhancement of consecutive C−O hydrogenolysis of
propanediols to over hydrogenolysis products such as propanols by the excess concentration
of protons and hydride ions at higher hydrogen flow rates. Therefore, the results suggest
that the selectivity of propanediols is suppressed with increased formation of propanols at
hydrogen flow rate 80 mL/min (Figure 5.7). A similar trend of glycerol conversion with
hydrogen flow rate has been described in previous studies [16]. A maximum 1,3-PDO
selectivity of 48.6 % at 94.9% glycerol conversion was obtained at 60 mL/min hydrogen
flow rate. Thus, 60 mL/min hydrogen flow rate was considered to be optimum for further
studies.
Figure 5.7: Effect of hydrogen flow rate on hydrogenolysis of glycerol to 1,3-PDO Reaction conditions: Reaction temperature = 225oC; H2 flow rate = 20, 40, 60 & 80 mL/min, WHSV
– 1.02 h-1
20 40 60 800
20
40
60
80
100
0
20
40
60
80
100
Selec
tivity
(%)
Conv
ersio
n (%
)
Hydrogen flow rate (mL/min)
Conversion Sel of 1,3-PDO Sel of 1,2-PDO Sel of EG Sel of HA Sel of Others

Chapter 5
167 | P a g e
5.3.2.4 The effect of contact time (W/F)
The influence of the contact time (W/F) on the hydrogenolysis of glycerol was
investigated over a constant feed rate of glycerol by changing the weight of 2Pt/HM catalyst
and the results are depicted in Figure 5.8. It is obvious that glycerol conversion increases
with increasing contact time. With increase in W/F from 0.4 to 1.0 g mL−1h, conversion of
glycerol has been increased from 78% to 94.9%. The longer the contact time, more is the
availability of active sites that glycerol is exposed to react with and hence more is the
glycerol conversion. Also there was a gradual increase in the 1,3-PDO selectivity from
21.4% to 48.6% with increasing contact time [37]. On the contrary, increase in W/F resulted
in decrease of 1,2-PDO and HA selectivity. No obvious change in the EG selectivity was
detected during the reaction. This suggests that the selectivity of 1,3-PDO appears to
increase at higher contact time which can be due to the enhancement of secondary hydroxyl
removal from glycerol with subsequent hydrogenation, thereby, the selectivity of undesired
products such as acetone, methanol and ethanol was found to be decreased.
Figure 5.8: Effect of contact time (W/F) on hydrogenolysis of glycerol to 1,3-PDO
Reaction conditions: Reaction temperature = 225 oC ; H2 flow rate = 60 mL/min; Glycerol feed: 0.5
mL/hr; W/F = 0.4, 0.6, 0.8, 1.0 g mL-1 h.
0.4 0.6 0.8 1.00
20
40
60
80
100
0
20
40
60
80
100
Sele
ctiv
ity (%
)
Conv
ersio
n (%
)
W/F (g mL-1 h)
Conversion Sel of 1,3-PDO Sel of 1,2-PDO Sel of EG Sel of HA Sel of Others

Chapter 5
168 | P a g e
5.3.2.5 The effect of weight hourly space velocity (WHSV)
In order to examine the influence of WHSV on glycerol hydrogenolysis, reactions
over the 2Pt/HM catalyst sample were performed at 225 °C with the flow rate of 10 wt%
glycerol solution varied from 0.5 to 2.0 mL/h (corresponding WHSV = 1.02–4.08 h−1) by
using 60 mL/min hydrogen flow rate (Figure 5.9). When the WHSV was increased from
1.02 to 4.08 h−1, the glycerol conversion decreased from 94.9% to 75.2%. Also, the
selectivity to 1,3-PDO decreased rapidly from 48.6% to 19.4%. It can be inferred that at
higher WHSV, the excess amount of glycerol would not possibly find adequate number of
active sites on the catalyst surface to interact, hence there was a decrease in the contact time
between glycerol and the catalyst; resulting in a low glycerol less selectivity to 1,3-PDO
[38]. The results therefore suggest that the lowest WHSV 1.02 h-1 resulted in maximum 1,3-
PDO selectivity and glycerol conversion.
Figure 5.9: Effect of WHSV on hydrogenolysis of glycerol to 1,3-PDO Reaction conditions: Reaction temperature = 225 oC; H2 flow rate = 60 mL/min; catalyst wt = 0.5 g;
WHSV – 1.02 h-1, 2.04 h-1, 3.06 h-1, 4.08 h-1.
1 2 3 40
20
40
60
80
100
0
20
40
60
80
100
Selec
tivity
(%)
Conv
ersio
n (%
)
WHSV (h-1)
Conversion Sel of 1,3-PDO Sel of 1,2-PDO Sel of EG Sel of HA Sel of Others

Chapter 5
169 | P a g e
5.3.2.6 Catalyst stability
To gain further insight into the catalytic performance, the sustainability of activity of
catalyst was studied by conducting a time on stream experiment over the best catalyst
2Pt/HM under the optimum reaction conditions (Figure 5.10). The reaction was carried out at
225 oC under atmospheric pressure for duration of 8 h in order to study the stability of the
catalyst. Initially, 84-86% conversion of glycerol was obtained, reached maximum (94.9%) at
3 h and subsequently dropped with time although remained stable till 5 h. In addition, the
selectivity to 1,3-PDO also maximized at 3 h, showing a fall as the reaction time proceeded.
The time on stream studies demonstrate that slight decrease in the activity of catalyst is
observed as reaction time extended which might be ascribed to the fact that solid acid catalyst
undergoes gradual deactivation due to many factors such as coke formation, decreased BET
surface area, total acidity and sintering of Pt during the reaction which is in accordance with
the literature report [39]. This is further supported by the results of analysis of spent catalyst.
Figure 5.10: Time on stream studies of hydrogenolysis of glycerol to 1,3-PDO over 2Pt/HM
catalyst Reaction conditions: Reaction temperature = 225 oC; H2 Flow rate =60 mL/min, WHSV – 1.02 h-1.
0
20
40
60
80
100
1 2 3 4 5 6 7 8
Conv
ersio
n &
Sel
ectiv
ity (%
)
Time (h)
Time on stream
Conversion of Glycerol Selectivity of 1,3-PDO

Chapter 5
170 | P a g e
5.3.3 Regeneration of the catalyst
The glycerol conversion and selectivity of 1,3-PDO was examined over the used
catalyst of 2 wt% Pt/HM under the same reaction conditions (225 oC, 0.1 MPa) to further
verify the stability of the catalyst. As a process of regeneration or recovery of the spent
catalyst, the catalyst was initially treated in air at 300 °C for 3 h followed by reduction in H2
flow at 300 °C for 3 h [37]. The catalytic activity of the regenerated catalyst was then
evaluated in the hydrogenolysis of glycerol under optimized reaction conditions. The spent
catalyst was also characterized by XRD, BET surface area, acidity measurements. The results
are shown in Table 5.5 and Figure 5.11. As can be seen from Table 5.5, the glycerol
conversion and 1,3-PDO selectivity slightly dropped over the used catalyst when compared to
that of the fresh catalyst. The XRD pattern of spent 2Pt/HM catalyst reveals sharp
diffraction line at 2θ=39.7o indicating the presence of large Pt particles on the exterior of the
support (Figure 5.11). It is obvious that Pt species agglomerate during the reaction and pore
blockage of H-mordenite channels by large Pt clusters could have made Pt sites inaccessible
to the reaction.
Figure 5.11: XRD and NH3-TPD patterns of spent 2Pt/HM catalyst

Chapter 5
171 | P a g e
Table 5.5: Studies of the spent catalyst 2Pt/HM
Catalyst Conversion (%) Selectivity of
1,3-PDO
BET SA Acidity
(µmol/g)a
Fresh 94.9 48.6 398 645.5
Spent 89 42 307 430.0 aMeasured from NH3-TPD studies;
Carbon content and decrease in the surface area of spent catalyst provides useful
information on the catalyst deactivation. As has been noted, the surface area and the total
acidity (NH3µmol/g) of spent catalyst were found to be decreased as that of fresh catalyst.
CHNS analysis of the used catalysts reveals the amount of coke deposited during the catalytic
reaction and the results are shown in Table 5.4. Therefore, these results suggest that the
deactivation of catalyst could be mainly attributed to the loss of acidic sites in the catalyst due
to the blockage of pores by carbon deposition which eventually resulted in decrease in the
catalytic activity.
5.3.4 Mechanism of glycerol hydrogenolysis to 1,3-PDO
Hydrogenolysis of glycerol occurs via acid-catalyzed dehydration to form
intermediates (acetol and 3-hydroxypropaldehyde (3-HPA)) and successive hydrogenation
to form propanediols (1,2-PDO and 1,3-PDO) on metal sites [2, 3, 40]. Therefore, it is well
established that metal and acid sites along with active hydrogen species favour to reach
outstanding catalytic performance of glycerol hydrogenolysis. In addition to the acid
strength, the nature of the acidic sites, i.e., Brønsted and Lewis acidic sites indeed play a
predominant role in determining the product formation. It is highly evident that Brønsted
acid sites are responsible for 1,3-PDO formation while Lewis acid sites allow formation of
1,2-PDO [41].
In this reaction mechanism, the secondary carbocation intermediate for 3-HPA, is
more stable than that of primary carbocation for acetol. Therefore 3-HPA although

Chapter 5
172 | P a g e
thermodynamically unstable its formation is kinetically more favourable than acetol
production. The possible reaction mechanism of glycerol hydrogenolysis to 1,3-PDO over
Pt/HM is proposed based on our experimental investigations (Scheme 5.2). The pathway
describes the protonation and dehydration of secondary hydroxyl group of adsorbed
glycerol (1) on the Brønsted acid sites of the zeolite by interacting with bridging OH groups
of zeolite. The alkoxy species (2) formed as a result of dehydration undergoes desorption
followed by re-adsorption onto the zeolite with the primary hydroxyl groups of glycerol to
generate 3-hydroxypropene (3). Consequently 3-hydroxy propionaldehyde (3-HPA) was
originated from keto-enol tautomerisation (4) undergoes quick hydrogenation on active Pt
sites under hydrogen atmosphere to yield 1,3-PDO (5).The quick hydrogenation of 3-HPA
is essential to stop further dehydration of 3-HPA to produce acrolein.
Scheme 5.2: Reaction mechanism of Glycerol hydrogenolysis to 1,3-PDO over Pt/HM
catalyst

Chapter 5
173 | P a g e
5.4 Conclusions
Vapour phase hydrogenolysis of glycerol was investigated over a series of 0.5-3 wt%
Pt/HM catalysts for the first time under atmospheric pressure. Among several catalysts
examined, 2 wt% Pt/HM was proven to be a highly active and selective catalyst in the
hydrogenolysis of glycerol with 48.6 % 1,3-PDO selectivity at 94.9% glycerol conversion.
• XRD results reveal the presence of well crystallized mordenite structure and clearly
indicate the textural properties of mordenite did not change after platinum
impregnation.
• NH3-TPD studies illustrate the presence of strong and weak acid sites in the Pt/HM
catalysts whereas Pyridine FTIR results show that Brønsted acidic sites are
predominant in Pt/HM catalysts.
• Well dispersed Platinum and the average particle size (3 nm-10 nm) were known from
CO-Chemisorption and TEM analysis.
• XPS spectra showed significant broadening and shift in binding energies at higher Pt
loadings as a consequence of platinum-mordenite interaction.
• The parametric study (effect of reaction temperature, hydrogen flow rate, contact time
and WHSV) showed that the activity and 1,3-PDO selectivity was favored by the
increase of temperature and hydrogen flow rate.
• In addition, longer contact time resulted in maximum conversion and 1,3-PDO
selectivity. Further, the structural aspects of the spent catalyst allowed evaluating the
stability of the catalyst.
• Pt/HM catalyst with proper metal/acid balance was highly desirable in improving the
catalytic activity and the Brønsted acids on the surface of H-Mordenite possibly
played an essential role in accelerating the 1,3-PDO selectivity.

Chapter 5
174 | P a g e
From the results of the present study, it is concluded that, selective hydrogenolysis of
glycerol to 1,3-PDO through a dehydration-hydrogenation route was highly efficient over a
bifunctional catalyst made up of of a well-crystallized zeolite such as H-mordenite,
constituted mainly by Brønsted acidity, and a dispersed platinum as hydrogenating function.

Chapter 5
175 | P a g e
References
[1] I. Gandarias, P. L. Arias, J. Requies, M. B. Guemez, J. L. G. Fierro, Appl. Catal., B. 97
(2010) 248-256.
[2] Y. Nakagawa, M. Tamura, K. Tomishige, J. Mater. Chem., A. 2 (2014) 6688-6702
[3] S. Zhu, Y. Qiu, Y. Zhu, S. Hao, H. Zheng, Y. Li, Catal. Today, 212 (2013) 120-126.
[4] O. M. Daniel, A. DeLaRiva, E. L. Kunkes, A. K. Datye, J. A. Dumesic, R. J. Davis,
ChemCatChem. 2 (2010) 1107-1114.
[5] L. Ma, D. H. He, Catal. Today. 149 (2010) 148-156.
[6] S. S. Priya, V. P. Kumar, M. L. Kantam, S. K. Bhargava, K. V. R. Chary, RSC Adv. 4
(2014) 51893-51903.
[7] J. Oh, S. Dash, H. Lee, Green Chem. 13 (2011) 2004-2006.
[8] Y. Nakagawa, Y. Shinmi, S. Koso, K. Tomishige, J. Catal. 272 (2010) 191-194.
[9] Y. Zhang, X. C. Zhao, Y. Wang, L. Zhou, J. Zhang, J. Wang, A. Wang, T. Zhang, J.
Mater. Chem. A. 1 (2013) 3724-3732.
[10] C. H. Liang, Z. Q. Ma, L. Ding, J. S. Qiu, Catal. Lett. 130 (2009) 169-176.
[11] Z. H. Xiao, S. H. Jin, X. K. Wang, W. Z. Li, J. H. Wang, C. H. Liang, J. Mater. Chem.
32 (2012) 16598-16605.
[12] I. Furikado, T. Miyazawa, S. Koso, A. Shimao, K. Kunimori, K. Tomishige, Green
Chem. 9 (2007) 582-588.
[13] JT. Dam, K. Djanashvili, F. Kapteijn, U. Hanefeld, ChemCatChem. 5 (2013) 497-505.
[14] R. Arundhathi, T. Mizugaki, T. Mitsudome, K. Jitsukawa, K. Kaneda, ChemSusChem. 6
(2013) 1345-1347.
[15] T. Kurosaka, H. Maruyama, I. Naribayashi Y. Sasaki, Catal. Commun. 9 (2008) 1360-
1363.
[16] L. Z. Qin, M. J. Song C. L. Chen, Green Chem. 12 (2010) 1466-1472.

Chapter 5
176 | P a g e
[17] Y. Amada, Y. Shinmi, S. Koso, T. Kubota, Y. Nakagawa, K. Tomishige, Appl. Catal., B.
105 (2011) 117-127.
[18] A. Corma, Chem Rev. 97 (1997) 2373-2420.
[19] M. J. Garcia, M. Johnson, J. Valla, K. Li, J. Y. Ying, Catal. Sci. Technol. 2 (2012) 987-
994.
[20] M. Hartmann, Angew Chem. Int. Ed. 43 (2004) 5880-5882.
[21] S. Jin, Z. Xiao, C. Li, C. T. Williams C. Liang, J. Energy Chem. 23 (2014) 185-192.
[22] R. T. Mitsce E. L. Pollitzer, U.S. Patent, 1970, 3,544,451.
[23] R. A. Asuquo, G. Eder-Mirth, J. A. Lercher, J. Catal. 155 (1995) 376-382.
[24] S. T. Tie, Stud. Surf. Sc. Catal., 85 (1994) 587-631.
[25] H. Liu, G. D. Lei, W. M. H. Sachtler, Appl. Catal., A. 137 (1996) 167-177.
[26] H. González, O. S. Castillo, J. L. Rico, A. Gutiérrez-Alejandre, J. Ramírez, Ind. Eng.
Chem. Res. 52 (2013) 2510-2519.
[27] Ferenc Lo´nyi, Anita Kova´cs, Ágnes Szegedi, Jo´zsef Valyon, J. Phys. Chem., C 113
(2009) 10527-10540.
[28] X. L. Yang, W. L. Dai, R. Gao, K. Fan, J. Catal. 249 (2007) 278-288.
[29] G. L. Woolery, G. H. Kuehl, H. C. Timken, A. W. Chester, J. C. Vartuli, Zeolites. 19
(1997) 288-296.
[30] J. A. Lercher, C. Gründling, G. Eder-Mirth, Catal. Today. 27 (1996) 353-376.
[31] G. Busca, Catal. Today. 27 (1996) 323-352.
[32] C. A. Emeis, J. Catal. 141 (1993) 347-354.
[33] J. I. Villegas, D. Kubicka, H. Karhu, H. Osterholm, N. Kumar, T. Salmi, D. Murzin, J.
Mol.Catal. A: Chem. 264 (2007) 192–201.
[34] P. Canizares, A. de Lucas, F. Dorado, A. Duran, I. Asencio, Appl. Catal., A. 169 (1998)
137-150.

Chapter 5
177 | P a g e
[35] J. Z. Shyu, K. Otto, Appl. Surf. Science 32 (1998) 246-252.
[36] Y. Wang, J. Zhou, X. Guo, RSC Adv. 5 (2015) 74611-74628.
[37] S. S. Priya, V. P. Kumar, M. L. Kantam, S. K. Bhargava, A. Srikanth, K V. R. Chary,
Ind. Eng. Chem. Res. 54 (2015) 9104−9115.
[38] S. Zhu, Y. Zhu, S. Hao, H. Zheng, T. Mo, Y. Li, Green Chem. 14 (2012) 2607-2616.
[39] F. Cavani, S. Guidetti, C. Trevisanut, E. Ghedini, M. Signoretto, Appl. Catal., A.
409−410 (2011) 267-278.
[40] S. S. Priya, V. P. Kumar, M. L. Kantam, S. K. Bhargava, K. V. R. Chary, Catal. Lett.
144 (2014) 2129-2143.
[41] S. Zhu, X. Gao, Y. Zhu, Y. Li, J. Mol. Catal., A. 398 (2015) 391-398.

Chapter 6
178 | P a g e
CHAPTER 6
Catalytic performance of Pt-HPA/ZrO2
catalysts for Selective Hydrogenolysis of
Glycerol to Propanols under atmospheric
pressure

Chapter 6
179 | P a g e
In this chapter, the development of highly selective route to produce biopropanols
from glycerol hydrogenolysis has been illustrated. Metal-acid bifunctional catalysts
containing platinum and heteropolyacids (HPA) supported on zirconia were employed for the
selective vapor phase hydrogenolysis of glycerol to propanols (1-propanol+2-propanol) under
normal atmospheric pressure. The Pt-HPA/ZrO2 catalysts (HPAs such as silicotungstic acid
(STA), phospotungstic acid (PTA), phosphomolybdic acid (PMA) and silicomolybdic acid
(SMA)) were prepared by impregnation method and the calcined catalysts were characterized
by means of XRD, FTIR, Raman spectroscopy, BET surface area, CO chemisorption and
NH3-TPD methods. The results of characterization techniques show the existence of well
dispersed Pt metallic phase and Keggin structure of HPAs on support. The catalytic
performance during glycerol hydrogenolysis is well correlated with Pt dispersion and the
acidic properties of catalysts. Among the tested catalysts, it was found that Pt-PTA/ZrO2
exhibited excellent selectivity to propanols (98%) with total glycerol conversion at 230 oC. A
detailed study was made on the effect of various reaction parameters such as the influence of
reaction temperature, reduction temperature, glycerol concentration, hydrogen flow rate, feed
flow rate and HPA loading to unveil the optimized reaction conditions. The spent catalysts
were also characterized by the X-ray diffraction, NH3-TPD and SEM analysis to investigate
the changes in catalytic performance and causes of catalyst deactivation.
The work presented in this chapter has been published:
S. Shanthi Priya, V. P. Kumar, M. L. Kantam, S. K. Bhargava, PR. Selvakannan and K. V.
R. Chary, Metal-Acid Bifunctional catalysts for Selective Hydrogenolysis of Glycerol
under atmospheric pressure: A Highly Selective route to produce Propanols. Applied
Catalysis A: General 498 (2015) 88–98.

Chapter 6
180 | P a g e
6.1 Introduction
The previous chapters (2, 3, 4 & 5) focused on the development of various supported
platinum catalysts and its performance evaluation for hydrogenolysis of glycerol particularly
towards the selective production of 1,3-PDO. Based on the results obtained from the
previous chapters, it is clearly evident that acidity of the catalyst and Pt dispersion had a
major role in regulating the activity and selectivity during glycerol hydrogenolysis. In
particular, the catalysts with Brønsted acidity and appropriate metal/acid balance allowed the
glycerol hydrogenolysis more selective towards 1,3-PDO. In this scenario, heteropolyacids
which are strong Brønsted acids were used as additive/promoter in an effort to improve the
selectivity to 1,3-PDO. However, interestingly, the presence of too strong acidic sites in Pt-
HPA/ZrO2 catalysts resulted in double dehydration-hydrogenation of glycerol leading to the
formation of propanols. The present chapter focusses on the use of bifunctional platinum-
heteropolyacid catalysts supported on zirconia for the selective production of propanols from
glycerol hydrogenolysis.
Production of 1,2-propanediol (1,2-PDO), 1,3-propanediol (1,3-PDO) and propanols
by hydrogenolysis of bioglycerol over supported noble metal catalysts is one of such
potential routes which has been extensively studied by several authors [1-4]. 1,2-propanediol
and 1,3-propanediol, are used as solvents and additives in various fields such as polymer,
cosmetics and pharmaceuticals [5]. On the other hand, propanols (1-propanol and 2-propanol)
are also expensive commodity chemicals widely employed as industrial solvents and attracted
much attention in recent years. Currently, 1-propanol is produced by hydroformylation of
ethylene and is mainly used as printing ink or in the synthesis of n-propyl acetate [6]. 2-
Propanol can be formed by the propylene hydration and finds application in pharmaceuticals,
as a disinfectant and a deicer [7]. However, routes to biopropanols [8-10] such as 1-propanol

Chapter 6
181 | P a g e
[11, 12] and 2-propanol have been less discussed while abundant literature is available on
conversion of glycerol to 1,2-PDO [13-21] and 1,3-PDO [22-32].
Tomishige and coworkers [33] conducted the hydrogenolysis of glycerol at 120 °C
and 8.0 MPa in which the optimized Ru-added Ir-ReOx/SiO2 catalyst gave high yields of
propanols (84%). Previously reported processes describe a method of single step glycerol
hydrogenolysis to biopropanols over Pt-HSiW/ZrO2 catalyst at a pressure of 5 MPa and 200
°C and achieved a selectivity of 90.9% towards propanols [8].
Despite these research efforts, a major disadvantage is the fact that maximum research
work reported so far has employed the use of high reaction pressure carried out in batch
reactors, although few operated in continuous fixed bed reactors. Consequently, the energy
intakes of the process are increased and in turn a decline in the productivity of the process.
Above all, the selectivities to propanols are still low and did not go beyond 91%. Therefore,
there is great interest for the selective production of propanols from glycerol under mild and
utmost economical conditions. In this context, development of suitable fixed bed continuous
flow reactors functioned at atmospheric pressure and desired temperature for selective
conversion of glycerol to propanols is still considered as a challenge.
The glycerol hydrogenolysis reaction involves dissociation of C–C and C–O with
simultaneous addition of hydrogen. Since glycerol is rich in oxygen content, C–O
hydrogenolysis is the most promising method in view point of biomass conversion to
chemicals. The glycerol hydrogenolysis is usually takes place via the
“dehydration−hydrogenation” mechanism [26, 29, 32]. In this view, “metal−acid”
bifunctional catalysts are most effective for the glycerol hydrogenolysis wherein the
dehydration step is facilitated by the acid sites and the hydrogenation step by metallic sites,

Chapter 6
182 | P a g e
respectively (Scheme 6.1). If the acid sites are too strong, it results in excessive
hydrogenolysis to form propanols.
Scheme 6.1: Hydrogenolysis of glycerol to various products
Heteropolyacids (HPAs) have high potential as catalyst. These materials offer the
unique opportunity to replace the corrosive liquid acids currently used in many chemical
conversion steps to provide “greener” processes. HPAs are characteristic strong Bronsted
acids compared to conventional solid acid catalysts and catalyze a wide range of
homogeneous and heterogeneous reactions [34] offering a strong option for efficient and
cleaner processing. Supported HPAs have been used in a variety of organic transformations
such as acylation, alkylation, esterification, oxidation and hydrogenation. Zirconia based
materials have attracted considerable interest in recent years for their potential use as catalyst
supports [35] and often used to immobilize HPAs [36] as they present special characteristics
such as high thermal stability, extreme hardness, and stability under reducing conditions.
In the present study, several zirconia supported Pt-HPAs (STA, PTA, PMA and
SMA) bi-functional catalysts were prepared, characterized, and verified for glycerol
hydrogenolysis. The main emphasis of this work was the evaluation of supported Pt-HPA
catalysts for the vapor phase hydrogenolysis of glycerol (Scheme 6.2) under atmospheric
pressure with the objective to produce alcohols, in particular 1-propanol (1-PrOH) and 2-
propanol (2-PrOH) with highest selectivities.

Chapter 6
183 | P a g e
Scheme 6.2: Hydrogenolysis of glycerol to propanols over Pt-HPA/ZrO2 catalysts
6.2 Experimental section
6.2.1 Catalyst Preparation
6.2.1.1 Preparation of ZrO2 support
ZrO2 support was prepared by the hydrolysis of ZrOCl2 with aqueous ammonia
solution maintaining the pH of the solution to 8.0. The resulting solution is then washed and
dried at 110 °C for 24 h. The support was calcined at 500 °C for 3 h in a stream of air.
6.2.1.2 Preparation of HPA/ZrO2 catalyts
The heteropolyacids (HPAs) such as phosphotungstic acid (PTA), phosphomolybdic
acid (PMA), silicotungstic acid (STA), silicomolybdic acid (SMA) were purchased from
Sigma-Aldrich. The Pt-HPA/ZrO2 catalysts used in this study were prepared by sequential or
step by step wet impregnation method. Initially, HPA/ZrO2 was prepared by impregnation of
ZrO2 support with an aqueous solution of HPA. The sample obtained was dried overnight at
110 °C and then calcined at 300 °C in air for 3 h.
Biodiesel
Glycerol
OHOH
OH
Pt-HPA/ZrO2
Vapour phase hydrogenolysis
230 oCatmospheric pressure
OHOH
+
1-propanol 2-propanol
Green SynthesisHigh Selectivities
HPA = PTA, STA, PMA, SMA

Chapter 6
184 | P a g e
6.2.1.3 Preparation of Pt-HPA/ZrO2 catalysts
The Pt-HPA/ZrO2 catalysts were prepared by impregnation of HPA/ZrO2 with
aqueous solution of H2PtCl6·6H2O. After impregnation, the catalyst was allowed to dry
overnight at 110 °C and then calcined at 350 °C for 4 h. The optimum weight loadings of Pt
metal and acid components (STA, PTA, PMA and SMA) in all the catalysts were confined to
2 wt% and 15 wt%, respectively. The catalysts will be hereinafter referred to as Pt-
PTA/ZrO2, Pt-STA/ZrO2, Pt-PMA/ZrO2 and Pt-SMA/ZrO2.
6.2.2 Catalyst characterization
The calcined forms of catalysts were characterized by powder X-ray diffraction
(XRD) analysis over a Rigaku miniflex X-ray diffractometer using Ni filtered Cu Kα
radiation (λ=0.15406 nm). The measurements were obtained in the 2θ range of 2 to 65°, at a
scan rate of 2°min−1operated at beam voltage of 30 kV and a beam current of 15 mA
respectively.
FTIR spectra of the catalysts were recorded under ambient condition on the GC-FT-
IR Nicolet 670 spectrometer using KBr background.
Raman spectra of the catalyst samples were acquired with the micro-Raman
attachment of a Horbia-Jobin Yvon Raman spectrometer equipped with a confocal
microscope, a notch filter and 2400/900 grooves/mm gratings. Yag double diode pumped
Laser (20 mW) provided visible laser excitation of 532 nm (visible/green). UV sensitive
LN2- cooled CCD detector (Horbia-Jobin Yvon CCD- 3000 V) was used to measure
scattered photons which were dried and focused on to a single-stage monochromator.
NH3-TPD experiments were conducted on AutoChem 2910 (Micromeritics, USA)
instrument equipped with a TCD detector for continuous monitoring of desorbed NH3. Prior
to TPD measurements, 0.1g of sample was dried in flowing (99.995%) helium (50 mL min−1)
at 200 °C for 1 h, then adsorbed with a mixture of 10% NH3–He at 80 °C for 1 h until

Chapter 6
185 | P a g e
saturation, and successively flushed with He (50 mL min−1) at the same temperature for 30
min. TPD analysis was conducted out from 100 oC to 800 °C at a heating rate of 10 °C min−1
and the amount of NH3 desorbed was measured using GRAMS/32 software.
N2 adsorption-desorption experiments on Autosorb 1 (Quantachrome instruments,
USA) were carried out to analyze the surface area of the calcined catalysts at −196 °C by the
multipoint BET method taking 0.0162 nm2 as its cross-sectional area.
CO-chemisorption studies were performed on AutoChem 2910 (Micromeritics, USA)
instrument. Initially, 0.1 g of the sample was reduced in hydrogen (50 mL/min) at 400 °C for
3 h followed by flushing out in helium gas flow at 400 °C for one hour. The sample was then
cooled to ambient temperature in the same He stream. After pretreatment, the reduced
samples were subjected to pulses of 9.96% CO balanced helium at 400 °C. Adsorption was
supposed to be complete after three successive runs presented similar peak areas. Thereby,
the platinum surface area, percentage dispersion and Pt average particle size were
calculated assuming the stoichiometric factor (CO/Pt) as 1.
6.2.3 Catalyst testing
The vapour phase hydrogenolysis of glycerol was conducted in a vertical fixed bed
quartz reactor (i.d. 9 mm, 40 cm length) under atmospheric pressure. The catalyst bed is
prepared by charging 0.5 g of the catalyst in the constant temperature zone of the reactor and
a thermocouple was employed to control the temperature. Prior to the reaction, the catalysts
(0.5 g) were pretreated at 350 °C for 2 h in flowing H2 (60 mL min−1). After reduction, the
reactor was cooled down to the reaction temperature (230 °C) and fed with a mixture of
10wt% aqueous glycerol solution and hydrogen (100 mL/min) through a syringe feed pump.
Finally, the reaction products were condensed in an ice–water trap and collected for analysis
every hour on a GC (Shimadzu) equipped with a DB-wax 123-7033 (Agilent) capillary
column (0.32 mm i.d., 30 m long) and a FID detector.

Chapter 6
186 | P a g e
The gas products were collected in a gas trap and analyzed offline using a gas
chromatograph equipped with a POROPAQ packed column and FID. The identified products
were 1-propanol, 2-propanol, hydroxyacetone, ethanol, ethylene glycol, methanol, acetone
and propane. Quantification of product mixture has been achieved by comparing the weight
composition in the input and output. The glycerol conversion and product selectivity obtained
during glycerol hydrogenolysis were calculated as follows:
Conversion (%) =moles of glycerol (in) − moles of glycerol (out)
moles of glycerol (in) × 100
Selectivity (%) =moles of one productmoles of all products
× 100
6.3 Results and discussion 6.3.1 Characterization techniques
6.3.1.1 X-ray diffraction (XRD)
XRD patterns of pure ZrO2, Pt/ZrO2 and Pt-HPA/ZrO2 catalysts are shown in the
Figure 6.1. In all the samples, ZrO2 mainly showed diffraction peaks consistent to monoclinic
ZrO2 at 2θ = 24.1°, 28.3°, 31.5°, 34.3° and 49.4° [37]. The peaks related to HPAs (Keggin
molecules) were not detected on the catalysts and appear to be overlapped with that of ZrO2.
This might be possibly due to the interaction of HPAs with ZrO2 or good dispersion of
species on the support surface. Meanwhile, a less intense diffraction peak at 2θ=39.7°
corresponding to Pt crystalline plane (111) reveals the existence of small crystals of Pt on the
support surface of Pt/ZrO2, Pt-STA/ZrO2, Pt-PMA/ZrO2 and Pt-SMA/ZrO2 catalysts.
However, the intensity of Pt peak in case of Pt-PTA/ZrO2 catalyst was found to be very less
which suggests that the Pt particles were highly dispersed on the support compared to other
Pt-HPA/ZrO2 catalysts.

Chapter 6
187 | P a g e
Figure 6.1: XRD patterns of Pure ZrO2, Pt/ZrO2 and various Pt-HPA/ZrO2 catalysts.
6.3.1.2 Fourier Transform Infrared Spectroscopy (FTIR)
Figure 6.2 shows the FTIR spectra of various platinum and heteropolyacid catalysts
supported on zirconia. The strong peaks in the wave number region 740-505 cm-1 are
associated with Zr-O-Zr asymmetric stretching mode of zirconia. A series of peaks observed
between 700-1100 cm-1 reveals the presence of characteristic bands of Keggin structure of
various HPAs. The characteristic bands of PTA molecule at 1080, 985, 890 and 839 cm-1 are
allocated to the stretching vibrations of oxygen atom bonded to tungsten and phosphorous, P–
O, W=O, W–O–W in corner shared octahedral and W–O–W in edge shared octahedral,
respectively. The bands at 1010, 975, 880 and 742 cm-1 are attributed to Si-O, W=O, W-O-W
(inter octahedral) and W-O-W (intra octahedral) phases of STA molecule respectively. The
four characteristic bands for the Keggin structure of PMA molecule appeared at 1031 (P-O),
960 (Mo=O) and 783 (Mo-O-Mo) cm-1. The peak at 956 cm-1 has been assigned to the
terminal Mo=O bond of SMA. In addition, the bands observed at 1622-1627 cm-1 are due to

Chapter 6
188 | P a g e
the bending vibrations of –OH of water and an adsorption band in between 3600-3000 cm-1
corresponded to the stretching vibration of –OH group from water. Similar results were also
observed by Jadhav et al. [38] and Ferreira et al. [39]. These results indicate that the Keggin
structure of heteropolyacids remained intact in the supported catalysts.
Figure 6.2: FTIR spectra of Pt/ZrO2 and various Pt-HPA/ZrO2 catalysts.
6.3.1.3 Raman spectroscopy
Raman spectroscopy was further used to confirm the state of primary structure of
Keggin ion in the heteropolyacid catalysts. Raman spectra of pure ZrO2 and as prepared
catalysts are shown in Figure 6.3. Raman bands at 310, 382, 474, 499, 559, 620 and 636 cm−1
corresponds to zirconia in monoclinic phase as verified by XRD results. The bands appeared
in the range of 900-1010 cm-1 were assigned to W=O symmetric and asymmetric stretching
vibrations of HPAs Keggin structure. In addition, a broad band in the range 980-750 cm-1 is
observed in case of PMA and SMA catalysts ascribed to the stretching vibrations of MoO3

Chapter 6
189 | P a g e
Keggin structure [40]. These findings are in good agreement with the studies of Zhu et. al
[28].
Figure 6.3: Raman spectra of Pt/ZrO2 and various Pt-HPA/ZrO2 catalysts.
6.3.1.4 Temperature programmed desorption of ammonia studies (NH3-TPD)
NH3-TPD experiments were performed to investigate the acidity and acid strength
distribution of the catalysts. In general, the strength of acid sites in the NH3-TPD profiles can
be ordered in three different regions i.e., at 100-250 °C, 250-500 °C and above 500 °C. The
desorption of ammonia from first region is attributed to weak acidic sites, the second region
refers to moderate strength acidic sites, and the third region represents desorption of ammonia
from strong acidic sites [41]. The NH3-TPD profiles of Pt/ZrO2 and catalysts with different
HPAs are shown in Figure 6.4, and the amounts of NH3 desorbed (µmol/g) are presented in
Table 6.1. Three types of acid sites are observed in these catalysts. The desorption peak in the
low temperature region (Tmax in the range 180 oC-360 oC) is related to the zirconia support

Chapter 6
190 | P a g e
corresponding to weak and moderate acidic sites. The peaks due to strong acidic sites
generated by the heteropolyacid interacting with support are observed at Tmax 350 oC-480 oC.
However, the acidity of the catalyst depends on the type of HPA on zirconia. It is evident
from Table 6.1, that Pt-PTA/ZrO2 catalyst possesses more number of strong acid sites
compared with others. Therefore, the results indicate that the acid strength of HPAs follows
the order: PTA > STA > PMA > SMA, consistent with the previous reports [42]. In addition,
it is evident from NH3-TPD results that the Pt-HPA/ZrO2 catalysts possess stronger acidity
when compared to the Pt/ZrO2 catalyst significantly affecting the catalytic performance in
glycerol hydrogenolysis.
Table 6.1: Results from NH3-TPD and BET surface area of Pt/ZrO2 and Pt-HPA/ZrO2
catalysts
Catalyst BET surface
area (m2/g)
NH3 uptake
(µmol/g)
Total acidities
(µmol/g)
Weak Moderate Strong
Pt/ZrO2 85 83.2 193.2 -- 276.4
Pt-PTA/ZrO2 72 21.1 226.1 31.0 278.2
Pt-STA/ZrO2 69 53.9 199.0 28.5 280.9
Pt-PMA/ZrO2 68 42.6 267.8 23.0 333.4
Pt-SMA/ZrO2 57 18.8 184.5 15.6 218.9

Chapter 6
191 | P a g e
Figure 6.4: NH3-TPD profiles of Pt/ZrO2 and various Pt-HPA/ZrO2 catalysts.
6.3.1.5 BET surface area
The catalytic activity is significantly increased by using a high surface area catalyst
since the catalytic action occurs on specific sites on the surface of catalyst, called active sites.
Therefore, measurement of the surface area is most important study, as it is generally
believed that higher the surface area, higher will be the catalytic activity. The surface areas of
the catalysts determined by using BET method are listed in Table 6.1. It was observed that
the immobilization of HPAs on zirconia leads to a decrease in the surface area of the
catalysts. The reduction in surface area may be due to the blockage of pores by active species.
A similar observation was made by Malliek [43].

Chapter 6
192 | P a g e
6.3.1.6 CO-Chemisorption
The CO chemisorption on the samples was used to assess Pt dispersion, metal surface
area and active particle diameter. The trends of activity observed for different catalysts can be
elucidated based on dispersion of metal and active particle diameter of Pt. As compiled in
Table 6.2, the incorporation of HPAs did not affect Pt particle size and Pt dispersion notably
compared with Pt/ZrO2 catalyst. However, the results demonstrate that Pt-PTA/ZrO2 catalyst
exhibited high dispersion over other catalysts and simultaneously improved catalytic
performance of glycerol hydrogenolysis significantly. Zhu et. al. [28] also reported that HPAs
have little influence on the dispersion of Pt. The attained results are well correlated with those
obtained from XRD studies.
Table 6.2: Results from CO chemisorption studies of Pt/ZrO2 and Pt-HPA/ZrO2 catalysts
Catalyst Dispersion (%) CO uptake
(µmol/g)
Metal surface
area (m2/g)cat
Particle size
(nm)
Pt/ZrO2 13.7 14.0 0.55 10.1
Pt-PTA/ZrO2 13.3 13.6 0.65 8.4
Pt-STA/ZrO2 11.6 11.9 0.57 9.7
Pt-PMA/ZrO2 9.0 9.2 0.44 12.5
Pt-SMA/ZrO2 8.7 8.9 0.43 12.9
6.3.2. Catalytic performance of the catalysts
6.3.2.1 Effect of HPAs on the glycerol hydrogenolysis
Glycerol hydrogenolysis is known to proceed through several consecutive
hydrogenolysis reactions and C-C bond cleavage reactions and therefore it is an important
task to regulate the product distribution selectively. The catalytic performance of glycerol
hydrogenolysis over Pt/ZrO2 and Pt-HPA/ZrO2 catalysts with different HPAs was
investigated in a continuous fixed-bed reactor at 230 oC under atmospheric pressure. The
optimum loadings of Pt and HPAs used in the present study are confined to 2 wt% and 15

Chapter 6
193 | P a g e
wt%. The major products obtained include propanols (1-PrOH+2-PrOH) whereas
hydroxyacetone and other degradative products such as ethanol, methanol, ethylene glycol,
acetone and propane are obtained as byproducts. This research work was aimed at analyzing
and optimizing the sequential process in order to improve conversion and selectivity of
glycerol hydrogenolysis to propanols.
In general, propanols can be produced from glycerol by two pathways (Scheme
6.3). Hydrogenolysis of glycerol to 1-propanol and 2-propanol via 1,2-propanediol is one
significant route whereas hydrogenolysis of glycerol to 1-propanol via 1,3-propanediol is
another possible route. Nevertheless, it is evident that the reaction route that leads 1,2-
propanediol, 1,3-propanediol and ethylene glycol should be suppressed in order to obtain
propanols with high selectivities. However it is important task to perform both the reactions
simultaneously including hydrogenolysis of glycerol and hydrogenolysis of propanediols to
produce propanediols and propanols respectively by using a single catalyst. Therefore, a one-
step conversion of glycerol to propanols over Pt-HPA/ZrO2 catalysts in vapor phase was
attempted in the present investigation for making the process more reliable and economic
viable.
Scheme 6.3: Glycerol hydrogenolysis to propanols
At first, the effect of HPAs on glycerol hydrogenolysis was examined for the selective
production of propanols in comparison with Pt/ZrO2 catalyst. Table 6.3 presents the results of
catalytic performance of Pt/ZrO2 and Pt-HPA/ZrO2 catalysts for glycerol conversion and
OH OHOH
OHOH
OHOH
OH OH OH
+
Glycerol
1,2-PDO 1-PrOH 2-PrOH
2-PrOH1,3-PDO
-H2O
-H2O
-H2O
-H2O
+H2
+H2
+H2
+H2

Chapter 6
194 | P a g e
selectivity to liquid products. As it is obvious in Table 6.3, all the Pt-HPA/ZrO2 catalysts
presented higher glycerol conversion and high selectivity to 1-PrOH and 2-PrOH than that of
Pt/ZrO2 sample. It is interesting to note that propanediols have not been detected during the
reaction which implies that the complete sequential hydrogenolysis of propanediols to
propanols occurred leading to higher selectivities towards propanols. The promoting effect of
the HPA was distinct when compared to the experiment carried out under same reaction
conditions in the absence of HPA (85% conversion and 62% selectivity to total propanols).
This result suggests that the acidic component of the catalyst have important influence on the
catalytic performance.
Table 6.3: Catalytic performance of Pt/ZrO2 and Pt-HPA/ZrO2 catalysts for the production
of propanols from glycerola
Selectivity in liquid products (%)
Catalyst
Conversion
(%)
Total
propanols
1-
PrOH
2-
PrOH
1,3-
PDO
1,2-
PDO
HA Others
Pt/ZrO2 85 62 33 29 6.0 27 5.0 --
Pt-PTA/ZrO2 99.9 98 52 46 -- -- -- 2.0
Pt-STA/ZrO2 99.7 96 62 34 -- -- 2.5 1.5
Pt-PMA/ZrO2 98.4 90.7 62 28.7 -- -- 5.3 4.0
Pt-SMA/ZrO2 98.1 80.9 53 27.9 -- -- 13.4 5.7 aReaction conditions: 0.5 g catalyst; Reaction temperature: 230 oC, 0.1 MPa H2; H2 flow rate: 100
mL/min; WHSV-1.02 h-1; 1-PrOH: 1-propanol, 2-PrOH: 2-propanol, HA: Hydroxyacetone, Others
include ethanol, ethylene glycol, methanol and acetone.
It is worth noting that, the Pt-PTA/ZrO2 catalyst reached the outstanding
performance, 99.9% glycerol conversion with 98% selectivity to total propanols, which
seemed to be more superior and contrast to the previous Pt–H4SiW12O40/ZrO2 [8]. The Pt-
STA/ZrO2 catalyst also exhibited best catalytic activity in terms of glycerol conversion and
propanols selectivity. The superior performance of Pt-PTA/ZrO2 catalyst can be explained

Chapter 6
195 | P a g e
based on the dispersion of active metal and acidity of catalyst which play a significant role in
the bi-functional hydrogenolysis mechanism of glycerol. To our knowledge, this is the best
selectivity ever achieved for the transformation of glycerol into propanols under atmospheric
pressure. Table 6.4 represents the performance of various Pt-HPA/ZrO2 catalysts during
glycerol hydrogenolysis including both liquid and gas product distribution. The result showed
that propane is formed by sequential hydrogenolysis of propanols and the yield of propane
varied with the type of HPA present in the catalyst.
Table 6.4: Performance of glycerol hydrogenolysis over Pt-HPA/ZrO2 catalysts a
Selectivity in liquid and gas products (%)
Catalyst
Conversion
(%)
Total
propanols
1-PrOH 2-PrOH Propane HA Others
Pt-PTA/ZrO2 99.9 88 47(46.9) 41(40.9) 10.2(10.1) -- 1.8
Pt-STA/ZrO2 99.7 84.5 54.5(54.3) 30(29.9) 12.5(12.4) 1.8 1.2
Pt-PMA/ZrO2 98.4 79 54(53.1) 25(24.6) 14(13.7) 4.0 3.0
Pt-SMA/ZrO2 98.1 70 46(45.1) 24(23.5) 15(14.7) 11 4.0 aReaction conditions: 0.5 g catalyst; Reaction temperature: 230 oC, 0.1 MPa H2; H2 flow rate: 100
mL/min; WHSV-1.02 h-1; 1-PrOH: 1-propanol, 2-PrOH: 2-propanol, HA: Hydroxyacetone, Others
include ethanol, ethylene glycol, methanol and acetone. In parentheses, the yield (%) of the respective
products is mentioned.
Considering the remarkable higher activity of Pt-PTA/ZrO2 catalyst than that of other HPA
supported catalysts, Pt-PTA/ZrO2 catalyst was chosen as the catalytic system for further
optimization in the hydrogenolysis of glycerol.
6.3.2.2 Effect of Reaction temperature
The effect of temperature over Pt-PTA/ZrO2 catalyst on vapor phase glycerol
hydrogenolysis was studied in detail. The experiments were performed at different
temperatures in the range of 150 oC-270 oC under atmospheric pressure and the results are
presented in Table 6.5. As revealed in Table 6.5, the glycerol conversion increased rapidly

Chapter 6
196 | P a g e
from 10% to 99.9% as the temperature elevated from 150 oC to 230 oC and then decreased to
about 89% at 270 oC, whereas the total selectivity of propanols reached 98% at 230 oC
followed by a slight decrease at higher temperature. It is noteworthy that, low temperatures
promoted significant formation of 1-PrOH with little amounts of degradation products inspite
of low glycerol conversion. Interestingly, 2-PrOH is observed only at moderate temperatures
which did not appear under low or high temperatures.
Table 6.5: Effect of Reaction temperature on glycerol hydrogenolysis over Pt-PTA/ZrO2
catalyst under atmospheric pressurea
Selectivity in liquid products (%)
150 oC 170 oC 190 oC 210 oC 230 oC 250 oC 270 oC
Conversion 10 25 42 74 99.9 98.6 89
Total PrOHs 65 84 92 92 98 97 95.9
1-PrOH 65 84 49 50 52 97 95.9
2-PrOH -- -- 43 42 46 -- --
HA 22 11 6.0 3.0 1.3 1.2 2.1
Others 13 5.0 2.0 5.0 0.7 1.8 2.0 aReaction conditions: 0.5 g catalyst, Reduction temperature: 350 oC, H2 flow rate: 100 mL/min,
WHSV-1.02 h-1; 1-PrOH: 1-propanol, 2-PrOH: 2-propanol, HA: Hydroxyacetone, Others include
ethanol, ethylene glycol, methanol and acetone.
It is clear that, the 1-PrOH/2-PrOH relative ratio was significantly affected by the
temperature and excellent selectivity to total propanols can be achieved at appropriate
temperature. Moreover, the increasing temperature could accelerate the glycerol
hydrogenolysis to 1-PrOH with promoted dehydration and hydrogenation of propanediols.
Taking into account that selectivity of 1-propanol is comparatively high (97%), indicates that
over-hydrogenolysis of propanediols to 1-propanol will be accelerated at high temperatures.
Based on these results, it is evident that temperature is one such key parameter that has
strongly influenced glycerol conversion and propanols selectivity. This was also observed by

Chapter 6
197 | P a g e
Ryneveld and co-workers [10] where at higher reaction temperatures, the glycerol conversion
over Ni/SiO2 catalysts was increased significantly. Further studies were performed at 230 oC,
the conversion and selectivity being both significant at this temperature.
6.3.2.3 Effect of PTA loading
Figure 6.5 shows the effect of PTA loading on glycerol hydrogenolysis over the
Pt-PTA/ZrO2 catalyst. In the absence of PTA, the sequential hydrogenolysis capability was
comparatively low with a total selectivity of 62 % to propanols. For the catalysts with acidic
component (5-20 wt% PTA), both glycerol conversion and selectivity to propanols elevated
and reached maximum at 15 wt% PTA loading (99.9% conversion with 98% selectivity to
propanols). Further increase in the loading of PTA dropped the glycerol conversion to 92%
and propanols selectivity to 84%. From the results, it is well-established that the synergitic
effect of active metal and acid sites appears to play a prime role in the catalytic performance
of glycerol hydrogenolysis and a balanced distribution of metal and acid sites gives best
reaction performance. Zhu et al. [8] also reported that the optimal concentration of acid
component was 15 wt%.
Figure 6.5: Effect of PTA loading on glycerol hydrogenolysis reaction to propanols
0 5 10 15 200
20
40
60
80
100
0
20
40
60
80
100
Selec
tivity
(%)
Conv
ersio
n (%
)
PTA loading (wt%)
Conversion 1-PrOH 2-PrOH

Chapter 6
198 | P a g e
Reaction conditions: Reaction temperature = 230 oC; H2 flow rate =100 mL/min, WHSV– 1.02 h-1.
6.3.2.4 Effect of catalyst reduction temperature
The results of glycerol hydrogenolysis using Pt-PTA/ZrO2 catalyst reduced at
different temperatures are presented in Figure 6.6. The sample was reduced in flowing
hydrogen at 200, 250, 300 and 350 oC, respectively. As shown in Figure 6.6, the reduction
temperature of catalyst has a noteworthy effect on the selectivity of propanols. As the
reduction temperature rose up from 200 to 350 oC, there was a uniform increase in the
conversion of glycerol from 70 to 99.9%. The selectivity to propanols (1-PrOH+2-PrOH)
also gradually increased with increasing catalyst reduction temperature specifying that the
reduction temperature can affect the catalytic performance promoting active hydrogen species
on the metal sites. Feng et al. [44] investigated the influence of catalyst reduction
temperature for the hydrogenolysis of glycerol to glycols over ruthenium catalysts and
concluded that reduction method has significant influence on the catalytic performance.
Figure 6.6: Effect of Reduction temperature on hydrogenolysis of glycerol to propanols
200 250 300 3500
20
40
60
80
100
0
20
40
60
80
100
Selec
tivity
(%)
Conv
ersio
n (%
)
Effect of Reduction temperature (oC)
Conversion 1-PrOH 2-PrOH

Chapter 6
199 | P a g e
Reaction conditions: Reduction temperature = 200-350 oC, Reaction temperature = 230 oC ; H2 flow
rate =100 mL/min; WHSV – 1.02 h-1.
6.3.2.5 Effect of glycerol concentration
Previous studies by Chary et al. [45] showed that higher glycerol conversion is
favorable at low glycerol concentration. However, this trend was found to be the same over
the Pt-PTA/ZrO2 catalyst in the present work. Figure 6.7 provides the influence of glycerol
concentration on the glycerol hydrogenolysis examined in the range of 5-20 wt% glycerol
feed. As the glycerol content increased, the glycerol conversion and the selectivity towards
propanols decreased considerably. At 5 wt% glycerol, the selectivity of propanols was 80%
with conversion of 99.9%. The same conversion was obtained at 10 wt%, but the selectivity
of propanols increased to 98% which indicates the over hydrogenolysis of propanediols to
propanols is accelerated. Further increase in the glycerol concentration caused a rapid decline
in the conversion and selectivity of propanols which attributes to a lowered reaction rate due
to higher viscosity. Therefore 10 wt% glycerol was found to be the optimal concentration to
obtain maximum conversion of glycerol and propanols selectivity.
Figure 6.7: Effect of Glycerol concentration on hydrogenolysis of glycerol to propanols

Chapter 6
200 | P a g e
Reaction conditions: Reaction temperature =230 oC; H2 flow rate =100 mL/min, WHSV – 1.01 h-1,
1.02 h-1, 1.03 h-1 & 1.04 h-1.
6.3.2.6 Effect of hydrogen flow rate
The hydrogen pressure showed significant effect on the conversion of glycerol and
the selectivities of propanols, and the results are displayed in Figure 6.8. The glycerol
conversion increased with rise in hydrogen flow rate from 60 mL/min to 120 mL/min. When
hydrogen flow rate was low, only 54% of glycerol was converted with 84% propanols
selectivity. While when hydrogen pressure was 100 mL/min, the increment of glycerol
conversion was as distinct as it reached maximum with an excellent selectivity of 98% to
propanols. Chary et al. [46] also reported a similar result that the conversion of glycerol
increased with the increase of hydrogen flow rate.
Figure 6.8: Effect of H2 flow rate on hydrogenolysis of glycerol to propanols
Reaction conditions: Reaction temperature = 230 oC; H2 flow rate =60 mL/min, 100 mL/min, 120
mL/min & 140 mL/min, WHSV – 1.02 h-1.
60 80 100 1200
20
40
60
80
100
0
20
40
60
80
100
Selec
tivity
(%)
Conv
ersio
n (%
)
Effect of hydrogen flow rate (mL/min)
Conversion 1-PrOH 2-PrOH

Chapter 6
201 | P a g e
6.3.2.7 Effect of partial pressure of glycerol
Reactions were carried out at 0.5, 1.0, 1.5 and 2.0 mL/hr flow rate of glycerol feed
(8.3, 10.9, 12.2 and 13.0 mm. Hg partial pressure of glycerol respectively) at a constant
temperature of 230 oC over the Pt-PTA/ZrO2 catalyst to conclude the effect of partial
pressure of glycerol on the reaction. Fig. 5 represents the results of the propanols selectivity
and conversions of 10 wt% glycerol solution under altered partial pressures of glycerol. As
shown in Figure 6.9, glycerol conversion decreased from 99.9% to 85% and the selectivities
of propanols (1-PrOH+2-PrOH) decreased greatly from 98% to 40% when partial pressure of
glycerol increased from 8.3-13.0 mm. Hg. The low conversion and selectivities at high
glycerol feed flow rate is as expected, due to limited availability of active sites on the
catalysts [47, 48].
Figure 6.9: Effect of partial pressure of glycerol on hydrogenolysis of glycerol to propanols
8 9 10 11 12 130
20
40
60
80
100
0
20
40
60
80
100
Selec
tivity
(%)
Conv
ersio
n (%
)
Effect of Partial Pressure of Glycerol (mm.Hg)
Conversion 1-PrOH 2-PrOH

Chapter 6
202 | P a g e
Reaction conditions: Reaction temperature = 230 oC; H2 flow rate =100 mL/min, WHSV – 1.02 h-1,
2.04 h-1, 3.06 h-1 & 4.08 h-1
6.3.2.8 Effect of Contact time (W/F)
The W/F was varied from 0.4 to 2.0 g ml-1 h by changing the weight of catalyst over
a fixed feed rate of glycerol. The effects of contact time on glycerol conversion and product
distribution on Pt-PTA/ZrO2 catalyst are shown in Figure 6.10. As expected, it was found
that glycerol conversion increased with prolonging contact time. As the value of W/F
increased from 0.4 to 1.0 g ml-1 h, glycerol conversion increased from 74% to 99.9%. The
selectivity of over hydrogenolysis products, i.e. 1-propanol and 2-propanol also increased to
52% and 46% from 30% and 23%, respectively, while HA and EG selectivity decreased from
17% to 0.4% and 18% to 1.3%, respectively by increasing contact time. This suggests that
higher contact time tends to increase selectivity of propanols which might be caused by the
enhancement further hydrogenolysis, and decreases the selectivity of undesired products such
as methanol, ethanol and acetone.
Figure 6.10: Effect of contact time (W/F) on glycerol hydrogenolysis
0.4 0.6 0.8 1.00
20
40
60
80
100
0
20
40
60
80
100Se
lectiv
ity (%
)
Conv
ersio
n (%
)
Effect of W/F (g ml-1 h)
Conversion 1-PrOH 2-PrOH HA EG Others

Chapter 6
203 | P a g e
Reaction conditions: Reaction temperature = 230 oC ; H2 flow rate =100 mL/min; Glycerol feed: 0.5
mL/hr; W/F = 0.4, 0.6, 0.8, 1.0 g ml-1 h.
6.3.2.9 Time on stream studies
As a descriptive example, a time-on-stream behavior of Pt-PTA/ZrO2 catalyst
during vapor phase hydrogenolysis of glycerol was studied for a period of 10 h at 230 oC
under atmospheric pressure, and the results are presented in Figure 6.11. The catalyst displays
a great rise in glycerol conversion and in the selectivities of 1-PrOH and 2-PrOH with
increasing the reaction time up to 3 h. At the reaction time of 3 h, the glycerol conversion
reached maximum to 99.9%, with selectivity towards propanols increasing to 98%. Till the
end of 7h, the glycerol conversion remained almost stable, although there is a slight decrease
in the selectivities of 1-PrOH and 2-PrOH. Upon further increasing the reaction time to 10 h,
the glycerol conversion dropped to 86% while the decline in total selectivity to propanols
(94%) is not so obvious. These maximum glycerol conversion and selectivities of propanols
(1-propanol + 2-propanol) in the vapor phase glycerol hydrogenolysis were higher than those
of the previously reported catalysts Pt-HSiW/ZrO2 [8] and Rh-ReOx/SiO2 [12] (propanols
(1-PrOH + 2-PrOH): 91% and 92% respectively).
1 2 3 4 5 6 7 8 9 10
85
90
95
100
85
90
95
100
Selec
tivity
(%)
Conv
ersio
n (%
)
Time (h)
Conversion of glycerol Selectivity of 1-PrOH+2-PrOH

Chapter 6
204 | P a g e
Figure 6.11: TOS on hydrogenolysis of glycerol to propanols over Pt-PTA/ZrO2 catalyst Reaction conditions: Reaction temperature = 230 oC; H2 Flow rate =100 mL/min, WHSV – 1.02 h-1.
6.3.3 Studies on the spent catalyst
The spent catalyst was regenerated by activating the catalyst through simple
oxidative treatment in air at 400 oC for 4 h to remove the coke deposited on surface of the
catalyst. To verify the stability of the catalyst, the Pt-PTA/ZrO2 catalyst was reused, and the
results are presented in Table 6.6. The conversion and the selectivity were nearly repeated
over the spent catalyst. Further, the stability of the catalyst was confirmed by various
characterization techniques. The XRD, SEM and TPD patterns of the spent Pt-PTA/ZrO2
catalyst were similar to those of the fresh Pt-PTA/ZrO2 catalyst as shown in Figure 6.12,
indicating that the structure of Pt-PTA/ZrO2 was maintained during the catalytic reaction.
Table 6.6: Studies of the spent catalyst Pt-PTA/ZrO2
Catalyst Conversion
(%)
Selectivity of
Total PrOHs
(%)
BET surface
area (m2/g)
Total acidity
(NH3
µmol/g)
Fresh 99.9 98 72 278.2
Spent 98.4 96.7 69 274.0

Chapter 6
205 | P a g e
Figure 6.12: XRD, NH3-TPD and SEM images of spent Pt-PTA/ZrO2 catalyst
6.4 Conclusions
A single step vapor phase hydrogenolysis of glycerol to propanols under atmospheric
pressure, based on metal-acid bifunctional catalysts is presented as a new and efficient
method. Highly active platinum and heteropolyacid catalysts supported on zirconia were
prepared by a simple and convenient step by step impregnation method. Different
characterization methods including XRD, FT-IR, Raman, NH3-TPD, BET surface area and
CO chemisorption were used to evaluate the structural properties of Pt-HPA/ZrO2 catalysts.
• XRD studies show that zirconia exist in the monoclinic phase in Pt-HPA/ZrO2
catalysts and the existence of small platinum crystals in the catalysts.
• FTIR and Raman studies reveal the characteristic keggin structure of HPAs in Pt-
HPA/ZrO2 catalysts.
• NH3-TPD studies clearly show that three types of acid sites (weak, moderate and
strong) are present in the catalysts and incorporation of HPAs favored the formation
of strong acid sites.
• CO-chemisorption results suggest that platinum is well dispersed on the support and
incorporation of HPAs did not significantly effect the dispersion.
Fresh Spent

Chapter 6
206 | P a g e
• The efficiency of Pt-HPA/ZrO2 catalysts employed for the vapor phase glycerol
hydrogenolysis for the selective production of propanols was much higher than that of
Pt/ZrO2 catalyst under the same conditions.
• The strong acidic sites of the catalysts caused double dehydration-hydrogenation of
glycerol and resulted in excellent glycerol conversion (99.9%) and propanols
selectivities (98%).
Decisively, among various Pt-HPA/ZrO2 catalysts, Pt-PTA/ZrO2 catalyst featured with
high dispersion of active species and strong acidity based on the results from CO
chemisorption and NH3-TPD methods, correlates well with the catalytic activity. A
detailed study on reaction parameters reveals the optimized reaction conditions and
further confirms that the reaction temperature had a noteworthy impact on the glycerol
hydrogenolysis. Further, the used catalyst was found to be relatively stable without
considerable drop in the catalytic activity, as evidenced from XRD, SEM and NH3-TPD
of spent catalyst.

Chapter 6
207 | P a g e
References
[1] E. P. Maris, R. J. Davis, J. Catal. 249 (2007) 326-335.
[2] V. P. Kumar, S. S. Priya, Y. Harikrishna, A. Kumar, K. V. R. Chary, J. Nanosci.
Nanotechnol. 15 (2015) 1–9.
[3] M. Schlaf, P. Ghosh, P. J. Fagan, E. Hauptman, R. M. Bullock, Adv. Synth. Catal. 351
(2009) 789-800.
[4] K. Chen, K. Mori, H. Watanabe, Y. Nakagawa, K. Tomishige, J. Catal. 294 (2012) 171-
183.
[5] E. Drent, W. W. Jager, US Patent 2000, 6,080,898.
[6] J. D. Unruh, D. Pearson, Kirk-Othmer Encyclopedia of Chemical Technology, John
Wiley & Sons, 2000.
[7] J. E. Logsdon, R. A. Loke, Kirk-Othmer Encyclopedia of Chemical Technology, John
Wiley & Sons, 2000.
[8] S. Zhu, Y. Zhu, S. Hao, H. Zheng, T. Mo, Y. Li, Green Chem. 14 (2012) 2607-2616.
[9] E. van Ryneveld, A. S. Mahomed, P. S. van Heerden, H. B. Friedrich, Catal. Lett. 141
(2011) 958-967.
[10] E. van Ryneveld, A. S. Mahomed, P. S. van Heerden, M. J. Green, H.B. Friedrich, Green
Chem. 13 (2011) 1819-1827.
[11] M. Schlaf, P. Ghosh, P.J. Fagan, E. Hauptman, R.M. Bullock, Adv. Synth. Catal. 351
(2009) 789-800.
[12] Y. Amada, S. Koso, Y. Nakagawa, K. Tomishige, ChemSusChem. 3 (2010) 728-736.
[13] C. Liang, Z. Ma, L. Ding, J. Qiu, Catal. Lett. 130 (2009) 169-176.
[14] M. A. Dasari, P. Kiatsimkul, W. R. Sutterlin, G. J. Suppes, Appl. Catal. A: 281 (2005)
225-231.

Chapter 6
208 | P a g e
[15] L. Huang, Y. Zhu, H. Zheng, Y. Li, Z. Zeng, J. Chem. Technol. Biotechnol. 83 (2008)
1670-1675.
[16] A. Perosa, P. Tundo, Ind. Eng. Chem. Res. 44 (2005) 8535-8537.
[17] T. Miyazawa, S. Koso, K. Kunimori, K. Tomishige, Appl. Catal., A. 329 (2007) 30-35.
[18] I. Furikado, T. Miyazawa, S. Koso, A. Shimao, K. Kunimori, K. Tomishige, Green.
Chem. 9 (2007) 582-588.
[19] A. Shimao, S. Koso, N. Ueda, Y. Shinmi, I. Furikado, K. Tomishige, Chem. Lett. 38
(2009) 540-541.
[20] L. C. Meher, R. Gopinath, S. N. Naik, A. K. Dalai, Ind. Eng. Chem. Res. 48 (2009)
1840-1846.
[21] S. Wang, H. Liu, Catal. Lett. 117 (2007) 62-67.
[22] J. Chaminand, L. Djakovitch, P. Gallezot, P. Marion, C. Pinel, C. Rosier, Green Chem. 6
(2004) 359-361.
[23] T. Kurosaka, H. Maruyama, I. Naribayashi, Y. Sasaki, Catal. Commun. 9 (2008) 1360-
1363.
[24] L. Huang, Y. Zhu, H. Zheng, G. Dong, Y. Li, Catal. Lett. 131 (2009) 312-320.
[25] O. M. Daniel, A. DeLaRiva, E. L. Kunkes, A. K. datye, J. A. Dumesic, R. J. Davis,
ChemCatChem. 2 (2010) 1107-1114.
[26] Y. Amada, Y. Shinmi, S. Koso, T. Kubota, Y. Nakagawa, K. Tomishige, Appl. Catal., B.
105 (2011) 117-127.
[27] J. Oh, S. Dash, H. Lee, Green Chem. 13 (2011) 2004-2007.
[28] S. Zhu, Y. Qiu, Y. Zhu, S. Hao, H. Zheng, Y. Li, Catal. Today. 212 (2013) 120-126.
[29] Y. Amada, H. Watanabe, M. Tamura, Y. Nakagawa, K. Okumura, K. Tomishige, J.
Phys. Chem., C 116 (2012) 23503-23514.
[30] J.t. Dam, K. Djanashvili, F. Kapteijn, U. Hanefeld, ChemCatChem. 5 (2013) 497-505.

Chapter 6
209 | P a g e
[31] R. Arundhathi, T. Mizugaki, T. Mitsudome, K. Jitsukawa, K. Kaneda, ChemSusChem. 6
(2013) 1345-1347.
[32] S. S. Priya, V. P. Kumar, M. L. Kantam, S. K. Bhargava, K. V. R. Chary, RSC Adv. 4
(2014) 51893-51903.
[33] M. Tamura, Y. Amada, S. Liu, Z. Yuan, Y. Nakagawa, K. Tomishige, J. Mol. Catal. A:
Chemical. 388-399 (2014) 177-187.
[34] O. Toshio, Catal. Today. 73 (2002) 167-176.
[35] T. Yamaguchi, Catal. Today. 20 (1994) 199-217.
[36] A. M. Alsalme, P. V. Wiper, Y. Z. Khimyak, E. F. Kozhevnikova, I. V. Kozhevnikov, J.
Catal. 276 (2010) 181-189.
[37] C. F. Oliveira, L. M. Dezaneti, F. A. C. Garcia, J. L. de Macedo, J. A. Dias, S. C. L.
Dias, K. S. P. Alvim, Appl. Catal., A. 372 (2010) 153-161.
[38] A. H. Jadhav, H. Kim, I. T. Hwang, Bioresource Technology. 132 (2013) 342-350.
[39] P. Ferriera, I. M. Fonsea, A. M. Ramos, J. Vital, J. E. Castanheiro, Catal. Commun. 12
(2011) 573-576.
[40] H. Atia, U. Armbruster, A. Martin, J. Catal. 258 (2008) 71-82.
[41] F. Arena, R. Dario, A. Pamalina, Appl. Catal., A. 170 (1998) 127-137.
[42] E. Tsukuda, S. Sato, R. Takahashi, T. Sodesawa, Catal. Commun. 8 (2007) 1349-1353.
[43] S. Malliek, K. M. Parida, Catal. Commun. 8 (2007) 889-893.
[44] J. Feng, H. Fu, J. Wang, R. Li, H. Chen, X. Li, Catal. Commun. 9 (2008) 1458-1464.
[45] V. P. Kumar, Y. Harikrishna, N. Nagaraju, K. V. R. Chary, Indian J. Chem., Sect. A. 53
(2014) 516-523.
[46] S. S. Priya, V. P. Kumar, M. L. Kantam, S. K. Bhargava, K. V. R. Chary, Catal. Lett.
144 (2014) 2129-2143.

Chapter 6
210 | P a g e
[47] V. P. Kumar, Ch. S. Srikanth, A. N. Rao, K.V.R. Chary, J. Nanosci. Nanotechnol. 14
(2014) 3137-3146.
[48] V. P. Kumar, A. Kumar, G. S. Rao, K.V.R.Chary, Catal. Today. 2014, DOI
10.1016/j.cattod.2014.03.036.

Chapter 7
211 | P a g e
CHAPTER 7
Summary

Chapter 7
212 | P a g e
7.1 Overall Conclusions
With glycerol available as a low cost, large volume feedstock byproduct originated
from the production of biodiesel, the valorisation of glycerol becomes very appealing.
Selective hydrogenolysis is an attractive route that allows the catalytic conversion of glycerol
into commodity chemicals, such as 1,3-propanediol and propanols. In spite of many past
studies on selective glycerol hydrogenolysis, there is a significant shortage of methods to
achieve sustainable and economically competitive processes. This knowledge gap has created
the need to develop a highly efficient, economically viable and environmentally friendly
catalytic process.
In the present research work, glycerol was successfully converted to value-added
products, such as 1,3-propanediol and propanols through vapour phase catalytic
hydrogenolysis using various supported platinum catalysts. This catalytic process was carried
out in a fixed bed reactor in a continuous process instead of a batch process, which allowed
the reaction process to be more compatible with the industrial scale. A number of supported
platinum catalysts (supports such as ZrO2, S-ZrO2, Al2O3, AlPO4, Y-zeolite, activated
carbon,SBA-15, H-mordenite) with and without additives (eg. WO3, HPAs) were prepared by
the impregnation method, characterized and screened for the glycerol hydrogenolysis.
Glycerol hydrogenolysis was carried out under ambient reaction conditions (180-260 oC and
atmospheric pressure (0.1MPa)), which made the process highly competitive and
advantageous over other processes that use high temperature and pressure.
The major conclusions drawn from the present work are summarized as follows:
The supported platinum catalysts with appropriate metal/acid balance were highly
effective for selective glycerol hydrogenolysis.
Surface acidic sites, as well as their strength in the support, were found to be
important factors in controlling the product selectivity in glycerol hydrogenolysis.

Chapter 7
213 | P a g e
In addition to acidic strength, the nature of acidic sites (Brønsted and Lewis) also
played a key role in product formation.
Irrespective of the presence of weak, moderate or strong acidic sites in the support,
Brønsted acidic sites selectively led to the formation of 1,3-propanediol whereas
Lewis acidic sites favoured the formation of 1,2-propanediol.
The presence of very strong acidic sites promoted the double dehydration-
hydrogenation of glycerol to produce propanols.
The controlled and optimized reaction conditions enabled the vapour phase glycerol
hydrogenolysis to be highly efficient and selective towards the desired products.
Overall, the catalytic system comprising highly dispersed platinum on a support with
optimal acidity and maximised surface area was found to be active towards the
glycerol hydrogenolysis reaction and was found to be important in governing the
product selectivity.
The first part of this work was to study selective glycerol hydrogenolysis over various
supported platinum catalysts on different support materials (ZrO2, S-ZrO2, γ-Al2O3, AlPO4,
Y-zeolite, activated carbon) under the same reaction conditions in order to precisely study the
effect of catalyst support and thus compare catalytic performance. Among the various
supported platinum catalysts screened, aluminium phosphate-supported platinum catalyst was
found to be the most effective catalyst for the hydrogenolysis of glycerol to 1,3-PDO. The
uniform dispersion of platinum, Brønsted acidity and high strength weak acidic sites of
AlPO4 support remarkably favoured the selective formation of 1,3-PDO from glycerol.
In the next chapter, a more detailed study involving Pt/AlPO4 catalyst was carried out
as there were no previous studies about its activity in glycerol hydrogenolysis. The effect of
platinum loading on the catalytic performance during glycerol hydrogenolysis to selectively
produce 1,3-PDO was investigated along with a detailed parametric reaction study. It was

Chapter 7
214 | P a g e
found that 2 wt% Pt/AlPO4 catalyst gave the best result, showing 35.4% selectivity to 1,3‐
PDO for 100% glycerol conversion at 260 °C, WHSV=1.02 h-1 and atmospheric pressure 0.1
MPa. The high conversion rate and selectivity were attributed to the well dispersed Pt, small
particle size, and optimal acidity of the catalyst.
In both previous studies, it was concluded that Brønsted acid sites are important in
improving the 1,3-PDO selectivity, therefore the subsequent study focussed on improving the
selectivity to value-added 1,3-PDO by using a strong Brønsted acidic tungstate (WO3)
additive in platinum catalyst supported on non-Brønsted acidic SBA-15 support in order to
study the role of Brønsted acid sites generated by tungstate for enhancing 1,3-PDO
selectivity.
As a result, the Pt-WO3/SBA-15 catalyst (2 wt% Pt; 10 wt% WO3) showed promising
activity for the selective hydrogenolysis of glycerol and increased the selectivity to 1,3-PDO
to 42%. SBA-15, a mesoporous silica support with high surface area and larger pore
diameter, enabled better dispersion of Pt as well as WO3 species, which together with the
Brønsted acidity generated by the incorporation of WO3 species contributed to the better
performance of the catalyst. It is evident from the bifunctional dehydration-hydrogenation
mechanism of glycerol hydrogenolysis that the Pt and WO3 species of the Pt-WO3/SBA-15
catalyst assisted in providing active metal sites for hydrogenation and acid sites for
dehydration, respectively.
To further verify the role of Brønsted acidic sites in controlling the 1,3-PDO
selectivity, a support containing strong Brønsted acidity was chosen to disperse Pt without
adding any external Brønsted acid additive in the next part of research work. In this regard,
Pt/H-mordenite catalysts were found to be the most promising catalysts for the selective
hydrogenolysis of glycerol to 1,3-PDO. The H-mordenite, being a Brønsted acidic zeolite,
provided the required Brønsted acidic sites for the selective formation of 1,3-PDO without

Chapter 7
215 | P a g e
the use of external additive, which is another advantage of this catalytic system (Pt/HM).
Among the investigated catalysts, 2 wt% Pt/HM was found to be the best bifunctional
catalyst successful in achieving the highest 1,3-PDO selectivity (48.6 %) resulting in 94.9%
glycerol conversion under mild reaction conditions.
Since all the afore-mentioned studies proved that a bi-functional catalyst was required
to increase the 1,3-PDO selectivity, the last part of this work focussed on developing metal-
acid bifunctional Pt-HPA/ZrO2 catalysts using heteropoyacids as strong Brønsted acid
additives for selective glycerol hydrogenolysis. In this case, however, the strong acidic sites
of the catalyst resulted in excessive hydrogenolysis (double dehydration-hydrogenation) of
glycerol to produce lower alcohols such as 1-propanol and 2-propanol performed in the vapor
phase under atmospheric pressure. Different kinds of HPAs were evaluated for their activity,
among which Pt-PTA/ZrO2 catalyst exhibited the highest propanol selectivity (98%) and
glycerol conversion yield (99.9%). The Pt dispersion and the strong acidity of the catalyst
promoted selective glycerol hydrogenolysis to propanols.
In summary, it was demonstrated that the catalytic vapour phase hydrogenolysis of
glycerol is an attractive method of producing value-added commodity chemicals such as 1,3-
PDO and PrOHs using highly efficient supported platinum catalysts. High glycerol
conversions and selectivities to the desired products can be obtained with metal-acid
bifunctional catalysts (acidity may be either from support or an acid additive) prepared by
impregnation method. Optimum conditions were explored by various reaction parametric
studies to attain maximum 1,3-PDO or PrOHs selectivity along with high levels of glycerol
conversion. Further, all the supported platinum catalysts were found to show stable activity
during the hydrogenolysis reaction. This research work successfully demonstrated the
development of an economic and viable method for the sustainable production of 1,3-PDO

Chapter 7
216 | P a g e
and propanols from glycerol, with respect to both catalyst preparation techniques and reaction
processes.
7.2 Scope for future study
Vapour phase catalytic hydrogenolysis of glycerol is a promising route to convert
glycerol into useful compounds, however in order to achieve acceptable selectivities,
additional important work should be carried out for further insights on how to address the
remaining challenges. A systematic understanding of the principles behind converting
glycerol into commodity chemicals will pave the way for future work on the development of
novel catalytic systems and reaction processes. It would be interesting to investigate the
stability of platinum catalysts and establish methods to overcome a potential decrease in
catalytic activity with catalyst deactivation/sintering. The selectivities can be improved with
the appropriate choice of acidic support and its interaction with the metal. In order to increase
the activity and selectivity, the use of phosphate-doped supports could be interesting and can
lead to an enhancement of the catalytic activity. A promoter effect in Pt-based catalysts could
also be investigated in bimetallic systems through the addition of other metals, such as Rh,
Re, Ir, Ru or Cu. The use of “green H2” obtained by optimizing in situ parallel glycerol
reforming, and the investigation of some lower grade glycerol qualities would also be
promising challenges.
Because of its unique physical and chemical properties, glycerol has also been
successfully used as an efficient alternative green solvent in various organic reactions and
syntheses. The widespread use of solvents in almost all chemical industries, and the
development of green solvents from renewable sources calls for further studies on the use of
glycerol as alternative green reaction medium and its promising use in a variety of ways, thus
confirming that this is an important and challenging area of research to be further
investigated.

Publications & Conferences
217 | P a g e
Publications and Conferences Contributions in refereed journals (From thesis)
1. S. Shanthi Priya, P. Bhanuchander, V. P. Kumar, D. Deepa, PR. Selvakannan, M. L.
Kantam, S. K. Bhargava, K. V. R. Chary, Platinum supported on H-Mordenite: A highly
efficient catalyst for selective hydrogenolysis of glycerol to 1,3-PDO. ACS Sustainable
Chem. Eng. 4 (2016) 1212-1222.
2. S. Shanthi Priya, V. P. Kumar, M. L. Kantam, S. K. Bhargava, A. Srikanth and K. V. R.
Chary, High Efficiency Conversion of Glycerol to 1,3-propanediol using a novel Platinum-
tungsten catalyst supported on SBA-15. Ind. Eng. Chem. Res. 54 (2015) 9104−9115.
3. S. Shanthi Priya, V. P. Kumar, M. L. Kantam, S. K. Bhargava, PR. Selvakannan and K.
V. R. Chary, Metal-Acid Bifunctional catalysts for Selective Hydrogenolysis of Glycerol
under atmospheric pressure: A Highly Selective route to produce Propanols. Applied
Catalysis A: General 498 (2015) 88–98.
4. S. Shanthi Priya, V. P. Kumar, M. L. Kantam, S. K. Bhargava and K. V. R. Chary,
Catalytic performance of Pt/AlPO4 catalysts for selective hydrogenolysis of glycerol to 1, 3-
propanediol in vapour phase. RSC Advances, 4 (2014) 51893-51903.
5. S. Shanthi Priya, V. P. Kumar, M. L. Kantam, S. K. Bhargava and K. V. R. Chary,
Vapour-phase Hydrogenolysis of Glycerol to 1, 3-propanediol Over Supported Pt Catalysts:
The Effect of Supports on the Catalytic Functionalities. Catal. Lett. 144 (2014) 2129–2143.
Out of thesis:
6. S. Shanthi Priya, P. Bhanuchander, V. P. Kumar, S. K. Bhargava, K. V. R. Chary,
Activity and Selectivity of Platinum−Copper Bimetallic Catalysts Supported on Mordenite
for Glycerol Hydrogenolysis to 1,3-Propanediol. Ind. Eng. Chem. Res. 55 (2016)
4461−4472.

Publications & Conferences
218 | P a g e
7. V. P. Kumar, S. Shanthi Priya, Y. Harikrishna A. Kumar, and K. V. R. Chary, Catalytic
Functionalities of Nano Ruthenium/γ-Al2O3 Catalysts for the Vapour Phase Hydrogenolysis
of Glycerol. Journal of Nanoscience and Nanotechnology, 15 (2015) 1–9.
8. R. Kishore, S. Shanthi Priya, M. Sudhakar, B.Venu, A. Venugopal, J. Yadav, and M. L.
Kantam, Synthesis of fluorenones by using Pd(II)/Mg-La mixed oxide catalyst. Catal. Sci.
Technol. 5 (2015) 3363-3367.
9. V. P. Kumar, Jorge N. Beltramini, S. Shanthi Priya, A. Srikanth, K. V. R. Chary,
Catalytic Functionalities of Nano Ru Catalysts Supported On TiO2-ZrO2 Mixed-Oxide for
Vapour-Phase Hydrogenolysis of Glycerol to Propanediols. Applied Petrochemical
Research (2015) DOI 10.1007/s13203-015-0136-8.
10. M. Harisekhar, V. P. Kumar, S. Shanthi Priya, K. V. R. Chary, Vapour phase
hydrogenolysis of glycerol to propanediols over CuO catalysts supported on SBA-15. J.
Chem. Technol. Biotechnol. 90 (2015) 1906–1917.
11. V. P. Kumar, S. Shanthi Priya, Jorge N. Beltramini, A. Srikanth, K. V. R. Chary,
Vapour phase hydrogenolysis of glycerol over Nanostructured Ru/SBA-5 catalysts. J.
Chem. Technol. Biotechnol. 2015 (Under Review)
Contributions in refereed conferences:
1. S. Shanthi Priya, , P. Bhanuchander, V.P. Kumar, D. Deepa, PR. Selvakannan, M. L.
Kantam, S. K. Bhargava, K. V. R. Chary, Platinum supported on H-Mordenite: A highly
efficient catalyst for selective hydrogenolysis of glycerol to 1,3-PDO. CHEMECA
Australia Sep 2015, Oral presentation.
2. S. Shanthi Priya, V. P. Kumar, M. L. Kantam, S. K. Bhargava, A. Srikanth and K. V. R.
Chary, High Efficiency Conversion of Glycerol to 1,3-propanediol using a novel

Publications & Conferences
219 | P a g e
Platinum-tungsten catalyst supported on SBA-15. CATSYMP, India, Jan 2015, Oral
presentation.
3. S. Shanthi Priya, V. P. Kumar, M. L. Kantam, S. K. Bhargava, PR. Selvakannan and K.
V. R. Chary, Metal-Acid Bifunctional catalysts for Selective Hydrogenolysis of Glycerol
under atmospheric pressure: A Highly Selective route to produce Propanols. Advanced
Spectroanalytical Techniques, India, Sep 2014, Poster presentation.
4. V. P. Kumar, S. Shanthi Priya, P. Bhanuchander, A. Srikanth, K. V. R. Chary, Vapour
phase hydrogenolysis of glycerol over Ru/SBA-5 catalysts. ICONBMS, India, Jan 2014,
Poster presentation.
Awards & Honours:
1. Achieved Prof Martin Bennett Research Excellence Award – 2016, one of the
prestigious awards in School of Applied Sciences, RMIT University awarded to the
Postgraduate Research Student making the most outstanding academic achievements in
2015.
2. Received Gold medal and Merit certificates from Osmania University for being the
topper and Distinction in Masters in Organic Chemistry during the academic year 2006-
08.
3. Achieved Best Appreciation merit from Avanthi Degree & PG College, Hyderabad,
India, for Distinction in Bachelors in Chemistry, Biotechnology & Microbiology during
the academic year 2003-2006.
4. Cleared and qualified National Eligibilty Test-Eligibility for Lectureship in the subject
Chemical Sciences, conducted by Council of Scientific & Industrial Research (CSIR-
UGC-NET), India, December 2011.

Publications & Conferences
220 | P a g e
5. Qualified and Awarded Junior Research Fellowship by Council of Scientific and
Industrial Research (CSIR) New Delhi, India, June 2012.
6. Awarded Best Poster Presentation in the National seminar on “Advance Spectro-
Analytical Techniques” (ASAT – 2014), 11-12th September, 2014 held at Loyola
Academy Degree & PG college, Hyderabad, India.