valuation: intrinsic, relative and contingent claim …adamodar/pdfiles/country/portugal.pdf ·...
TRANSCRIPT

Aswath Damodaran 1
Valuation: Intrinsic, Relative and ContingentClaim Valuation
Aswath Damodaran
http://www.stern.nyu.edu/~adamodar

Aswath Damodaran 2
Some Initial Thoughts
" One hundred thousand lemmings cannot be wrong"
Graffiti
Aswath Damodaran 3
A philosophical basis for Valuation
n Many investors believe that the pursuit of 'true value' based upon financialfundamentals is a fruitless one in markets where prices often seem to havelittle to do with value.
n There have always been investors in financial markets who have argued thatmarket prices are determined by the perceptions (and misperceptions) ofbuyers and sellers, and not by anything as prosaic as cashflows or earnings.
n Perceptions matter, but they cannot be all the matter.
n Asset prices cannot be justified by merely using the “bigger fool” theory.

Aswath Damodaran 4
Misconceptions about Valuation
n Myth 1: A valuation is an objective search for “true” value• Truth 1.1: All valuations are biased. The only questions are how much and in
which direction.
• Truth 1.2: The direction and magnitude of the bias in your valuation is directlyproportional to who pays you and how much you are paid.
n Myth 2.: A good valuation provides a precise estimate of value• Truth 2.1: There are no precise valuations
• Truth 2.2: The payoff to valuation is greatest when valuation is least precise.
n Myth 3: . The more quantitative a model, the better the valuation• Truth 3.1: One’s understanding of a valuation model is inversely proportional to
the number of inputs required for the model.
• Truth 3.2: Simpler valuation models do much better than complex ones.

Aswath Damodaran 5
Approaches to Valuation
n Discounted cashflow valuation, relates the value of an asset to the presentvalue of expected future cashflows on that asset.
n Relative valuation, estimates the value of an asset by looking at the pricing of'comparable' assets relative to a common variable like earnings, cashflows,book value or sales.
n Contingent claim valuation, uses option pricing models to measure the valueof assets that share option characteristics.

Aswath Damodaran 6
Basis for all valuation approaches
n The use of valuation models in investment decisions (i.e., in decisions onwhich assets are under valued and which are over valued) are based upon
• a perception that markets are inefficient and make mistakes in assessing value
• an assumption about how and when these inefficiencies will get corrected
n In an efficient market, the market price is the best estimate of value. Thepurpose of any valuation model is then the justification of this value.

Aswath Damodaran 7
Discounted Cash Flow Valuation
n What is it: In discounted cash flow valuation, the value of an asset is thepresent value of the expected cash flows on the asset.
n Philosophical Basis: Every asset has an intrinsic value that can be estimated,based upon its characteristics in terms of cash flows, growth and risk.
n Information Needed: To use discounted cash flow valuation, you need• to estimate the life of the asset
• to estimate the cash flows during the life of the asset
• to estimate the discount rate to apply to these cash flows to get present value
n Market Inefficiency: Markets are assumed to make mistakes in pricing assetsacross time, and are assumed to correct themselves over time, as newinformation comes out about assets.

Aswath Damodaran 8
Discounted Cashflow Valuation: Basis for Approach
n where CFt is the cash flow in period t, and r is the discount rate appropriategiven the riskiness of the cash flow and t is the life of the asset.
Proposition 1: For an asset to have value, the expected cash flows have to bepositive some time over the life of the asset.
Proposition 2: Assets that generate cash flows early in their life will be worthmore than assets that generate cash flows later; the latter may howeverhave greater growth and higher cash flows to compensate.
Value = CF
t
( 1 +r)tt = 1
t = n∑

Aswath Damodaran 9
Valuing a Firm
n The value of the firm is obtained by discounting expected cashflows to thefirm, i.e., the residual cashflows after meeting all operating expenses andtaxes, but prior to debt payments, at the weighted average cost of capital,which is the cost of the different components of financing used by the firm,weighted by their market value proportions.
where,
CF to Firmt = Expected Cashflow to Firm in period t
WACC = Weighted Average Cost of Capital
Value of Firm = CF to Firmt
( 1 +WACC) tt = 1
t = n
∑
Aswath Damodaran 10
Discounted Cash Flow Valuation: The Steps
n Estimate the discount rate or rates to use in the valuation• Discount rate can be either a cost of equity (if doing equity valuation) or a cost of
capital (if valuing the firm)
• Discount rate can be in nominal terms or real terms, depending upon whether thecash flows are nominal or real
• Discount rate can vary across time.
n Estimate the current earnings and cash flows on the asset, to either equityinvestors (CF to Equity) or to all claimholders (CF to Firm)
n Estimate the future earnings and cash flows on the asset being valued,generally by estimating an expected growth rate in earnings.
n Estimate when the firm will reach “stable growth” and what characteristics(risk & cash flow) it will have when it does.
n Choose the right DCF model for this asset and value it.

Aswath Damodaran 11
Cashflow to FirmEBIT (1-t)- (Cap Ex - Depr)- Change in WC= FCFF
Expected GrowthReinvestment Rate* Return on Capital
FCFF1 FCFF2 FCFF3 FCFF4 FCFF5
Forever
Firm is in stable growth:Grows at constant rateforever
Terminal Value= FCFFn+1/(r-gn)
FCFFn.........
Cost of Equity Cost of Debt(Riskfree Rate+ Default Spread) (1-t)
WeightsBased on Market Value
Discount at Cost of Capital (WACC) = Cost of Equity (Equity/(Debt + Equity)) + Cost of Debt (Debt/(Debt+ Equity))
Firm Value- Value of Debt= Value of Equity
Riskfree Rate:- No default risk- No reinvestment risk- In same currency andin same terms (real or nominal as cash flows
+Beta- Measures market risk X
Risk Premium- Premium for averagerisk investment
Type of Business
Operating Leverage
FinancialLeverage
Base EquityPremium
Country RiskPremium
DISCOUNTED CASHFLOW VALUATION

Aswath Damodaran 12
Cashflow to FirmEBIT(1-t) : 471- Nt CpX 362- Chg WC 29= FCFF 80
Expected Growth in EBIT (1-t).8289*.1544 = .128012.80%
86 97 110 124 139
Forever
Stable Growthg = 5%; Beta = 1.00Cap Ex/Deprecn = 120%
Terminal Value 5= 642/(.0856-.05) = 18,046
Cost of Equity12.33%
Cost of Debt(4.24%+ 1.50%)(1-.3625)= 3.66%
WeightsE = 61.35% D = 38.65%
Discount at Cost of Capital (WACC) = 12.33% (0.6135) + 3.66% (0.3865) = 8.98%
12,120- 4908= 7,506Per Share: 39.51
Riskfree Rate:Government Bond Rate = 4.24%
+Beta 1.11 X
Risk Premium5.5% + 1.79%
Unlevered Beta for Sector: 0.79
Firm’s D/ERatio: 63%
Historical US Premium5.5%
Country RiskPremium1.79%
Portugal Telecom: A ValuationReinvestment Rate82.89%
Return on Capital15.44%
WC : 9.86% ofRevenues
Aswath Damodaran 13
I. Discount Rates: Cost of Equity
n Consider the standard approach to estimating cost of equity:
Cost of Equity = Rf + Equity Beta * (E(Rm) - Rf)
where,
Rf = Riskfree rate
E(Rm) = Expected Return on the Market Index (Diversified Portfolio)
n In practice,• Short term government security rates are used as risk free rates
• Historical risk premiums are used for the risk premium
• Betas are estimated by regressing stock returns against market returns

Aswath Damodaran 14
Short term Governments are not riskfree
n On a riskfree asset, the actual return is equal to the expected return. Therefore,there is no variance around the expected return.
n For an investment to be riskfree, then, it has to have• No default risk
• No reinvestment risk
n Thus, the riskfree rates in valuation will depend upon when the cash flow isexpected to occur and will vary across time
n A simpler approach is to match the duration of the analysis (generally longterm) to the duration of the riskfree rate (also long term)
n In emerging markets, there are two problems:• The government might not be viewed as riskfree (Brazil, Indonesia)
• There might be no market-based long term government rate (China)

Aswath Damodaran 15
Estimating a Riskfree Rate
n Estimate a range for the riskfree rate in local terms:• Upper limit: Obtain the rate at which the largest, safest firms in the country borrow
at and use as the riskfree rate.
• Lower limit: Use a local bank deposit rate as the riskfree rate
n Do the analysis in real terms (rather than nominal terms) using a real riskfreerate, which can be obtained in one of two ways –
• from an inflation-indexed government bond, if one exists
• set equal, approximately, to the long term real growth rate of the economy in whichthe valuation is being done.
n Do the analysis in another more stable currency, say US dollars.

Aswath Damodaran 16
A Simple Test
n You are valuing a Portuguese company in U.S. dollars and are attempting toestimate a riskfree rate to use in the analysis. The riskfree rate that you shoulduse is
o The interest rate on a Escudo denominated Portuguese Government bond
o The interest rate on a US $ denominated Portuguese Government bond
o The interest rate on a US treasury bond

Aswath Damodaran 17
B. Everyone uses historical premiums, but..
n The historical premium is the premium that stocks have historically earnedover riskless securities.
n Practitioners never seem to agree on the premium; it is sensitive to• How far back you go in history…
• Whether you use T.bill rates or T.Bond rates
• Whether you use geometric or arithmetic averages.
n For instance, looking at the US:
Historical period Stocks - T.Bills Stocks - T.Bonds
Arith Geom Arith Geom
1926-1998 8.76% 6.95% 7.57% 5.91%
1962-1998 5.74% 4.63% 5.16% 4.46%
1981-1998 10.34% 9.72% 9.22% 8.02%

Aswath Damodaran 18
If you choose to use historical premiums….
n Go back as far as you can. A risk premium comes with a standard error. Giventhe annual standard deviation in stock prices is about 25%, the standard errorin a historical premium estimated over 25 years is roughly:
Standard Error in Premium = 25%/√25 = 25%/5 = 5%
n Be consistent in your use of the riskfree rate. Since we argued for long termbond rates, the premium should be the one over T.Bonds
n Use the geometric risk premium. It is closer to how investors think about riskpremiums over long periods.
n Never use historical risk premiums estimated over short periods.
n For emerging markets, start with the base historical premium in the US andadd a country spread, based upon the country rating and the relative equitymarket volatility.

Aswath Damodaran 19
Assessing Country Risk Using Currency Ratings: WesternEurope
Country Rating Default SpreadBelgium Aa1 75Denmark Aaa 0France Aaa 0Germany Aaa 0Greece A2 120Ireland Aaa 0Italy Aa3 90Netherlands Aaa 0Norway Aaa 0Portugal Aa2 85United Kingdom Aaa 0

Aswath Damodaran 20
Assessing Country Risk using Ratings: Eastern Europe
Country Rating Default Spread (In bp)
Bulgaria B2 550
Croatia Baa3 145
Czech Republic Baa1 120
Hungary Baa2 130
Russia B3 650
Slovenia A3 95

Aswath Damodaran 21
Using Country Ratings to Estimate Equity Spreads
n Country ratings measure default risk. While default risk premiums and equityrisk premiums are highly correlated, one would expect equity spreads to behigher than debt spreads.
• One way to adjust the country spread upwards is to use information from the USmarket. In the US, the equity risk premium has been roughly twice the defaultspread on junk bonds.
• Another is to multiply the bond spread by the relative volatility of stock and bondprices in that market. For example,
– Standard Deviation in PSI20 (Equity) = 17.78%
– Standard Deviation in Portuguese long bond = 8.47%
– Adjusted Equity Spread = 0.85% (17.78/8.47) = 1.79%
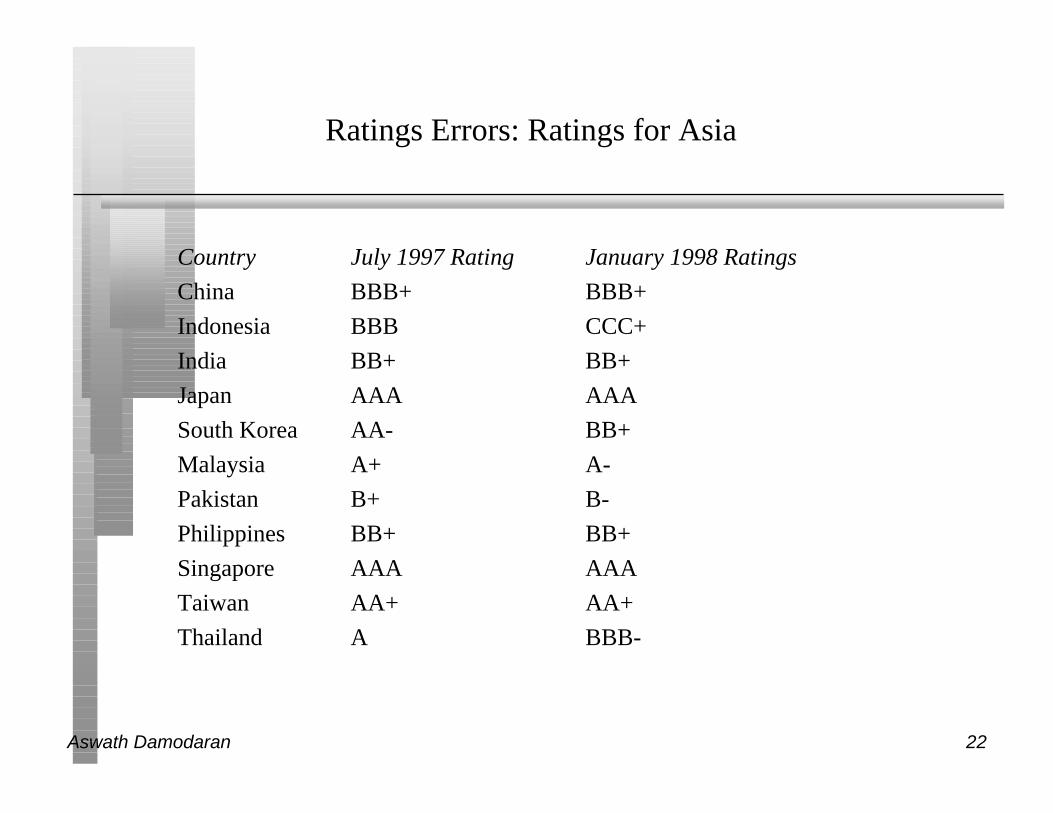
n Ratings agencies make mistakes. They are often late in recognizing andbuilding in risk.
Aswath Damodaran 22
Ratings Errors: Ratings for Asia
Country July 1997 Rating January 1998 Ratings
China BBB+ BBB+
Indonesia BBB CCC+
India BB+ BB+
Japan AAA AAA
South Korea AA- BB+
Malaysia A+ A-
Pakistan B+ B-
Philippines BB+ BB+
Singapore AAA AAA
Taiwan AA+ AA+
Thailand A BBB-

Aswath Damodaran 23
From Country Spreads to Risk premiums
n Approach 1: Assume that every company in the country is equally exposed tocountry risk. In this case,
E(Return) = Riskfree Rate + Country Spread + Beta (US premium)Implicitly, this is what you are assuming when you use the local Government’s dollar
borrowing rate as your riskfree rate.
n Approach 2: Assume that a company’s exposure to country risk is similar toits exposure to other market risk.
E(Return) = Riskfree Rate + Beta (US premium + Country Spread)
n Approach 3: Treat country risk as a separate risk factor and allow firms tohave different exposures to country risk (perhaps based upon the proportion oftheir revenues come from non-domestic sales)
E(Return)=Riskfree Rate+ β (US premium) + λ (Country Spread)

Aswath Damodaran 24
Estimating Exposure to Country Risk
n Different companies should be exposed to different degrees to country risk.For instance, a Portuguese firm that generates the bulk of its revenues inWestern Europe should be less exposed to country risk in Portugal than onethat generates all its business within Portugal.
n The factor “λ” measures the relative exposure of a firm to country risk. Onesimplistic solution would be to do the following:
λ = % of revenues domesticallyfirm/ % of revenues domesticallyavg firm
For instance, if a firm gets 35% of its revenues domestically while the averagefirm in that market gets 70% of its revenues domestically
λ = 35%/ 70 % = 0.5
n There are two implications• A company’s risk exposure is determined by where it does business and not by
where it is located
• Firms might be able to actively manage their country risk exposures
Aswath Damodaran 25
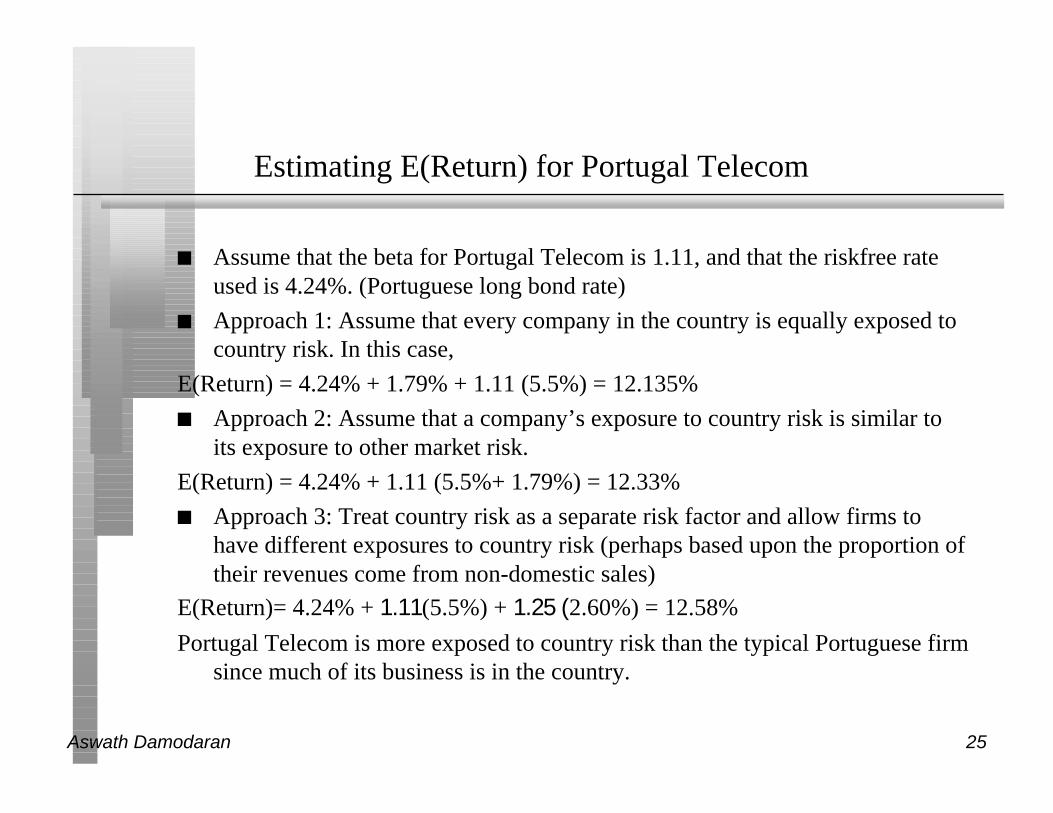
Estimating E(Return) for Portugal Telecom
n Assume that the beta for Portugal Telecom is 1.11, and that the riskfree rateused is 4.24%. (Portuguese long bond rate)
n Approach 1: Assume that every company in the country is equally exposed tocountry risk. In this case,
E(Return) = 4.24% + 1.79% + 1.11 (5.5%) = 12.135%
n Approach 2: Assume that a company’s exposure to country risk is similar toits exposure to other market risk.
E(Return) = 4.24% + 1.11 (5.5%+ 1.79%) = 12.33%
n Approach 3: Treat country risk as a separate risk factor and allow firms tohave different exposures to country risk (perhaps based upon the proportion oftheir revenues come from non-domestic sales)
E(Return)= 4.24% + 1.11(5.5%) + 1.25 (2.60%) = 12.58%
Portugal Telecom is more exposed to country risk than the typical Portuguese firmsince much of its business is in the country.

Aswath Damodaran 26
Implied Equity Premiums
n If we use a basic discounted cash flow model, we can estimate the implied riskpremium from the current level of stock prices.
n For instance, if stock prices are determined by the simple Gordon GrowthModel:
• Value = Expected Dividends next year/ (Required Returns on Stocks - ExpectedGrowth Rate)
• Plugging in the current level of the index, the dividends on the index and expectedgrowth rate will yield a “implied” expected return on stocks. Subtracting out theriskfree rate will yield the implied premium.
n The problems with this approach are:• the discounted cash flow model used to value the stock index has to be the right
one.
• the inputs on dividends and expected growth have to be correct
• it implicitly assumes that the market is currently correctly valued

Aswath Damodaran 27
Implied Premiums in US Market
Implied Premium for US Equity Market
0.00%
1.00%
2.00%
3.00%
4.00%
5.00%
6.00%
7.00%
1960
1962
1964
1966
1968
1970
1972
1974
1976
1978
1980
1982
1984
1986
1988
1990
1992
1994
1996
1998
Year
Implied P
rem
ium

Aswath Damodaran 28
Implied Premium for Portuguese market: June 1, 1999
n Level of the Index = 9808
n Dividends on the Index = 2.03% of 9808 (Used weighted yield)
n Other parameters• Riskfree Rate = 4.24%
• Expected Growth (in nominal dollar terms)– Next 5 years = 12% (Used expected growth rate in Earnings)
– After year 5 = 5%
n Solving for the expected return:• Expected return on Equity = 7.93%
• Implied Equity premium = 3.69%
Aswath Damodaran 29
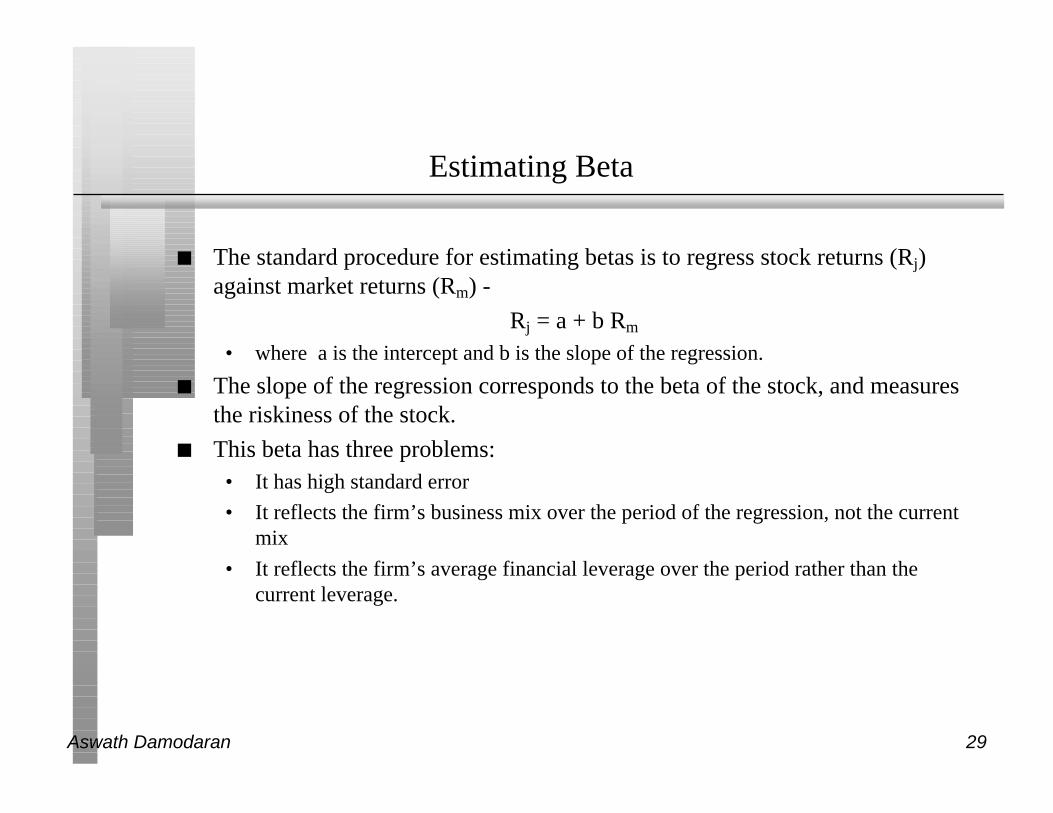
Estimating Beta
n The standard procedure for estimating betas is to regress stock returns (Rj)against market returns (Rm) -
Rj = a + b Rm
• where a is the intercept and b is the slope of the regression.
n The slope of the regression corresponds to the beta of the stock, and measuresthe riskiness of the stock.
n This beta has three problems:• It has high standard error
• It reflects the firm’s business mix over the period of the regression, not the currentmix
• It reflects the firm’s average financial leverage over the period rather than thecurrent leverage.

Aswath Damodaran 30
Beta Estimation: The Old Fashioned Way

Aswath Damodaran 31
The Index Effect

Aswath Damodaran 32
Determinants of Betas
n Product or Service: The beta value for a firm depends upon the sensitivity ofthe demand for its products and services and of its costs to macroeconomicfactors that affect the overall market.
• Cyclical companies have higher betas than non-cyclical firms
• Firms which sell more discretionary products will have higher betas than firms thatsell less discretionary products
n Operating Leverage: The greater the proportion of fixed costs in the coststructure of a business, the higher the beta will be of that business. This isbecause higher fixed costs increase your exposure to all risk, including marketrisk.
n Financial Leverage: The more debt a firm takes on, the higher the beta willbe of the equity in that business. Debt creates a fixed cost, interest expenses,that increases exposure to market risk.
Aswath Damodaran 33
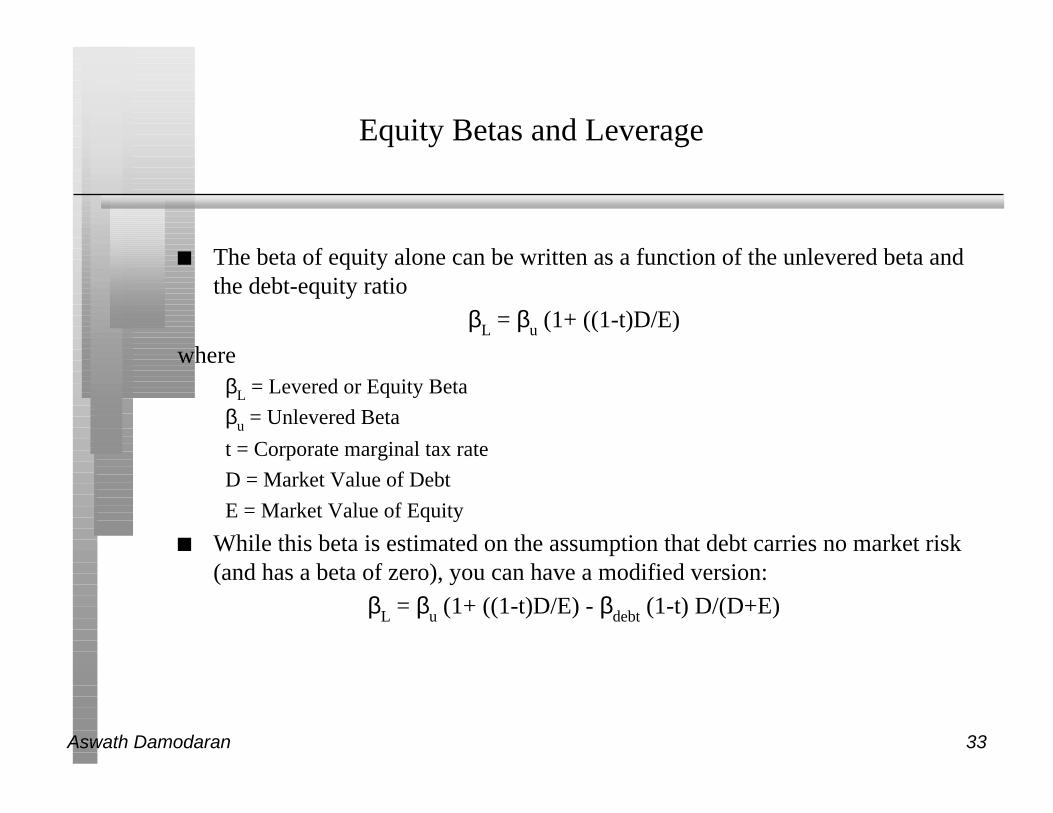
Equity Betas and Leverage
n The beta of equity alone can be written as a function of the unlevered beta andthe debt-equity ratio
βL = βu (1+ ((1-t)D/E)
whereβL = Levered or Equity Beta
βu = Unlevered Beta
t = Corporate marginal tax rate
D = Market Value of Debt
E = Market Value of Equity
n While this beta is estimated on the assumption that debt carries no market risk(and has a beta of zero), you can have a modified version:
βL = βu (1+ ((1-t)D/E) - βdebt (1-t) D/(D+E)

Aswath Damodaran 34
Solutions to the Regression Beta Problem
n Modify the regression beta by• changing the index used to estimate the beta
• adjusting the regression beta estimate, by bringing in information about thefundamentals of the company
n Estimate the beta for the firm using• the standard deviation in stock prices instead of a regression against an index.
• accounting earnings or revenues, which are less noisy than market prices.
n Estimate the beta for the firm from the bottom up without employing theregression technique. This will require
• understanding the business mix of the firm
• estimating the financial leverage of the firm
n Use an alternative measure of market risk that does not need a regression.
Aswath Damodaran 35
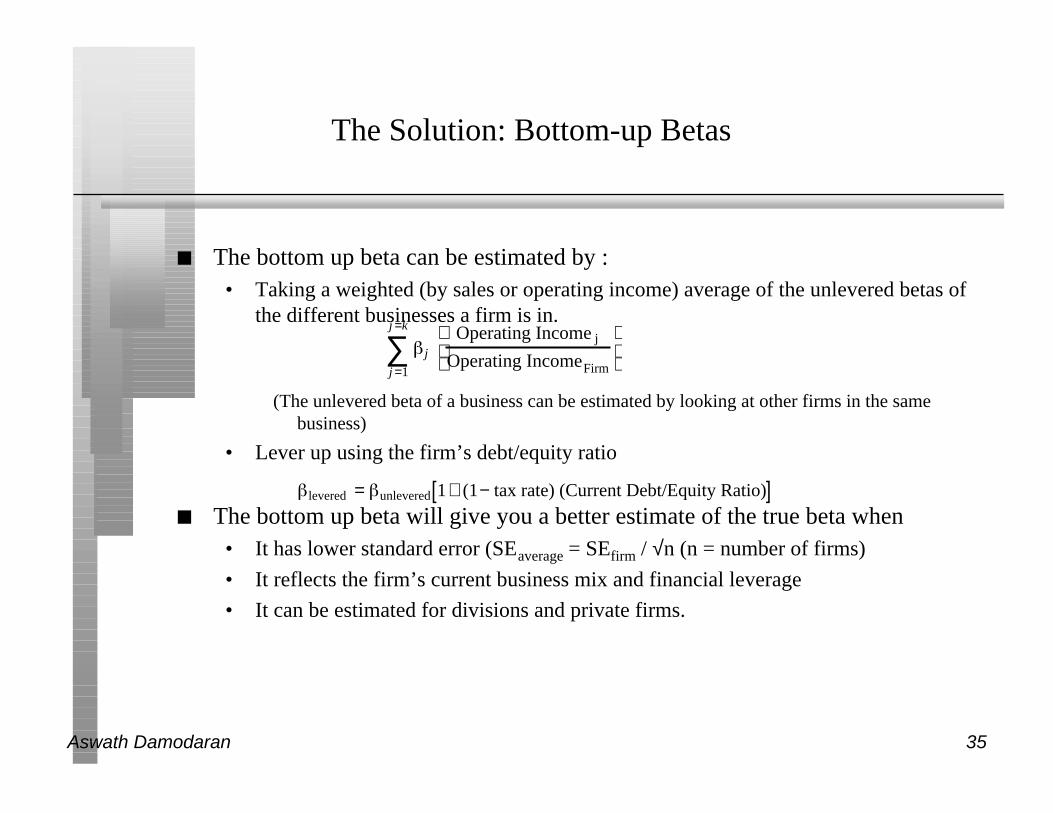
The Solution: Bottom-up Betas
n The bottom up beta can be estimated by :• Taking a weighted (by sales or operating income) average of the unlevered betas of
the different businesses a firm is in.
(The unlevered beta of a business can be estimated by looking at other firms in the samebusiness)
• Lever up using the firm’s debt/equity ratio
n The bottom up beta will give you a better estimate of the true beta when• It has lower standard error (SEaverage = SEfirm / √n (n = number of firms)
• It reflects the firm’s current business mix and financial leverage
• It can be estimated for divisions and private firms.
j
j =1
j =k
∑ Operating Income j
Operating IncomeFirm
levered = unlevered 1+ (1− tax rate) (Current Debt/Equity Ratio)[ ]

Aswath Damodaran 36
Portugal Telecom’s Bottom-up Beta
Business Unlevered D/E Ratio Levered Riskfree Risk Cost of
Beta Beta Rate Premium Equity
Telecom 0.79 63% 1.11 4.24% 7.29% 12.33%
Proportion of operating income from telecom = 100%
Unlevered Beta for Portugal Telecom= 0.79
Assume now that Portugal Telecom decides to go into the internet business, andthat the unlevered beta for that business is 1.75. Assuming that 25% ofPortugal Telecom’s business looking forward will come from the internet,what will the firm’s beta be?

Aswath Damodaran 37
Private Business: Owner hasall his wealth invested in thebusiness
Venture Capitalist: Haswealth invested in a numberof companies in one sector
Publicly traded companywith investors who are diversified domesticallyorIPO to investors who aredomestically diversified
Publicly traded companywith investors who are diverisified globallyorIPO to global investors
Market Risk
Int’nl Risk
Sector Risk
Competitive Risk
Project Risk
Market Risk
Int’nl Risk
Sector Risk
Competitive Risk
Project Risk
Market Risk
Int’nl Risk
Sector Risk
Competitive Risk
Project Risk
Market Risk
Int’nl Risk
Sector Risk
Competitive Risk
Project Risk
TotalRisk
Risk added to sectorportfolio
Risk added to domestic portfolio
Risk added to global portfolio
StandardDeviation
Beta relative to sector
Beta relative to local index
Beta relative to global index
40%
25%
15%
10%
100/.4=250
100/.25=400
100/.15=667
100/.10=1000
Investor Type Cares about Risk Measure Cost ofEquity
Firm Value
Valuing a Firm from Different Risk PerspectivesFirm is assumed to have a cash flow of 100 each year forever.

Aswath Damodaran 38
IB. Cost of Debt
n If the firm has bonds outstanding, and the bonds are traded, the yield tomaturity on a long-term, straight (no special features) bond can be used as theinterest rate.
n If the firm is rated, use the rating and a typical default spread on bonds withthat rating to estimate the cost of debt.
n If the firm is not rated,• and it has recently borrowed long term from a bank, use the interest rate on the
borrowing or
• estimate a synthetic rating for the company, and use the synthetic rating to arrive ata default spread and a cost of debt
n The cost of debt has to be estimated in the same currency as the cost of equityand the cash flows in the valuation.

Aswath Damodaran 39
Estimating Synthetic Ratings
n The rating for a firm can be estimated using the financial characteristics of thefirm. In its simplest form, the rating can be estimated from the interestcoverage ratio
Interest Coverage Ratio = EBIT / Interest Expenses
n For Portugal Telecom, for instance
Interest Coverage Ratio = 739/254 = 2.91• Based upon the relationship between interest coverage ratios and ratings, we would
estimate a rating of BBB for Portugal Telecom.
n For Semapa,
Interest Coverage Ratio = 88.2/8.7 = 10.1• Based upon the relationship between interest coverage ratios and ratings, we would
estimate a rating of AAA for Semapa

Aswath Damodaran 40
Interest Coverage Ratios, Ratings and Default Spreads
If Interest Coverage Ratio is Estimated Bond Rating Default Spread
> 8.50 AAA 0.20%
6.50 - 8.50 AA 0.50%
5.50 - 6.50 A+ 0.80%
4.25 - 5.50 A 1.00%
3.00 - 4.25 A– 1.25%
2.50 - 3.00 BBB 1.50%
2.00 - 2.50 BB 2.00%
1.75 - 2.00 B+ 2.50%
1.50 - 1.75 B 3.25%
1.25 - 1.50 B – 4.25%
0.80 - 1.25 CCC 5.00%
0.65 - 0.80 CC 6.00%
0.20 - 0.65 C 7.50%
< 0.20 D 10.00%

Aswath Damodaran 41
IC. Weights for the Cost of Capital Computation
n The weights used to compute the cost of capital should be the market valueweights for debt and equity.
n There is an element of circularity that is introduced into every valuation bydoing this, since the values that we attach to the firm and equity at the end ofthe analysis are different from the values we gave them at the beginning.
n As a general rule, the debt that you should subtract from firm value to arrive atthe value of equity should be the same debt that you used to compute the costof capital.
Aswath Damodaran 42
Book Value versus Market Value Weights
n It is often argued that using book value weights is more conservative thanusing market value weights. Do you agree?
o Yes
o No
n It is also often argued that book values are more reliable than market valuessince they are not as volatile. Do you agree?
o Yes
o No

Aswath Damodaran 43
Estimating Cost of Capital: Portugal Telecom
n Equity• Cost of Equity = 4.24% + 1.11 (7.29%) = 12.33%
• Market Value of Equity = 41*190 = 7,790 Mil (61.35%)
n Debt• Cost of debt = 4.24% + 1.5% (default spread) = 5.74%
• Market Value of Debt = 4,908 Mil (38.65%)
n Cost of Capital
Cost of Capital = 12.33% (.6135) + 5.74% (1- .3625) (.3865)) = 8.98%
Aswath Damodaran 44
Portugal Telecom: Book Value Weights
n Portugal Telecom has a book value of equity of 2,195 million and a bookvalue of debt of 4,908 million. Estimate the cost of capital using book valueweights instead of market value weights.
n Is this more conservative?

Aswath Damodaran 45
II. Estimating Cash Flows to Firm
EBIT ( 1 - tax rate)
+ Depreciation
- Capital Spending
- Change in Working Capital
= Cash flow to the firm

Aswath Damodaran 46
What is the EBIT of a firm?
n The EBIT, measured right, should capture the true operating income fromassets in place at the firm.
n Any expense that is not an operating expense or income that is not anoperating income should not be used to compute EBIT. In other words, anyfinancial expense (like interest expenses) or capital expenditure should notaffect your operating income.
n Can you name• A financing expense that gets treated as an operating expense?
• A capital expense that gets treated as an operating expense?

Aswath Damodaran 47
Operating Lease Expenses: Operating or Financing Expenses
n Operating Lease Expenses are treated as operating expenses in computingoperating income. In reality, operating lease expenses should be treated asfinancing expenses, with the following adjustments to earnings and capital:
n Debt Value of Operating Leases = PV of Operating Lease Expenses at the pre-tax cost of debt
n Adjusted Operating Earnings = Operating Earnings + Pre-tax cost of Debt *PV of Operating Leases.

Aswath Damodaran 48
R&D Expenses: Operating or Capital Expenses
n Accounting standards require us to consider R&D as an operating expenseeven though it is designed to generate future growth. It is more logical to treatit as capital expenditures.
n To capitalize R&D,• Specify an amortizable life for R&D (2 - 10 years)
• Collect past R&D expenses for as long as the amortizable life
• Sum up the unamortized R&D over the period. (Thus, if the amortizable life is 5years, the research asset can be obtained by adding up 1/5th of the R&D expensefrom five years ago, 2/5th of the R&D expense from four years ago...:

Aswath Damodaran 49
Capitalizing R&D Expenses: Bristol Myers
n R & D was assumed to have a 10-year life.Year R&D Expense Unamortized portion $ Value
1998 1385.00 1.00 1385.00
1997 1276.00 0.90 1148.40
1996 1199.00 0.80 959.20
1995 1108.00 0.70 775.60
1994 1128.00 0.60 676.80
1993 1083.00 0.50 541.50
1992 983.00 0.40 393.20
1991 881.00 0.30 264.30
1990 789.00 0.20 157.80
1989 688.00 0.10 68.80
Value of research asset = $ 6,371 million
Amortization of research asset in 1998 = $ 637 million
Adjustment to Operating Income = $ 1,385 million - $ 637 million =$ 748 million

Aswath Damodaran 50
What tax rate?
n The tax rate that you should use in computing the after-tax operating incomeshould be
o The effective tax rate in the financial statements (taxes paid/Taxable income)
o The tax rate based upon taxes paid and EBIT (taxes paid/EBIT)
o The marginal tax rate
o None of the above
o Any of the above, as long as you compute your after-tax cost of debt using thesame tax rate

Aswath Damodaran 51
The Right Tax Rate to Use
n The choice really is between the effective and the marginal tax rate. In doingprojections, it is far safer to use the marginal tax rate since the effective taxrate is really a reflection of the difference between the accounting and the taxbooks.
n By using the marginal tax rate, we tend to understate the after-tax operatingincome in the earlier years, but the after-tax tax operating income is moreaccurate in later years
n If you choose to use the effective tax rate, adjust the tax rate towards themarginal tax rate over time.
n The tax rate used to compute the after-tax cost of debt has to be the same taxrate that you use to compute the after-tax operating income.

Aswath Damodaran 52
A Tax Rate for a Money Losing Firm
n Assume that you are trying to estimate the after-tax operating income for afirm with $ 1 billion in net operating losses carried forward. This firm isexpected to have operating income of $ 500 million each year for the next 3years, and the marginal tax rate on income for all firms that make money is40%. Estimate the after-tax operating income each year for the next 3 years.
Year 1 Year 2 Year 3
EBIT 500 500 500
Taxes
EBIT (1-t)
Tax rate
Aswath Damodaran 53
Normalizing Earnings
n In most valuations, we begin with the current operating income and estimateexpected growth. This practice works as long as
• Current operating income is positive
• Current operating income is normal. (In any given year, the operating income canbe too low, if the firm has had a poor year, or too high, if it has had an explosivelygood year)
n If the current operating income is negative, it has to be normalized. How younormalize earnings will depend upon why the earnings are negative in the firstplace.

Aswath Damodaran 54
A Framework for Analyzing Companies with Negative or Abnormally Low Earnings
Why are the earnings negative or abnormally low?
TemporaryProblems
Cyclicality:Eg. Auto firmin recession
StructuralProblems: Eg. Cable co. with high infrastruccture investments.
LeverageProblems: Eg. An otherwise healthy firm with too much debt.
Long-termOperatingProblems: Eg. A firm with significant production or cost problems.
Normalize Earnings
Value the firm by doing detailed cash flow forecasts starting with revenues and reduce or eliminate the problem over time.:(a) If problem is structural: Target for operating margins of stable firms in the sector.(b) If problem is leverage : Target for a debt ratio that the firm will be comfortable with by end of period, which could be its own optimal or the industry average.(c) If problem is operating : Target for an industry-average operating margin.
If firm’s size has notchanged significantlyover time
Average DollarEarnings (Net Income if Equity and EBIT if Firm made bythe firm over time
If firm’s size has changedover time
Use firm’s average ROE (if valuing equity) or average ROC (if valuing firm) on current BV of equity (if ROE) or current BV of capital (if ROC)

Aswath Damodaran 55
Net Capital Expenditures
n Net capital expenditures represent the difference between capital expendituresand depreciation. Depreciation is a cash inflow that pays for some or a lot (orsometimes all of) the capital expenditures.
n In general, the net capital expenditures will be a function of how fast a firm isgrowing or expecting to grow. High growth firms will have much higher netcapital expenditures than low growth firms.
n Assumptions about net capital expenditures can therefore never be madeindependently of assumptions about growth in the future.

Aswath Damodaran 56
Working Capital Investments
n In accounting terms, the working capital is the difference between currentassets (inventory, cash and accounts receivable) and current liabilities(accounts payables, short term debt and debt due within the next year)
n A cleaner definition of working capital from a cash flow perspective is thedifference between non-cash current assets (inventory and accountsreceivable) and non-debt current liabilities (accounts payable)
n Any investment in this measure of working capital ties up cash. Therefore, anyincreases (decreases) in working capital will reduce (increase) cash flows inthat period.
n When forecasting future growth, it is important to forecast the effects of suchgrowth on working capital needs, and building these effects into the cashflows.
Aswath Damodaran 57
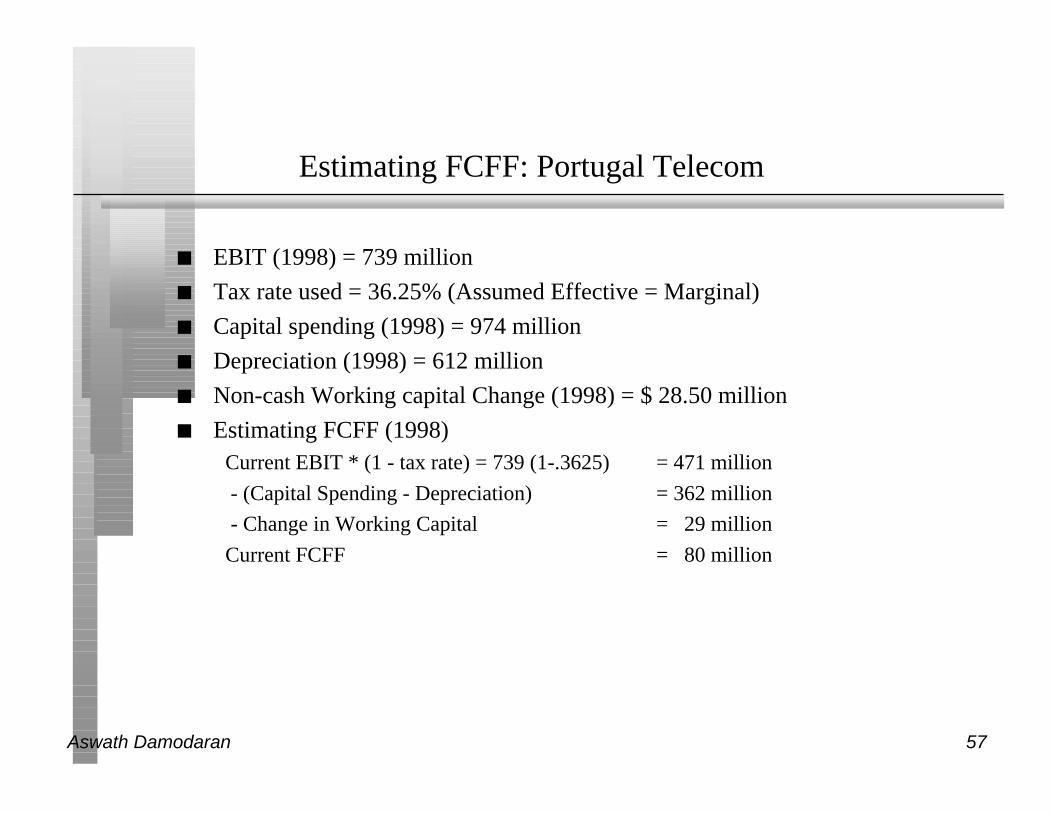
Estimating FCFF: Portugal Telecom
n EBIT (1998) = 739 million
n Tax rate used = 36.25% (Assumed Effective = Marginal)
n Capital spending (1998) = 974 million
n Depreciation (1998) = 612 million
n Non-cash Working capital Change (1998) = $ 28.50 million
n Estimating FCFF (1998)Current EBIT * (1 - tax rate) = 739 (1-.3625) = 471 million
- (Capital Spending - Depreciation) = 362 million
- Change in Working Capital = 29 million
Current FCFF = 80 million

Aswath Damodaran 58
IV. Estimating Growth
n When valuing firms, some people use analyst projections of earnings growth(over the next 5 years) that are widely available in Zacks, I/B/E/S or First Callin the US, and less so overseas. This practice is
o Fine. Equity research analysts follow these stocks closely and should be prettygood at estimating growth
o Shoddy. Analysts are not that good at projecting growth in earnings in the longterm.
o Wrong. Analysts do not project growth in operating earnings

Aswath Damodaran 59
Expected Growth in EBIT and Fundamentals
n Reinvestment Rate and Return on Capital
gEBIT = (Net Capital Expenditures + Change in WC)/EBIT(1-t) * ROC =Reinvestment Rate * ROC
n Proposition 2: No firm can expect its operating income to grow over timewithout reinvesting some of the operating income in net capital expendituresand/or working capital.
n Proposition 3: The net capital expenditure needs of a firm, for a given growthrate, should be inversely proportional to the quality of its investments.

Aswath Damodaran 60
Expected Growth and Portugal Telecom
n Return on Capital = EBIT (1- tax rate) / (BV of Debt + BV of Equity)
= 471/(1132+2020) = 15.44%
n Reinvestment Rate = (Cap Ex - Deprcn + Chg in WC)/EBIT (1-t)
= (362+29)/ 471= 82.89%
n Expected Growth in Operating Income = (.8289) (15.44%) = 12.8%

Aswath Damodaran 61
Not all growth is equal: Disney versus Hansol Paper
n Disney• Reinvestment Rate = 50%
• Return on Capital =18.69%
• Expected Growth in EBIT =.5(18.69%) = 9.35%
n Hansol Paper• Reinvestment Rate = (105,000+1,000)/(109,569*.7) = 138.20%
• Return on Capital = 6.76%
• Expected Growth in EBIT = 6.76% (1.382) = 9.35%
n Both these firms have the same expected growth rate in operating income. Arethey equivalent from a valuation standpoint?

Aswath Damodaran 62
V. Growth Patterns
n A key assumption in all discounted cash flow models is the period of highgrowth, and the pattern of growth during that period. In general, we can makeone of three assumptions:
• there is no high growth, in which case the firm is already in stable growth
• there will be high growth for a period, at the end of which the growth rate will dropto the stable growth rate (2-stage)
• there will be high growth for a period, at the end of which the growth rate willdecline gradually to a stable growth rate(3-stage)
Stable Growth 2-Stage Growth 3-Stage Growth

Aswath Damodaran 63
Determinants of Growth Patterns
n Size of the firm• Success usually makes a firm larger. As firms become larger, it becomes much
more difficult for them to maintain high growth rates
n Current growth rate• While past growth is not always a reliable indicator of future growth, there is a
correlation between current growth and future growth. Thus, a firm growing at30% currently probably has higher growth and a longer expected growth periodthan one growing 10% a year now.
n Barriers to entry and differential advantages• Ultimately, high growth comes from high project returns, which, in turn, comes
from barriers to entry and differential advantages.
• The question of how long growth will last and how high it will be can therefore beframed as a question about what the barriers to entry are, how long they will stayup and how strong they will remain.

Aswath Damodaran 64
An Alternative: Equity Valuation
n The value of equity is obtained by discounting expected cashflows to equity,i.e., the residual cashflows after meeting all expenses, tax obligations andinterest and principal payments, at the cost of equity, i.e., the rate of returnrequired by equity investors in the firm.
where,
CF to Equityt = Expected Cashflow to Equity in period t
ke = Cost of Equity
n The dividend discount model is a specialized case of equity valuation, and thevalue of a stock is the present value of expected future dividends.
Value of Equity = CF to Equityt
(1+ ke )tt=1
t=n
∑

Aswath Damodaran 65
DividendsNet Income * Payout Ratio= Dividends
Expected GrowthRetention Ratio *Return on Equity
Dividend 1 Dividend 2 Dividend 3 Dividend 4 Dividend 5
Forever
Firm is in stable growth:Grows at constant rateforever
Terminal Value= Dividendn+1/(ke-gn)
Dividend n.........
Cost of Equity
Discount at Cost of Equity
Value of Equity
Riskfree Rate:- No default risk- No reinvestment risk- In same currency andin same terms (real or nominal as cash flows
+Beta- Measures market risk X
Risk Premium- Premium for averagerisk investment
Type of Business
Operating Leverage
FinancialLeverage
Base EquityPremium
Country RiskPremium
EQUITY VALUATION WITH DIVIDENDS

Aswath Damodaran 66
DividendsEPS = 2.45 NG * Payout Ratio 46.12%DPS = 1.13 NG
Expected Growth53.88% *15.79% = 8.51%
1.23 NG 1.33 NG 1.44 NG 1.57 NG 1.70 NG
Forever
g =5%: ROE =15% (Ind. avg)Beta = 1.00Payout = (1- 5/15) = .667
Terminal Value= EPS 6*Payout/(r-g)
= 3.87(.667)/(.107-.05) = 45.26
Dividend n.........
Cost of Equity5% + 0.99 (5.5%) = 10.65%
Discount at Cost of Equity
Value of Equity per share = 32.63 NG
Riskfree Rate:Long term bond rate in the Netherlands5% +
Beta0.99 X
Risk Premium5.5%
Average beta for European banks = 0.99 5.5% 0%
VALUING ABN AMRO

Aswath Damodaran 67
Dividends and Cash Flows to Equity
n In the strictest sense, the only cash flow that an investor will receive from anequity investment in a publicly traded firm is the dividend that will be paid onthe stock.
n Actual dividends, however, are set by the managers of the firm and may bemuch lower than the potential dividends (that could have been paid out)
• managers are conservative and try to smooth out dividends
• managers like to hold on to cash to meet unforeseen future contingencies andinvestment opportunities
n When actual dividends are less than potential dividends, using a model thatfocuses only on dividends will under state the true value of the equity in afirm.

Aswath Damodaran 68
Measuring Potential Dividends
n Some analysts assume that the earnings of a firm represent its potentialdividends. This cannot be true for several reasons:
• Earnings are not cash flows, since there are both non-cash revenues and expensesin the earnings calculation
• Even if earnings were cash flows, a firm that paid its earnings out as dividendswould not be investing in new assets and thus could not grow
• Valuation models, where earnings are discounted back to the present, will overestimate the value of the equity in the firm
n The potential dividends of a firm are the cash flows left over after the firm hasmade any “investments” it needs to make to create future growth and net debtrepayments (debt repayments - new debt issues)
• The common categorization of capital expenditures into discretionary and non-discretionary loses its basis when there is future growth built into the valuation.
Aswath Damodaran 69
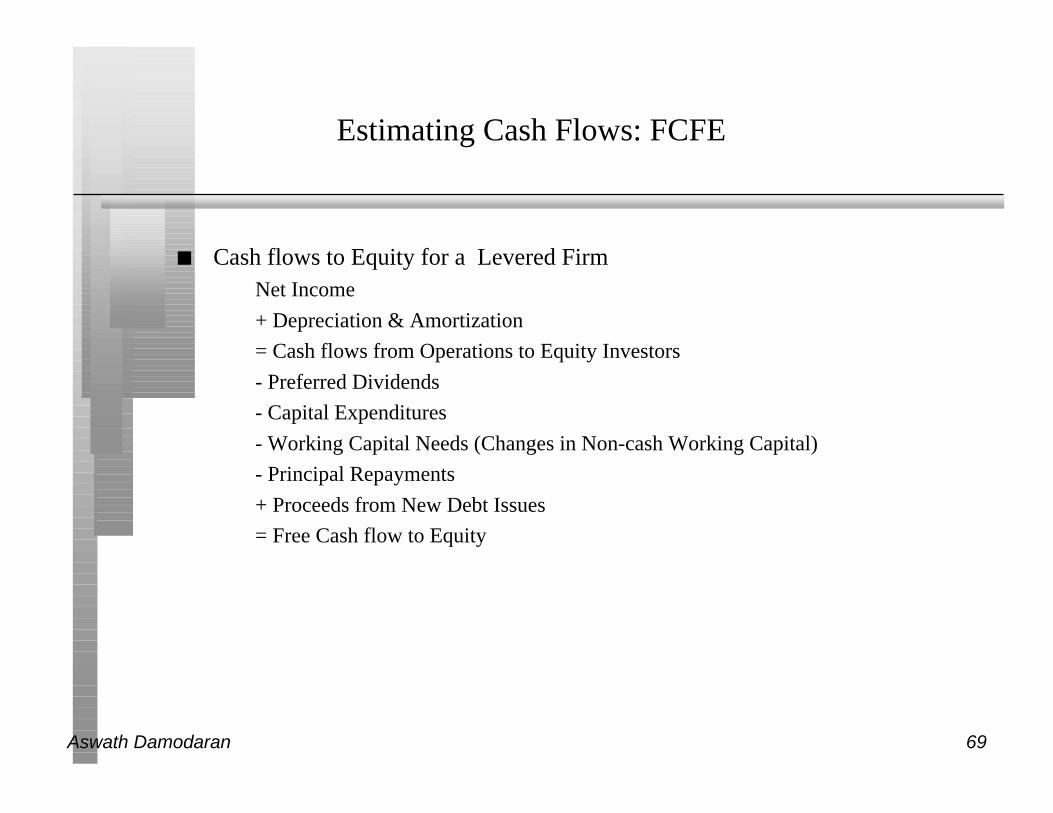
Estimating Cash Flows: FCFE
n Cash flows to Equity for a Levered FirmNet Income
+ Depreciation & Amortization
= Cash flows from Operations to Equity Investors
- Preferred Dividends
- Capital Expenditures
- Working Capital Needs (Changes in Non-cash Working Capital)
- Principal Repayments
+ Proceeds from New Debt Issues
= Free Cash flow to Equity
Aswath Damodaran 70
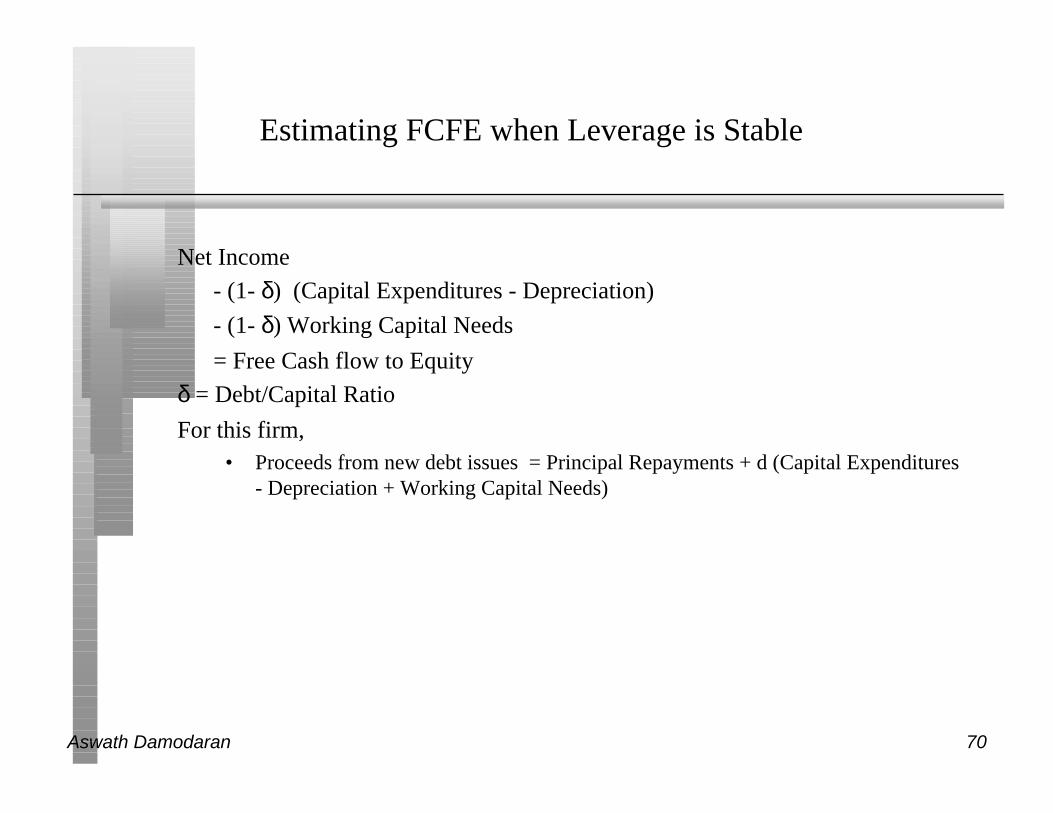
Estimating FCFE when Leverage is Stable
Net Income
- (1- δ) (Capital Expenditures - Depreciation)
- (1- δ) Working Capital Needs
= Free Cash flow to Equity
δ = Debt/Capital Ratio
For this firm,• Proceeds from new debt issues = Principal Repayments + d (Capital Expenditures
- Depreciation + Working Capital Needs)

Aswath Damodaran 71
Cashflow to EquityNet Income- (Cap Ex - Depr) (1- DR)- Change in WC (!-DR)= FCFE
Expected GrowthRetention Ratio *Return on Equity
FCFE1 FCFE2 FCFE3 FCFE4 FCFE5
Forever
Firm is in stable growth:Grows at constant rateforever
Terminal Value= FCFEn+1/(ke-gn)
FCFEn.........
Cost of Equity
Financing WeightsDebt Ratio = DR
Discount at Cost of Equity
Value of Equity
Riskfree Rate:- No default risk- No reinvestment risk- In same currency andin same terms (real or nominal as cash flows
+Beta- Measures market risk X
Risk Premium- Premium for averagerisk investment
Type of Business
Operating Leverage
FinancialLeverage
Base EquityPremium
Country RiskPremium
EQUITY VALUATION WITH FCFE
Aswath Damodaran 72
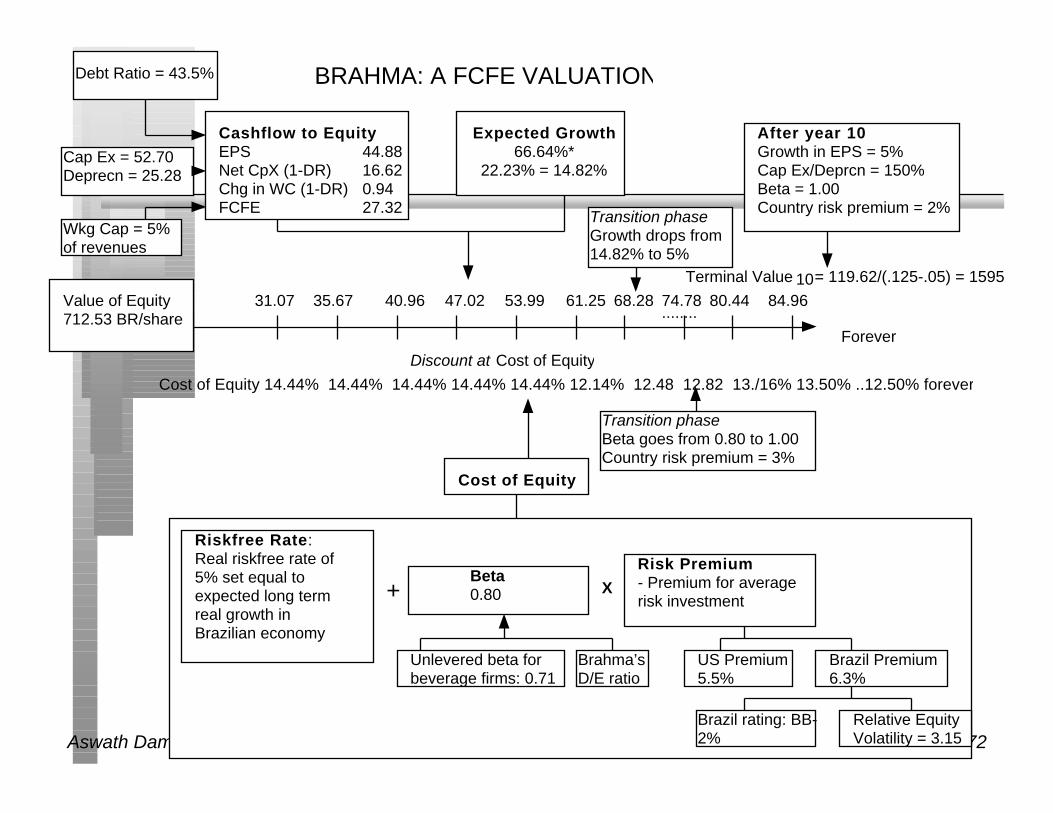
Cashflow to EquityEPS 44.88Net CpX (1-DR) 16.62Chg in WC (1-DR) 0.94FCFE 27.32
Expected Growth66.64%*
22.23% = 14.82%
31.07 35.67 40.96 47.02 53.99
Forever
After year 10Growth in EPS = 5%Cap Ex/Deprcn = 150%Beta = 1.00Country risk premium = 2%
Terminal Value 10= 119.62/(.125-.05) = 1595
84.96.........
Cost of Equity
Debt Ratio = 43.5%
Discount at Cost of Equity
Value of Equity712.53 BR/share
Riskfree Rate:Real riskfree rate of 5% set equal to expected long term real growth in Brazilian economy
+Beta0.80 X
Risk Premium- Premium for averagerisk investment
Unlevered beta for beverage firms: 0.71
Brahma’sD/E ratio
US Premium5.5%
Brazil Premium6.3%
BRAHMA: A FCFE VALUATION
Transition phaseGrowth drops from 14.82% to 5%
Cap Ex = 52.70Deprecn = 25.28
Wkg Cap = 5% of revenues
61.25 68.28 74.78 80.44
Brazil rating: BB-2%
Relative EquityVolatility = 3.15
Cost of Equity 14.44% 14.44% 14.44% 14.44% 14.44% 12.14% 12.48 12.82 13./16% 13.50% ..12.50% forever
Transition phaseBeta goes from 0.80 to 1.00Country risk premium = 3%
Aswath Damodaran 73
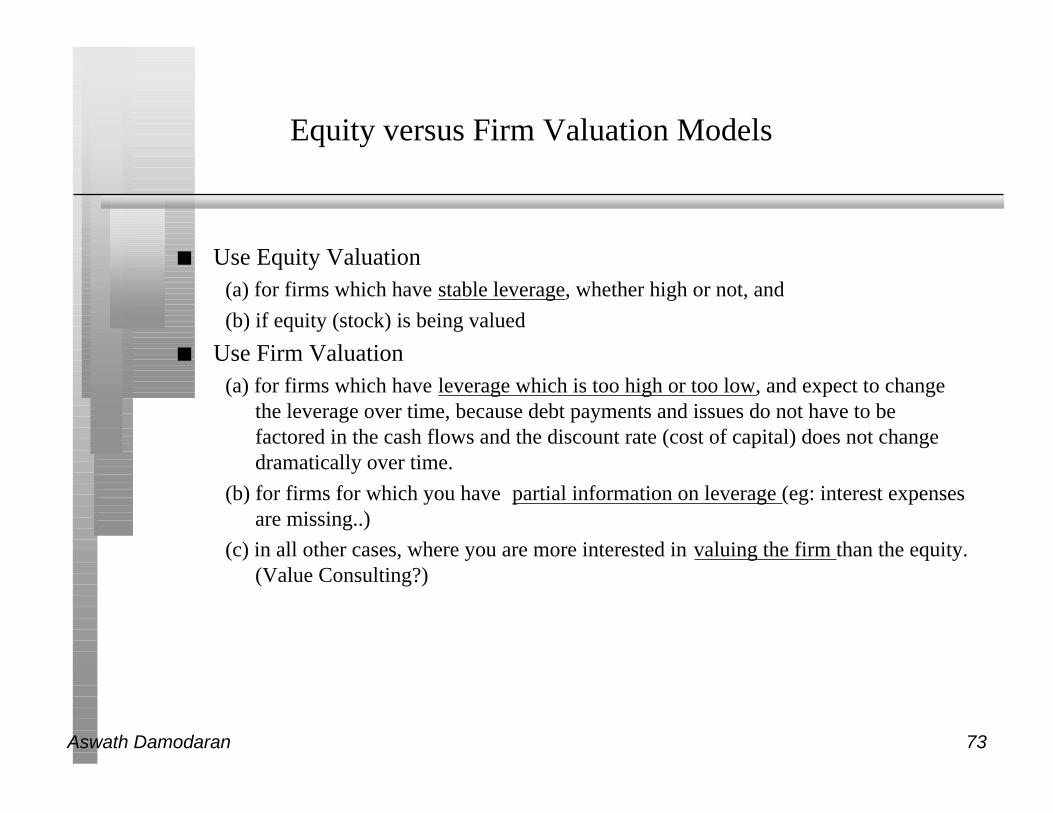
Equity versus Firm Valuation Models
n Use Equity Valuation(a) for firms which have stable leverage, whether high or not, and
(b) if equity (stock) is being valued
n Use Firm Valuation(a) for firms which have leverage which is too high or too low, and expect to change
the leverage over time, because debt payments and issues do not have to befactored in the cash flows and the discount rate (cost of capital) does not changedramatically over time.
(b) for firms for which you have partial information on leverage (eg: interest expensesare missing..)
(c) in all other cases, where you are more interested in valuing the firm than the equity.(Value Consulting?)

Aswath Damodaran 74
The Choices in DCF Valuation
Choose aCash Flow Dividends
Expected Dividends to
Stockholders
Cashflows to Equity
Net Income
- (1- δ) (Capital Exp. - Deprec’n)
- (1- δ) Change in Work. Capital
= Free Cash flow to Equity (FCFE)
[δ = Debt Ratio]
Cashflows to Firm
EBIT (1- tax rate)
- (Capital Exp. - Deprec’n)
- Change in Work. Capital
= Free Cash flow to Firm (FCFF)
& A Discount Rate Cost of Equity
• Basis: The riskier the investment, the greater is the cost of equity.
• Models:
CAPM: Riskfree Rate + Beta (Risk Premium)
APM: Riskfree Rate + Σ Betaj (Risk Premiumj): n factors
Cost of Capital
WACC = ke ( E/ (D+E))
+ kd ( D/(D+E))
kd = Current Borrowing Rate (1-t)
E,D: Mkt Val of Equity and Debt
& a growth pattern
t
g
Stable Growth
g
Two-Stage Growth
|High Growth Stable
g
Three-Stage Growth
|High Growth StableTransition

Aswath Damodaran 75
Value Enhancement in a DCF Framework

Aswath Damodaran 76
The Paths to Value Creation
n Using the DCF framework, there are four basic ways in which the value of afirm can be enhanced:
• The cash flows from existing assets to the firm can be increased, by either– increasing after-tax earnings from assets in place or
– reducing reinvestment needs (net capital expenditures or working capital)
• The expected growth rate in these cash flows can be increased by either– Increasing the rate of reinvestment in the firm
– Improving the return on capital on those reinvestments
• The length of the high growth period can be extended to allow for more years ofhigh growth.
• The cost of capital can be reduced by– Reducing the operating risk in investments/assets
– Changing the financial mix
– Changing the financing composition

Aswath Damodaran 77
A Basic Proposition
n For an action to affect the value of the firm, it has to• Affect current cash flows (or)
• Affect future growth (or)
• Affect the length of the high growth period (or)
• Affect the discount rate (cost of capital)
n Proposition 1: Actions that do not affect current cash flows, futuregrowth, the length of the high growth period or the discount rate cannotaffect value.

Aswath Damodaran 78
Value-Neutral Actions
n Stock splits and stock dividends change the number of units of equity in afirm, but cannot affect firm value since they do not affect cash flows, growthor risk.
n Accounting decisions that affect reported earnings but not cash flows shouldhave no effect on value.
• Changing inventory valuation methods from FIFO to LIFO or vice versa infinancial reports but not for tax purposes
• Changing the depreciation method used in financial reports (but not the tax books)from accelerated to straight line depreciation
• Major non-cash restructuring charges that reduce reported earnings but are not taxdeductible
• Using pooling instead of purchase in acquisitions cannot change the value of atarget firm.

Aswath Damodaran 79
Issue 1: In-Process R&D
n In acquisitions of firms with R&D, firms have increasingly taken advantage ofa provision that allows them to write off in-process R&D immediately. Thisreduces the amount that gets charged as goodwill and amortized in futureperiods; this, in turn, increases reported earnings in future periods. None ofthis has any tax implications.
• A study that looked at high-tech firms found that they paid larger premiums forfirms when they could qualify for this provision.
• When FASB announced that it was looking at banning this procedure, high-techfirms argued that doing so would make it harder to justify acquisitions.
n Does qualifying or not qualifying for this provision affect value?

Aswath Damodaran 80
Value Creation 1: Increase Cash Flows from Assets in Place
n The assets in place for a firm reflect investments that have been madehistorically by the firm. To the extent that these investments were poorly madeand/or poorly managed, it is possible that value can be increased by increasingthe after-tax cash flows generated by these assets.
n The cash flows discounted in valuation are after taxes and reinvestment needshave been met:
EBIT ( 1-t)- (Capital Expenditures - Depreciation)- Change in Non-cash Working Capital= Free Cash Flow to Firm
n Proposition 2: A firm that can increase its current cash flows, withoutsignificantly impacting future growth or risk, will increase its value.

Aswath Damodaran 81
1.1.: Poor Investments: Should you divest?
n Every firm has at least a few investments in place that are poor investments,earning less than the cost of capital or even losing money.
n At first sight, it may seem that terminating or divesting these investmentswould increase value. That is not necessarily true, however, because thatimplicitly assumes that you get at least your capital back when you terminate aproject.
n In reality, there are three values that we need to consider:• Continuing Value: This is the present value of the expected cash flows from
continuing the investment through the end of its life.
• Salvage or Liquidation Value: This is the net cash flow that the firm will receiveif it terminated the project today.
• Divestiture Value: This is the price that will be paid by the highest bidder for thisinvestment.

Aswath Damodaran 82
Issue 2: To liquidate or not to liquidate
n Assume that you have a division in your firm in which you have invested $ 1billion in capital (book value today). The division is earning $ 80 million inafter-tax operating income on an annual basis, and expects to earn this amounteach year forever. If your cost of capital were 12.5%, would your valueincrease from liquidating this division?

Aswath Damodaran 83
A Divestiture Decision Matrix
n Whether to continue, terminate or divest an investment will depend uponwhich of the three values - continuing, liquidation or divestiture - is thegreatest.
n If the continuing value is the greatest, there can be no value created byterminating or liquidating this investment.
n If the liquidation or divestiture value is greater than the continuing value, thefirm value will increase by the difference between the two values:
If liquidation is optimal: Liquidation Value - Continuing Value
If divestiture is optimal: Divestiture Value - Continuing Value

Aswath Damodaran 84
1.2: More Efficient Operations
n The operating income for a firm can be written asRevenues
* Operating Margin
= EBIT
n The operating margin for a firm is a function of how efficiently it operates toproduce the products and services that it sells. If a firm can reduce its costs,while generating similar revenues, it will increase its operating income andvalue.

Aswath Damodaran 85
Issue 3: Operating Margins and R&D
n Assume that analysts focus on the traditional operating margin. An easy wayto post higher earnings and margins is by cutting back on R&D expenses. Isthis value creating?

Aswath Damodaran 86
Cost Cutting: The First Leg
n Cost cutting and layoffs comprise the first leg of value enhancement for mostfirms. Since they occur quickly and are tangible, the effect on earnings (andvalue) is immediate.
n Not all cost cutting is value enhancing. If firms cut expenditures which aredesigned to create future growth (research and training expenses, for instance),they might report higher operating income but their value might drop.
Aswath Damodaran 87
1.3: The Tax Burden
n The value of a firm is the present value of its after-tax cash flows. Thus, anyaction that can reduce the tax burden on a firm over time, for a given operatingincome, will increase value.
n The tax rate of a firm can be reduced over time by doing any or all of thefollowing:
• Moving income from high-tax locales to low-tax or no-tax locales
• Acquiring or Obtaining net operating loss carry forwards that can be used to shieldfuture income
• Using risk management to reduce the average tax rate paid over time on income– The marginal tax rate on income tends to rise, in most regimes, as income increases.
– By using risk management to smooth income over time, firms can make their incomemore stable and reduce their exposure to the highest marginal tax rates.
– By doing so, they can increase their value.

Aswath Damodaran 88
1.4: Reduce Net Capital Expenditures
n The net capital expenditures refers to the difference between capitalexpenditures and depreciation. The net capital expenditure is a cash outflowthat reduces the free cash flow to the firm.
n Part of the net capital expenditure is designed to generate future growth, butpart of it may to be maintain assets in place
n If a firm can reduce its net capital expenditures on assets in place, it willincrease value.
n During short periods, the capital expenditures can even be lower thandepreciation for assets in place, creating a cash inflow from net capitalexpenditures.

Aswath Damodaran 89
1.5: Reduce Working Capital Needs
n The non-cash working capital in a firm can be measured as follows:Accounts Receivable
+ Inventory
- Accounts Payable
= Non-cash Working Capital
n Increases in non-cash working capital represent cash outflows, while decreasesrepresent cash inflows.
n Reducing the non-cash working capital needs of a firm, while keeping growthand risk constant, will increase its value.
Aswath Damodaran 90
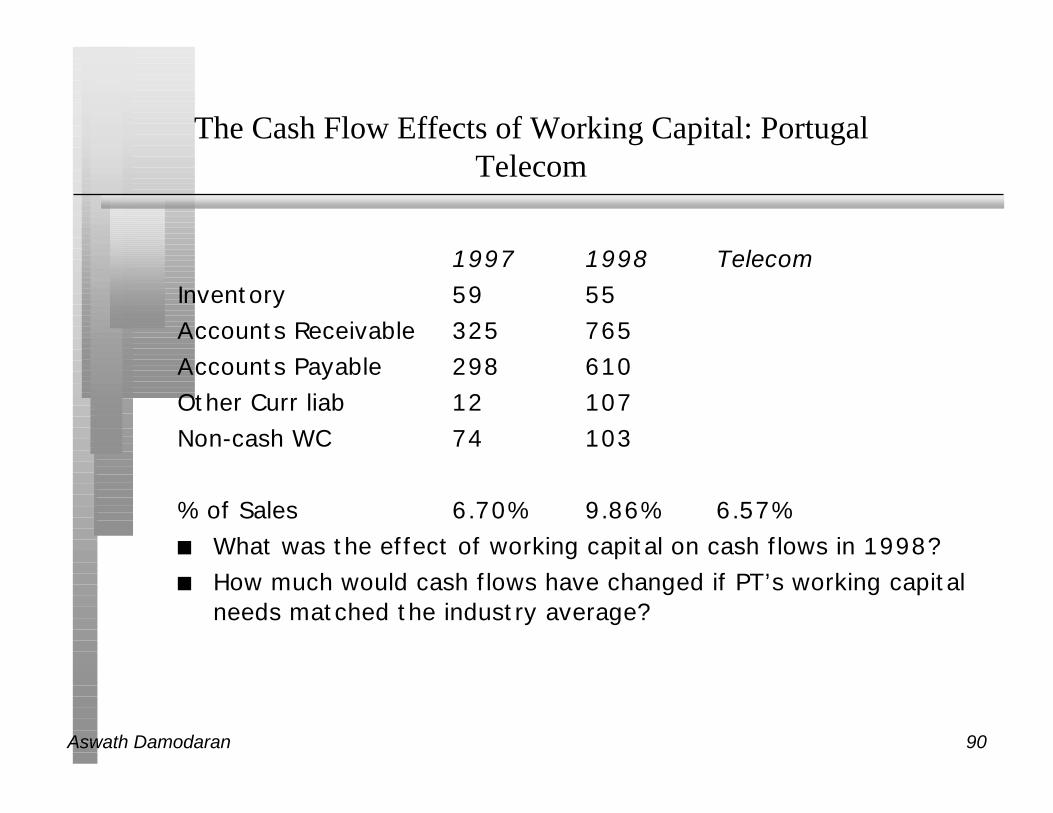
The Cash Flow Effects of Working Capital: PortugalTelecom
1997 1998 TelecomInventory 59 55Accounts Receivable 325 765Accounts Payable 298 610Other Curr liab 12 107Non-cash WC 74 103
% of Sales 6.70% 9.86% 6.57%n What was the effect of working capital on cash flows in 1998?n How much would cash flows have changed if PT’s working capital
needs matched the industry average?

Aswath Damodaran 91
Value Creation 2: Increase Expected Growth
n Keeping all else constant, increasing the expected growth in earnings willincrease the value of a firm.
n The expected growth in earnings of any firm is a function of two variables:• The amount that the firm reinvests in assets and projects
• The quality of these investments

Aswath Damodaran 92
2.1: Increase the Reinvestment Rate
n Holding all else constant, increasing the reinvestment rate will increase theexpected growth in earnings of a firm. Increasing the reinvestment rate will,however, reduce the cash flows of the firms. The net effect will determinewhether value increases or decreases.
n As a general rule,• Increasing the reinvestment rate when the ROC is less than the cost of capital will
reduce the value of the firm
• Increasing the reinvestment rate when the ROC is greater than the cost of capitalwill increase the value of the firm
Aswath Damodaran 93
2.2: Improve Quality of Investments
n If a firm can increase its return on capital on new projects, while holding thereinvestment rate constant, it will increase its firm value.
• The firm’s cost of capital still acts as a floor on the return on capital. If the returnon capital is lower than the cost of capital, increasing the return on capital willreduce the amount of value destroyed but will not create value. The firm would bebetter off under those circumstances returning the cash to the owners of thebusiness.
• It is only when the return on capital exceeds the cost of capital, that the increase invalue generated by the higher growth will more than offset the decrease in cashflows caused by reinvesting.
n This proposition might not hold, however, if the investments are in riskierprojects, because the cost of capital will then increase.

Aswath Damodaran 94
2.3: Pricing Decisions, ROC and Expected Growth
n The return on capital on a project or firm can be written as:ROC = EBIT (1-t)/ Sales * Sales/ Capital
= After-tax Operating Margin * Capital Turnover Ratio
n When firms increase prices for their products, they improve operating marginsbut reduce sales (and turnover ratios). The effects of the price/quantitydecision can be captured in the return on capital. It provides a simple way ofallowing firms to:
• Choose between price leader and volume leader strategies– The strategy that maximizes value should be the better strategy
– In analyzing these strategies, we should allow for a dynamic competitive envioronmentwhere competitors react to the firm’s pricing decisions.
• Decide whether to change price policy in response to competitive pressure

Aswath Damodaran 95
2.4: The Role of Acquisitions and Divestitures
n An acquisition is just a large-scale project. All of the rules that apply toindividual investments apply to acquisitions, as well. For an acquisition tocreate value, it has to
• Generate a higher return on capital, after allowing for synergy and control factors,than the cost of capital.
• Put another way, an acquisition will create value only if the present value of thecash flows on the acquired firm, inclusive of synergy and control benefits, exceedsthe cost of the acquisitons
n A divestiture is the reverse of an acquisition, with a cash inflow now (fromdivesting the assets) followed by cash outflows (i.e., cash flows foregone onthe divested asset) in the future. If the present value of the future cashoutflows is less than the cash inflow today, the divestiture will increase value.
n A fair-price acquisition or divestiture is value neutral.

Aswath Damodaran 96
An Acquisition Choice
n Assume now that you have the opportunity to acquire a internet firm and thatyou compute the internal rate of return on this firm to 17.50%. PT has a cost ofcapital of 8.98%, but the cost of capital for firms in the high technologybusiness is 20%. Is this a value enhancing acquisition?
n If it does not pass your financial test, can you make the argument that strategicconsiderations would lead you to override the financials and acquire the firm?

Aswath Damodaran 97
Value Creation 3: Increase Length of High Growth Period
n Every firm, at some point in the future, will become a stable growth firm,growing at a rate equal to or less than the economy in which it operates.
n The high growth period refers to the period over which a firm is able to sustaina growth rate greater than this “stable” growth rate.
n If a firm is able to increase the length of its high growth period, other thingsremaining equal, it will increase value.

Aswath Damodaran 98
High Growth and Barriers to Entry
n For firms to maintain high growth over a period, they have to earn excessreturns. In a competitive market place, these excess returns should attractcompetitors who will erase these excess returns over time.
n Thus, for a firm to maintain high growth and excess returns over time, it has tocreate barriers to entry that allow it to maintain these excess returns.

Aswath Damodaran 99
3.1: The Brand Name Advantage
n Some firms are able to sustain above-normal returns and growth because theyhave well-recognized brand names that allow them to charge higher pricesthan their competitors and/or sell more than their competitors.
n Firms that are able to improve their brand name value over time can increaseboth their growth rate and the period over which they can expect to grow atrates above the stable growth rate, thus increasing value.

Aswath Damodaran 100
3.2: Patents and Legal Protection
n The most complete protection that a firm can have from competitive pressureis to own a patent, copyright or some other kind of legal protection allowing itto be the sole producer for an extended period.
n Note that patents only provide partial protection, since they cannot protect afirm against a competitive product that meets the same need but is not coveredby the patent protection.
n Licenses and government-sanctioned monopolies also provide protectionagainst competition. They may, however, come with restrictions on excessreturns; utilities in the United States, for instance, are monopolies but areregulated when it comes to price increases and returns.

Aswath Damodaran 101
3.3: Switching Costs
n Another potential barrier to entry is the cost associated with switching fromone firm’s products to another.
n The greater the switching costs, the more difficult it is for competitors to comein and compete away excess returns.
n Firms that devise ways to increase the cost of switching from their products tocompetitors’ products, while reducing the costs of switching from competitorproducts to their own will be able to increase their expected length of growth.

Aswath Damodaran 102
3.4: Cost Advantages
n There are a number of ways in which firms can establish a cost advantage overtheir competitors, and use this cost advantage as a barrier to entry:
• In businesses, where scale can be used to reduce costs, economies of scale can givebigger firms advantages over smaller firms
• Owning or having exclusive rights to a distribution system can provide firms with acost advantage over its competitors.
n These cost advantages will show up in valuation in one of two ways:• The firm may charge the same price as its competitors, but have a much higher
operating margin.
• The firm may charge lower prices than its competitors and have a much highercapital turnover ratio.

Aswath Damodaran 103
Value Creation 4: Reduce Cost of Capital
n The cost of capital for a firm can be written as:
Cost of Capital = ke (E/(D+E)) + kd (D/(D+E))
Where,
ke = Cost of Equity for the firm
kd = Borrowing rate (1 - tax rate)
n The cost of equity reflects the rate of return that equity investors in the firmwould demand to compensate for risk, while the borrowing rate reflects thecurrent long-term rate at which the firm can borrow, given current interestrates and its own default risk.
n The cash flows generated over time are discounted back to the present at thecost of capital. Holding the cash flows constant, reducing the cost of capitalwill increase the value of the firm.

Aswath Damodaran 104
Estimating Cost of Capital: Portugal Telecom
n Equity• Cost of Equity = 4.24% + 1.11 (7.29%) = 12.33%
• Market Value of Equity = 41*190 = 7,790 Mil (61.35%)
n Debt• Cost of debt = 4.24% + 1.5% (default spread) = 5.74%
• Market Value of Debt = 4,908 Mil (38.65%)
n Cost of Capital
Cost of Capital = 12.33% (.6135) + 5.74% (1- .3625) (.3865)) = 8.98%

Aswath Damodaran 105
4.1: Reduce Operating Risk
n Both the cost of equity and cost of debt of a firm are affected by the operatingrisk of the business or businesses in which it operates. In the case of equity,only that portion of the operating risk that is not diversifiable will affect value.
n The operating risk of a firm is a direct function of the kinds of products orservices it provides, and the degree to which these products are services arediscretionary to the customer. The more discretionary they are, the greater theoperating risk faced by the firm.
n Firms can reduce their operating risk by making their products and servicesless discretionary. Advertising clearly plays a role, but coming up with newuses for a product/service may be another.
Aswath Damodaran 106
4.2: Reduce Operating Leverage
n The operating leverage of a firm measures the proportion of its costs that arefixed. Other things remaining equal, the greater the proportion of the costs of afirm that are fixed, the higher its cost of capital will be.
n Reducing the proportion of the costs that are fixed will make firms much lessrisky and reduce their cost of capital. This can be accomplished in a number ofdifferent ways:
• By using outside contractors for some services; if business does not measure up,the firm is not stuck with the costs of providing this service.
• By tying expenses to revenues; in particular, with wage contracts tying wages paidto revenues made will reduce the proportion of the costs that are fixed.

Aswath Damodaran 107
4.3: Changing Financial Mix
n The third approach to reducing the cost of capital is to change the mix of debtand equity used to finance the firm.
n Debt is always cheaper than equity, partly because it lenders bear less risk andpartly because of the tax advantage associated with debt.
n Taking on debt increases the risk (and the cost) of both debt (by increasing theprobability of bankruptcy) and equity (by making earnings to equity investorsmore volatile).
n The net effect will determine whether the cost of capital will increase ordecrease if the firm takes on more debt.

Aswath Damodaran 108
Portugal Telecom: Optimal Debt Ratio
Debt Ratio Beta Cost of Equity Bond Rating Interest rate on debt Tax Rate Cost of Debt (after-tax) WACC Firm Value (G)0% 0.79 10.01% AAA 4.54% 36.25% 2.89% 10.01% $9,232
10% 0.85 10.42% AAA 4.54% 36.25% 2.89% 9.67% $10,16920% 0.92 10.93% A 5.49% 36.25% 3.50% 9.45% $10,87530% 1.01 11.59% BBB 6.24% 36.25% 3.98% 9.31% $11,36740% 1.13 12.47% B 8.24% 36.25% 5.25% 9.58% $10,43750% 1.30 13.69% CCC 10.24% 36.25% 6.53% 10.11% $8,99560% 1.62 16.08% CC 11.74% 29.95% 8.22% 11.37% $6,71270% 2.22 20.42% C 13.24% 22.76% 10.23% 13.28% $4,74580% 3.33 28.51% C 13.24% 19.92% 10.60% 14.18% $4,13990% 6.66 52.77% C 13.24% 17.70% 10.90% 15.08% $3,654

Aswath Damodaran 109
4.4: Changing Financing Type
n The fundamental principle in designing the financing of a firm is to ensure thatthe cash flows on the debt should match as closely as possible the cash flowson the asset.
n By matching cash flows on debt to cash flows on the asset, a firm reduces itsrisk of default and increases its capacity to carry debt, which, in turn, reducesits cost of capital, and increases value.
n Firms which mismatch cash flows on debt and cash flows on assets by using• Short term debt to finance long term assets
• Dollar debt to finance non-dollar assets
• Floating rate debt to finance assetswhose cash flows are negatively or not affectedby invlaiton
will end up with higher default risk, higher costs of capital and lower firm value.

Aswath Damodaran 110
Financing Details: Portugal Telecom
n What would the cash flows on a project look like in terms of
o Project life?:
o Cash Flow Patterns?:
o Growth?:
o Currency?:
n Now what kind of debt would be best to finance such a project?