valuation of a digital operating room in the public health ...techniques (roach, 2003). smith &...
TRANSCRIPT

Valuation of a digital operating room in the public health care sector
- a case study in cooperation with Smith & Nephew
Bachelor’s Thesis
Industrial and Financial Management School of Business, Economics and Law Göteborg University Spring 2006 Authors: Date of birth: Andersson, Tobias 700330 Franzén, Robert 790923 Odén, Magdalena 790430 Tutor: Axvärn, Anders


ABSTRACT Technological progress takes place all the time and in all sorts of sectors in our society. A computerization of nearly all companies worldwide has taken place and barely any company in developed countries can stay away from using IT today. Numerous IT evaluation methods have been developed to find methods to investigate how IT solutions can supply to business performance and economic growth and how these benefits could be valued. Problems with valuing IT and modern technology are present also in the health care sector, which is one of the most expanding areas developing new technology. The goal of the Swedish health and medical care system is to ensure good health and provide care on equal terms for the entire population. A hospital confronts numerous decisions, such as which investment to make and why these investments are well aligned with their strategy, in order to reach these goals with limited resources. There are several aspects that are difficult or even impossible to financially value, such as patient satisfaction, ergonomics and other intangible values, when valuing a digital operating room. The main focus of this thesis is directed to the aspects for the specific investment of a digital OR from an investor’s point of view. The purpose of this report is to identify the most important aspects in view of the valuation of an investment of a digital operating room and to derive a model that can be used in valuing these kinds of investments within the public health care sector. This model is supposed to be used by an investor when choosing between different investment options and also to be used by companies to improve and pinpoint the utility of their digital OR and hence strengthen their position on the market. To be able to reach a reliable valuation of a digital OR investment, problems that can occur when valuing an investment of this type was identified. Thereafter, theoretical based literature and empirical data, collected by mainly interviews, has been studied and analyzed and the pros and cons of the commonly accepted theories were weighted to be able to select the most suitable theories. This ended up, after making use of the most suitable methods from all valuation models existing according to chosen criteria, in a new valuation model, the Dynamic Multi-Variable Decision Model, for the digital OR which can give a more suitable and combined valuation of both tangible and intangible assets.


ACKNOWLEDGEMENTS We would like to show our gratitude to all the persons that have helped us in completing this thesis. We would like to thank Stefan Lundberg, Per Weije and Per-Olof Ortgren at Smith & Nephew, Sweden for giving us necessary and useful information about digital operating rooms. We would also like to thank Claes-Göran Carlsson at the Sahlgrenska University Hospital, Sweden and Jens Wichmann, Monika Nordengren, Stig Winberg and Torsten Kroon at the Ängelholm Hospital, Sweden for helping us to understand how the investment decision process within the Swedish health care sector is implemented. Finally, we would also take the opportunity to show our gratitude to our tutor Anders Axvärn for support and guidance. Thank you! _________________ ________________ ________________
Tobias Andersson Robert Franzén Magdalena Odén


TABLE OF CONTENTS
1 INTRODUCTION................................................................................................. 1 1.1 History of IT investments.............................................................................. 1 1.2 Modern Technology and IT Investments in Health care ............................... 1 1.3 Case Presentation........................................................................................ 2 1.4 Problem Statement....................................................................................... 3 1.5 Purpose of Research.................................................................................... 5
2 METHOD............................................................................................................. 6 2.1 Method Outline ............................................................................................. 6 2.2 Choice of Methods ....................................................................................... 7 2.3 Theoretical Material...................................................................................... 8 2.4 Empirical Material......................................................................................... 9 2.5 Analysis Model and Interpretations ............................................................ 11
3 THEORETICAL FRAMEWORK......................................................................... 12 3.1 The Capital Budgeting Process.................................................................. 12 3.2 Traditional Financial Valuation Techniques................................................ 12 3.3 Real Options Analysis ................................................................................ 13
3.3.1 Basics of Real Options........................................................................ 14 3.3.2 The Binominal Option Pricing Model ................................................... 16 3.3.3 The Real Options Process .................................................................. 18
3.4 Techniques for Subjective and Balanced Valuation ................................... 19 3.4.1 Multi-Attribute Decision Making (MADM) ............................................ 19 3.4.2 Portfolio Methods ................................................................................ 24
4 EMPIRICAL RESULTS...................................................................................... 26 4.1 Definition of a Digital Operating Room ....................................................... 26 4.2 The Capital Budgeting Process.................................................................. 26 4.3 Investment Process for a Digital OR .......................................................... 27 4.4 Techniques for Valuation............................................................................ 28
4.4.1 Financial Valuation Techniques .......................................................... 28 4.4.2 Techniques for Subjective Valuation ................................................... 29 4.4.3 Balanced Valuation ............................................................................. 30
5 ANALYSIS OF THEORETICAL AND EMPIRICAL DATA.................................. 31 5.1 The Capital Budgeting Process.................................................................. 31 5.2 Analysis of Multi-Attribute Decision Making Models ................................... 31 5.3 Analysis of Portfolio Methods ..................................................................... 35
6 ALTERNATIVE VALUATION OF A DIGITAL OR .............................................. 36 6.1 Overview of Alternative Model.................................................................... 36 6.2 Strategic Evaluation ................................................................................... 37 6.3 Costs/Benefits and Advantages/Disadvantages......................................... 37 6.4 Financial Valuation ..................................................................................... 38 6.5 Subjective Valuation................................................................................... 43 6.6 Balanced Financial and Subjective Valuation............................................. 44
7 CONCLUSIONS ................................................................................................ 46 7.1 Outcome of the Research .......................................................................... 46 7.2 Conclusions from the Result ...................................................................... 46 7.3 Further research......................................................................................... 47
8 REFERENCES.................................................................................................. 48


1
1 INTRODUCTION
A short introduction and a presentation concerning the background of the subject of valuing modern technology and IT investments are here introduced to the reader. The point of the introduction is to enlighten the recipient of the topic in this report and contribute to a growing interest for the subject in total.
1.1 History of IT investments Technological progress takes place all the time and in all kind of sectors in our society. Since the first computer was developed computer technology has undergone an amazing growth, which has according to Andresen (2001) been beyond all other developments during the same period. A computerization of almost all companies worldwide has taken place and hardly any company in developed countries can stay away from using IT today. In The System Centric era (1964-1981) the companies had none, or very little, interest in implement IT evaluations as IT investments often were considered as experiments rather than actual investments. During this period Andersen (ibid.) claims that the difficulties of monitoring IT costs were initiated, as the usage of IT slowly became more and more decentralized. In 1981 IBM released the personal computer called IBM PC, which was the start of The PC Centric Era (1981-1994). During this period the companies were beginning to face difficulties with justifying their growing expenditures on IT solutions. Many new IT evaluation methods were therefore developed throughout this period as the companies slowly realized that the existing methods were insufficient. The Network Centric Era (1994-2005) is characterized by a changed focus from local area networks (LANs) to wide area networks (WANs). The potential benefit in reducing the transaction costs through electronic commerce is therefore now being recognized. A massive excess of IT evaluation methods is available, but most of the companies are not adopting them and tend to stay with the financial evaluation methods that are used in other types of investments. (ibid.) Brynjolfsson, professor at Massachusetts Institute of Technology, Hitt, professor at University of Pennsylvania, and Yang, assistant professor at New York University (2002) raised the question of how computers and IT solutions can contribute to business performance and economic growth. Their research focus on how businesses can effectively use information technology and how these benefits can be valued. Our expectation is to further develop Brynjolfsson et al. and similar researcher’s ideas and draw conclusions concerning whether there is a possibility to find a tool for valuing these kinds of investments. Consequently, there might be a need for some kind of model or tool when valuing investments in IT and new technology. Sound decision making is, according to Hefce (2006), a process that is an essential aspect of good governance and management in any administration. This requires, referring to Hefce, an obvious recognition of the problem to be solved and intentional judgment of the options.
1.2 Modern Technology and IT Investments in Health care These problems in valuing IT and modern technology are present in most areas and the health care sector is not an exception. The health care sector is one of the most expanding areas concerning development of new technology. A survey of new medical projects in Canada and the United States revealed, according to Swart (2005), that the digital revolution is a top priority for many health care facility planners. There were also discussions made with hospital

2
surgical teams and equipment vendors who also agreed with this conclusion. The digitalization of the operating room (OR) is a part of this digital revolution. Williamson (2004) states that the idea behind the digital operating room, is to combine the most modern technology with a maximization of space and to reduce procedure and turnover time. Ortgren1 further defines a digital OR as an OR where audio/video technology and/or medical equipment is coordinated and controlled centrally. Also, information produced can be distributed outside of the OR. Dr. Christopher Harner, professor of orthopedic surgery and chief of the division of sports medicine at the University of Pittsburgh Medical Center claims that the new digital operating rooms provides the ideal educational environment for medical students, surgeons in training and exciting opportunities for research and development of new techniques (Roach, 2003). Smith & Nephew, Karl Storz, Linvatec, Stryker Endoscopy and Olympus are just a few manufacturers offering these solutions.
1.3 Case Presentation A case study at Smith & Nephew has been performed in order to describe an application and a deployment of a digital OR and how it can be valued with measurable benefits. The point of the case study is to help us value the application of a complex system which a digital OR tends to be. Smith & Nephew plc is a publicly owned global company that develops and markets advanced medical devices. Smith & Nephew was founded in 1856 and is headquartered in London, UK and operates in 32 countries. For the year 2002 it had sales of £1,110 million. The company is one of the leading competitors in its global business units; advanced wound management (AWM), orthopedics and endoscopy. (Smith & Nephew, 2005) AWM, which is the area where Smith & Nephew first started, is a set of products and services for wound, skin, intravenous and burn care. Later on the company purchased its orthopedics business unit, which now includes medical science within prevention, diagnosis and treatment of diseases and abnormalities of musculoskeletal systems. The third business unit endoscopy, where Smith & Nephew today is a market leader, is a technology that enables visual examination of the interior of the body using a flexible fiber optic instrument. Now, in order to enhance the utility of their present products, especially in endoscopy, Smith & Nephew have entered the area of digital OR. Their system (see figure 1) essentially consists of off-the-shelf hardware, such as touch-panels, IT-communication equipment and medical devices, and control software, called CONDOR. (ibid.)
Figure 1: Digital OR of Smith & Nephew
1 Per-Olof Ortgren (Division Manager (Endoscopy), Smith & Nephew, Sweden)

3
Smith & Nephew emphasizes on the following advantages when trying to motivate their customers to invest in their digital OR: • Open architecture – Freedom to choose off-the-shelf products. • Customizability and modularity – Each digital OR is unique and designed to meet the
needs of individual customers. • System integration – Compatible with common interfaces for secure communication of
patient demographics and images. Also, it integrates with navigation and robotic systems from all manufacturers.
• Investment protection and future-proofing – The digital OR is designed to protect the investment from technology obsolesce via an easily upgradeable design.
• Ease of use – Their user interface is intuitive and easy to use. • Service and maintenance – Smith & Nephew offers comprehensive support. • Implementation services – Smith & Nephew has an implementation team that guides the
customer through the entire digital OR process. Even though all these statements are rather convincing they still lack a detailed valuation method which can be used by an investment decision maker. For instance, how does one value investment protection, future-proofing and ease of use?
1.4 Problem Statement The goal of the Swedish health and medical care system, according to section 2 of the Health and Medical Services Act (1982:763), is to ensure good health and provide care on equal terms for the entire population. Care shall be provided with respect for the equal worth of all people and for the dignity of the individual. Those who have the greatest need for health and medical care services shall be given priority. An institution, such as a hospital, faces several decisions about how to achieve these goals with limited resources. Among these decisions are which investments to make and why these particular investments are motivated and well aligned with their strategy. Allocating capital is the financial side of the strategic planning for the public health care and when allocating financial means to an investment there is a need to rank and value the different investments and their pros and cons. There are numerous ways in which these pros and cons of modern technology and IT investments can be described. There is a need, not only in the health care sector, for more thorough valuation methods. This issue has been known for several years and Keen (1991) describes the situation of the senior management as being caught in a troublesome double bind. On the one hand, they believe that they can not economically afford to increase capital spending on IT, but on the other hand they cannot afford not to do so. Renkema (1998) have identified parts of why this problem is frequent in IT investments, namely since costs are difficult to estimate and often hidden, benefits are difficult to quantify and measure, and the uncertainties and risks are often substantial. Nonetheless, there is evidence, for instance presented by Larman (2004), pointing in the direction of investment decisions becoming sounder even though there still is a gap that needs to be narrowed to better be able to support decision makers. In Svavarsson’s (2005) approach in valuing IT platform investment using real option analysis, he claims that there has not been developed any grounded theory on this subject. However, there has been several studies

4
performed using various theoretical frameworks such as financial theory, decision theory and game theory. One of the issues to take into consideration when valuing an investment for the public health care sector is the different measurements of success that exists for the health care system in comparison to the private sector. Studies made on this subject by Pakdil and Harwood (2005) shows that one of the most important quality dimensions and key success indicators in health care is patient satisfaction. Pakdil and Harwood imply that a way to quantify patient satisfaction is by calculating the potential gap between patients’ preconceived expectations and perceptions about services delivered. One way to quantify these values is by using the SERVQUAL model. According to Zeithaml, Parasuraman and Berry (1990), this model measures five key dimensions of service quality; tangibles, reliability, responsiveness, assurance and empathy. When considering these kinds of studies, the financial profitability dimension in the public health care sector is not the only relevant factor to take into consideration. With new technology come greater possibilities, but also challenges that need to be faced. Swart (2005) means that the digital OR not only contributes with positive aspects and the convenience that results from the ease of access to digital information, moving into this environment does also pose challenges for the nursing staff. Furthermore, the goal is to seamlessly integrate this new dimension of the hospital OR into the daily routine. Swart claims that the process begins by understanding how and why the digital OR is becoming more common and what factors need to be considered in order to digitalize the OR. Accordingly, Williamson (2004) states that the introduction of such innovative and high-tech equipment also brings the challenge of maintaining user friendliness, while increasing durability and overall effectiveness. When valuing an investment such as a digital OR there are numerous aspects that are complicated or even impossible to financially value, such as patient satisfaction, ergonomics and other intangible values. The knowledge of costs often being hidden and difficult to estimate and benefits are complicated to quantify and measure, often leads to uncertainties when valuing IT investments. Renkema (1998) describes how these uncertainties in investment decisions can amount to an “act of faith” decision if no structured dimension is applied. If there are no clear goals or prospects investor can only hope for a successful result. Some of the problems with these modern technology and IT investments are that all aspects might not be possible to value in the same manner. For example, valuing hardware costs and user friendliness poses different challenges. We feel that there is a need for some type of weighted and balanced scoring model in order to obtain a more controlled valuation. The main focus of this report is directed to the aspects for the specific investment of a digital OR from an investor’s point of view. Moreover, we have no intention to evaluate the current market and customers’ needs for this type of product. To further narrow our research we will concentrate on investments for hospitals within the Swedish public health care sector. There are two main reasons for these delimitations. Firstly, our case company, Smith & Nephew, need more information about the public health care investment process and how they measure

5
values of a digital OR. Secondly, investments within the public health care pose several different challenges compared to that of the private sector, which main goal is to maximize shareholders’ wealth. Furthermore, the aim is to avoid political issues such as questions concerning how and by whom the health care sector is financed. Consequently, the focus is on the actual valuation of a digital OR and the underlying process of allocating capital for such an investment. The valuation of a digital OR is obviously comparable with similar investments within the health care sector as well as outside of this sector. Hence, analysis and conclusions in this report can be somewhat extended outside the boundaries of our scope. By looking at the business case of valuing a digital OR with Smith & Nephew, our main ambition is to answer the following research question: How can an investment such as a digital operating room be valued in the public health care sector?
1.5 Purpose of Research In order to answer the research question this report is build up of two sub-objectives. The first objective is to identify the most important aspects considering the valuation of an investment of a digital OR and to derive a model that can be used in valuing these kinds of investments within the public health care sector. The second objective is to identify how this derived model can make it possible for companies such as Smith & Nephew to use this knowledge in order to improve and pinpoint the utility of their digital OR and hence strengthen their position on the market. Also, it is of great consideration how this model is implemented and used from an investor’s point of view when choosing between various investment options. This last objective is well aligned with the main purpose of answering the research question.

6
2 METHOD
The method chapter gives a view of how this research has been performed and in which way information has been gathered and analyzed. This information can be used when critically questioning the results and conclusions drawn in this report.
2.1 Method Outline To answer the question, how an investment such as a digital operating room can be valued in the public health care sector, a method outline has been followed which started by identifying the problems that can occur when valuing an investment of this type. Thereafter, the outline continued on two parallel paths by, on the one hand gathering theoretical information using various types of resources such as research papers and theoretically based literature and on the other hand gathering empirical information using mainly interviews. The theoretical and empirical information was then merged and analyzed, which ended up in a new valuation model for the digital OR. Finally, relevant conclusions are drawn and a discussion is made concerning our research. When identifying problems that can arise in this type of investment decisions we followed a model, influenced by Renkema (1998), which is constituted by identifying the different types of valuation problems that is present in modern technology related investments. The model follows a valuation from the two different approaches, product and process valuation. Valuation from a product view considers cash flows and tangible effects achieved from the investment. The result of this valuation is compared and merged with the process valuation, which consists of valuations of more intangible effects, such as better ergonomics and less suffering from patients. This finally leads to our own valuation model that includes most important aspects of an IT investment, which can give a more suitable and combined valuation of both tangible and intangible assets. The model in figure 2, illustrates how an investment decision can be transformed from an “act of faith” decision by taking two parallel paths and end up in a balanced and controlled valuation.
Act ofFaith
ProductValuation
ProcessValuation
Balanced andControlledValuation
Figure 2: Thesis Outline Model (Modification from Renkema, 1998) After having recognized the problems associated with the different types of tangible and intangible values based on the Renkema model the next step was to collect relevant data from theoretical and empirical resources.

7
2.2 Choice of Methods To reach a reliable and valid result the research is based on qualitative as well as quantitative methods. The level of validity is, referring to Bell (2000), consistent with measuring what is intended to measure and reliability is a measurement in which an instrument or a course of action produces similar results at different research occasions under the same circumstances. The relationship and differences between validity and reliability can be illustrated as a result on a target, which is illustrated in figure 3. High validity can be viewed as research actually measuring what it is intended to do and is illustrated as gathering the results close to the “bulls-eye” on the target. Similarly, reliability is a measurement of how consistent the research result is which can be illustrated by results being in a close range to each other anywhere on the target. Bell (ibid.) claims that a result with low validity can still show high reliability, but if the reliability is low no trustworthy conclusions can be drawn and therefore the validity is also low.
High validityHigh reliability
Low validityHigh reliability
Low validityLow reliability
Figure 3: Validity and reliability, Bell (2000) In this report were, on the one hand, qualitative methods used to get a deeper knowledge, understanding and to make sure that relevant information was measured. The qualitative information was mainly gathered by making interviews and studying theoretical material. The objective of the qualitative approach was to receive understanding for this unique investment and from different stand points examine how it can be valued today, especially in the process dimension. According to Thorén (1996), when considering a problem in its entirety, the use of a qualitative method is advantageous to the quantitative method. On the other hand, a more quantitative method was used to obtain relevant figures when valuing the digital OR in the business case. This quantitative information is mainly based on primary data which has been valued and examined according to accepted theories together with our own conclusions. Also, some data and figures have been produced as a result of educated guesses based on comparable information. This has been done in order to construct an estimation of the value of a digital OR, where investor’s later on easily can manipulate the figures to suit their specific needs. In the product dimension a more quantitative approach was used in order to, more concretely, value the financial impacts of a digital OR investment. However, note that most of the quantitative information has been derived from more qualitative approaches, such as via interviews. In the combined and controlled valuation the effort was to quantify or measure some of the gathered qualitative information and merge it with the quantitative information.

8
As mentioned earlier, mainly primary data has been used when it comes to the empirical information. Primary data is, according to Jacobsen (2002), information that has been collected to specifically suit the research in question. Hence, this method of collecting information is appropriate to use when gathering specific information for this kind of analysis. Suitable examples of methods to gather primary data are interviews, observations and questionnaires. A different way in which to collect information is to use secondary data, which essentially is information that was originally produced to fit earlier research. According to Bryman and Bell (2005), one needs to be especially careful when utilizing secondary information and also critically question the reliability of the information and its origination. When gathering theoretical information we have primarily made use of this type of secondary data.
2.3 Theoretical Material To be able to reach a reliable valuation of a digital OR investment there was a need to browse through already produced theoretical material concerning this subject. In general, the qualitative and secondary information in this thesis is collected from scientific journals and other theoretically based literature. Numerous databases has been explored in the search for previous studies regarding this particular subject. Examples of such databases are; Business Source Premiere, CiteSeer, PubMed (US National Library of Medicine) and Findarticels.com. The most frequent keywords that have been used are: • Balanced controlled valuation • Digital operating room • Intellectual capital • Investment decisions • Investment evaluation • Medical investments • Scoring models • Soft values • Utility of investments • Valuation of IT investments
Scientific journals that adhere from both pure financial research and more health care associated research have been browsed, in order to get an understanding from both these worlds. Also, the attention was to mainly make use of research papers and articles in order to use reliable and up-to-date material. Another reason for this choice of collecting theoretical material was to keep the framework of the thesis within the academic discourse. The use of the list of references from these scientific journals has been a useful tool when finding theoretically based literature in this field. Furthermore, other literature that has been used is course literature at the School of Business, Economics and Law, Göteborg University. The extensive and methodical literature search, which ended up in the theoretical material, functions as a stabile ground in the valuation performed in this research and worked as a guideline to find valid and relevant empirical information.

9
2.4 Empirical Material To collect primary data, methods such as interviews, observations and questionnaires are often used. Observations are a proper tool to use when studying various behavior and processes. This tool is not well suited for this type of research due to the fact that this study main concern is to analyze the investment decision. However, observations can be used useful tool when analyzing and evaluating the before and after states of making such an investment. Questionnaires are mainly used to collect data from an information resource where numerous respondents are present. Also, questionnaires lack the possibility of elaborate on interesting questions that might occur. Since the research deliberately has been limited to few respondents and the fact that it has been considered valuable and important to elaborate on interesting questions, this method has been excluded in our research. Therefore, the empirical data has mainly been collected from interviews with various parts involved in the investment decision of a digital OR. The interviews have been performed partly at Smith & Nephew, who is the selling part, and also with various investors and users within the public health care sector. There are, according to Bell (2000), different ways in which to structure an interview. On the one side an interview can be performed as a discussion without any predetermined structure and on the other side it can be well structured where questions are firmly bounded to the research in question. This type of structured interview, which is similar to a questionnaire, is well suited when interviews are performed on vast amount of respondents. In this research a semi-structured approach has been used when performing the interviews. This type of interview is well suited when the interviewer knows the boundaries and structure that is desirable, and at the same time it enables the interviewee to more freely discuss what he/she feels is important concerning this subject. Furthermore, Bell (ibid.) claims that the structure gives some sort of guarantee that all subjects will be covered. Another reason for choosing a semi-structured interview was that we had a rather good idea of the information we wanted to obtain, but we also wanted to be open for new ideas concerning the valuation process. Hence, we could easily set the boundaries of our interviews and also gain information in the subject by letting our interviewees speak freely. The boundaries were set by first asking more general questions, which was followed up with more specific questions when we felt the need to elaborate more. These general questions are presented in appendix 1. In order to gather relevant empirical information, discussions were initially done at Smith & Nephew where a common ground was established for the research and also to obtain knowledge about their products, specifically the digital OR. To get an understanding, from a seller’s point of view, additional interviews were made with sales personnel and management at Smith & Nephew, in order to study which values they believe are associated with an investment in a digital OR. To establish knowledge of how a digital OR is implemented and to analyze what kind of benefits and problems that can occur with this kind of investment, interviews have been done at a public hospital in Ängelholm, Sweden. This hospital has already decided to invest in a digital OR and the implementation stage has just begun. Additionally, an interview has been performed at the Sahlgrenska University Hospital, which, as a modern university hospital, continuously strives to modernize their facilities and make use of cutting edge technology, such as a digital OR. The choice of performing interviews at the Sahlgrenska University Hospital was also based on the fact that this organization might

10
work differently since it is relatively larger in size compared to the Ängelholm Hospital. When interviewing costumers and presumptive customers at different stages, different perspectives were captured and it also gave a better understanding of the implications of a digital OR and how this investment could and should be valued. Additionally, interviewing presumptive customers provided information about how and why different stages in the investment decision process occur. Interviews were done with the following respondents: • Per-Olof Ortgren (Division Manager (Endoscopy), Smith & Nephew, Sweden) • Per Weije (Sales (Endoscopy), Smith & Nephew, Sweden) • Stefan Lundberg (Sales Manager (Digital OR), Smith & Nephew, Sweden) • Claes-Göran Carlsson (Logistics manager, Sahlgrenska University Hospital, Sweden) • Jens Wichmann (Chief of Medical Engineering, Ängelholm Hospital) • Monika Nordengren (Chief Controller and Chairman of the Investment Group,
Ängelholm Hospital) • Stig Winberg (Technical Manager, Chairman of the Technical Committee and
Responisble for IT Equipment, Ängelholm Hospital) • Torsten Kroon (Departmental Manager at the Surgery Ward, Ängelholm Hospital)
The reason for performing interviews with these interviewees at the Ängelholm Hospital was based on the fact that they were involved in the decision process when investing in digital OR, which implies great knowledge about the decision process within the public health care sector and which methods are used today when valuing a digital OR. Interviews, as a way to gather qualitative data, are especially vulnerable for research bias due to personal influences while gathering and compiling the information that is obtained during the interviews. If this bias is not taken into consideration, there is a greater risk that the research will lack in both validity and reliability. It was of great importance to take this into consideration when performing interviews at the Ängelholm Hospital due to the fact that all interviewees was involved in the decision process and that they already decided to invest in a digital OR. Andersen (1998) touches upon these issues when he emphasizes the importance of criticisms toward the gathered material and suggests that a serious researcher must be skeptical to his/her favorite ideas and predetermined opinions. This was of great importance when using information obtained from personnel at Smith & Nephew due to their partial interest in this subject. Furthermore, there is a possibility that the respondents at the Ängelholm hospital also have a partial standing point since they might want to argue that their investment decision is correct and in accordance with their strategic goals. Finally, assumption will be made that information gathered from the two hospitals, Sahlgrenska University Hospital and Ängelholm Hospital, can be considered general enough so that conclusions can be drawn that can suit most Swedish public hospitals. The fact that interviews have been performed with many different parts involved in this investment process makes the information gathered reliable. Other empirical data that has been gathered for this study by analyzing secondary information has been obtained from the respondents while performing our interviews, examples of such data are budget information and already implemented valuation tools. Some of the data that has been essential when performing a valuation by using the alternative valuation model that has been constructed for this purpose, has also been collected from various sources on the Internet.

11
2.5 Analysis Model and Interpretations The main goal with this thesis is, as mention earlier, to find a way to value a digital OR for the public health care sector. In order to find a more suitable and relevant valuation model there is a need to analyze various theoretical valuation models with models and techniques used in reality. Given the theoretical and empirical information, these models can objectively be analyzed using relevant evaluation criteria. The criteria are based upon how the accepted theories are formed and the specifics that have occurred during the empirical research. The analysis model used in this thesis is therefore based on a deductive approach in order to draw theoretically reliable and valid conclusions given valuation theories and empirical information. The deductive methodology is, according to Jacobsen (2002), based on the researchers’ ability to draw logical conclusions from common principles and existing theories. This approach is considered advantageous to the inductive one when it comes to practically implementing new theories and models. Also, the inductive approach is more suitable when there is a great number of empirical data to compare and analyze. To be able to compose an improved and realistic alternative valuation model it was of great importance to analyze accepted theories and empirical data based on the given criteria. The result from the analysis model was therefore used as a base for the new valuation model. Pros and cons from already existing models were weighed and compared to each other using relevant evaluation criteria. These criteria are derived from the theoretical and empirical material and will be presented in the analysis chapter.

12
3 THEORETICAL FRAMEWORK The theoretical framework is a summary of various research theories that has been created to solve problems similar to those described in the previous chapter. These theories are work as a basis when selecting and creating the model we use in our analysis. Also, these theories give the reader a basic knowledge of theories developed in this field of study.
3.1 The Capital Budgeting Process To understand why certain investments are being made and what main goals and restrictions which are present, it is of great importance to understand the capital budgeting process. Decisions and investments made are often based on the similar grounds in the private as well as the public sector. Managers in the private sector are, according to Chan (2004), often forced to evaluate numerous capital investments opportunities. They are responsible for the administration of organizational assets, which will be allocated to capital projects if the investments are calculated to be profitable and provide expected return to stockholders. The possible risks and profits of these investments must be weighed and evaluated thoroughly. The main ambition of financial management in the private sector is to determine which investments are valuable and profitable to the firm. Chan claims that, even though profitability not always is an objective for the public sector, capital budgeting techniques still can assist administrators in valuing competing investment projects and bids from different contractors to make sure that the bid with the lowest cost or greatest cost savings is chosen. Chan (2004) further argues that the use of discounted cash flow analysis in practice is anything but perfect, even though the theoretical soundness of it. This, Chan continues, is because management often compares proposed projects to the status quo, and that the managers assume that the future cash flows will maintain at existing levels if no investment is done. That kind of approach is, according to Chan, unlikely to be adequate in the current operating environment for the, nonprofit, public sector, because operating costs of existing assets probably will increase and the efficiency decline if replacements or new investments not is made.
3.2 Traditional Financial Valuation Techniques There are numerous ways in which valuation of investments are being made today. Among the most common techniques we find the payback method, the net present value (NPV), the internal rate of return (IRR) and the accounting rate of return (ARR). However, the only method that will maximize shareholders’ wealth, according to Copeland, Weston and Shastri (2005) is the NPV method. It has all four properties; considers all cash flows, discounts all cash flows at the opportunity cost of capital, selects the investment that maximizes shareholders’ wealth from a set of mutually exclusive investments and enables a manager to consider one investment independently from all others. We will from hereon assume that the health care sector is no exception from other sectors in focusing on maximizing shareholders’ wealth, even though shareholders might not be present.

13
When using the NPV method one starts by calculating the expected future free cash flows (FCF) that will occur during the life time of the project or investment. Mun (2006) presents the definition of a free cash flow based on GAAP (generally accepted accounting principles) as:
Capital Working Net in ChangeesExpenditur Capital-onAmortizati onDepreciatiRate Tax Effective Taxes and Interest Before Earings Flow Cash Free
±++−×= )1(
(1)
where earnings before interest and taxes (EBIT) is derived as:
onAmortizati-onDepreciati-Costs tiveAdministra and General-Expenses Selling-Profits GrossEBIT =
(2)
The NPV of an investment is calculated as the present value of all future cash flows. Therefore, we need some way in which to discount each cash flow in order to incorporate the time value of money. This can be done by using the opportunity cost of capital k of the firm in the following manner (Copeland et al., 2005):
∑=
−+
=N
tt
t Ik
FCFNPV
10)1(
(3)
where N is the number of years that the investment will last, FCFt is the free cash flow at year t and I0 is the initial cash outlay. A project or investment should be implemented if the calculated NPV is greater than zero. All though the NPV method inhibits all four properties described by Copeland et al. (2005) there are some downsides that one needs to take into account. Some of the downsides presented by Mun (2006) include that decisions are made on a “now-or-never” mentality, investments are passively managed once decided upon and intangibles or immeasurable factors are valued at zero. According to Trigeorgis (1993), this could lead to underinvestment and projects that would positively contribute in maximizing shareholders’ wealth would be rejected. As described earlier in this thesis, these intangibles are common in the health care sector and in IT investments and we will therefore extend the theoretical framework with both real options analysis and subjective methods.
3.3 Real Options Analysis Real option analysis (ROA) has been developed in order to cope with the flaws of the NPV method, more specifically the “now-or-never” mentality and passive management once an investment is decided upon. Mun (2006) states that investments are full with uncertainty and risks. These uncertainties contain valuable information and once they become unresolved through the passage of time, actions and events, managers can make appropriate decisions which can lead to an increase of the investment value. ROA is a method where managerial flexibility is taken into account and the value of the so called imbedded real options are added to the more static NPV. An example of a real option in a digital OR could be to be able to expand the functionality when the investment has proven successful and by doing so increasing the investment value in total. A real option can be described as an option related to

14
physical assets where an option is an opportunity which can be exercised, but which is not required. Hence, the holder has the choice to exercise the option but not the obligation to do so. Consequently, ROA is a method to value a firm’s or an organization’s future investment opportunities. However, ROA is rather a complement and an extension of the NPV method than a totally new method. To get a better understanding of ROA some basics of the underlying theory will be presented. This theory is based on the financial option thinking, which will be the starting point of the presentation of the basics of real options. Thereafter, a real options process will be presented where each step is thoroughly discussed.
3.3.1 Basics of Real Options ROA has its roots in the financial option theory. In financial option theory, options are essentially bought in order to be able to buy (call option) or sell (put option) a stock on the market at a pre-defined value in the future. Since the options can be bought, they can naturally also be sold. We will mainly focus on having the so called long position, i.e. the position where you are in possession of the option. An option is a type of contract that will, after the so called maturity date, be invalid. Financial options are often divided into European and American options. The difference is that the European only can be exercised at the maturity date while the American can be exercised at any time up until the maturity date. (Svavarsson, 2005) To be able to understand the value of an option we will illustrate this as an example taken from Svavarsson (2005) of being long in a European put option. Assume that the final underlying stock has a value of ST at maturity and that X is the strike price at which you have the option to buy the underlying stock. In this case you will only exercise your option if you know that ST is greater that X. This gives us a payoff function of this European put option as max(ST – X, 0). Analogous, you can derive the payoff function of a European call option as max(X – ST, 0). Now that we have an idea of the possible payoffs we need to get an understanding of at which price these options are sold at and why. The most common, according to Svavarsson (2005), is the so called Black-Scholes (BS) formula. There are five different variables that affect the price of an option and these are; underlying stock price (S), exercise price (X), time to maturity (t), the risk-free interest rate (r) and the volatility of the underlying security (σ), i.e. the stock price. There has also been an extension made where dividends (d) are taken into account. A higher value in any of these variables will affect the option price as described in table 1. Table 1: Implications of the option price when having a high value on its variables, (Svavarsson, 2005)
Variable (High value)
Price of a European call option
Price of a European put option
Underlying stock price (ST) low high Exercise price (X) high low Time to maturity (t) high high Risk-free interest rate (r) high low Volatility (σ) high high Dividends (d) low high

15
For example, a high value in the underlying stock price will amount to a lower call option price and a greater put option price. For more information concerning these variables and how they affect the option price we refer to Svavarsson (2005) and Mun (2006). Real options use this financial option theory in order to incorporate the managerial flexibility value of investments and projects (Leslie and Michaels, 1997). In the real investments there are several different types of options that might be present. These different types are often categorized as described in table 2 (Svavarsson, 2005). Table 2: Different types of real options, (Svavarsson, 2005)
Type of Real Option
Description Relevance to IT investments
Option to defer Choice of investing now or later Timing of investments in new technology is of great importance in most organizations
Option to invest in stages
Provides managerial flexibility that may have substantial value in the face of great uncertainties
Step wise implementation or all at once execution of large IT projects can make or break the project
Growth options An investment may open up opportunities for future capabilities that require further investments but would not been possible without the initial investment
New applications added to existing systems or existing applications spread wider through the organization
Scaling options Allows scaling of current capacity or capabilities, either up or down, depending on market conditions
The capacity of many systems such as databases and network servers can sometimes be expanded to reach new requirements
Option to abandon
Abandoning ongoing implementation on a new system or use of an existing unprofitable technology
A large number of IT projects end in failure. Knowing when it is time to call it quits can potentially save the firm enormous resources
Option to switch Allows the firm to switch between alternative technologies or systems depending on market conditions
Modular system architecture may allow a firm to switch to another system vendor for individual applications and/or system support. An IT capability may offer support to multiple business capabilities allowing the firm to switch support to the most valuable application
Compound options
Options may be dependent of the implementation of other options. These may be simultaneously or sequentially dependent
Many extensive IT investments involve a series of inter-related IT projects. Individual projects can further often be implemented in contingent stages that resemble compound options
We now have the knowledge of different types of real options and also have an idea of financial option pricing. How do we map the variables used in financial option pricing to real options? Leslie et al. (1997) maps the variables in the following manner: • Underlying stock price (ST) – The equivalent in real options is the present value of all
future cash flows expected from investment opportunity on which the option is purchased.
• Exercise price (X) – In the real market the equivalent of the exercise price is the present value of all fixed costs expected over the lifetime of the investment opportunity.

16
• Time to maturity (t) – The equivalence in the real world is the time for which the investment opportunity is valid, which depends on technology, competitive advantage and contracts.
• Risk-free rate (r) – The risk-free rate has the same meaning in both the financial and the real options world.
• Volatility (σ) – The volatility in real options measures the risk that is associated with the value of expected future cash flows.
• Dividends (d) – Dividends can essentially be seen as some type of value-drainage. In real options this could be the costs implied when preserving the option and keeping it alive or the cash flows lost to competitors that go ahead and invest in an opportunity.
Leslie et al. (ibid.) use the similarity of the variables being levers that management can pull during the life time of the options in order to increase the total value of the investment. An example could be to lower the value of the fixed costs by utilizing economies of scale and scope. Another example could be to increase the time to maturity by maintaining regulatory barriers or making innovations that leads to a technology advantage. The risk-free rate lever is an exception of all others since it is said to be impossible for any market player to individually affect. There are three main assumptions, according to Copeland et al. (2005) that are made when transforming the option pricing theory into real options theory; Samuelson’s proof, law of one price and the market asset disclaimer (MAD). Samuelson’s proof essentially means that the underlying asset must fluctuate randomly. Even though cash flows might be fairly certain the value of each do follow a random pattern. The second assumption, the law of one price, indicates that there are no arbitrage possibilities. The third large assumption is MAD, which essentially states that the underlying asset must be traded, but in the case of real options it is argued that the expected present value of future cash flows of the underlying asset may be used.
3.3.2 The Binominal Option Pricing Model Calculation of a real option value can be done by using the analytical BS formula, but it is complex and hence hard to communicate and is inflexible. Therefore, numerical option pricing models, such as binominal and multinominal lattices, are often used. These numerical models are approximations of the BS formula. The main arguments that Svavarsson (2005) used when selecting the binominal option pricing model (BOPM) was due to its applicability, flexibility, simplicity and acceptability. For the same reasons we will focus on the BOPM and start by describing its essentials.

17
Assume that we have calculated an expected value of future cash flows S0 of an investment. The coming year there is a probability of S0 having increased to S0u or decreased to S0d. u and d will be further described when we get into the calculation parts. Moving yet another year we can end up in the following three discrete states; S0u2, S0ud and S0d2. This is illustrated in figure 4.
Figure 4: Two binominal time steps When extending these lattices we obtain a binominal distribution describing the possible outcomes of the value of the investment in question. The time steps can be made shorter than one year in order to derive a more accurate value. Mun (2006) illustrates this in an example where he calculates the value of a financial option using both BS and BOPM. He uses both a stock price and an exercise price of $100, a time to expiration of one year, a risk-free rate of 5 % and a volatility of the underlying asset of 25 %. Also, there are no dividends. The Black-Scholes formula yields a result of $12.3360. However, when using BOPM we obtain a value of $12.0923 when using ten time steps during that one year. Not until having 50,000 time steps we obtain a value equal to that of the BS formula. According to Mun (ibid), it is usually sufficient to use between 100 and 1,000 time steps to get a good valuation. We will now get into how these values are calculated using the BOPM. The up- and down-movement factors u and d depend on the length of each time step and also the volatility of the underlying asset. Naturally, a risky investment with a high volatility and a relatively long time step will have a greater spread in the up- and down-movements compared to that of a solid investment with a shorter time step. In order to calculate u and d we will use the same assumption used by the BS formula, namely that discounting is done using the risk free rate. Furthermore, we incorporate the probability of an up-movement p and a down-movement 1-p. The expected discounted value of the underlying asset, i.e. the expected present value of future cash flows of the IT investment, is derived as (Svavarsson, 2005):
( ) tr
tr
edSpupSSdSpupSeS
∆−
∆
×−+=⇒−+=
000
000
)1()1( (4)
where r equals the risk-free rate and ∆t is the length of each time step.
S0
S0u
S0d
S0u2
S0ud
S0d2

18
The risk neutral probability of an up-movement and the up- and down-movement factors are calculated as (Svavarsson, 2005):
dudep
tr
−−
=∆
(5)
tTeu /σ= (6) tTe
ud /1 σ−== (7)
where σ describes the volatility of the underlying asset and T equals the total time span of the investment. When calculating the value of real options using BOPM one starts by first calculating the so called value lattice which is exemplified in figure 4. The value lattice describes the evolution of the underlying asset as time goes by. Thereafter, the option lattice is calculated, which essentially uses the value lattice and at each node checks whether the real option should be exercised or not. We will illustrate this as a fairly simple example where an abandonment option is present. To recap, an abandonment option gives the holder an option to abandon the investment if it turns out that it will not return a positive NPV. Hence, the value at each node is calculated as C=max[ST-X,0], i.e. you will either proceed with the investment and have a NPV of ST-X or abandon the investment if the expected NPV is negative. Figure 5 illustrates this two step procedure of calculating the value lattice and the option lattice.
Figure 5: A two step valuation of a one year abandonment option (Modification from Svavarsson, 2005)
3.3.3 The Real Options Process Mun (2006) presents an eight step real options process. These steps include: 1. Qualitative management screening – Management have to decide on which types of
investments that need to be done in accordance with the organization’s mission, vision, goal and overall strategy.
2. Time-series and regression forecasting – The future forecast of possible investments are derived using either time-series analysis or multivariate regression analysis if historical information exist. Otherwise, other qualitative methods may be used.
3. Base case NPV analysis – A static NPV is calculated for each selected investment that passes the management screening.
4. Monte Carlo simulation – One way in which to derive the volatility of an investment is to perform a Mote Carlo simulation. However, first one needs to identify which variables, when increased and decreased, that the investment is most sensitive to. Common variables are revenues, costs, tax rates and discount rates. The most sensitive variables are then selected and a simulation is performed in order to obtain the volatility of the investment. The simulation is required since some of the variables might be
S0
S0u
S0d
C =[pS0u+(1-p) S0d]e-r
Cu=max [S0u-X,0]
Cd=max [S0d-X,0]
Value lattice Option lattice

19
correlated and the simulation will produce a much closer approximation to the variables’ real life behaviors. The volatility can also, according to Leuhrman (1998), be estimated by making an educated guess, which should be in the range of 30 % to 60 % per year.
5. Real options problem framing – The next step is to identify which types of real options those are present, such as option to abandon and expand. These real options are used in order to hedge downside risk and to take advantage of upside swings.
6. Real options modeling and analysis – Using input data from step 3, 4 and 5 real options modeling and analysis is performed using for instance the BOPM.
7. Portfolio and resource optimization – Among the various investments analyzed one selects the ones that utilize the resources optimally and suits the portfolio of investments of the organization.
8. Reporting and update analysis – The results of the previous steps needs to be reported in a transparent and easily understood manner.
3.4 Techniques for Subjective and Balanced Valuation The use and development of subjective methods, for IT valuation, first occurred in the late 1970s (Powel, 1992). According to Powel (1992) the major incentive for this was to move the computer system closer to manager and user by moving it away from the data processing area. By doing this the user would get a feeling of participation, ownership and commitment. A subjective method tries to quantify the value of a specific occurrence in order to find the differences between systems, focusing at intangible values that might be difficult to quantify, such as ergonomics, better documentation and education possibilities. We would like to convert these intangible values into financial values or vice versa, i.e. converting financial values into some kind of scoring system. Powel (1992) claims that subjective evaluation methods only can be used afterwards. Using such methods one could only base the decision to invest or not on analysis of already made investments of similar character. To study the benefits of intangible values obtained from IT investments, methods based on a multi-criteria approach is required (Svavarsson, 2005). For each investment one has to find a specific or sets of measures adapted to the specific investment. These subjective methods are often categorized as multi-criteria methods and portfolio methods. Multi-criteria methods are often referred to as multi-attribute decision making (MADM).
3.4.1 Multi-Attribute Decision Making (MADM) Many decision makers in organizations use MADM to evaluate complex problems. Usually multi-criteria thinking is used to ease the decision making process. It demonstrates the pros and cons of policy options under circumstances of risk and uncertainty, through trade-offs (Saaty, 1994). The MADM approach can be more or less elaborated, but basically all methods are based on some type of scoring system. The pre-defined process related benefits, used for identifying the impact of the investment, is the key potency of MADM method. According to Andresen (1999) the output of this model is not particularly supportive as a decision support tool. In order to further enlighten how these MADM approach can be used, a number of significant models are explained. These models are just a few of the theoretically existing MADM models, but can be used as examples of how these approaches differs and what similarities they have.

20
Scoring Models Scoring models are constructed to handle subjective aspects of evaluation and is often used when evaluating IT investments. These methods imply considerations about the importance of the different parts and how these will be affected by the investment, before taking a decision. Each criterion is assigned an importance weight and each alternative is ranked on these criteria using a scale of, for example 1 to 10. For each alternative a weighted average of the rankings is calculated and this results as the general score for that alternative (Sarkis, 2000). Even if a certain criterion is difficult to measure in monetary terms this method does not exclude it which enables consideration of all parts. Another advantage with scoring models is the easiness to communicate the project strategy, by making the weights of criteria open to decision makers on a lower level within the company (Cooper, Edgett and Kleinschmidt, 2001). Management should make sure that every level within the company knows about their strategic goals and they can use the assignment of weights as a tool to discuss and come to a decision upon the overall strategy. The output of a scoring model is an abstract figure and that is the main drawback. It requires understanding of the model and its context to decide if the output from a scoring model makes an investment worth to implement or not. When dealing with complex investment decisions in multi divisional and decentralized organizations, this issue becomes even greater. Scoring models should not, according to Svavarsson (2005), replace the traditional capital budgeting methods but should be used as a complement, to make sure the inclusion of qualitative values. Sarkis (2000) says that scoring models are the most popular techniques of subjective methods and also the simplest. Information Economics According to Svavarsson (2005), the Information Economics (IE) approach introduces a concept of value, based on the effect IT investments have on the business performance of the organization. IE, consisting of cost and values, tools and measurements, is a method used to evaluate different alternatives for IT investments. This method is based on three parts; the economic domain, the business domain and the technology domain which describes the benefits of the investment. Each domain is made up of numerous different sub categories. The economic domain is separated into five parts, which are (Andresen, 2001):
• The traditional cost/benefit analysis - This part focuses on quantifiable costs and benefits of the IT investment, like software cost and reduction of operating expenses.
• Value linking - All economically quantifiable benefits, which are attainable in other business units of the company because of the use of the IT investment, are included.
• Value acceleration - This part is consisting of quantifiable economic benefits, which are characterized as on-off benefits. One example is reduced time scale for operation.
• Value restructuring - This part is focusing on benefits that increase the employees’ time on more value-adding activities because of the IT investment.
• Innovation - In this part the benefits achieved, when IT investments provide innovating aspects like new business markets or competitive advantages, are in focus.
All negative effects of IT investments are included in costs. To find the “true economic impact” of an IT investment benefits and costs are compared. Furthermore, the IE approach provides a structure in how to classify risks associated with IT investments. By using this method it is possible to attain a broad evaluation, though extensive knowledge is required and has to be applied in a proper manner. This method can be time consuming because of all

21
information needed from many different sources and therefore it is a risk that the application of this model would be costly. (Svavarsson 2005) Analytic Hierarchy Process Yet another MADM model is the Analytic Hierarchy Process (AHP) (Saaty, 1994). Both ranking and comparison methods are included in this model. In AHP a problem is structured as a hierarchy and broken down into sub problems and then the solutions of these are aggregated into a conclusion. The criteria and sub criteria are compared according to their relative importance (ibid.). An example of a hierarchy is illustrated in figure 6. According to Sarkis (2000) this model assigns weights to different factors, whether they are tangible or intangible, by the decision makers’ strength of preference of one factor over another. He defines it as a pair wise comparison approach. It is assumed that all factors have some utility that is additive and these are grouped into levels and their importance is based on their relationship to a controlling factor in the hierarchy. By using this method a systematic approach for gathering and quantifying weights and rating of both objective and subjective criteria is presented, in order to compare them on a common scale (Svavarsson, 2005). The number of criteria compared should not, according to Saaty (1994) be too great, in order to obtain priorities with acceptable reliability.
Choosing Best IT InvestmentBenefits Hierarchy
Customer benefits0.30
Strategic benefits0.16
Financial benefits0.54
Accessibility toproducts
0.17
Lower prices0.09
Customization ofproducts
0.04
Marketing0.14
CustomerManagement
0.02
Goal
GeneralCriteria
Subcriteria
Figure 6: Example of the AHP model, (Saaty, 1994) In the example illustrated in figure 6 the benefit criteria are weighted and relatively compared in order to enable an easier comparison of different investment alternatives. Measuring the Benefits of IT Innovation The Measuring the Benefits of IT Innovation (MBITI) model is developed especially to deal with IT investments (Svavarsson, 2005). The MBITI was developed by Construct IT, UK and published in 1998. (Andresen, 2001) It is initially developed for use by companies from the construction industry. The strategic part consists of finding out the background and strategic aspects of the IT investment. The benefit part is divided into three tables focusing on efficiency benefits, the effectiveness benefits and the performance benefits. The two first of these benefits are measurable and the latter is non-measurable.

22
Carter, Thorpe and Baldwin (1999), states that the strategic part is composed of seven questions about the background and the strategic aspects of the IT investment that need to be answered. The questions are: • What is the business opportunity/need that is the trigger? • What strategic aim or business objective is being met? • How does it fit with current business plans? • How does it fit with IT strategies? • How does it meet client/business partners’ needs? • What are the implications of not implementing? • What business processes are affected? (Carter et al., 1999)
Completing this method requires an evaluation in at least two stages of the IT investment’s lifecycle; one before the IT investment is implemented and one during the on-going use. According to Andresen (ibid.), the methods are completed using a number of stages; some of the stages require more resources than others e.g. stages 4 and 6. The stages are: 1. Completion of interviews where the strategic questions were answered - Three sets
of questions are answered through interviews, focusing on describing the company, the IT investment and the current IT evaluation practice. Some of the answers from these interviews can also be used to answer the strategic questions of the method.
2. Identification of benefits - To identify the benefits of the IT investment, all possible types of benefits are recognized with no consideration to their characteristics.
3. Categorization of the identified benefits into the three different tables according to their measurability – In this stage the identified benefits are categorized into three different tables: the efficiency, the effectiveness and the performance table.
4. Estimation of benefits value, weightings, likelihood and/or qualitative ratings - When all the recognized benefits are categorized, the estimate of value, weightings, likelihood and/or qualitative rating, is concluded for each benefit.
5. Calculating the final estimated output - On the basis of the expected numerical and qualitative data, the last expected output are calculated and presented by inputting of the collected data into spreadsheets.
6. Measuring the actual benefit realization - Each benefit is regularly measured and registered through the identified benefits and their determined measurement unit. The frequency of measurement needs to be determined individually for each IT investment.
7. Presenting the final output - In the final stage a presentation of the estimated output and the measured output is completed. This is done by inputting the output of the three tables to a presentation sheet. Further conclusions should be derived by comparing the estimated benefits and the measured benefits. (Andresen, 2001)

23
After completing the strategic part, the benefit part is taken into consideration. This part consists of completing three tables, using the input collected in the initial part. These tables, shown in table 3, focus on the efficiency benefits, the effectiveness benefits and the performance benefits. Table 3: The benefit part, (Andresen, 2001)
Efficiency table Effectiveness table Performance table Typical benefits Typical benefits Typical benefits Specific benefits Specific benefits Specific benefits Implication to benefit of not completing the IT investment
Implication to benefit of not completing the IT investment
Implication to benefit of not completing the IT investment
Measurement unit Measurement unit Measurement unit Responsible person Responsible person Responsible person Estimated value of benefit Likelihood of benefit occurring Likelihood of benefit occurring Likelihood of benefit occurring Total weighting of benefit Total estimated benefit Total estimated benefit
Qualitative rating and description of the impact of the expected benefit
Specific benefit resulting Specific benefit resulting Specific benefit resulting Total measured value Total measured value
Qualitative rating and description of the impact of the measured benefit
To apply the benefits to a company, each of the tables is divided into a number of general business processes, an example how these business processes can be defined to a company in the construction industry is (Andresen, 2001): • Business planning • Marketing • Information management • Procurement • Finance • Client management • Design • Construction • Operation & Maintenance • Human resources
The business processes are, according to Andresen (2001), defined in order to help identifying the benefits that can be associated with the IT investment. Nonetheless, it does not mean that benefits have to be identified for each one of the business processes. In this example the

24
business processes are suited for a construction company, but can easily be adjusted for any other type of business. The output of the MBITI model is separated into three areas reflecting the three types of benefits, which is illustrated in table 4. A summary of the contents in the three tables constitutes to the result of the valuation. The first output shows an estimate of the monetary cost savings of the IT investment, the second output illustrates the increase of the effectiveness benefits in a comparatively scale and the third output is displaying the significance of the non-measurable benefits. Table 4: MBITI’s benefit output (Andresen, 2001)
Type of Benefits Expected Benefits Measured Benefits Efficiency Benefits Quantifiable and Financial
Total forecasted monetary value
Total realized monetary value
Effectiveness Benefits Quantifiable but Non-Financial
Total forecasted score (1 to 100)
Total realized score (1 to 100)
Business performance Benefits Non-Quantifiable and
Non-Financial Entering the data from the IT evaluation into the output tables enables an evaluation of the expected benefits and the measured benefits. These relationships can reveal interesting differences that can be used as guidelines for how to examine the expectations or the measured benefits. (Andresen, 2001) An overview of the MBITI method is illustrated in figure 7.
Efficiency Effectiveness Performance
Benefits Part
Strategic Part
Financial Non-measurableScoring Figure 7: MBITI overview (Carter et al., 1999) After analyzing the strategic questions, benefit issues are identified. These benefits are grouped in to three different benefit categories according to their measurability. Thereafter, the result is presented as shown in table 4.
3.4.2 Portfolio Methods Portfolios are a decision making tools which are used in many strategic analyses. In a portfolio a number of several investments are plotted against several evaluation criteria. These criteria can be selected from a variety of decisive factors, such as financial, strategic or technology (Andresen, 2001). The number of evaluation criteria used in this method, according to Renkema (1999), is normally less than in MADM models, though the result is

25
often more informative. The portfolio approach provides qualitative output, like subjective statements and portfolio diagrams, which are not defined as quantitative. This method is not focused on presenting a financial output but it may be a part of the conclusion of the method (Andresen, 2001). IT benefits should, according to Carter et al. (1999) also be considered as a portfolio of benefits being distributed across various organizations. A list of requirements for stakeholders should be produced to establish the scope of this portfolio and also to realize the maximization of the benefits. An example of a portfolio method is Bedell’s method, which answers the following three questions: (Renkema, 1999) • Should the organization invest in IT applications? • In which activities should the organization invest? • Which IT applications should be developed?
Balance between quality and importance is needed and this is the main principle of this method and the three questions are based on this. IT investments are further suitable if the relation between supposed quality of the investment and the importance of information system is worse. Three estimations have to be made before the three questions can be answered and calculations can be done. These assessments concern: (Renkema, 1999) • The importance of an activity to the organization. • The importance of IT-based support to the activities. • The quality of the IT support in terms of effectiveness, efficiency and timing.
The three questions are answered by the involved stakeholders: senior management, user management and IT specialists when a more detailed investment analysis is made. When evaluating the IT investment the contribution of each investment is calculated and thereafter three portfolios are plotted. The contribution of an IT investment is defined, according to Renkema (ibid.), as the importance of the system multiplied by the improvement in quality after development. By relating the contribution of the IT system to the development costs a project-return index can be calculated and this is used to evaluate the business value of the investment.

26
4 EMPIRICAL RESULTS
This chapter is a review of the gathered information from our empirical research. The information is mainly based on interviews from parts involved in these kinds of investment decisions. The information is presented in order to follow the decision process used when deciding upon investments for the public health care.
4.1 Definition of a Digital Operating Room In order to identify and explain the similarities and differences between investments in general and an investment of a digital OR, it is of great importance to define this type of asset. Since a digital OR is based on modern technology, an investment like this has many similarities with an IT investment. An IT investment is characterized as an asset with many intangible advantages, which can be hard to measure and quantify. By those responsible for retailing these products at Smith & Nephew, a digital OR is defined as an operating room with a centralized and coordinated control of audio/video technology and/or medical equipment. This makes it possible to distribute produced information outside of the operating room. Other advantages, according to Smith & Nephew, is the open architecture, ease of use and the customizability and modularity, which makes each digital OR unique and designed to meet the needs of individual customers. Furthermore, a digital OR can provide an improved efficiency and an ideal educational environment for medical students and surgeons in training, internally as well as externally. The efficiency includes less need of supporting personnel as doctors by themselves can control most of the equipment and also achieve a shorter operating procedure. The increase in efficiency in a shorter operating procedure is estimated to be in the range of 15 %. However, this figure is said to be very much dependent on how the operating procedure was performed before making the investment. For example, a study made at the Ullevål University Hospital showed an increase of 45 % in efficiency2. For some providers of digital operating rooms, such as Smith & Nephew, the realization of this investment can increase the sales of endoscopic instruments, which is one of their main business goals.
4.2 The Capital Budgeting Process The capital budgeting process in the Swedish public health care sector is mainly concerned with allocating financial means in a way that is well aligned with the goal of the health and medical care system to ensure good health and provide care on equal terms for the entire population. According to Carlsson3, planning and implementing investments are parts of the strategic work at a hospital. The process of allocating capital and deciding upon investments within the public health care has been identified both at the Sahlgrenska University Hospital and the Ängelholm Hospital as a procedure including the following four steps.
1. Identifying a certain need – The first step is to identify a certain need that either occurs at the hospital, such as maintenance needs, or might be a part of a strategic goal enforced from a governmental level.
2 Information is obtained from a digital OR presentation of Smith & Nephew 3 Claes-Göran Carlsson (Logistics manager, Sahlgrenska University Hospital, Sweden)

27
2. Applying for financial means and allocating capital – When a need has been identified, the next step is to apply for financial means and, if successful, capital is allocated to this investment covering this certain need. Also, budgeted capital which already has been allocated to the hospital can be applied for from different departments within the hospital. Application of financial means is often an iterative process when extra capital is needed.
3. Deriving requirements for the public procurement – After the point where capital has been allocated for a certain need and investment the hospital derives detailed requirements. These requirements have to be in accordance with the Act on Public Procurement (1992:1528). This act is a framework used by governmental institutions when making procurements of goods and services. The essence of the act is to provide a fair competition in an objective and businesslike manner within the directives given by the European Union.
4. Evaluating different investment alternatives – In accordance with the requirements and the Act on Public Procurement, all bids are analyzed before the most suitable one is selected. Also, a clear specification of why this alternative is selected is provided to all bidders. It is of great importance that the evaluation is performed properly and objectively according to the requirements declared in the published public procurement. If this not is the case it could lead to an appeal which might delay and increase the costs of the process.
Note that the steps presented not always follow this consecutive pattern. There is sometimes a need to go back and forth in between two steps to follow up on information which has been identified. For instance, when deriving requirement new needs might arise and this means that there is a need to apply for more financial means.
4.3 Investment Process for a Digital OR To exemplify how the capital budgeting and investment process can be performed in actuality we will describe the basic steps in the investment of a digital OR, as it has occurred at the Ängelholm Hospital. Due to the secrecy of this investment, all figures provided in this example are merely estimations. The process started with a governmental directive of the Ängelholm Hospital becoming a centre concerning shoulder and back orthopedics. This is in accordance with the specialization strategy within the Swedish health care, where each hospital is concentrating on specific areas in order to increase productivity and effectiveness. When given this directive the hospital was asked to apply for 5.5 million SEK. However, after gathering information concerning potential investments they applied for an additional 4.5 million SEK, which they were granted and finally ended up with 10 million SEK. The next step in the process was to derive the requirements for three digital operating rooms. These requirements were set up by doctors, IT and economy personnel, medical engineers and the hospital management which made the investment well rooted in the entire organization. In the end there were four bidders competing for the investment opportunity. After evaluating these four alternatives by using a scoring model, which is further described later in this chapter, Smith & Nephew received the contract of providing these three digital operating rooms.

28
4.4 Techniques for Valuation In order to evaluate the different proposed alternatives from the bidders there is, in the fourth step of the decision process, a need to make a thorough and balanced comparison, well aligned with the set of requirements. In general there seems to be a common use of different scoring models in the Swedish health care sector, for instance the Sahlgrenska University Hospital have started to use a valuation model called PENG. The PENG model is based on assigning financial values on utilities in three categories; green, yellow and red. Green benefits affect the result directly, yellow benefits affect the result indirectly and red benefits are more subjective and considered difficult to evaluate. There are also benefits included in the model, which are categorized as benefits not reached, when it is used as a post-evaluation method (Carlsson and Ring, 2005). At the Ängelholm Hospital they use another type of scoring system which is more linked to the requirements for the public procurement. These two models differ from each others and for instance, the PENG model is more suitable to make more general valuation of how a certain type of investment is profitable or not and can therefore be used earlier in the decision process to compare how allocation of capital shall be done in the most effective way. However, the model used at the Ängelholm Hospital is only suitable for valuation between proposals of equal investments from different bidders. Yet another difference between these two scoring model is in how they quantify the output of the valuation. The PENG model strives to weight the subjective values and put a financial value on these. The scoring model that is used at the Ängelholm Hospital is, as mentioned above, linked to the requirement publication in order to inform the bidders how the evaluation of the tenders is done. This model has an output which weighs all values, including the financial ones, into a total score, where the invited tender with the highest score gets the contract. A more detailed way in which both financial and subjective values are and can be valued using PENG and the model used at the Ängelholm Hospital will be described in the following subsections.
4.4.1 Financial Valuation Techniques At the Ängelholm Hospital as well as at the Sahlgrenska University Hospital cost analysis is the most frequent way in which financial valuation is performed. More specifically, it is the only way in which financial valuation is done at the Ängelholm Hospital. This is partly due the fact that the health care system has been changed from being a public sector company to a public sector administration. As a public sector company the hospitals were organizationally managed similar to a private company where they got financed in relation to performance and had demands of being profitable. Due to a political change profitability goals became less important and financing was more related to a fixed performance goal. However, recently at the Ängelholm Hospital change has been done in order to incorporate a possibility of getting finance in relation to performance. Calculation of costs must, according to specification, include fixed operational and maintenance costs and costs of all equipment, packaging, education, insurance, duty, transportation and installation. At the Sahlgrenska University Hospital they also claim to make use of a traditional financial valuation based on the NPV technique. When calculating the NPV at public hospitals the free cash flows differ from the definition presented in equation 1. Due to the fact that the public health care is a non-profit organization tax shields

29
can not be included in the calculation. A tax shield can be utilized in profitable organizations by deducting for instance depreciations from the EBIT value before taxes are paid. This leads to a lower tax payment and hence greater earnings after tax. When calculating the time value of money a cost of capital in the range of 4-5.5 % is used today. The reason of having such a low cost of capital at a public hospital compared to that of private firms is due to the possibility of borrowing almost risk free capital from the government. In order to make an NPV calculation one need to estimate the life time of the investment in order make correct depreciations and cash flow analysis. A reasonable life time for a digital OR is estimated to be ten years. This is also the time span in which Smith & Nephew is obligated to supply spare parts and maintenance services. When using the PENG model at the Sahlgrenska University Hospital, they calculate financial benefits as cost savings in efficiency according to how the investment has been recognized to affect, for instance, daily routines. The direct and indirect financial values/benefits are, as mentioned earlier, categorized as green and yellow values. The PENG model, in the way it has been used at the Sahlgrenska University Hospital, does not take time value of money into consideration, which can be done by using the NPV model. There are today no explicit techniques used when valuing flexibility such as real option analysis and therefore these possibilities are not quantified as financial figures. However, some specific requirements, concerning for instance expansion of an investment, can be included in the public procurement. The decision taken at the Ängelholm Hospital was to invest in three digital OR, where only one of them was fully equipped. This includes a flexibility of making an additional investment to enhance the remaining two OR in the future. Furthermore, the investment in a digital OR can be seen as a prerequisite investment in being able to fully utilize digital patient files.
4.4.2 Techniques for Subjective Valuation There are numerous ways of valuing subjective advantages and disadvantages. One of the problems lies in how to quantify and weigh them in relation to each others in an objective manner. The Sahlgrenska University Hospital use, as mention earlier a model called PENG, which is similar to the AHP model presented in the theoretical framework. The similarities are mainly based on how these two models identify the utilities of an investment. The subjective advantages are structured in a hierarchy and broken down into sub areas. In the PENG model subjective advantages are often categorized as red benefits, i.e. benefits that are considered difficult to value. The evaluation performed at the Ängelholm Hospital was based on a scoring model, which was well linked to the requirements used in the public procurement, which can be further analyzed in appendix D (in Swedish). The requirements were arranged into must- and should-requirements. All must-requirements had to be met by all bidders. The should-requirements were scored by personnel at the hospital according to a well defined structure. Also, the should-requirements often included a subjective valuation of the usability, ergonomics and safety issues in each digital OR.
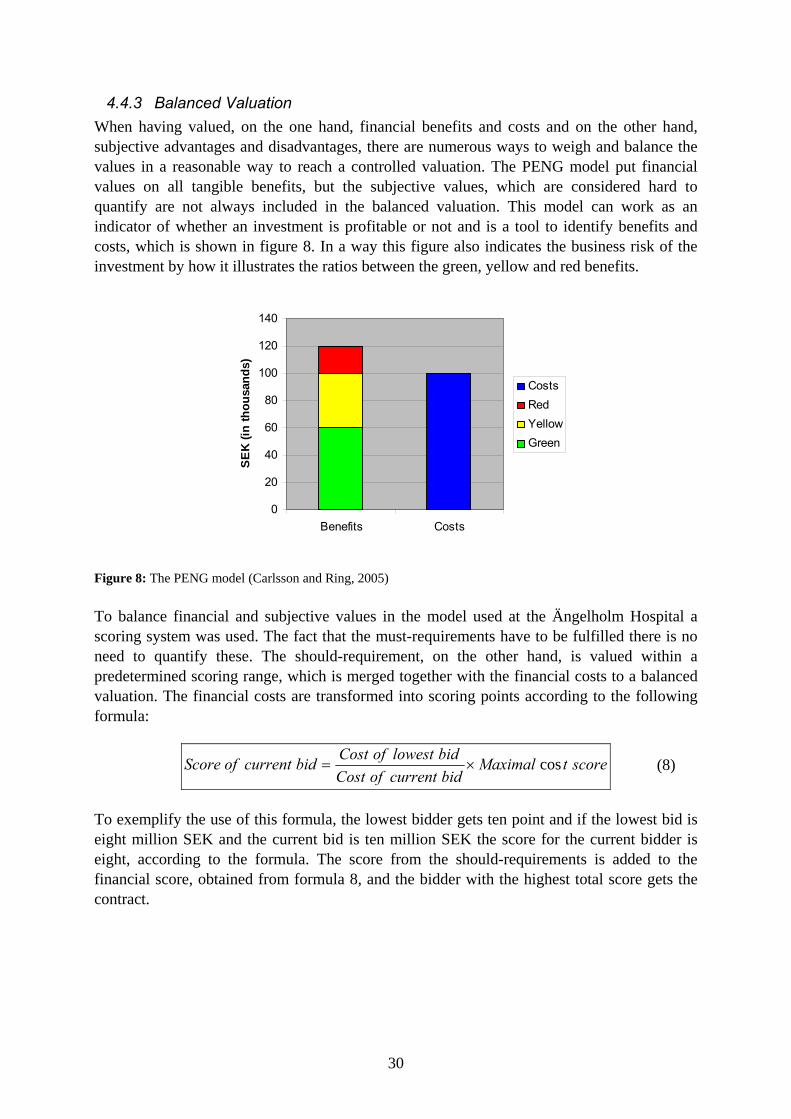
30
4.4.3 Balanced Valuation When having valued, on the one hand, financial benefits and costs and on the other hand, subjective advantages and disadvantages, there are numerous ways to weigh and balance the values in a reasonable way to reach a controlled valuation. The PENG model put financial values on all tangible benefits, but the subjective values, which are considered hard to quantify are not always included in the balanced valuation. This model can work as an indicator of whether an investment is profitable or not and is a tool to identify benefits and costs, which is shown in figure 8. In a way this figure also indicates the business risk of the investment by how it illustrates the ratios between the green, yellow and red benefits.
0
20
40
60
80
100
120
140
Benefits Costs
SEK
(in th
ousa
nds)
CostsRedYellowGreen
Figure 8: The PENG model (Carlsson and Ring, 2005) To balance financial and subjective values in the model used at the Ängelholm Hospital a scoring system was used. The fact that the must-requirements have to be fulfilled there is no need to quantify these. The should-requirement, on the other hand, is valued within a predetermined scoring range, which is merged together with the financial costs to a balanced valuation. The financial costs are transformed into scoring points according to the following formula:
scoretMaximalbidcurrentofCostbidlowestofCostbidcurrentofScore cos×= (8)
To exemplify the use of this formula, the lowest bidder gets ten point and if the lowest bid is eight million SEK and the current bid is ten million SEK the score for the current bidder is eight, according to the formula. The score from the should-requirements is added to the financial score, obtained from formula 8, and the bidder with the highest total score gets the contract.

31
5 ANALYSIS OF THEORETICAL AND EMPIRICAL DATA
In order to create an alternative model for valuation, we intend to use a mix of the most suitable methods from a number of selected models. These models are in here analyzed according to chosen criteria and will end up in an overview of pros and cons of these models.
5.1 The Capital Budgeting Process The fact that the capital budgeting process in the Swedish public health care sector differ from that of private firms implies that valuations are performed in a somewhat different manner and have other criteria of measuring success. To reiterate, the Swedish public health care is mainly concerned with allocating financial means in a way that is well aligned with the goal of the health and medical care system to ensure good health and provide care on equal terms for the entire population and private firms are more concerned with maximizing shareholders’ wealth. Therefore, it is often more relevant to include subjective/non-financial values such as improved patient utility factors. Yet another difference in the capital budgeting techniques is that the public and private sector are bound by different governmental frameworks concerning how investments must be performed. One very important aspect is that the public sector, given certain circumstances, is obliged to operate according to the Act on Public Procurement. This act means that all involved parts have a full view of how the decision process works and how criteria are weighed and evaluated. If the criteria of the public procurement are not fulfilled and some involved parts feel that they have been treated unfair they might file an appeal. This appeal might be either accepted or declined, but nonetheless an appeal leads to a longer and more costly investment process. The public procurement phase of an investment decision might have to be performed all over again if the appeal is accepted. Therefore, it is of great importance that the evaluation performed during the public procurement is transparent, fair and rather easy to understand by bidders.
5.2 Analysis of Multi-Attribute Decision Making Models To be able to evaluate and analyze the theoretical and empirical information in a balanced way, some evaluation criteria have been identified. These criteria are derived in order to ease the construction of an alternative valuation model and are divided into three sub areas. The criteria are based on theoretical and empirical assumptions on which parts in these kind of multi –attribute models that are considered extra important aspects. Financial Criteria • Time value of money – The models are analyzed upon their ability to take time value of
money in consideration. • Flexibility – Is flexibility included in the financial valuation? • Cash flows – Are all cash flows included or are the financial valuation only based on
cost analysis?
Subjective Criteria • Subjective valuation – Are subjective values included in the valuation? • Association of subjective values with financial values – Are the subjective values in
some how compared and/or related to the financial values?

32
General Criteria • Ease of use – Valuation is made upon how easy the model is to use and how to make
tailored changes to fit the specific client. • Combines financial and subjective values – Are both financial and non-financial
benefits valued together or must they be valued separately? • Incorporates risk measures – Does the model include risk in the valuation? • Implementation – Is the model well grounded in the organization in order to give
relevant output and is easy to apply downwards? Financial Criteria There are numerous ways in which investment valuation models take financial aspects in consideration. NPV, IRR or payback methods are just a few methods of how to calculate an investments financial value. The analyzed models often include cost/benefits calculation but lack the influence of time value of money. Some of the models, e.g. AHP and MBITI, can be manipulated to include time value but are mainly based on cost analysis without any consideration of the time aspect. The cost analysis is also the used as a basis, when it comes to financial valuation, in the Ängelholm model. This model is, as mention earlier, constructed for evaluation between bidders in a public procurement phase and only takes the initial cost in consideration. The financial benefits are therefore implicitly assumed to be the same from all bidders and are covered using must-requirements. The scoring model, which is based on pure subjective and intangible valuation, includes no specific financial valuation. The value of flexibility, such as options to expand or abandon, is not common in any of the analyzed models. This might be because there is a lack of knowledge of how to include flexibility or that it is not considered to be important enough. To evaluate an investment in a fair manner one can estimate which future cash flows that are expected to occur as a result of the investment. These cash flows can be increased earnings or, which might be more common for a hospital, savings compare to other investments or if no investment is made at all. The PENG model identifies expected benefits that occur from a specific investment and these benefits can easily be transformed or compared to as cash flows. How the other models identify their future cash flows is not explicitly stated, but the fact that they mainly are based on cost analysis means that the possible future cash flows therefore will be excluded. Subjective Criteria The main point with all Multi-Attribute Decision Making (MADM) models is, as the name indicates, to make decisions from more than one attribute or aspect. Some of these attributes might be intangible or subjective values, which might be hard or impossible to quantify or put a financial value on. The scoring model is mainly based on these subjective values and all of the analyzed models take subjective valuation in consideration in some way. The PENG model is based on assigning financial values on utilities in three categories. Two of these are measurable and the third one, the subjective benefits are considered not measurable or hard to quantify, which is similar to the MBITI that also only have two measurable categories. The MBITI model is however categorized into both financial and subjective values, while the PENG model gives the three categories different colors in the output depending on measurability and possibility of occurrence. The AHP model weighs the subjective attributes in a hierarchic system where the one responsible for the valuation can assign different values

33
upon how important the specific benefits are. This way of illustrating and dividing possible intangible advantages is very useful when one needs an overview of the subjective values. General Criteria The PENG model indicates if an investment should be implemented or not, and it, identical to the AHP model, identifies the utilities of an investment. These utilities are thereafter financially valued. Another similarity with AHP is that PENG structures the subjective advantages in a hierarchy and these are then broken down into sub areas. The PENG model output is a financial value, which is not the case with the AHP model, where the output is a scoring value. This is one of the main differences between these two models. It can be discussed whether or not a financial value is better than a scoring value. Yet another difference is that the objective and subjective values in the AHP model are presented separately, while the PENG model strives to put these together to combined valuation, but since the PENG model considers the subjective values hard to quantify, they are seldom included in the valuation. To get an understanding for the output of the AHP model as basic data for decision making, a high level of knowledge and understanding of the valuation model and its criteria is required. This is not the case with the output of the PENG model, but on the other hand one can question if the output is reliable when the subjective values are excluded. The model used at the Ängelholm Hospital is based on a scoring model where all values are weighted into a total score. The must-requirements had to be met by all bidders, which means that only the should-requirements are scored. This model also puts weights on the financial values, but it is of great importance that the decision makers are aware of how much each point is worth to be able to do a fair estimation when valuing the should-requirements. The question of how large part the financial value should get in contrast to the subjective values is also a question that must be taken in consideration. The must-requirements in the public procurement evaluation can lead to numerous bidders, which do not meet all these requirements, being weeded out. The question is if this is the most effective and correct method to select the best total investment amongst different proposals. One the one hand, it can be positive when can be time consuming to go trough all proposals but on the other hand, it could also lead to a high-quality proposal being thrown away. As mention in the analysis criteria, the ease of use is of great importance. The scoring model and the Ängelholm model are considered easy to manage and understand, but this might also be due to the lack of more thorough valuation steps. The ease of use also includes how the output of the model is grounded and well implemented downwards in the organization. A functional model must be easy to implement, which is the case when using the MBITI model. The three levels of output are fairly easy to understand. The PENG model can also be considered easy to interpret with its colorful staple diagram. The other analyzed models, such as the AHP model, are more elaborated and therefore a bit more complex and require a greater knowledge by the user and also to communicate the output downwards in the organization. When it comes to risk measurement and management, only some of the models take this aspect in consideration. The IE model includes possible disadvantages as costs and the PENG model point out the insecurities with the yellow and red values. The MBITI model can also be considered to include risk when it shows the result in three levels with different levels of reliability.

34
When choosing between the various MADM models it is essential to know the strengths and weaknesses of each model. Therefore, in table 5, an overview has been created based on chosen criteria of the selected types of methods where pros and cons are presented. Table 5: Summary of MADM models
Model Pros Cons Scoring Models + easy to manage − subjective + easy to include non-
monetary aspects − only a complement to
traditional capital budgeting methods
+ easy to implement downwards
Information Economics + takes many aspects into
consideration − time consuming
+ includes risk − requires extensive knowledge
+ possible to attain a broad evaluation
− no monetary time value
Analytic Hierarchy Process
+ more elaborated than regular scoring models
− time consuming
+ takes many aspects in consideration
− complex
+ weights and rates of both objective and subjective criteria
Measuring the Benefits of IT Innovation
+ measures three dimensions of benefits
− time consuming
+ includes risk − requires extensive knowledge
+ structurally easy to implement
− developed specifically for the construction sector
+ both ranking and comparison methods are included
− only measures benefits and not costs
+ weights and rates of both objective and subjective criteria
− no monetary time value
PENG + benefits and costs are
financially valued + fairly easy to understand
and use + incorporates a measure of
risk + systematic way to identify
benefits
− subjective values are often omitted due to the fact that they are hard to value
− not well suited for public procurement evaluation
Ängelholm model + combines a financial and a
subjective evaluation + well suited for a public
procurement
− not well suited to value different types of investments
− might value financial values “incorrectly”

35
The choice of picking one method over the other naturally differs depending on what kind of evaluation that is going to be performed. The cost of the evaluation must be in proportion to the scope of the investment. For example, when deciding on a small investment for a relatively small company, where subjective evaluation is needed, it might be better and more cost effective to make us of a simple scoring model. It is also of great importance to make an analysis according to the purpose of the valuation. If, for instance, the valuation is supposed to compare different offers in order to select one of several producers, which means that the type of investment already is decided upon, a public procurement evaluation must be performed. On the contrary, there can also be a need for a more over-viewing valuation on whether or not an investment is to be implemented or if the allocated means are better invested in another way.
5.3 Analysis of Portfolio Methods Portfolio management is a method to find investments that will suit the organization depending on other investments and how the investments fit with the strategic goals of the company or organization. The portfolio methods can be used together with a decision model and is not a way of individually valuing an investment and must therefore be analyzed on another level than the MADM model. Also, the common two dimensions of portfolio analysis are associated with profit and risk. This thesis is focused on the health care sector and due to the fact that this sector, in contrast to the private sector, is non-profitable and hence, general profit/risk management is not used in the same manner. Of course, there is a need to systematically make sure that all investments are well collaborated and integrated, but this is however not within the delimitation of this thesis. In order to create an alternative to these models we make use of the most suitable methods from all of these models according to the chosen criteria. One of the most important criteria was how the analyzed models weigh the subjective advantages/disadvantages with the financial benefits/costs. The intension is to end up with either a scored result or a monetary value of all pros and cons of the investment.

36
6 ALTERNATIVE VALUATION OF A DIGITAL OR In the previous chapter various theoretical and empirical methods were analyzed. In this chapter an alternative model is presented in order to reach a better tool for valuing digital ORs and similar investments. This model is described and used in valuing an example of a digital OR investment.
6.1 Overview of Alternative Model One of the objectives of this research was to identify the most important aspects considering the valuation of an investment of a digital OR and to derive a model that can be used in valuing these kinds of investments within the public health care sector. More specifically, this model is created to value a digital OR compared to other types of investments, such as a new x-ray system. In order to reach a method to derive a balanced valuation of modern technology and IT investments we need to value tangible and intangible effects associated with the investment in both the process and product dimension. After having analyzed the commonly accepted theories we have weighed their pros and cons to be able to select the most suitable theories. We have decided to build an alternative valuation model, which is mainly influenced by the MBITI model, particularly in the subjective valuation and how the process is structured. This is also the reason why this report more thoroughly describes this method in the theoretical chapter compared to other multi-attribute decision models. Other reasons that the alternative valuation model has more similarities with the MBITI model are that this model includes the possibility to incorporate various types of values, combine them and give a broader perspective in the valuation process. When looking at the product dimension of our valuation, our model is influenced by the real options analysis approach of evaluating IT platform investments by Svavarsson (2005). The real options analysis approach is essentially based on a net present value calculation, risk analysis and real options theory. To be able to calculate NPV and make real options analysis, relevant figures concerning for instance costs, revenues, risks and other tangible and measurable values were collected. Similar to several presented theories in valuing IT and modern technology investments, the model also incorporates intangible values, especially values associated with flexibility.
FinancialValuation ofEfficiency
(ROA/NPV)
Scoring Valuationof Effectiveness/
Performance
Costs/Benefits andAdvantages/Disadvantages
StrategicEvaluation
BalancedFinancial and
Scoring Valuation
Figure 9: Dynamic Multi-Variable Decision Model (DMVDM)

37
An overview of our model, which we call the Dynamic Multi-Variable Decision Model (DMVDM), is illustrated in figure 9. The reason why the model is called a dynamic model is that it incorporates financial flexibility valuation via real options analysis. Each step of the DMVDM will be described below and also contains the valuation of the specific investment of three digital OR similar to the investment being made at the Ängelholm Hospital. As discussed earlier, only one out of these three will be fully equipped and the other two are prepared to be upgraded later on. Values and figures used in this valuation are merely estimations due to the fact that the figures still are kept secret and are used in order to give an example of how the model can be used.
6.2 Strategic Evaluation The strategic evaluation essentially consists of the questions presented by Carter et.al. (1999), where the investment is evaluated on a strategic level. The questions needed to be answered are: • What is the business opportunity/need that is the trigger? • What strategic aim or business objective is being met? • How does it fit with current business plans? • How does it fit with IT strategies? • How does it meet client/business partners’ needs? • What are the implications of not implementing? • What business processes are affected?
A digital OR on a strategic level is most of the times associated with a specialization of a hospital or clinic within the area of endoscopy. For instance, the Ängelholm Hospital was assigned to become a centre concerning shoulder and back orthopedics, which makes use of endoscopic techniques. On a strategic level, this is a step for the Swedish public health care to become more efficient and specialized in various fields, i.e. each hospital will not be able to perform all sorts of surgeries and medical treatments. The digital OR also enhances the way in which hospitals can utilize the possibilities that IT brings, namely increased educational possibilities, digital patient files and that doctors from various places around the world can assist one another. However, it might also result in a higher demand on employee know-how in handling IT equipment. The answers on these questions will most likely vary between investors, but it is of great importance to make sure that the investment is well aligned with the strategies of the organization. A more structured way in which to evaluate strategic values can be done by using a complementary portfolio method. This is however, outside of the scope of this thesis.
6.3 Costs/Benefits and Advantages/Disadvantages The next step of the model is to identify financial costs and benefits and subjective advantages and disadvantages that are associated with the investment. There are various ways in which one can identify, structure and value these and this can be done in a way that suits the organization. The only requirement of the DMVDM is that financial cost and benefits and subjective advantages and disadvantages are well separated and are mutually exclusive. Two techniques that are well suited to fit the DMVDM is the hierarchical structuring of the AHP model and also the categorization of the MBITI model. One can start by first identifying categories such as business processes that are present in the organization. Also, if there are

38
expected future financial costs and benefits these needs to be forecasted. The forecasts can be performed by making estimations through well educated guesses or by using techniques, such as regression. The categorization that has been done is based on empirical information gathered at interviews and also from the requirements specification made at the Ängelholm Hospital. The categories or levels are financial level and the subjective levels; patient level, employee level and general level. The patient level includes patient satisfaction, contamination and waiting time. The employee level includes employee satisfaction, ergonomics, usability and know-how. Finally, the general level includes educational possibilities, communication, quality of production output and safety. These subjective categories will be more described in the subjective valuation section below. On the financial level we have identified the following costs and benefits: Costs • Initial costs – includes cost for equipment, software, prerequisite education, packaging,
transportation, installation and construction costs. • Yearly costs – includes insurance and other extra expenses. • Sunk costs – includes costs that would occur even though the investment is not
performed, such as operation lights and tables. Benefits and Cost Savings • Yearly efficiency cost savings – includes essentially two major aspects. A digital OR
makes it possible to perform quicker operations and this also implies that there is a possibility of performing additional operations or potentially selling operations to other institutions.
• Yearly salary savings – includes salary savings that can be collected due to the fact that doctors can by them selves control most of the equipment and hence do not need an assistant in the same way as prior to the investment.
6.4 Financial Valuation The financial valuation can be performed in various ways. However, cost analysis seems to be included in most valuation techniques, which is the case with for instance the PENG and Ängelholm model. Merely making use of a cost analysis does exclude for instance the time value of financial means, potential future cash flows and flexibility. This is why the DMVDM includes real options analysis (ROA). The first two steps of the ROA, namely qualitative management screening and time-series/regression forecasting, are already assumed to have been performed in the strategic part and the cost/benefits and advantages/disadvantages part of the DMVDM. The next step is to perform a NPV calculation. When making use of the NPV technique in the public health care there are some changes and simplifications that can be done. Due to the fact that a public hospital in Sweden does not work according to profit driven goals and hence do not pay any taxes, there is no need to include taxes and tax shields in the calculation. Also, gross profits are usually associated with cost savings, but might also include profits, such as

39
selling operations to other hospitals. The resulting equation of calculating the free cash flow for each year can in the public health care be simplified from equation 1 and 2 down to:
Capital Working Net in ChangeesExpenditur Capital-Costs tiveAdministra&lGeneraExpensesSellingProfitsGross Flow Cash Free
±−−=
(9)
The free cash flows can now be discounted using the cost of capital used in the public health care. The cost of capital is relatively low due to the fact that there is no equity and that the loan rate is low. The estimated values that have been derived in calculating the financial costs and benefits of three digital OR similar to the investment being performed at the Ängelholm Hospital are presented in table 6. Table 6: Estimated values on benefits and costs Costs & Benefits Total Value Included criteria Initial costs 10,000,000 High-tech (AV, CONDOR, etc):
Endoscopy products: Installation, Packaging, Ceiling Assembly, Transportation: Microscope: Construction: (Educational costs are included)
1,900,000600,000
1,750,0001,250,0004,500,000
Yearly costs 700,000 Insurance: Extra expenses:
300,000400,000
Sunk costs 3,500,000 Yearly efficiency cost savings (from operational efficiency)
945,000 Number of yearly operations: Cost of an operation: Labour costs in percent: Efficiency savings in percent:
30030,000
70%15%
Yearly efficiency cost savings (from selling operations)
225,000 Number of yearly operations: Efficiency savings in percent: Benefit of sold operation:
30015%
5,000Yearly salary savings 400,000
Some of these entries have to be further explained. For instance, the sunk costs are costs that the hospital would have had even though the digital OR investment is not implemented. This includes for instance costs of operation lights and tables. The total value of 3,500,000 SEK is a mere estimation from information gathered during interviews. The yearly efficiency cost savings obtained from operational efficiency are derived from how much labour costs that can be utilized in other ways due to the investment. The Ängelholm Hospital is assigned to perform 300 operations every year and we have estimated the cost of one typical operation to be in the range of 30,000 SEK. Labour costs at the Ängelholm Hospital is estimated to be around 70 % and the investment is likely to enhance productivity by 15 %, which means that the hospital could perform an additional 45 (300 х 15 %) operations and hence saves 945,000 SEK (45 х 30,000 х 70 %) on labour costs. The efficiency cost savings from selling

40
operations are calculated as 45 х 5,000 SEK, which is an estimated guess of how much benefit the hospital can get from selling one operation to another hospital. Finally, the salary cost savings are savings from having one less person in the operation process due to the fact that the operating personnel now can control all the equipment by themselves. Note that we only assumed one less person even though there are three digital ORs included in the investment. The next step, which take place after the costs/benefits and advantages/disadvantages has been identified, is to decide whether a NPV and real options calculations needs to be performed. This depends on if the investment is being compared to another investment or if the valuation is done in isolation. If the valuation is done in isolation, both NPV and real options calculations needs to be done if future cash flows and flexibility exists. Nonetheless, if several investment possibilities are valued in comparison to each others it might or might not be the case that NPV or real option calculations are needed. Therefore, a valuation selection model has been developed in order to make the selection of techniques easier. This model is presented in figure 10 and starts with an obligatory cost analysis, which we already have done.
FinancialValuation ofEfficiency
(ROA/NPV)
Scoring Valuationof Effectiveness/
Performance
Costs/Benefits andAdvantages/Disadvantages
StrategicEvaluation
BalancedFinancial and
Scoring Valuation
Figure 10: Valuation Selection Model of DMVDM The next step is to check whether the investments being compared differ in flexibility. Examples of flexibility can for instance be that one investment can be abandoned, another expanded and a third contracted as time passes by and resolves uncertainties. If there is flexibility that differs, i.e. investments inhibiting various real options, both NPV and ROA are needed for a fair financial comparison. On the contrary, if the investments do not differ in flexibility or have no flexibility yet another question needs to be answered, namely if the

41
future expected cash flows differ. On the one hand, if the future cash flows are expected to differ a NPV calculation is needed and on the other hand a plain cost analysis is sufficient. The final two steps, namely the subjective and balanced valuation, will be treated in the following sections. We will from hereon assume that the valuation of the digital OR investment is being done in comparison to another type of investment where there is flexibility that differs and hence there is a need for NPV as well as ROA. When performing the NPV calculations a time horizon of 10 years was used and a discount rate of 5 %. The total initial cost was estimated to 6,500,000 SEK, which is derived as the initial costs minus the sunk costs. Also, the yearly costs used were constant at 700,000 SEK and yearly benefits at 1,570,000 SEK (945,000 + 225,000 + 400,000). Hence the present value of all future cash flows was, according to equation 3, derived as:
SEKr
FCFt
t
N
tt
t 909,717,6)05.01(
000,700000,570,1)1(
10
11=
+−
=+ ∑∑
==
The resulting NPV can now be calculated as 6,717,909 – 6,500,000, which gives us an expected positive NPV of 217,909 SEK. This means that according to these calculations the digital OR investment is “profitable”. In order to get a better understanding of how various input used in these calculations actually affect the resulting NPV or more specifically how changes in these inputs change the value of the NPV simulations and sensitivity analysis can be used. In the calculations performed on the digital OR a sensitivity analysis has been completed using most input present in the NPV calculations. Each variable included in the analysis was multiplied by 0.5 and 1.5, i.e. a decrease and an increase of 50 % respectively. When changing one variable all others were fixed to their initially given value. The result of this sensitivity analysis is presented in a tornado diagram, which is illustrated in figure 11.
-6,000,000 -4,000,000 -2,000,000 - 2,000,000 4,000,000 6,000,000
Initial costs:
Number of yearly operations:
Efficiency saving:
Cost of an operation:
Labour costs in percent:
Sunk costs:
Yearly salary savings:
Discount rate:
NPV (SEK)
Figure 11: Sensitivity analysis From the sensitivity analysis it can be concluded that the NPV is most sensitive to changes in initial costs, number of yearly operations and efficiency savings while being least sensitive to changes in the discount rate. The main reason why initial costs is the most sensitive input variable is that it includes several entries, such as equipment, education and construction costs, which results in relatively great changes on the NPV. Furthermore, due to the fact the discount rate is as low as 5 % means that the range in the sensitivity analysis only is between

42
2.5 % and 7.5 %, which apparently does not alter the NPV significantly. The sensitivity analysis does only present changes made in isolation (ceteris paribus) and does not account for any correlation between the inputs. To get a better understanding of these Monte Carlo simulations can be constructed and executed. In this calculation of the digital OR the simulation is skipped in order to focus on more relevant calculations of this valuation. The next step of the financial valuation consists of real options problem framing, modelling and analysis. Based on the overall strategic evaluation performed earlier it usually becomes apparent which strategic options that might be included in each investment, such as scaling options, option to defer, option to switch and so forth, which are described in table 2. Based on the identification of strategic options that exist for each investment or at a stage of the investment, the analyst can then choose from a list of options to analyze in more detail. To recap, real options are added to the investments to hedge downside risks and to take advantage of upside swings. As described earlier in the empirical chapter, there were two real options identified in Ängelholm investment. Firstly, there was an option to expand two of the operating rooms to fully utilize the enhancements of the digitalization. Secondly, the investment worked as a prerequisite of fully making use digital patient files and can hence be seen as a part of an option to invest in stages. In this valuation we have only included the expansion option and not the option to invest in stages due to the fact that this option needs much further research concerning the system of digital patient files to be evaluated. The expansion option is assumed to enhance upside swings with an additional 10 % in future cash flows with an extra cost of 1,000,000 SEK. Furthermore, the risk measure, namely the volatility of the underlying asset, was estimated to 30 % per year according to the educated guess approach recommended by Leuhrman (1998). In order not to overvalue the real option we selected the lowest value in his recommendation in the range between 30 % and 60 %. The option is assumed to have a life span of five years and hence, the upgrade option is not considered interesting after this time span. The risk-free rate is assumed to be around 4 %, according to the rate given by the Swedish National Debt Office. The calculation, using the binominal option pricing model, is presented in appendix B. The steps that were followed during this real options analysis was to fist calculate the up- and down-movement factors and the risk neutral probability. Thereafter, the evolution of the expected future cash flows was calculated using the input value of 6,717,909 SEK, which is presented as the evolution of the underlying in appendix B. The lattice calculations were executed using a tool called LatticeMaker, which is a free program delivered by investmentscience.com. The terminal nodes of the lattice, i.e. the nodes on year five, are thereafter multiplied by the expansion factor exp of 1.1 and subtracted by the exercise price X of 1,000,000 SEK. The value selected in the node is selected as max(S, S х 1.1 – 1,000,000), where S indicates the value of the current node. The rest of the nodes are calculated as max[(pSu+ (1-p)Sd)e-r, S х exp – X], where p, u and d represent the risk neutral probability, up- and down-movement factor respectively. The total value of the expected future cash flows including flexibility obtained was 6,845,409 SEK, which means that the flexibility value is 6,845,409 - 6,717,909 = 127,500 SEK. This implies that the total value of the NPV and the expansion option value sum up to 345,409 SEK (217,909 + 127,500).

43
The last lattice presented in appendix 2 describes the optimal decisions that must be taken during the life time of the option in order to optimally make use of the option value. If for instance, a manager does not act according to the decision lattice the option might become worthless. According to the optimal decision lattice the option should only be exercised during year five at the top three nodes and otherwise disregarded.
6.5 Subjective Valuation A subjective valuation is a valuation which is performed in using one or several persons’ opinions. The valuation is often performed on issues considered to be non-financial or hard to financially value and must be done in relation to other investments, i.e. there must be some type of reference in the valuation. If a subjective valuation is to be considered and if financial values are included in the total valuation, there is a need to make decision makers aware of the financial impact of scoring non-financial values. Therefore, we have taken the MBITI model one step further when scoring the effectiveness and performance. In the DMVDM the decision maker starts by analyzing the relative importance between the financial value and the subjective categories that were identified in the costs/benefits and advantages/disadvantages step of the process. The relative importance should be valued by distributing 100 points to the financial value and the subjective criteria. Thereafter, each criteria, financial as well as subjective, will be scored from -100 % to 100 %. However, before doing so it must be stated which financial value that should be considered to be 100 %. To derive a scoring value of the financial criterion between -100 % and 100 % of each investment we take the ratio between the financial value of current investment and the 100 % financial value. Thus, the selected 100 % financial value is recommend to be positive and must imply that the rest of the evaluated investments will end up with a value between -100 % and 100 %. Also, negative financial values should be represented in the range between -100 % and 0 %. To get a more clear view of this process we will continue with the valuation of the digital OR investment. In the valuation performed on the digital OR investment it was assumed that a net present value plus the flexibility value of 500,000 SEK was thought of as 100 % as a comparison value. Therefore, the value of 345,409 SEK is given a value of approximately 69 %. Before valuing any subjective criteria we need to weigh the importance of each criterion, including the financial one. The general criteria selected for this example valuation and their respective weights are presented in appendix C. Note that the criteria are given weights just to show an example of how the DMVDM can be used and the subjective valuation should be done at the institution where the valuation is taken place. After having decided upon the scoring value of the financial value and weighed each criterion it is possible to calculate the financial impact of setting subjective scoring values. The value of each percentage point is calculated as:
weightfinancial
value financial maxweightpointpervalue ×=100
(10)
To give an example using equation 10 we will calculate the value of each percentage point in valuing the satisfaction on a patient level obtained in implementing this particular investment. The weight given to this criterion is 6 and the maximal financial value is already stated to be 500,000 SEK. Also, the financial weight is assumed to be 20, i.e. the financial value is said to have a relative importance of 20 % in the current valuation model, which gives us a value per

44
point of 1,500 SEK. This value might be rather hypothetical, but does however give the decision maker a better understanding of setting subjective values and the financial implication in doing so. By setting a value of 30 % we can in theory assume that the decision maker is implicitly ready to pay 45,000 SEK in order to increase the patient satisfaction, which is obtained in making this investment. The score column which is presented in appendix C is the score given by multiplying the weight and the value of each criterion, which ends up in a scoring value that can be used in comparing individual criteria. Each of these points in our valuation has the same financial value of 25,000 SEK, which was decided when setting the maximal financial value of 500,000 SEK and a financial weight of 20. The total score of the subjective criteria in this example is 43.75, which has a financial value of 1,093,750 SEK. The combined results and valuation is discussed in the following section.
6.6 Balanced Financial and Subjective Valuation The MBITI model has, as previously discussed, three different resulting outputs; financial efficiency, scored effectiveness and a non-measurable performance. This could pose a great problem when choosing between two different investment possibilities. The model does not have any structured decision criteria when it comes to valuing one investment over another if for instance one investment has a rather high financial efficiency value and a low effectiveness score while another has a rather low financial efficiency value and a high effectiveness score. This could imply that the decision maker does not understand the financial implication of choosing one investment possibility over another. This is the main problem that has, to some extent, been solved by the DMVDM. The final result of the DMVDM can be illustrated using either the scoring value or the combined financial value. However, the financial value should not be viewed as the correct financial contribution of the analyzed investment, but does give an estimation on how the decision maker values the investment and should only be used when comparing multiple investment opportunities. The result in it self also has to be presented in an easy and understandable way similar to that of the PENG model and in accordance with the last step of the real options process. We have selected to present the result in two different figures using the financial values instead of the scoring values. The first figure, figure 12, gives a comprehensive view of the total costs and benefits and in this case the subjective advantages.
-
1,000,000
2,000,000
3,000,000
4,000,000
5,000,000
6,000,000
7,000,000
8,000,000
9,000,000
Costs Benefits
Valu
e (S
EK) Subjective Value
Flexibility Value
PV of FCFInitial Costs
Figure 12: Investment costs and benefits

45
The second resulting figure, figure 13, gives a better view of the expected positive contributions. Due to the relatively high initial costs and the present value of future cash flows, which is illustrated in figure 12, the flexibility and subjective value seems to have a fairly low contribution. However, when just looking at the positive contributions we get a better view of the situation.
-
200,000
400,000
600,000
800,000
1,000,000
1,200,000
NPV FlexibilityValue
NPV(total)
SubjectiveValue
Valu
e (S
EK) Subjective Value
Flexibility ValueNPV
Figure 13: Positive investment contributions In our results we have only presented the values of the digital OR and essentially this gives a good view of the financial impact, but the subjective and combined valuation should be compared to another investment, which is intended for.

46
7 CONCLUSIONS
This final chapter summarizes the results of this research and evaluates these in correspondence with the purpose of this thesis. Thereafter, the results are discussed in the dimensions of reliability and validity. Finally, some ideas of possible further research are pointed out.
7.1 Outcome of the Research This research, among many others, has identified the multiple difficulties associated with valuing modern technology and IT investments, especially within the public health care. Common difficulties might for instance include valuation of intangibles, making balanced and merged valuation and having an alternative measurement of success than maximizing shareholders’ wealth. This research was, in order to study these difficulties, divided into two sub-objectives. The first objective was to identify the most important aspects considering the valuation of an investment of a digital OR and to derive a model that could be used when valuing these kinds of investments within the public health care sector. The alternative model that has been constructed for this purpose is somewhat a combination of accepted theoretical valuation models where we have selected the parts that were considered most suitable for a valuation of a digital OR. The second objective was to make it possible for manufacturing companies such as Smith & Nephew to use this knowledge in order to improve and pinpoint the utility of their digital OR and hence strengthen their position on the market. The alternative model includes possible future cash flows and not only make cost analysis based calculations, therefore we claim that this model is making a fair and just valuation which in an advantageous way also can be used by Smith & Nephew to identify their strengths and weaknesses. Another important aspect was to identify how this derived model could be used from an investor’s point of view when choosing between various investment options. After interviewing presumptive investors from the health care sector we have gathered information in order to make the valuation model more practical to implement in this specific environment. The outcome of these objectives has resulted in an alternative valuation model, the DMVDM, which can be a substitute for methods currently used in the public health care sector.
7.2 Conclusions from the Result The conclusions that can be drawn from the new alternative valuation model is that the DMVDM can work as a guideline when a hospital in the public health care sector is allocating means for deciding upon which investments that should be implemented in order to maximize the patience utility and wealth fare. The DMVDM is not a completely new tool for valuation and decision making, but rather another step in enhancing the valuation process in the medical health care. The fact that different valuation models are used for different purposes, the DMVDM might not always be the optimal framework. For instance, several aspects of this model might be considered unnecessary when it comes to making a valuation between different bids in a public procurement. The enhancements that the DMVDM contributes with, compared to earlier research, are mainly the including of real option analysis in the financial valuation and that this model strives to solve the difficulties with having multiple output results. The real option analysis is a structured way to deal with and value flexibility and risk that is associated with each investment opportunity. The effort to find a combined output

47
result is grounded in how accepted theoretical models deal with this problem of different resulting outputs, or rather how they do not cope with this problem. This could lead to great problems when choosing between different investment possibilities. The DMVDM is a theoretical framework and a tool for valuation of investments similar to digital OR and modern technology investments which inhibits several intangible advantages. The valuation is based on numerous assumptions, which, if changed, can alter the final output value. How these possible changes affect the output is illustrated using a sensitivity analysis. This is done to give the model higher reliability, even though it has not yet been used in practice by a potential investor. Nonetheless, all financial figures and estimations are based on empirical collected information from different hospitals and other sources involved in this type of investment, which implies a relatively high credibility. The DMVDM is created to suit the needs for hospitals and similar institution when deciding upon different investment possibilities. However, manufacturing companies such as Smith & Nephew can use this model in order to motivate an investment by using arguments such as potential flexibility and identified future financial cash flows that comes with this investment. They can also argue the potential value of the subjective criteria. One of the drawbacks with the DMVDM are that the dynamic properties in the model is only associated with the financial valuation. For instance, when evaluating the investment progress one year after deciding on an investment uncertainties might become unresolved and this can lead to a variation in the value of different valuation criteria. The real options analysis does take this in consideration for the financial values but when, for instance, evaluating whether or not to expand the subjective values are not included. Furthermore, another aspect to take in consideration is that the including of real options analysis might be hard to comprehend. Nevertheless, we believe that the possibilities that come with the real options analysis are of greater value than the downsides in complexity. The reliability and validity of this research could be increased with an additional empirical research, especially when identifying practically used valuation models, such as the PENG model and the model used for the public procurement phase at the Ängelholm hospital. One question is how frequent these models are used and how wide spread they are in reality. However, we consider these models quite similar to generally accepted theoretical models and hence believe that our research can be argued to have considerable high reliability and validity.
7.3 Further research While creating the DMVDM a number of questions has come up, some of these questions have been out of the delimitation of this thesis and has therefore been excluded in the research. Nevertheless, we feel that some of these remaining research questions are of great value when performing further research in this area. One of these questions was if intangible values can be incorporated in real option analysis and hence be a part of the dynamic and flexible decision process. Also, there might be a need to further investigate how one can improve the use of public procurement methods in order to increase the fairness and correctness. There is yet another interesting research subject in how to optimally select set of investments depending on already implemented investments using portfolio methods suited for the public health care sector in order to minimize risk and maximize patient utility. When it comes to the DMVDM, we believe that more thorough research must be performed to evaluate the usability of this model in practice.

48
8 REFERENCES Andersen, I. (1998). Den uppenbara verkligheten, Lund: Studentlitteratur. (In Swedish)
Andresen, J. L. (1999). Evaluation of IT in the Danish Construction Industry, Technical University of Denmark, Department of Planning.
Andresen, J. L. (2001). A Framework for Selecting an IT Evaluation Method, Report: BYG DTU R-012, Danmarks Tekniske Universtiet
Bell, J. (2000). Introduktion till forskningsmetodik, Lund: Studentlitteratur. (In Swedish)
Bryman, A. and Bell, E. (2005). Företagsekonomiska forskningsmetoder, Liber Ekonomi. (In Swedish)
Brynjolfsson, E, Hitt, L (2000). Beyond computation: Information Technology, Organizational Transportation and Business Performance, Journal of economic perspectives-Volume 14, number 4-Fall 2000-p 23-48
Brynjolfsson, E, Hitt, L and Yang, S (2002). Intangible Assets: Computers and Organizational Capital, Brookings papers on economical activity, 1:2002
Carlsson, M. and Ring, F. (2005). Utvärdering baserad på PENG – Digitaliseringen inom Radiologiverksamheten inom SU, VGR, Sahlgrenska University Hospital. (In Swedish)
Carter, C, Thorpe, T and Baldwin, A (1999). ISoCCCrates Deliverable 3 – Benefits Assessment, Department of Civil and Building Engineering, Loughborough University
Chan Y-C, L (2004). Use of Capital Budgeting Techniques and an Analytic Approach to Capital Investment Decisions in Canadian Municipal Governments, Public Budgeting & Finance/Summer 2004
Cooper, R., Edgett, S. and Kleinschmidt, E. (2001) Portfolio management for new products, Oxford: Perseus
Copeland, T., Weston F. and Shastri K. (2005). Financial Theory and Corporate Policy. Pearson Addison Wesley, USA.
Hefce. (2006). http://www.hefce.ac.uk/Pubs/hefce/2003/03_17/03_17ab.doc (2006-04-10)
Jacobsen D. I. (2002). Vad, hur och varför? Lund: Studentlitteratur. (In Swedish)
Kaplan, K. and Atkinson, A. (1998). Advanced Management Accounting, Prentice Hall International, Inc.
Keen, P. (1991). Shaping the Future: Business Design through Information Technology. Harvard Business School Press, USA.
Larman, C. (2004). Agile & Iterative Development – A Manager’s Guide. Boston: Pearson Education.
Leslie, K. and Michaels, M. (1997). The real power of real options. The McKinsey Quarterly, No. 3, pp. 5-22.
Leuhrman, T. (1998). Investment Opportunities as Real Options: Getting Started on the Numbers. Harvard Business Review, July – August.
Mun, J. (2006). Real Options Analysis, Second edition. John Wiley & Sons, Inc., USA.

49
Myers, S. (1984). Finance Theory and Financial Planning. Interfaces, Volume 14, Issue 1, pp. 126-137, January/February.
Pakdil, F, Harwoodd, T (2005). Patient Satisfaction in a Preoperative Assessment Clinic: An Analysis Using SERVQUAL Dimensions, Total Quality Management, Vol. 16, No. 1, 15–30, January 2005 Department of Industrial Engineering, School of Engineering, Baskent University, Turkey
Renkema, T. (1998). The four P’s revisited: business value assessment of the infrastructure impact of IT investments. Journal of Information Technology, Edition 13, pp.181-190. Eindhoven University of Technology, The Netherlands.
Renkema, T. (1999). The IT value quest: how to capture the business value of IT-based infrastructure, John Wiley & Sons Ltd, England.
Roach, R. (2003). University of Pittsburgh opens Digital Operating Room - tech briefs - Brief Article. Black Issues in Higher Education, January 2, USA.
Smith & Nephew. (2005). 2005 Sustainability Report. USA.
Swart, R. (2005). Planning For the Rapidly Emerging Digital OR. Canadian Operating Room Nursing Journal, March, Canada.
Svavarsson, D. (2005). Evaluation of IT Platform Investments. Doctoral Thesis, School of Business, Economics and Law, Göteborg University. Intellecta Docusys, Sweden.
Sveriges rikes lag. (2005). Nordstedt juridik AB (In Swedish)
Thorén, T. (1996). Vetenskapsteori för nybörjare, Stockholm: Liber. (In Swedish)
Trigeorgis, L. (1993). Real Options and Interactions With Financial Flexibility, Financial Management, Autumn, Vol. 22, Issue 3.
Trost, J. (2005). Kvalitativa Intervjuer, Lund: Studentlitteratur, Third edition. (In Swedish)
Wallén (1996). Vetenskapsteori och forskningsmetodik, Lund: Studentlitteratur. (In Swedish)
Williamson, J. (2004). Arthroscopy sector scopes out tech advancements. Health care Purchasing News, February, USA.
Wilson, E., Rees, J. and Fordham, R. (2006). Developing a prioritisation framework in an English Primary Care Trust. Cost Effectiveness and Resource Allocation, Volume 4, 17 January, BioMed Central, Great Britain
Zeithaml, V., Parasuraman, A. and Berry, L. (1990). Delivering Quality Service Service: Balancing Customer Perceptions and Expectations, New York: Free Press corp.

Appendix A – Questions for Interviews
Interviews at Smith & Nephew, provider of digital operating rooms
1. Please give us a short briefing about yourself and your role within Smith & Nephew.
General questions about investments within the health care sector 2. What typically characterizes an investment decision process within the health care
sector? Who takes part in the decision-making?
3. Which are the deciding factors for health care sector investments?
4. Which costs comes with a surgery?
5. Where can one find information about costs within the health care sector? 6. How long is the time horizon for this type of investments within the health care
sector?
Digitalt OR 7. How much more endoscopy products can be generated by selling a digital OR?
8. Can your products be used in a digital OR from a competitor and vice versa?
9. Can the introduction of digital OR be compared to any other technical break through?
How was endoscopy introduced and when was this?
10. Are there any alternative solutions to digital OR?
11. How would you do to sell a digital OR?
12. Which are the advantages with a digital OR? (financial/non financial)
13. Which are the disadvantages with a digital OR? (financial/non financial)
14. Which are the risks in investing in a digital OR? (Which are the risks not to invest in a digital OR?)
Endoscopy 15. How would the procedure within endoscopy be affected by a digital OR?
16. Which are the differences between a digital OR and a non digital OR?
17. Which are the opportunities generated from a digital OR? (expansion, change of
technique, invest in different phases, etc.)

Appendix A – Questions for Interviews
Interviews at hospitals, presumptive purchaser of digital operating rooms
1. Please give us a short briefing about yourself and your role at the hospital. Questions about investment and the digital OR
2. What typically characterizes an investment decision process within the health care sector? Who takes part in the decision-making?
3. Which are, and how do you value:
a. Financial pros and cons? (Numbers?) b. Non financial pros and cons? (How are these weighted?)
4. How do you calculate the free cash flows? (Which are the extra costs and benefits
generated from a digital OR?)
a. How much does surgery time costs? b. How large are personnel costs in proportion to the total costs? c. How much do you think the efficiency will increase?
5. How are depreciations used within the public health care?
6. Are there any possibilities to expand with more digital OR? How would costs and
benefits differ from the present investment?
7. Do you think that there are any options generated from this type of investment?
8. Which are the common risks with an investment, especially with IT-investments?
9. Which risks did you take into consideration when evaluating this investment?
10. Which are the typical financial pros and cons?
11. How is flexibility within the alternative investments valued?
12. How are investments evaluated and financed?
13. Which weighted average cost of capital (WACC) is used? Why?
14. Which depreciation time is normally used when it comes to an investment like a digital OR?
15. How do you calculate the free cash flows?
16. What is your opinion about our hypothetic valuation model? (After shortly explain our
model)
17. Where can we get information (numbers) about costs within the health care sector?

Appendix B – Real Option Analysis (Option to Expand)
Binomial Option Pricing Model Inputs: Output: Present Value of FCF (S0): 6,717,909 NPV: 217,909 Volatility - Annual (σ): 30 % Flexibility Value: 127,500 Riskfree Rate - Annual (rf): 4 % Total Value: 345,409 Strike Price (X): 1,000,000 Time to Maturity - Years (t): 5 Expansion Factor: 1.1 Upmovement/Period (u): 1.35 Downmovement/Period (d): 0.74 Riskneutral Probability (p): 0.49 Period (Year)
0 1 2 3 4 5 Evolution of the Underlying 6,717,909 9,068,229 12,240,829 16,523,391 22,304,245 30,107,581
4,976,750 6,717,909 9,068,229 12,240,829 16,523,391 3,686,867 4,976,750 6,717,909 9,068,229 2,731,298 3,686,867 4,976,750 2,023,395 2,731,298 1,498,968
Option Valuation Lattice 6,845,409 9,303,932 12,667,647 17,274,761 23,573,880 32,118,339
5,009,472 6,787,053 9,214,332 12,549,550 17,175,730 3,686,867 4,976,750 6,717,909 9,068,229 2,731,298 3,686,867 4,976,750 2,023,395 2,731,298 1,498,968
Optimal Decision Lattice Open Open Open Open Open Expand Open Open Open Open Expand Open Open Open Continue Open Open Continue Open Continue Continue

Appendix C – Subjective and Balanced Valuation
Subjective Valuation
Financial Value (100 %) 500,000 Financial Value per Scoring Point: 25,000
Value Weight Score Value per point Total Value Total Financial Value: 345,409 69 % 20 13.82 5,000 345,409 Change in Patient level Satisfaction: 30 % 6 1.80 1,500 45,000 Contamination: 75 % 11 8.25 2,750 206,250 Waiting time: 50 % 11 5.50 2,750 137,500 Employee level Satisfaction: 50 % 9 4.50 2,250 112,500 Ergonomics: 60 % 7 4.20 1,750 105,000 Usability: 30 % 8 2.40 2,000 60,000 Know-how: 10 % 3 0.30 750 7,500 General level Educational possibilities: 50 % 5 2.50 1,250 62,500 Communication: 70 % 8 5.60 2,000 140,000 Quality of production output: 65 % 6 3.90 1,500 97,500 Safety: 80 % 6 4.80 1,500 120,000 51.82% 100 Total Subjective Value 43.75 1,093,750 Total Financial Value 13.82 345,409 Total Value 57.57 1,439,159
Appendix D – Example of a Public Procurement
FÖRFRÅGNINGSUNDERLAG - Utrustning till tre operationssalar för arthroskopi och ryggkirurgi vid Ängelholm sjukhus Detta förfrågningsunderlag är indelat i följande avsnitt:
A. Allmän orientering B. Upphandlingens genomförande C. Anbudsutformning D. Kravspecifikation E. Kommersiella villkor
Till förfrågningsunderlaget hör följande bilagor:
1. Kravspecifikation 2. Kommunikation RIS – Modaliteter inom Region Skåne 3. DICOM, Bildproducerande utrustningar
A. Allmän orientering Vänligen svara under respektive punkt att ni är införstådd med dess innebörd och i de fall svar krävs lämna svaret där eller referera till var i anbudet svar/information går att finna.
1. Region Skåne Region Skåne ansvarar för regional utveckling och regional service inom områdena hälso- och sjukvård, tandvård, kollektivtrafik, kultur- och utbildning, näringsliv, planering och miljö inom Skåne län. Information beträffande Region Skåne, dess organisation och verksamhet kan erhållas på Internet, "http://www.skane.se" . Svar:
2. Region Skånes kvalitetsarbete Region Skånes verksamhet baseras på de långsiktiga målen i Skånsk Livskraft - Tillväxt, Attraktionskraft, Bärkraft och Balans. Region Skånes kvalitetsdeklaration går att finna på "http://www.skane.se/kvalitet" . Svar:
3. Region Skånes miljöarbete Miljöarbetet inom alla Region Skånes verksamheter skall bedrivas i enlighet med "Miljöprogram för Region Skåne", se http://www.miljo.skane.se . Region Skånes leverantörer skall medverka till att målen i miljöprogrammet uppnås. Svar:
4. Upphandlande enhet Upphandlande enhet är Region Skåne, org nr 232100-0255, genom MA-Skåne. Svar:

Appendix D – Example of a Public Procurement
5. Upphandlingsobjekt och omfattning Upphandlingen avser köp av utrustning till operationssalar enligt kravspecifikation. Svar:
B. Upphandlingens genomförande
1. Upphandlingsform Denna upphandling följer Lagen (1992:1528) om offentlig upphandling (LOU) i de avsnitt som gäller för upphandlingar över tröskelvärdet (200 000 Euro). Upphandlingen genomförs som en öppen upphandling. Svar:
2. Sekretess Under själva upphandlingen gäller sekretess automatiskt, s k absolut sekretess. Detta innebär att inga uppgifter som rör anbud får lämnas ut, även om ett utlämnande inte skulle medföra någon skada. För tiden efter avslutat upphandlingsförfarande gäller följande: Om någon begär att få ut anbudshandlingar måste Region Skåne göra en prövning om
ett utlämnande kan ske i förhållande till olika sekretessregler. Region Skåne kan inte i förväg garantera att viss uppgift förblir sekretessbelagd, men
för att underlätta sekretessprövningen uppmanas anbudsgivare som önskar sekretess för uppgift i sitt anbud rörande egna affärs- och driftsförhållanden att tydligt ange detta tillsammans med skälen för en sådan begäran.
Denna sekretess gäller i högst 20 år efter det att den absoluta sekretessen under anbudsförfarandet upphört.
Om sekretesskyddade uppgifter förekommer i avtal mellan parterna gäller sekretessen i högst 5 år.
Svar:
3. Anbudsprövning Anbudsprövning genomförs i två steg. Först sker en prövning av anbudsgivaren. Därefter sker en prövning/utvärdering gentemot uppställda bedömningskriterier. Anbud som inte uppfyller samtliga ställda skall-krav kommer inte att behandlas. Svar:
4. Kontroll av anbudsgivaren Anbudsgivare kan uteslutas från upphandlingen om han eller hon är i konkurs eller likvidation, är under tvångsförvaltning eller är föremål för ackord-
eller tills vidare har inställt sina betalningar eller är underkastad näringsförbud. är föremål för ansökan om konkurs, tvångslikvidation, tvångsförvaltning, ackord eller
annat liknande förfarande. är dömd för brott avseende yrkesutövningen enligt lagakraftvunnen dom. har gjort sig skyldig till allvarligt fel i yrkesutövningen. inte har fullgjort sina åligganden avseende socialförsäkringsavgifter eller skatt i det

Appendix D – Example of a Public Procurement
egna landet eller i det land där upphandlingen sker. Anbudsgivare intygar genom att anbud undertecknas av behörig, att förhållanden under denna punkt inte föreligger vid anbudslämnandet. Svar:
5. Kontroll av registrering Region Skåne skall kontrollera om anbudsgivaren är: registrerad i aktiebolags-, handels- eller föreningsregistret. registrerad för redovisning och inbetalning av mervärdesskatt, innehållen preliminär
A-skatt och arbetsgivaravgifter, och fri från skulder för svenska skatter och sociala avgifter. Anbudsgivare skall styrka förhållandena under denna punkt genom att till anbudet bifoga av skattemyndigheten ifylld blankett SKV 4820, ”Begäran om upplysningar
offentlig upphandling”, vilken kan hämtas på "http://www.skatteverket.se" . Då blanketten endast är tillämpbar i Sverige skall utländsk anbudsgivare insända motsvarande dokumentation som intyg på att denna fullgjort i hemlandet föreskrivna registreringar och betalningar, samt
kopia på företagets gällande registreringsbevis utfärdat av behörig officiell myndighet (motsvaras i Sverige av Bolagsverket).
SKV 4820 skall inte vara daterad tidigare än en månad före datum för detta förfrågnings-underlag. Svar:
6. Anbudsgivarens tekniska förmåga och kapacitet Referenser lämnas avseende liknande uppdrag som utförts under den senaste 2-årsperioden. Anbudsgivare lämnar även beskriva av företagets serviceorganisation och reservdelsförsörjning. Om anbudsgivare avser anlita underleverantörer för genomförandet av uppdraget skall detta tillsammans med omfattning anges i anbudet. Normal inställelsetid för felavhjälpning anges. Svar:
7. Anbudsgivarens finansiella och ekonomiska ställning Anbudsgivare och eventuella underleverantörer skall ha en stabil ekonomisk bas och ha tillgång till resurser som svarar mot anbudets omfattning och innehåll. Anbudsgivaren skall i sitt anbud styrka sina ekonomiska förutsättningar genom fastställda årsredovisningar inkl undertecknade revisionsberättelser alt balans- och resultaträkningar avseende de två senaste räkenskapsåren.

Appendix D – Example of a Public Procurement
Anbudsgivaren skall på begäran lämna information om vilka bankgarantier eller motsvarande som kan ställas som säkerhet. Anbudsgivaren skall redovisa omsättning av sådana tjänster eller varor som upphandlingen avser för de två senaste räkenskapsåren. I anbudsgivarens årsredovisning kommer nyckeltal som kassalikviditet och soliditet att kontrolleras. Kassalikviditeten bör vara minst 1,0 och soliditeten bör vara minst 15 procent I det fall lägre nyckeltal redovisas skall anbudsgivaren i anbudet lämna, eller på begäran lämna, en sådan förklaring att det kan anses klarlagt att anbudsgivaren innehar motsvarande ekonomisk stabilitet. Anbudsgivaren skall på begäran redovisa kvartals- och/eller delårsrapport. Förändringar av nyckeltalen under innevarande verksamhetsår bör inte vara sådana att dessa innebär väsentliga förändringar av anbudsgivarens ekonomiska stabilitet jämfört med den som redovisats i senaste årsredovisningen. Region Skåne skall ha möjlighet att kontrollera anbudsgivarens uppgifter. Kontrollen kan innebära att det aktuella bolagets/ens revisorer och/eller bank kontaktas och att en kassaflödesanalys genomförs. Svar:
8. Anbudsgivarens kvalitetsarbete Anbudet bör innehålla en beskrivning över anbudsgivarens kvalitetsarbete. Handling som styrker certifiering eller pågående certifieringsarbete bör bifogas anbudet. Svar:
9. Anbudsgivarens miljöarbete Anbudsgivaren bör presentera sitt interna miljöarbete. Kopia på certifikat, policy eller andra dokument som styrker informationen bifogas anbudet. Svar:
10. Bedömningskriterier Region Skåne kommer att anta det anbud som uppfyller ställda krav och som bedöms vara det ekonomiskt mest fördelaktiga med hänsyn till de poängen i kravspecifikationen:
1. Antal poäng från krav (64 poäng) 2. Priset (6 poäng) (gäller på all begärd utrustning) Poängsättning av priset går till på följande vis: Lägst pris får 6 P
De andra anbudens pris får PoängprisLägst 6
pris anbudents andra De∗
Anbudet som får högst antal poäng kommer att antas. Anbud kan komma att antas helt eller delvis.

Appendix D – Example of a Public Procurement
Avtal tecknas med anbudsgivare som offererat all utrustning. Avtal kommer att tecknas med en anbudsgivare. Svar:
11. Avbrytande av upphandling Region Skåne förbehåller sig rätten att avbryta denna upphandling, om politiska beslut fattas eller organisatoriska förändringar sker, som påverkar eller förändrar förutsättningarna för upphandlingens fullföljande. Svar:
12. Underrättelse om beslut Region Skåne underrättar snarast möjligt såväl den vars anbud antagits som övriga anbudsgivare om beslutet. Svar:
13. Upplysningar Kontaktperson för denna upphandling: Inköpare Per Molin, MA-Skåne Tel: 040-33 29 67 E-post: [email protected] Fax: 040-33 62 22 Frågor angående denna upphandling skall ställas skriftligt och kan komma att tillsammans med svaren delges samtliga anbudsgivare. Eventuella frågor bör vara inkomna senast 2006-02-14 för att Region Skåne skall kunna behandla frågan och ge svar till alla berörda. Svar:
C. Anbudsutformning
1. Anbudets form och innehåll Anbud skall vara skriftligt, avfattat på svenska, samt vara egenhändigt undertecknat av behörig hos anbudsgivaren. Eventuell fullmakt skall bifogas. Komplett anbud skall lämnas i ett (1) original och fem (5) kopior. Anbud, exklusive broschyrer, bör även avges på diskett eller CD-rom. Anbudsgivaren ansvarar för att innehållet i disketten är rätt och att det inte skiljer sig från det skriftliga anbudet. Årsredovisning behöver endast bifogas originalanbudet. Ofullständigt anbud kan innebära att anbudsgivaren utesluts från upphandlingen. Svar:

Appendix D – Example of a Public Procurement
2. Märkning av anbudet Anbud och ytterkuvert märks tydligt med ANBUD MA/050306. Svar:
3. Anbudsadress Anbud som skickas som brev sändes till postadress: MA-Skåne Ystadsgatan 53 E 205 02 Malmö För anbud som lämnas under kontorstid genom bud eller paket gäller följande adress: MA-Skåne Ystadsgatan 53E Malmö Svar:
4. Anbudstidens utgång Anbud skall vara MA-Skåne, tillhanda senast 2006-02-27. Anbud som kommit in för sent får inte prövas av Region Skåne. Svar:
5. Anbudets giltighet Anbudet skall vara bindande t o m 2006-09-30. Svar:
6. Uppställning av anbudet För att underlätta hanteringen och värderingen av anbuden bör anbudsgivaren dela in anbudet enligt följande:
A. Anbudsgivarens namn och adress samt kontaktperson B. Eventuell allmän presentation av anbudsgivaren C. Svar/uppgifter/intyg enligt B. Upphandlingens genomförande D. Svar/uppgifter enligt D. Kravspecifikation E. Svar/uppgifter enligt E. Kommersiella villkor F. Eventuella bilagor Svar:
D. Kravspecifikation Se bilaga kravspecifikation. Svar:

Appendix D – Example of a Public Procurement
E. Kommersiella villkor
1. Pris Priser skall vara fasta, utan indexreglering, och utsatta i svenska kronor (SEK), exklusive mervärdesskatt. Priser skall, i förekommande fall, inkludera kostnader för emballage, försäkring, tull, transport och installation. Eventuell valutajustering kan endast ske från och med avtalsdatum till och med avtalad leveranstid. Svar:
2. Betalningsvillkor Fakturering skall ske efter godkänd leverans. Betalningsvillkor 30 dagar netto efter mottagen korrekt faktura och godkänd leverans. Faktureringsavgifter och expeditionskostnader accepteras ej. I övrigt gäller räntelagen. Svar:
3. Leveranstid Installationstid och leveranstid anges. Exakt leveranstid bestäms i samband med avtalstecknande. Svar:
4. Leveransvillkor Leverans skall ske enligt DDP (Sjukhus x i x) Incoterms 2000. Emballage och installation ingår. Svar:
5. Uppdatering Förbättringar eller ändringar som görs på utrustningen mellan beställnings- och leveransdatum skall efter vårt godkännande införas utan kostnad. Svar:
6. Studiebesök Anbudsgivaren skall ange minst två datum i vecka 11 och 12 då det finns möjlighet för upphandlingsgruppen att genomföra ett studiebesök. Studiebesöket är mycket viktigt eftersom vissa punkter i kravspecifikationen enbart kan utvärderas genom prövning. Svar:

Appendix D – Example of a Public Procurement
7. Vite Vid leveransförsening skall vite utgå med 1 % per påbörjad vecka. Dock högst 10 %. Svar:
8. Hävning Beställaren äger rätt att med omedelbar verkan häva ingånget avtal om: antagen leverantör i väsenligt hänseende underlåter att utföra sina åtagande om rättelse inte sker utan dröjsmål efter skriftlig erinran antagen leverantör begärs eller försätts i konkurs, ansöker om ackord eller träffar
ackordsuppgörelse Hävning av avtal skall ske skriftligt. Svar:
9. Katastrof och beredskap Antagen leverantör skall med alla till buds stående medel verka för att klara av sina leveranser vid beredskaps- och krigsförhållanden samt i katastrofsituationer. Force majeure-klausulen nedan träder i kraft först när leverantören fullgjort sina skyldigheter enligt ovan. Svar:
10. Force Majeure Parterna är befriade från åtagande om parts respektive åtagande förhindras av force majeure-karaktär. Som force majeure räknas krig, omfattande arbetskonflikt, blockad, eldsvåda, miljökatastrof, allvarlig smittspridning eller annan omständighet som parterna inte råder över och som förhindrar part att fullgöra sina skyldigheter enligt detta avtal. Arbetskonflikt som har sin grund i brott mot kollektivavtal får inte åberopas som befrielsegrund. Motpart skall omedelbart underrättas om det föreligger omständigheter som kan föranleda tillämpning av denna bestämmelse. Svar:
11. Intrång Antagen leverantör skall hålla beställaren skadeslös för alla skadeanspråk, ersättningskrav, kostnader och utgifter som följd av intrång i eventuella patent, upphovs-, mönster- och varumärkesrätter eller andra skyddade rättigheter tillhörande tredje man. Svar:
12. Överlåtande av avtal Antagen leverantör får inte överlåta avtal på annan utan Region Skånes skriftliga medgivande. Svar:

Appendix D – Example of a Public Procurement
13. Tvist Tvist angående tolkning och användning av eventuellt avtal och som ej kan lösas av parterna gemensamt skall avgöras av allmän domstol med tillämpande av svensk lag. Svar: MA-Skåne Per Molin Inköpare