valuation of intellectual capital and real option...
TRANSCRIPT
Valuation of Intellectual Capital and Real Option Models
Sudi Sudarsanam Professor of Finance & Corporate Control
Cranfield School of Management Cranfield University Cranfield MK43 0AL
Dr Ghulam Sorwar Lecturer in Finance
Cardiff Business School Cardiff University
&
Bernard Marr Research Fellow in the Centre for Business Performance
Cranfield School of Management Cranfield University Cranfield MK43 0AL
Paper presented to PMA Intellectual Capital Symposium, 01-02 October 2003 at Cranfield University.

Valuation of Intellectual Capital and Real Option Models
Abstract
Intellectual capital is an increasingly major component of the total capital of firms as firms move from manufacturing and industrial activities towards services and knowledge-based activities. Relative to the other components of a firm’s capital such as physical and monetary capital, intellectual capital is more difficult to define, measure, manage and value. Yet given the profound importance of such assets to firm’s competitive advantage and value creation capabilities, serious attempts need to be, and increasingly are, made to establish clear definitions, measurement rules and valuation principles. In this paper we discuss intellectual capital from a valuation perspective. We examine the nature of such capital and why traditional valuation methods fail to reflect the unique characteristics of ICs. We develop a valuation perspective based on the real option models that have been extended from their origins in financial asset valuation to the valuation of firms’ growth opportunities. Intellectual assets embody these opportunities contributing to both their evolution over time and their realisation in future. This approach provides a richer framework to analyse the issues that confront the valuation of ICs.

Valuation of Intellectual Capital and Real Option Models 1. Introduction
Intellectual capital represents a collection of intangible assets also known as
knowledge assets. These assets distinguished from physical assets such as property,
plant and equipment (PPE) or stock and financial assets such as receivables,
investments and cash have become increasingly important as key resources of firms in
their competitive strategies. In today’s complex and turbulent business environment
companies are required to be flexible, highly innovative and able to develop pro-
active strategic approaches. To reach these aims many organisations have realised that
knowledge (underlying capabilities) represents the most important factor in creating
economic value that underpins a firm’s value creation performance (Marr, Schiuma
and Neely, Jl of BPM, 2002).
Paul Krugman argues that in the past businesses primarily invested in the
tangible means of production e.g. buildings and machines. The value of a company
was at least somewhat related to the value of its physical capital. But now businesses
increasingly invest intangibles. Once you have designed a chip, or written a code for a
new operating system, no further investment is needed to ship the product to yet
another customer. “The intangibility of a company’s most important assets makes it
extremely hard to figure out what that company is really worth. That may partly
explain the nauseating volatility of stock prices” (New York Times, 22, October
2000).
Krugman’s observation reflects the phenomenal growth in the market values
of some of knowledge driven Internet companies in the second half of the 1990s and
the subsequent crash of 1999-2000. The ascent of stock markets around the world
driven by dotcom companies was as spectacular as the crash. This experience is a

potent reminder of the perils of overvaluation of knowledge rich companies. Bio-
technology companies that sought to exploit new advances in bio sciences to create
new drugs and cures had been similarly overvalued only to experience dramatic falls
in their values.
The merger of AOL the Internet service with a more mature media company
Time Warner in 2001 provides a cautionary tale in valuing knowledge-based
companies. When the friendly merger of equals was announced in January 2000 the
combined market capitalisation of the two entities was $288bn. When the deal was
consummated in January 2001 it was $205bn. By the middle of 2003, the merged
firm, AOL Time Warner, was valued at just $74bn. 74% of the value of the two firms
had been wiped out. While part of the decline was due to the general decline of stock
markets, given the size of the firm the stock market decline itself is partly due to the
value decline of AOLTW. An analysis of the valuation metrics used at the time of
merger announcement and merger consummation shows that they were based on
extraordinary and wildly exuberant optimism (Linda Applegate, Valuing the AOL
Time Warner Merger, HBR case 9-802-098, 2002).
It is starkly apparent from cases like the AOL Time Warner merger that tools
for valuation of knowledge-based companies are woefully inadequate. The traditional
valuation tools such as relative valuation multiples such as price earnings ratio (PER)
or enterprise value to EBITDA do not fully capture how intellectual capital
contributes to firm value. Although the discounted cash flow represents a more
sophisticated approach to valuation than one based on multiples, it does not
adequately or correctly address the complexities that intellectual capital-based
competitive strategies engender. For example managerial flexibility in expanding,
abandoning or deferring investments while awaiting new information is an important

strand of corporate strategy but hardly incorporated in the traditional DCF model.
These models make assumptions about the future, which are far too static or only
hazily mapped out.
Intellectual assets provide firms with a range of options that managements can
exercise flexibly over time. Such flexibility itself is a source of value since it helps
managers avoid decisions that lock into negative value outcomes. Real option models
(ROM) provide a means of valuing these options. Extended from the financial
markets where option pricing models (OPMs) have been used to value options on
financial assets such as stocks, bonds and currencies, ROMs can provide useful
insights into corporate competitive strategies, the place of intellectual capital in such
strategies and how they affect corporate value. In this paper we develop a framework
of intellectual capital valuation based on real option models. We describe the basic
characteristics of ROMs, contrast them with the traditional models and discuss how
they can provide a superior approach to valuation of knowledge assets. We also
indicate the limitations of this approach, highlight the model implementation issues
and suggest how some of these may be addressed in practice.
The paper is divided into the following sections. Section 2 defines intellectual
capital and its various components. It identifies the different types of intellectual
assets and describes their characteristics. In Section 3 we introduce real option models
and contrast them with the traditional models. Section 4 brings intellectual assets into
the real options framework and identifies the option-like characteristics of such assets.
It also discussed how some of these assets may be valued using ROMs. It points to
limitations of ROMs in their application to intellectual assets and suggests how these
may be overcome in practice. Section 5 provides a summary and conclusions.
2. Intellectual capital, intellectual assets and intangibles

2.1 Definitions and classification
Marr and Schiuma (2001) define intellectual capital (IC) as “the group of
knowledge assets that are attributed to an organisation and most significantly
contribute to an improved competitive position of this organisation by adding value to
defined stakeholders”. There is some confusion over how intellectual capital (IC)
differs from intangibles, intangible assets or intellectual property. Another term to
describe the same assets is knowledge assets. In this paper we use the terms
intangibles, IC, intellectual assets and knowledge assets interchangeably. Intellectual
property (IP) is a subset of IC. IP comprises assets such as patents, copyrights and
trademarks and its property rights are established under the law and ownership of IP
may be transferred. Often there may be a secondary market in IP. In contrast, other
intangibles such as goodwill, R & D, organisational capital etc may be too embedded
within organisations to be tradeable separately. Their ownership may, however, be
transferred as part of the organisation in which they are embedded.
IC is a broad concept that is often split into different categories – most
commonly human, relational and structured capital. Knowledge assets are seen as a
resource that underpins capabilities, which in turn can be transformed into core
competencies. Subsequently, these core competencies allow organisations to execute
(and identify) their strategy in order to achieve better business performance. The
attempt to operationalise the concept of knowledge has led academics as well as
practitioners to define new concepts to identify, classify and manage knowledge
resources of organisations. In order to define knowledge assets one needs taxonomies
which facilitate an understanding and help evaluating such organisational components
(Edvisson and Malone, 1997; Stewart, 1997; Williams and Bukowitz, 2001). The
taxonomy used in this research is based on earlier classifications provided by a

research stream on intellectual capital and intangible assets (Stewart, 1997; Stewart,
2001; Sveiby, 1997; Roos et al. 1997; Brooking, 1996; Lev, 2001). However, taking
a knowledge based view of the firm these taxonomies where brought together to build
a comprehensive framework: the knowledge asset map (Marr and Schiuma, 2001;
Schiuma and Marr, 2001; Marr et al. 2002).
Most classifications of knowledge assets (and intellectual capital) proposed in the
management literature are particularly useful for accounting and external reporting
purposes. However, they do not necessarily provide managers with meaningful tools
to manage the company’s knowledge from an internal perspective. The knowledge
assets map developed by Marr and Schiuma (2001) provides managers with a broader
framework to evaluate the organisational knowledge from both an external and
internal point of view. It is based on a broader interpretation of intellectual capital
(IC) addressing the assessment of all knowledge assets in a company. The knowledge
assets map facilitates the identification and definition of the critical knowledge areas
of a company.
The knowledge assets map is based on an interpretation of a company’s knowledge
assets as the sum of two organisational resources: stakeholder resources and structural
resources. This distinction reflects the two main components of an enterprise, (1) its
actors, who can be internal or external to the organisation, and (2) its constituent
parts, i.e. the elements at the basis of the organisation’s processes. Figure 1 illustrates
the hierarchy of knowledge assets with its sub-classifications. Stakeholder resources
are divided into stakeholder relationships and human resources. The former identifies
all external actors of a company while the latter represents internal actors. Structural
resources are split into physical and virtual infrastructure, which refers to their
tangible and intangible nature respectively. Finally, virtual infrastructure is further

sub-divided into culture, routines & practices, and intellectual property. The six
categories of knowledge assets identified by the knowledge assets map are defined in
further detail below.
Stakeholder relationships include all forms of relationships of the company with its
stakeholdersi. These relationships could be licensing agreements, partnering
agreements, financial relations, contracts and arrangements about distribution
channels, as well as informal relationships. The stakeholder relationships also include
customer loyalty, company names and brand image, which represents a fundamental
link between a company and its stakeholders.
Human Resource contains knowledge provided by employees in forms of
competence, commitment, motivation and loyalty as well as in form of advice or tips.
Some of the key components are know-how, technical expertise, and problem solving
capability, creativity, education, attitude, and entrepreneurial spirit.
Figure 1. Knowledge Assets Map.
StakeholderRelationships
HumanResources
StakeholderResources
PhysicalInfrastructure
Culture Routine& Practices
Intellectualproperty
VirtualInfrastructure
StructuralResources
KnowledgeAssets

Physical infrastructure comprises all infrastructure assets, such as structural layout
and information and communication technology like computers, servers and physical
networks.
Culture embraces corporate culture and management philosophies. Some important
components are the organisation’s values, the networking practices of employees as
well as the set of mission goals. Culture is of fundamental importance for
organisational effectiveness and efficiency since it provides the organisation’s
members with a framework in which to interpret events. The culture provides
organisations with a framework that encourages individuals to operate both as an
autonomous entity and as a team in order to achieve the company’s objectives.
Practices & Routines include internal practices, virtual networks and routines, i.e.
tacit rules and procedures. Some key components are process manuals providing
codified procedures and rules, tacit rules of behaviour as well as management style.
Practices and routines determine how processes are being handled and how workflow
processes flow through the organisation.
2.2 Intellectual capital and competitive strategies
Within the resource-based view of competition, intellectual capital may be an
important source of competitive advantage. In their article introducing the dynamic
capability approach Teece et al. (1997) distinguish (a) models of strategy as
emphasising the exploitation of market power, such as competitive forces (Porter,
1980) and strategic conflict (Sharpiro, 1989), and (b) models of strategy emphasising
efficiency, such as the resource based perspective (Penrose, 1959; Wernerfelt, 1984)
and the dynamic capabilities approach. For the research presented in this article we
take a strategy view of emphasising efficiency consistent with the Schumpeterian
view of the world. This view of innovation-based competition, increasing returns and

development of strategic competence was first framed by Edit Penrose (1959) and
then later picked up by Birger Wernerfelt (1984) and Richard P. Rumelt (1984) who
are seen as developers of the modern resource based view of the firm (Foss, 1997).
The resource based view understands firms as heterogeneous entities characterised by
their unique resource bases (Nelson and Winter, 1982) with different distinctive
competencies (Selznick, 1957). This means that strategist had to move away from a
black-box view of the firm and match external opportunities with company’s
capabilities (Andrews, 1971). Furthermore, transaction cost theories show that
organisations should concentrate on core capabilities and not necessarily use excess
capabilities to enter a multi-product or diversification strategy (Teece, 1980;
Montgomery and Wernerfelt, 1988). This means that firms need to strategically
develop their resources in order to gain a competitive advantage and therefore
increase their performance (Petergraf, 1993). Firms need to identify and develop the
competencies and capabilities which drive their performance (Prahalad and Hamel,
1990; Teece et al. 1997).
All organisational capabilities are based on knowledge (Marr and Schiuma, 2001;
Winter, 1987). Hence, knowledge is a resource that forms the foundation of a
company’s capabilities. The ownership of specific knowledge provides organisation
with specific capabilities (Leonard-Barton, 1992; Prahalad and Hamel, 1990). This
means that the ownership of knowledge enables specific capabilities and therefore
only the management of this knowledge allows an organisation to identify, maintain
and refresh its competencies over the time. The basis of the knowledge-based view of
the firm is therefore the fact that competition is based on capabilities and
competencies (Stalk et al. 1992) which are underpinned by knowledge (Grant, 1997;
Grant, 1996a; Grant, 1996b; Spender and Grant, 1996; Spender, 1996b; Skyrme,

1996).
The performance capacity of a company is hence based on the knowledge of its
people (Savage, 1990) as well as on the collective or organisational knowledge (von
Krogh et al. 1994). This explains why companies are thriving to become learning
organisations pursuing the objective of continuous development of their knowledge
assets (Senge, 1990).
2.3. Intellectual assets, growth opportunities and value of a firm
A firm’s value is made up of contributions from the various components of its
asset portfolio. Physical assets and monetary assets generate income, profits and cash
flows by enabling it to produce, market and sell its goods and services. These are sold
to identifiable customers in existing markets. On the other hand certain types of assets
do not have immediate and measurable payoffs. Investments in these assets are aimed
to enable the firm to produce goods or services some time in the future but the
outcomes are subject to much uncertainty. Thus these investments are intended to
secure and exploit future growth opportunities. Thus
Firm value = value of assets in place
+ value of future growth opportunities from assets already in place
+ value of future growth opportunities from new assets (1)
An example of the second component is a patent that resulted from R & D
investments already made. An example of the third component is a product that may
be discovered or developed from future investments that may be made. Both the
second and third components are largely path-dependent and derive from the firm’s
accumulation of resources and capabilities from past investments although
occasionally, a firm may chance upon these growth opportunities. Future growth

opportunities allow a firm to create new knowledge leading to new products and
services and new markets hitherto unknown. In the words of Hamel and Prahalad,
while assets in place and the growth opportunities they create enable a firm to
compete for the world as it exists, future investment in assets that can generate growth
opportunities enable a firm to compete for the future.
Research and development leading to innovations must be valued for their
potential contribution to the generation of valuable growth opportunities. Investments
in activities to generate future growth opportunities may lead to subsequent
investments in intangibles as well as tangible assets necessary to exploit the growth
opportunities. Thus research investment is the first stage of a sequence of investments.
The first stage investment is somewhat speculative with no guarantee that it will
successfully result in exploitable growth opportunities e.g. a new design, drug or
process. In making the first stage investment a firm is merely buying an option.
Valuation of the first stage investment cannot be completed without valuing the
payoffs from the subsequent stage investments. In valuing the initial investment as an
options we also have to allow for the possibility that in certain unfavourable states of
nature i.e. when it is not worthwhile to continue to maintain the option it may be
abandoned.
In the following sections we describe the various traditional models for valuing
intellectual assets and then introduce the real options models. We discuss the
similarities between real options and intellectual assets and identify those intellectual
assets that may be amenable to valuation using real options models.
3. Valuing intellectual assets
3.1. Traditional valuation models
To value any asset we need to identify an income stream clearly identified with

that asset. Alternatively the value of that asset may be determined through buy-and-
sell transactions in a market. In the case of some of the intellectual assets such as
patents or licenses for know-how, such transactions often take place but the
transaction prices may often be negotiated by the buyer and seller. An active and
competitive secondary market with numerous buyers and sellers may not exist in most
intellectual assets. Apart from intellectual properties referred to above, intellectual
assets may therefore have to be valued in other ways. Even in the case of traded assets
such as patents, the buyer and seller need to value them before entering into the
purchase or sale transaction.
Valuation models may be broadly divided into two kinds:
• Models that estimate the aggregate value of IC at a point in time. They thus
estimate the value of the accumulated intellectual assets. These models do not
differentiate the temporal differences in the accumulated intellectual assets or
the differences among different categories of intangibles at the time of
valuation. Lev’s residual income model, Tobin’s q model and market value less
book value model belong in this group. We may call these static models.
• Models that value the investments in intangibles each at a time. Discounted
cash flow models and real option models belong in this group. We may call
these dynamic models.
3.2 Static valuation models
Lev’s residual income model
A major problem with intellectual assets is therefore their embedded nature that
disallows the development of secondary markets. They are part of a bundle of
physical, financial and intellectual assets. One approach is to value the bundle as a
whole and then subtract the values of the physical and financial assets to arrive at the
value of the intellectual assets. Baruch Lev (2001) adopts this approach by matching
the earnings to assets that generate them. From the after-tax earnings of the firm as a
whole, Lev subtracts after-tax earnings attributable to financial assets and after-tax
earnings attributable to physical assets. The residual earnings are then attributed to
intellectual or knowledge capital and capitalised at an appropriate discount rate that
Lev derives from correlation analysis of IC earnings and equity returns.
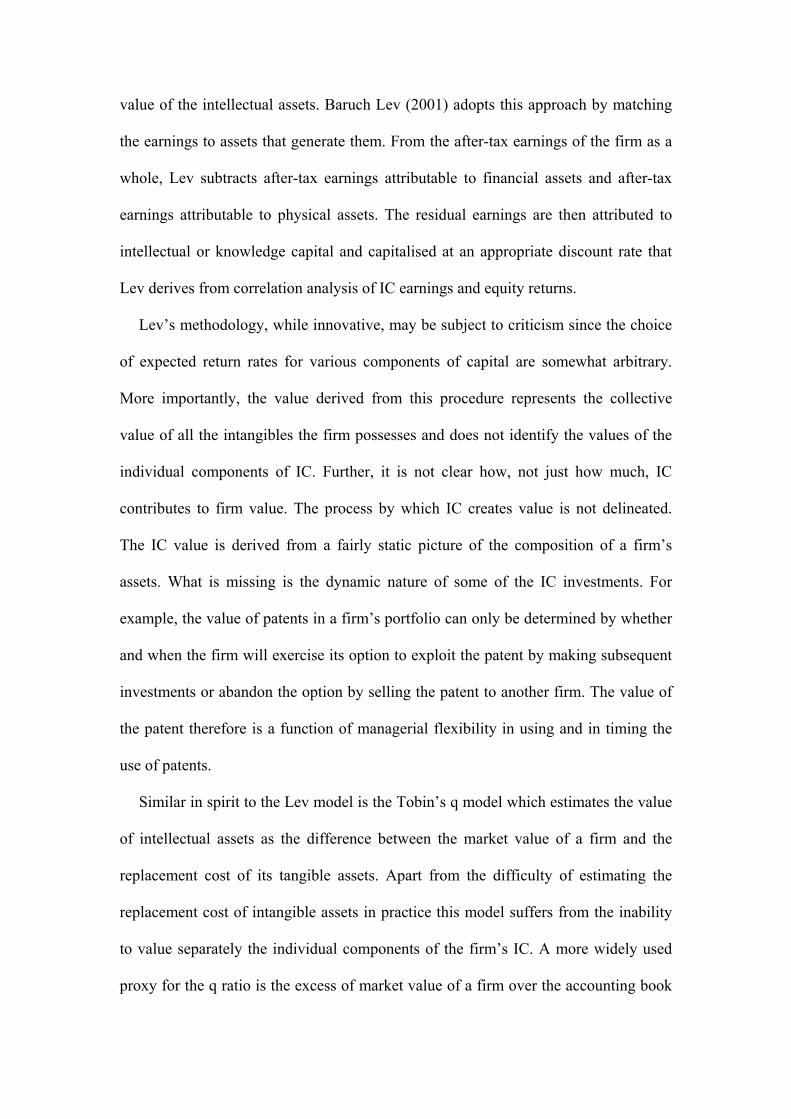
Lev’s methodology, while innovative, may be subject to criticism since the choice
of expected return rates for various components of capital are somewhat arbitrary.
More importantly, the value derived from this procedure represents the collective
value of all the intangibles the firm possesses and does not identify the values of the
individual components of IC. Further, it is not clear how, not just how much, IC
contributes to firm value. The process by which IC creates value is not delineated.
The IC value is derived from a fairly static picture of the composition of a firm’s
assets. What is missing is the dynamic nature of some of the IC investments. For
example, the value of patents in a firm’s portfolio can only be determined by whether
and when the firm will exercise its option to exploit the patent by making subsequent
investments or abandon the option by selling the patent to another firm. The value of
the patent therefore is a function of managerial flexibility in using and in timing the
use of patents.
Similar in spirit to the Lev model is the Tobin’s q model which estimates the value
of intellectual assets as the difference between the market value of a firm and the
replacement cost of its tangible assets. Apart from the difficulty of estimating the
replacement cost of intangible assets in practice this model suffers from the inability
to value separately the individual components of the firm’s IC. A more widely used
proxy for the q ratio is the excess of market value of a firm over the accounting book

value of its tangible assets.
3.3. Dynamic valuation models
Discounted cash flow model
In contrast to the ‘residual income’ approach to IC valuation by Lev, the
discounted cash flow (DCF) model in corporate finance projects the cash flows from
investment in a particular asset throughout the economic life of that assets discount
these cash flows at an appropriate discount rate. The present value of the investments
in the assets are subtracted to give the net present value of that investment. In theory
this model can be used to value any type of asset - physical, financial or intangible. It
is also a dynamic model in that cash flows from the asset are forecast into the future
thereby allowing for the future market conditions to determine the magnitude and
timing of the cash flows and hence the value of the asset.
However, the DCF model is generally based on point estimates of future cash
flows and does not explicitly account for the total riskiness of these cash flows but
only for the systematic component of that risk in the form of market determined
discount rate. Importantly, a model assumption is that the investment in the asset is
irreversible i.e. the firm commits itself to the investment now whatever state of nature
transpires later. There is no going back, no abandonment of the investment n
unfavourable states of nature. In brief, the DCF does not accommodate the option like
nature of certain corporate investments and ignores managerial flexibility.
Moreover, in practice, estimating the future cash flows associated with some
intangibles is difficult not only because of their embedded nature but also because
they are in the nature of exploratory investments that allow for learning. Future cash
flows are also subject to the impact of competitors’ ability to develop similar options
e.g. investment in R & D to create generic or ‘me-too’ drugs to compete with patented

drugs. Such competitor reactions erode the value of the real options the firm has
developed through investments in intangible assets.
DCF is thus a model that best captures the value of assets in place that generate
relatively stable or predictable cash flows. It is a model that may still capture the
growth opportunities arising from these assets in place. It is a model for those
corporate investments that facilitate ‘competing for the world’ rather than ‘competing
for the future’.
The DCF model does not altogether escape from the need to consider the
interactive nature of many intangible assets. In the resource-based view of
competition, what gives firms competitive advantage and the ability to create value is
not just the possession of certain resources but also the capabilities that lever these
resources in such a way as to give the firm a sustainable competitive advantage. Many
of these resources and capabilities, as noted earlier, are in the form of intangible
assets. Thus DCF cashflows need to be incremental cashflows i.e. the cash flows with
the intellectual asset being valued and the cashflows in the absence of that asset. In
practice this may be a tricky variable to estimate.
3.4 Real option models (ROM)
Since the parentage of real option models is the financial option pricing models
(OPMs) it is useful to start with a description of the latter. The best known of the
OPMs is the Black-Scholes OPM (BSOPM). Robert Merton independently derived
OPM and shared the Nobel Prize with Scholes for the work.
Call and put options on financial assets
A call option gives the buyer of that option the right, but not the obligation, to
buy the asset on which it is written at an agreed price (the exercise price) at maturity
of the option contract (in the case of a European option) or any time before maturity

(in the case of an American option). The price of the option is called option premium.
A put option gives the buyer the right, but not the obligation, to sell the asset at the
agreed price at or before maturity. An investor buys a call option when she expects
the asset to increase in value beyond the exercise price. An investor buys a put when
he expects the asset to decline in value below the exercise price.
Black –Scholes (BS) MODEL
The BS model is one of the most outstanding models in financial economics.
Myron Scholes and Robert Merton who developed a similar model independently
received the Nobel Prize in economics for the model. The BSOPM based on
stochastic calculus is as shown below: C the value of a European call option is
C = S N(d1) – E e-rt N(d2) (2)
Where d1 = [ln(S/E) + (r + ½ σ2)t] /√σ2t and d2 = d1 - √σ2t
S = current stock price; E = exercise price; r = annual risk free continuously
compounded rate; σ2 = annualised variance of the continuous return on the stock and t
= time to expiry of the option.
The exponential term, e-rt, discounts the exercise price to the present value.
Call value = S N(d1) – present value of E times N(d2) (3)
N(d1) and N(d2) represent the probability distributions. Values of N(d1) and N(d2) are
obtained from normal probability distribution tables. They give us the probability that
S or E will be below d1 and d2. In the BS model they measure the risk associated with
the volatility of the value of S. Software is available to calculate the BS option prices
for various parameter values.
Suppose Wild Goose Chase (WGC) Company stock is selling for $10 and a
call option on the stock is available. The exercise price is $10. This European call has
a maturity of 1 year. The risk free rate (the government treasury bill rate for 1 year) is

12%. The standard deviation (σ) of the annual returns on WGC is 10%. We need to
use normal probability distribution tables to get N(d1) and N(d2). We get N(d1) of
89.4% and N(d2) of ) of 87.5%. So the value of the call is $1.2. This value will
change with the value of the various parameters in the BS model.
Valuation of a put or abandonment option
This follows from the Put-Call parity theorem that establishes the following parity:
Stock value + put value = call value + present value of exercise. Thus knowing the
value of the call we can value the put option
Interpretation of the BS model
• The underlying asset value (S) – high S increases call value and reduces pur value
• The exercise price (X) – high X reduces call value but increases out value
• The volatility of the value of S (σ) – high σ increases both call and put values
• The time to maturity (t) – high t increases both call and put values
• Any dividend payment – high dividend reduces call value and increases put value.
• The risk free rate (rf) – high rf increases call value and reduces put value
One of the most intriguing relationships is that high volatility enhances the
option value. Since an option restricts the downside loss to the option premium but
does not restrict the upside potential, high volatility benefits the option. This
perspective has particular relevance to real options we discuss below.
Examples of such contingent investments are research & development,
advertising, pilot marketing, license for oil exploration, geological testing for mineral
reserves etc. In some cases managers may make an initial investment knowing well
that they can exit or abandon that investment.
Financial options and real options
Real option describes an option to buy or sell an investment in physical or
intangible assets rather than in financial assets. Thus any corporate investment in
plant, equipment, land, patent, brand name, etc can be the assets on which real options
are ‘written’. Purchase of a brand is an option on the related product or service. A
license to explore for oil is an option on oil. Many investment projects have call and
out option features. Investment in R & D is a call option since it may lead to ‘buying’
i.e. investing in, a second stage production facility. Any exploratory investment in a
growth opportunity such as the Internet or biotechnology is a call option. An
investment that can be sold of if it does not meet the investor’s expectations may be
regarded as a put option e.g. a mine that is abandoned when the price of gold falls and
is unlikely to recover.
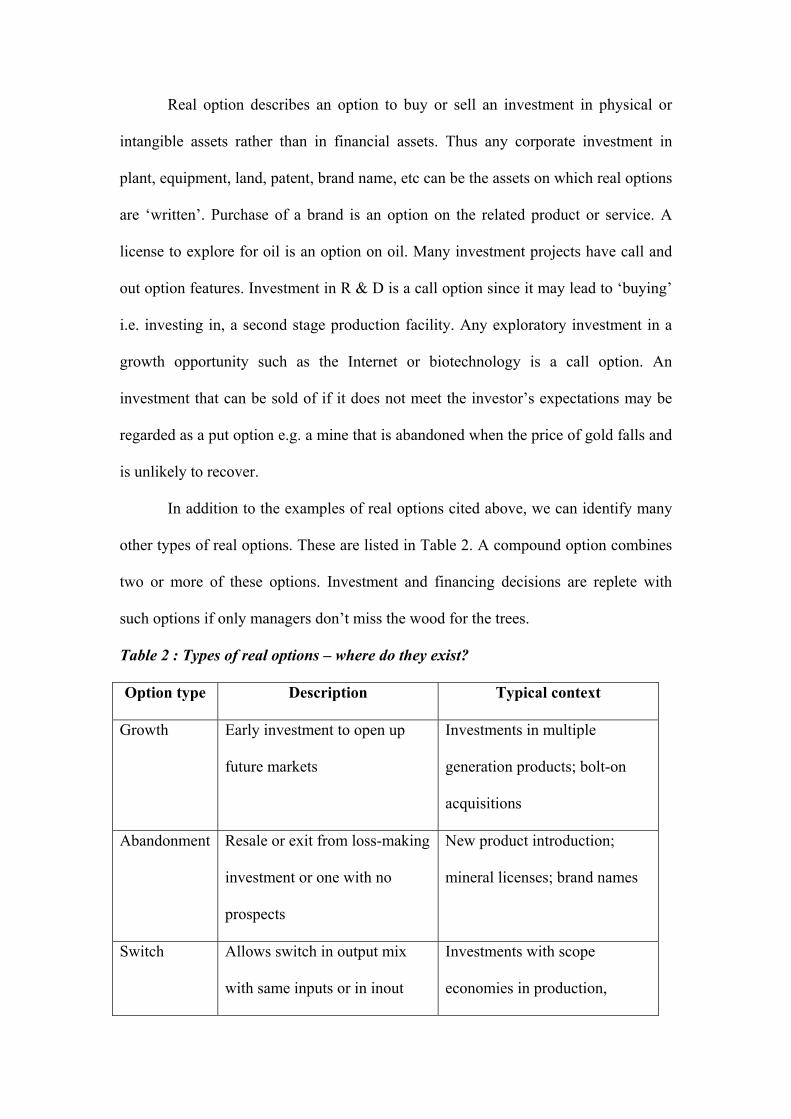
In addition to the examples of real options cited above, we can identify many
other types of real options. These are listed in Table 2. A compound option combines
two or more of these options. Investment and financing decisions are replete with
such options if only managers don’t miss the wood for the trees.
Table 2 : Types of real options – where do they exist?
Option type Description Typical context
Growth Early investment to open up
future markets
Investments in multiple
generation products; bolt-on
acquisitions
Abandonment Resale or exit from loss-making
investment or one with no
prospects
New product introduction;
mineral licenses; brand names
Switch Allows switch in output mix
with same inputs or in inout
Investments with scope
economies in production,

mix for same outputs. marketing, technology
After scale Option to expand or contract
output
In cyclical or fashion industries
Source: L Trigeorgis, Real Options, Managerial Flexibility and Strategy in Resource
Allocation, (Cambridge, Mass: The MIT Press, 1996), Table 1.1.
Valuation of real options
The BSOPM may be used to value real options (Luehrman, HBR, 1998). We
first show such a valuation application and then discuss the limitations and caveats in
valuing real options using the BSOPM. The variables in the BS model when applied
to real options are as follows:
• C = the first stage investment
• S = present value of the second stage investment
• ‘t’ = the time to making the second stage investment i.e. how long will that
opportunity be open i.e. how long can the second stage investment be deferred.
• X = present value of the cost of the second stage investment
• Dividend = intermediate costs to keep the second stage investment opportunity
open e.g. maintenance costs, rents etc
• σ = the volatility of the value of the second stage investment
The risk free rate has the same connotation as in the financial asset case.
Real option as a learning opportunity – ‘They also win who only stand and wait”
While waiting to make the second stage investment the company is gathering
information that flows from the first stage investment e.g. about feasibility of
technology and from the outside world e.g. the size of the potential market or the
price of the output say gold or a drug or a regulatory change. This learning covers
learning what the company’s resources and capabilities are and how they can be

adapted to the environmental changes (a process of self-discovery) as well as learning
about the environment (intelligence gathering) (Bernardo and Chowdhry, 2002; Kogut and N
Kulatilaka, 2001).
Real options and game theory
What is the option value that a firm has acquired when there is competition?
How soon will the competitors catch up and acquire similar options? Real options
may give rise to unique non-imitable claims on the underlying second stage
investment opportunity or they can be replicated by competitors in which case the
opportunity is shared. This is a fundamental issue in competitive strategy and not
peculiar to the real options framework (Luehrman, 1998; Bowman and Moskowitz, 2001; Smit,
2001). However the real options framework may be used to shed light on value
implications of shared options.
Whether competitors enter and spoil the game for the first mover depends on
whether the claims on the growth opportunities are shared but also on entry barriers
and what the first option holder does to forestall such entry. The game theory
framework can be used to figure out how the game will be played with shared
opportunities and entry and pre-emptive strategies of different players. One way we
can model the threat of entry is to incorporate an estimate of competitive erosion
(proxied by ‘dividend’ payment in the BSOPM). Where there are more than one
competitor this attrition can be increased to reflect this on the option value
Other real option models
Although BSOPM is the best known ROM, there are other approaches available to
value options. The binomial model (BOPM) rests on assuming two possible outcome
– an upside movement in the underlying asset’s value or a downside. Each of these
outcomes may be followed by further binary outcomes as shown in Figure 2. At each

nodal point in the binomial tree, the option value is the maximum of either 0 or the
excess of the underlying asset value over the exercise price. Thus at certain nodal
points (i.e. states of nature) the option will not be exercised and its value will be 0.
The BOPM converts the future cashflows into their certainty-equivalents (CE) using
risk-neutral probabilities. The CE cashflows are then discounted at a risk-free rate to
derive the present value of the call option.
The binomial model is easier to conceptualise than the BSOPM although in the
extreme the binomial model converges to the BSOPM e.g. if the frequency of option
valuation is high and the time to maturity is very long.
Figure 2: Insert a binomial tree with a number of nodes
Moalauk Can you insert a simple binomial tree diagram here?
4. Intangibles as real options
While not all intangible assets share real option characteristics many of them are in
essence real options that firms create through their activities, organic investments or
acquisitions. Among these are:
• customer relationship arrangements such as joint ventures, licensing agreements
as well as informal relationships;
• investment in human resources such as education, training & development,
domain expertise, creativity, problem solving capability, entrepreneurial spirit,
and ability to work in teams;
• investment in information technology for knowledge management and
enhancement of the capability to exploit organisational learning, expertise and
resource;

• investment in developing a unique culture that increases managerial flexibility,
organisational learning, creativity;
• practices and routines that identify growth opportunities and facilitate exploitation
of such opportunities
• intellectual property such as patents, copyrights, trademarks, brands and registered
designs.
• Research and development.
Investments in these intangibles do not generate immediate payoffs. Indeed they
are considered costs and often expensed in company accounts. But they are often
small, exploratory and speculative investments made in expectation that they will lead
to new growth opportunities and unique competitive advantages. Some of them create
switching options that allow the firm to switch existing resources to alternative uses
e.g. customer relationship information that allows the firm to switch its focus on from
low value customer segments to high value customer segments.
Table 3 lists the types of real options associated with some of intangibles. Each
intangible may be a bundle options rather than a single option. Thus intangibles may
be impregnated with substantial managerial flexibility.
Table 3: Intangibles as embedded real options
Intangible Asset Types of real options that may be
incorporated
Research and development Option to defer, option to abandon,
growth option to invest in production
Patents Option to defer, option to abandon,
growth option to invest in production
Advertising (Brand name) Growth option to invest in production,
marketing and selling
Capital Expenditure Option to alter operating scale, multiple interacting options, option to switch

process technology Information systems Time-to-build options, option to switch,
option to expand Technology acquisitions Option to switch, growth option
Human resource practices such as incentive-based compensation and employee training
Option to expand, option to switch, option to defer

4.1 Applying BSOPM to valuing a patent or R & D
We illustrate the application in the context of a firm that has acquired a patent
which is a real option to undertake production and marketing of the patented drug
(See Damodaran, Applied Corporate Finance, 2001 for further discussion). Biogen is
a biotechnology company with a patent on a drug called Avonex. It has received FDA
approval to treat multiple sclerosis. The patent gives the firm legal monopoly for 17
years. Biogen, however, is strapped for cash and wants to shop its patent and invest
the proceeds in further research. Major Pharma (MP) is considering buying the firm
because of its patent for the MS drug. There is no other drug with Biogen.
MP has analysed the situation as an acquisition opportunity. How much is
Biogen worth? The following data are used to value Biogen as a real option since the
patent would give MP the opportunity to manufacture the drug if the market
conditions are favourable in the next 17 years. If the drug is produced on a
commercial scale and marketed today, the investment cost is £2.875bn (X). The
present value of cash flows from that project is $3.422bn (S). Although immediate
investment is a positive $547m NPV decision, MP wants to know whether waiting
until more marketing and other information is available will create more value. There
is the risk that competitors may come up with alternative me-too drugs and erode
MP’s competitive advantage. The risk free, 17 year Treasury bond, rate is 6.7%. Time
to expiry of the option is 17 years (t). MP estimates the variability of the expected
present value S as 22.4% (σ). With a single potential competitor, the option value will
be eroded evenly at 1/17. This is the expected cost of delay. Estimation of σ is often
taken from the volatility of the stock of a company similar to the follow-on project. It

is the variability of the value of the follow-on manufacturing project. Analysts may be
able to estimate this variability through simulation.
These data, used in the BS model, give an option value of $907m compared to
a static NPV of $547mn. This suggests that MP will increase the value of its
acquisition if it waited to exercise the second stage investment option. If we assume
that with more competitors the attrition rate will double to 2/17, the option value is
$255. In this case MP will be nearly $300m better off by buying Biogen now and
manufacturing straight away. Unless it can think of other ways of challenging
potential competitors and keeping them at bay, e.g. erecting entry barriers or threat of
nasty and expensive litigation etc.
We can apply the same model to the valuation of any investment such as R &
D, human resource training, brand development, software development, customer
relations initiatives, joint ventures or strategic alliances.
4.2 Limitations of real option valuation models
Extrapolation of the BSOPM model to real options and strategic options is
fraught with problems. Many of the assumptions that underlie financial options do not
hold in the real options context. Data such as volatility are difficult to estimate since
the underlying investment opportunities are not traded. By their very nature many of
these are of an exploratory nature and historical data about them will not be available.
Many other differences between financial and real options make valuation of real
options using BSOPM less reliable.
The Black-Scholes model ignores many of the complications associated with
intangibles like R&D. A more realistic approach to value the option to abandon
would need to include:
• The rate at which the patent owning organisation may invest in

• The total cost of completion will be an unknown, it will need to be
incorporated as a random process
• Possibility of catastrophic future events which will lead to the termination of
the project. Such an event may include change in government regulation or a
rival company developing a similar product in advance
• Physical difficulties in completing the project
• The completion date of the investment project is not known in advance and
will again have to be modelled as a random event
• Cash flow received from the investment will be uncertain
• The salvage value of the project may be zero
Difficulties highlighted above with the Black-Scholes approach can be easily
overcome using Monte Carlo simulation. Simulation models roll out thousands of
possible paths of evolution of the underlying asset from the present to the option
maturity or exercise date (Amram and Kulatilaka, 1999). The optimal investment
strategy at the end of each path is determined and the payoff calculated. The
current value of the option is found by averaging the payoffs and then discounting
the average back to the present. The Monte Carlo method can handle many
aspects of real-world applications including complicated decision rules and
complex relationships between the option value and the underlying asset.
Simulation models can also solve path-dependent options wherein the value of
the option depends not only on the value of the underlying asset but also on the
particular path followed by the asset. For example, investments in further
customer relations initiatives depend upon the profitability of past customer
relations.
Similarities between some of the intangibles and real options may not be
readily apparent. Further, identifying the option parameters such as exercise price,
time to maturity is not easy. Perhaps the most difficult part of the application
process is the estimation of volatility for use in models such as the BSOPM.
However, some of these problems may be handled by alternative models such as
Monte Carlo simulation.
5. Summary and conclusions
In this paper, we explore how intangible assets that have come to dominate the
valuation of many firms can be valued using advances in real option valuation. The
context of the paper is the rising proportion of intangibles in the overall value of
firms, problems in identifying, measuring and valuing such intangibles, and the
inadequacies of traditional valuation tools. We argue that intangibles in general
contribute to frms’ competitive advantage and value creation as they give rise to
growth opportunities. Exploitation of these growth opportunities require investments
and whether such investments will be made depends on the result of initial
investments to develop the intangible assets. Thus intangible assets represent on
options to pursue growth or to abandon such opportunities. Given this fundamental
similarity we set out alternative real option valuation models and illustrate how some
of the intangible assets may be valued.
While it is conceptually easy to regard some if not all intangibles as real options, in
practical application estimating some of the model parameters may be difficult. We
point to alternative estimation procedures such as Monte Carlo simulation to make
these problems more tractable. Even the real options framework may not provide easy
solutions to the problem of intangible valuation, it still provides a challenging way of
thinking about intangibles, their nature and how they contribute to value creation.
