valuation report - jindal poly valuation report_jpfl.pdf · the ifrs foundation, ... p/e prevailing...
TRANSCRIPT
Valuation Report
Jindal Poly Films Limited
August 2016
Index
I. Our Engagement
II. Executive Summary
III. Company Overview
IV. Industry Overview
V. Valuation Methodology
VI. Valuation Analysis
VII. Statement of Limiting Conditions
1

I. Our Engagement
2
Our Engagement (1/1)
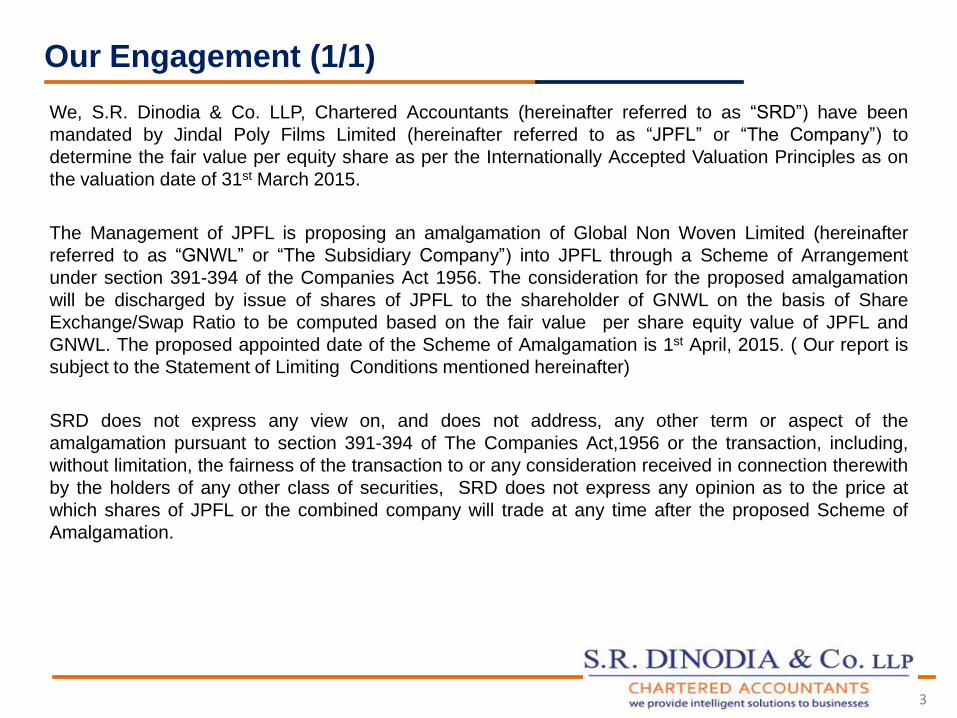
We, S.R. Dinodia & Co. LLP, Chartered Accountants (hereinafter referred to as “SRD”) have been
mandated by Jindal Poly Films Limited (hereinafter referred to as “JPFL” or “The Company”) to
determine the fair value per equity share as per the Internationally Accepted Valuation Principles as on
the valuation date of 31st March 2015.
The Management of JPFL is proposing an amalgamation of Global Non Woven Limited (hereinafter
referred to as “GNWL” or “The Subsidiary Company”) into JPFL through a Scheme of Arrangement
under section 391-394 of the Companies Act 1956. The consideration for the proposed amalgamation
will be discharged by issue of shares of JPFL to the shareholder of GNWL on the basis of Share
Exchange/Swap Ratio to be computed based on the fair value per share equity value of JPFL and
GNWL. The proposed appointed date of the Scheme of Amalgamation is 1st April, 2015. ( Our report is
subject to the Statement of Limiting Conditions mentioned hereinafter)
SRD does not express any view on, and does not address, any other term or aspect of the
amalgamation pursuant to section 391-394 of The Companies Act,1956 or the transaction, including,
without limitation, the fairness of the transaction to or any consideration received in connection therewith
by the holders of any other class of securities, SRD does not express any opinion as to the price at
which shares of JPFL or the combined company will trade at any time after the proposed Scheme of
Amalgamation.
3

II. Executive Summary
4
Executive Summary
5
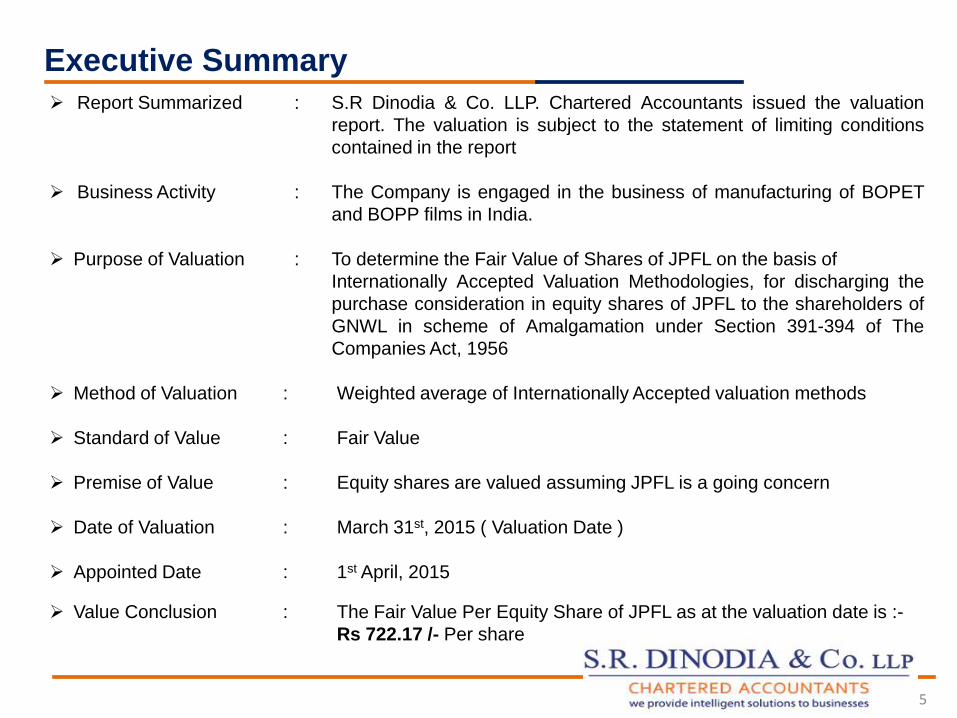
Report Summarized : S.R Dinodia & Co. LLP. Chartered Accountants issued the valuation
report. The valuation is subject to the statement of limiting conditions
contained in the report
Business Activity : The Company is engaged in the business of manufacturing of BOPET
and BOPP films in India.
Purpose of Valuation : To determine the Fair Value of Shares of JPFL on the basis of
Internationally Accepted Valuation Methodologies, for discharging the
purchase consideration in equity shares of JPFL to the shareholders of
GNWL in scheme of Amalgamation under Section 391-394 of The
Companies Act, 1956
Method of Valuation : Weighted average of Internationally Accepted valuation methods
Standard of Value : Fair Value
Premise of Value : Equity shares are valued assuming JPFL is a going concern
Date of Valuation : March 31st, 2015 ( Valuation Date )
Appointed Date : 1st April, 2015
Value Conclusion : The Fair Value Per Equity Share of JPFL as at the valuation date is :-
Rs 722.17 /- Per share
III. Company Overview
6
Company Overview(1/3)
7
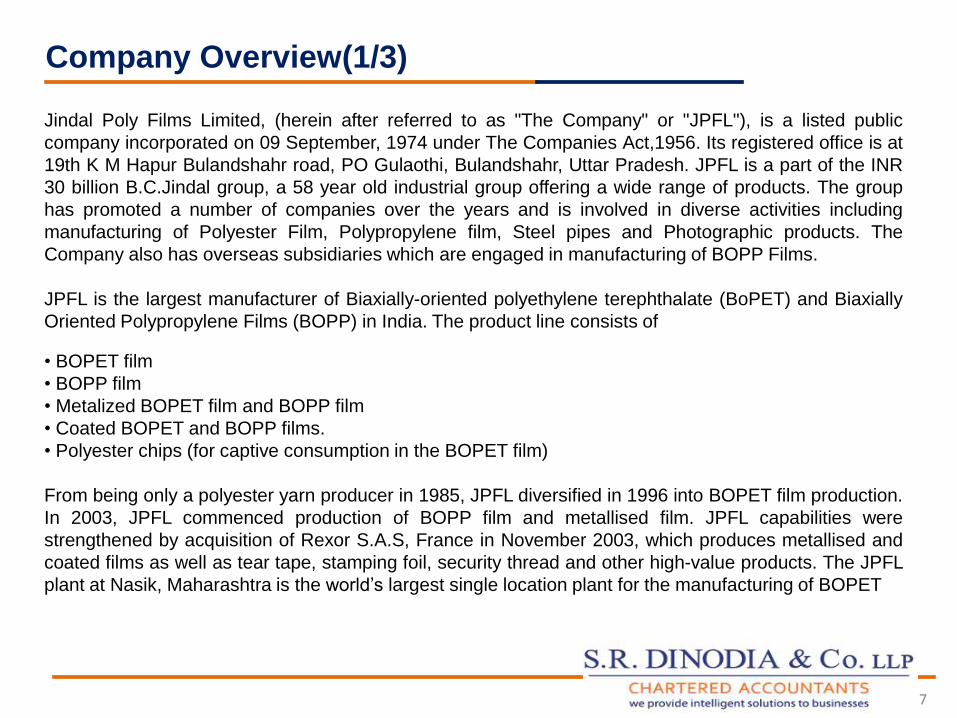
Jindal Poly Films Limited, (herein after referred to as "The Company" or "JPFL"), is a listed public
company incorporated on 09 September, 1974 under The Companies Act,1956. Its registered office is at
19th K M Hapur Bulandshahr road, PO Gulaothi, Bulandshahr, Uttar Pradesh. JPFL is a part of the INR
30 billion B.C.Jindal group, a 58 year old industrial group offering a wide range of products. The group
has promoted a number of companies over the years and is involved in diverse activities including
manufacturing of Polyester Film, Polypropylene film, Steel pipes and Photographic products. The
Company also has overseas subsidiaries which are engaged in manufacturing of BOPP Films.
JPFL is the largest manufacturer of Biaxially-oriented polyethylene terephthalate (BoPET) and Biaxially
Oriented Polypropylene Films (BOPP) in India. The product line consists of
• BOPET film
• BOPP film
• Metalized BOPET film and BOPP film
• Coated BOPET and BOPP films.
• Polyester chips (for captive consumption in the BOPET film)
From being only a polyester yarn producer in 1985, JPFL diversified in 1996 into BOPET film production.
In 2003, JPFL commenced production of BOPP film and metallised film. JPFL capabilities were
strengthened by acquisition of Rexor S.A.S, France in November 2003, which produces metallised and
coated films as well as tear tape, stamping foil, security thread and other high-value products. The JPFL
plant at Nasik, Maharashtra is the world’s largest single location plant for the manufacturing of BOPET
Company Overview(2/3)
8
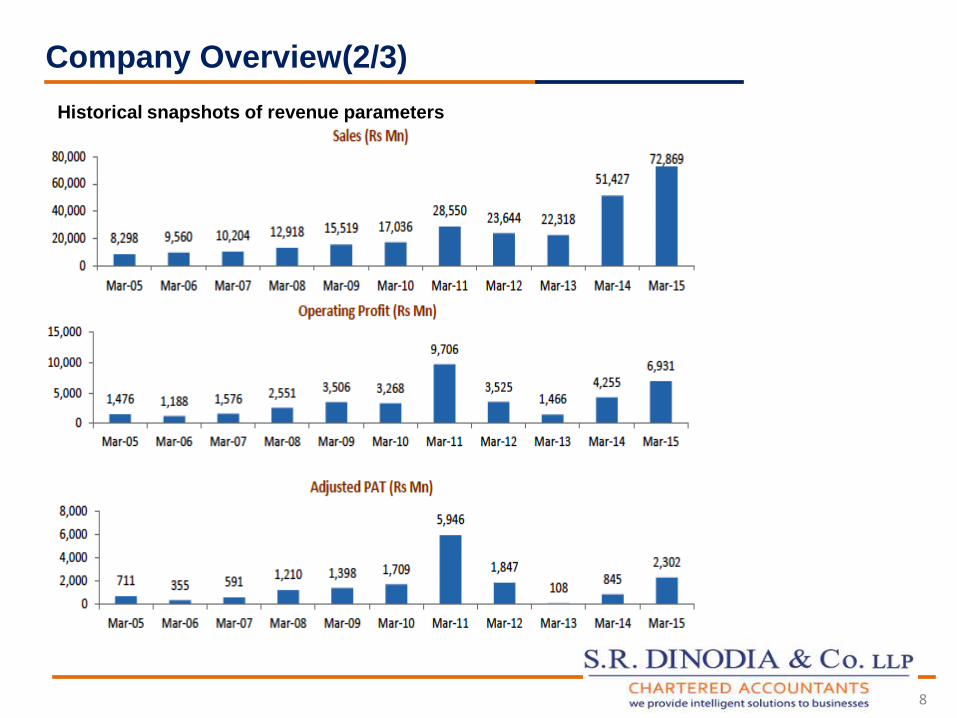
Historical snapshots of revenue parameters
Company Overview(3/3)
9
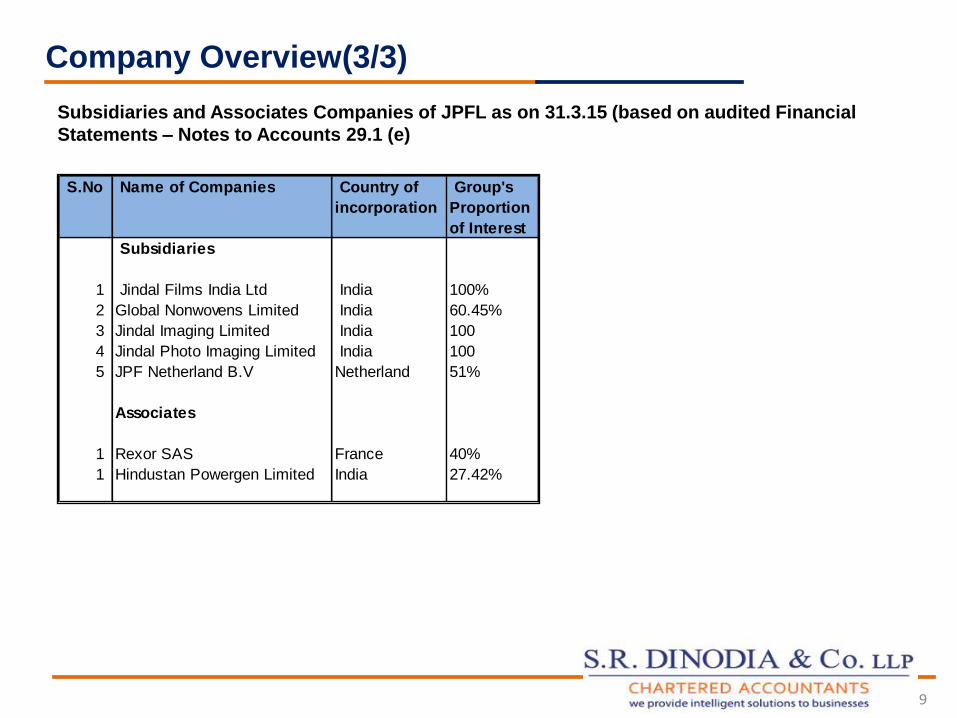
Subsidiaries and Associates Companies of JPFL as on 31.3.15 (based on audited Financial
Statements – Notes to Accounts 29.1 (e)
S.No Name of Companies Country of
incorporation
Group's
Proportion
of Interest
Subsidiaries
1 Jindal Films India Ltd India 100%
2 Global Nonwovens Limited India 60.45%
3 Jindal Imaging Limited India 100
4 Jindal Photo Imaging Limited India 100
5 JPF Netherland B.V Netherland 51%
Associates
1 Rexor SAS France 40%
1 Hindustan Powergen Limited India 27.42%

IV. Industry Overview
10
11
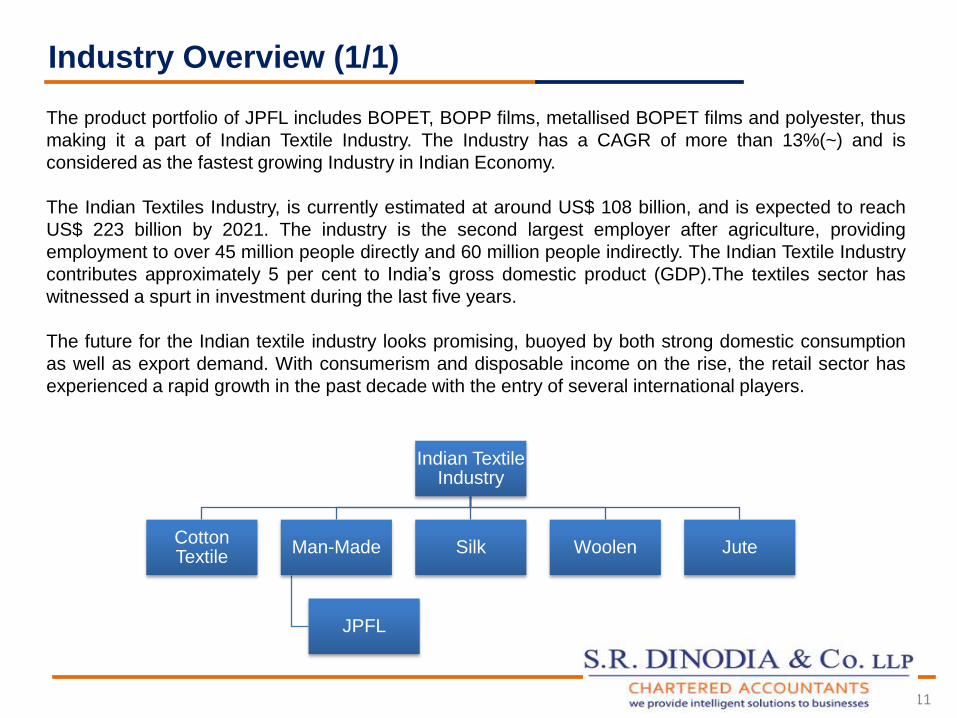
The product portfolio of JPFL includes BOPET, BOPP films, metallised BOPET films and polyester, thus
making it a part of Indian Textile Industry. The Industry has a CAGR of more than 13%(~) and is
considered as the fastest growing Industry in Indian Economy.
The Indian Textiles Industry, is currently estimated at around US$ 108 billion, and is expected to reach
US$ 223 billion by 2021. The industry is the second largest employer after agriculture, providing
employment to over 45 million people directly and 60 million people indirectly. The Indian Textile Industry
contributes approximately 5 per cent to India’s gross domestic product (GDP).The textiles sector has
witnessed a spurt in investment during the last five years.
The future for the Indian textile industry looks promising, buoyed by both strong domestic consumption
as well as export demand. With consumerism and disposable income on the rise, the retail sector has
experienced a rapid growth in the past decade with the entry of several international players.
Indian Textile Industry
Cotton Textile
Man-Made
JPFL
Silk Woolen Jute
Industry Overview (1/1)
12
FACTORS RESPONSIBLE FOR GROWTH OF THE TEXTILE INDUSTRY :
Stable government framework
Increased purchasing power
Large domestic market
High export potential market
Humid climate required for spinning of the yarn
Lower excise duty on specific parts
Proven R&D capabilities
Increase governmental incentive in Indian textile industry
CONCLUSION
From the above discussion it is evident that the Indian Textile industry is experiencing growth due to
factors such as increasing income, rise in cost of living, Proven R&D capabilities etc. Further, entry of
globally recognized players in the market has boosted the future prospects. The business environment of
the future will be intensely competitive. Countries will want their own interests to be safeguarded. As
tariffs tumble, non-tariff barriers will be adopted. New consumer demands and expectations coupled with
new techniques in the market will add a new dimension. E-commerce will unleash new possibilities.
This will demand a new mindset to eliminate wastes, delays, and avoidable transaction costs. Effective
entrepreneur-friendly institutional support will need to be extended by the Government, business and
umbrella organizations.
Industry Overview (2/2)
V. Valuation Methodology
13
Valuation by its very nature, cannot be regarded as an exact science and the conclusions arrived at in
many cases will be subjective and dependent on the exercise of individual judgment. Given the same set
of facts and using the same assumptions, expert opinions may differ due to the number of separate
judgment decisions. There can therefore be no standard formulae to establish an indisputable value,
although certain formulae are helpful in assessing reasonableness.
The International Accounting Standard Board (IASB), which is the independent standard setting body of
the IFRS foundation, has set out two internationally accepted valuation methodologies for arriving at
the fair value of a share namely, the income approach and the market approach
Guidance is also available from the Institute of Chartered Accountants of India (ICAI) which has
published a "Technical Guide for Valuation" in 2009 and prescribes the approaches for generally
accepted valuation methodologies such as the Income approach and the market approach similar
to the internationally accepted valuation methodologies. However, ICAI also allows for a third method
which is the asset approach for arriving at the fair value of a share.
For the purpose of determining fair value, a valuer may therefore, use any of the approaches as per the
generally / internationally accepted valuation methodologies which in its opinion are most appropriate
based on the facts of each valuation. Reliance is placed on the case of Dr. Mrs. Renuka Datla vs.
Solvay Pharmaceutical B.V. & Ors on 30 October, 2003, in which it was held that, a valuer has to give
a justification for selecting or rejecting a method.
Valuation Methodology (1/7)
14
Valuation Methodology (2/7)
15
1 Weighted average cost of capital (WACC) is used as a discount rate
(A). Income Approach
Usually under the Income Based Approach, the methods that maybe applied are Discounted Cash Flow
(DCF) Method or the Price Earning Capacity Value (PECV) Method.
Under DCF approach, the future free cash flows of the business are discounted to the valuation date to
arrive at the present value of the cash flows of the business or capitalized using a discount rate1
depending on the capital structure of the company. This approach also takes into account the value of
the business in perpetuity by the calculation of terminal value using the exit multiple method or the
perpetuity growth method, whichever is appropriate.
Under PECV method. The average earning on the basis of past 3-5 year are first determined,
adjustments are then made for any exceptional transactions or items of non- recurring nature. The
adjusted average earning are then capitalized at an appropriate rate to arrive at the value of business.
The capitalization rate so factored has to be decided depending upon various factors such as the
earning trend in the industries, P/E prevailing in the industries etc.
The internationally / generally accepted valuation methodologies have been discussed hereinafter, along
with the reasons for choice of approach used based on the facts of JPFL.
Valuation Methodology (3/7)
16
Facts of the Case:
JPFL is a financially sound company which has strong financial results over the last decade. On a
common size analysis the net worth of the company is ~ 45% of its total assets, this is due to
accumulation of profit which has generated due to streamlined operating efficiencies of the Company.
Conclusion:
In our considered view since the company is growing substantially from year to year, the capitalization
of its historical profits are not an appropriate indicator of its value. Accordingly the PECV method has
not been considered appropriate.
The dynamics of the business of JPFL is such that the operations generate incomes which are
reflective of the value of its business in perpetuity. In view of the management the projections of future
cash flows are reasonably achievable, therefore, it was considered appropriate to use DCF approach
to determine the fair value of the business of JPFL under the Income Approach. (For details refer
Valuation Analysis – Ch. VI)

Valuation Methodology (4/7)
17
(B). Market Approach
Under this approach the valuation is done on the basis of the quoted market price of the company in case it
is a publicly traded company, or publicly traded comparable businesses / date is reviewed in order to
identify a peer group similar to the subject company and then their multiples are applied to the entity being
valued to determine the fair value.
Usually under the market based approach, the methods that maybe applied are Market Price Method,
Comparable Multiple Method (CMM), Comparable Transaction Method (CTM) or Price of Recent
Investment Method (PORI). Under CMM method various multiple like EV/Sales, EV/EBITDA, P/BV, P/E,
Price/Sales can be used to value a business depending upon the facts and circumstances of the cases.
Facts of the Case:
JPFL is a publicly traded company and therefore a peer set has to be selected which is representative of
companies that are listed and engaged in a similar business and operate as a part of the same industry.
Keeping in view the business of JPFL and its products portfolio the following peer set has been provided by
the Management of JPFL, which in its view are considered appropriate.
1. Uflex
2. Polyplex
3. Garware Polyester
4. Cosmo Films

Valuation Methodology (5/7)
18
In order to determine the fair price per equity share under the Market Price Method, the market price of
JPFL’s share as traded on the Stock Exchange on 31st March 2015 would need to be computed, keeping in
mind the SEBI Guidelines (even though they do not apply directly), however, since this would include the
value of GNWL and separate market price is not available – this method was not considered appropriate.
Accordingly the Comparable multiple method has been considered appropriate to determine the fair value
of the equity of JPFL (Consolidated basis without GNWL) based on the peer set so available. (For details
refer to Valuation Analysis – Ch VI)
*Duff and Phelps Risk Premium Report 2013
(This space has been left blank intentionally)
Valuation Methodology (6/7)
19
(D). Assets Based Approach
Under this approach, the book value / replaceable value / realizable value of the underlying assets of the
company is determined to arrive at the value of the business, depending on the facts and circumstances
applicable to a company . This methodology is likely to be appropriate for business which derive value
mainly from the underlying value of its assets rather than its earnings. Such as in the case of real estate
business or investment business
Usually under the assets based approach, the methods that maybe applied are Net Book Value Method,
Net Replaceable Value, Net Realizable Value.
Facts of the case:
JPFL is a operationally efficient company which has been in good financial conditions over the last
decade. In doing the common size analysis of book value as % of total assets, with the accumulation of
past profits the book value of the company as a % of total assets is ~45% .
Conclusion:
Since the Company is a going concern, the Net Replicable and Net Realizable value approaches were
not considered appropriate. Accordingly, the Net Book Value approach has been considered appropriate
to determine the fair value of business if JPFL, since the assets are reflecting the intrinsic value in the
business.
Valuation Methodology (7/7)
20
Conclusion
In conclusion, the fair value of the business of JPFL is determined using the Internationally Accepted
Valuation Methodologies, namely
1. Income Approach
2. Market Approach.
3. Assets Approach
(This space has been left blank intentionally)

VI. Valuation Analysis
21

Valuation Analysis (1/24)
22Strictly Private and Confidential
To aid us in our valuation analysis, we have relied on the information furnished by the management of the
Company, including but not limited to background of the business of the Company & the group to which it
belongs, Audited financial statements as on 31st March 2015, necessary explanations and information,
which we believed were relevant to the present valuation exercise, from the executives and management
of the company and certified Projections of JPFL for the period starting from April 2016 till March 2020
prepared by the management, with their assurance of the reasonability.
In arriving at this opinion, SRD amongst other things:
a. Relied on the audited financials statements provided by the management / representatives of JPFL
and the projections on a stand alone basis as well the audited financial statements of subsidiaries
and associates along with their projections, without further due diligence.
b. Preliminary discussion and information from the representatives of JPFL as provided time to time
regarding the business outlook, current state of affairs and financial position of the Company and the
Industry. Including discussions with regard to the past and current operations and financial conditions
and the prospects of JPFL
c. SRD consulted various market reports, historical statistics in addition to other public available data as
considered appropriate including the market data available for JPFL
d. Performed such other analysis, reviewed such other information and considered such other factors
as SRD had deemed appropriate
Valuation Analysis (2/24)
23
The analysis that is conducted, estimates the “Fair Value” of the business of JPFL based on the average
value computed as per the valuation methodologies adopted
The detailed valuation analysis, is hereinafter of :-
1. Income Approach.
2. Market Approach.
3. Assets Approach.
(This space has been left blank intentionally)

Valuation Analysis (3/24)
24
Discounted Cash Flow Method (DCF)
Under this technique the future free cash flows are discounted to the date of valuation in order to arrive at
the Present Value of the Business, the following variables need to be determined before deriving the
value of the baseness:
Free Cash Flows After Tax form business operations :
The Future Free Cash flows have been determined based on the Company’s projections of the next 5
years (March 2016 to March 2020), assumed to be reasonable. (Subject to Statement of limiting
conditions). The following table depicts the statement of standalone free cash flows of the business of
JPFL (standalone):
(A). Income Approach
Strictly Private and Confidential
JPFL (Standalone)
(Rs. In crores)
Free Cash Flow Statement Mar-16(A) Mar-17(P) Mar-18(P) Mar-19(P) Mar-20(P)
1 2 3 4
EBIT 314.41 299.06 377.32 407.96 429.46
Less: Taxes 34.61% 108.81 103.50 130.58 141.19 148.63
EBIAT 205.60 195.56 246.74 266.77 280.83
Add:
Depreciation 59.25 70.73 73.72 74.74 74.56
Changes in Working Capital (21.53) (45.09) (42.63) (10.23) (6.18)
Capital Expenditures (216.72) (168.91) (44.00) (15.00) (15.00)
Free Cash Flows 26.60 52.29 233.83 316.28 334.21
In order to determine the fair value of the business under the DCF method the Capital Asset Pricing
Model (CAPM) has been used. This model discounts the future free cash flows based on a weighted
average cost of capital i.e. WACC.
WACC = Ke*E/(D+E) + Kd*D/(D+E)
Where,
D= Debt Funds
E= Equity Shareholders Funds
Accordingly, the key variables of the WACC are explained below :
Cost of Equity (Ke)
The cost of equity is the minimum rate of return that an equity shareholder expects on his investment. It is
calculated as per formula as given below:
KE = RF + *RP
The various components of the above-mentioned formula are described below:
RISK FREE RATE (RF)
The Government of India has considered risk free rate as return on 10 years bonds issued, which is
7.80% p.a. (Monetary Policy Report-April 2016 issued by the Reserve bank of India) The YTM of Central
Govt. Securities with term to maturity of 10-years (end period) is 7.80%
Valuation Analysis (4/24)
25Strictly Private and Confidential
BETA ()
Beta is a measure of volatility, or systematic risk of the return on a particular security to the return on a
market portfolio. To determine the beta for JPFL, we have considered average 5 years Beta of JPFL as
available in public domain. Accordingly, the Beta () for JPFL was determined at 1.03
MARKET RISK PREMIUM (RP)
Market Risk Premium is the premium earned on equities issued in India over and above the risk free
return(Rf) earned i.e. Rp= (RM-Rf). The average rate of return on equity (RM) is taken on the basis of the
average equity market return of the BSE Sensex over 15 years is 17.42% (RM). Accordingly the Market
risk premium is 9.62% (RP).
Accordingly, the Ke- Return on Equity of 17.71% has been arrived.
Cost of Debt (Kd)
The cost of debt is the minimum rate of return that a lender expects on his investment after tax
adjustment as the interest paid on debt is tax deductable expenses. It is calculated as per formula as
given below: K d = Interest Rate (1- Tax Rate)
Valuation Analysis (5/24)
26Strictly Private and Confidential
INTEREST RATE
It is the minimum rate of return that a lender expects on his investment and is generally equal to the
coupon rate of interest. In the case of JPFL (standalone) there is a total debt of Rs. 549.37 Crores
carrying an average interest rate of 4.75% to 5% (as provided by the Management/Representatives of
JPFL). However, the Interest over a sustained period of time including hedging and foreign currency risk
is assumed to be 9%, which in our view maybe considered appropriate given the Indian Lending
Scenario.
Accordingly a Cost of Debt (Kd) of 5.89% has been computed based on Weighted Average Interest rate
of 9% and effective tax rate of ~34.61%
Thus, WACC as per the Capital Assets Pricing Model (CAPM) has been computed as 14.60%
GROWTH RATE IN PERPETUITY
In addition to the WACC the Terminal Value growth rate in perpetuity needs to be determined. In order to
do so, the GDP growth rate levels of the country that stand at ~7.80%, the inflation rate that stands at
~4.83% (Economic Survey of FY2015-16), together with the industry trend of man made fibers that has
experienced stagnant growth over the last 5 years, as well the growth projected by the Company were
analyzed. Accordingly, a growth rate in perpetuity of ~2% was assumed to be reasonable based on a
going concern principle.
Valuation Analysis (6/24)
27Strictly Private and Confidential
Valuation Analysis (7/24)
28
Value of Equity
Fair Value is the price, in cash or equivalent, that a buyer could reasonably be expected to pay, and a
seller could reasonably be expected to accept, if the business were exposed for sale on the open market
for a reasonable period of time, with both buyer and seller being in possession of the pertinent facts and
neither being under any compulsion to act. It is calculated as per formula given below:
Value of Equity = Present Value of the less Present Value
Business of the Company of Net Debt
The various components of the above-mentioned formula are described below:
Present Value of Business of the Company
Present Value of the business of the Company is the sum of future discounted free cash inflow that is
expected to be realized from the business in perpetuity. Based on the Valuation analysis the Present
Value of the free cash flow of the Company based on a 5 years projected period in our opinion is
Rs. 570.75 Crores
On the last projected year’s free cash flow, a growth rate in perpetuity of 2% and the discount rate
(WACC) of 14.60% has been applied to determine the present value of the terminal cash flow which
stands at 1368 Crores
Thus, the present value of the business (Standalone) is present value of future cash flows plus the
present value of the terminal value amounting to Rs. 1938.75 Crores
Strictly Private and Confidential
Valuation Analysis (8/24)
29
Net Debt
Net Debt means total debt outstanding as on the valuation date less the excess cash. As on valuation
date, total Net Debt amount is Rs 384.14 Crores
Conclusion based on DCF Approach
On the basis of above analysis, the standalone equity value of the shares of JPFL in our opinion is Rs
1554.61 Crores.
To capture the fair value of investment in subsidiary/ associates companies the value of below mentioned
companies has been added to arrive at the Consolidated value of JPFL under DCF approach. The list of
subsidiaries and associates have been valued as follows, based on the assumptions of business
projections provided by the management:
1. Jindal Films India Ltd –
2. JPF Netherlands (BV) (including Rexor SAS - 40% of the holding of JPFL as on 31.3.15 is held
through JPF Netherlands in the projected period in addition to its own direct shareholding, making it a
Holding Co. of Rexor SAS)
3. Global NonWovens Limited (GNWL)
4. Jindal Imaging Limited,
5. Jindal Photo Imaging Limited
6. Hindustan Powergen Limited
Strictly Private and Confidential
Valuation Analysis (9/24)
30
DCF of Subsidiaries / Associate :
1. Jindal Films India Ltd –
JFIL is valued on Discounted Cash Flow (DCF) basis, using free cash flow to firm approach. The overall
equity value of JFIL works out to Rs 167.31 Crores as on 31.3.2015 (Refer Appendix A for Calculations)
2. JPF Netherlands (BV) (including Rexor SAS 40% of which is held through JPF Netherlands)
JPF Netherlands (BV) is valued on Discounted Cash Flow (DCF) basis. Using free cash flow to firm
approach. The overall equity value of JPF(Netherland) works out to Rs 8247.70 Crores as on 31.3.2015.
(Refer Appendix B for Calculations)
3. Global NonWovens Limited (GNWL) –
GNWL is valued on Discounted Cash Flow (DCF) basis. Using free cash flow to firm approach. The
overall equity value of GNWL works out to Rs 71.19 Crores as on 31.3.2015. (Refer Valuation Report
dated 19th August 2016 for Calculations
4. We understand that Jindal Imaging Limited, Jindal Photo Imaging Limited and Hindustan Powergen
Limited have no operating business and accordingly, DCF Method cannot be applied to them.
Strictly Private and Confidential
Valuation Analysis (10/24)
31Strictly Private and Confidential
(This space has been left blank intentionally)
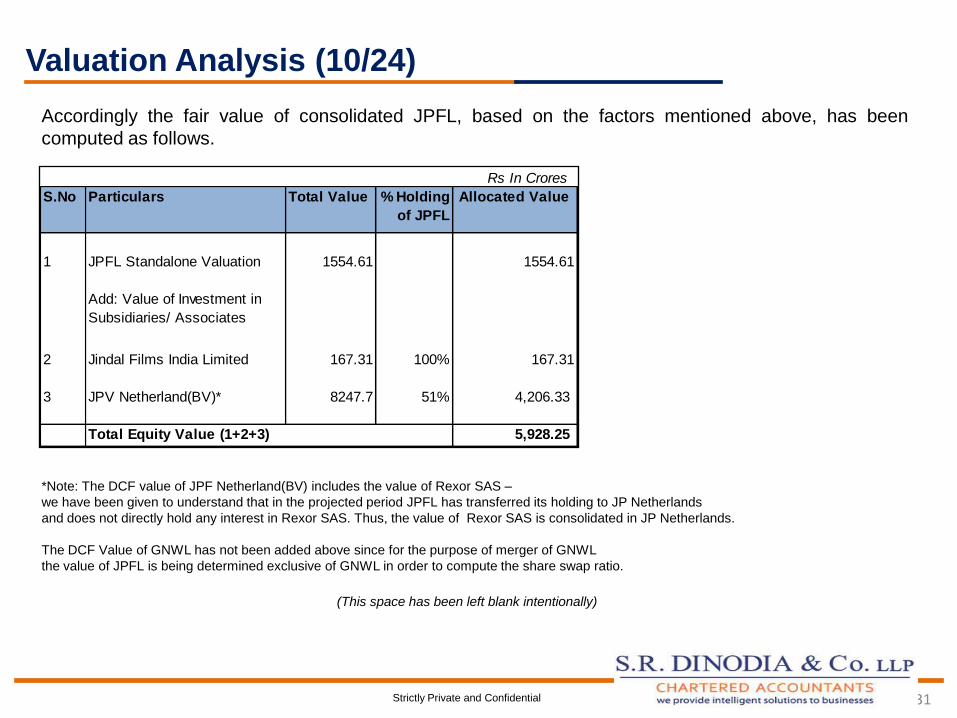
Accordingly the fair value of consolidated JPFL, based on the factors mentioned above, has been
computed as follows.
*Note: The DCF value of JPF Netherland(BV) includes the value of Rexor SAS –
we have been given to understand that in the projected period JPFL has transferred its holding to JP Netherlands
and does not directly hold any interest in Rexor SAS. Thus, the value of Rexor SAS is consolidated in JP Netherlands.
The DCF Value of GNWL has not been added above since for the purpose of merger of GNWL
the value of JPFL is being determined exclusive of GNWL in order to compute the share swap ratio.
Rs In Crores
S.No Particulars Total Value % Holding
of JPFL
Allocated Value
1 JPFL Standalone Valuation 1554.61 1554.61
Add: Value of Investment in
Subsidiaries/ Associates
2 Jindal Films India Limited 167.31 100% 167.31
3 JPV Netherland(BV)* 8247.7 51% 4,206.33
Total Equity Value (1+2+3) 5,928.25
32
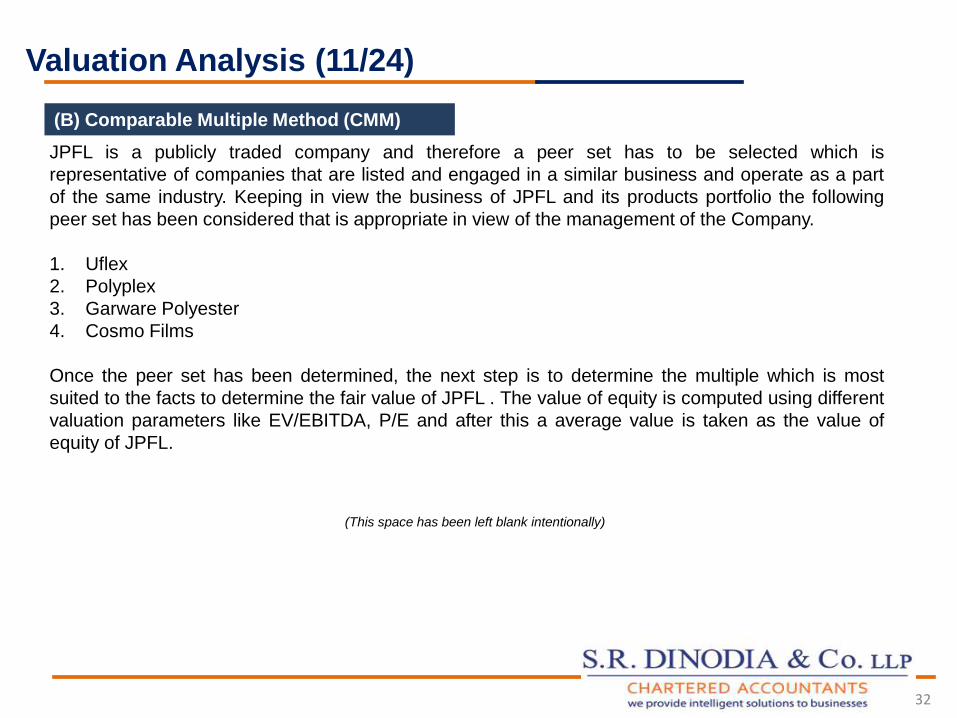
JPFL is a publicly traded company and therefore a peer set has to be selected which is
representative of companies that are listed and engaged in a similar business and operate as a part
of the same industry. Keeping in view the business of JPFL and its products portfolio the following
peer set has been considered that is appropriate in view of the management of the Company.
1. Uflex
2. Polyplex
3. Garware Polyester
4. Cosmo Films
Once the peer set has been determined, the next step is to determine the multiple which is most
suited to the facts to determine the fair value of JPFL . The value of equity is computed using different
valuation parameters like EV/EBITDA, P/E and after this a average value is taken as the value of
equity of JPFL.
(B) Comparable Multiple Method (CMM)
Valuation Analysis (11/24)
(This space has been left blank intentionally)
33
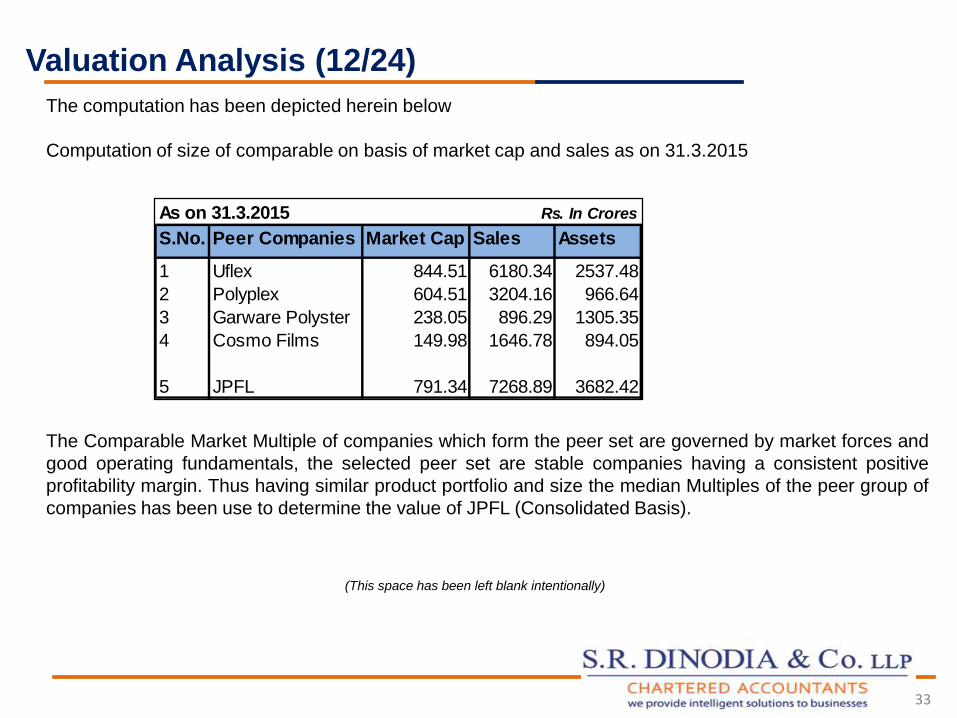
The computation has been depicted herein below
Computation of size of comparable on basis of market cap and sales as on 31.3.2015
The Comparable Market Multiple of companies which form the peer set are governed by market forces and
good operating fundamentals, the selected peer set are stable companies having a consistent positive
profitability margin. Thus having similar product portfolio and size the median Multiples of the peer group of
companies has been use to determine the value of JPFL (Consolidated Basis).
Valuation Analysis (12/24)
As on 31.3.2015
S.No. Peer Companies Market Cap Sales Assets
1 Uflex 844.51 6180.34 2537.48
2 Polyplex 604.51 3204.16 966.64
3 Garware Polyster 238.05 896.29 1305.35
4 Cosmo Films 149.98 1646.78 894.05
5 JPFL 791.34 7268.89 3682.42
Rs. In Crores
(This space has been left blank intentionally)
34
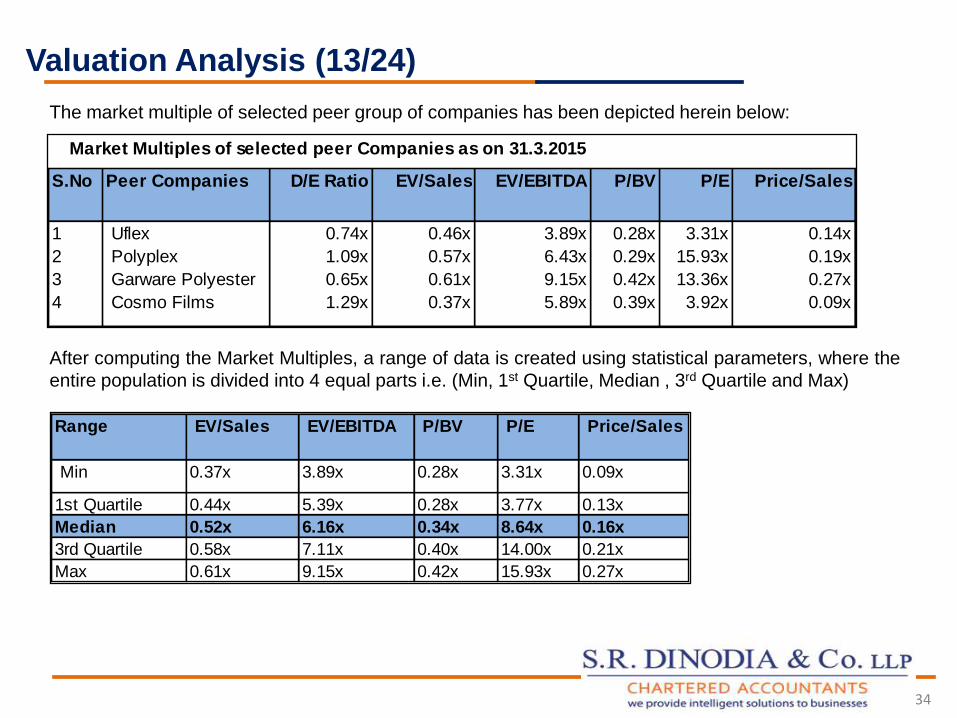
The market multiple of selected peer group of companies has been depicted herein below:
After computing the Market Multiples, a range of data is created using statistical parameters, where the
entire population is divided into 4 equal parts i.e. (Min, 1st Quartile, Median , 3rd Quartile and Max)
Valuation Analysis (13/24)
Range EV/Sales EV/EBITDA P/BV P/E Price/Sales
Min 0.37x 3.89x 0.28x 3.31x 0.09x
1st Quartile 0.44x 5.39x 0.28x 3.77x 0.13x
Median 0.52x 6.16x 0.34x 8.64x 0.16x
3rd Quartile 0.58x 7.11x 0.40x 14.00x 0.21x
Max 0.61x 9.15x 0.42x 15.93x 0.27x
S.No Peer Companies D/E Ratio EV/Sales EV/EBITDA P/BV P/E Price/Sales
1 Uflex 0.74x 0.46x 3.89x 0.28x 3.31x 0.14x
2 Polyplex 1.09x 0.57x 6.43x 0.29x 15.93x 0.19x
3 Garware Polyester 0.65x 0.61x 9.15x 0.42x 13.36x 0.27x
4 Cosmo Films 1.29x 0.37x 5.89x 0.39x 3.92x 0.09x
Market Multiples of selected peer Companies as on 31.3.2015
35
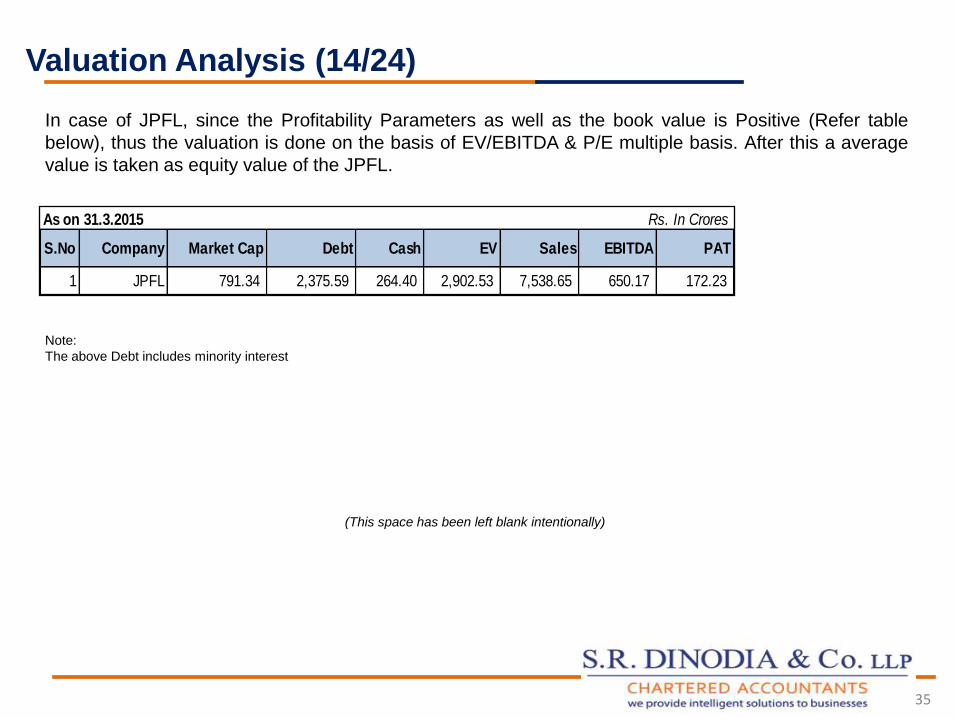
In case of JPFL, since the Profitability Parameters as well as the book value is Positive (Refer table
below), thus the valuation is done on the basis of EV/EBITDA & P/E multiple basis. After this a average
value is taken as equity value of the JPFL.
Note:
The above Debt includes minority interest
Valuation Analysis (14/24)
(This space has been left blank intentionally)
As on 31.3.2015
S.No Company Market Cap Debt Cash EV Sales EBITDA PAT
1 JPFL 791.34 2,375.59 264.40 2,902.53 7,538.65 650.17 172.23
Rs. In Crores

36
1. EV/EBITDA multiple
EV/EBITDA is the most commonly used Market based multiple to value a manufacturing companies. It
takes into account the value and amount of debt a company has, which needs to be paid back at some
point. Apart from this, EV/EBITDA multiple is depended upon the operational efficiency of the company
without getting the impact of capital structure. The valuation as per this method is done after using the
median EV/EBITDA multiple of peer companies.
The Computation has been shown herein below as on 31.3.15:
*The EBDITA & Net Debt used for JPFL is consolidated i.e. including the EBDITA & Net Debt of subsidiaries as per audited financials as on 31.3.15
except 60.40% EBITDA of GNWL.
•Net Debt includes long term debt , short term debt, current maturity of long term debt less cash & cash equivalents. It is not adjusted for minority
interest of Rs. 468 cr.
Valuation Analysis (15/24)
Particulars Rs In Crores
Median EV/EBITDA Multiple (A) 6.16x
EBITDA of JPFL (B) 650.25
Enterprise Value (A*B) 4,005.69
Less: Net Debt 1,403.96
Less: Consolidated Minority
Interest other than GNWL
440.55
Equity Value 2,161.18

37
2. EV/Sales Multiple:
EV/Sales is commonly used in the valuation of companies whose operating costs exceed revenues i.e.
having negative profitability margins. It is regarded as a more accurate measure than the Price/Sales
ratio since it takes into account the value and amount of debt a company has, which needs to be paid
back at some point. Historically JPFL has a steady profitability and even the projections provided by the
management shows the same trends thus, this ratio has not been used for the valuation.
3. P/E Multiple:
The price-earnings ratio (P/E Ratio) is the ratio for valuing a company that measures its
current share price relative to its per share earnings. In essence, the price-earnings ratio indicates the
dollar amount an investor can expect to invest in a company in order to receive one dollar of that
company’s earnings. This is why the P/E is sometimes referred to as the multiple because it shows how
much investors are willing to pay per dollar of earnings. The price-earnings ratio can be calculated as:
(Market Value per Share / Earnings per Share). The Computation has been shown herein below as on
31.3.15:
*The PAT used for JPFL is consolidated i.e. including the PAT of subsidiaries as per audited financials as on 31.3.15 except 60.40% PAT of GNWL
valued separately
Valuation Analysis (16/24)
Particulars Rs In Crores
Median P/E Multiple (A) 8.64x
PAT of JPFL (B) 172.31
Equity Value (A*B) 1,489.38

38
Valuation Analysis (17/24)
4. P/BV Multiple :
This valuation ratio compares a stock's per-share price (market value) to its book value (shareholder’s
equity). The Price/Book value , expressed as a multiplies an indication of how much shareholders are
paying for the net assets of a company. This is a conservative measure to value a firm since this does
not account for the future earning prospects of the company. However since the company has a steady
stream of incomes, this multiple was not considered appropriate
5. Price/Sales Multiple(P/S):
A stock's (P/S ratio) is another stock valuation indicator. The P/S ratio measures the price of a
company's stock against its annual sales, instead of earnings. This ratio shows how many times
investors are paying for every dollar of a company's sales. However the Price to sales ratio does not take
in into account the outstanding Liabilities of a company, accordingly it has not been used.
(This space has been left blank intentionally)
39
Valuation Analysis (18/24)
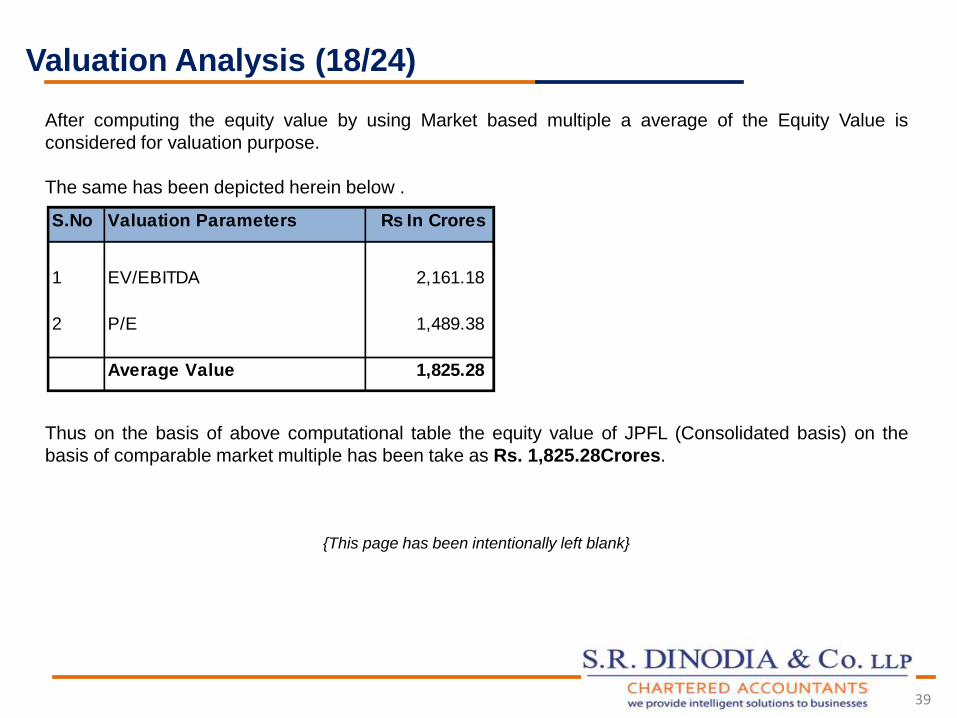
After computing the equity value by using Market based multiple a average of the Equity Value is
considered for valuation purpose.
The same has been depicted herein below .
Thus on the basis of above computational table the equity value of JPFL (Consolidated basis) on the
basis of comparable market multiple has been take as Rs. 1,825.28Crores.
{This page has been intentionally left blank}
S.No Valuation Parameters Rs In Crores
1 EV/EBITDA 2,161.18
2 P/E 1,489.38
Average Value 1,825.28
Valuation Analysis (19/24)
40Strictly Private and Confidential
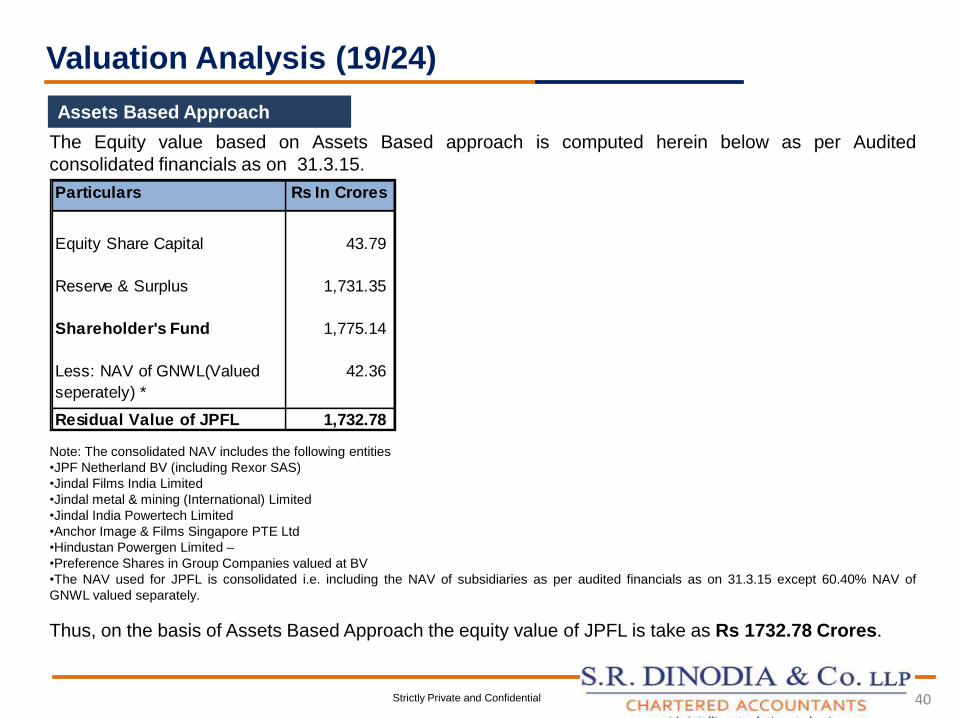
The Equity value based on Assets Based approach is computed herein below as per Audited
consolidated financials as on 31.3.15.
Note: The consolidated NAV includes the following entities
•JPF Netherland BV (including Rexor SAS)
•Jindal Films India Limited
•Jindal metal & mining (International) Limited
•Jindal India Powertech Limited
•Anchor Image & Films Singapore PTE Ltd
•Hindustan Powergen Limited –
•Preference Shares in Group Companies valued at BV
•The NAV used for JPFL is consolidated i.e. including the NAV of subsidiaries as per audited financials as on 31.3.15 except 60.40% NAV of
GNWL valued separately.
Thus, on the basis of Assets Based Approach the equity value of JPFL is take as Rs 1732.78 Crores.
Assets Based Approach
Particulars Rs In Crores
Equity Share Capital 43.79
Reserve & Surplus 1,731.35
Shareholder's Fund 1,775.14
42.36
Residual Value of JPFL 1,732.78
Less: NAV of GNWL(Valued
seperately) *
Valuation Analysis (20/24)
41Strictly Private and Confidential
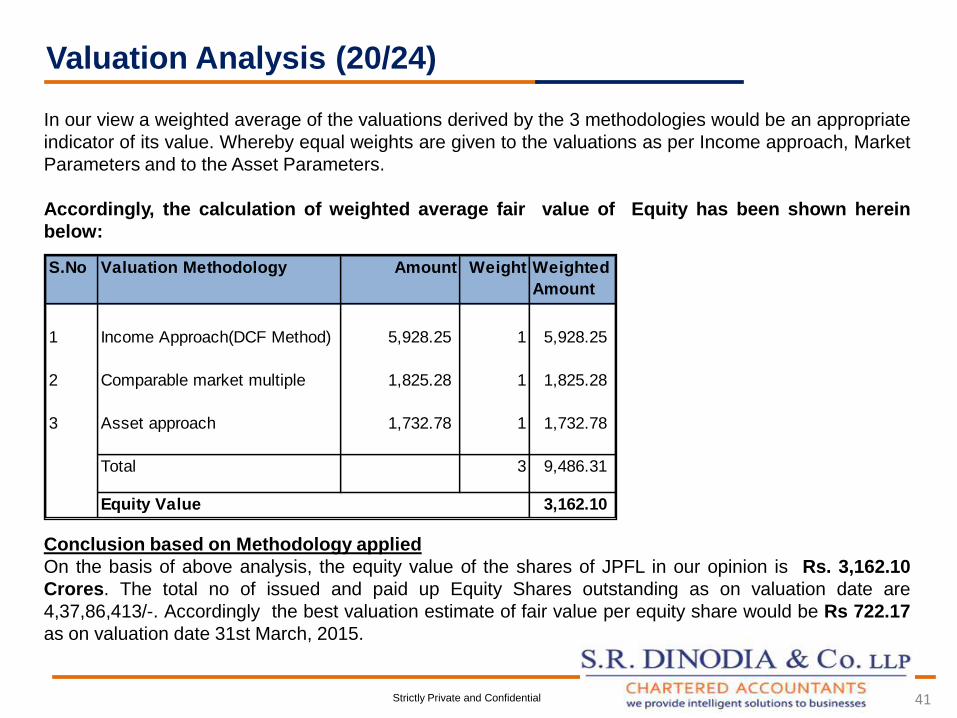
In our view a weighted average of the valuations derived by the 3 methodologies would be an appropriate
indicator of its value. Whereby equal weights are given to the valuations as per Income approach, Market
Parameters and to the Asset Parameters.
Accordingly, the calculation of weighted average fair value of Equity has been shown herein
below:
Conclusion based on Methodology applied
On the basis of above analysis, the equity value of the shares of JPFL in our opinion is Rs. 3,162.10
Crores. The total no of issued and paid up Equity Shares outstanding as on valuation date are
4,37,86,413/-. Accordingly the best valuation estimate of fair value per equity share would be Rs 722.17
as on valuation date 31st March, 2015.
S.No Valuation Methodology Amount Weight Weighted
Amount
1 Income Approach(DCF Method) 5,928.25 1 5,928.25
2 Comparable market multiple 1,825.28 1 1,825.28
3 Asset approach 1,732.78 1 1,732.78
Total 3 9,486.31
Equity Value 3,162.10
Valuation Analysis (21/24)
42
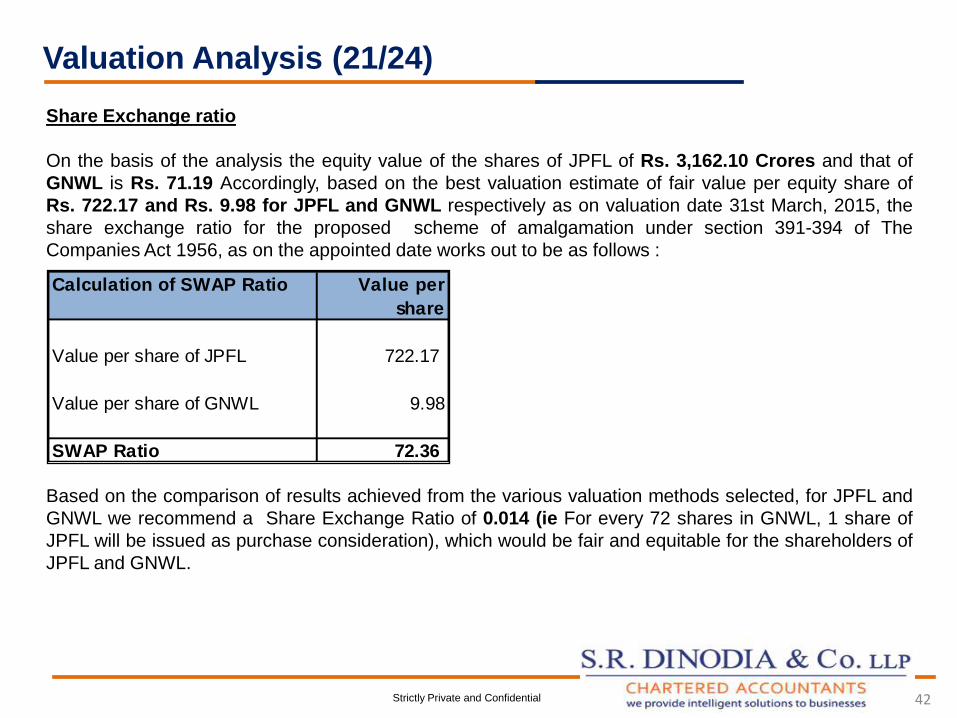
Share Exchange ratio
On the basis of the analysis the equity value of the shares of JPFL of Rs. 3,162.10 Crores and that of
GNWL is Rs. 71.19 Accordingly, based on the best valuation estimate of fair value per equity share of
Rs. 722.17 and Rs. 9.98 for JPFL and GNWL respectively as on valuation date 31st March, 2015, the
share exchange ratio for the proposed scheme of amalgamation under section 391-394 of The
Companies Act 1956, as on the appointed date works out to be as follows :
Based on the comparison of results achieved from the various valuation methods selected, for JPFL and
GNWL we recommend a Share Exchange Ratio of 0.014 (ie For every 72 shares in GNWL, 1 share of
JPFL will be issued as purchase consideration), which would be fair and equitable for the shareholders of
JPFL and GNWL.
Strictly Private and Confidential
Calculation of SWAP Ratio Value per
share
Value per share of JPFL 722.17
Value per share of GNWL 9.98
SWAP Ratio 72.36
Valuation Analysis (22/24)
43
Further, we understand that as decided by the Board of JPFL vide resolution dated 6th August 2016 the
remaining 39.60% of equity shares of GNWL are to be purchased by JPFL. This exercise has been
completed by 11th August 2016, and accordingly as on the date of issue of this report all the shares held
by JPFL in GNWL would be cancelled on a merger under the Scheme of Amalgamation u/s 391-394 of
the Companies Act, 1956.
This report is subject to the Statement of Limiting Conditions.
Strictly Private and Confidential
For S.R. DINODIA & CO. LLP,
CHARTERED ACCOUNTANTS
FIRM REGN. NO.: 001478N/N500005
(PALLAVI DINODIA GUPTA)
P A R T N E R
M.NO. 500618
PLACE: NEW DELHI
DATED: 23RD AUGUST, 2016
Valuation Analysis (23/24)
44
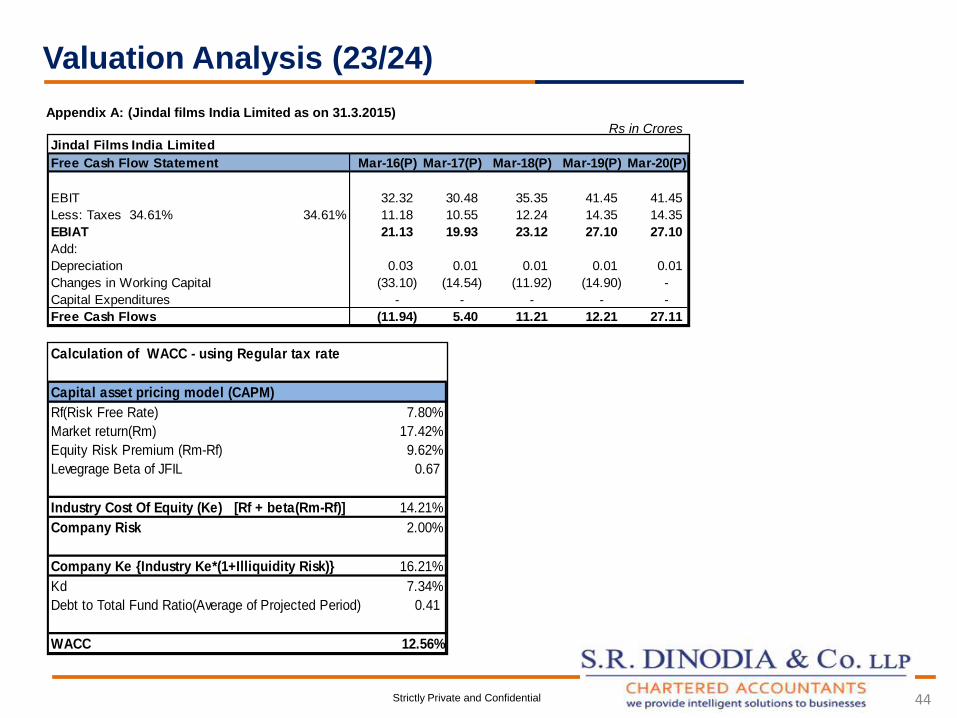
Appendix A: (Jindal films India Limited as on 31.3.2015)
Rs in Crores
.
Strictly Private and Confidential
Jindal Films India Limited
Free Cash Flow Statement Mar-16(P) Mar-17(P) Mar-18(P) Mar-19(P) Mar-20(P)
1 2 3 4
EBIT 32.32 30.48 35.35 41.45 41.45
Less: Taxes 34.61% 34.61% 11.18 10.55 12.24 14.35 14.35
EBIAT 21.13 19.93 23.12 27.10 27.10
Add:
Depreciation 0.03 0.01 0.01 0.01 0.01
Changes in Working Capital (33.10) (14.54) (11.92) (14.90) -
Capital Expenditures - - - - -
Free Cash Flows (11.94) 5.40 11.21 12.21 27.11
Calculation of WACC - using Regular tax rate
Capital asset pricing model (CAPM)
Rf(Risk Free Rate) 7.80%
Market return(Rm) 17.42%
Equity Risk Premium (Rm-Rf) 9.62%
Levegrage Beta of JFIL 0.67
Industry Cost Of Equity (Ke) [Rf + beta(Rm-Rf)] 14.21%
Company Risk 2.00%
Company Ke {Industry Ke*(1+Illiquidity Risk)} 16.21%
Kd 7.34%
Debt to Total Fund Ratio(Average of Projected Period) 0.41
WACC 12.56%
Valuation Analysis (24/24)
45
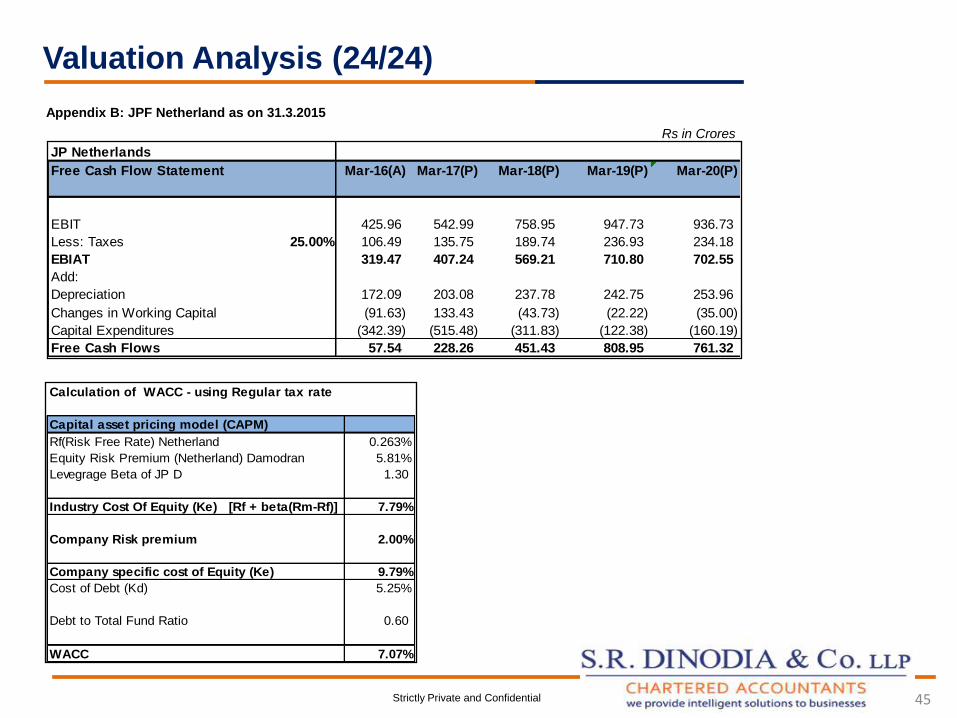
Appendix B: JPF Netherland as on 31.3.2015
Rs in Crores
.
Strictly Private and Confidential
Calculation of WACC - using Regular tax rate
Capital asset pricing model (CAPM)
Rf(Risk Free Rate) Netherland 0.263%
Equity Risk Premium (Netherland) Damodran 5.81%
Levegrage Beta of JP D 1.30
Industry Cost Of Equity (Ke) [Rf + beta(Rm-Rf)] 7.79%
Company Risk premium 2.00%
Company specific cost of Equity (Ke) 9.79%
Cost of Debt (Kd) 5.25%
Debt to Total Fund Ratio 0.60
WACC 7.07%
JP Netherlands
Free Cash Flow Statement Mar-16(A) Mar-17(P) Mar-18(P) Mar-19(P) Mar-20(P)
1 2 3 4 5
EBIT 425.96 542.99 758.95 947.73 936.73
Less: Taxes 25.00% 106.49 135.75 189.74 236.93 234.18
EBIAT 319.47 407.24 569.21 710.80 702.55
Add:
Depreciation 172.09 203.08 237.78 242.75 253.96
Changes in Working Capital (91.63) 133.43 (43.73) (22.22) (35.00)
Capital Expenditures (342.39) (515.48) (311.83) (122.38) (160.19)
Free Cash Flows 57.54 228.26 451.43 808.95 761.32
46
This valuation is subject to the following limiting conditions:
This report has been prepared for the purpose of determining / estimating the Fair Value per Equity share of the Company
based on the international / generally accepted valuation methodologies. The valuation is based on the company’s audited
financial statements as on 31st March, 2015, on the projections provided by the Company and on the basis of information
available in public domain. The Terms of our engagement were such that we were mandated to rely upon the information
provided to us by the client with no further due diligence.
Since, the scope of work did not include any due diligence procedures - We have not conducted a site review of the subject
business premises, nor have we reviewed any of the business financials or projections provided by the representatives of the
Company. We do not imply that it should not be construed that we have verified any of the information provided to us, or that
our inquiries could have verified any matter, which a more extensive examination might disclose. As valuers we are unable to
comments / verify the achievability of the projections provided to us and have been taken on an as is where is basis for the
valuation exercise with no further enquires or due diligence.
By this report SRD is not purporting to advice the investor or investee companies on the prudence of the investment.
Neither SRD nor any of its employee undertakes responsibility in any way whatsoever to any person in respect of any errors in
this report arising due to limited time and information available to us
The liability if any as a consequence of this Valuation report shall be limited to the professional fees paid to SRD by the
Company for this assignment, SRD shall not be responsible for any loss to the Company or any third parties who have relied
on this report.
This report and the information provided herein is the sole Intellectual property of SRD and SRD holds its complete copyrights.
No part of this report shall be reproduced/ copied/ extracted etc. without the express permission of SRD in writing, which shall
not be unnecessarily withheld.
SRD has not undertaken responsibility to update this report for the events and circumstances occurring after the valuation
date. This report is purely recommendatory in nature. S.R. Dinodia & Co. LLP’s.
Statement of Limiting Conditions Annexure A

47
ASSURANCE SERVICES
Advisory Services
Management Assurance
SocioConnect Assurance
Statutory Assurance
Business Valuation
CapitalConnect
Corporate Finance Advisory
Mergers and Acquisitions & Re-
structuring
Sales, Divestitures and Demergers
Transaction Evaluation (Due
Diligence)
Negotiation & transaction
Management
TAXATION SERVICES
Direct Taxation Advisory
Taxation Litigation Services
Cross Border Taxation
TaxConnect Services
REGULATORY ADVISORY
SERVICES
Corporate Law
EthiConnect
Foreign Exchange Law
Limited Liability Partnership Law
For further details, contact
Sandeep Dinodia,
Sr. Partner
Tel: 011-43403305
Pallavi Dinodia,
Partner
Tel: 011-43703311
S. R. DINODIA & Co. LLP.
K-39, Connaught Place,
New Delhi – 110001, INDIA
Telephone: 91-11-4370 3300
Fax : 91-11-41513666
E-mail : [email protected]
Website : www.srdinodia.com
TRANSACTION ADVISORY
SERVICES