value and of impactimpact basque eeeeconomicconomic language · 5. introduction this general report...
TRANSCRIPT

VALUE AND VALUE AND VALUE AND VALUE AND
EEEECONOMICCONOMICCONOMICCONOMIC IMPACTIMPACTIMPACTIMPACT
OF OF OF OF BASQUE LANGUAGE

2.
INDEX
0/ GENERAL RESULTS................................................................................................................ 4
INTRODUCTION ........................................................................................................................................... 5
0.1/ OBJECTIVE .......................................................................................................................................... 5
0.2/ SECTORS IN THE SCOPE OF STUDY................................................................................................. 6
0.3/ CRITERIA USED TO DEFINE ACTIVITIES IN THE BASQUE LANGUAGE SECTOR ........................... 7
0.4/ DIRECT, INDIRECT AND INDUCED IMPACT ................................................................................... 7
0.5/ METHODOLOGICAL PHASES ............................................................................................................ 8
0.6/ FINAL RESULTS................................................................................................................................. 12
1/ GENERAL OVERVIEW ........................................................................................................ 15
1.1/ ECONOMIC IMPACT OF LANGUAGES ........................................................................................... 16
1.2/ PARTICULAR CHARACTERISTICS OF BASQUE LANGUAGE ......................................................... 16
1.3/ DEFINITION OF SECTORS LINKED TO BASQUE LANGUAGE ...................................................... 16 1.3.1/ General considerations ...................................................................................................... 16 1.3.2/ Criteria to classify sectors ................................................................................................. 17 1.3.3/ General description of sectors and subsectors ............................................................ 18 1.3.4/ Difficulties to assess the economic activity of the Basque language sectors ......... 20
2/ EMPLOYMENT IN BASQUE LANGUAGE SECTORS ................................................. 21
2.1/ DIRECTORY OF BAC ECONOMIC ACTIVITIES (EUSTAT, 2014) ............................................... 22
2.2/ DEFINITION OF THE SCOPE OF STUDY: CONFIGURATION OF THE DATABASE OF
COMPANIES, ASSOCIATIONS AND ORGANIZATIONS ................................................................. 22
2.3/ COMPARISON BETWEEN THE OFFICIAL CLASSIFICATION OF ECONOMIC ACTIVITIES
(CNAE) AND LANGUAGE SECTORS ............................................................................................ 23
2.4/ PROCEDURE TO CALCULATE THE BASQUE LANGUAGE COEFFICIENT TO APPLY TO
EACH BRANCH OF ACTIVITY ......................................................................................................... 24

3.
2.5/ RESULTS OF THE PROCEDURE TO CALCULATE EMPLOYMENT CORRESPONDING TO
THE SCOPE OF STUDY AND TO BASQUE LANGUAGE ................................................................ 27 2.5.1/ Language industry ................................................................................................................ 28 2.5.2/ Industry of culture and the media ................................................................................... 36 2.5.3/ Activities in the area of education and universities ..................................................... 52 2.5.4/ Public administration ........................................................................................................... 64 2.5.5/ TOTAL employment generated by Basque language sectors ................................... 70
3/ ECONOMIC DATA FOR BASQUE LANGUAGE SECTORS .................................... 71
3.1/ METHODOLOGY ............................................................................................................................. 72
3.2/ GROSS VALUE ADDED AND GROSS DOMESTIC PRODUCT ...................................................... 73
3.3/ ECONOMIC DATA OF BASQUE LANGUAGE SECTORS ............................................................... 73
3.4/ ECONOMIC DIMENSION OF THE BASQUE LANGUAGE .............................................................. 79
4/ ECONOMIC IMPACT OF THE BASQUE LANGUAGE ................................................ 81
4.1/ METHODOLOGICAL CLARIFICATIONS .......................................................................................... 82
4.2/ DIRECT AND INDIRECT ECONOMIC IMPACT ............................................................................... 87 4.2.1/ Output Value ........................................................................................................................ 87 4.2.2/ Gross Value Added ............................................................................................................. 90 4.2.3/ Employment .......................................................................................................................... 92
4.3/ INDUCED IMPACT ........................................................................................................................... 94 4.3.1/ Methodological procedure ............................................................................................... 94 4.3.2/ Induced impact ..................................................................................................................... 95
4.4/ TOTAL ECONOMIC IMPACT OF BASQUE LANGUAGE ................................................................ 95 4.4.1/ Value of production ……. ................................................................................................. 95 4.4.2/ Gross Value Added ............................................................................................................. 98 4.4.3/ Employment ....................................................................................................................... 101
5/ CONTRIBUTION OF BASQUE LANGUAGE TO THE GDP OF THE BASQUE ECONOMY ....................................................................................................... 104
5.1/ PROCEDURE TO CALCULATE THE GDP OF BASQUE ............................................................... 105 5.1.1/ Regarding the usefulness of GDP ................................................................................. 105 5.1.2/ Procedure used to calculate the GDP of Basque ..................................................... 105
5.2/ IMPORTANCE OF BASQUE LANGUAGE IN THE BASQUE ECONOMY ..................................... 106

4.
GENERAL RESULTATSGENERAL RESULTATSGENERAL RESULTATSGENERAL RESULTATS 0000....

5.
Introduction
This general report corresponds to the study carried out by the Siadeco Research Society for the
Basque Government Department of Education, Language Policy and Culture.
This first section of the report consists of a short presentation of the whole study, in which aspects
of the methodological procedure, as well as the main results obtained are described.
0.1/ Objective
Objective: measure the dimension and the economic impact of Basque language.
The objective of the study has consisted of recognizing the contribution made by Basque language to
the economy of the Basque Autonomous Community, measure the economic wealth generated and
quantify the dimension and economic value of Basque language sectors. Many studies have been made
on Basque language from the perspectives of sociology and philology; however, there are very few
studies carried out from the point of view of the economic sciences, to analyse the market that
moves around Basque in the economic context of the BAC and measure its impact. After recognizing
the initiatives and voluntary work by social agents, who are vital in the process of the normalization
of Basque, this study clearly shows that Basque language is another activity sector in the Basque
economy. In addition to public activity led by public administrations, Basque accounts for an ever
growing market, as well as its own industry, and these private market activities, which are closely
linked to the Basque language, constitute activity sectors that generate employment in the Basque
economy. The most common macroeconomic variables used to measure the importance of a
determined sector in the economy of a country are employment, Gross Value Added (GVA),
Production Value (PV) and the Gross Domestic Product (GDP); therefore, the final result of this
study will consist of applying these variables to the Basque language sectors language and their
comparison with general data of the BAC.

6.
0.2/ Sectors in the scope of the study
Four main activity sectors in the study: language industry; industry of culture and the media in Basque; education in Basque; and public administration services to promote Basque language and Basque
culture.
When quantifying the importance of Basque language as an economic sector, besides the structures
and services belonging to the public administrations to promote Basque and Basque culture, we have to also bear in mind the employment and value added generated by Basque language sector activities
belonging to the private economic sector. When carrying out this economic study, four main sectors linked to language were distinguished; two of them may be considered as belonging to the private
economy (the language industry, and the industry of culture and media in Basque), a third is linked to the public administration (promotion of Basque language and culture) and the fourth is mixed, i.e. it
includes both public and private institutions (education and university):
- Language industry: this first sector includes the teaching of Basque language, translation and interpreting, language consultancy, the production and dissemination of the corpus of
- Basque, and language technology activity sectors. In all of these activities language constitutes the object of the activity, and the sector is made up of companies, associations and organizations that offer products and services aimed at developing, teaching, using or disseminating Basque.
- Industry of culture and media: culture sectors that have Basque language as an indispensable element or resource; specifically the books and music industry in Basque and the audio-visual industry in Basque, the performing arts, bertsolaritza (ad-lib poetry-singing), media in Basque, Basque language associations, and other agents from the sphere of communications, culture and social activities.
- Activities related to education and universities: language being an indispensable resource to develop teaching, while also being aware of the great importance that the education system has in the transmission and use of a language, and bearing in mind the effort carried out by the public administration to make the education system of the BAC Basque speaking, employment and other economic variables associated with education imparted in Basque have been calculated, from infant and primary education to the stage of university studies.
- Public Administration: given the importance of culture in Basque with regard to the volume of the cultural industry in the BAC in general, in this fourth sector, in addition to the structure and employment of services to promote the Basque language, part of the employment in the cultural area of the public administrations has also been taken into account.

7.
0.3/ Criteria used to define activities in the Basque language sector
This study does not measure the economic impact of services and activities developed in Basque, but
the economic impact of activity sectors closely linked to language.
Taking into account the four language sectors previously mentioned, while including other economic
sectors in addition to those directly linked to the promotion and use of language, two criteria have
been taken into account in order to define which activities make up the Basque language sector and
which do not. On the one hand, they must be services or products closely linked to language, and on
the other, language must be an indispensable element of the activity or the product, the language
used must be Basque.
0.4/ Direct, indirect and induced impact
Economic impact: direct, indirect and induced.
In economic studies in order to measure the economic impact or influence of a sector in the
economy of a country, direct, indirect and induced impacts are taken into account, which are also
considered in this study relating to Basque language sectors. Firstly, the personnel employed in the
Basque language activity sectors has been quantified. As Basque language sectors are supplied by
companies from other sectors located in the BAC, the production of Basque language sectors also
influences the production of these sectors, creating an indirect economic impact. Finally, part of the
family income, which corresponds to direct and indirect employment generated by Basque language,
is used for internal consumption, and therefore to calculate the induced impact of Basque, the impact
that this internal consumption has on the productive economy of the BAC has been measured.

8.
0.5/ Methodological Phases
Working methodology: the magnitudes of the economic impact of this study have been
calculated by crossing the results of direct information collected by Siadeco with Eustat
economic data.
Here is the methodology used to carry out this economic study and the main phases of the process:
Phase 1: Definition of language sectors and subsectors. 4 general sectors and 20 subsectors.
I. INDUSTRY OF
LANGUAGE
II. INDUSTRY OF CULTURE
AND MEDIA
III. ACTIVITIES IN
EDUCATION AND
UNIVERSITIES
IV. PUBLIC
ADMINISTRATION
I.1. Teaching Basque
I.2. Translation
I.3. Language services and
consultancy
I.4. Preparation and
dissemination of a
corpus of Basque
I.5. Development and
spread of language
technologies
II.1. Book industry
II.2. Music industry
II.3. Self-employed creators
of culture
II.4. Industry of the audio-
visual media
II.5. Stage arts
II.6. Bersolarismo (ad-lib
poetry-singing)
II.7. Media
II.8. Basque Associations
II.9. Other associations and
companies in the area
of communications,
culture and society
III.1. Infant and Primary
Education
III.2. Secondary Education
III.3. University Education
III.4. Other education
activities
IV.1. Resources of the
Basque public
administrations
IV.2. Resources of public
administration in
culture and their
autonomous bodies
SE
CT
OR
ES
SU
BS
EC
TO
RE
S

9.
Phase 2: Definition of the area of work; complete a directory of companies, associations and
organizations from each sector and subsector.
Based on the Directory of Economic Activities in 2014 by EUSTAT, a list of businesses that belong to area of this study was created, which includes 10,195 businesses. After completing the list, several different sources of information were used and 309 businesses were added, which had not been included previously. Thus, the database generated for this study has 10,504 registers altogether.
Phase 3: Classification of activity branches according to employment attributable to Basque
language.
While the employment of some activity branches is totally linked to Basque, such as the case of the euskaltegis (Basque language centres), in other activity branches only part of the employment has been attributed to Basque, as occurs in the case of the Official Language Schools or companies and self-employed workers in the translation sector.
Phase 4: Analysis by data sectors of different studies and sources of information.
Using different studies and sources of information according to subsectors and activity branches, the greatest amount of data possible was collected to obtain information that makes it possible to estimate employment attributable to the Basque language.
Phase 5: Direct collection of data and surveys carried out in companies, in order to find out the
employment and production value relating to the Basque language.
In companies from sectors in which the necessary data for the estimation of employment attributable to Basque has not been obtained, a survey was carried out. A survey was specifically developed and directed at a strategic sample of 336 businesses altogether.
Phase 6: Calculation of the Basque language coefficients applicable to employment in each activity branch.
The Basque language coefficients to apply to each activity branch were calculated using, on the one hand, the results of surveys carried out in companies, and on the other hand, economic data by sectors collected previously, as well as the data on the level of production in Basque. The Basque language coefficient indicates the percentage corresponding to Basque language with regard to the total employment in each activity branch.
Phase 7: Calculation of employment corresponding to Basque.
Employment related directly to Basque language was calculated, multiplying the figure in realtion to total employment of the companies, associations and organizations in each branch of activity by the previously calculated Basque language coefficient.
Phase 8: Calculation of the economic macro magnitudes of the economic value of Basque.
Once employment directly related to Basque is known and using the ratios of the economic data from the Survey on Services obtained through EUSTAT, the variables that indicate the economic value and dimension of Basque language were calculated: employment corresponding to Basque sectors, personnel costs, Gross Value Added and turnover volume.

10.
Phase 9: Measuring the indirect economic impact of Basque language sectors.
Expenditure and investment that companies of these activity branches carry out in the same sector or in other sectors were calculated, applying the technical coefficients of Eustat Input/Output tables on a BAC level. This expenditure and investment was considered to be the indirect economic impact of the Basque sectors.
Phase 10: Calculation of induced impact.
In order to calculate the induced impact, the Leontief coefficients of the Input-Output tables were used. The induced impact depends on the impact of the income generated by employment directly and indirectly related to Basque language and to the consumption derived from this income with an impact on the final demand of BAC economic sectors.
Phase 11: Calculation of the importance of Basque, as an economic sector, on the Gross Domestic
Product of the BAC.
After adding net taxes on products to the total Gross Value Added of the direct, indirect and induced impact of Basque sectors, the part corresponding to Basque sectors within the whole Gross Domestic Product of the BAC was calculated. In order to calculate the amount of net taxes on products, first the amount levied by the Gross Value Added tax was calculated (depending on the type of VAT corresponding to each product or type of service), and then, the amount of subsidies for the promotion of Basque and culture in Basque awarded by public administrations was subtracted.

11.
Image: Diagram of the procedure used to calculate the direct, indirect and induced impact of Basque language
on the Basque economy

12.
0.6/ Final Results
As the results about the economic value and the dimension of the Basque language show, the
contribution made to the Basque economy by the Basque language sectors is significant. 6.3%
of employment is generated by the BAC economy and 4.5 % of Gross Value Added is linked
to Basque language. As an economic sector, 4.2 % of the Gross Domestic Product of the
Autonomous Community corresponds to Basque, close to the importance of the tourism
sector in the Basque economy (5.8 % of the GDP).
� Language industry
If we observe direct employment among companies and organizations in the area of language
industries, the activities of this first Basque language sector generate employment for 2,500 jobs
altogether, most being employed in euskaltegis (Basque language schools) (1,316) and as translators
(485). The volume of annual turnover of jobs and services linked to Basque within the language
industry is slightly more than 136 million per year producing a Gross Value Added of 107 million. We
must bear in mind that these economic data do not correspond to the whole of language industry,
but to economic activities linked to Basque language.
� Culture industry and the media
Direct employment related to Basque language within the area of cultural production and the media
comes to 4,550 jobs altogether. This second sector of Basque moves around 407 million euros a
year. These activities are related to Basque language and generate greater employment: associations
and companies providing cultural, leisure and social services (764 jobs); companies from the area of
communications and advertising (627 jobs); self-employed creators (616 jobs). The area of culture
and the media in Basque generates a Gross Value Added of 227 million a year.
� Activities in the area of education and universities
Economic variables associated with the education system in Basque, as well as university activity and
other education activities in Basque show very high figures; in formal pre-university education, the
employment estimated at all levels of education, from Infant Education to the end of Baccalaureate or
Technical Training, is 31,000 jobs. To this figure we have to add employment linked to credits in
which are offered at university, and represent another 3,000 jobs.
The system education in Basque gives employment to a total of 34,000 persons; around 20,000
persons in Infant and Primary Education, 11,000 in Secondary Education (including Baccalaureate and
Technical Training) and another 3,000 in university studies.

13.
� Public administration
According to data from the study by the Vice-Ministry for Language Policy of the Basque
Government on human resources available at public administrations and the economic resources
awarded for the promotion of Basque, the number of persons from the administration employed in
different services and areas of Basque is 716. In addition, based on the study of the Basque Culture
Observatory of the Basque Government, part of the employees of the public administration who
work in the area of culture generated or disseminated in Basque was included in this study. It is
estimated that employment attributable to Basque from the area of public administration culture is
795 jobs. Therefore, Basque generates 1,511 jobs altogether in the public administration.
� Economic dimension of Basque language
The sum of the economic data calculated for the four Basque language sectors included in this study
shows the magnitude of the value and economic dimension of Basque. The Basque language sectors
generate almost 43,000 jobs altogether (direct jobs) and almost 1,900 million Gross Value Added a
year.
The economy of the Basque Autonomous Community generates a total of 894,000 jobs and, bearing
in mind that direct employment generated by Basque language activity sectors accounts for 42,700
jobs, employment linked to Basque represents 4.78% of the total employment in the BAC. Almost
80% of direct employment corresponds to the education sector, around 10% corresponds to the
culture and media sector, 6% to the language industry and the remaining 4% corresponds to public
administration employment.
Annual Gross Value Added of the BAC economy is around 61,000 million euros. The annual GVA of
the Basque economy is 1,900 million, by which Basque constitutes 3.07% of BAC Gross Value Added
(taking into consideration only the direct impact).
� Indirect impact and induced impact
Based on employment generated directly by the Basque sectors and on the Gross Value Added data,
and applying the technical coefficients of the Eustat BAC Input-Output tables and the Leontief
coefficients, the indirect impact and the economic data of the induced impact of Basque were
calculated.
It is estimated that the economic activities of the Basque language sectors generate, indirectly, 3,478
jobs in other sectors. In addition, the induced economic effect by consumption and demand
generated from income corresponding to direct employment (42,724) and indirect employment
(3,478) from the Basque sector generate another 9,670 jobs in the productive economy of the BAC
(induced employment).

14.
233 million euros a year of Gross Value Added from other activity sectors correspond to economic
transactions of Basque language sectors (indirect impact); by which the GVA of the induced impact
would be almost 651 million euros.
� Contribution of Basque language to the Basque economy
These are the final macroeconomic results of the direct, indirect and induced impact of the Basque
language sectors:
• Employment: 6.28 % of the total employment of the Basque economy is generated by Basque language sectors; total employment in the BAC is 893,952 jobs and the figure for the Basque sector is 56,142 jobs, taking into consideration direct, indirect and induced employment. From this figure, almost 43,000 jobs are generated directly by activities related to Basque, almost 4,000 are indirect and another 10,000 are induced.
• Gross Value Added : 4.5% of Gross Value Added of the BAC economy is related to economic activities linked to Basque. Total GVA of the BAC is almost 61,000 million euros and the figure corresponding to the Basque sectors is over 2,751 million euros.
• Gross Domestic Product: 4.19% of the Gross Domestic Product of the BAC corresponds to economic sectors directly or indirectly linked to Basque. The total GDP of the BAC is 66,775,970,000 euros (in 2012) and the figure corresponding to Basque is 2,800,634,000 euros.
Given the above macro-economic variables, we may conclude that the data for the economy
generated by Basque language, both directly and indirectly, are significant, and that Basque has a great
value in economics terms. In addition to jobs and resources linked to the administration, the
economic sectors that work in relation to Basque generate a lot of employment and a great value
added.
In order to compare the economic importance of the Basque language sector with that of other
activity sectors, and taking Eustat data into consideration, we should point out that the contribution
of 4.19% of this sector to the GDP is higher than the figure corresponding to total expenditure on
R&D&i in the BAC (2.12% of GDP) and slightly below that corresponding to the tourism sector
(5.8% of the GDP).

15.
GENERAL OVERVIEWGENERAL OVERVIEWGENERAL OVERVIEWGENERAL OVERVIEW 1.1.1.1.

16.
1.1/ Economic Impact of languages Language is used in every economic activity, as it is an indispensable means of communication; in
every production process, promotion, distribution and commercialization one or more languages are
used to organize the work, create, offer and exchange goods and services. From this point of view,
language is necessary in all relations and communications between persons, companies and
organizations, and without it no economic activity is possible at all.
However, this study was not carried out from this perspective, but with the aim to quantify the value
of Basque language in economic terms and know its contribution to the economic activity of the
BAC; the aim was to measure the economic wealth that Basque generates, as a productive sector, as
well as its impact on the Basque economy.
1.2/ Particular characteristics of Basque language
When carrying out a study to measure the economic impact of Basque language, you have to take
into account certain particularities that this language presents compared with other stronger and
standard languages such as Spanish and others of a transnational character. When assessing the
importance and weight of Basque in the economy of the BAC, it is not correct to limit ourselves to
the sectors in which the language itself is part of the product. It is also necessary to take into
account, on the one hand, the effort made by public administrations to normalize Basque, and on the
other, the increase that has occurred over recent years in the market of products and services linked
to Basque; the increase in products in Basque generated in the area of the media and culture. In
addition, we should also highlight the effort to spread the use of Basque throughout the education
system. Therefore, when quantifying the impact of Basque on the economy of the BAC, besides the
sector linked to the language industry, we have also taken into account the sector of the culture and
media industry; the education system; and resources earmarked for the area of Basque language and
culture in Basque by the public administrations.
I.3/ Definition of sectors linked to Basque language
1.3.1/ General considerations
The first task was to clearly define conceptually, which economic activities are directly linked to
language. At one extreme, as already indicated, is the view that every economic activity and every
commercialized product or service needs language in order to communicate and for other phases in
the commercialization chain.

17.
The other extreme consists of limiting ourselves solely to the language industry, i.e. consider only
economic activities linked to producing and developing a corpus of Basque (language services,
language teaching, language technologies, publishing, etc.).
The point of view adopted to develop this study is in an intermediate position between the two
approaches indicated. Applying this point of view, we have identified the products and services linked
to language, i.e. sectors where language constitutes the object of the activity or is an indispensable
element of the activity.
However, to define the degree of link between products and services and language and to thus define
the object of the study, would give rise to difficulties, as different criteria may be used which could
lead to an endless debate.
1.3.2/ Criteria to classify sectors Activity linked to Basque language may be classified according to the function that language itself
fulfils in the activity and according to the public or private character of the promoter of the activity.
► According to the functions of language:
A first classification depends on the function that language fulfils in the public or private company,
association and organization activity.
♦ Language as an object of the activity: we are speaking of activities and services whose objective is the development and dissemination of language itself; they are economic activities closely linked to language and we consider that they constitute the language industry: we refer to the teaching of Basque, translation and interpreting, language services and consultancies, the development and dissemination of a corpus of Basque and the development of language technologies.
♦ Language as an indispensable element or resource of the activity: we are speaking of activity sectors where language is an indispensable input or resource in the product or service offered; mainly products/services generated and produced which refer to the use of language: we refer to the book and music industry, audio-visual media, the performing arts, bertsolaritza (ad-lib poetry-singing), the media, activities in the area of communications and advertising, etc. This group, besides activities associated with the culture sector, also includes activity associated with the area of education.
► According to the public or private character of the promoter:
♦ Activities of public administrations: language, education and culture resources corresponding to BAC public institutions.
♦ Activities of social organizations: mainly carried out by non-profit making social organizations in the area of Basque language, culture and leisure.
♦ Company activities: mainly companies with economic activity linked to language, education and culture sectors.

18.
1.3.3/ General Description of sectors and subsectors
In this section we indicate, on the one hand, the activity branches that are taken into consideration
and, on the other, how they were classified when measuring the economic dimension of Basque
language and carrying out calculations of the economic impact. The classification used is divided in
four general sectors with their corresponding subsectors. In any case, to be able to compare the
macroeconomic data corresponding to Basque language sectors with general macroeconomic data
corresponding to the economy of the BAC, and thus know its importance with regard to total
employment or for the total Gross Domestic Product, it is necessary to use data from activity
sectors and branches of official statistics. Therefore, when calculating the final results of the
economic impact of Basque language, we have to compare the classification of sectors and subsectors
created especially for this study with the classification of activity sectors and branches used in general
statistics that reflect the economic magnitudes of the BAC.
Let us now look at which sectors and subsectors are defined for this study:
♦ First sector – Language industry:
This first sector includes all the activity sectors whose aim is to work and extend the corpus
or linguistic aspects of the language. We are referring to design, production and
commercialization activities for products and services linked to teaching, the use and the
treatment of the language. Within this first sector we can distinguish the following
subsectors:
I.1. Teaching Basque (outside the education system): Euskaltegis, Official Schools of Languages and language academies.
I.2. Translation and interpreting work: service companies and self-employed workers.
I.3. Language services and consulting: consultancy services for the design and implementation of Basque plans.
I.4. Development and dissemination of a corpus of Basque: area of the regulation of the language, lexicography and the terminology.
I.5. Language technologies: electronic dictionaries, language processors, language correctors, translation software, learning applications and the use of language, web technologies, etc.
♦ Second sector – Industry of culture and the media:
With regard to the activities in this second group, we consider that language has a direct link
with the generation of the product or service; language is not the main object, as in the first
sector, but is indispensable for the activity. A clear example is books and other similar

19.
products, where products are created from the works of words, language. The subsectors of
this second sector are:
II.1. Book industry: publishing houses, book shops and library services.
II.2. Music industry: record labels, record shops, music promoters and programmers.
II.3. Self-employed creators of culture: writers, musicians and other creators of art and culture.
II.4. Industry of audio-visual media: on the one hand, film, documentary, advertising, TV programme producers, radio programmers and other producers, and on the other hand, cinemas.
II.5. Performance arts: companies and of theatre and dance producers.
II.6. Bertsolaritza (ad-lib poetry-singing): associations and organizations related to bertsolaritza.
II.7. Media: newspapers, magazines, radios and radio services, television, internet and new agencies.
II.8. Basque Language Associations.
II.9. Other associations and companies related to culture and social communication: associations and companies from culture, leisure and social areas; communications and advertising companies; internet services; and documentation centres and other non-university research centres.
♦ Third sector – Activities from the area of education and universities:
The education system is the main pillar of learning and transmitting Basque in the Basque
Autonomous Community. The degree of the relationship of education and university
activities with Basque varies according to the level or stage and the branch of studies. Bearing
in mind these and other criteria, the importance corresponding to Basque was estimated for
this third sector. The subsectors included are:
III.1. Infant and Primary Education: employment corresponding to the teaching in Basque in Infant and Primary Education was estimated.
III.2. Secondary Education: employment corresponding to the teaching in Basque in Compulsory Secondary Education was estimated, Baccalaureate, Technical Training and Early Professional Qualification Programmes.
III.3. University Education: employment corresponding to studies in Basque at the University of the Basque Country, the University of Deusto and Mondragon University was calculated.
III.4. Other education activities: employment corresponding to studies in Basque in other education activities and centres was estimated, applying different coefficients of Basque according to the type of education activity and the degree of relationship with Basque.

20.
♦ Fourth sector – Public Administration:
In the three previous sectors and especially in the Basque language industry, the importance
of the public administration is great. This fourth sector includes employment in services and
structures to promote Basque and, in addition, part of the employment in cultural areas is
managed by public administrations, calculated according to the importance of culture in
Basque with regard to all the cultural activities developed by the administrations. Thus, we
can differentiate between two subsectors:
IV.1. Resources earmarked for the promotion of Basque by public administrations.
IV.2. Cultural resources of public administrations and their dependent autonomous bodies.
1.3.4/ Difficulties to assess the economic activity of the Basque language sectors
Once the object of study has been defined as to measure and assess in economic terms, and once
the limits of the economic reality linked to Basque have been established, statistics and other sources
of official information that include macroeconomic data for these activity sectors were consulted.
However, obtaining economic data for Basque language sectors and calculating the economic
dimension entails certain difficulties:
♦ Firstly, there is not a standard classification that defines the products and activity branches
that are linked to language; the definition of the area of work is, therefore, ethereal, as the
degree of the link between language and the economic sectors may lead to very differing
interpretations; therefore, criteria had to be defined to select the economic sectors and
products which were the object of study.
♦ Secondly, the degree of the link between the products and services and language is also
variable; thus, throughout the process of developing a specific product, language can be an
indispensable element (for example, when writing a book), on the other hand, for other
products, even while a certain link exists, the importance of language in economic terms is
lesser (for example in the music industry).
♦ Thirdly, there are no official statistics which come close to assessing the economic reality of
products and activities linked to language; faced with this situation, we have had to consult
different sources of information and develop specific field work for this study.
♦ Fourthly, in activities linked to language, we have had to assess the importance of Basque
with regard to other languages, for which the coefficient that corresponds to Basque was
calculated.

21.
EMPLOYMENT IN BASQUEEMPLOYMENT IN BASQUEEMPLOYMENT IN BASQUEEMPLOYMENT IN BASQUE
LANGUAGE SECTORSLANGUAGE SECTORSLANGUAGE SECTORSLANGUAGE SECTORS 2222....

22.
2.1/ Directory of BAC Economic Activities (Eustat 2014)
The starting point to obtain economic information corresponding to activity sectors linked to
language was the Eustat Directory of Economic Activities (DIRAE), which shows economic data for
companies in the BAC. This directory is a census of all the businesses in the Autonomous
Community of the Basque Country, which is updated annually, and includes data from the public
administrations and other statistical operations. The data used in this study correspond to the Eustat
Directory for 2014.
Data from the Directory of Economic Activities is structured according to the epigraphs of the
National Classification of Economic Activities (CNAE). Altogether, 629 branches of activity are
defined (with 4 digit codes), of which 51 have been selected as activities linked to language. Even so,
we have to take into account that the Directory of Economic Activities does not include some of the
activities in the scope of this study, and that they are mainly related to the promotion of Basque (for
example, the euskalgintza social organizations). Economic data corresponding to these activities was
calculated using other indirect sources of information.
In addition, we should also bear in mind that a business, although it markets different products or
services, appears in a sole CNAE epigraph in the Directory: corresponding to the main activity of the
business. Thus, although a business may develop products located in different activity epigraphs, it is
only assigned to one.
2.2/ Definition of the scope of study: configuration of the database of companies, associations and organizations
A great effort was made to develop the most complete list possible of companies, associations and
organizations of the 4 general sectors considered and of the corresponding subsectors. One by one,
businesses have been identified corresponding to each subsector by consulting different sources of
information and taking the following steps to complete the directory or basis of initial data:
- Firstly, each of the businesses in the Directory of Economic Activities obtained by Eustat (16,519 businesses altogether), has been located in a sector and subsector defined for this study; thus, the businesses with activities linked to language are located in their corresponding subsector, and those that have no link are left to one side; once this operation has been carried out, the number of businesses decreases from 16,519 to 10,195.

23.
- Secondly, the Directory of Economic Activities is completed with information on companies that do not appear in the census but that belong to the sectors of activity that are the object of this study: 309 companies, associations or organizations altogether have been added. Faced with a lack of economic data and information for both the initial Directory of Economic Activities and some Basque subsectors, we contacted different associations and organizations, and thanks to working in collaboration, we managed to estimate economic data for these subsectors.
In many studies with a similar goal to this, a methodology limited to statistical sources is used that
manages national accounting data and general economic magnitudes, i.e. the direct impact in terms of
employment and turnover is calculated, but without identifying and listing the companies that make
up this sector. The database of businesses and companies that we have generated for this study has
its defects, but the study, from a methodology point of view, has a solid basis given that when we
refer to the economic data of each subsector, we can know what type of economic activity it
corresponds to and the specific companies that have been included in each of them.
2.3/ Comparison between the official classification of economic activities (CNAE) and the language sectors
We then analysed in which epigraph of the CNAE activities corresponding to the 4 sectors and 20
subsectors considered in this study are located. Once the businesses located in each CNAE epigraph
from the initial Directory of Economic Activities are analysed, we can observe that:
1.- The classification of sectors and subsectors created for this study does not coincide with
the classification of the CNAE epigraphs.
2.- Businesses located in the same subsector are located in more than one CNAE epigraph
of the Directory of Economic Activities.
3.- Businesses belonging to the same CNAE epigraph belong to different language
subsectors.
4.- Not all businesses, organizations and associations considered in this study figure in the
Eustat Directory of Economic Activities; therefore, as we have commented before, we
have gone to other sources of information to complete and update the original DIRAE.
24.
2.4/ Procedure to calculate the Basque language coefficient to apply to each branch of activity
Some branches of activity taken into account in this study are completely linked to Basque language:
this is the case of the euskaltegis, bertsolaritza, resources aimed at the public administration
promotion of Basque, etc. In many other branches, the activity, in addition to being linked to Basque
language, is also linked to other languages: translation, the book and music industry, the world of
education, etc. Consequently, in those cases in which the whole of the activity cannot be linked to
Basque, a calculation has been made of the part of the economic activity and employment that is
attributable to Basque. In order to do this, data from sources of indirect information were used to
carry out estimates based on a degree of presence of Basque language in the activity sector; in
addition, Siadeco has carried out field work to obtain the necessary information directly. In this field
work, the companies, associations and organizations consulted were requested to contribute data
that made it possible to estimate what part of total employment could be assigned to Basque.
► Sources of indirect information
The main sources to obtain and analyse sectorial information were the following:
- University of Deusto, Basque and Multilingualism Office, year 2014-2015
- Group EITB – activity reports, 2015
- Publishers Association of the Basque Country, 2012 (publications in Basque of the BAC)
- Association of Friends of Bertsolaritza of Euskal Herria, 2015 (economic calculations on
bertsolaritza carried out for this study)
- University of the Basque Country, Vice Chancellor for Basque Language, year 2014-2015
- University of the Basque Country, Elebilab programme, 2015
- University of the Basque Country, Institute of Basque, 2015
- Basque Government – Statistics on public libraries in the BAC, 2002
- Basque Government – Database of infrastructures of Basque, 2015
- Basque Government – Distribution contact hours in Basque and rest in the education
system, year 2012-2013
- Basque Government – Data Official Language Academies, year 2013-2014
- Basque Government – Vice Ministry for Language Policy (data on persons benefitting
from subsidy awards), from 2000 to 2014
- Basque Government - Vice Ministry for Language Policy – Statistics on budgets and public
resources corresponding to Basque, 2012

25.
- Basque Government – Basque Culture Observatory– Statistics on arts and cultural
industries in the BAC, 2011
- Basque Government – Basque Culture Observatory – Statistics on expenditure and
funding in culture, 2012
- Eustat, 2014 (Directory of Economic Activities)
- Eustat, 2014 (Education statistics)
- Eustat, 2012 (Survey of services and economic data produced by Eustat for this study)
- HABE (Employment at public and private euskaltegis, year 2013-2014)
- Langune, 2014
- Mondragon University, year 2014-2015
- Topagunea – Federation of Basque Language Associations, 2007 (employment and
budgets of Basque associations)
► Collecting direct information
The activity sectors that had to be consulted to calculate the Basque language coefficient, through
strategic samples integrated by large associations or companies in each activity sector, were the
following:

26.
Table 1: Sample from the survey carried out in companies, according to the activity sector
Sector Subsector Type of activity
No. of
businesses
consulted
Weight (%) of
the sample on
total
employment of
activity type
I.
Industry of
language
Non-formal
teaching of
Basque
Language academies 23 19.6
Translation Translation service
companies 26 65.8
Development and dissemination of language
technologies 9 98.4
II.
Industry of the
culture and of
the media
Music Music Promoters and
programmers 15 78,0
Industry of
audio-visual
media
Producers of films,
documentaries,
advertising, radio and
television programmes,
ITC and video
26 14,3
Media
Publication of
newspapers and
magazines, radio and
television services,
internet and news
agencies
97 86,4
Other
associations and
companies from
communications,
culture and
social areas
Other associations and
companies from culture,
leisure and social areas.
72 62,9
Communications and
advertising services 26 15,2
Internet services 15 49,0
IV.
Activities from
the area of
education and
the
Universities
Other education activities 27 2,0
TOTAL 336 24,3
Source: Siadeco, 2015.

27.
2.5/ Results of the procedure to calculate employment corresponding to the scope of the study and to Basque language
Below you can see different tables which include the results of the data calculated using the
methodology described above. We have used different sources of information according to
subsectors and types of activity, and there are also variations in the procedure employed in different
sectors to estimate employment corresponding to the Basque language. The most complete
information possible was obtained for each activity sector and, based on this, criteria was established
to estimate employment associated with Basque; taking into account the characteristics of each
sector and the information obtained was adapted to the criteria as well as the procedure to calculate
for each subsector and branch of activity.
Las tables that appear below show, for each sector and subsector, the following information:
♦ The source of information consulted in order to estimate the employment data for each
subsector:
• In general, the data comes from the Directory of Economic Activities, relating to
the number of businesses and employment. With regard to employment, we have
assigned the following values to the employment intervals of the Directory:
- 1 (employment interval 0-2): 1.5 jobs
- 2 (interval 3-5): 4 jobs
- 3 (interval 6-9): 7.5 jobs
- 4 (interval 10-14): 12 jobs
- 5 (interval 15-19): 17 jobs
- 6 (interval 20-49): 34.5 jobs
- 7 (interval 50-99): 74.5 jobs
- 8 (interval 100-249): 174.5 jobs
- 9 (interval 250-499): 374.5 jobs
- 10 (>= 500): 750 jobs
• Number of businesses added in each branch activity to the initial Eustat Directory
in which they were not included.
• Other sources of sectorial information used to obtain economic data for each
branch of activity.
• Information used to calculate employment to attribute to Basque language, i.e. the
Basque language coefficient: both indirect and direct information obtained through
field work carried out by Siadeco.

28.
• Reference employment, i.e. the number of jobs that may be attributed to Basque
for each branch of activity; this would be direct employment for Basque.
2.5.1/ Language industry
This sector encompasses the following 5 subsectors:
• Teaching Basque (outside the education system): Euskaltegis, Official Language
Schools and language academies.
• Translation and interpreting work: companies and self-employed workers.
• Language services and consultancies: advisory services for the design and
implementation of Basque language plans.
• Development and dissemination of the corpus of Basque: areas relating to the
regulation of the language, lexicography and terminology.
• Technologies of language: electronic dictionaries, language processors, correctors,
translation software, applications to learn and use language, web technologies, etc.
We then present the procedure used to calculate the coefficients of Basque and the employment for
the Basque for each subsector and branch of activity.
� I.1. Teaching Basque (outside the education system): euskaltegis, Official Language Schools and
language academies.
Euskaltegis
126 euskaltegis are registered in the Directory (32 public and 94 private) and they are
estimated to provide a total of 1,368 jobs.
According to data provided by HABE over the academic year 2013-2014, altogether 1,559
persons were working, 451 in public and 1,108 in private euskaltegis. 81.5% is teaching staff
and the remaining 18.5% were non-teaching staff (employment in offices, coordination
work, etc.). 64.9% of the teachers work full time, 22.3% work half day and the remaining
12.8% work a third of a full day. Extrapolating these figures to full time, we estimate 1,316
jobs for euskaltegis in the BAC during the academic year 2013-2014. In addition,
expenditure on personnel came to 46.3 million euros (20.2 million euros corresponding to
public and 26.1 million euros to the private euskaltegis).

29.
Table 2: Employment and expenditure for personnel belonging to euskaltegis, according to information obtained from the
Eustat Directory and HABE
Sub-
sector Activity type Type of institution
Sources of information
Reference
Employment
Directory of Economic
Activities (Eustat,2012) HABE (year 2013-2014)
Epigraph
CNAE
No of
business
-es
Employm
ent
No.
employees
(teaching and
non-teaching)
Employm
ent (full
time)
Expenditure on
personnel (million
€)
I.1.-
Tea
chin
g B
asqu
e
Euskaltegis
Public Euskaltegis 8552
8559 32 - 451 387 20,2 -
Private Euskaltegis
8532
8552
8559
94 - 1.108 929 26,1 -
Total 126 1.368 1.559 1.316 46,3 1.316
Source: Eustat, 2012; HABE, year 2013-2014
Official Language Schools
In the Eustat DIRAE directory there is no data for any of the official language schools.
Nevertheless, having consulted information sources of the Department of Education,
Language Policy and Culture, we learnt of the existence of 14 centres of this type in the
BAC, and we also know that 30,228 persons were enrolled, 6,640 were learning Basque
throughout the academic year 2013-2014 (22% of the enrolment). Applying the ratio of
teachers per pupil of public euskaltegis, we estimate that employment linked to Basque
comes to 262 persons working full time (219 of which are teaching staff and 43 non-
teaching).
Table 3: Sources of information to estimate employment corresponding to Basque at the Official Language Schools
and reference employment
Sub-
sector Type of activity
Sources of information
Reference
employment
Basque Government (Dpt. of
Education, Language Policy and
Culture)
Criteria to estimate employment
No. of
centres
Course
enrolment
2013-2014
Basque
Students
(2013-
2014)
Ratio
teacher/
pupil at
public
euskaltegis
Other staff employed at
public euskaltegis, applying 22% to
ratio of teacher/pupil
Employ
ment
(full
time)
I.1.-
Tea
chin
g of
Bas
que
Lang
uage
Official
Language
Schools
14 30,228
pupils
6,640
pupils
(22% of
enrolment)
0.0329 43 262 262
Source: Basque Government- Education, academic year 2013-2014; developed by Siadeco, 2015

30.
Language Academies
With regard to language academies, there are 392 businesses registered in the DIRAE, with
1,613 jobs.
In order to be able to estimate the jobs related to Basque language in this type of activity a
survey was carried out in the 23 businesses with the greatest number of employees. Among
them were the following: British Council, Elduaien Hizkuntza Eskola, Bai & By, Komalingua,
Welcom & Willkommen and Mondragón Lingua.
The people in charge of the academies were asked to estimate the proportion of Basque
pupils in relation to the total, taking the year 2014 as a reference. Thus, the average
percentage of Basque pupils was 5.4%, which gives an estimate of employment attributable
to Basque as 87 jobs.
Table 4: Data from the Eustat Directory of Economic Activities, results of the survey on the Basque language
coefficient and language academy reference employment
Sub-
sector
Type of activity
Sources of information
Reference
employment
Directory of Economic Activities
(Eustat, 2012)
SURVEY on Basque language coefficient
(Siadeco,2015)
Epigraph
CNAE
No. of
businesses
Employmen
t
Strategic
sample
Weight of the
sample
Basque
Coefficient
(weighted
according to
employment)
I.1.-
Tea
chin
g B
asqu
e
Language
Academies
8552
8559 392 1,613
23 large
language
academies
(greater no.
of persons
employed)
19.6% of
employment
5.4% of
clients who
study Basque
87
Source: Eustat, 2012; Siadeco, 2015
� I.2. Translation and interpreting work: companies and self-employed persons,
In the Eustat directory 90 companies and 494 self-employed workers are registered who work
in the area of translation, corrections and interpreting. To this initial list we have added another
two companies detected from the Langune database, and altogether there are estimated to be
845 jobs for this type of activity.

31.
In order to calculate the Basque language coefficient for this group Siadeco carried out field
work to collect direct information on the largest companies; among which are Mabranchra,
Urrats Euskara Zerbitzuak, Lanser Language, Tisa and I.C. Formation. The people in charge of
these businesses were asked to estimate the proportion of translation work related to Basque
(translations to and from Basque) in relation to their total work, taking the year 2014 as a
reference.
The Basque language coefficient calculated from the 25 businesses with the greatest number of
employees (representing 65.8% of total employment in companies that offer translation services)
is 57.4%. In addition, this coefficient was applied to self-employed workers, and as a result we
found 485 jobs associated to Basque in this activity group.
Table 5. Data from the Eustat Directory of Economic Activities, results of the survey on the Basque language coefficient
and reference employment of companies and self-employed workers in the area of translation
Sub-
sector
Type of
activity
Type of
organization
Sources of information
Reference
Employment
Directory of
Economic
Activities (Eustat,
2012)
Langune
Total
employ
ment
ENCUESTA on Basque language
coefficient (Siadeco, 2015)
Epigraph
CNAE
No
business
-es
Companies
added
Strategic
sample
Weight
of the
sample
Basque language
coefficient
(weighted
according to
employment)
I.2.-
Tra
nsla
tion
Translation
Companies
and self-
employed
persons
Translation
Companies
7430
8552
8559
90 2 348
25 larger
companie
s
65.8%
of the
employ
ment
% of translation
work carried
out from or
into Basque:
57.4%
200
Self-employed
translators 7430 494 - 497 - -
Same % applied
to companies:
57.4%
285
Total 584 2 845 - - 485
Source: Eustat, 2012; Siadeco, 2015

32.
� I.3. Language services and consultancy: consultancy services for the design and
implementation of Basque language plans.
14 businesses are registered in the Directory whose main work consists of offering language
consultancy services, and based on the Basque Government “infrastructures of Basque language”
database, we added 3 more.
It is important to point out that although the main activity of these companies was language
consultancy services, they also offer other types of services. The following are the 14 companies
considered, sorted from greater to smaller, according to the number of employees: Elhuyar
Fundazioa, Emun, Artez Euskara Zerbitzua, Elhuyar Aholkularitza, Ahize-AEK, Siadeco,
Soziolinguistika Klusterra, Hori-Hori, Ekilore Euskara Planak, Artez Formakuntza Eskola and
Meblis Método and Educación al Bilingüismo.
In relation to the criteria used for to estimate the Basque language coefficient, we should point
out that in the case of 11 businesses, 100% of employment was attributed to Basque. Taking into
account all the businesses, the Basque language coefficient stood at 87.3%; as a result,
employment associated to Basque language for this group of activity stands at around 247 jobs.
Table 6: Data from the Eustat Directory of Economic Activities, criteria to estimate the Basque language coefficient
and reference employment of language consultancy service companies
Sub-
sector Type of activity
Sources of information
Reference
Employment
Directory of Economic
Activities (Eustat, 2012)
BG
infrastructure
of Basque
language
Database Total
employmen
t
Criteria to estimate the
Basque language coefficient
(Siadeco, 2015)
Epigraph
CNAE
No. of
businesses
Companies
added
No. of
businesses
with 100%
employment
attributed to
Basque
Basque
language
coefficient
(weighted
according to
employment)
I.3.-
Serv
ices
and
lang
uage
con
sulta
ncy
Companies that
mainly offer
language
consultancy
services
7022
7220
7430
7490
8552
8559
14 3 283 11 87.3% 247
Source: Eustat, 2012; Siadeco, 2015

33.
� I.4. Development and dissemination of the corpus of Basque: areas of language
regulation, lexicography and the terminology.
4 business premises are registered in the Directory whose main activity consists of
developing and disseminating a corpus of Basque. Three of the premises correspond to
Euskaltzaindia and one corresponds to UZEI Centre of Terminology and Lexicography.
We have added the Basque Language Institute of the University of the Basque Country, and we
estimate a total of 44 reference jobs for this group of activity. In this case, the Basque language
coefficient is 100%, 44 are reference jobs in relation to this study.
Table 7: Number of organizations and reference employment in the area of the development and dissemination of
the corpus of Basque
Sub-
sector Type of activity
Sources of information
Reference
Employment
Directory of Economic
Activities (Eustat, 2012)
University of
the Basque
Country Total
employme
nt
Criteria to estimate the Basque
language coefficient (Siadeco,
2015)
Epigraph
CNAE
No of
business
premises
Companies
added
No. of businesses
with 100%
employment
attributed to
Basque
Basque language
coefficient
(weighted
according to
employment)
I.4.-
Cor
pus
of B
asqu
e
Organizations in
the area of the
language regulation,
lexicography and
terminology.
7220
7430 4 1 44 5 100% 44
Source: Eustat, 2012; University of the Basque Country, 2015; Siadeco, 2015
� I.5. Language technologies: electronic dictionaries, language processors, correctors,
translation software, applications for learning and using languages, web technologies,
etc.
In addition to I-ametza Interaktiboa registered in the Directory, we identified another 11
businesses from the Langune study; Vicomtech-IK4, BCBL-Basque Centre of Cognition-Brain
and Language, Komaberri Bi, Didaktiker, Ametzagaña, Eleka Ingeniaritza Linguistikoa, Natural
Vox, Plazagunea, Anboto Europe and Eratuz Kooperatiba Elkartea.
In this case field work was also developed to estimate the Basque language coefficient; taking the
year 2014 as a reference, the people in charge of these businesses were asked to estimate the
approximate proportion corresponding to Basque language in their activity.

34.
Applying the Basque language coefficient at 39.2% obtained from the field work on the 256 job
estimate, around 100 jobs were considered to be attributable to Basque.
Table 8: Sources of information and reference employment of the language technologies sector
Sub-
sector Type of activity
Sources of information
Employment
of reference
Directory of Economic
Activities (Eustat, 2012)
Langune
Total
employment
Survey on Basque language
coefficient (Siadeco, 2015)
Epigraph
CNAE
No. of
businesses
Companies
added
Weight of the
sample
Basque
language
coefficient
(weighted
according to
employment)
I.5.-
Lang
uage
tech
nolo
gies
Area of
technologies and IT
sciences applied to
treat and process
language
1812 1 10 256 98.4%
employment 39.2% 100
Source: Eustat, 2012; Langune, 2014; Siadeco, 2015
� I.6. TOTAL industry of language
The sum of employment for Basque language in the 5 subsectors analysed so far is 2,541. Most
of them (66%) are located in the area of teaching Basque language, and specifically in euskaltegis:
with around 1,316 jobs. Employment for the translation sector represents 485 jobs, the figure is
247 for language consultancy companies, another 44 correspond to organizations from the area
of the corpus and terminology and another 100 are correspond to the area that is made up of
new technologies and language.

35.
Table 9. Total reference employment for language industry and distribution by subsectors
Sector Subsector Reference employment
Abs. %
I.-
Industry of the
language
I.1.- Teaching Basque 1,665 65.5
I.2.- Translation 485 19.1
I.3.- Language services and consultancy 247 9.7
I.4.- Development & dissemination of corpus of
Basque 44 1.7
I.5.- Language technologies 100 3.9
TOTAL 2,541 100.0
Source: data produced by Siadeco, 2015
1,665
65.5%
485
19.1%
247
9.7%
44
1.7%
100
3.9%
Chart1. Employment realting to Basque corresponding to the sector "language industry", according to subsectors (absolute numbersutos and %)
1. Teaching Basque
2. Translation
3. Language ConsultancyServices
4. Development &dissemination of corpus ofBasque
Source: data produced by Siadeco, 2015.

36.
2.5.2/ Industry of culture and the media
The sector corresponding to culture and the media encompasses the following 9 subsectors:
• Book industry: publishing houses, bookshops and library services.
• Music industry: record labels, record shops, music promoters and programmers.
• Self-employed creators of culture: writers, musicians and other creators of art and
culture.
• Audio-visual media industry: film producers, documentary, advertising, television
programmes, radio programmes and other producers on the one hand, and cinemas
on the other.
• Performing arts: theatre companies and promoters.
• Bertsolaritza: associations and organizations from the world of bertsolaritza.
• Media: newspapers, magazines, radios and radio services, television and other
television services, internet and news agencies.
• Basque Language Associations.
• Other associations and companies from the world of communications, culture and
social affairs: associations and companies for culture, leisure and social interests;
communications and advertising companies; internet services; documentation
centres and other non-university research centres.
� II.1. Book industry: publishing houses, bookshops and library services.
Publishing Houses
The Eustat Directory includes 184 businesses belonging to the publish houses subsector.
This is a significant number, but there are only 19 businesses with over 10 employees; the
rest are small companies or self-employed persons. We have added to the initial Eustat list
another three businesses identified in the Langune database. In this subsector, we refer,
among others, to the following companies: Ediciones Deusto S.A., Elkarlanean S.L., Erein
S.A., Txinpartetan S.L., Zubia Editoriala, etc.
Altogether, we estimate around 594 jobs, and for the calculation of the Basque language
coefficient, data from the study “publications in Basque in the BAC” by the Association of
Publishers of the Basque Country and corresponding to 2012 was taken into account; this
study indicates that the turnover from the sale of titles in Basque was 31.9 million euros,

37.
50% of the total turnover (63.7 million euros). Applying this percentage, the number of jobs
attributable to Basque comes to 297. According to the report by the Association of
Publishers of the Basque Country, 89% of the turnover corresponding to titles in Basque is
carried out in the BAC itself and the average retail sale price of each title is 15 euros.
Table 10. Sources of information for the estimation of employment, criteria to estimate the Basque language
coefficient and reference employment for publishing houses
Sub-
sector Type of activity
Sources of information
Reference
Employme
nt
Directory of Economic
Activities (Eustat, 2012) Langune
Total
employment
Association of Publishers of
the Basque Country (Publications in Basque in
the BAC, 2012)
Epigraph
CNAE
No. of
businesses
Companies
added
Annual
turnover of
publications
in Basque
Weight of the
turnover of
publications
in Basque
II.1.
- B
ook
Indu
stry
Publishing houses 5811
5819 182 3 594 32.0 million € 50% 297
Source: Eustat 2012; Basque Government-HPS; Gremio of Editores of Euskadi 2012, data produced by Siadeco, 2015
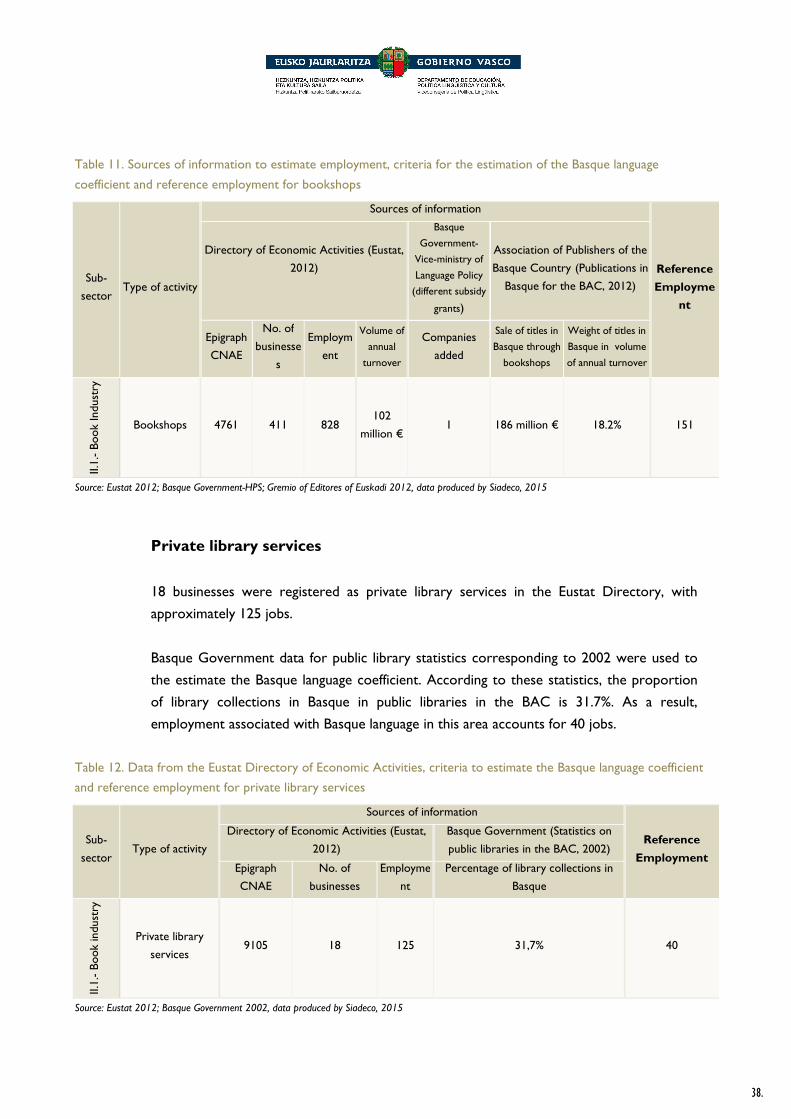
Bookshops
828 jobs correspond to the 411 retail book selling businesses registered in the Eustat
DIRAE.
According to the study by the Association of Publishers of the Basque Country
corresponding to 2012, mentioned in the previous section, 18.6 million euros were
invoiced through independent bookshops and distribution chains; in addition, according to
Eustat data, we know that the total turnover of these retail businesses is around 102 million
euros. Thus, the Basque language coefficient estimated for this subsector is 18.2%, and as a
result 151 jobs are attributable to Basque.
38.
Table 11. Sources of information to estimate employment, criteria for the estimation of the Basque language
coefficient and reference employment for bookshops
Sub-
sector Type of activity
Sources of information
Reference
Employme
nt
Directory of Economic Activities (Eustat,
2012)
Basque
Government-
Vice-ministry of
Language Policy
(different subsidy
grants)
Association of Publishers of the
Basque Country (Publications in
Basque for the BAC, 2012)
Epigraph
CNAE
No. of
businesse
s
Employm
ent
Volume of
annual
turnover
Companies
added
Sale of titles in
Basque through
bookshops
Weight of titles in
Basque in volume
of annual turnover
II.1.
- B
ook
Indu
stry
Bookshops 4761 411 828 102
million € 1 186 million € 18.2% 151
Source: Eustat 2012; Basque Government-HPS; Gremio of Editores of Euskadi 2012, data produced by Siadeco, 2015
Private library services
18 businesses were registered as private library services in the Eustat Directory, with
approximately 125 jobs.
Basque Government data for public library statistics corresponding to 2002 were used to
the estimate the Basque language coefficient. According to these statistics, the proportion
of library collections in Basque in public libraries in the BAC is 31.7%. As a result,
employment associated with Basque language in this area accounts for 40 jobs.
Table 12. Data from the Eustat Directory of Economic Activities, criteria to estimate the Basque language coefficient
and reference employment for private library services
Sub-
sector Type of activity
Sources of information
Reference
Employment
Directory of Economic Activities (Eustat,
2012)
Basque Government (Statistics on
public libraries in the BAC, 2002)
Epigraph
CNAE
No. of
businesses
Employme
nt
Percentage of library collections in
Basque
II.1.
- B
ook
indu
stry
Private library
services 9105 18 125 31,7% 40
Source: Eustat 2012; Basque Government 2002, data produced by Siadeco, 2015
39.
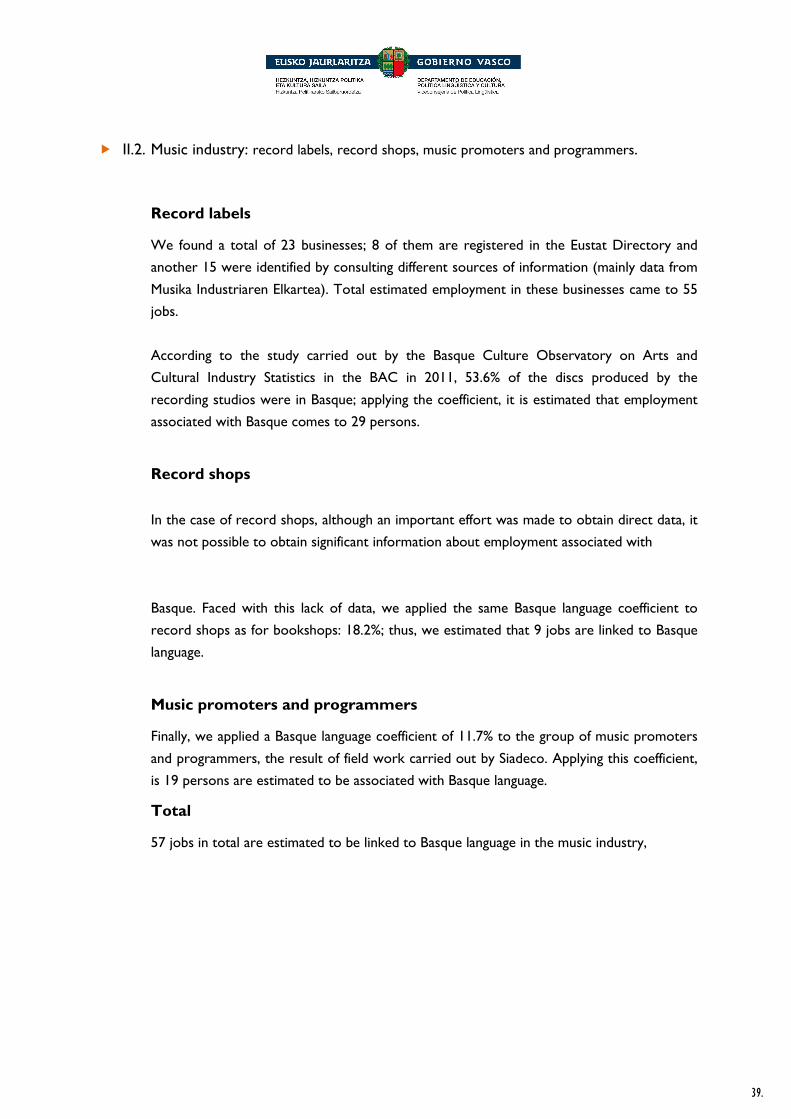
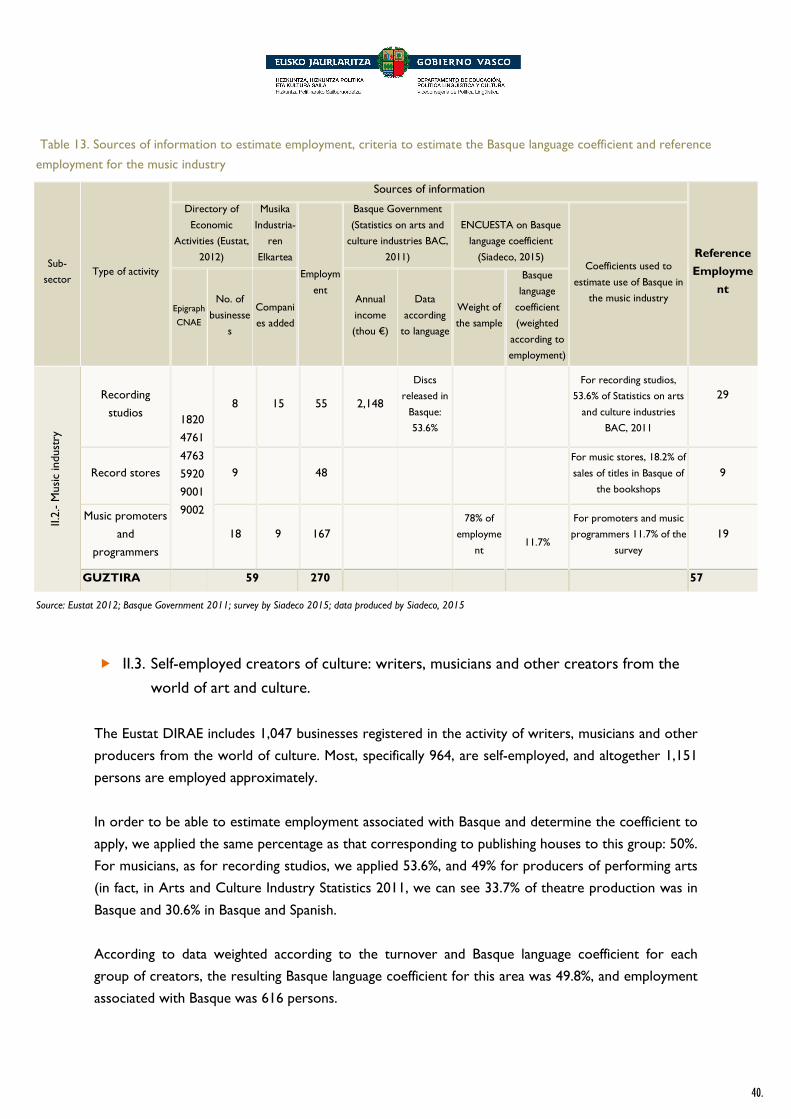
� II.2. Music industry: record labels, record shops, music promoters and programmers.
Record labels
We found a total of 23 businesses; 8 of them are registered in the Eustat Directory and
another 15 were identified by consulting different sources of information (mainly data from
Musika Industriaren Elkartea). Total estimated employment in these businesses came to 55
jobs.
According to the study carried out by the Basque Culture Observatory on Arts and
Cultural Industry Statistics in the BAC in 2011, 53.6% of the discs produced by the
recording studios were in Basque; applying the coefficient, it is estimated that employment
associated with Basque comes to 29 persons.
Record shops
In the case of record shops, although an important effort was made to obtain direct data, it
was not possible to obtain significant information about employment associated with
Basque. Faced with this lack of data, we applied the same Basque language coefficient to
record shops as for bookshops: 18.2%; thus, we estimated that 9 jobs are linked to Basque
language.
Music promoters and programmers
Finally, we applied a Basque language coefficient of 11.7% to the group of music promoters
and programmers, the result of field work carried out by Siadeco. Applying this coefficient,
is 19 persons are estimated to be associated with Basque language.
Total
57 jobs in total are estimated to be linked to Basque language in the music industry,
40.
Table 13. Sources of information to estimate employment, criteria to estimate the Basque language coefficient and reference
employment for the music industry
Sub-
sector Type of activity
Sources of information
Reference
Employme
nt
Directory of
Economic
Activities (Eustat,
2012)
Musika
Industria-
ren
Elkartea
Employm
ent
Basque Government
(Statistics on arts and
culture industries BAC,
2011)
ENCUESTA on Basque
language coefficient
(Siadeco, 2015) Coefficients used to
estimate use of Basque in
the music industry Epigraph
CNAE
No. of
businesse
s
Compani
es added
Annual
income
(thou €)
Data
according
to language
Weight of
the sample
Basque
language
coefficient
(weighted
according to
employment)
II.2.
- M
usic
indu
stry
Recording
studios 1820
4761
4763
5920
9001
9002
8 15 55 2,148
Discs
released in
Basque:
53.6%
For recording studios,
53.6% of Statistics on arts
and culture industries
BAC, 2011
29
Record stores 9 48
For music stores, 18.2% of
sales of titles in Basque of
the bookshops
9
Music promoters
and
programmers
18 9 167
78% of
employme
nt
11.7%
For promoters and music
programmers 11.7% of the
survey
19
GUZTIRA 59 270 57
Source: Eustat 2012; Basque Government 2011; survey by Siadeco 2015; data produced by Siadeco, 2015
� II.3. Self-employed creators of culture: writers, musicians and other creators from the
world of art and culture.
The Eustat DIRAE includes 1,047 businesses registered in the activity of writers, musicians and other
producers from the world of culture. Most, specifically 964, are self-employed, and altogether 1,151
persons are employed approximately.
In order to be able to estimate employment associated with Basque and determine the coefficient to
apply, we applied the same percentage as that corresponding to publishing houses to this group: 50%.
For musicians, as for recording studios, we applied 53.6%, and 49% for producers of performing arts
(in fact, in Arts and Culture Industry Statistics 2011, we can see 33.7% of theatre production was in
Basque and 30.6% in Basque and Spanish.
According to data weighted according to the turnover and Basque language coefficient for each
group of creators, the resulting Basque language coefficient for this area was 49.8%, and employment
associated with Basque was 616 persons.
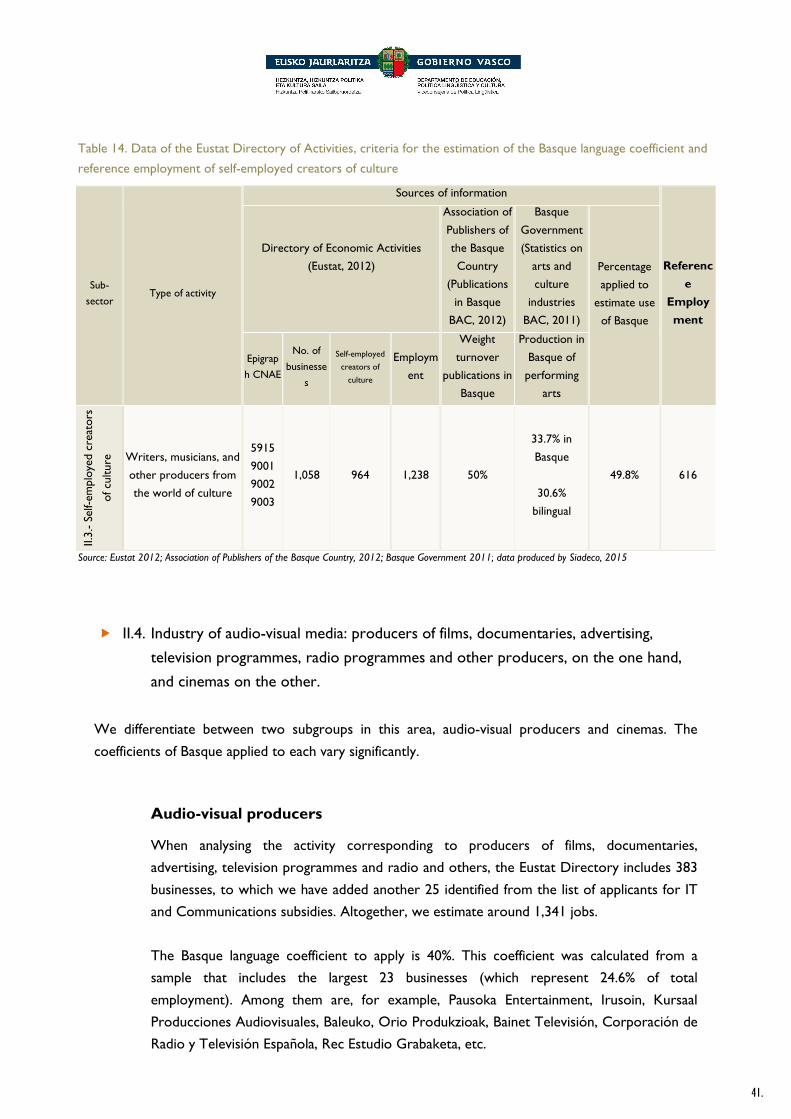
41.
Table 14. Data of the Eustat Directory of Activities, criteria for the estimation of the Basque language coefficient and
reference employment of self-employed creators of culture
Sub-
sector Type of activity
Sources of information
Referenc
e
Employ
ment
Directory of Economic Activities
(Eustat, 2012)
Association of
Publishers of
the Basque
Country
(Publications
in Basque
BAC, 2012)
Basque
Government
(Statistics on
arts and
culture
industries
BAC, 2011)
Percentage
applied to
estimate use
of Basque
Epigrap
h CNAE
No. of
businesse
s
Self-employed
creators of
culture
Employm
ent
Weight
turnover
publications in
Basque
Production in
Basque of
performing
arts
II.3.
- Se
lf-em
ploy
ed c
reat
ors
of c
ultu
re Writers, musicians, and
other producers from
the world of culture
5915
9001
9002
9003
1,058 964 1,238 50%
33.7% in
Basque
30.6%
bilingual
49.8% 616
Source: Eustat 2012; Association of Publishers of the Basque Country, 2012; Basque Government 2011; data produced by Siadeco, 2015
� II.4. Industry of audio-visual media: producers of films, documentaries, advertising,
television programmes, radio programmes and other producers, on the one hand,
and cinemas on the other.
We differentiate between two subgroups in this area, audio-visual producers and cinemas. The
coefficients of Basque applied to each vary significantly.
Audio-visual producers
When analysing the activity corresponding to producers of films, documentaries,
advertising, television programmes and radio and others, the Eustat Directory includes 383
businesses, to which we have added another 25 identified from the list of applicants for IT
and Communications subsidies. Altogether, we estimate around 1,341 jobs.
The Basque language coefficient to apply is 40%. This coefficient was calculated from a
sample that includes the largest 23 businesses (which represent 24.6% of total
employment). Among them are, for example, Pausoka Entertainment, Irusoin, Kursaal
Producciones Audiovisuales, Baleuko, Orio Produkzioak, Bainet Televisión, Corporación de
Radio y Televisión Española, Rec Estudio Grabaketa, etc.

42.
The other source of information used for to calculate the Basque language coefficient was
the Statistics on Arts and Cultural Industries 2011, where audio-visual industry production
only in Basque and/or in Basque and Spanish is indicated and represents around 40%. This
data coincides completely with that obtained by Siadeco through field work carried out.
Consequently, 536 jobs are attributable to Basque in the area of audio-visual production.
Cinemas
51cinemas are registered in the Eustat Directory, with 377 jobs.
In the study carried out by the Basque Culture Observatory in 2010 with regard to private
and public cinemas in the BAC, of the 189,774 shows projected, 5,785 were in Basque.
Thus, with a Basque language coefficient of 3.04%, estimated employment comes to 11 jobs.
Table 15. Sources of information for the estimation of use of Basque, criteria to calculate the Basque language
coefficient and reference employment of the audio-visual media industry
Sub-
sector Type of activity
Sources of information
Referenc
e
Employ
ment
Directory of
Economic
Activities (Eustat,
2012)
Basque
Government-
Vice-ministry
of Language
Policy
(ITC subsidies)
Employm
ent
SURVEY on Basque language
coefficient (Siadeco, 2015)
Basque
Government
(Statistics on
Arts and
Culture
Industries
BAC, 2011)
Epigraph
CNAE No. of
businesses
Companies
added
Indices
on use of
Basque
Weight
of the
sample
Basque
language
coefficient
(weighted
according
to
employmen
t)
Indices on
use of
Basque
II.4.
- In
dust
ry o
f aud
io-v
isua
l med
ia Producers of film,
documentaries,
advertising, television
programmes, radio and
other producers
4741
5821
5915
5916
7022
7311
6010
9001
9002
383 25 1,341
23 largest
establish-
ments
24.6% of
employme
nt
40%,
production
in Basque
Audio-visual
media
produced
only in Basque
or bilingual:
40.0%
536
Cinemas 5914 51 - 377 - - -
Percentage of
projections of
films in
Basque:
3.04%
11
TOTAL 434 25 1,718 547
Source: Eustat 2012; Basque Government (HPS and OVC); survey by Siadeco 2015; data produced by Siadeco, 2015.

43.
� II.5. Performing arts: theatre companies and programmers.
In this subsector we have also differentiated between producers and programmers.
Theatre companies
The DIRAE includes 84 businesses whose main activity is focused on the production of
theatre plays and dance productions, with 239 jobs.
In addition, according to the results of the Statistics on Arts and Culture Industries 2011,
employment corresponding to theatre and dance companies in 2011 came to 186.4 full
days, production in Basque represented 33.7% and in Basque and Spanish 30.6%. These are
the data we have used for our estimates; and applying a 49% Basque language coefficient,
around 91 jobs are estimated to be associated with Basque language.
Theatre and dance programmers
In the group of programmers of theatre and dance performances, 26 are businesses
registered in the Eustat Directory with approximately 124 jobs.
On the other hand, according to the results of Statistics on Arts and Culture Industries
2011, employment corresponding to theatre performance programmers is 217.7 and the
percentage of peformances in Basque comes to 34.2%. As a result, 71 jobs are attributable
to Basque.
Table 16. Data on employment from the Eustat Directory of Economic Activities, criteria to calculate the Basque
language coefficient and reference employment of the performing arts
Sub-
sector Type of activity
Sources of information
Referenc
e
Employ
ment
Directory of Economic Activities
(Eustat, 2012)
Basque Government (Statistics on
arts and culture industries BAC,
2011)
Percentage
applied to
estimate use
of Basque Epigraph
CNAE No. of
businesses
Employme
nt Employment
References of the
presence of Basque
II.5.
- Pe
rfor
min
g ar
ts Theatre companies
9001
9002 84 239 186,4
Production in Basque
in performing arts:
- 33,7% in Basque
- 30,6% bilingual
49% 91
Theatre and dance
programmers 9004 26 124 217,7
Performances in
Basque in theatres:
34.2%
34% 74
TOTAL 110 363 404 165
Source: Eustat 2012; Basque Government-OVC; data produced by Siadeco, 2015

44.
� II.6. Bertsolaritza: associations and organizations from the world of bertsolaritza.
There are 8 associations and organizations from the area of bertsolaritza located in the BAC; 4 of
them are registered in the DIRAE with 55 jobs. The organizations that operate in this subsector are
the Associations of Friends of Bertsolaritza (Bertsozale Elkarteak) of Bizkaia, Gipuzkoa, Álava and
Euskal Herria; the service companies Lanku; Librean Kooperatiba Elkarte Txikia; the Mintzola
Foundation and the Algorta School of Bertsolaris. We should point out that it was not possible to
obtain data on employment at schools for bertsolaris and, therefore, data were not taken into
account for employment estimations this subsector.
In addition, based on data from the Association of Friends of Bertsolaritza around 80 jobs were
estimated for this subsector (without taking into account the activity of bertsolari schools), which is
the data used for this study.
The accumulate budget of the associations of friends of bertsolaritza at a BAC level is 3 million euros
approximately (2015 budgets) and slightly over 1 million euros corresponding to service companies
and the development of projects related to bertsolaritza.
Table 17. Sources of information to estimate employment, criteria to calculate the Basque language coefficient and
reference employment of bertsolaritza
Sub-
sector Type of activity
Sources of information
Reference
Employm
ent
Directory of Economic
Activities (Eustat, 2012)
Assoc. of
Friends of
Bertsolaritza(20
15)
Assoc. of Friends of
Bertsolaritza(2015)
Epigraph
CNAE
Nº
businesse
s
Employme
nt Companie
s added
Companie
s added
Budgets
Employment
II.6.
- B
erts
olar
itza
Associations of
bertsolaritza of the
BAC (from the
three provinces
and those of
Euskal Herria),
service companies
and foundations
7220
8559
9001
9003
4 55 4 25
Budget of
associations in the
BAC and Euskal
Herria in 2014: 3.2
million €
Lanku and Mintzola:
1.1 million €
(including sessions of
bertsolaritza)
Total: 4.3 million €
In associations
in the BAC and
Euskal Herria:
58
Lanku and
Mintzola: 22
(including sessions
of bertsolaritza)
Total: 80
80
Source: Eustat 2012; Association of Friends of Bertsolaritza of Euskal Herria, 2015; data produced by Siadeco, 2015

45.
� II.7. Media: publication of newspapers, publication of magazines, radio and radio services,
television and television services, internet and news agencies.
Newspapers
The Eustat Directory includes 42 businesses whose main activity is publishing newspapers.
Another was added from the list of beneficiaries of Basque Government grants for the
media. The Basque language coefficient is estimated to be 27.1%, calculated from a sample
with the largest 24 businesses in terms of jobs in this subsector (they represented 98.3% of
total employment in this subsector). Among them are, for example, El Diario Vasco, Berria,
Deia, Euskal Herriko Egunkaria-Gara and Noticias de Gipuzkoa. Total employment for this
branch of activity is 867, 235 jobs are estimated to be attributable to Basque language, as a
result of applying the Basque language coefficient.
General and specialized magazines
77 businesses who publish magazines are registered in the Eustat Directory; and we have
added another 2, from the list of beneficiaries of Basque Government grants for the media.
11 of them only publish contents in Basque, and employ 64 persons, which is the data we
used as reference employment. These 11 businesses, arranged in order of greater to lesser
size, are: Argia, Herri Komunikabideak Kooperatiba Elkartea, 11 barri.info, Jakin, Xangorin,
Uztartzen Euskara Elkartea, Hilero Zornotzan, Bertsozaleak, Totoan Txorierriko Euskara
Elkarteen Federazioa, Euskal Birusa Elkarte Kulturala Ermua and Mendebalde Euskal Kultur
Elkartea. On a BAC level there are more associations that publish magazines in Basque, but
we placed them in a different subsector because they mainly carry out a different kind of
activity besides the publication of magazines.
In addition, employment corresponding to local magazines managed by different Basque
language and culture associations is not included in this subsector but in the sector
corresponding to Basque language associations and culture associations.
Radio and radio services
There are 57 businesses registered in the Eustat Directory which are linked to radio and
other radio services, with 718 jobs. The Basque language coefficient is 37.8%; calculated
with a sample of the 29 businesses with the highest number of employees in the subsector
(which represent 91% of total employment); among them are, Euskadi Irratia, Radio Popular
de Bilbao, Radio Bilbao Cadena Ser, Bizkaia Irratia, Arrate Irratia, etc. 271 jobs are
attributed to Basque language in this branch of activity.

46.
TV channels and other television services
This branch of activity includes staff who work in television and other services linked to
television; according to Eustat Directory data, there are 20 businesses with a total of 708
jobs. A survey was carried out on a sample of 10 companies, and an index of 37.8%
presence of Basque was obtained. Thus, employment associated with Basque was estimated
to be 311 persons.
The Internet
Mainly media that broadcast digitally have been taken into account, specifically 8 media
businesses; the total estimated employment is 58 persons and the Basque language
coefficient is 39.0%; obtaining direct information in the 5 businesses with the highest
number of jobs has made it possible to define this coefficient (among them, Eitbnet, El
Correo Digital and Deia Digital). 23 jobs are attributable to the Basque language in this
branch of activity.
News agencies
Finally, in this subsector of media, we have analysed news agencies. 73 are registered in the
Eustat Directory; 151 jobs. The survey was carried out on a sample of 13 businesses
(which represent 44% of total employment), and the presence of Basque index is 10.6%.
Thus employment associated to Basque in this branch of activity is estimated to be 16
persons.
Total media
After adding reference employment in the aforementioned subgroups, total employment
linked to Basque language in the media subsector amounts to 920 persons.
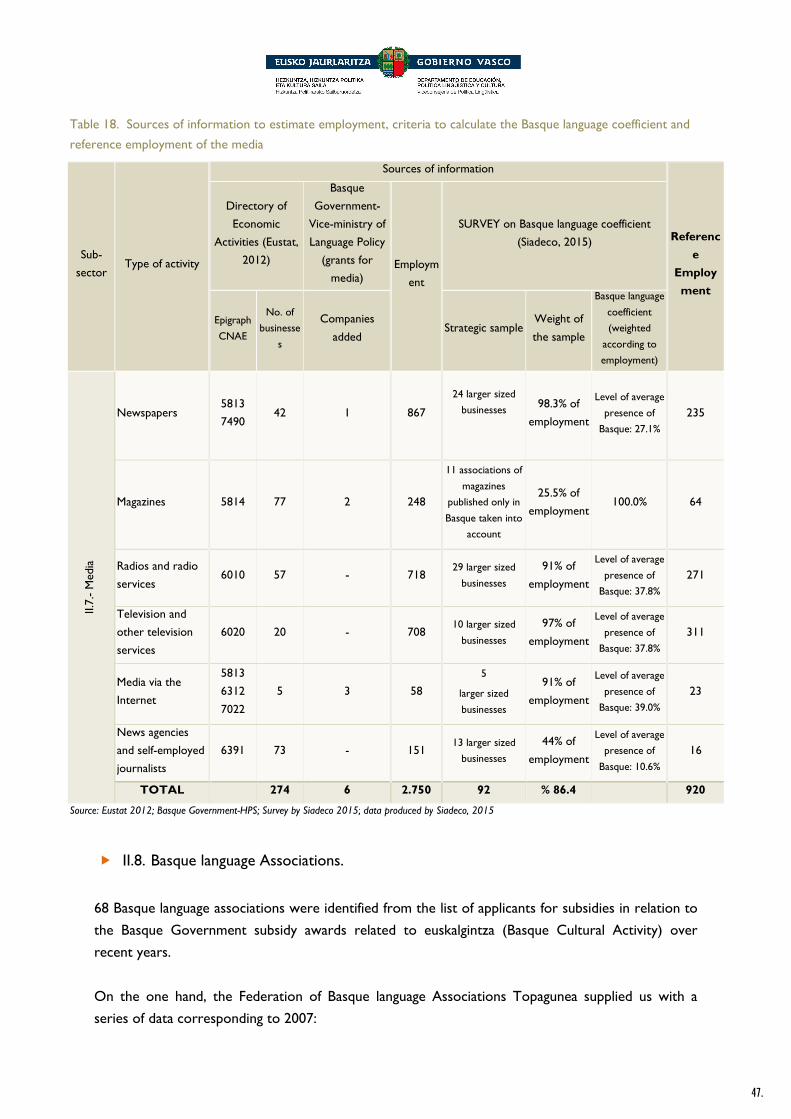
47.
Table 18. Sources of information to estimate employment, criteria to calculate the Basque language coefficient and
reference employment of the media
Sub-
sector Type of activity
Sources of information
Referenc
e
Employ
ment
Directory of
Economic
Activities (Eustat,
2012)
Basque
Government-
Vice-ministry of
Language Policy
(grants for
media) Employm
ent
SURVEY on Basque language coefficient
(Siadeco, 2015)
Epigraph
CNAE
No. of
businesse
s
Companies
added Strategic sample
Weight of
the sample
Basque language
coefficient
(weighted
according to
employment)
II.7.
- M
edia
Newspapers 5813
7490 42 1 867
24 larger sized
businesses
98.3% of
employment
Level of average
presence of
Basque: 27.1%
235
Magazines 5814 77 2 248
11 associations of
magazines
published only in
Basque taken into
account
25.5% of
employment 100.0% 64
Radios and radio
services 6010 57 - 718
29 larger sized
businesses
91% of
employment
Level of average
presence of
Basque: 37.8%
271
Television and
other television
services
6020 20 - 708 10 larger sized
businesses
97% of
employment
Level of average
presence of
Basque: 37.8% 311
Media via the
Internet
5813
6312
7022
5 3 58
5
larger sized
businesses
91% of
employment
Level of average
presence of
Basque: 39.0% 23
News agencies
and self-employed
journalists
6391 73 - 151 13 larger sized
businesses
44% of
employment
Level of average
presence of
Basque: 10.6% 16
TOTAL 274 6 2.750 92 % 86.4 920
Source: Eustat 2012; Basque Government-HPS; Survey by Siadeco 2015; data produced by Siadeco, 2015
� II.8. Basque language Associations.
68 Basque language associations were identified from the list of applicants for subsidies in relation to
the Basque Government subsidy awards related to euskalgintza (Basque Cultural Activity) over
recent years.
On the one hand, the Federation of Basque language Associations Topagunea supplied us with a
series of data corresponding to 2007:
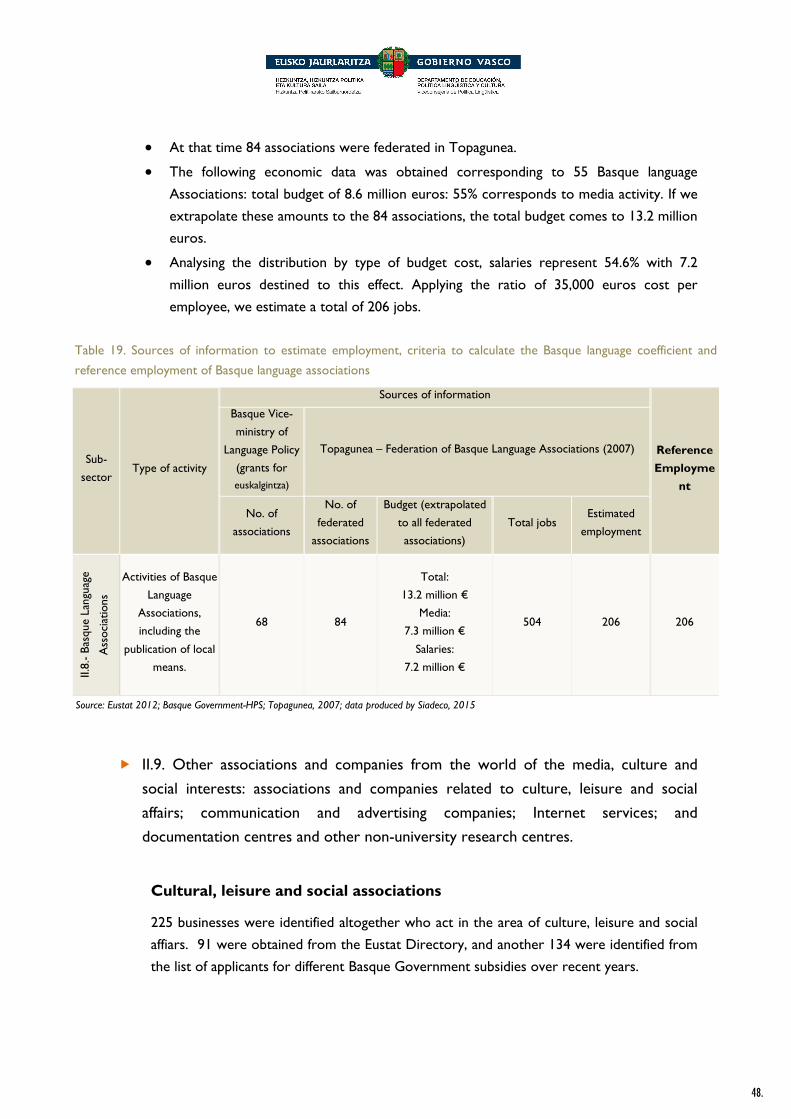
48.
• At that time 84 associations were federated in Topagunea.
• The following economic data was obtained corresponding to 55 Basque language
Associations: total budget of 8.6 million euros: 55% corresponds to media activity. If we
extrapolate these amounts to the 84 associations, the total budget comes to 13.2 million
euros.
• Analysing the distribution by type of budget cost, salaries represent 54.6% with 7.2
million euros destined to this effect. Applying the ratio of 35,000 euros cost per
employee, we estimate a total of 206 jobs.
Table 19. Sources of information to estimate employment, criteria to calculate the Basque language coefficient and
reference employment of Basque language associations
Sub-
sector Type of activity
Sources of information
Reference
Employme
nt
Basque Vice-
ministry of
Language Policy
(grants for
euskalgintza)
Topagunea – Federation of Basque Language Associations (2007)
No. of
associations
No. of
federated
associations
Budget (extrapolated
to all federated
associations)
Total jobs Estimated
employment
II.8.
- B
asqu
e La
ngua
ge
Ass
ocia
tions
Activities of Basque
Language
Associations,
including the
publication of local
means.
68 84
Total:
13.2 million €
Media:
7.3 million €
Salaries:
7.2 million €
504 206 206
Source: Eustat 2012; Basque Government-HPS; Topagunea, 2007; data produced by Siadeco, 2015
� II.9. Other associations and companies from the world of the media, culture and
social interests: associations and companies related to culture, leisure and social
affairs; communication and advertising companies; Internet services; and
documentation centres and other non-university research centres.
Cultural, leisure and social associations
225 businesses were identified altogether who act in the area of culture, leisure and social
affiars. 91 were obtained from the Eustat Directory, and another 134 were identified from
the list of applicants for different Basque Government subsidies over recent years.

49.
Field work to collect direct information spread in this case to 72 companies and
associations, and the average Basque language coefficient was 70.1%. These organizations
represent 63% of total employment in this area. This group encompasses associations with
very different activities and characteristics; there are, among others, Asociación
Sociocultural Ziba, Asociación de Tiempo Libre Suspergintza, Asociación Zubietxe against
social exclusion, Eusko Ikaskuntza, Elkargi, Azaro Fundazioa, Harribide Fundazioa,
Federación de Grupos de Tiempo Libre Amarauna, Galtzagorri, Servicios Kultur Kabia…
Altogether 1,090 persons are employed and 764 jobs are estimated to be attributable to
Basque language.
Communications and advertising services
With regard to companies that offer communications and advertising services, 1,394
businesses were identified altogether (1,391 from the Eustat Directory and another 3) and
3,995 persons were employed in this branch of activity. A survey was carried out to
estimate the Basque language coefficient and the result obtained was 15.7%; data was
directly obtained from 26 communications and advertising companies, which represented
15% of total employment in this area. Thus, employment attributable to Basque language is
627 persons in this branch of activity.
Internet services
This group is made up of 35 businesses altogether, 29 are registered in the Eustat Directory
and another 6 were added by consulting other sources of information; with 318 jobs.
Following direct data collection in the 14 largest businesses (representing 49% of total
employment), a Basque language coefficient of 22.1% was calculated. Some of the largest
are: Hispavista Compañías, Codesyntax, Adimedia, etc. 70 jobs were estimated to be
attributable to Basque language in this branch of activity.
Documentation and research centres
And finally, with regard to the activity of documentation and research centres, 10
businesses are registered in the Eustat Directory (for example, Documentation and Studies
Centre of Siis and Lazkaoko Beneditarren Fundazioa), with 32 jobs generated. Applying the
same Basque language coefficient as for private library services (31.7%), we estimate 10 jobs
linked to Basque language.
Total associations from the area of the media, culture and social affairs
The sum of reference employment for the four branches of activity mentioned, 1,471 jobs
were linked to Basque language in this subsector.

50.
Table 20. Sources of information to estimate employment, criteria to calculate the Basque language coefficient and
reference employment of other associations and companies from the area of communications, culture and society
Sub-
sector Type of activity
Sources of information
Referen
ce
Employ
ment
Directory of
Economic
Activities (Eustat,
2012)
Basque
Government-
Vice-ministry of
Language Policy
(grants for
subsidies)
Employm
ent
SURVEY on Basque language coefficient
(Siadeco, 2015)
Epigraph
CNAE
No. of
businesse
s
Companies
added
Strategic
sample
Weight of
sample
Basque language
coefficient (weighted
according to
employment)
II.9.
- O
ther
ass
ocia
tions
and
com
pani
es fr
om t
he a
rea
of c
omm
unic
atio
ns, c
ultu
re a
nd s
ocie
ty
Other
associations and
companies from
the area of
culture, leisure
and society
5811
5912
6399
7022
7220
7490
9001
9002
9105
9106
91 134 1,090
72 associations
or larger sized
companies
63% of
employm
ent
Level average
presence of Basque:
70.1%
764
Communications
and advertising
services
7021
7311
7490
1,391 3 3,995
26 associations
or larger sized
companies
15% of
employm
ent
Level average
presence of Basque:
15.7%
627
Internet services
6312
7430
7490
29 6 318
14
associations or
larger sized
companies
49% of
employm
ent
Level average
presence of
Basque: 22.1% 70
Documentation
and research
centres
9105
9106 10 32 - -
Same Basque
language coefficient
as private library
services
(31.7%)
10
TOTAL 1,521 143 5,435 1,471
Source: Eustat 2012; Basque Government-HPS; survey by Siadeco 2015; data produced by Siadeco, 2015
� II.10. TOTAL industry of culture and the media
This second sector belonging to the industry of culture and media employs 4,550 persons linked
directly to Basque, distributed in 9 subsectors which were analysed; the two most important, on the
one hand those made up of companies and organizations from the area communications, culture and
social (1,471 jobs) and on the other, media companies (920 jobs). After them come: self-employed
creators of culture (616 jobs), audio-visual media industry (547 jobs), book industry (488 jobs),
Basque language associations (206 jobs), performing arts (165 jobs), bertsolaritza (80 jobs) and the
music industry (57 jobs).

51.
Table 21. Employment of reference total of the industry of the culture and the media and distribution by subsectors
Sector Subsector Reference Employment
Abs. %
II. Industry of culture and
the media
II.1.- Book industry 488 10,7
II.2.- Music industry 57 1,3
II.3.- Self-employed creators of culture 616 13,5
II.4.- Audio-visual media industry 547 12,0
II.5.- Performing arts 165 3,6
II.6.- Bertsolaritza 80 1,8
II.7.- Media 920 20,2
II.8.- Basque Language Associations 206 4,5
II.9.- Other associations and companies in the
areas of the media, culture and society 1.471 32,3
TOTAL 4.550 100,0
488
10.7%
57
1.3%
616
13,5%
547
12.0%
165
3.6%80
% 1.8
920
% 20,2
206
% 4,5
1,471
32.3%
Figure 2. Use of Basque in the sector "industry of culture and the media", according to subsectores (absolute numbers and %)
1.Book industry
2. Music industry
3. Self employed culture creators
4. Media industry
5. Performing arts
6. Bersolarismo
7. Media
8. Basque language associations
9. Other communications, culture and society associations & companies
Source: Data produced by Siadeco.

52.
2.5.3/ Activities in the area of education and Universities
The third language sector defined for the study corresponds to the area of education and
Universities; employment and other economic data linked to education imparted in Basque was
calculated. The main criteria used was to estimate the weight of the subjects imparted in Basque in
relation to the total of subjects for each stage and education model, and this was the coefficient used,
after being applied to total employment, to calculate employment linked the Basque language.
Four subsectors were differentiated within the third sector:
• Infant and Primary Education.
• Secondary Education (ESO; Baccalaureate and Technical Training; Programmes of
Job Start Up Qualification).
• University.
• Other associations and organizations in the area of education.
� III.1 Infant and Primary Education
Basque language coefficients
The information provided by the Department of Education of the Basque Government was
greatly used to be able to calculate the total contact hours and those in Basque in the case
of Infant and Primary Education and Secondary Education; corresponding to year 2012-
2013.
Based on this information, the coefficients of Basque calculated for each model (A, B or D)
and each education stage (Infant and Primary Education and Secondary Education,
Baccalaureate and Technical Training) are the following:
- Model A: contact hours in Basque correspond only to the subject Basque, by
which the coefficients of Basque for each stage are the following: 14.4% in Infant
and Primary Education, 11,0% in ESO and 7.9% in Baccalaureate and Technical
Training.
- Model B: contact hours in Basque correspond to the subject of Basque plus half
the remaining subjects, by which the coefficients of Basque for each stage are the
following: 58.75% in Infant and Primary Education, 56,2% in ESO and 53.25% in
Baccalaureate and Technical Training.
- Model D: contact hours in Basque are for all subjects except those corresponding
to Spanish in primary, and to Spanish and English in ESO, Baccalaureate and FP;
the estimated Basque language coefficients, are as follows: 85.60% in Infant and
Primary Education; 78.00% in ESO and 84.20% in Baccalaureate and Technical
Training.

53.
Table 22. Basque language coefficients applied to each stage and education model and indications to this regard
Model Indications
Coefficients of Basque applied
Infant and Primary
Education
Secondary
Education
Baccalaureate and
Technical Training
Job Start up
Qualification
Programmes
A
Contact hours in Basque, only the
subject Basque language
14.40% 11.00% 7.90% 0,00%
B
Contact hours in Basque, subject
Basque language plus half
remaining subjects
17.3% + (82.7%/2)
= 58.65%
12.4% + (87.6%/2)
= 56.2%
6.5% + (93.5%/2)
= 53.25%
D
Contact hours in Basque, all
subjects except Spanish in
primary, and Spanish and English
in ESO, Baccalaureate and FP
(100.0% – 14.4%)
= 85.60%
(100% – 11.0%*2)
= 78.00%
(100% - 7.9%*2)
= 84.20%
X No contact hours in Basque 0.0% 0.0% 0,0%
Source: Basque Government, Department of Education, year 2012-2013; data produced by Siadeco, 2015
Teaching staff
Using Eustat data, firstly we proceeded with the distribution of the teaching staff according
to education models, based on the proportion of pupils according to each model.
18,266 teachers work in Infant and Primary Education altogether; to calculate this data the
following criteria was applied: a teacher who works both in infant and primary education is
counted only once, there are no duplicates.
Secondary Education teaching staff amount to 15,402 teachers; in the following Table the
sum of all the stages of secondary education reflect a result of 19,479, as a teacher may
figure in more than one stage. The following table shows the estimation of the number of
teachers for each model and education stage:

54.
Table 23. Estimation of the number of teachers for each education stage and model, according to the
distribution of pupils
Model Stage Pupils Teachers
Abs. % Abs. %
A
Infant and Primary Education .......................... 12,110 5.6 1,018 5.6
ESO ........................................................................ 10,155 14.0 1,407 14.0
Baccalaureate and FP ........................................ 34,922 59.1 4,956 59.1
PCPI ...................................................................... 4,404 100.0 748 100.0
Total
B
Infant and Primary Education .......................... 53,616 24.7 4,507 24.7
ESO ........................................................................ 20,010 27.7 2,773 27.7
Baccalaureate and FP ........................................ 1,159 2.0 171 2.0
PCPI ...................................................................... - - - -
Total 74,785 21.2 7,451 19.7
D
Infant and Primary Education .......................... 150,278 69.2 12,631 69.2
ESO ........................................................................ 41,690 57.6 5,778 57.6
Baccalaureate and FP ........................................ 22,787 38.6 3,540 38.6
PCPI ...................................................................... - - - -
Total 214,755 60.8 21,949 58.2
X
Infant and Primary Education .......................... 1,310 0.6 110 0.6
ESO ........................................................................ 510 0.7 71 0.7
Baccalaureate and FP ........................................ 206 0.3 35 0.3
PCPI ...................................................................... - - - -
Total
TO-
TAL
Infant and Primary Education .......................... 217,314 61.5 18,266 100.0
ESO ........................................................................ 72,365 20.5 10,029 100.0
Baccalaureate and FP ........................................ 59,074 16.7 8,702 100.0
PCPI ...................................................................... 4,404 1.2 748 100.0
Total 353,157 100.0 37,745 100.0
Source: Basque Government-Department of Education, year 2012-2013; data produced by Siadeco, 2015
Altogether 33,668 teachers work in Infant and Primary Education and Secondary Education
(once duplicate amounts have been subtracted), after applying the corrective coefficients
to eliminate the incidence of the duplicate personnel and the coefficients of Basque for each
education model and stage, 21,258 teachers are attributable to Basque language in this
subsector. More detailed data can be seen in the following two Tables.
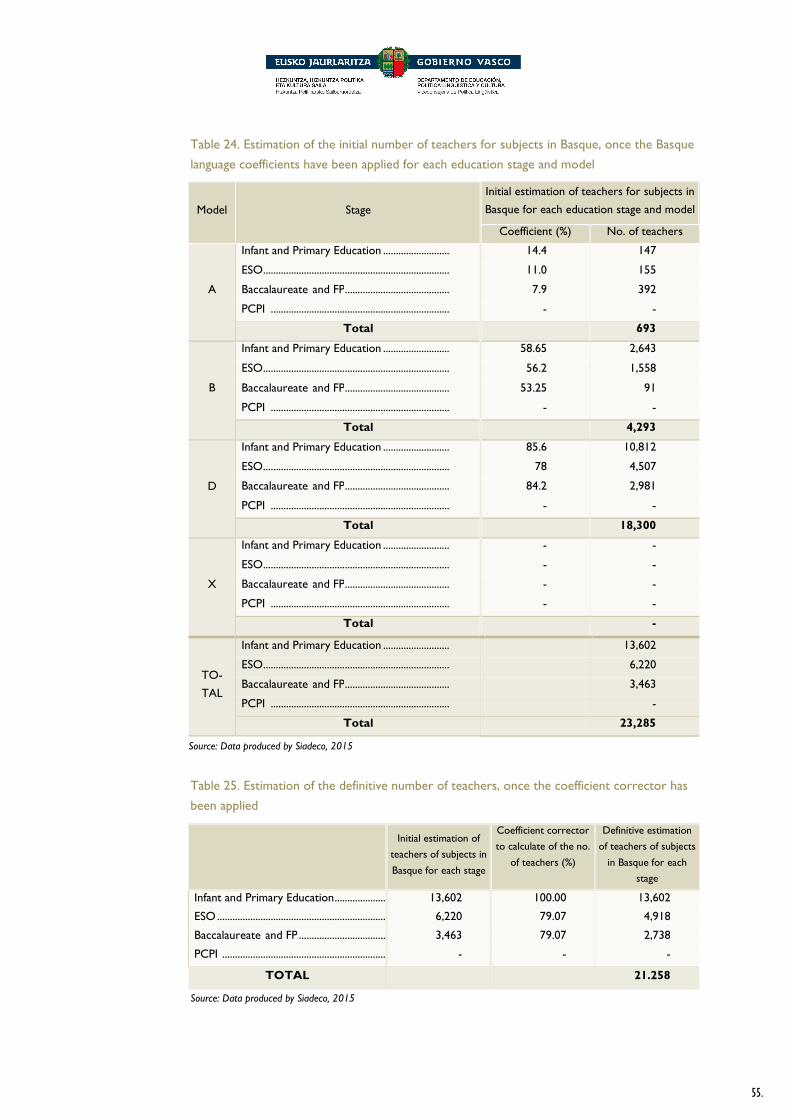
55.
Table 24. Estimation of the initial number of teachers for subjects in Basque, once the Basque
language coefficients have been applied for each education stage and model
Model Stage
Initial estimation of teachers for subjects in
Basque for each education stage and model
Coefficient (%) No. of teachers
A
Infant and Primary Education .......................... 14.4 147
ESO ......................................................................... 11.0 155
Baccalaureate and FP ......................................... 7.9 392
PCPI ...................................................................... - -
Total 693
B
Infant and Primary Education .......................... 58.65 2,643
ESO ......................................................................... 56.2 1,558
Baccalaureate and FP ......................................... 53.25 91
PCPI ...................................................................... - -
Total 4,293
D
Infant and Primary Education .......................... 85.6 10,812
ESO ......................................................................... 78 4,507
Baccalaureate and FP ......................................... 84.2 2,981
PCPI ...................................................................... - -
Total 18,300
X
Infant and Primary Education .......................... - -
ESO ......................................................................... - -
Baccalaureate and FP ......................................... - -
PCPI ...................................................................... - -
Total -
TO-
TAL
Infant and Primary Education .......................... 13,602
ESO ......................................................................... 6,220
Baccalaureate and FP ......................................... 3,463
PCPI ...................................................................... -
Total 23,285
Source: Data produced by Siadeco, 2015
Table 25. Estimation of the definitive number of teachers, once the coefficient corrector has
been applied
Initial estimation of
teachers of subjects in
Basque for each stage
Coefficient corrector
to calculate of the no.
of teachers (%)
Definitive estimation
of teachers of subjects
in Basque for each
stage
Infant and Primary Education ........................... 13,602 100.00 13,602
ESO ......................................................................... 6,220 79.07 4,918
Baccalaureate and FP ......................................... 3,463 79.07 2,738
PCPI ................................................................ - - -
TOTAL 21.258
Source: Data produced by Siadeco, 2015

56.
Non-teaching staff
According to data of the Basque Government Department of Education, 15,380 jobs
correspond to non-teaching staff in infant, primary and secondary education. Thus, the ratio
of non-teaching personnel in relation to teaching staff is 45.68%.
Table 26. Estimation of the reference employment, once non-teaching staff is added to
teaching staff
Teaching staff
Non-teaching
staff
Coefficient of non-
teaching staff on
teaching staff (%)
Infant and Primary Education ................................ 18,266
Secondary Education ................................ 15,402
TOTAL 33,668 15,380 45.681
Source: Basque Government-Department of Education, year 2012-2013; data produced by Siadeco, 2015
Use of Basque in Primary-Infant Education and Secondary Education
Adding teaching staff and non-teaching staff reference jobs we reached 30,696 jobs for
Infant-Primary and Secondary education stages.
Table 27. Use of reference Basque in Infant-Primary Education
and Secondary Education
Estimation of use of
reference Basque
Teachers ................................................................ 21,258
Non-teaching staff .......................................................... 9,711
TOTAL 30,969
Source: Data produced by Siadeco, 2015.
In this subsector, employment attributable to Basque was calculated also based on the
criteria of considering only the subject Basque, and not subjects imparted in Basque. With
this hypothesis, the coefficients of Basque to apply to each education model and stage are
significantly reduced, by which the reference employment would stand at around 7,360
persons (taking into account both the teaching and non-teaching staff).

57.
� III.2- University Education
In order to calculate employment linked to credits imparted in Basque in the university stage we have
worked with the information supplied by the University of the Basque Country, the University of
Deusto and Mondragon Unibertsitatea.
Below we show the offer of the three Universities indicated. Based on the number of credits offered
in the year 2014-2015, the proportion of the credits was calculated in Basque in relation to the total
and this coefficient was applied to employed staff, or more specifically, to full working days, in order
to be able to estimate the employment linked to Basque.
University of the Basque Country
Data corresponding to the campuses of Álava, Bizkaia and Gipuzkoa supplied by the Vice-
Chancellors of Basque Language of the University of the Basque Country; 41,369 credits
were offered to different degrees in the three provinces altogether, 21,180 of which were
imparted in Basque; thus, the Basque language coefficient for the degrees of the University
of the Basque Country is 48.8%.
Table 28. Offer of credits in degrees at the University of the Basque Country according to
language and estimated Basque language coefficient
Province Credits in degrees Basque language
coefficient (%) Credits in Spanish Credits in Basque Total credits
Campus of Bizkaia 10,295 9,662,5 19,957.5 48.42
Campus of Gipuzkoa 5,285,5 5,814,5 11,100 52.38
Campus of Álava 5,599 4,713 10,311 45.71
TOTAL 21,180 20,190 41,369 48.81
Source: University of the Basque Country – Vice-Chancellor of Basque, year 2014-2015
The Basque language coefficient calculated with the same criteria for postgraduates and
masters offered is significantly lower, 10.02% to be exact.

58.
Table 29: Offer of credits of postgraduate and masters studies at the University of the Basque
Country according to language and estimated Basque language coefficient
Credits of postgraduate and masters studies Basque language
coefficient (%) Credits in Spanish Credits in Basque Total credits
University of the Basque
Country 6.138,65 683,94 6.822,59 10,02
Source: University of the Basque Country- Vice-Chancellor of Basque language, year 2014-2015. Data produced by
Siadeco, 2015.
Taking into account all the education models (i.e. degrees, postgraduates and masters) of
the UPV, the average Basque language coefficient stands at around 43.31%.
3,832 persons work (full time) as lecturers and researchers in the UPV and another 1,878
work for the general administration. Applying the 43.31% coefficient, we estimate
employment for 2,473 persons linked to Basque language at the University of the Basque
Country.
Table 30: Total employment of the University of the Basque Country (full time) and estimated
use of Basque
Employment (full
time)
Average Basque
language coefficient
(%)
Use of Basque
Teachers and researchers 3.832,58
General administration 1.878
TOTAL 5.710,58 43,31 2.473,25
Source: University of the Basque Country- Vice-Chancellor of Basque, year 2014-2015. Data produced by
Siadeco, 2015.
University of Deusto
At the University of Deusto, the data required for this study was provided by the Basque
Language and Multilingualism Office with data from the campuses of Bilbao and San
Sebastián. the Basque language coefficient was calculated for each area, and we obtained an
average of 38% for all the credits in the different degrees.

59.
Table 31. Offer of credits in degrees at the University of Deusto according to language and
estimated Basque language coefficient
Area
Credits in degrees Basque
language
coefficient (%) Credits in
Spanish
Credits in
Basque Total credits
Social sciences 1,419 861 2,280 38,00
Psychology and Education 256 644 900 72,00
Law 180 348 528 66,00
Engineering 900 240 1,140 21,00
Business Studies and Economic
Sciences 420 168 588 29,00
Joint degrees 1,302 498 1,800 28,00
TOTAL 4,477 2,759 7,236 38,00
Source: University of Deusto- Basque and Multilingualism Office, year 2014-2015. Data produced by Siadeco,
2015.
In contrast, the Basque language coefficient in credits for postgraduates and masters is
6.39%.
Table 32: Offer of credits for postgraduates and masters of the University of Deusto
according to language and estimated Basque language coefficient
Credits of postgraduates and masters Basque language
coefficient
(%) Credits in Spanish Credits in Basque Total credits
University of Deusto
3,353
229
3.582
6.39
Source: University of Deusto- Basque and Multilingualism Office, year 2014-2015. Data produced by Siadeco, 2015.
Thus, the average coefficient calculated by the University of Deusto is 27.62%, which when
applied to total employment results in 276 persons attributable to Basque.
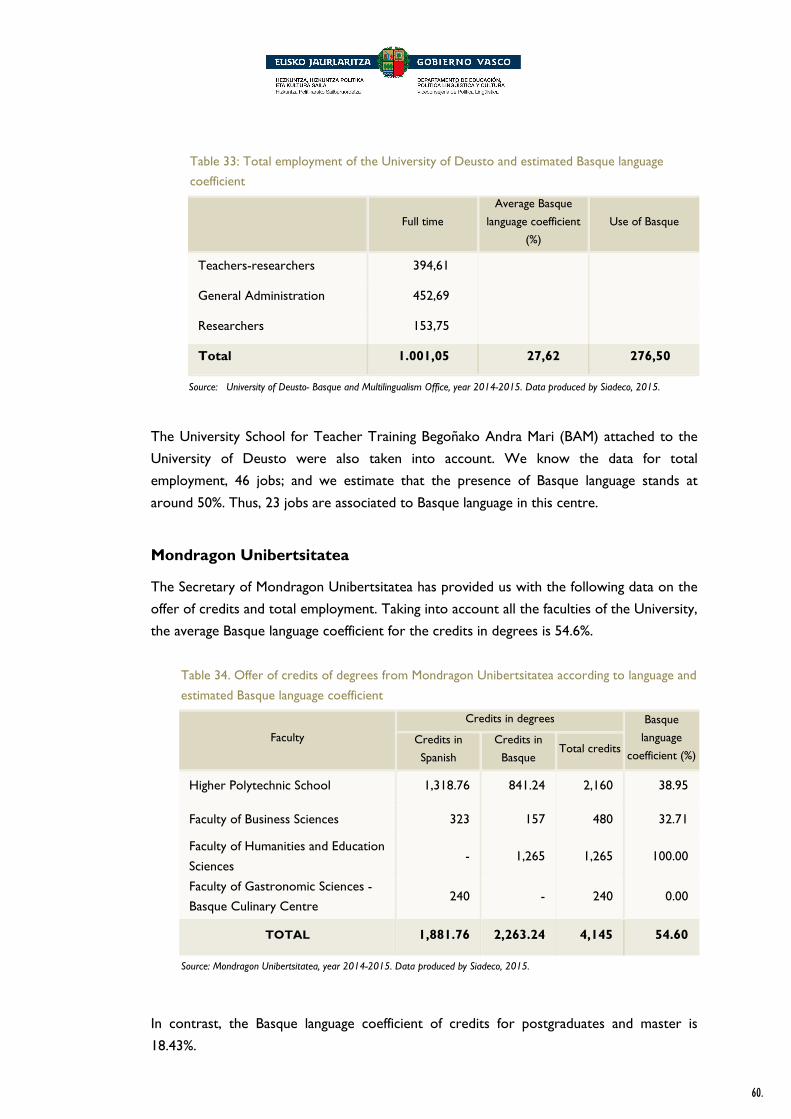
60.
Table 33: Total employment of the University of Deusto and estimated Basque language
coefficient
Full time
Average Basque
language coefficient
(%)
Use of Basque
Teachers-researchers 394,61
General Administration 452,69
Researchers 153,75
Total 1.001,05 27,62 276,50
Source: University of Deusto- Basque and Multilingualism Office, year 2014-2015. Data produced by Siadeco, 2015.
The University School for Teacher Training Begoñako Andra Mari (BAM) attached to the
University of Deusto were also taken into account. We know the data for total
employment, 46 jobs; and we estimate that the presence of Basque language stands at
around 50%. Thus, 23 jobs are associated to Basque language in this centre.
Mondragon Unibertsitatea
The Secretary of Mondragon Unibertsitatea has provided us with the following data on the
offer of credits and total employment. Taking into account all the faculties of the University,
the average Basque language coefficient for the credits in degrees is 54.6%.
Table 34. Offer of credits of degrees from Mondragon Unibertsitatea according to language and
estimated Basque language coefficient
Faculty
Credits in degrees Basque
language
coefficient (%) Credits in
Spanish
Credits in
Basque Total credits
Higher Polytechnic School 1,318.76 841.24 2,160 38.95
Faculty of Business Sciences 323 157 480 32.71
Faculty of Humanities and Education
Sciences - 1,265 1,265 100.00
Faculty of Gastronomic Sciences -
Basque Culinary Centre 240 - 240 0.00
TOTAL 1,881.76 2,263.24 4,145 54.60
Source: Mondragon Unibertsitatea, year 2014-2015. Data produced by Siadeco, 2015.
In contrast, the Basque language coefficient of credits for postgraduates and master is
18.43%.

61.
Table 35. Offer of credits of postgraduates and masters of Mondragon Unibertsitatea according
to language and estimated Basque language coefficient
Credits of postgraduates and masters Basque
language
coefficient (%) Credits in
Spanish
Credits in
Basque Total credits
Mondragon Unibertsitatea 1,027 232 1,259 18.43
Source: Mondragon Unibertsitatea, year 2014-2015. Data produced by Siadeco, 2015.
Thus, the average coefficient calculated for Mondragon Unibertsitatea is 46.17%, which
when applied to total employment at 491 (full time), gives 226 jobs attributable to Basque
language.
Table 36: Total employment of Mondragon Unibertsitatea and estimated use of the Basque
Full time
Average Basque
language coefficient
(%)
Use of Basque
Teachers 305.31
General administration 185.32
Total 490.63 46.17 226.52
Source: Mondragon Unibertsitatea, year 2014-2015. Data produced by Siadeco, 2015.
Total use of Basque at Universities
According to the calculations and estimations carried out by the three Universities,
employment directly linked to Basque language will be around 3 thousand persons.
Table 37: Estimated employment of Basque in BAC Universities
University Use of Basque (full time)
University of the Basque Country 2,473.25
University of Deusto (BAM included) 299.50
Mondragon Unibertsitatea 226.52
Total 2,999.27
Source: data produced by Siadeco, 2015.

62.
If for the calculation of the Basque language coefficient instead of credits imparted in Basque, we
were to use degrees, postgraduates and masters linked directly to Basque, the estimated
employment would be 115 jobs. We reach this figure considering employment linked to Basque
Studies and postgraduate studies of Linguistics and Basque Philology at the University of the Basque
Country and the degree of Basque Philology and Culture at the University of Deusto.
� III.3- Other education associations and organizations
This fourth group is composed of associations and organizations registered in Epigraphs
corresponding to the area of education in the Eustat Directory. 3,185 businesses altogether employ
an estimated 9,193 persons. However, once the complete list of organizations has been analysed,
only 27 were taken into account, precisely the largest and the closest linked to Basque language.
Among others are the Escuela de Educadores de Tiempo Libre Urtxintxa, the University of the
Basque Country Fundación Cursos de Verano and other companies and associations that offer
education services in the area of culture.
We have added the Laboratorio de Psicolingüística Elebilab of the University of the Basque Country,
and altogether the estimated reference employment to be 154 jobs.
Table 38. Data from the Eustat Directory of Economic Activities and sources of information to estimate
reference employment of other education associations and organizations
Sub-
sector
Sources of information
Reference
employment
Directory Economic Activities
(Eustat, 2012) Total
employment
UPV -
Elebilab
Epigraph CNAE
No. of businesses
Employment
Employment
of added
organizations
IV.4
.- O
ther
edu
cation
asso
ciat
ions
and
org
aniz
atio
ns
8551
8552
8559
3185 9,193
120
(employment
corresponding to
0.8% of
businesses
registered in the
Directory)
34 154
Source: Data produced by Siadeco, 2015.
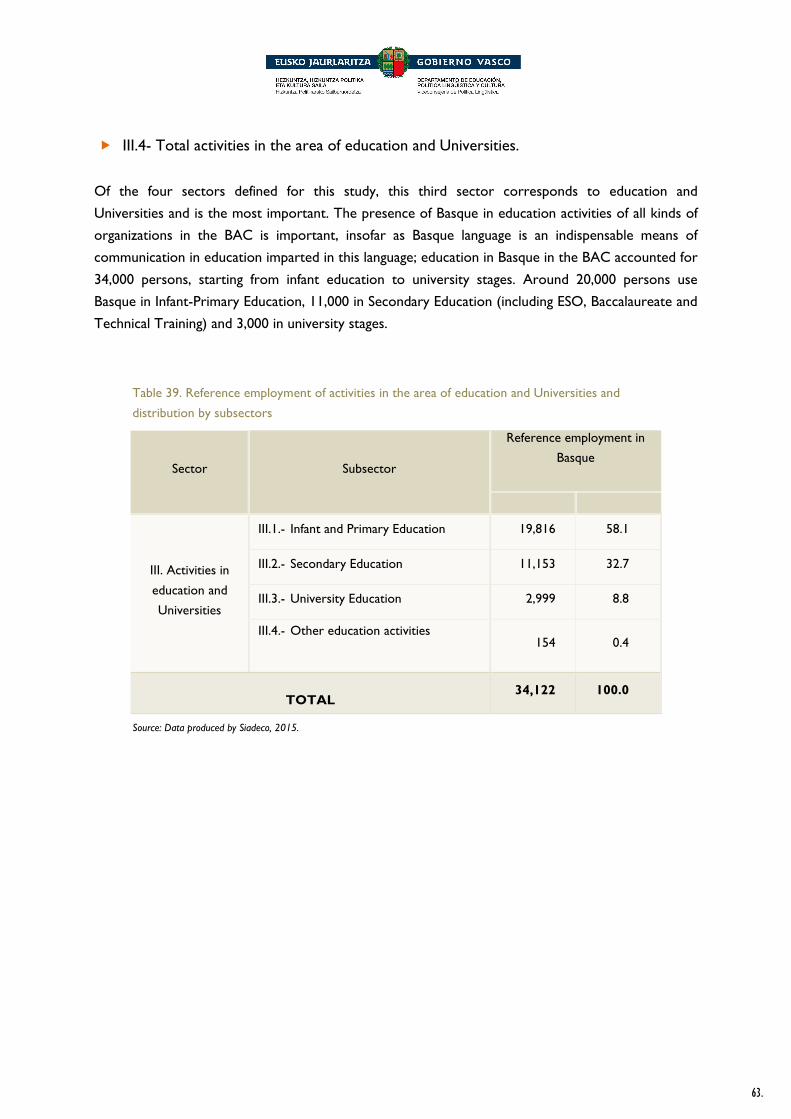
63.
� III.4- Total activities in the area of education and Universities.
Of the four sectors defined for this study, this third sector corresponds to education and
Universities and is the most important. The presence of Basque in education activities of all kinds of
organizations in the BAC is important, insofar as Basque language is an indispensable means of
communication in education imparted in this language; education in Basque in the BAC accounted for
34,000 persons, starting from infant education to university stages. Around 20,000 persons use
Basque in Infant-Primary Education, 11,000 in Secondary Education (including ESO, Baccalaureate and
Technical Training) and 3,000 in university stages.
Table 39. Reference employment of activities in the area of education and Universities and
distribution by subsectors
Sector Subsector
Reference employment in
Basque
III. Activities in
education and
Universities
III.1.- Infant and Primary Education 19,816 58.1
III.2.- Secondary Education 11,153 32.7
III.3.- University Education 2,999 8.8
III.4.- Other education activities
154 0.4
TOTAL 34,122 100.0
Source: Data produced by Siadeco, 2015.
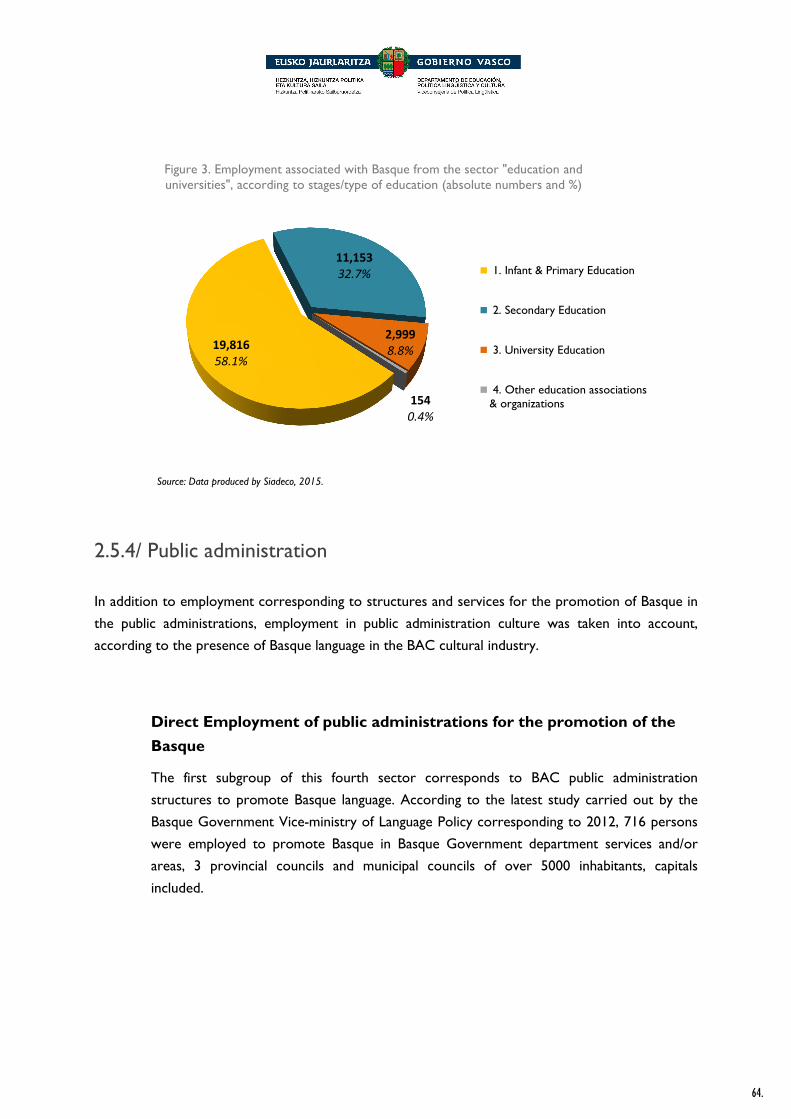
64.
2.5.4/ Public administration
In addition to employment corresponding to structures and services for the promotion of Basque in
the public administrations, employment in public administration culture was taken into account,
according to the presence of Basque language in the BAC cultural industry.
Direct Employment of public administrations for the promotion of the
Basque
The first subgroup of this fourth sector corresponds to BAC public administration
structures to promote Basque language. According to the latest study carried out by the
Basque Government Vice-ministry of Language Policy corresponding to 2012, 716 persons
were employed to promote Basque in Basque Government department services and/or
areas, 3 provincial councils and municipal councils of over 5000 inhabitants, capitals
included.
19,816
58.1%
11,153
32.7%
2,999
8.8%
154
0.4%
Figure 3. Employment associated with Basque from the sector "education and universities", according to stages/type of education (absolute numbers and %)
1. Infant & Primary Education
2. Secondary Education
3. University Education
4. Other education associations& organizations
Source: Data produced by Siadeco, 2015.

65.
Table 40. Reference employment of public administration areas of Basque
Sub-
sector Type of activity Total global budget
Subsidies and
agreements (cap.
IV. and VII.)
Employment
(full time)
IV.1
.- R
esour
ces
of B
asqu
e la
ngua
ge p
ublic
adm
inis
trat
ion
area
s
Basque language services of
municipal councils with over
5000 inhabitants and capitals
39,094,699 € 14,481,951 € 214
Basque language offices of
Provincial Councils 17,507,814 € 10,286,547 € 55
Basque language services of
Basque Government
departments 93,070,112 € 52,236,331 €
309
Dependent Bodies of the Basque
Government 138
TOTAL 149,672,625 € 77,004,829 € 716
Source: Basque Government – Vice-ministry of Language Policy, 2012
214
29.9%
55
7.7%309
43.1%
138
19.3%
Graph 4. Direct employment of the areas of Basque in public administrations of the BAC, according to type of organization (absolute numbers and %)
Town counciles with over 5000inhabitants and capitals
Basque aeas in Provincial Councils
Basque services in Basque Governmentdepartments
Autonomous bodies reporting to theBasque Government
Source: Data produced by Siadeco, 2015.
66.
Estimation of employment attributable to Basque in the promotion of
the culture developed by the public administrations
In the second sector defined for this study, the use of Basque language in companies,
organizations and associations that operate in the industry of culture and the media was
estimated. On the other hand, the estimation carried out for the second group of this
fourth sector corresponds to employment associated to Basque language in areas of public
administration culture; i.e. insofar as they are actions carried out by administrations to
promote culture in Basque, associated employment is considered to correspond to Basque
language. In order to do so, the data of the study that the Basque Government Basque
Culture Observatory carries out every two years was used; this study includes the number
of persons employed in each of the cultural sectors on a public administrations level. In
addition, in order to estimate employment to attribute to Basque we know the Basque
language coefficient for each of these areas (calculated in the second sector, for culture and
media industry). Using and crossing such Data, employment associated to Basque among
public administration personnel that work in the area of culture was estimated.
Direct employment in the area public administration culture and bodies depending on the
BAC comes to 1,770 persons, according to data from 2012 supplied by the Basque
Government Basque Culture Obervatory. According to the Basque language coefficients
defined for each type of cultural activity, the estimated data for jobs attachable to Basque is
795.

67.
Table 41. Reference employment for the area of public administration culture and their dependent bodies
Sub-
sector
Sector
cultural Type of activity
Sources of information
Referenc
e
employm
ent
Basque Government – Vice-ministry of Language Policy
(Statistics on budgets and public resources for Basque, 2012)
Budget
Personnel
costs
(chap. I.)
Contracting
services
(chap. II.)
Subsidies and
agreements
(chap. IV. and
VII.)
Rest of costs
and
investment
(chap. III. VI,
VIII and IX.)
Employment
Basque
language
coefficient
IV.2
- C
ultu
ral R
esou
rces
of t
he p
ublic
adm
inis
trat
ions
and
the
ir d
epen
dent
bod
ies
Cultural
heritage
Heritage and
archaeology 18,197,393 4,120,822 3,557,865 3,589,641 6.929.065 56 0.0% -
Libraries 35,233,842 19,291,771 12,735,032 53,249 3.153.790 261 31.7% 83
Archives 13,419,286 5,805,512 2,821,638 1,094,491 3.697.645 79 31.7% 25
Museums 44,505,444 10,556,419 17,968,550 11,568,856 4.411.619 143 5.0% 7
Industry of
art and
culture
Theatre and
dance 30,636,221 7,405,860 14,886,209 7,638,370 725.782 100 49.0% 49
Music 93,185,966 48,738,235 23,065,752 10,111,160 11.270.819 660 61.3% 405
Visual arts 7,769,941 1,516,287 3,627,442 2,380,083 246.129 21 0.0% -
Cinema and
audio-visual 21,952,479 2,610,682 9,088,918 4,327,216 5.925.663 35 40.0% 14
Literature 3,109,336 312,583 670,323 2,114,421 12.009 4 50.0% 2
Culture
Centres and
cultural activity
60,077,986 10,936,761 26,536,616 12,608,911 9.995.698 148 50.0% 74
Bertsolaritza 655,571 25,464 230,913 398,757 437 - 100.0% -
Media 10,065,319 676,185 1,515,680 7,864,939 8.515 9 100.0% 9
Fiestas and popular culture 34,287,928 1,985,587 25,811,075 6,423,786 67,480 27 50.0% 13
General cultural services 26,256,678 16,740,827 8,423,944 157,727 934,180 227 50.0% 113
TOTAL 399,353,390 130,722,995 150,939,957 70,331,607 47,378,831 1,770 795
Source: Basque Government- Basque Culture Observatory, 2012. Data produced by Siadeco, 2015.

68.
Total employment associated with Basque in the public administration of
the BAC
If we consider as a whole both the promotion of Basque and the promotion of culture in
Basque, employment linked to Basque in the public administrations of the BAC is estimated
to be around 1,511 jobs.
Table 42. Reference employment of public administrations and their distribution by subsectors
Sector Subsector Reference employment
Abs. %
IV. Public
administration
IV.1.- Resources of public administration
areas of Basque 716 47.4
IV.2.- Resources of public administration
areas of culture and their dependent
bodies
795 52.6
TOTAL 1.511 100.0
539
30.5%
977
55.2%
27
1.5% 227
12.8%
Figure 5. Employment of Basque in the areas of public administration culture, according to cultural sector (absolute numbers and %)
Cultural heritage
Art & culture industry
Fiestas & popular culture
General cultural services
Source: Data produced by Siadeco, 2015.
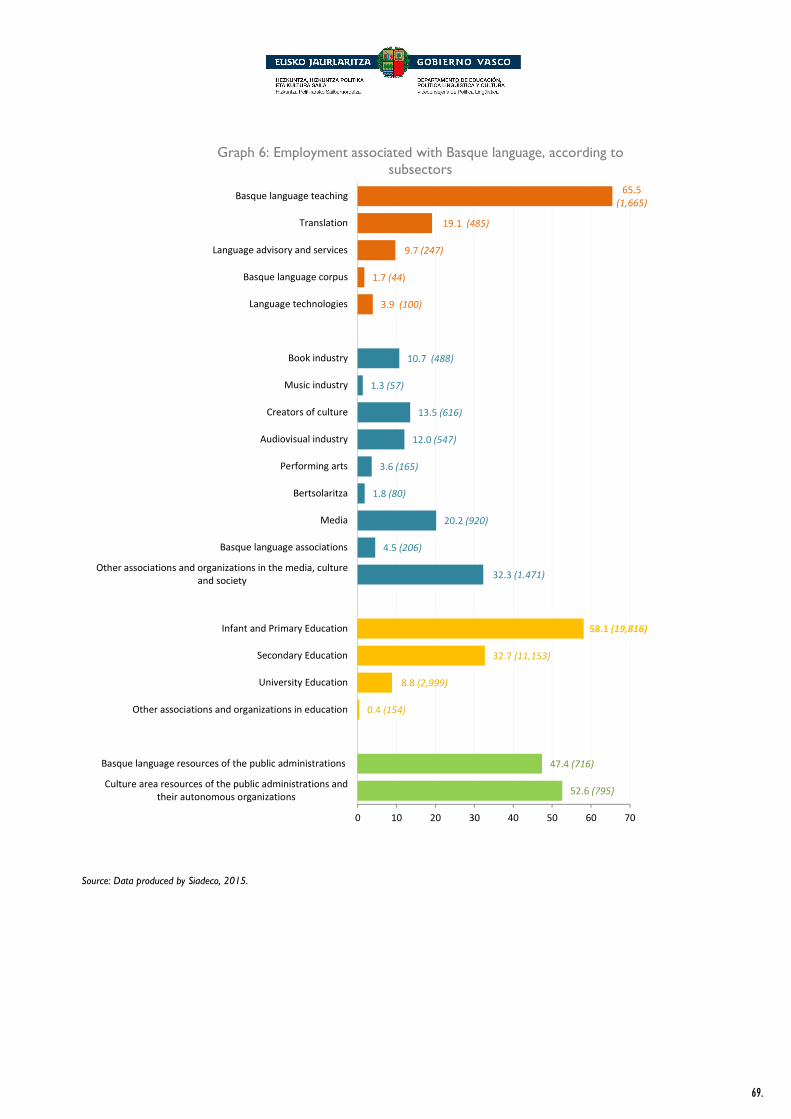
69.
52.6 (795)
47.4 (716)
0.4 (154)
8.8 (2,999)
32.7 (11,153)
58.1 (19,816)
32.3 (1.471)
4.5 (206)
20.2 (920)
1.8 (80)
3.6 (165)
12.0 (547)
13.5 (616)
1.3 (57)
10.7 (488)
3.9 (100)
1.7 (44)
9.7 (247)
19.1 (485)
65.5
(1,665)
0 10 20 30 40 50 60 70
Culture area resources of the public administrations and
their autonomous organizations
Basque language resources of the public administrations
Other associations and organizations in education
University Education
Secondary Education
Infant and Primary Education
Other associations and organizations in the media, culture
and society
Basque language associations
Media
Bertsolaritza
Performing arts
Audiovisual industry
Creators of culture
Music industry
Book industry
Language technologies
Basque language corpus
Language advisory and services
Translation
Basque language teaching
Graph 6: Employment associated with Basque language, according to subsectors
Source: Data produced by Siadeco, 2015.

70.
2.5.5/ TOTAL employment generated by Basque language sectors Table 43. Data corresponding to employment of Basque, according to Basque language sectors
Subsector
Employment associated with Basque
Abs.
%
On Basque
language
sector
On total
employment
related to
Basque
Accumulated
I.-
Lan
gu
age in
du
stry
I.1. Teaching Basque 1,665 65.5 3.9 3.9
I.2. Translation 485 19.1 1.1 5.0
I.3. Language services and consultancy 247 9.7 0.6 5.6
I.4. Corpus of Basque 44 1.7 0.1 5.7
I.5. Language technologies 100 3.9 0.2 5.9
Total industry of language 2,541 100.0 5.9 5.9
II.-
In
du
stry
of
cu
ltu
re a
nd
med
ia
II.1. Book industry 488 10.7 1.1 7.0
II.2. Music industry 57 1.3 0.1 7.1
II.3. Self-employed creators of culture 616 13.5 1.4 8.5
II.4. Industry of the audio-visual media 547 12.0 1.3 9.8
II.5. Performing arts 165 3.6 0.4 10.2
II.6. Bertsolaritza 80 1.8 0.2 10.4
II.7. Media 920 20.2 2.2 12.6
II.8. Basque Language Associations 206 4.5 0.5 13.1
II.9. Associations and organizations in the area of
media, culture and society 1,471 32.3 3.4 16.5
Total industry of culture and media 4,550 100.0 10.6 16.5
III.
- E
du
cati
on
an
d
Un
ivers
itie
s
III.1. Infant and Primary Education 19,816 58.1 46.4 62.9
III.2. Secondary Education 11,153 32.7 26.1 89.0
III.3. University Education 2,999 8.8 7.0 96.0
III.4. Other education activities 154 0.4 0.4 96.4
Total education and University 34,122 100.0 79.9 96.4
IV.-
Pu
blic
Ad
min
istr
ati
on
IV.1. Resources in the area of public administration
Basque 716 47.4 1.7 98.1
IV.2. Resources in area of public administration and
their dependent bodies culture 795 52.6 1.8 100.0
Total-public administration 1,511 100.0 3.5 100.0
TOTAL employment related to
Basque 42,724 100.0
Source: Data produced by Siadeco, 2015.
71.
ECONOMIC DATA FOR THE ECONOMIC DATA FOR THE ECONOMIC DATA FOR THE ECONOMIC DATA FOR THE BASQUE LANGUAGE SECTORS BASQUE LANGUAGE SECTORS BASQUE LANGUAGE SECTORS BASQUE LANGUAGE SECTORS 3333....

72.
In this third part of the report we have calculated another series of variables related to the direct economic impact of the Basque language on the Basque Autonomous Community, based upon the calculation of direct employment generated by the Basque language sector. Eustat carries out surveys to gather economic information in the BAC, and by matching the estimated data for direct employment with the activity data for the sectors and subsectors defined for this study, we are able to calculate the salary costs, Gross Value Added and total turnover. In the following methodological section we outline the way in which these estimations were made.
3.1/ Methodology
Quantification of the economic dimensions of Basque language sectors is based upon the use of the
average economic ratios of each branch of activity and other calculations made by Eustat.
♦ The economic data was obtained from Eustat corresponding to the activity classifications pertinent to this study (according to the National Classification of Economic Activities); this information has been produced by Eustat from the 2012 Service Survey. We began with the following economic data from each activity classification: number of businesses, employment, salary costs (salaries and social security contributions), turnover and Gross Value Added.
♦ Depending on the type of employment, the following ratios were calculated for each activity classification:
• Salary payment (thousand €) for each job.
• Turnover (thousand €) for each job.
• Gross Value Added (thousand €) for each job.
♦ Once businesses and activity branches linked to Basque language were classified accordingly, and bearing in mind employment corresponding to the Basque language, the
economic ratio were applied according to each job in every activity classification, and
economic figures were calculated for the Basque language subsector as a whole, i.e. employment, salary payments, Gross Value Added and turnover.
♦ The economic data of the fourth language sector, corresponding to the areas of Basque language and culture belonging to the various public administrations of the BAC, were
obtained from studies carried out by Siadeco for the Basque Government; these statistics are based on the 2012 public administration budgets: both statistics for Basque language
public resources (from the Vice-Ministry of Language Policy of the Basque Government)
and statistics from public resources culture (from the Basque Government Basque Culture Observatory).

73.
3.2/ Gross Value Added and Gross Domestic Product If, when working out an output we include the corresponding expenditure on products or
intermediate services, we would be double counting the economic resources of the country, as the
output from certain sectors would be included in others. By way of example, more than one sector
intervene in the productive chain of a book (author, printing, publishing, distribution, sales…), and
each link in the chain invoices the previous one, both for its own work and for work that has already
been paid for; thus if we add all the invoicing from all these sectors, the economic valuation of the
certain tasks will be accounted for more than once.
Gross Value Added, represents the value of a product or a service which is added during the
production process; therefore, Gross Value Added which corresponds to a specific economic sector
does not include either the economic transactions carried out in another sector or intermediate
consumption. The two most suitable variables for quantifying the economic impact of a specific
sector in the economy of a country are Gross Value Added and Gross Domestic Product. Gross
Domestic Product is calculated by adding net taxes on products to the Gross Value Added.
3.3/ Economic data of Basque language sectors
� Language Industry
The volume of annual turnover for companies and entities belonging to the language industry is 136
million, generating 107 million in Gross Value Added, 79 million euros of which are earmarked for
salary payments; activity from this first sector generates 2,500 jobs. The most relevant activity in this
sector are the euskaltegis (Basque language schools) and companies which provide translation
services. The specific results of each subsector are as follows:
I.1.- Basque language teaching (Euskaltegis, Official Public Language Schools and
language academies): around 1,665 jobs, 58 million € in salary payments, GVA of 69 million € and 82 million € total turnover.
I.2.- Translation sector: around 485 jobs (including self-employed), 8 million € in salary
payments, GVA 17 million € and 25 million € total turnover.
1.3.- Language Consulting Services: around 250 jobs, 7 million € in salary payments,
GVA of 11 million € and 14 million € total turnover.
1.4.- Basque Language Corpus: around 44 jobs, 1 million € in salary payments, GVA
total turnover of 1.8 million €.
1.5.- Language Technologies: around 100 jobs, 4 million € in salary payments, GVA of 7
million € and almost 13 million € total turnover.
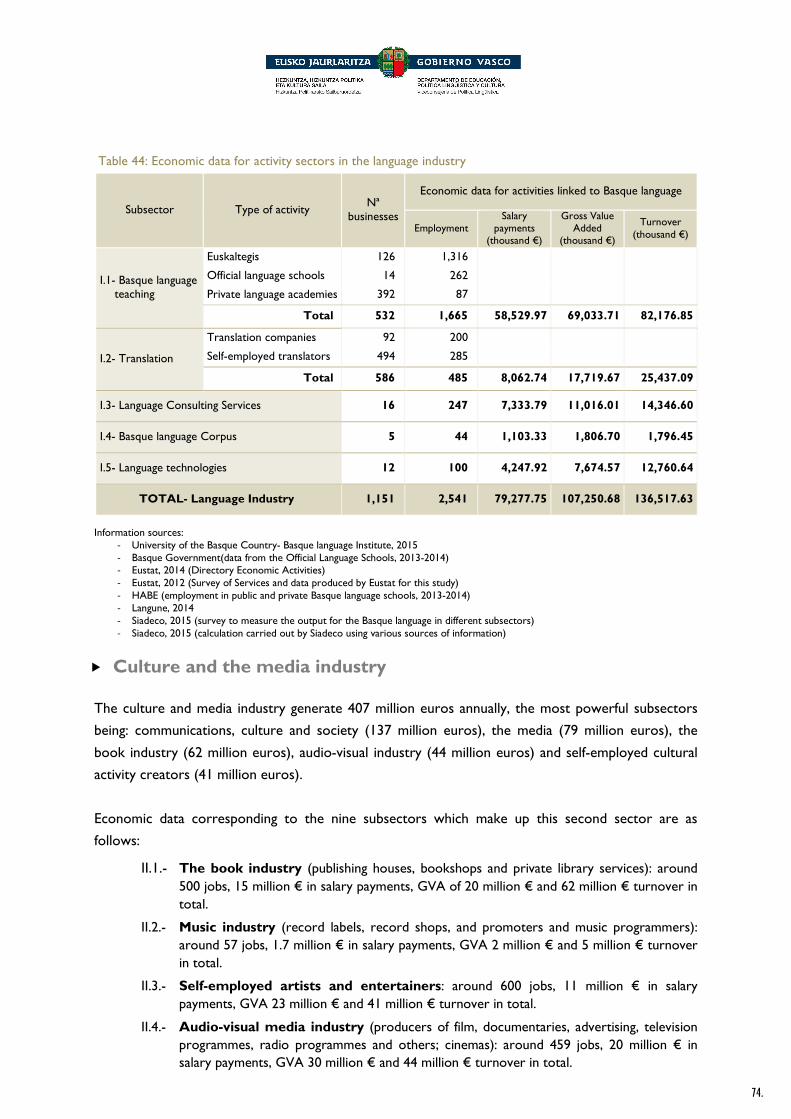
74.
Table 44: Economic data for activity sectors in the language industry
Subsector Type of activity Nª
businesses
Economic data for activities linked to Basque language
Employment Salary
payments (thousand €)
Gross Value Added
(thousand €)
Turnover (thousand €)
I.1- Basque language teaching
Euskaltegis 126 1,316
Official language schools 14 262
Private language academies 392 87
Total 532 1,665 58,529.97 69,033.71 82,176.85
I.2- Translation
Translation companies 92 200
Self-employed translators 494 285
Total 586 485 8,062.74 17,719.67 25,437.09
I.3- Language Consulting Services 16 247 7,333.79 11,016.01 14,346.60
I.4- Basque language Corpus 5 44 1,103.33 1,806.70 1,796.45
I.5- Language technologies 12 100 4,247.92 7,674.57 12,760.64
TOTAL- Language Industry 1,151 2,541 79,277.75 107,250.68 136,517.63
Information sources:
- University of the Basque Country- Basque language Institute, 2015 - Basque Government(data from the Official Language Schools, 2013-2014) - Eustat, 2014 (Directory Economic Activities) - Eustat, 2012 (Survey of Services and data produced by Eustat for this study) - HABE (employment in public and private Basque language schools, 2013-2014) - Langune, 2014 - Siadeco, 2015 (survey to measure the output for the Basque language in different subsectors) - Siadeco, 2015 (calculation carried out by Siadeco using various sources of information)
� Culture and the media industry
The culture and media industry generate 407 million euros annually, the most powerful subsectors
being: communications, culture and society (137 million euros), the media (79 million euros), the
book industry (62 million euros), audio-visual industry (44 million euros) and self-employed cultural
activity creators (41 million euros).
Economic data corresponding to the nine subsectors which make up this second sector are as
follows:
II.1.- The book industry (publishing houses, bookshops and private library services): around 500 jobs, 15 million € in salary payments, GVA of 20 million € and 62 million € turnover in total.
II.2.- Music industry (record labels, record shops, and promoters and music programmers): around 57 jobs, 1.7 million € in salary payments, GVA 2 million € and 5 million € turnover in total.
II.3.- Self-employed artists and entertainers: around 600 jobs, 11 million € in salary payments, GVA 23 million € and 41 million € turnover in total.
II.4.- Audio-visual media industry (producers of film, documentaries, advertising, television programmes, radio programmes and others; cinemas): around 459 jobs, 20 million € in salary payments, GVA 30 million € and 44 million € turnover in total.

75.
II.5.- Performing Arts (theatre and dance and programmers): around 165 jobs, 5 million € in salary payments, GVA 8 million € and 11 million € turnover in total.
II.6.- Bertsolaritza: around 80 jobs, 2 million € in salary payments, GVA 3 million € and almost 6 million € turnover in total.
II.7.- Media (newspapers, magazines, radio and telephone services, television and other televised services, internet and news agencies and freelance journalist): around 920 jobs, 44 million € in salary payments, GVA 59 million € and 79 million € turnover in total.
II.8.- Basque language associations: around 206 jobs, 8 million € in salary payments, GVA 12 million € and 21 million € in invoicing.
II.9.- Other associations and companies in the field of communication, culture and
society (cultural associations and companies, leisure and social area; communication and advertising companies; internet services; and archive and research services): around 1,471 jobs, 48 million € in salary payments, GVA de 70 million € and 137 million € turnover in total.

76.
Table 45: Economic data for subsectors belonging to the culture and media industry
Subsector Type of activity Nº
businesses
Economic data for activities linked to the Basque language
Employment Salary
payments (thousand €)
Gross Value Added
(thousand €)
Total turnover (thousand €)
II.1. Book Industry
Publishing 185 297
Bookshops 411 151
Private library services 18 40
Total 617 488 15,222.82 19,944.95 61,733.96
II.2. Music Industry
Record labels
59
28
Record shops 9
Promoters and music programmers
20
Total 59 57 1,676.85 2,221.30 5,159.45
II.3. Self-employed artists and entertainers 1,058 616 10,984.87 23,175.09 40,968.01
II.4. Audio-visual
media industry
Film producers, documentaries, advertising, TV and radio programmes, and other producers
408 536
Cinemas 51 11
Total 459 547 20,389.19 29,983.13 44,190.04
II.5. Performing
arts
Theatre and Dance companies 84 91
Theatre producers and programmers
26 74
Total 110 165 5,567.84 7,812.85 11,239.18
II.6.- Bertsolaritza 8 80 2,265.81 3,554.66 5,822.98
II.7.- Media
Newspaper publication 43 235
Magazine publication 79 64
Radios and radio services 57 271
Televisions and other televised services
20 311
Internet media 8 23
News agencies and freelance journalists
73 16
Total 280 920 43,737.73 58,732.26 79.277.93
II.8.- Basque language associations 84 206 8,078.99 12,132.58 21,625.96
II.9.- Other associations and companies in the field of communication, culture and social affairs
Cultural and leisure associations and companies
225 764
Media and advertising companies 1,394 627
Internet services 35 70
Archive and research centres 10 10
Total 1,521 1,471 48,264.53 69,912.27 136.659.85
TOTAL- Culture and media industry 4,196 4,550 156,188.63 227,469.09 406,677.36

77.
Information sources:
- EITB Group–activity memorandum, 2015 - Editors Guild Euskadi, 2012 (Basque language publications in the BAC) - Friends of Bertsolaritza association, 2015 (economic calculation for bertsolaritza for this study) - Basque Government– Basque Culture Observatory, 2011 (Statistics of Art and Culture Industries of the BAC) - Basque Government- Vice-Ministry of Language Policy (data re beneficiaries of subsidy tenders) - Basque Government – Public Library statistics in the BAC, 2002 - Eustat, 2014 (Directory Economic Activities) - Eustat, 2012 (Survey of Services and data produced by Eustat for this study) - Langune, 2014 - Music Industry Elkartea, 2015 - Topagunea – Federation of Basque language Associations, 2007 (employment and budgets of Basque language Associations) - Siadeco, 2015 (survey to measure the output for the Basque language in different subsectors) - Siadeco, 2015 (calculation carried out by Siadeco using various sources of information)
� Activities in the areas of education and universities
The economic variables corresponding to activities in the areas of education and universities reflect
very high figures; employment linked to the Basque language, from infant education to baccalaureate
and professional training, accounts for 31,000 jobs. To which must be added a further 3,000 jobs
linked to credit subjects taught in Basque at university.
The macroeconomic variables of this third sector, reflected for each subsector are as follows:
III.1.- Infant-Primary Education (Infant-Primary Education and Special Education): around 20,000 jobs (13,602 teaching staff and 6,214 non-teaching staff), almost 700 million € in
salary payments, GVA of 821 million € and 978 million € turnover in total.
III.2.- Secondary Education (ESO, job start up qualification programmes, Baccalaureate and Technical Training): around 11,000 jobs (7,656 teaching staff and 3.497 non-
teaching staff), almost 392 million € in salary payments, GVA of 462 million € and 550 million € turnover in total.
III.3.- University Education: around 3.000 jobs, 105 million € in salary payments, GVA of 124 million € and 148 million € turnover in total.
III.4.- Other associations and companies in the field of education: around 154 jobs, 5
million € in salary payments, GVA of 6 million € and 7 million € turnover in total.

78.
Table 46: Economic data for the subsectors in the area of education, according to the employment linked to contact hours given in the Basque language
Subsector Type of activity
Nº education centres (Eustat)
Economic data of the activity linked to the Basque language
Employment Salary payments (thousand €)
Gross Value Added
(thousand €)
Invoicing (thousand €) Teachers Others
III.1.- Infant-Primary Education
Infant Education 862 5.762 -
Primary Education 536 5.870 -
Special Education 46 135 -
Total 882 13,602 6,214 696,647.27 821.666.87 978.101.11
III.2.- Secondary Education
Secondary Obligatory Education
329 4,152 -
Professional start-up qualifications
68 - -
Baccalaureate 200 1,634 -
Technical Training 448 311 -
Total 477 7,656 3,497 392,092.60 462.457.14 550.502.71
III.3.- University Education 2,999 105,432.23 124,353.00 148,028.12
III.4.- Other associations and bodies in the area of education
154 5,413.99 6,385.58 7,601.31
TOTAL- Education 1,391 34,122 1,199,586.09 1,414,862.59 1,684,233.25
Information sources:
- University of Deusto- Basque and Multilingual Office, 2014-2015 - University of the Basque Country- Elebilab Program, 2015 - University of the Basque Country- Vice-rector Basque language, 2014-2015 - Eustat, 2014 (Directory of Economic Activities) - Eustat, 2014 (education statistics) - Department of Education of the Basque Government, 2012-2013 (distribution of teaching hours in the Basque language in the
education system) - Mondragon University, 2014-2015 - Siadeco, 2015 (calculation made by Siadeco from various information services)
� Public Administration
The total annual BAC public administration budget for the Basque language is 317 million. The Gross
Value Added for the sector reaches almost 118 million euros, of which 104 million is for salary
payments for 1,500 employees.
The macroeconomic variables corresponding to the two subsectors of the public administration area
as follows:
IV.1.- Public administration resources in the area of Basque language: around 716
jobs, almost 46 million € in salary payments, GVA of 51 million € and 146 million € in invoicing.
IV.2.- Resources in the area of culture corresponding to public administration and
autonomous bodies: around 795 jobs, almost 59 million € in salary payments, GVA of 66 million € and 171 million € in invoicing.

79.
Table 47: Economic data for the public administration subsector
Subsector
Total Budget (thousand €) and employment Economic data for activity linked to Basque
language
Bud
get
Pers
onne
l cos
ts
(C
hap.
I.)
Expe
nditu
re o
n go
ods
and
serv
ices
(C
ap. I
I.)
Subs
idie
s an
d ag
reem
ents
(c
hap.
IV. a
nd V
II.)
Oth
er c
osts
and
in
vest
men
t (c
hap.
III
. VI,
VIII
and
IX.)
Empl
oym
ent
Employment
Salary payments (thousand
€)
Gross Value Added
(thousand €)
Budget (thousand
€)
IV.1.-Public administration resources in the area of Basque language
146,250 45,861 26,254 75,722 1,834 716 716 45,861.62 51,640.15 146,250
IV.2.- Resources in the area of culture corresponding to the public administration and autonomous bodies
399,353 130,723 150,940 70,332 47,379 1,770 795 58,722.87 66,122.16 171,150
TOTAL- Public Administration
545,603
176,584
177,194
146,054
49,213
2,486 1,511 104,58
4.49 117,76
2.31 317,40
0
Information sources:
- Basque Government- Vice-ministry of Language Policy (Statistics on Basque language budgets and public resources, BAC, 2012)
- Basque Government-Basque Culture Observatory (Expenditure and Finance statistics, BAC, 2012)
3.4/ Economic dimension of the Basque language
Below we measure the proportional contribution and economic magnitude of the Basque language
sectors as they have been defined in the study, making a comparison with the overall data for BAC
employment and Gross Value Added.
Employment
According to Eustat a total of 894,000 jobs are generated by the economy of the BAC,
42,700 of which are linked to the Basque language, representing 4.78% of total employment
in the BAC.
80% of direct employment corresponds to the education sector, with 34,100 jobs; the sector
corresponding to the culture and media industry represents around 10%, language industry
6% and the remaining 4% corresponds to the public administration.
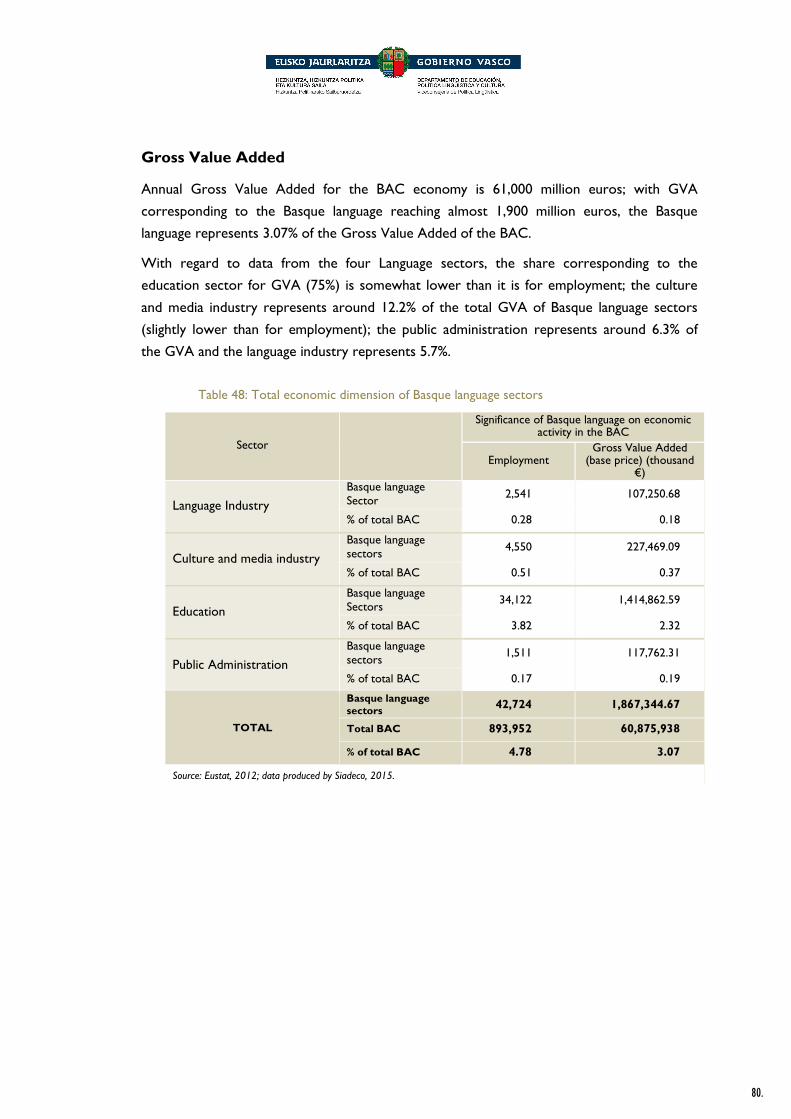
80.
Gross Value Added
Annual Gross Value Added for the BAC economy is 61,000 million euros; with GVA
corresponding to the Basque language reaching almost 1,900 million euros, the Basque
language represents 3.07% of the Gross Value Added of the BAC.
With regard to data from the four Language sectors, the share corresponding to the
education sector for GVA (75%) is somewhat lower than it is for employment; the culture
and media industry represents around 12.2% of the total GVA of Basque language sectors
(slightly lower than for employment); the public administration represents around 6.3% of
the GVA and the language industry represents 5.7%.
Table 48: Total economic dimension of Basque language sectors
Sector
Significance of Basque language on economic activity in the BAC
Employment Gross Value Added
(base price) (thousand €)
Language Industry
Basque language Sector
2,541 107,250.68
% of total BAC 0.28 0.18
Culture and media industry
Basque language sectors
4,550 227,469.09
% of total BAC 0.51 0.37
Education
Basque language Sectors
34,122 1,414,862.59
% of total BAC 3.82 2.32
Public Administration
Basque language sectors
1,511 117,762.31
% of total BAC 0.17 0.19
TOTAL
Basque language sectors
42,724 1,867,344.67
Total BAC 893,952 60,875,938
% of total BAC 4.78 3.07
Source: Eustat, 2012; data produced by Siadeco, 2015.

81.
ECONOMIC IMPACT ECONOMIC IMPACT ECONOMIC IMPACT ECONOMIC IMPACT OF THE BASQUE LANGUAGEOF THE BASQUE LANGUAGEOF THE BASQUE LANGUAGEOF THE BASQUE LANGUAGE 4444....

82.
4.1/ Methodological clarifications
� The economic impact: direct, indirect and induced When it comes to quantifying the economic impact of the Basque language, every kind of
expenditure and investment made by branches and sectors involved, both those within the language
sector itself and other sectors of the productive economy of the BAC, have to be taken into
consideration, as they affect both employment and income. Thus, both the direct and the indirect
impact have to be taken into account when calculating the economic impact.
The methodology used to calculate the indirect economic impact is based on input-output modelling
or intersectoral transaction tables. This methodology enables the quantification of the impact that an
increase in final demand in one sector produces on other sectors due to, for example, an increase in
purchases on the part of suppliers (indirect economic impact). Input-output methodology also
enables the quantification of the multiplier effect derived from family consumption (induced impact);
the expenditure and investment carried out in direct and indirect sectors generate work and income;
and in turn this family income brings about further demand for products and services, which also has
an influence on the aggregate market demand.
Thus, when it comes to quantifying the total economic impact of Basque, we have to take into
account both the direct and the induced impact.
� Economic evaluation of goods and products: The evaluation of a product can be made from two perspectives, that of the purchaser and that of
the producer of the product. The difference between these values is explained by the following
factors:
- The work of intermediaries, who generate commercial and transport costs when bringing the manufactured product to the consumer.
- Taxes and subsidies; on the one hand, purchasers of products have to pay tax (Value Added Tax) and on the other, products may also be subsidized and put on sale at lower prices.
Therefore, when evaluating goods, we differentiate between market prices (the price to be paid by
the buyer) and the basic price (from the point of view of the producer). The evaluation from the
point of view of basic prices depends on production costs, so the costs of primary input (personnel
and capital costs) is added to the intermediate input or consumption. If we add to the basic prices
both the costs borne by the intermediaries to bring the product to the final consumer, as well as
taxes and then we deduct the subsidies, we obtain the market price.

83.
When it is the value of the product which is to be economically quantified, basic prices have to be
taken into account; on the other hand when the aim is to quantify the product cost for the
purchaser, it is the market price which should be taken into consideration. In accounting figures
which are usually published, the data referring to the total demand for a product is based on market
prices, and those referring to supply are based on basic prices.
� Input-Output Statistics Tables
To be able to quantify the importance of the Basque language in the BAC economy, calculations were
made based, on one hand, on Gross Value Added, and on the other hand, using Input Output tables
which reflect the interdependence between the different economic sectors of the BAC. These tables
are based on the economic model developed by the Nobel Prize winner in Economics, Wassily
Leontief.
The system of Input-Output tables is the most popular for measuring the impact of a particular
sector on the GDP of a country or a region. Input-Output tables are statistical tools which provide
information regarding the output of a country; they show the distribution by sectors of the total
production of the region, and also for which sectors the production of each sector is destined. With
the data from the Input-Output tables it is also possible to find out how much of the production of a
particular sector is designated for final consumption and which proportion is for intermediate
consumption by other sectors. Economic data is included in Input-Output tables regarding the
relation between products and different branches of activity, and moreover, by making use of the
corresponding Gross Value Added data, the problem of double accounting is resolved.
The main information tables of the Input/Output model or economic system are as follows: “origin
table”, “destination table” and “symmetric table”.
- Input/output table of origin: this reflects the total supply of goods and services in an economy, differentiating between local and imported production.
- Input/output destination table: reflects the total demand of goods and services in an economy, differentiating between the uses made of each kind of product, that is, the quantity earmarked for intermediate consumption and the quantity earmarked for final consumption. The totals of the “origin” and “destination” tables are identical, if the system is balanced. The destination table also provides information about value added (i.e. regarding the return obtained from primary factors like work and capital, during the production process) from each branch of activity. This information is placed in columns. Then the total of each column, the result of adding intermediate input consumption and primary input income, reflects the value of the production for each branch of activity.

84.
- The “symmetric” table: this is a table made from the previous tables and is largely the result of processes of reproduction of the origin/destination subsystem; generally, the statistical system does not directly provide the necessary information with which to draw up this table. Its structure is similar to the destination table, but with two important differences:
• A theoretical Input/Output table is drawn up in which the products and branches of activity are homogenous; i.e. one branch of activity produces a unique product and a single product is produced by one branch of activity.
• Also reflected is the data corresponding to the importation of products, thus, as well as offering a production value (at basic prices) of the product in question, it also reflects the total value of demand at basic prices (in accounting terms, the value of the used resources).
In effect, it is the symmetric table which, by including (in the columns) the production function
(costs) according to each product, enables the coefficient matrix to be drawn up which is used most
when it comes to quantifying the economic impact of an activity. In the symmetric table drawn up by
Eustat for the BAC, the quantity of intermediate consumption carried out in the BAC itself, in Spain
and outside either of these is specified. The technical coefficients and the Leontief matrix used to
calculate the indirect impact are based on the symmetric table, and as far as intermediate
consumption in other sectors is concerned, only the expenditure carried out in the area itself is
taken into account; for this study, these coefficients have been calculated according to the level of
consumption within the BAC.
� Procedure to calculate the direct or indirect impact Using the BAC Input-Output tables drawn up by Eustat, the following procedure has been used to
estimate the direct impact, indirect impact and induced impact of the Basque language:
1.- The economic data of associations, companies and organizations from sectors and subsectors
related to the Basque language (Gross Value Added and employment) were put into the activity branches of the Input-Output table (according to the CNAE- National Classification of Economic Activities). There are 85 branches of activity for Input-Output 85, but for the purposes of this study to calculate the direct impact of Basque, the organizations taken into account were placed among the 13 branches listed below:
• Graphic Arts and reproduction (code: 15).
• Retail trade (code: 50).
• Publishing (code: 59).
• Audio-visual, cinema, radio and TV (code: 60).
• Information Technology (code: 62).
• Legal activities and accountancy (code: 67).
• Research and development (code: 69).
• Advertising and market studies (code: 70).
• Other professional activities (code: 71).
• Public administration (code: 76).

85.
• Education (code: 77).
• Cultural activities; gambling (code: 80).
• Association activities (code: 82).
2.- Depending on the Gross Value Added (GVA) for the Basque language sectors of each branch of the Input-Output table (IO Table), i.e. using the GVA of the direct impact, the data for the direct impact were calculated in terms of production and employment values linked to Basque for each IO branch; to do this, by applying the relation coefficient between the GVA and the production value of each IO branch, the production value of the direct impact corresponding to the Basque language for each IO branch was estimated. Next, starting with the direct production value linked to Basque of each IO branch, direct employment was estimated, applying the coefficient of the relation between the value of production and employment for each branch. In this way, the direct impact of Basque was calculated, in terms of the three main variables: production, Gross value added and employment.
3.- To measure the indirect impact the intermediate consumption acquired by agents and
entities connected to Basque either from within the same sector or from other sectors have been taken into account. The operation was carried out using the technical coefficients of the IO symmetrical table; these technical coefficients indicate the relation between the production value and the intermediate consumption of each IO branch; the technical coefficients are used to calculate the economic impact generated by the intermediate consumption required by a branch of the activity to carry out production, in this way the indirect economic impact is calculated. By applying technical coefficient multipliers, the impact which spreads throughout all the activity branches supplying each other is calculated. Consequently, although the figures are fairly low, it can be seen that the indirect impact of the Basque language reaches most activity branches within the IO table.
4.- Once the direct and indirect economic impact of Basque had been calculated with regard to the 85 activity branches, by way of simplification, we grouped the 85 activity branches into 14 broader groups.

86.
Table 49: Activity branches of the Input-Output tables, by economic sectors
Source: Eustat, 2012. Data provide by Siadeco, 2015.

87.
4.2/ Direct and Indirect economic impact
4.2.1/ Output Value The output value of an economic activity is calculated by adding intermediate consumption to Gross
Value Added. There may be differences between the output value and total sales, as not all the
output may be sold or some subsidized products may be sold at a lower price than the output cost.
The annual output value of the direct and indirect impact of Basque language sectors is almost 3,000
million euros (2,949 million euros); 84.7% of the output value corresponds to direct impact (2,497
million euros) and the remaining 15.3% to indirect impact (451 million euros). The total value of
output of the sectors of the BAC amounts to 135,000 million (135,277 million euros), the output
value of the impact and indirect impact of the Basque language is 2.18%.
Analysing the direct impact of the Basque language by sectors, it should be pointed out that the
biggest is the Education sector (1,762 million euros), accounting for 70.6% of the total output value
linked to Basque; it must not be overlooked that this calculation is based on employment generated
by the teaching of Basque throughout the different stages of education.
Following Education, and accounting for 8-9%, come Information and Communication activities (240
million euros) and Public Administration (208 million euros). Then, representing 5-6%, are Cultural,
Sports and Leisure Services (157 million euros) and Professional Services (124 million euros).
However, as we have mentioned previously, the indirect impact of the Basque language, extends to a
greater or lesser extent, to all the economic sectors; the agents of the Basque sector, to be able to
produce their products and carry out their services, generate a certain level of output in other
sectors. In total, indirectly, the Basque language generates an output value of 451,857,000 euros.
In order to correctly interpret the data from the indirect and indirect impact output value table
below, the following aspects should be taken into consideration:
- The figures for the output value which appear in the indirect impact column no not correspond
only to this economic sector; in fact, one sector can have an effect on many other sectors. For example, in Economic Sector III (manufacturing industries), the output value of the direct impact
is one million euros, and the indirect impact is 55 million euros. In this case, the indirect impact
comes to a large extent from Sectors VII (mainly activity branch 59, Publishing), XI (Public
Administration) and XII (Education), as the suppliers who need these activity branches are in Economic Sector III, in IO branches 14 and 15 (Paper and Graphic Arts Industry and Printing).

88.
- It is also striking that, with a direct impact output value of 208 million euros, the public
administrations do not generate any indirect impact. The explanation is that the figure corresponding to the output value generated indirectly is reflected in the output linked to
intermediate demand for the working of the public administration, which is accounted for in the
corresponding IO branch; but as an economic sector, the public administration does not appear
in the IO table as a supplier of any other sector (the entire output of this sector is for final demand), and therefore, the direct economic impact of the Basque language does not affect its
output.
Thus, the sector with the largest influence on the indirect impact of the Basque language are Information
and Communication activities (86 million euros – 19.1%) and the Trade, Catering and Transport sector
(75 million euros – 16.5%).
In total, taking into account the direct and indirect impacts, the annual output value of the Basque
language reaches almost 3,000 million euros (2,949 million euros); the Education sector is responsible for
the largest proportion (1,768 million euros, 60.0%). This is followed, but at a great distance, by
Information and Communication activities (11%), Public Administration (7%), Cultural, Sports and Leisure
Services (6%) and Professional Activities (6%). 2.7% of the direct output value of the Basque language
corresponds to Trade, Catering and Transport and less than 2% to the remaining sectors.
Thus, the output value of the direct and indirect impact of the Basque language represents 2.18% of the
total of the BAC. This proportion is not distributed equally among the Input-Output branches, and there
are sectors with an output value closely linked to the Basque language: for example, 50.4% of the output
value of the branch corresponding to education is generated –directly or indirectly- by Basque; 44.1% of
the total output for the branch represented by audio-visuals, cinema, radio and TV is generated by the
Basque language, as well as 28% of the total publishing branch output.
In the following activity branches, the output value linked to the Basque language varies between 11-15%:
Professional Activities (15%), Cultural Activities and Gambling (13%), Association Activities (12%),
Advertising and Market Studies (11%). In the remaining IO branches the contribution of the Basque
language is considerably lower.

89.
Table 50: Direct and indirect impact of the Basque language on the economic sectors of the BAC, according to the value of output
Economic Sector Input-Output Activity Branches
Output Value (thousand €) Direct Impact Indirect Impact TOTAL
Abs. %
horizon-tal
Abs. %
horizon-tal
Abs. %
vertical % of BAC
I.- Agriculture, livestock, forestry and fishing 01, 02, 03 - 0.00 449 100.00 449 0,02 0,04
II.- Mining Industries 04 0.00 1 100.00 1 0,00 0,00
III.- Manufacturing Industries
15. Graphic arts and printing 1,050 7.40 13,140 92.60 14,190 0.48 2.81 Remaining I/O branches: between 05 and 42, except 15 - 0.00 42,141 100.00 42,141 1.43 0.09
Total sector III 1,050 1.86 55,281 98.14 56,331 1.91 0.12 IV.- Energy, gas and water
storage 43,44,45,46 - 0.00 37,575 100.00 37,575 1.27 0.48
V.- Construction 47 - 0.00 39,223 100.00 39,223 1.33 0.30
VI.- Trade, catering and transport
49. Wholesale trade 0.00 7,523 100.00 7,523 0.26 0.15 50. Retail trade 4,794 52.06 4,415 47.94 9,209 0.31 0.23 58. Catering 0.00 31,243 100.00 31,243 1.06 0.54 Remaining I/O branches: from 48-58, except 49,50 and 58 - 0.00 31,698 100.00 31,698 1.07 0.40
Total sector VI 4.794 6.02 74,879 93.98 79,673 2.70 0.35
VII.- Communication and information activities
59. Publishing 85,483 87.47 12,244 12.53 97,728 3.31 27.98
60. Audio-visual, cinema, radio and TV. 145,795 86.65 22,468 13.35 168,263 5.70 44.08
61. Telecommunications 0.00 29,960 100.00 29,960 1.02 1.69
62. Information Technology 9,440 30.26 21,756 69.74 31,195 1.06 2.64
Total sector VII 240,718 73.58 86,428 26.42 327,146 11.09 8.87
VIII.- Financial services and real estate activities 63,64,65 y 66 - 0.00 47,833 100.00 47,833 1.62 0.38
IX.- Professional Activities
67. Legal and accounting activities 29,388 67.15 14,376 32.85 43,764 1.48 1.63
68. Architecture and engineering Services. 0.00 3,578 100.00 3,578 0.12 0.15
69. Research and development 7,353 97.15 215 2.85 7,568 0.26 1.45
70. Advertising and market studies 49,535 85.15 8,639 14.85 58,174 1.97 11.44
71. Other professional activts. 37,438 70.52 15,654 29.48 53,092 1.80 14.96
Total sector IX 123,713 74.45 42,464 25.55 166,177 5.63 2.59
X.- Renting, travel agencies and auxiliary activities 72,73,74 and 75 - 0.00 38,035 100.00 38,035 1.29 1.32
XI.- Public Administration 76 207,532 100.0
0 - 0.00 207,532 7.04 4.08
XII.- Education 77 1,762,939 99.71 5,188 0.29 1,768,12
7 59.95 50.35
XIII.- Health and Social Services
78 y 79 - 0.00 6,193 100.00 6,193 0.21 0.12
XIV.- Cultural services, sports and leisure
80. Cultural activities; gambling 98,452 93.68 6,638 6.32 105,091 3.56 12.89
81. Sports and recreation activities 0.00 3,316 100.00 3,316 0.11 0.53
82. Association activities 58,420 96.90 1,866 3.10 60,286 2.04 12.41
Other I/O branches: 83,84 and 85 - 0.00 6,488 100.00 6,488 0.22 0.47
Total sector XIV 156,872 89.55 18,308 10.45 175,180 5.94 5.31
TOTAL 2,497,618 84,68 451,857 15.32 2.949.475 100,00 2.18
Source: Eustat, 2012; Data produced by Siadeco, 2015

90.
4.2.2/ Gross Value Added The indirect and direct gross value added of Basque is 2,100 million euros annually. Generally
representing 3.45% of the total Gross Value Added of the BAC (60,875 million euros); 88.9% of this
corresponds to direct impact (1.867 million euros), and the remaining 11.1% to indirect impact (233
million euros).
GVA of impact direct
80% of the total GVA of the four sectors of the Basque language corresponds to the formal
education sector, universities and other educational activities, 1,488 million euros (79.7%).
Next, but by a considerable margin, representing 6%, are the public administrations (118 million
euros), and information and communications activities (114 million euros); and with 4%, cultural,
sports and leisure services (76 million euros) and professional activities (68 million euros).
However, as with the output value, the indirect impact of the Basque language on Gross Value
Added extends, to a greater or lesser extent, to all the economic sectors; we are referring to the
Gross Value Added of output which the agents of the Basque language sector generate in other
sectors to produce products or services. In total, indirectly, the Basque language generates Gross
Value Added of 233 million euros.
GVA of indirect impact
The sectors in which the indirect impact of the Basque language has the greatest effect on GVA
are communications and information activities (43,605,000€ -18.7%), the trade, catering and
transport sector (39,762,000€ -17.1%) and the financial services and real estate activities sector
(37,697,000€ -16.2%).
GVA of direct and indirect impact
In total, taking into account the direct and indirect impact, the education sector has the biggest
effect (71.1%), and next, at a great distance, are the information and communications activities,
(7.5%), public administration (5.6%), cultural, sports and leisure services (4.1%) and professional
activities (4.3%). 2.1% of the direct and indirect output value of the Basque language corresponds
to the trade, catering and transport sectors, and less than 2% to the remaining sectors.
Thus, the Gross Value Added corresponding to the direct and indirect impact of the Basque
language on the whole of the BAC is 3.45%. This proportion is not distributed equally over all the
Input-Output branches, and there are sectors with a GVA which is much more closely linked to
the Basque language: in particular 50.6% of the output value of the education branch is generated
–directly or indirectly- by Basque; in the audio-visual branch, cinema, radio and TV some 42.4% of
the total output is generated by the Basque language, as well as 26.5% of the total output of the
publishing branch.

91.
In the following activity branches, the Gross Value Added linked to the Basque language is
between 11-14%: other professional activities (14.3%), cultural activities and gambling (12.1%),
association activities (12%), and advertising and market studies (11.9%). In the remaining IO
branches the contribution of the Basque language to Gross Value Added is considerably lower.
Table 51: Direct and indirect impact of the Basque language on the economic sectors of the BAC, in terms of Gross Value Added
Economic Sector Input-Output activity
branches
Gross Value Added (000€)
Impact direct Impact indirect TOTAL
Abs. % horizontal Abs. %
horizontal Abs. % vertical % of BAC
I.- Agriculture, livestock, forestry and fishing 01, 02, 03 - 0.00 227 100.00 227 0.01 0.04
II.- Mining Industries 04 0.00 1 100.00 1 0.00 0.00
III.- Manufacturing Industries
15. Graphic Arts and reproduction 457 7.40 5,722 92.60 6,180 0.29 3.07
Other I/O branches: between 05 and 42, except 15 - 0.00 14,106 100.00 14,106 0.67 0.12
Total sector III 457 2.25 19,829 97.75 20,286 0.97 0.16 IV.- Energy, gas and water
storage 43,44,45,46 - 0.00 12,443 100.00 12,443 0.59 0.55
V.- Construction 47 0.00 11,623 100.00 11,623 0.55 0.27
VI.- Trade, catering and transport
49. Wholesale trade 0.00 4,965 100.00 4,965 0.24 0.15 50. Retail Trade 3,224 52.06 2,969 47.94 6,193 0.29 0.22 58. Catering 0.00 14,639 100.00 14,639 0.70 0.54 Other I/O branches: between 48-58, except 49,50 and 58 - 0.00 17,188 100.00 17,188 0.82 0.49
Total sector VI 3,224 7.50 39,762 92.50 42,985 2.05 0.35
VII.- Information and communication activities
59. Editorial 45,010 87.47 6,447 12.53 51,457 2.45 26.52 60. Audio-visual, cinema, radio and TV. 63,270 86.65 9,750 13.35 73,020 3.48 42.38
61. Telecommunications 0.00 15,362 100.00 15,362 0.73 1.59 62. Information technology 5,226 30.26 12,045 69.74 17,271 0.82 2.45
Total sector VII 113,506 72.25 43,605 27.75 157,111 7.48 7.70 VIII.- Financial services and
real estate activities 63,64,65 and 66 - 0.00 37,697 100.00 37,697 1.79 0.38
IX.- Professional activities
67. Legal and accounting activts. 17,037 67.15 8,334 32.85 25,371 1.21 1.63
68. Architecture and engineering 0.00 1,768 100.00 1,768 0.08 0.14
69. R & D 5,972 97.15 175 2.85 6,146 0.29 2.01 70. Advertising and market studies 23,086 85.15 4,026 14.85 27,112 1.29 11.90
71. Other professional activ. 21,720 70.52 9,082 29.48 30,802 1.47 14.29 Total sector IX 67,814 74.36 23,386 25.64 91,200 4.34 2.56
X.- Renting Activities, travel agencies and auxiliary activities
72,73,74 and 75 - 0.00 25,240 100.00 25,240 1.20 1.50
XI.- Public Administration 76 117,762 100.00 - 0.00 117,762 5.61 3.85 XII.- Education 77 1,488,332 99.71 4,380 0.29 1,492,712 71.07 50.60 XIII.- Health and social
services 78 and 79 - 0.00 4,722 100.00 4,722 0.22 0.12
XIV.- Cultural, sports and leisure services
80. Cultural Activities; gambling 49,186 93.68 3,316 6.32 52,503 2.50 12.08
81. Sports and recreation activ 0.00 1,835 100.00 1,835 0.09 0.50
82. Association activities 27,063 96.90 865 3.10 27,927 1.33 12.00 Other I/O branches: 83. 84 and 85 - 0.00 4,069 100.00 4,069 0.19 0.36
Total sector XIV 76,249 88.32 10,085 11.68 86,334 4.11 4.00 TOTAL 1,867,344 88.91 232,999 11.09 2,100,43 100.00 3.45
Source: Eustat, 2012; data produced by Siadeco, 2015.

92.
4.2.3/ Employment After adding indirect employment to direct employment calculated previously, it can be seen that
the Basque language generates 46,472 jobs in the economy of the BAC; in other words, 5.20% of
total employment of the BAC (893,952 jobs) corresponds to employment generated directly or
indirectly by the Basque language.
Direct Employment
84% of direct employment generated by the Basque language is linked to the field of education,
with 35,894 jobs.
In absolute terms, this is followed by communications activities (1,907 jobs), culture, sports and
leisure services (1,712 jobs), professional activities (1,527 jobs) and public administration (1,511
jobs).
Indirect Employment
However, just as with GVA, the indirect impact of the Basque language on employment extends,
to a greater or lesser extent, to all economic sectors; here we refer to employment generated by
Basque language agents in other sectors to provide their products or services. In total, indirectly,
the Basque language generates 3,748 jobs.
Total direct and indirect employment
In total, bearing in mind the direct and indirect impact, the education sector represents the
biggest share of employment (35,982 jobs – 77.4%), followed, but a long way off, by media activity
sectors (2,466 jobs), professional activities (2,017 jobs), cultural, sports and leisure services (1,952
jobs) and the public administration (1,511 jobs).
Thus, 5.2% of total employment in the BAC corresponds to the direct and indirect impact of the
Basque language. This is not equally distributed over all Input-Output branches; in education, 57%
of employment is directly linked to the Basque language. Other sectors do not contribute so
much, although in some cases the proportion is noteworthy. For example, 40% of employment in
the audio-visual, cinema, radio and TV branch is generated -directly or indirectly- by Basque; and
in the publishing branch 33%; the cultural activities branch accounts for 22% of employment, other
professional activities for 16% and the advertising and market studies branch for 13%. Thus, it can
be stated that the proportion of employment linked to the Basque language in some branches of
activity is considerable.

93.
Table 52: Direct and indirect impact of the Basque language on the economic sectors of the BAC, in terms of Employment
Economic Sector Input-Output activity Branches
Employment (jobs )
Direct impact Indirect impact TOTAL
Abs. % horizontal Abs. % horizontal Abs. %
vertical % on BAC
I.- Agriculture, livestock, forestry and fishing 01, 02, 03 0 0.00 8 100.00 8 0.02 0,06
II.- Mining Industries 04 0.00 0 100.00 0 0.00 0.00
III.- Manufacturing industries
15. Graphic Arts and reproduction 11 7.66 133 92.34 144 0.31 3.34
Other I/O branches: between 05 and 42, except 15 0 0.00 262 100.00 262 0.56 0.14
Total sector III 11 2.71 395 97.29 406 0.87 0.22
IV.- Energy, gas and water storage 43,44,45,46 0 0.00 43 100.00 43 0.09 0.53
V.- Construction 47 0.00 185 100.00 185 0.40 0.28
VI.- Trade, catering and transport
49. Wholesale Trade 0.00 67 100.00 67 0.14 0.15
50. Retail Trade 162 66.85 80 33.15 242 0.52 0.34
58. Catering 0.00 277 100.00 277 0.60 0. 56
Other I/O branches: between 48-58, except 49,50 and 58 0 0.00 279 100.00 279 0.60 0.53
Total sector VI 162 18.71 704 81.29 866 1.86 0,40
VII.- Media activities
59. Publishing 687 89.61 80 10.39 767 1.65 32.90
60. Audio-visual, cinema, radio and TV. 1,121 84.07 212 15.93 1,333 2.87 39.99
61. Telecommunications 0.00 49 100.00 49 0.11 1.77
62. Information Technology 99 31.24 218 68.76 317 0.68 2.62
Total sector VII 1,907 77.32 559 22.68 2,466 5.31 12,00
VIII.- Services financial and real estate activities 63,64,65 and 66 0 0.00 133 100.00 133 0.29 0.53
IX.- Professional activities
67. Legal and accounting activities 230 63.05 135 36.95 365 0.78 1.56
68. Architecture and engineering services 0.00 28 100.00 28 0.06 0.16
69. Research and development 135 98.06 3 1.94 138 0.30 2.03
70. Advertising and market studies 563 86.60 87 13.40 650 1.40 12.79
71. Other professional activities 599 71.59 238 28.41 837 1.80 15.55
Total sector IX 1,527 75.70 490 24.30 2,017 4.34 3.50
X.- Renting activities, travel agencies and auxiliary activities
72,73,74 and 75 0 0.00 838 100.00 838 1.80 1.65
XI.- Public administration 76 1,511 100.00 0 0.00 1,511 3.25 2.69
XII.- Education 77 35,894 99.75 88 0.25 35,982 77.43 57.43
XIII.- Health and social Services 78 y 79 0 0.00 65 100.00 65 0.14 0.10
XIV.- Cultural, sports and leisure services
80. Cultural activities; gambling 1,163 95.84 50 4.16 1,213 2.61 21.88
81. Sports and recreation activities 0.00 35 100.00 35 0.08 0.53
82. Association Activities 549 95.52 26 4.48 575 1.24 8.60
Other I/O branches: 83,84 and 85 0 0.00 129 100.00 129 0.28 0.29
Total sector XIV 1,712 87.70 240 12.30 1,952 4.20 3.06
TOTAL 42,724 91.93 3,748 8.07 46,472 100.00 5.20
Source: Eustat, 2012; data produced by Siadeco, 2015.

94.
4.3/ Induced impact
4.3.1/ Methodological Procedure Induced impact arises from private consumption proceeding from family income generated directly
or indirectly by the economic activity of the Basque language sectors; therefore, the multiplier effect,
which the indirect and direct impact of Basque generates on the BAC community, has been
calculated.
To estimate the induced impact, the procedure was as follows:
- Using the direct and indirect output value estimated for each branch of IO activity and applying the salary coefficient/output value, total salaries paid out which correspond to direct and indirect employment was calculated, minus social security contributions.
- From the total gross income received by people on a payroll, we deduct the average Personal Income Tax and social security contribution for employees (4.70%), and we calculate the available funds for savings and family spending. The average Personal Income Tax was calculated from payments made to the Inland Revenue Department, bearing in mind the income and tax allowances available depending on the personal situation of tax payers. This percentage is 16.67% in Spain (Source: Spanish Government; Tributary Administration Memorandum, 2012).
- The main part of this income is earmarked for spending and a smaller portion towards savings. By subtracting savings from disposable income we can calculate how much is dedicated to consumption or spending. According to the 2013 Economic Bulletin of the Bank of Spain, the savings rate for Spanish families was 8.2% at the end of 2012. Thus, 91.8% was used for family spending.
- Using data from the symmetric IO table and bearing in mind the part of the output from each branch of activity value which is destined for final consumption, the figure for total family consumption calculated in the previous point was distributed according to the branches of the symmetric IO table.
- The output value dedicated by families for final consumption in each IO branch, is calculated at basic prices; but, the payment of indirect taxes has to be borne by the amount used by families for final consumption. Therefore, the amount distributed among IO branches is what remains from what families have earmarked for consumption once tax on products or output has been deducted. To calculate these taxes, we have applied the levied taxes corresponding to the products made in each IO branch (4%, 10% and 21%).
- Once consumption emanating from the income generated by the direct and indirect impact of the Basque language sectors is known for each IO branch, and the corresponding Leontief coefficients have been applied to each branch (on GVA/output value and on employment/output value), then the total data for the induced impact is obtained (output value, GVA and Employment).
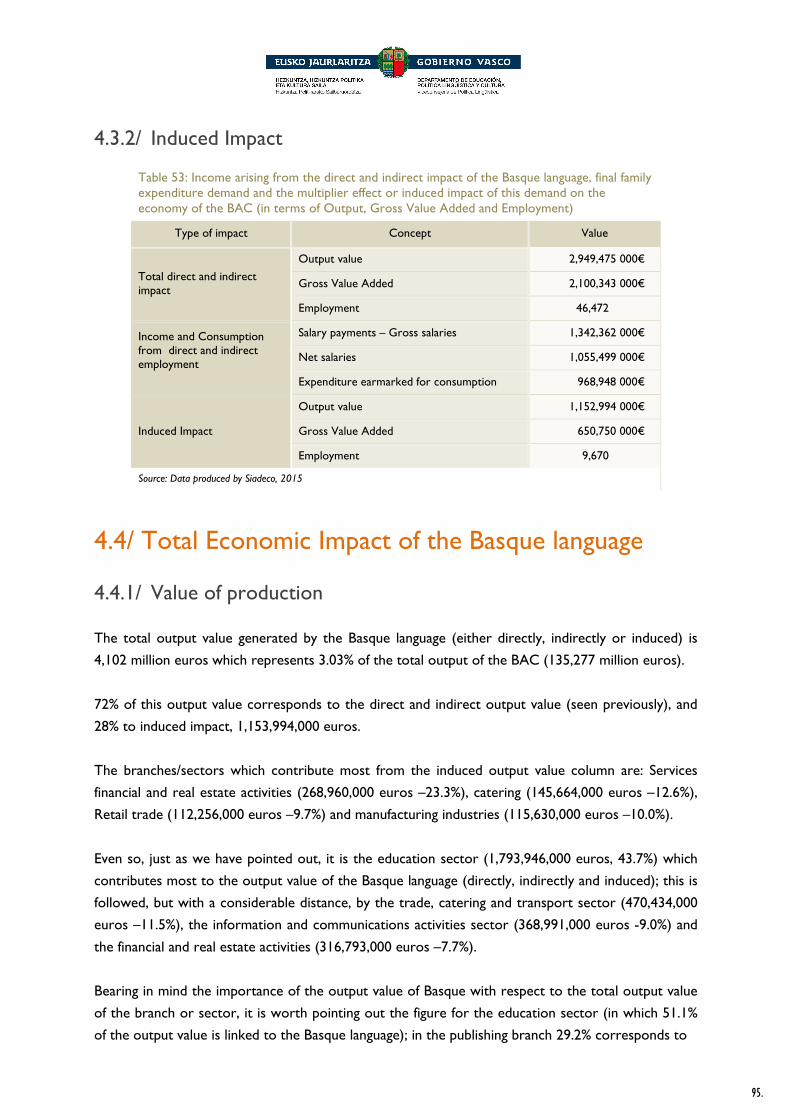
95.
4.3.2/ Induced Impact
Table 53: Income arising from the direct and indirect impact of the Basque language, final family expenditure demand and the multiplier effect or induced impact of this demand on the economy of the BAC (in terms of Output, Gross Value Added and Employment)
Type of impact Concept Value
Total direct and indirect impact
Output value 2,949,475 000€
Gross Value Added 2,100,343 000€
Employment 46,472
Income and Consumption from direct and indirect employment
Salary payments – Gross salaries 1,342,362 000€
Net salaries 1,055,499 000€
Expenditure earmarked for consumption 968,948 000€
Induced Impact
Output value 1,152,994 000€
Gross Value Added 650,750 000€
Employment 9,670
Source: Data produced by Siadeco, 2015
4.4/ Total Economic Impact of the Basque language
4.4.1/ Value of production
The total output value generated by the Basque language (either directly, indirectly or induced) is
4,102 million euros which represents 3.03% of the total output of the BAC (135,277 million euros).
72% of this output value corresponds to the direct and indirect output value (seen previously), and
28% to induced impact, 1,153,994,000 euros.
The branches/sectors which contribute most from the induced output value column are: Services
financial and real estate activities (268,960,000 euros –23.3%), catering (145,664,000 euros –12.6%),
Retail trade (112,256,000 euros –9.7%) and manufacturing industries (115,630,000 euros –10.0%).
Even so, just as we have pointed out, it is the education sector (1,793,946,000 euros, 43.7%) which
contributes most to the output value of the Basque language (directly, indirectly and induced); this is
followed, but with a considerable distance, by the trade, catering and transport sector (470,434,000
euros –11.5%), the information and communications activities sector (368,991,000 euros -9.0%) and
the financial and real estate activities (316,793,000 euros –7.7%).
Bearing in mind the importance of the output value of Basque with respect to the total output value
of the branch or sector, it is worth pointing out the figure for the education sector (in which 51.1%
of the output value is linked to the Basque language); in the publishing branch 29.2% corresponds to

96.
Basque; and the following four branches are between 12-16%: other professional activities, cultural
activities and gambling; association activities and advertising, and market studies.
1.050
4.794240.718
123.713 207.532
1.762.939
156.872
449 1
55.281
37.575 39.223
74.87986.428
47.833 42.464
38.035
5.188
6.193
18.308
9.231 370
115.630
61.016 44.162
390.76141.845
268.960 31.180
41.628
25.819
43.177
79.215
0
200.000
400.000
600.000
800.000
1.000.000
1.200.000
1.400.000
1.600.000
1.800.000
2.000.000
I. A
gric
ultu
re, l
ives
tock
, for
estr
y &
fish
erie
s
II. M
inin
g in
dust
ries
III. M
anuf
actu
ring
indu
stri
es
IV. E
nerg
y, g
as &
wat
er s
uppl
y
V. C
onst
ruct
ion
VI.
Tra
de, c
ater
ing
& t
rans
port
VII.
Info
rmat
ion
and
com
mun
icat
ion
activ
ities
VIII
. Fin
anci
al s
ervi
ces
& r
eal e
stat
e ac
tiviti
es
IX. P
rofe
ssio
nal a
ctiv
ities
X. R
entin
g ac
tiviti
es, t
rave
l age
ncie
s &
aux
iliar
yac
tiviti
es
XI.
Publ
ic A
dmin
istr
atio
n
XII.
Edu
catio
n
XIII
. Hea
lth a
nd s
ocia
l ser
vice
s
XIV
. Cul
tura
l, sp
orts
and
leis
ure
serv
ices
Figure 7. Direct. indirect. induced impact of Basqie language on the economic sectors of the BAC, according to production value (000€)
de la CAE, según valor de producción (000€)
Induced impact
Indirect impact
Direct Impact
Source: data produced by Siadeco, 2015.

97.
Table 54: Output value (thousand euros) generated directly, indirectly or induced by the Basque language, and its IO branch output share (%)
Economic Sector Input-Output
Activity Branches
Output value (thousand euros) Direct and indirect Induced TOTAL
Abs. %
horizontal
Abs. %
horizontal Abs. %
vertical % of BAC
I.- Agriculture, livestock, forestry and fishing 01, 02, 03 449 4.64 9,231 95.36 9,680 0.24 0.93
II.- Mining Industries 04 1 0.33 370 99.67 372 0.01 0.18
III.- Manufacturing Industries
15. Graphic Arts and reproduction 14,190 83.89 2,726 16.11 16,916 0.41 3.35
other I/O branches: between 05 and 42, except 15 42,141 27.18 112,905 72.82 155,045 3.78 0.33
Total sector III 56,331 32.76 115,630 67.24 171,961 4.19 0.36
IV.- Energy, gas and water storage
43,44,45,46 37,575 38.11 61,016 61.89 98,591 2.40 1.25
V.- Construction 47 39,223 47.04 44,162 52.96 83,385 2.03 0.63
VI.- Trade, catering and transport
49. Wholesale Trade 7,523 13.72 47,306 86.28 54,829 1.34 1.09 50. Retail Trade 9,209 7.58 112,256 92.42 121,465 2.96 3.01
58. Catering 31,243 17.66 145,664 82.34 176,907 4.31 3.03 Other I/O branches: between 48-58, except 49,50 and 58 31,698 27.04 85,535 72.96 117,233 2.86 1.49
Total sector VI 79,673 16.94 390,761 83.06 470,434 11.47 2.07
VII.- information and communications activities
59. Publishing 97,728 95.75 4,335 4.25 102,063 2.49 29.22
60. Audio-visual, cinema, radio and TV. 168,263 99.17 1,414 0.83 169,677 4.14 44.45
61. Telecommunications 29,960 50.39 29,494 49.61 59,454 1.45 3.35
62. Information Technology 31,195 82.54 6,601 17.46 37,796 0.92 3.20
Total sector VII 327,146 88.66 41,845 11.34 368,991 8.99 10.00
VIII.- Services financial and activities de real estate
63,64,65 y 66 47,833 15.10 268,960 84.90 316,793 7.72 2.52
IX.- Activities professional
67 legal activ. accounting 43,764 75.16 14,467 24.84 58,231 1.42 2.17 68 architecture and engineering services 3,578 39.72 5,430 60.28 9,009 0.22 0.38
69. Research and development 7,568 100.00 - 0.00 7,568 0.18 1.45 70. Advertising and market studies 58,174 90.95 5,786 9.05 63,960 1.56 12.58
71. Other professional activ. 53,092 90.62 5,497 9.38 58,589 1.43 16.51
Total sector IX 166,177 84.20 31,180 15.80 197,357 4.81 3.07
X.- Renting activities, travel agencies and auxiliary activities
72,73,74 and 75 38,035 47.74 41,628 52.26 79,663 1.94 2.77
XI.- Public Administration 76 207,532
100.00 - 0.00 207,532 5.06 4.08
XII.- Education 77 1,768,127 98.56 25,819 1.44 1,793,946 43.73 51.09
XIII.- health and social services 78 and 79 6,193 12.54 43,177 87.46 49,371 1.20 0.92
XIV.- Cultural, sports and leisure services
80. Cultural activities; gambling 105,091 83.29 21,085 16.71 126,176 3.08 15.47
81. Sports and recreation activ 3,316 23.24 10,949 76.76 14,264 0.35 2.27
82. Association Activities 60,286 86.06 9,762 13.94 70,048 1.71 14.42
Other I/O branches: 83,84 and 85 6,488 14.78 37,419 85.22 43,907 1.07 3.20
Total sector XIV 175,180 68.86 79,215 31.14 254,395 6.20 7.70
TOTAL 2,949,475 71.90 1,152,994 28.10 4,102,469 100.00 3.03
Source: Eustat, 2012; Data produced by Siadeco, 2015.

98.
4.4.2/ Gross Value Added
The total Gross Value Added generated by the Basque language (directly, indirectly or induced) is
2,751,093,000 euros, 4.52% of the total GVA of the BAC (60,875,938,000 euros).
76.4% of total GVA total corresponds the direct and indirect output value (see above), and 23.6% to
the induced impact, some 650,750,000 euros.
The branches/sectors which contribute the most to the induced GVA column are: financial services
and real estate activities (206,672,000 euros – 31.8%), retail trade (75,489,000 euros - %11.6) and
catering (68,249,000 euros – 10.5%).
Even so, as has already been pointed out, it is the education sector (1,514,510,000 euros, 55.1%)
which has contributed most to GVA of the Basque language (directly, indirectly and induced);
followed at a considerable distance by the trade, catering and transport sectors (257,879,000 euros –
9.4%), financial services and real estate activities (244,370,000 euros – 8.9%) and the sector for
information and communication activities (178,785,000 euros – 6.5%).
Bearing in mind the contribution of the GVA of the Basque language to the total GVA of the branch
or sector, the figure for Education should be highlighted (for which 51.3% of the GVA is linked to the
Basque language); in the audio-visual branch the GVA of the Basque language represents 42.7%; in
publishing it is 27.7%; and the following four branches account for 13-15%: other professional
activities, cultural and gambling activities; association activities and advertising and market studies.

99.
Source: data produced by Siadeco, 2015.
457
3.224
113.50667.814 117.762
1.488.332
76.249
227 1
19.829
12.443 11.623
39.762
43.605 37.69723.386
25.240
4.380
4.722
10.085
4.549 154
31.331
19.641 13.086
214.894
21.675 206.67216.956
18.100
21.797
30.859
51.036
0
200.000
400.000
600.000
800.000
1.000.000
1.200.000
1.400.000
1.600.000
I. A
griculture
, liv
esto
ck, fo
restr
y &
fis
heries
II. M
inin
g industr
ies
III. M
anu
factu
ring industr
ies
IV. E
nerg
y, g
as &
wate
r sup
ply
V.
Constr
uction
VI.
Tra
de, cate
ring
& tra
nspo
rt
VII
. In
form
ation &
com
munic
ations a
ctivitie
s
VII
I. F
inancia
l serv
ices &
real esta
teactivitie
s
IX. P
rofe
ssio
nal activitie
s
X.
Renting a
ctivitie
s, tr
avel agen
cie
s &
auxili
ary
activitie
s
XI.
Public
adm
inis
tration
XII
. E
ducation
XII
I. H
ealth &
socia
l serv
ice
s
XIV
. C
ultura
l, s
port
s &
leis
ure
serv
ice
s
Figure 8. Direct, indirect and induced impact of Basque in the economic sectores of the BAC, by Gross Value Added (thousand €)
Induced impact
Indirect impact
Direct impact

100.
Table 55: Gross Value Added (thousand euros) generated by the Basque language directly, indirectly and induced, and their percentage of GVA of the IO branch (%)
Economic Sector
Branches de activity Input-Output
Employment Direct e indirect Induced TOTAL
Abs. % hori-zontal
Abs. % hori-zontal
Abs. % vertical
% of BAC
I.- Agriculture, livestock, forestry and fishing 01, 02, 03 227 4.75 4,549 95.25 4,776 0.17 0.92
II.- Mining Industries 04 1 0.33 154 99.67 154 0.01 0.24
III.- Manufacturing Industries
15. Graphic Arts and reproduction 6,180 83.89 1,187 16.11 7,367 0.27 3.66
Other I/O branches: between 05 and 42, except 15
14,106 31.88 30,144 68.12 44,250 1.61 0.36
Total sector III 20,286 39.30 31,331 60.70 51,617 1.88 0.42
IV.- Energy, gas and water storage
43,44,45,46 12,443 38.78 19,641 61.22 32,084 1.17 1.41
V.- Construction 47 11,623 47.04 13,086 52.96 24,709 0.90 0.58
VI.- Trade, catering and transport
49. Wholesale Trade 4,965 13.72 31,226 86.28 36,191 1.32 1.10 50. Retail Trade 6,193 7.58 75,489 92.42 81,681 2.97 2.96
58. Catering 14,639 17.66 68,249 82.34 82,888 3.01 3.06 Other I/O branches: between 48-58, except 49,50 and 58
17,188 30.09 39,930 69.91 57,119 2.08 1.63
Total sector VI 42,985 16.67 214,894 83.33 257,879 9.37 2.10
VII.- Information and communications activities
59. Publishing 51,457 95.75 2,283 4.25 53,739 1.95 27.70
60. Audio-visual cinema, radio and TV. 73,020 99.17 614 0.83 73,634 2.68 42.74
61. Telecommunications 15,362 50.39 15,124 49.61 30,486 1.11 3.15
62. Information Technology 17,271 82.54 3,655 17.46 20,926 0.76 2.97
Total sector VII 157,111 87.88 21,675 12.12 178,785 6.50 8.76
VIII.- Financial services and real estate activities
63,64,65 and 66 37,697 15.43 206,672 84.57 244,370 8.88 2.49
IX.- Professional Activities
67. Legal activ and accounting 25,371 75.16 8,387 24.84 33,758 1.23 2.17
68. Architecture services and engineering 1,768 39.72 2,683 60.28 4,452 0.16 0.36
69. R&D 6,146 100.00 - 0.00 6,146 0.22 2.01 70. Advertising and market studies 27,112 90.95 2,697 9.05 29,809 1.08 13.09
71. Other professional activ 30,802 90.62 3,189 9.38 33,991 1.24 15.77
Total sector IX 91,200 84.32 16,956 15.68 108,156 3.93 3.04
X.- Renting activities, travel agencies and activities auxiliary
72,73,74 and 75 25,240 58.24 18,100 41.76 43,339 1.58 2.57
XI.- Public Administration 76 117,762 100.00 - 0.00 117,762 4.28 3.85
XII,- Education 77 1,492,712 98.56 21,797 1.44 1,514,510 55.05 51.34
XIII,- Health and social services
78 and 79 4,722 13.27 30,859 86.73 35,582 1.29 0.93
XIV,- Cultural services, sports and leisure
80, Cultural activities; gambling 52,503 83.29 10,534 16.71 63,037 2.29 14.50
81, Sports and recreation Activ 1,835 23.24 6,060 76.76 7,896 0.29 2.13
82, Association activities 27,927 86.06 4,522 13.94 32,449 1.18 13.95
Other I/O branches: 83,84 and 85 4,069 11.97 29,920 88.03 33,989 1.24 3.03
Total sector XIV 86,334 62.85 51,036 37.15 137,370 4.99 6.36
TOTAL 2,100,343 76.35 650,750 23.65 2,751,093 100.00 4.52
Source: Eustat, 2012; Data produced by Siadeco, 2015

101.
4.4.3/ Employment Total employment generated by the Basque language (directly, indirectly and induced) stands at
56,142 jobs, representing 6.28% of the total employment in the BAC (893,952 jobs),
82.8% (46,472 jobs) are generated either directly or indirectly (as seen above), and 17.2% (9,670
jobs) are induced.
The branches/sectors which contribute most to induced employment are: retail trade (2,043 jobs-
21.1%), cultural services, sports and leisure (1,686 jobs – 17.4%) and catering (1,294 jobs – 13.4%),
Nevertheless, once again, it is the education sector (36,422 jobs, 64.9%) which contributes most to
employment linked to the Basque language; following at a considerable distance, but generating more
than 1,000 jobs, are the following branches: retail trade (2,285 jobs), catering (1,571 jobs), public
administration (1,511 jobs), cultural activities and gambling (1,374 jobs), renting activities (1,360 jobs),
audio-visual branch (1,347 jobs) and other cultural, sports and leisure services (1,404 jobs),
Considering the proportion of Employment arising from the Basque language in relation to the total
employment of the branch or sector, the figure for the Education sector stands out (in which 64.9%
of employment is linked to the Basque language); in the audio-visual branch, employment associated
with Basque accounts for 44% of total employment; in publishing 34.1%; 24.8% is contributed by
cultural activities and gambling; 17.1% by other professional activities; 13.9% from advertising and
market studies and 10.6% from association activities

102.
11
162
1.907 1.527 1.511
35.894
1.712
8 0
395
43 185
704
559
133
490
838
88
65
240
169 1
573
80 208
4.443
156
516
320
523
439
558
1.686
0
5.000
10.000
15.000
20.000
25.000
30.000
35.000
40.000
I. A
griculture
, liv
esto
ck, fo
restr
y a
nd
fisheries
II. M
inin
g industr
ies
III. M
anu
factu
ring Ind
ustr
ies
IV. E
nerg
y, g
as a
nd w
ate
r supply
V.
Constr
uction
VI.
Tra
de, ho
tel a
nd c
ate
ring &
tra
nsport
VII
. In
form
ation a
nd c
om
munic
ation
activitie
s
VII
I. F
inancia
l serv
ices a
nd p
ropert
yactivitie
s
IX. P
rofe
ssio
nal activitie
s
X.
Renta
l activitie
s,
travel agencie
s a
nd
auxili
ary
activitie
s
XI.
Public
Adm
inis
tratio
n
XII
. E
ducation
XII
I. H
ealth a
nd s
ocia
l serv
icie
s
XIV
. C
ultura
l, s
port
s a
nd leis
ure
serv
ices
Figure 9. Direct, indirect and induced impact of Basqueon the econommic sectors of the BAC, according to employment (number of
persons)
Induced Impact
Indirect Impact
Direct Impact
Source: data produced by Siadeco, 2015.

103.
Table 56: Employment generated directly, indirectly and induced by the Basque language (jobs), and proportion of employment in the IO branch (%)
Economic Sector
Activity Branches Input-Output
Employment Direct and
indirect Induced TOTAL
Abs, % hori-zontal Abs, % hori-
zontal Abs, % vertical % of BAC
I,- Agriculture, livestock, forestry and fishing 01, 02, 03 8 4.80 169 95.20 177 0.32 1.31
II,- Mining Industries 04 0 0.33 1 99.67 1 0.00 0.20
III,- Industries manufacturing
15. Graphic Arts and reproduction 144 83.92 28 16.08 171 0.30 3.98
Other I/O branches: between 05 and 42, except 15
262 32.47 545 67.53 807 1.44 0.44
Total sector III 406 41.47 573 58.53 978 1.74 0.53
IV,- Energy, gas and water storage
43,44,45,46 43 35.24 80 64.76 123 0.22 1.51
V,- Construction 47 185 47.04 208 52.96 393 0.70 0.60
VI,- Trade, catering and transport
49. Wholesale trade 67 13.72 419 86.28 485 0.86 1.12 50, Retail trade 242 10.61 2,043 89.39 2,285 4.07 3.18
58. Catering 277 17.66 1,294 82.34 1,571 2.80 3.15 Other I/O branches: between 48-58, except 49,50 and 58
279 28.90 687 71.10 967 1.72 1.84
Total sector VI 866 16.31 4,443 83.69 5,308 9.46 2.44
VII,- Information and communications activities
59. Publishing 767 96.45 28 3.55 795 1.42 34.11
60. Audio-visual, cinema, radio and TV, 1,333 99.01 13 0.99 1,347 2.40 40.40
61. Telecommunications 49 50.39 49 49.61 98 0.17 3.51
62, Information Technology 317 82.74 66 17.26 383 0.68 3.16
Total sector VII 2,466 94.04 156 5.96 2,622 4.67 12.76
VIII,- Financial services and real estate activities
63,64,65 and 66 133 20.47 516 79.53 648 1.15 2.59
IX,- Professional activities
67. Legal and accounting 365 72.90 136 27.10 500 0.89 2.14 68. Architecture and engineering 28 39.72 42 60.28 70 0.13 0.41
69. R&D 138 100.00 - 0.00 138 0.25 2.03 70, Advertising and market studies 650 91.76 58 8.24 708 1.26 13.94
71. Other professional activities 837 90.93 83 9.07 920 1.64 17.10
Total sector IX 2,017 86.32 320 13.68 2,337 4.16 4.06
X,- Renting activities, travel agencies and auxiliary activities
72,73,74 and 75 838 61.59 523 38.41 1,360 2.42 2.68
XI,- Public Administration 76 1,511 100.00 - 0.00 1,511 2.69 2.69
XII,- Education 77 35,982 98.79 439 1.21 36,422 64.87 58.13
XIII,- Health and social services
78 and 79 65 10.40 558 89.60 623 1.11 0.93
XIV,- Cultural, sports and leisure services
80. Cultural activities; gambling 1,213 88.33 160 11.67 1,374 2.45 24.77
8. Sports and recreation 35 23.24 115 76.76 150 0.27 2.29
82, Association Activities 575 81.03 135 18.97 709 1.26 10.61
Other I/O branches: 83,84 and 85 129 9.18 1,275 90.82 1,404 2.50 3.12
Total sector XIV 1,952 53.66 1,686 46.34 3,638 6.48 5.69
TOTAL 46,472 82.78 9,670 17.22 56,142 100.00 6.28
Source: Eustat, 2012; Data produced by Siadeco, 2015,

104.
CONTRIBUTIÓN OF THE BASQUE CONTRIBUTIÓN OF THE BASQUE CONTRIBUTIÓN OF THE BASQUE CONTRIBUTIÓN OF THE BASQUE LANGUAGE TO THE GDP OF LANGUAGE TO THE GDP OF LANGUAGE TO THE GDP OF LANGUAGE TO THE GDP OF THE BASQUE ECONOMY THE BASQUE ECONOMY THE BASQUE ECONOMY THE BASQUE ECONOMY
5555....

105.
5,1/ Procedure to calculate the GDP of the Basque language
5,1,1/ Regarding the usefulness of GDP Gross Domestic Product (GDP) is the most common economic statistic used to measure the wealth
of a country and changes in its economy, and it expresses the total amount of economic activity of a
country throughout a year. The calculation, both annual and quarterly of the GDP of the Basque
Autonomous Community is carried out by Eustat. An inter-annual increase in GDP reflects an
upswing in the economy; a fall in GDP on the other hand, depicts an economy in recession. GDP is
also used to compare the situation of different countries, and to obtain economic indicators such as
debt, deficit or the expenditure on R&D.
Bearing in mind that the objective of this study is to measure the contribution of the Basque language
to the Basque economy, the amount of GDP linked to Basque as a proportion of the total GDP of
the BAC provides a measure in monetary terms of the importance of the Basque language to the
economy of the BAC, and enables us to make a comparison with the contribution of other sectors.
Based on the information made available by Eustat, we know the following data regarding the relative
weight of the GDP for various sectors within the total for the BAC:
- Expenditure on R&D&i: 2.1% of GDP (2012) - Expenditure on tourism: 5.8% of GDP (2013) - Expenditure on education: 5.5% of GDP (2011) - Expenditure on health: 8.8% of GDP (2012)
5,1,2/ Procedure used to calculate the GDP of the Basque language
Gross Domestic Product is obtained by adding the net taxes on output to the Gross Value Added. In
order to calculate the amount of net taxes, the difference between the income obtained by public
administrations from taxes on output and subsidies awarded. To calculate net taxes corresponding to
the Basque language, first, the income obtained by Inland Revenue from VAT on the invoicing of
Basque language sectors is estimated; and from this figure the subsidies awarded to promote the
Basque language and Basque culture are subtracted.
VAT generated by the Basque language sectors
To calculate the Gross Value Added of the direct, indirect and induced impact of Basque, we take the
values of each Input-Output activity branch and apply the corresponding rate of VAT for each one
(4%, 10% or 21%), thereby calculating the VAT generated by the Basque language for each IO branch.

106.
According to these calculations, it is estimated that VAT generated by the Basque language sectors
amounts to 157 million euros annually, precisely 156,933 000euros.
Subsidies for the promotion of the Basque language and culture awarded by the BAC
administration
As we have mentioned previously, to estimate the net tax on output generated by Basque, VAT in
the section above, we subtract the subsidies awarded by the BAC administrations to promote
Basque language and culture.
Examination of data from the Public Budget Statistics regarding the Basque language reveal that the
public administrations of the BAC provide 77 million euros in annual subsidies related to the Basque
language (total from the economic chapters IV. and VII. 77,004,829 euros, year 2012). With regard to
Basque culture, the total amount of subsidies has not been used in the calculation, but rather the
amounts resulting from applying the estimated Basque language coefficients for each culture
subsector. The data is from the 2012 Public Finance and Expenditure Statistics for Culture published
by the Basque Culture Observatory. In total, a figure of 30,388,000 euros was calculated for subsidies
earmarked for cultural activities.
Net taxes on output
In total, government subsidies intended for the promotion of the Basque language and those
earmarked for cultural activities Basque language reached a sum of 107 million euros, which was
subtracted from the VAT generated by activities linked to the Basque language (157 million euros),
with the result that the net taxes on output were estimated to be 50 million euros.
GDP of the Basque language
Adding the sum of 49 million euros for net taxes on output to the Gross Value Added of the total
impact (direct, indirect and induced) of the Basque language on the Basque economy, which is 2,751
million euros, the Gross Domestic Product accounted for by the Basque language reaches 2,800
million euros.
5.2/ Importance of Basque Language in the Basque economy
Gross Domestic Product expresses the value of the total economic activity of a country during the
year, and so calculating the proportion represented by the Basque language in the GDP of the BAC
will provide us with the contribution of the Basque language to the Basque economy.

107.
The Gross Domestic Product of the Basque economy has fluctuated, in the last five years, between
66-68 thousand million euros. Data from Eustat for 2012 has been used to calculate the economic
variables of the Basque language, so the figure for GDP for the BAC also corresponds to that year.
The GDP of the BAC in 2012 was 66,775,970,000 euros and the amount corresponding to the
Basque language sectors was 2,800,634,000 euros, so it can be seen that the share of the GDP of the
BAC generated by the Basque language is 4.19%.
With the calculation of the data concerning the relative importance of Basque in relation to the GDP,
the final economic picture regarding the contribution of the Basque language is as follows:
- Employment: 6.28 % of total employment within the Basque economy is generated by Basque language sectors; total employment of the BAC stands at 893,952 and the Basque language sector employs 56,142 people, including direct, indirect and induced employment. From this figure, almost 43,000 jobs are generated directly by activities related to the Basque language, almost 4,000 correspond to indirect impact and a further 10,000 come from the induced impact.
- Gross Value Added: 4.5% of the Gross Value Added of the economy of the BAC is related to economic activities linked to the Basque language. The total GVA of the BAC is almost 61,000 million euros, of which more than 2,751 million euros correspond to Basque language sectors.
- Gross Domestic Product: 4.19% of the Gross Domestic Product of the BAC corresponds to economic sectors which are directly or indirectly linked to the Basque language. The total GDP of the BAC is 66,775,970,000 euros (year 2012) and the figure corresponding to the Basque language is 2,800,634,000 euros.
Considering the aforementioned macroeconomic variables, it can be concluded that the importance
of the Basque language in the economy, both direct and indirect, is significant, and that the Basque
language has considerable value in economic terms. Moreover, with regard to employment and
resources connected to the public administration, it is clear that the economic sectors working in
the Basque language field generate a great number of jobs and produce significant value added to the
economy.
According to Eustat data, the contribution of the Basque language to the GDP of the BAC (4.19%) is
higher than that of R&D&i (2.12%) and just below that registered by the tourism sector (5.8%).

108.
Figure 10: Final results of the economic impact of the Basque language
Source: Eustat, 2012; Data produced by Siadeco, 2015

109.
Table 57: Aggregate figures for the economic value of the Basque language and its impact on the economy of the Basque Autonomous Community
Data for the Basque language Data for the BAC % of BAC
Direct impact
Output value 2,497,618
(thousand euros)
135,277,209 (thousand
euros) 1.85
Gross Value Added 1,867,344
(thousand euros)
60,875,938 (thousand
euros) 3.07
Employment 42,724 893,952 4.78
Indirect impact
Output value 451,857
(thousand euros)
135,277,209 (thousand
euros) 0.33
Gross Value Added 232,999
(thousand euros)
60,875,938 (thousand
euros) 0.38
Employment 3,748 893,952 0.42
Induced impact
Output value 1,152,994
(thousand euros)
135,277,209 (thousand
euros) 0.85
Gross Value Added 650,750
(thousand euros)
60,875,938 (thousand
euros) 1.07
Employment 9,670 893,952 1.08
TOTAL impact
Output value 4,102,469
(thousand euros)
135,277,209 (thousand
euros) 3.03
Gross Value Added 2,751,093
(thousand euros)
60,875,938 (thousand
euros) 4.52
Employment 56,142 893,952 6.28
Net taxes on output
Value Added Tax(VAT)
156,933 (thousand euros)
- -
Subsidies 107,392
(thousand euros) - -
Total 49,541
(thousand euros)
5,900,032 (thousand
euros) 0.84
Gross Domestic Product of the Basque language
2,800,634 (thousand euros)
66,775,970 (thousand euros)
4.19
Source: Eustat, 2012; Data produced by Siadeco, 2015