value at risk (var) - stacresearch.com · • more volatile the portfolio larger the value at risk,...
TRANSCRIPT

Value At Risk (VaR) Aggregation and reporting using Spark SQL
Deeper and quicker insight using a High Definition Data Warehouse
-By Deenar Toraskar-Co-founder
-ThinkReactive

• Solution Architect/Dev Manager/Developer/Market Risk SME at a tier 1 investment bank
• 20 years of JVM experience
• 2011 - Hadoop + Map Reduce
• 2012 - Hive, then Shark
• 2013 - Spark, Scala, Play and Spray
• 2014 - Spark Streaming, Spark as a compute grid, Spark ML
• 2015 - Independent Apache Spark consultant
Me and Spark

Agenda
• VaR reporting and Aggregation on Spark
–What is Value at Risk (VaR) ?
–How do you calculate VaR ?
–Challenges in VaR reporting and aggregation
–Spark SQL solution
• High Definition Data Warehouse + DSL => Empowered Users
• Questions + Demo (time permitting)

What is Value At Risk (VaR)
• Predicted maximum loss (or worst loss) over a target horizon within a given confidence interval.
• $1000 GOOG shares => 1 day Value at Risk at a 95% confidence level is $22. (99% - $31)
• i.e. You would lose less than $22, 95 days out of 100 over one trading day.
• More volatile the portfolio larger the value at risk, VaR(95%, $1000 of TWTR) =

What is VaR used for?
• Widely adopted risk measure since stock market crash of 1987
• Risk Management
• Broker Margin Calculations
• Regulatory Reporting
• Capital Charges
• Pre-Trade Decision

How do you calculate VaR?
• VaR of risk of a single asset viz. $1,000 worth of GOOG shares
• Find price history GOOG going back in time
• Get Prices, convert to 1 day returns and PnL https://uk.finance.yahoo.com/q/hp?s=GOOG
• Sort the PnLs
• Take the 5% worst PnL (PERCENTILE in excel) -2.14% VaR (95%) = -22, VaR (99%) = -36
• Historical Simulation VaR

Daily Returns
Date Closing Price Daily Return4/30/2015 537.34003 -2.138%4/29/2015 549.08002 -0.831%4/28/2015 553.67999 -0.304%4/27/2015 555.37 -1.715%4/24/2015 565.06 3.302%4/23/2015 547 1.416%4/22/2015 539.36499 1.010%4/21/2015 533.96997 -0.263%4/20/2015 535.38 2.162%4/17/2015 524.04999 -1.827%4/16/2015 533.79999 0.238%4/15/2015 532.53003 0.403%4/14/2015 530.39001 -1.628%4/13/2015 539.16998 -0.156%4/10/2015 540.01001 -0.142%
4/9/2015 540.78003 -0.153%4/8/2015 541.60999 0.855%4/7/2015 537.02002 0.048%
Daily Return = (Today’s Price - Yesterday’s Price)/ Yesterday’s Price

Sorted - Worst Daily Losses
Value at Risk (99%), 1% worst return (2nd worst out of 200)
Value at Risk 95% confidence, 5% worst return (10th worst return)
Date Daily Return Loss12/16/2014 -3.583% -$35.83
1/27/2015 -3.098% -$30.9810/10/2014 -2.922% -$29.22
7/31/2014 -2.693% -$26.9310/17/2014 -2.543% -$25.43
3/10/2015 -2.433% -$24.3310/7/2014 -2.357% -$23.57
1/6/2015 -2.318% -$23.1812/5/2014 -2.243% -$22.439/25/2014 -2.199% -$21.994/30/2015 -2.138% -$21.38
1/5/2015 -2.085% -$20.8510/13/2014 -2.072% -$20.72
10/9/2014 -2.030% -$20.303/25/2015 -2.000% -$20.00
12/12/2014 -1.832% -$18.324/17/2015 -1.827% -$18.274/27/2015 -1.715% -$17.151/28/2015 -1.664% -$16.64

VaR
def valueAtRisk(pnls : Seq[Double], confidence: Double): Double = {
val size = pnls.size /* find number of scenarios */
val sortedVector = pnls.sorted /* sort returns */
val indexR = (size * ((100 - confidence) / 100)) - 1 /* percentile */
val upper = math.ceil(indexR).toInt.max(0).min(size - 1)
val lower = math.floor(indexR).toInt.max(0).min(size - 1)
if (lower == upper)
sortedVector.apply(upper)
else ((upper - indexR) * sortedVector(lower)) + ((indexR - lower) * sortedVector(upper)) /* interpolate if percentile between scenarios */
}

Varied VaR reporting requirements
• VaR by counterparty - for margining
• VaR by trader - Trader P&L
• VaR by Desk - Desk head
• VaR by Legal Entity - Finance/Regulator
• ….
• What days drove VaR?

Value At Risk (VaR) of a portfolio
• VaR is not simply additive• VAR of a portfolio containing assets A and B does not
equal the sum of VAR of asset A and VAR of asset B.
VaR ($500 GOOG + $500 BERK) <>
VaR($500 GOOG) + VaR($500 BERK)

Value At Risk (VaR) of a portfolio
• Add individual position PnLs for each day to get daily portfolio PnL
• Then sort portfolio PnLs
• Take percentile to calculate Portfolio VaR

Portfolio Returns
Date GOOG GOOG Return BERK BERK Return Portfolio PnL Total Return
4/30/2015 537.34003 -2.138% 141.21001 -0.843% -$14.90 -1.49%
4/29/2015 549.08002 -0.831% 142.41 -0.077% -$4.54 -0.45%
4/28/2015 553.67999 -0.304% 142.52 1.014% $3.55 0.35%
4/27/2015 555.37 -1.715% 141.09 -0.704% -$12.09 -1.21%
4/24/2015 565.06 3.302% 142.09 -0.239% $15.31 1.53%
4/23/2015 547 1.416% 142.42999 0.310% $8.63 0.86%
4/22/2015 539.36499 1.010% 141.99001 0.602% $8.06 0.81%
4/21/2015 533.96997 -0.263% 141.14 -0.669% -$4.66 -0.47%
4/20/2015 535.38 2.162% 142.09 0.988% $15.75 1.57%
4/17/2015 524.04999 -1.827% 140.7 -0.985% -$14.06 -1.41%
Portfolio PnL = Asset A PnL + Asset B PnL

Sorted - Worst Daily Returns
Value at Risk (99%), 1% worst return
Value at Risk 95% confidence, 5% worst return
Date Return Loss
7/31/2014 -2.251% -$22.51
1/27/2015 -2.234% -$22.34
3/10/2015 -2.222% -$22.22
12/12/2014 -2.138% -$21.38
9/25/2014 -2.121% -$21.21
12/16/2014 -2.079% -$20.79
10/7/2014 -2.055% -$20.55
10/9/2014 -2.033% -$20.33
1/28/2015 -1.804% -$18.04
1/5/2015 -1.770% -$17.70
10/10/2014 -1.581% -$15.81
4/30/2015 -1.490% -$14.90
4/17/2015 -1.406% -$14.06
7/17/2014 -1.387% -$13.87

SQL aggregation does not work
CREATE TABLE positionsVaR (book INT, trader String, clientAccount String, product String riskFactor String, riskType String, var Double)
Select book, sum(VaR) from positionsVaR group by book
(** does not work **)
● Pre- aggregate all VaR values by certain dimensions
● In turn users lose the flexibility to analyse risk metrics in detail. Dependent on IT or batch jobs for further analysis.

Traditional Data Warehouses
• Shallow reporting schema, limited analytical capabilities
• Support standard slice and dice and aggregation functions used for reporting
• No support for non-linear or semi structured data, such as vectors or json objects
• Pre-aggregation of data used for performance and presenting analytics results from engines
• New analytics/aggregation level require new views and changes

Spark SQL solution
VaR Aggregation and Reporting

VaR Aggregation with Spark SQL
1) CREATE TABLE positions
(book INT, trader String, clientAccount String, product String riskFactor String, riskType String, nominal Double, pnls Array<Double>)
1) sqlContext.udf.register("valueAtRisk", valueAtRisk _ )sqlContext.sql("create temporary function arraySum as 'com.thinkreactive.udf.GenericUDAFArraySum';")
1) select book, valueAtRisk(arraySum(pnls), 95.0) as VaR from positions group by book
High definition view of data + DSL

Portfolio VaR - Spark SQL
/* VaR by client */
$ select clientAccount, valueAtRisk(arraySum(pnls), 99.0) from positions group by clientAccount"
/* What If I sell GOOG */
$ select clientAccount, valueAtRisk(arraySum(pnls), 99.0) from positions where riskFactor <> ‘GOOG’ group by clientAccount
/* Change confidence level */$select clientAccount, valueAtRisk(arraySum(pnls), 95.0) from positions group by clientAccount

Turbo Charged/Enriched Reporting Layer
•Enrich your data warehouse by storing a higher definition view of your data using complex type support and provide a DSL using User defined functions
•pnl Array<Double> + valueAtRisk(..)
•Entire risk profile of positions in the data model allows users to ask any questions using the reporting layer

• SQL - lingua franca of data analysis• Custom UDFs• Hundreds of standard Hive and community
contributed UDFs, from likes of Facebook, Brickhouse, etc.
• Building blocks, Chain functions • UDFs in Spark - concise, easily testable• Write once - use everywhere - Streaming, batch
jobs, REST services, adhoc queries (explore use cases), Machine Learning
SQL + UDFs = DSL

Take Away
• Hive Complex Types - Maps, Arrays and Struts to represent your model
• Dont ETL, write custom Data Source/Serde
• Power of SQL and all other Hadoop tools are at your finger tips
• Use standard visualisation tools - Tableau, ZoomDate, Qlik, Microstrategy, any JDBC/ODBC compliant tool
• Empowered users – leaving engineering team to work on more things

VaR Aggregation DSL
• Changes driven by BCBS - FRTB (aka Basel 4)• VaR -> Expected Shortfall• Scaled Expected Shortfall (Liquidity factor)• Desk level treatment
• Change time horizon (10 day VaR)
• Change confidence level
• Complete Transparency - find VaR drivers
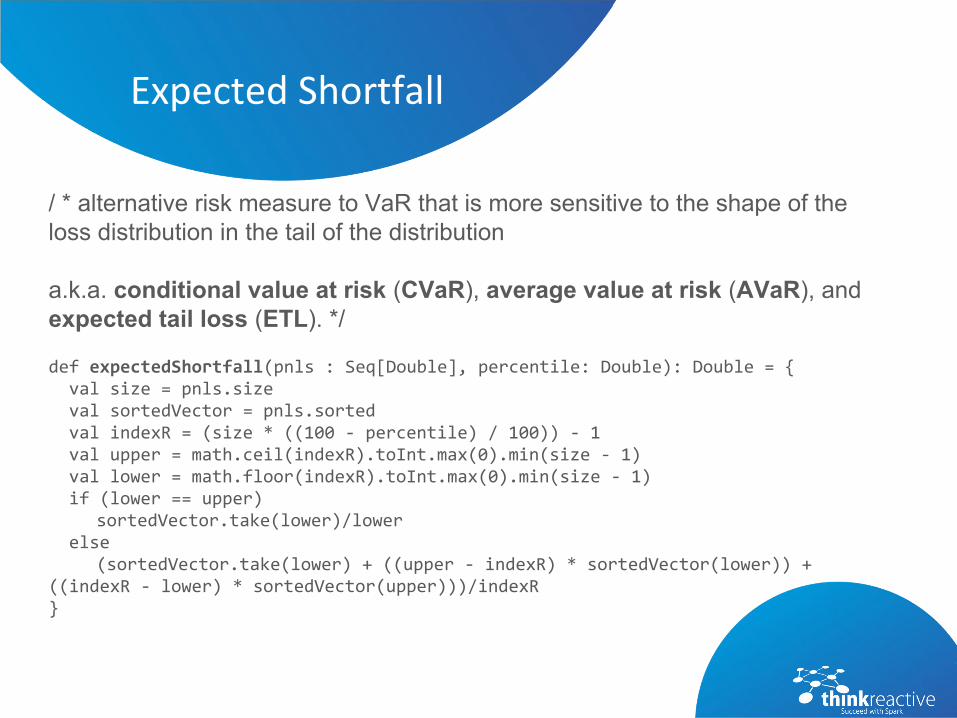
Expected Shortfall
/ * alternative risk measure to VaR that is more sensitive to the shape of the loss distribution in the tail of the distribution
a.k.a. conditional value at risk (CVaR), average value at risk (AVaR), and expected tail loss (ETL). */
def expectedShortfall(pnls : Seq[Double], percentile: Double): Double = { val size = pnls.size val sortedVector = pnls.sorted val indexR = (size * ((100 - percentile) / 100)) - 1 val upper = math.ceil(indexR).toInt.max(0).min(size - 1) val lower = math.floor(indexR).toInt.max(0).min(size - 1) if (lower == upper)
sortedVector.take(lower)/lower else
(sortedVector.take(lower) + ((upper - indexR) * sortedVector(lower)) + ((indexR - lower) * sortedVector(upper)))/indexR}

Polygot Persistence
● Positions from HDFS
● TimeSeries from Cassandra
● Hierarchy, Liquidity horizons and other reference data from RDBMS

Polygot Persistence
val url = "jdbc:oracle:thin:@data.thinkreactive.co.uk:1922:DATA"
val jdbcDF = sqlContext.load("jdbc", Map( "url" -> url, "dbtable" -> "Hierarchy"))
jdbcDF.registerTempTable("hierarchy")
/* VaR by business hierarchy */select businessArea, desk, trader. valueAtRisk(pnls, 95.0) from positions left outer join hierarchy on (positions.bookId= hiearchy.bookId) group by businessArea, desk, trader

Thank You
• Obligatory Plug• Solutions Architect• FRTB QIS reporting solution• Contact• Questions