value-based marketing & pricing
TRANSCRIPT

Customer Value, Inc. 217 Lewis Wharf, Boston, MA 02110, USA (617) 227-8191Web site: cval.com email: [email protected]
© Customer Value, Inc. 2006
Value-Based Marketing & PricingBradley T. Gale and Donald J. Swire
(November 2006)
Customer Value, Inc.Competitive Marketing Strategy

1
Value-Based Marketing & Pricing
Bradley T. Gale and Donald J. Swire(October 2006)
Today, many companies are shifting from cost-based pricing to customer-perceived valueanalysis and value-based pricing. The benefits of this shift include developing a betterunderstanding of:
What factors differentiate your product from the competition How much those differences are really worth to the customer How much of a price premium (if any) you should be able sustain over the competitors What improvements to your product would add the most value from the customers’
perspective How you should position and promote your product to stress your comparative
advantages
Value-Based Marketing and Pricing describes the tools that Customer Value, Inc. uses to helpcompanies achieve a comprehensive, consistent approach for appraising their customer-perceived value versus rival brands and executing value-based pricing.
Contents
1. Approaches to Customer Value Measurement -- provides an overview of somepopular approaches to the problem of valuation and shows how they can be extended andcombined
2. Customer Value Accounting for Value-Based Pricing -- Combining Cost-In-UseEstimates and Attribute Performance Scores -- presents a case example of how tocombine cost-in-use analysis and attribute performance scores and set a fair price
3. Building a Value-Based Marketing Strategy System -- explains how to use theMarketing War Room™ software toolkit to create a physical war room setting forsupporting deliberations regarding product-line and multi-product, division strategy.

2
Section 1
Approaches to Customer Value Measurement
All customers want good products and no customers want to overpay. Regardless of the productcategory, it is the customers’ perception of value that will determine which vendor gets theirbusiness. For this reason, it is important for companies who make and price products tounderstand how much their products are worth.
A product’s worth depends on how it stacks up against competing products. If it is a better-than-average product, it is worth more than average. Such products could be sold for a premium price.On the other hand, customers will often tolerate reduced performance if they can get the productat an economy price. Customer value measurement and accounting is a structured approach forcomparing a product or service against the competition to understand its comparative strengthsand weaknesses, assess its worth, and provide a rational basis for setting its price.
Traditionally, the primary approaches for analyzing differences in the worth (or value) ofcompeting products to potential buyers in a product-market category were:
Importance-Performance Analysis Engineering Economics Conjoint (tradeoff) Analysis
Customer value accounting, developed at Customer Value, Inc., combines and extends aspects ofthese traditional approaches to provide a comprehensive system for measuring the differences inworth/value among competing products. Here we outline the key features of the componentapproaches. In Section 2, we provide a case illustration that combines a monetized importance-performance analysis with a cost-in-use, engineering economics analysis.
Importance-Performance Analysis
Importance-performance analysis is a technique frequently used in business on both the sellingside and the buying side of a purchase. The technique uses a “scorecard” (CVI refers to this as a“market profile”) for comparing different products. Listed across the top of this table are thedifferent competing products in the category. The rows show different “attributes” (also called“key buying factors”), aspects of the product or service (e.g. “Power” or “Appearance”) that areimportant to the customer. In this grid, each product is given a “score” showing that product’sperformance on each attribute. Because some attributes are more important than others to thecustomer, each attribute is also given an “importance weight”, a measure of its relativeimportance. Hence the name: “Importance-Performance Analysis”.
For marketing applications, the data supporting importance-performance analysis often comesfrom market research surveys. These studies provide customer-perceived performance scores fora predefined set of attributes for each product/brand competing in a market category. They also

3
provide data on the relative influence weights for each attribute. Such studies are similar to“customer-satisfaction” surveys in that they collect customers’ perceptions of performance,typically on, say, a 1-to-10 scale. However, to support customer-value accounting, surveys mustsample the customers of all of the key vendors in the market category, not just the customers of asingle vendor.
Traditional market perception studies provide insights into differences in the value delivered tocustomers by each brand. But, typically these studies do not provide estimates of the worthdifferences in financial, or monetary, terms. “Dollarizing” these data is one of the key extensionsto the traditional analyses provided by CVI.
Monetized Importance-Performance Analysis
At CVI we use a hybrid approach to combine (a) monetary price data from competitiveintelligence with (b) 1-to-10 performance data and data on importance weights from marketperception studies. We call this hybrid approach a monetized importance-performance analysis.The currency can be $ US, Euros, etc. A monetized importance-performance analysis providesestimates of the worth (or value) of the differences in performance scores among competingproducts, by attribute. Section 2 provides an example of how such analyses work. An interestingfeature of this approach is that it enables us to monetize the worth differences associated withperformance differences on not only the functional dimensions of customer value analysis, likeproduct attributes and service attributes, but also the dimensions that yield differences inpsychological benefits, like relationship attributes and brand affinity attributes.1
Engineering Economics
Some products are more expensive than others to purchase. However, costs don’t stop with thepurchase; some products may be more expensive to own or operate than others. Engineeringeconomics focuses on quantifying the costs of owning and using one product versus otherproducts. Other terms used for this kind of analysis are “value engineering”, “cost-in-useanalysis”, and “economic value analysis.”
People using an engineering economics approach typically focus on quantifying those costs thatmight be affected by choosing one product over another. The approach is useful when studyingoperations or logistics costs. The approach is more difficult to apply when trying to quantify theworth of performance attributes not usually discussed in purely monetary terms (for example,safety in use or aesthetics). Economic value analysis is useful when assessing a new technologyversus an established technology, especially when the focus is on doing the job cheaper ratherthan better.
Using new software tools (see below), practitioners can now produce a hybrid analysis thatcombines (a) cost-in-use data from an engineering economics study with (b) the purchase pricedata and a monetized importance-performance analysis. The hybrid analysis covers the cost
4
savings, the worth of functional benefits, and the worth of psychological benefits of each productversus any other product in the market category.
Conjoint (tradeoff) Analysis
Conjoint analysis is a form of market research typically applied to the design of new products.The focus is on understanding how much value possible features or performance improvementsmight add to the worth of the product. Practitioners use conjoint analysis to select which featuresto include in the product and to choose enhanced performance levels that seem to add the mostvalue relative to the cost of improving performance.
By itself, conjoint analysis does not assess the performance differences and associated worthdifferences of products actually competing in a market category. The choices offered torespondents in a conjoint survey are typically a hypothetical construct of what various offerscould be.
On rare occasions, a company may carry out both a market perception study and a tightlycoupled conjoint study. In such cases, if a monetary selling price variable is included in theconjoint study, the conjoint data can be used to estimate the increased price that people aretypically willing to pay for better composite overall performance. This information can be usedto calibrate the trade off of higher prices paid for better performance that we use in a monetizedimportance-performance analysis based on market perception data.
Customer Value Accounting integrates the pieces
As noted above, customer value accounting is a comprehensive system of analysis that integrateswhatever data is available from
Importance-performance analysis based on market perception studies Price data from competitive intelligence Engineering Economics studies Conjoint Analyses that are tightly couple to market perception studies
In the next section, we show an example of customer-value accounting in action.
5
Section 2
Customer Value Accounting for Value-Based PricingCombining Cost-In-Use Estimates and Attribute Performance Scores
As we have seen, two widely used approaches to measuring the differences in worth amongcompeting products are engineering economics (cost-in-use analysis) and importance-performance analysis. Customer value accounting, developed at Customer Value, Inc., combinesand extends aspects of these traditional approaches to provide a comprehensive system formeasuring the differences in worth/value among competing products. In this section we usecustomer value accounting to illustrate how to integrate data on cost-in-use with data onimportance, performance, and equipment price for room air cleaning equipment.
Comparing Products In Terms of Cost-In-Use
Let’s start with the analysis of cost-in-use differences. To illustrate the process, we use anevaluation of room air cleaners published by Consumer Reports. The article provided a cost-in-use analysis for energy and filter costs for each of the sixteen air cleaner models evaluated.Consumer Reports measured the number of kilowatts of electricity used by each model,estimated annual kilowatt-hour consumption, and monetized the differences in energyconsumption using the average cost per kilowatt-hour in the US. Filter costs were calculated in asimilar fashion – Consumer Reports engineers calculated the estimated number of filters used bya model in a year times the cost per filter. Knowing the cost per kilowatt-hour and cost for eachvendor’s filters made it easy to convert energy and filter usage into annual energy and filter costsfor each of the sixteen room air cleaner models evaluated.
Differing costs in using the product make some air cleaner models more valuable than others. Ifenergy usage is the sole difference between two air cleaners, the model that uses less energy willbe worth more to consumers. Cost-in-use analysis helps to quantify how much more. Forexample, based on the sixteen models evaluated, the price of the average air cleaner is $209.Relative to the average air cleaner, the best performing Frederich model saves $3 in energy and$71 in filter usage over a two-year period. Based on these cost-in-use differences, the Frederichmodel is worth $283 -- $74 more than the average model.
Comparing Products on the Basis of Performance Differences
The different brands of air cleaners differ in terms of the cost of owning and operating. That factmakes certain brands worth more than others. However, there are typically other differences thatcustomers should consider when making a purchase. Generally we refer to these as performancedifferences. Quantifying the worth differences associated with different levels of performance onbenefit attributes, like removes dust and removes smoke in the air cleaner case, is much moredifficult. In the following sections we will outline customer value accounting, a technique for

6
inferring the differences in incremental value associated with a product’s performancedifferences on benefit attributes relative to competing products.
It is usually difficult to calculate directly the monetary value of all performance differencesamong products. However, using the right tools, you can infer the worth of your comparativeadvantages and disadvantages. Customer value accounting consists of three basic steps. First wehave to define what we mean by overall performance. Then we measure the performance of ourproducts and the competing products. Finally, we compare the overall performance of theproducts in the market with the prices they command. This gives us a sense of the pricepremiums that are justified by superior performance.
How should overall product performance be measured? The standard approach, used by marketresearch firms, Consumer Reports Magazine, and most marketing departments, is to break downperformance into a list of what are commonly referred to as “key buying factors.” These are theproduct and service attributes that customers look at in determining which brand to purchase.Once these factors are identified, each vendor’s products can be given a “score” reflectingperformance on each attribute. These scores are the basis for assessing overall performance.Overall performance is thus a composite, weighted average, of the performance scores on theindividual key buying factors.
It is important to note that the attribute list should include all of the key factors that are importantto the customer. Generally, these will include product features, quality, and service. Theattribute list may also include aspects of the relationships that exist between buyer and seller,and, occasionally, factors that reflect customers’ affinity for certain brands apart from thebrands’ product and service characteristics.
The customer value accounting process starts with a simple table that shows the differentperformance levels of competing products. Here is the abbreviated market profile for room aircleaners. It shows the performance scores of six of the sixteen room air cleaner models on fourperformance attributes on a 1 to 10 point scale. The complete market profile spreadsheet wouldshow scores for the other ten brands where the white band is located in the middle of this exhibit.
In addition to estimating the cost-in-use data for energy and filter usage described above,Consumer Reports evaluators measured how well each room air cleaner removed dust andsmoke. These are efficacy attributes. The evaluation also covered noise (a side effect) and easeof use. To set the stage for calculating a weighted overall performance level, we havetransformed the underlying performance metrics, like particles of dust per measure of volume ordecibels of noise, onto a comparable, 1 to 10, scale.
In addition to performance scores, the market profile shows the relative weight or influence ofeach benefit attribute. We use these weights to reflect the leverage that each attribute has in thevendor selection process. Weighted performance scores measure how models stack up on overallperformance. This is the primary measure of performance that we use in evaluating the worth ofa product.

7
Next we describe how to monetize the added value created by brands that outperformcompetitors on key benefit attributes.
The Customer Value Map and Fair-Value Line
The key tool that product and pricing managers use to assess the worth of their products in themarketplace is the customer value map. Using customer value accounting, we can infer the worthdifferences associated with the efficacy, side effects, and ease-of-use attributes.
First, we produce a customer value map for the room air cleaner models. In this example thevalue map is a plot of total cost versus overall performance on the four benefit attributes. Totalcost is the price of the air cleaner plus electricity and filter costs for the relevant time period.Second, we establish the tradeoff that customers are willing to make by paying more for betterperforming products. Generally, as in the room air cleaner market, the value map will showproducts to be differentiated from each other in both the vertical and the horizontal dimensions.Products plotted in the lower right (high performance, low price) are good deals for customers;products in the upper left (high price, low performance) are bad deals.
Looking at this value map, we find that in order to get better than average overall performancecustomers are incurring a higher than average total cost. In this category, the slope of the fair-value line is $115 per benefit point on a scale of 1 to 10.2
Performance ProfilesAir Cleaners -- CR Feb. 02
Market Profile Attrib. ValueAir Cleaners -- CR Feb. 02 Performance Scores WeightWeight
Dimension Attributes Frie
dric
h
Whi
rlpo
ol
Bio
nair
e
Hol
-625
HW
-170
00
Shar
per
Imag
e
Ave
rage
Benefits Dust 9.0 8.0 7.0 3.0 3.0 2.0 8.8 40.0Smoke 7.0 7.0 6.0 3.0 3.0 2.0 7.2 30.0Noise 6.0 6.0 4.0 7.0 6.0 10.0 8.3 20.0Ease of use 6.0 6.0 6.0 6.0 8.0 6.0 6.7 10.0
Weighted benefit scores 7.5 7.1 6.0 4.1 4.1 4.0 8.0
Costs Price Equipment Price 475 250 220 120 130 350 245 100.0In-use 2 year Energy 110 126 124 48 106 8 83 100.0In-use 2 year Filter 144 260 264 120 250 0 150 100.0
Weighted cost scores 729 636 608 288 486 358 478
Slope of fair value line 115

8
Based on the slope of the fair-value line and the fraction of weight associated with each attribute,we calculate the worth differentials associated with performance differences on a 1 to 10 scale.These monetization coefficients, worth per point data, are shown in the product appraisal tablebelow. Like the cost per kilowatt-hour information, the worth per point data enable you toestimate the worth differences associated with the performance differences on benefit attributesin monetary terms.
At this point we have assembled all of the pieces we need to do a product appraisal. We have theperformance scores showing how our product stacks up against the competition on the keybuying factors. We’ve used data on the relative importance of these factors to construct aweighted average overall performance index for our business and the other players. We’ve usedthe value map to calibrate the degree to which customers will pay a premium for better overallperformance. This information all feeds into the appraisal process.
The appraisal process evaluates a product by comparing it against a reference product. Usually(but not always), we use the “average product” as the reference. We start with the average priceof products in the market. Then, attribute-by attribute, we compare our product’s benefit scoresto the average scores. For each comparison, we estimate the differential worth of our product.These increments are then added onto the starting reference price to arrive at an appraisal.
In equation form, the appraisal logic can be expressed as
Value Map for Air Cleaners -- CR Feb. 02
Sharper Image
HW-17000
Hol-625
HW-18150
Panasonic
Ken-83353
Hun-170
Hol-650
HW-17400
Ken-83259Hun-30375
HW 13520
Hol-675
Bionaire
Whirlpool
Friedrich
250
350
450
550
650
750
3.5 4.0 4.5 5.0 5.5 6.0 6.5 7.0 7.5 8.0
Performance Index
Total Cost ($)
Fair-value line passes through average price and average benefit. Slope = $115 per benefit point.
HighPrice
LowPrice
Worse Better
Fair-value line
9
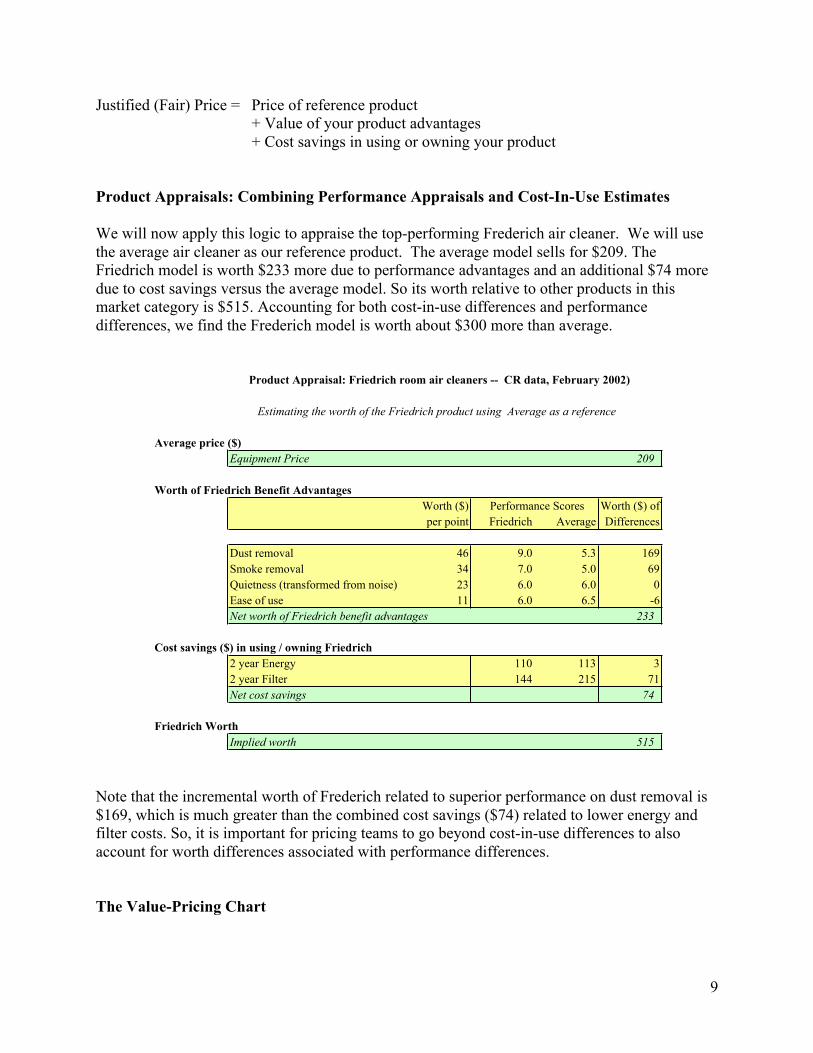
Justified (Fair) Price = Price of reference product+ Value of your product advantages+ Cost savings in using or owning your product
Product Appraisals: Combining Performance Appraisals and Cost-In-Use Estimates
We will now apply this logic to appraise the top-performing Frederich air cleaner. We will usethe average air cleaner as our reference product. The average model sells for $209. TheFriedrich model is worth $233 more due to performance advantages and an additional $74 moredue to cost savings versus the average model. So its worth relative to other products in thismarket category is $515. Accounting for both cost-in-use differences and performancedifferences, we find the Frederich model is worth about $300 more than average.
Note that the incremental worth of Frederich related to superior performance on dust removal is$169, which is much greater than the combined cost savings ($74) related to lower energy andfilter costs. So, it is important for pricing teams to go beyond cost-in-use differences to alsoaccount for worth differences associated with performance differences.
The Value-Pricing Chart
Product Appraisal: Friedrich room air cleaners -- CR data, February 2002)
Estimating the worth of the Friedrich product using Average as a reference
Average price ($)Equipment Price 209
Worth of Friedrich Benefit AdvantagesWorth ($) Performance Scores Worth ($) ofper point Friedrich Average Differences
Dust removal 46 9.0 5.3 169Smoke removal 34 7.0 5.0 69Quietness (transformed from noise) 23 6.0 6.0 0Ease of use 11 6.0 6.5 -6Net worth of Friedrich benefit advantages 233
Cost savings ($) in using / owning Friedrich2 year Energy 110 113 32 year Filter 144 215 71Net cost savings 74
Friedrich WorthImplied worth 515

10
Pricing teams use the data in the product appraisal to produce a value-pricing chart. The value-pricing chart summarizes the worth differences between your product and a reference productand sets the stage for pricing your product based on its worth in the marketplace, as well as basedon your costs. As noted earlier, the reference product is often the average or all products, butcould be a key customer’s current product, a product close to your product in overallperformance, or any other product you are competing against. The left side of the value-pricingchart plots the results of customer value accounting. The right side of the chart focuses on value-based pricing.
We show the appraisal calculations numerically in the Product Appraisal table and graphically inthe Value-Pricing Chart. Knowing the worth of your product and the cost of your productestablishes a framework for pricing your product. Hopefully you find that the worth of yourproduct is greater than its cost. If you price your product above what it is worth, you will havedifficulty attracting customers. If you price your product below its cost, you lose money.
Setting your price determines the split of worth minus cost to the customer and to your business.We refer to worth minus price as customer surplus. If a product is worth more than you chargefor it, customer surplus is positive. A Frederich air cleaner is worth $515; the price is only $475.Therefore the customer surplus is $40. We often measure customer surplus in percentage terms,relative to the worth of the product. When expressed as a percentage of its worth, Frederich’customer surplus is 7.8 percent. Customer surplus is a measure of the goodness-of-the-deal thatcustomers get from an offer.3 The percentage measure of customer surplus is comparable across
Value-Pricing Chart
Average Price
Price
Unit Production Cost
Better benefits
In-use savings
Worth
Margin
Surplus
0
100
200
300
400
500
600
Estimating the worth of Friedrich using Average as a reference
$
Customer valueaccounting
Value-basedpricing

11
products that sell at different price levels. Price minus cost per unit is the profit margin for yourbusiness. For illustration purposes, we have assumed that Frederich’s cost per room air cleaner is$375. Using this hypothetical cost, the profit margin would be $100.
Customer Value Accounting
Customer value accounting is closely related to, but more comprehensive than economic valueanalyses focused on cost savings to the customer. Pricing specialists using economic valuemodeling typically compare a new (subject) product versus an existing (reference) product. Theynote the tangible and perhaps the emotional differences in benefits between offers. They attemptto estimate the monetary differences in worth for the tangible attributes. They find it easy tomonetize some of the tangible attributes that relate to costs, like energy usage. They can usemiles per gallon data, a typical number of miles driven per year, and the cost per gallon toestimate differences in fuel costs. But they have no monetary conversion factor like $3 per gallonof gas that they can use to monetize differences in ride comfort, seating comfort, acceleration,emergency handling, and braking. Yet these attributes are important whether one is analyzingminivans sold to consumers or heavy-duty trucks sold to industrial customers.
Note that modeling a market and each vendor versus every other vendor, including the categoryaverage, is a more comprehensive approach than just modeling two of the vendors in a category,a subject and a reference vendor. By modeling a market category, we can also produce a head tohead value appraisal and a value-pricing chart for any subject vendor’s offer versus any vendorin the category.
Pricing teams use these tools4 -- the customer value map, product appraisal, and value-pricingchart -- to help resolve classic pricing issues:
Pricing a new, premium-performance product Pricing a new, low-cost, lesser performing product Repositioning a product that is currently positioned deep into the negative customer
surplus zone, with a price that far exceeds it worth Identifying and re-pricing products that are offering a large customer surplus versus the
average vendor – perhaps leaving money on the table
As illustrated in the marketing-war-room collage in Section 3, product positioning and pricingteams display the value-pricing chart, product value appraisal, and the customer value map side-by-side. This enables them to focus on their offer versus a key reference vendor while keeping aclose watch on each of the other vendors’ positions on the value map.

12
Section 3
Building a Value-Based Marketing Strategy System
The products and services that attract customers and retain their loyalty are the ones that deliverbetter overall performance and/or lower prices than their competitors. They win by deliveringbetter customer-perceived value.
To understand and manage the positioning of your products, your management team needs toknow how customers perceive your product’s performance on key benefit attributes and pricerelative to competing offerings. They need competitive positioning data. Yet, most companiesmanage their business units based on financial data, performance versus budget, and bonuses tiedto “meeting the numbers” for revenue growth, profit, or shareholder value. Most companies donot have a competitive positioning information system and a set of marketing strategy tools tohelp manage their product lines with data that reveals their prices and performance versuscompeting products.
In this section we describe what a value-based marketing strategy system is. The ingredientsinclude competitive positioning data covering the key product-market segments that you serveand a software toolkit for developing competitive marketing strategy.
Value-Based Marketing Strategy
The objective of value-based marketing strategy is to sell the right products to the right customersegments at the right price to maximize profits and growth. The underlying philosophy is that ifwe understand customer needs and satisfy them better than the competitors do, our business willbe successful.
What a Value-Based Marketing Strategy System Should Do for You
For each market you serve, you should have a system that can help you:
• Understand your competitive strengths and weaknesses• Identify opportunities to improve your product and service, and set priorities for
improvement based on your customer needs• Set prices that are consistent with your strengths and weaknesses• Sharpen your marketing message to highlight your strengths and correct customers’
misperceptions• Test new product concepts
For companies that serve many markets (e.g. product lines of related products, differentgeographical markets for core products, different key account customers for a product), thesystem should help you

13
• Evaluate your product line coverage• Avoid cannibalizing a high-margin product with a low-margin one• Coordinate product and pricing across different geographical regions.• Develop benchmarks for evaluating product success in one market or key account
customer based on results in other markets or key accounts• Maintain pricing consistency across different regions• Identify cross-market management issues, systemic strengths or weaknesses, that merit
centralized attention
Analyzing a Product-Market Segment
A value-based marketing strategy system applies a core set of marketing strategy tools forcustomer value management of individual product-market segments. These tools include:
• Market Profile – a compact data set that compares your product to the competition fromthe customer perspective
• Value Map – a visual display that looks at competitors in a price-performance space,allowing you to see if you are competitively positioned
• Product Appraisal – a collection of tools for helping you set prices based on what yourproduct is really worth
• Value-Pricing Chart – a graph that shows how much more, or less, your product is worththan a reference product and how setting your price splits the difference between yourproduct’s worth and cost into profit margin for you and customer surplus for buyers
• Value-Selling Tools -- to help you identify how to extract the full value of yourperformance advantages
• Improvement Priorities Tools -- helping you to identify who must do what by when toimprove your competitive position.
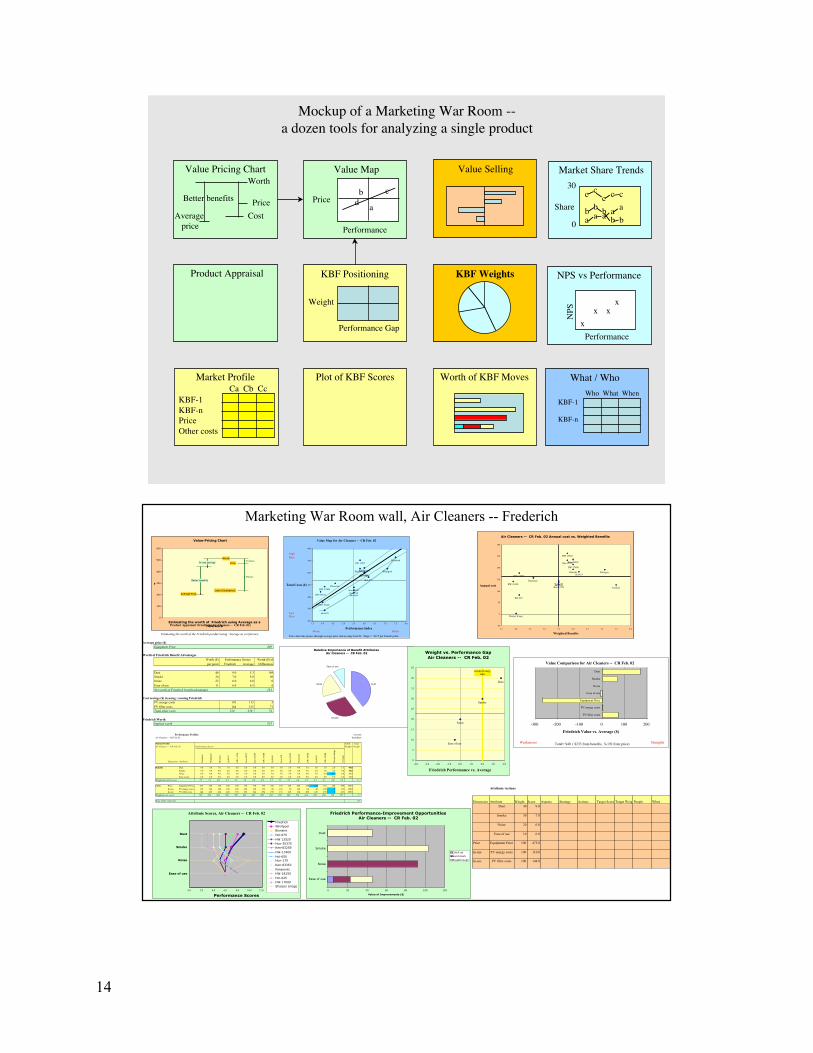
For periodic strategy review meetings, you post these tools on a conference room wall,transforming it into a Marketing War Room. A who-does-what-by-when exhibit summarizes yourproduct line team’s competitive marketing strategy and tracks time lines for executing it.Pictured here is a mock up of a marketing war room for a key product, followed by a collage ofmarketing-war-room exhibits for the Friederich room air cleaner.
14
KBF Weights
Value Map
Price
Performance
Mockup of a Marketing War Room --a dozen tools for analyzing a single product
Market Profile
KBF-1KBF-nPriceOther costs
Ca Cb Cc
Product Appraisal
Value Pricing Chart
Plot of KBF Scores
Value Selling
KBF Positioning
Worth of KBF Moves
Weight
Performance Gap
Average price
Better benefits
Worth
CostPrice
Who What WhenKBF-1
KBF-n
What / Who
Market Share Trends
NPS vs Performance
Performance
NPS
xxx
x
Share
0
30
aaaaa bbbbb
ccccc
a
b cd
Attribute Scores, Air Cleaners -- CR Feb. 02
Ease of use
Noise
Smoke
Dust
0.0 2.0 4.0 6.0 8.0 10.0 12.0
Performance Scores
FriedrichWhirlpoolBionaire
Hol-675
HW 13520Hun-30375Ken-83259
HW-17400
Hol-650Hun-170
Ken-83353
PanasonicHW-18150
Hol-625HW-17000Sharper Image
Relative Importance of Benefit AttributesAir Cleaners -- CR Feb. 02
Dust
Smoke
Noise
Ease of use
Marketing War Room wall, Air Cleaners -- Frederich
Value-Pricing Chart
Average Price
Price
Costs (Illustrative)
Better benefits
In-use savings
Worth
Margin
Surplus
0
100
200
300
400
500
600
Estimating the worth of Friedrich using Average as a reference
$
Value Map for Air Cleaners -- CR Feb. 02
Sharper Image
HW-17000
Hol-625
HW-18150
Panasonic
Ken-83353Hun-170Hol-650
HW-17400
Ken-83259Hun-30375
HW 13520
Hol-675
Bionaire
Whirlpool
Friedrich
200
300
400
500
600
700
800
3.5 4.0 4.5 5.0 5.5 6.0 6.5 7.0 7.5 8.0
Performance Index
Total Costs ($)
Fair-value line passes through average price and average benefit. Slope = $115 per benefit point.
HighPrice
LowPrice
Worse Better
Value Comparison for Air Cleaners -- CR Feb. 02
-300 -200 -100 0 100 200
Dust
Smoke
Noise
Ease of use
Equipment Price
PV energy costs
PV filter costs
Friedrich Value vs. Average ($)
StrengthsWeaknesses Total= $40 ( $233 from benefits, $-192 from price)
Product Appraisal: Friedrich (Air Cleaners -- CR Feb. 02)
Estimating the worth of the Friedrich product using Average as a reference
Average price ($)Equipment Price 209
Worth of Friedrich Benefit AdvantagesWorth ($) Performance Scores Worth ($) ofper point Friedrich Average Differences
Dust 46 9.0 5.3 169Smoke 34 7.0 5.0 69Noise 23 6.0 6.0 0Ease of use 11 6.0 6.5 -6Net worth of Friedrich benefit advantages 233
Cost savings ($) in using / owning FriedrichPV energy costs 110 113 3PV filter costs 144 215 71Total other costs 254 328 74
Friedrich WorthImplied worth 515
Weight vs. Performance GapAir Cleaners -- CR Feb. 02
Ease of use
Noise
Smoke
Dust
Friedrich Avg. Gap
0
5
10
15
20
25
30
35
40
45
-4.0 -3.0 -2.0 -1.0 0.0 1.0 2.0 3.0 4.0
Friedrich Performance vs. Average
Performance Profiles 10/26/02Air Cleaners -- CR Feb. 02 Sue&Brad
Market Profile Attrib. ValueAir Cleaners -- CR Feb. 02 Performance Scores Weight Weight
Dimension Attributes Frie
dric
h
Whi
rlpo
ol
Bio
nair
e
Hol
-675
HW
135
20
Hun
-303
75
Ken
-832
59
HW
-174
00
Hol
-650
Hun
-170
Ken
-833
53
Pana
soni
c
HW
-181
50
Hol
-625
HW
-170
00
Shar
per
Imag
e
Ave
rage
Benefits Dust 9.0 8.0 7.0 7.0 6.0 6.0 6.0 6.0 5.0 5.0 5.0 4.0 3.0 3.0 3.0 2.0 5.3 40.0Smoke 7.0 7.0 6.0 6.0 6.0 6.0 6.0 6.0 5.0 5.0 5.0 4.0 3.0 3.0 3.0 2.0 5.0 30.0Noise 6.0 6.0 4.0 5.0 5.0 5.0 5.0 5.0 7.0 7.0 7.0 5.0 6.0 7.0 6.0 10.0 6.0 20.0
Ease of use 6.0 6.0 6.0 6.0 6.0 6.0 8.0 8.0 6.0 6.0 6.0 8.0 6.0 6.0 8.0 6.0 6.5 10.0
Weighted benefit scores 7.5 7.1 6.0 6.2 5.8 5.8 6.0 6.0 5.5 5.5 5.5 4.6 3.9 4.1 4.1 4.0 5.5 99.1
Costs Price Equipment Price 475 250 220 200 180 170 170 170 160 170 220 200 160 120 130 350 209 100.0
In-use PV energy costs 110 126 124 126 188 210 130 136 88 112 50 160 84 48 106 8 113 100.0In-use PV filter costs 144 260 264 240 338 256 342 294 190 176 210 154 200 120 250 0 215 100.0
Weighted cost scores 729 636 608 566 706 636 642 600 438 458 480 514 444 288 486 358 537 -0.9
Slope of fair value line 115
Friedrich Performance-Improvement OpportunitiesAir Cleaners -- CR Feb. 02
0 20 40 60 80 100 120
Dust
Smoke
Noise
Ease of use
Value of Improvements ($)
Catch up
Benchmark
Breakthrough
Air Cleaners -- CR Feb. 02 Annual cost vs. Weighted Benefits
Sharper Image
HW-17000
Hol-625
HW-18150
Panasonic
Ken-83353Hun-170Hol-650
HW-17400
Ken-83259Hun-30375
HW 13520
Hol-675Bionaire Whirlpool
Friedrich
-50
0
50
100
150
200
250
300
3.5 4.0 4.5 5.0 5.5 6.0 6.5 7.0 7.5 8.0
Weighted Benefits
Annual cost
Attribute-Actions
Dimension Attribute Weight Score Aspects Strategy Actions Target Score Target WeightPeople WhenDust 40 9.0
Smoke 30 7.0
Noise 20 6.0
Ease of use 10 6.0
Price Equipment Price 100 475.0
In-use PV energy costs 100 110.0
In-use PV filter costs 100 144.0

15
Reviewing a Portfolio of Related Product-Market Segments
For companies that serve many markets or several key account customers, a value-basedmarketing strategy system should also apply a core set of tools for managing a portfolio ofrelated product-market segments or key accounts:
KBF Performance Review – a table showing the portfolio’s performance relative tocompetitors, by key buying factor across the set of product-market segments. This tablereveals systemic strengths and weaknesses in performance across the portfolio and pavesthe way for initiatives to improve your performance across several products and markets.
Review of Overall Performance – a histogram of relative performance for the portfolio ofproduct-market segments or key accounts. This histogram reveals how much the portfoliois outperforming or underperforming its competitors across the market categories served.
Pricing Review – a plot of price versus fair-price for the products in your portfolio. Thisplot reveals inconsistencies in product line pricing and whether the products aresystematically priced above or below their worth in the marketplace.
Revenue Pie Chart – showing the relative size of the product lines or key accounts
Portfolio Scorecard of CV Metrics – This table summarizes each product’s performance,price, and customer-perceived value relative to competitors. It also shows the customersurplus offered by each product in the portfolio.
Market Share Review – This table summarizes the market rank, market-share level, andmarket-share trend of each product in the portfolio or share of customer by key account.
Collage of Value Maps – identifying which product lines are on or near the best valuefrontier
Scatter plots of Net Promoter Scores versus Overall Performance scores – showing howNet Promoter Scores are related to a product’s overall performance versus competitors.The key buying factor scores that make up overall performance provide a blueprint foroutperforming competitors and boosting net promoter scores.
Here is a mock up of a marketing war room for a multi-product line general manager, his productleaders, and function heads with responsibility for customer service, relationship building, andbrand affinity across the product portfolio.

16
Gathering Competitive Positioning Data for Your Key Product Lines
To assess and manage a product’s competitive positioning in the marketplace your value-basedmarketing strategy system should
• Identify the key benefit attributes (buying factors) that customers value when selecting aproduct or choosing a brand
• Measure your performance and the performance of competing products as perceived bycustomers
• Estimate the relative importance or weight of each key buying factor• Measure how customers perceive your price versus competition and measure actual
monetary prices versus competition• Track market-share trends
Some companies have the data necessary for a marketing strategy system; some companiesdon’t. Many companies have the data they need for a system but, because the data lies in bits andpieces in different functional silos, they are unable to put it all together. For example, relevantdata on customer perceptions might lie within a market research function, relevant data oncompetitor prices might be in competitive intelligence or the sales-force feedback system, anddata on market-share trends might lie in the marketing files. A good first step in building astrategy system is to take an inventory of the relevant data resources available in the company.
Mockup of a Marketing War Room --tools for analyzing a portfolio of 4 products in related segments
Who What WhenProductServiceRelationshipBrand
What / Who
Overall Performance
1.0
Product Revenues
P1
P2
CV Metrics
P1P2P3P4
Market Share
P1P2P3P4
Value Map Positions Net Promoter Scores
xx
xx
x xx
x
Performance
NPS
xx
xx
x
xx
xx
KBF Performance
KBF-1KBF-2
KBF-n
P1 P2 P3 P4
Pricing Review
Price
Fair-Price
XX
XX

17
The best way to build toward a world-class system is to assemble the best data available and useit as the basis for your key decisions. At the same time, understand the gaps in your data andinitiate programs to fill them in. The types of data you need and the typical sources for gettingthem are listed in the exhibit above.
Your competitive positioning and customer value accounting system won’t be perfect; noaccounting system ever is. But, it should be good enough to help you better understand the needsof customers in your targeted markets and how you are positioned relative to competingproducts. It should help your product line teams to better align their mental models with theperceptions of customers. And it should help you to position your products to outperformcompeting products.
Sources of data for --Customer Value Analysis & Value-Based Pricing
Type of data Sources
Performance scores -- Your mental models, refined by customers -- Engineering measures, transformed to 1-10 -- Market perception surveys
Attribute importance -- Mental models, refined by key accounts-- Rank ordered, top attributes from surveys
-- Influence weights derived from surveys
Transaction prices -- Competitive intelligence Customer’s other costs -- Cost-in-use analysis Market-share trends -- Industry analysts
Your unit costs -- Your cost accounting & competitive intelligence

18
Appendix
CVI Resources for Value-Based Marketing & Pricing
Customer Value Inc. can help you implement value-based marketing and pricing with• Marketing War Room™ software• Training• Consulting
The Marketing War Room™ Software Toolkit
Customer Value, Inc.’s Marketing War Room™ is personal-computer software for helping aproduct-market team develop strategies to increase the value of their offering to their customers.The software allows you to do all of the appraisal and pricing steps discussed in this paper. Thesoftware makes it easy to generate the exhibits used in the marketing war room collage ofexhibits for an individual product market segment and also provides the ingredients that youneed for the exhibits summarizing a portfolio of related products.
Applications of the Marketing War Room include:
• Business managers defining their value proposition and setting priorities for productimprovement
• Pricing specialists setting prices• Key-account managers discussing needs with the customers and sharing insights within their
company• Marketing-communication strategists evaluating the attributes they want to stress.• Market researchers analyzing and displaying the results of surveys
We offer division licenses and training programs to help ramp up your organization to meet theseneeds.

19
Footnotes
1 Monetized importance-performance analysis focuses on quantifying the added value ofoutperforming competitors on key attributes that deliver functional and psychological benefits tocustomers. The techniques and tools for a monetized importance-performance analysis areillustrated in the twenty-page paper, “How Much Is Your Product Really Worth?” by Bradley T.Gale.2 For more information on the customer value map, fair-value line, and customer valueaccounting see, “How Much Is Your Product Really Worth? – optimize your pricing with ValueAccounting and the Value Scorecard,” by Bradley T. Gale, (Customer Value, Inc., Boston,2002).3 Customer surplus is the appropriate measure for the goodness of the deal. Some pricingpractitioners and purchasing teams use the performance-to-price ratio as a measure of thegoodness of the deal, but this is a mistake. This bang-for-buck ratio is not a proper metric forsetting prices based on the worth of your product.4 At Customer Value, Inc. we have developed a software toolkit for customer value accountingand value-based pricing that we call the Marketing War Room™. For more information on thetools in the new value-pricing module, see the brochure for the Marketing War Room release 6(Customer Value, Inc., Boston, September 2006) available on www.cval.com. Customer Value,Inc. developed the Marketing War Room software for its consulting practice and offers annualsoftware leases to operating divisions of client companies. Seat holders typically include productmanagers, market managers, product-market-pricing practitioners, key-account managers, andcompetitive marketing strategy specialists. For information on how to get started with acomprehensive and repeatable, yet flexible and adaptable approach to customer valuemeasurement, analysis, accounting, and management – review a copy of the flyer “LaunchingCustomer Perceived Value Analysis and Value-Based Pricing” available from the authors.