value-based software engineering: seven key...
TRANSCRIPT

Value-Based Software Engineering: Seven Key Elements
and Ethical Considerations
Barry Boehm USC-CSE-2005-503, February 2005
Copyright USC-CSE 2005
Abstract: This chapter presents seven key elements that provide candidate foundations for value-based software engineering:
1. Benefits Realization Analysis 2. Stakeholder Value Proposition Elicitation and Reconciliation 3. Business Case Analysis 4. Continuous Risk and Opportunity Management 5. Concurrent System and Software Engineering 6. Value-Based Monitoring and Control 7. Change as Opportunity
Using a case study, it then shows how some of these elements can be used to incorporate ethical considerations into daily software engineering practice. Keywords: benefits realization, business case analysis, cost-benefit analysis, investment analysis, return on investment, risk management, stakeholder values, software economics, software engineering ethics, value-based software engineering. 15.1 Benefits Realization Analysis
Benefits Realized
Many software projects fail by succumbing to the “Field of Dreams” syndrome. This refers to the American movie in which a Midwestern farmer has a dream that if he builds a baseball field on his farm, the legendary players of the past will appear and play on it (“Build the field and the players will come”).
In The Information Paradox (Thorp, 1998), John Thorp discusses the paradox that
organizations’ success in profitability or market capitalization do not correlate with their level of investment in information technology (IT). He traces this paradox to an IT and software analogy of the “Field of Dreams” syndrome: “Build the software and the benefits will come”.

To counter this syndrome, Thorp and his company, the DMR Consulting Group, developed a Benefits Realization Approach (BRA) for determining and coordinating the other initiatives besides software and IT system development that are needed in order for the organization to realize the potential IT system benefits. The most significant of these features, the Results Chain, is discussed next.
Results Chain
Figure 15.1 shows a simple Results Chain provided as an example in The
Information Paradox. It establishes a framework linking Initiatives that consume resources (e.g., implement a new order entry system for sales) to Contributions (not delivered systems, but their effects on existing operations) and Outcomes, which may lead either to further contributions or to added value (e.g., increased sales). A particularly important contribution of the Results Chain is the link to Assumptions, which condition the realization of the Outcomes. Thus, in Figure 15.1, if order-to-delivery time turns out not to be an important buying criterion for the product being sold, (e.g., for stockable commodities such as soap and pencils), the reduced time to deliver the product will not result in increased sales.
The Results Chain is a valuable framework by which software project members can
work with their clients to identify additional non-software initiatives that may be needed to realize the potential benefits enabled by the software/IT system initiative. These may also identify some additional success-critical stakeholders who need to be represented and “bought into” the shared vision.
INITIATIVE OUTCOME OUTCOME
ASSUMPTION
Contribution Contribution
Implement a new order entry system
Reduced time to process order
Reduce order-processing cycle (intermediate outcome)
Reduce time to deliver product
Increased sales
Order to delivery time is an important buying criterion
Figure 15.1. Benefits Realization Approach Results Chain
For example, the initiative to implement a new order entry system may reduce the time required to process orders only if some additional initiatives or system features are pursued to convince the sales people that the new system will be good for their careers and to train them in how to use the system effectively. For example, if the
order entry-system is so efficiency-optimized that it doesn’t keep track of sales credits, the sales people will fight using it.
Further, the reduced order processing cycle will reduce the time to deliver products
only if additional initiatives are pursued to coordinate the order entry system with the order fulfillment system. Some classic cases where this didn’t happen were the late deliveries of Hershey’s Halloween candy (Carr, 2002) and Toys’R’Us’ Christmas toys.
Such additional initiatives need to be added to the Results Chain. Besides
increasing its realism, this also identifies additional success-critical stakeholders (sales people and order fulfillment people) who need to be involved in the system definition and development process. The expanded Results Chain involves these stakeholders not just in a stovepipe software project to satisfy some requirements, but in a program of related software and non-software initiatives focused on value-producing end results.
15.2 Stakeholder Value Proposition Elicitation and Reconciliation
It would be convenient if all the success-critical stakeholders had readily
expressible and compatible value propositions that could easily be turned into a set of objectives for each initiative and for the overall program of initiatives. “Readily expressible” is often unachievable because the specifics of stakeholders’ value propositions tend to be emergent through experience rather than obtainable through surveys. In such cases, synthetic-experience techniques such as prototypes, scenarios, and stories can accelerate elicitation.
Readily compatible stakeholder value propositions can be achievable in situations of long-term stakeholder mutual understanding and trust. However, in new situations, just considering the most frequent value propositions or success models of the most frequent project stakeholders (users, acquirers, developers, maintainers) shows that these are frequently in conflict and must be reconciled.
Stakeholders’ Success Model Clashes
For example, Figure 15.2 shows a “spider web” of the most frequent “model clashes” among these stakeholders’ success models that can cause projects to fail.

Figure 15.2. Value Proposition Model-Clash Spiderweb diagram.
- The red lines show model clashes from the MasterNet system.
The left- and right-hand sides of Figure 15.2 show these most-frequent success
models. For example, users want many features, freedom to redefine the feature set at any time, compatibility between the new system and their existing systems, and so on.
However, the Spiderweb diagram shows that these user success models can clash with other stakeholders’ success models. For example, the users’ “many features” product-oriented success model clashes with the acquirers’ “limited development budget and schedule” property-oriented success model, and with the developer’s success model, “ease of meeting budget and schedule.”
The developer has a success model, “freedom of choice: COTS/reuse” that can often resolve budget and schedule problems. But the developer’s choice of COTS or reused components may be incompatible with the users’ and maintainers’ other applications, causing two further model clashes. Further, the developer’s reused software may not be easy to maintain, causing an additional model clash with the maintainers.
The red lines in Figure 15.2 show the results of one of the analyses performed in constructing and refining the major model clash relationships. It determined the major model clashes in the Bank of America Master Net development, one of several major project failures analyzed. Further explanations are in (Boehm et al., 2000) and (Al-Said, 2003).

Given the goodly number of model clashes in Figure 15.2 (and there are potentially many more), the task of reconciling them may appear formidable. However, there are several effective approaches for stakeholder value proposition reconciliation, such as:
• Expectations management. Often, just becoming aware of the number of potential stakeholder value proposition conflicts that need to be resolved will cause stakeholders to relax their less-critical levels of desire. Other techniques such as lessons-learned retrospectives, well-calibrated cost models, and “simplifier and complicator” lists help stakeholders better understand which of their desired capabilities are infeasible with respect to budget, schedule, and technology constraints. Good examples are in Chapter 34 of this book.
• Visualization and tradeoff-analysis techniques. Frequently, prototypes, scenarios, and estimation models enable stakeholders to obtain a better mutual understanding of which aspects of an application are most important and achievable. Good examples are in Chapters 12, 13, and 35.
• Prioritization. Having stakeholders rank-order or categorize the relative priorities of their desired capabilities will help determine which combination of capabilities will best satisfy stakeholders’ most critical needs within available resource constraints. Various techniques such as pairwise comparison and scale-of-10 ratings of relative importance and difficulty are helpful aids to prioritization. Good examples are in Chapters 22 and 36.
• Groupware. Some of those prioritization aids are available in groupware tools, along with collaboration-oriented support for brainstorming, discussion, and win-win negotiation of conflict situations. Good examples are in Chapters 35 and 36.
• Business case analysis. Determining which capabilities provide the best return-on-investment can help stakeholders prioritize and reconcile their value propositions. Business case analysis is summarized next, and discussed in more detail in Chapter 11.
15.3 Business Case Analysis
In its simplest form, business case analysis involves determining the relative financial costs, benefits, and return on investment (ROI) across a system’s life-cycle as:
ROI = Benefits – Costs Costs
Since costs and benefits may occur at different times, the business case analysis will usually discount future cash flows based on likely rates of interest, so that all of cash flows are referenced to a single point in time (usually the present, as in Present Value).
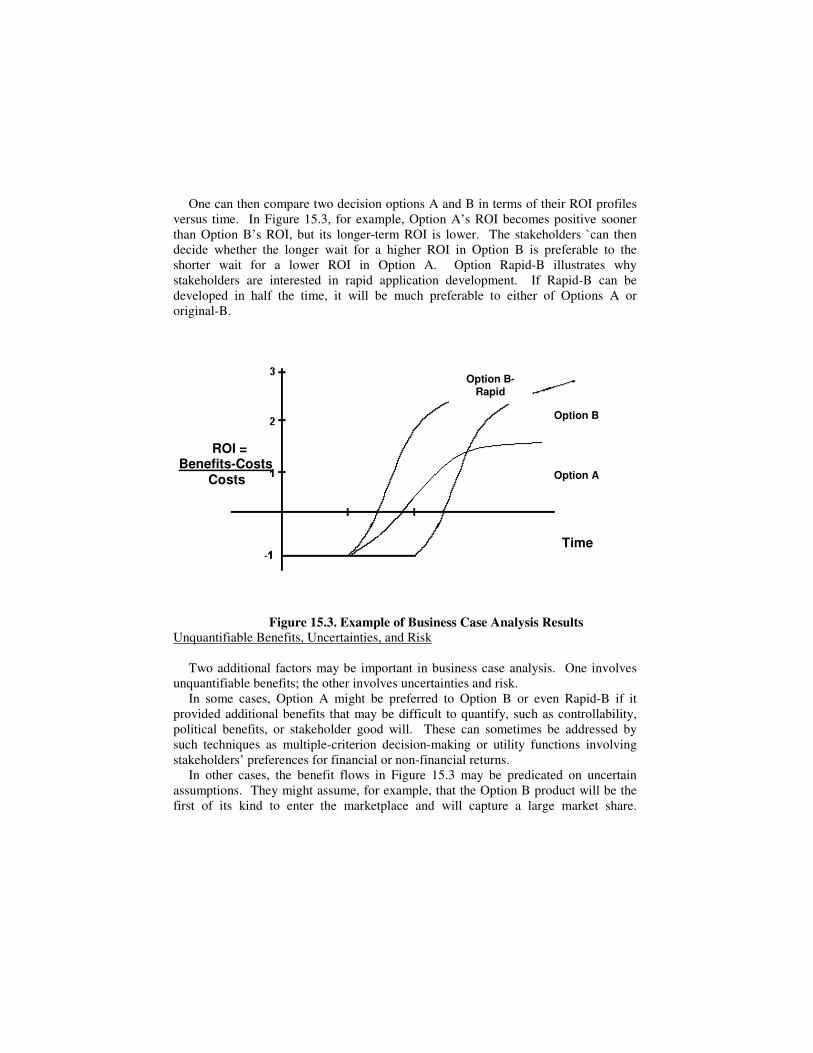
One can then compare two decision options A and B in terms of their ROI profiles versus time. In Figure 15.3, for example, Option A’s ROI becomes positive sooner than Option B’s ROI, but its longer-term ROI is lower. The stakeholders `can then decide whether the longer wait for a higher ROI in Option B is preferable to the shorter wait for a lower ROI in Option A. Option Rapid-B illustrates why stakeholders are interested in rapid application development. If Rapid-B can be developed in half the time, it will be much preferable to either of Options A or original-B.
Figure 15.3. Example of Business Case Analysis Results Unquantifiable Benefits, Uncertainties, and Risk
Two additional factors may be important in business case analysis. One involves unquantifiable benefits; the other involves uncertainties and risk.
In some cases, Option A might be preferred to Option B or even Rapid-B if it provided additional benefits that may be difficult to quantify, such as controllability, political benefits, or stakeholder good will. These can sometimes be addressed by such techniques as multiple-criterion decision-making or utility functions involving stakeholders’ preferences for financial or non-financial returns.
In other cases, the benefit flows in Figure 15.3 may be predicated on uncertain assumptions. They might assume, for example, that the Option B product will be the first of its kind to enter the marketplace and will capture a large market share.
ROI = Benefits-Costs Costs
Option B
Time
Option B- Rapid
Option A

However, if two similar products enter the marketplace first, then the payoff for Option B may be even less than that for Option A.
If the profitability of early competitor marketplace entry can be quantified, it can then be used to determine the relative value of the rapid development Option Rapid-B. This value can then be used to determine the advisability of adopting practices that shorten schedule at some additional cost. An example is pair programming: empirical studies indicate that paired programmers will develop software in 60-70% of the calendar time required for an individual programmer, but thereby requiring 120-140% of the cost of the individual programmer.
If the profitability of early competitor marketplace entry is unknown, this means that making a decision between the cheaper Option B and the faster Option Rapid-B involves considerable uncertainty and risk. It also means that there is a value in performing competitor analysis to determine the probability of early competitor marketplace entry, or of buying information to reduce risk. This kind of value-of-information analysis can be performed via statistical decision theory; a discussion and examples of its applicability to software decision making are provided in Chapter 21. An excellent overall introduction to software business case analysis is (Reifer, 2002). Good examples in this book are in Chapters 11, 22, 24, 41, and 44.
15.4 Continuous Risk and Opportunity Management
Risk analysis and risk management are not just early business case analysis
techniques; they pervade the entire information system life cycle. Risk analysis also reintroduces the people factor into economic decision-making. Different people may be more or less risk-averse, and will make different decisions in similar situations, particularly when confronted with an uncertain mix of positive and negative outcomes.
For example, consider a programmer who is given 4 weeks to complete the development of a software module. The programmer is given two choices. One is to develop a new version of the module, which he is sure he can do in 4 weeks. The other is to reuse a previously-developed module, for which there is an 80% chance of finishing in 1 week and a 20% chance of finishing in 6 weeks. The expected duration of this option is (.8)(1) + (.2)(6) = 2 weeks. This represents an expected time savings of 2 weeks and a corresponding savings in expected effort or cost. Understanding and Addressing People’s Utility Functions
In this situation, though, many risk-averse programmers would reject the reuse option. They don’t want to be known as people who overrun schedules. Their utility function would assign a much larger negative utility to overrunning the 4-week schedule than the positive utility of finishing ahead of schedule. In terms of expected utility, then, they would prefer the assured 4-week develop-a-new-module approach.

However, their boss may have preferred the reuse option, particularly if she had invested resources in creating the reusable components, and if she could organize the project to compensate for the uncertainties in module delivery schedules (e.g., via modular architectures and daily builds rather than a pre-planned module integration schedule). If so, she could revise the programmers’ incentive structure (rewarding reuse independent of actual completion time) in a way that realigned their utility functions and success models to be consistent with hers.
Thus, understanding and addressing people’s utility functions becomes a powerful tool in reducing the risk of the overall project’s failure—or, from a complementary perspective, in improving the opportunity for the overall project’s success. It means that value-based software engineering is not a dry “manage by the numbers” approach, but a highly people-oriented set of practices. And its treatment of uncertainty balances negative risk considerations with positive opportunity considerations. Reconciling stakeholders’ utility functions involves essentially the same approaches for stakeholder value proposition elicitation and reconciliation as we discussed in Section 15.2.
Using Risk to Determine “How Much Is Enough” A current highly-debated issue is the use of plan-driven methods versus use of agile methods such as Extreme Programming, Crystal Methods, Adaptive Software Development, and Scrum (Highsmith, 2002). Recent workshop results involving plan-driven and agile methods experts have indicated that hybrid plan-driven/methods are feasible, and that risk analysis can be used to determine how much planning or agility is enough for a given situation.
A central concept in risk management is the Risk Exposure (RE) involved in a given course of action. It is determined by accessing the probability of loss P(L) involved in a course of action and the corresponding size of loss S(L), and computing the risk exposure as the expected loss: RE=P(L)*S(L). “Loss” can include profits, reputation, quality of life, or other value-related attributes.
Figure 15.4 shows risk exposure profiles for an example e-services company with a sizable installed base and desire for high assurance; a rapidly changing marketplace and desire for agility and rapid value; and an internationally distributed development team with mix of skill levels and a need for some level of documented plans.

- RE due to inadequate plans
- RE due to market share erosion
- Sum of risk exposures
low P(L): thorough planslow S(L): minor problems
Time and Effort Invested in Plans
RE
= P
(L)
* S
(L)
low P(L): few plan delayslow S(L): early value capture
high P(L): plan breakage, delayhigh S(L): value capture delays
Sweet Spot
high P(L): inadequate planshigh S(L): major problems
(oversights, delays, rework)
Figure 15.4. Risk Exposure (RE) Profile: Planning Detail
The downward curve in Figure 15.4 shows the variation in risk exposure (RE) due
to inadequate plans, as a function of the level of investment the company puts into its projects’ process and product plans. At the left, a minimal investment corresponds to a high probability P(L) that the plans will have loss-causing gaps, ambiguities, and inconsistencies. It also corresponds to a high S(L) that these deficiencies will cause major project oversights, delays, and rework costs. At the right, the more thorough the plans, the less P(L) that plan inadequacies will cause problems, and the smaller the size S(L) of the associated losses.
The upward curve in Figure 15.4 shows the variation in RE due to market share erosion through delays in product introduction. Spending little time in planning will get at least a demo product into the marketplace early, enabling early value capture. Spending too much time in planning will have a high P(L) due both to the planning time spent, and to rapid changes causing delays via plan breakage. It will also cause a high S(L), as the delays will enable others to capture most of the market share.
The upper curve in Figure 15.4 shows the sum of the risk exposures due to inadequate plans and market share erosion. It shows that very low and very high investments in plans have high overall risk exposures, and that there is a “Sweet Spot” in the middle where overall risk exposure is minimized, indicating “how much planning is enough?” for this company’s operating profile.

With the example company situation as a reference point, we can run comparative risk exposure profiles of companies having different risk profiles. For example, consider an e-services company with a small installed base and less need for high assurance, a rapidly changing marketplace, and a collocated team of highly capable and collaborative developers and customers. With this profile, the major change in risk exposure from Figure 15.4 is that the size of rework loss from minimal plans is much smaller due to the ability of the team to rapidly replan and refactor, and thus the company’s Sweet Spot moves to the left toward agile methods.
As another example, consider a company in the plan-driven home ground, with a
more stable product line of larger, more safety-critical systems. Here, the major difference from Figure 15.4 is a much higher size of rework loss from minimal plans, and a resulting shift of the company’s Sweet Spot toward higher investments in plans. Further discussion and illustration of these issues and more quantitative analyses are provided in (Boehm and Turner, 2004). Similar analyses have shown that such risk analysis techniques can be used to determine “how much is enough” for other key software engineering levels of activity, such as testing, specification, prototyping, COTS evaluation, formal methods, or documentation. Other good treatments of risk considerations are in Chapters 24, 33, and 41. 15.5 Concurrent System and Software Engineering
As we discussed in Chapter 21, the increasing pace of change in the information technology marketplace is driving organizations toward increasing levels of agility in their software development methods, while their products and services are concurrently becoming more and more software-intensive. These trends also mean that the traditional sequential approach to software development, in which systems engineers determined software requirements and passed them to software engineers for development, is increasingly risky to use. Increasingly, then, it is much more preferable to have systems engineers and software engineers concurrently engineering the product’s or service’s operational concept, requirements, architecture, life cycle plans and key sections of code. Concurrent engineering is also preferable when system requirements are more emergent from usage or prototyping than prespecifiable. It is further preferable when the relative costs, benefits, and risks of commercial-off-the-shelf (COTS) software or outsourcing decisions will simultaneously affect requirements, architectures, code, plans, costs, and schedules. It is also essential in determining cost-value tradeoff relationships in developing software product lines (Faulk et. al., 2000).

Relevant Process Models
For the future, then, concurrent spiral-type process models will increasingly be preferred over sequential “waterfall”-type process models. Several are available, such as the Evolutionary Spiral Process (SPC, 1992), the Rational Unified Process (RUP) (Royce, 1998; Jacobson et al., 1999; Kruchten, 2001), and the MBASE/CeBASE models (Boehm and Port, 2001; Boehm et al., 2002a). Some agile process models such as Lean Software Development and Adaptive Software Development (Highsmith, 2002) also emphasize concurrent system and software engineering.
An important feature of concurrent process models is that their milestone pass-fail criteria involve demonstrations of consistency and feasibility across a set of concurrently-developed artifacts. For example, Table 15.1 shows the pass-fail criteria for the anchor point milestones used in MBASE and RUP: Life Cycle Objectives (LCO), Life Cycle Architecture (LCA), and Initial Operational Capability (IOC) (Boehm and Port, 2001).

Table 15.1 LCO, LCA, and IOC Pass/Fail Criteria
These milestones work well as common commitment points across a variety of
process model variants because they reflect similar commitment points during one’s lifetime. The LCO milestone is the equivalent of getting engaged, and the LCA milestone is the equivalent of getting married. As in life, if you marry your architecture in haste, you and your stakeholders will repent at leisure (if, in Internet time, any leisure time is available). The third anchor point milestone, the Initial Operational Capability (IOC), constitutes an even larger commitment: It is the equivalent of having your first child, with all the associated commitments of care and feeding of a legacy system.
Another important development in this area is the Capability Maturity Model-Integrated (CMMI) (SEI, 2002; Ahern et. al, 2001). It integrates the previous software-centric Software CMM (Paulk et al., 1994) with CMM’s for System Engineering and for Integrated Product and Process Development. The CMMI (and
LCO LCA IOC
For at least one architecture, a system built to that architecture will:
• Support the core operational concept
• Satisfy the core requirements
• Be faithful to the prototype(s)
• Be buildable within the budgets and schedules in the plan
• Show a viable business case
• Have its key stakeholders committed to support the Elaboration Phase (to LCA)
For a specific detailed architecture, a system built to that architecture will:
• Support the elaborated operational concept
• Satisfy the elaborated requirements
• Be faithful to the prototype(s)
• Be buildable within the budgets and schedules in the plan
• Show a viable business case
• Have all major risks resolved or covered by a risk management plan
• Have its key stakeholders committed to support the full life cycle
An implemented architecture, an operational system that has:
• Realized the operational concept
• Implemented the initial operational requirements
• Prepared a system operation and support plan
• Prepared the initial site(s) in which the system will be deployed for transition
• Prepared the users, operators, and maintainers to assume their operational roles

its predecessor iCMM (FAA, 1997)) provides a process maturity assessment and improvement framework, which organizations can use to evolve from sequential to concurrent systems and software engineering approaches, in ways, which emphasize integrated stakeholders teaming and reconciliation of stakeholder value propositions. Further good examples of concurrent system and software engineering are in Chapters 12, 13, 22, 23, 31, 35, and 36. 15.6 Value-Based Monitoring and Control
A technique often used to implement project monitoring and control functions in
the software CMM or the CMMI is Earned Value Management. It works as shown in Figure 15.5.
Develop/update
plans, BCWS
Perform to plans
BCWP> BCWS?
BCWP> Cost ?
Determine corrective actions
Yes
No No
Yes
BCWS: Budgeted Cost of Work Scheduled BCWP: Budgeted Cost of Work Performed
Cost: Actual Cost of Work Performed
Figure 15.5. “Earned Value” Feedback Process
The Earned Value Management process is generally good for tracking whether the project is meeting its original plan. However, it becomes difficult to administer if the project’s plan changes rapidly. More significantly, it has absolutely nothing to say about the actual value being earned for the organization by the project’s results. A project can be tremendously successful with respect to its cost-oriented “earned value,” but an absolute disaster in terms of actual organizational value earned. This frequently happens when the resulting product has flaws with respect to user acceptability, operational cost-effectiveness, or timely market entry. Thus, it would be

preferable to have techniques which support monitoring and control of the actual value to be earned by the project’s results. Business-Case and Benefits-Realized Monitoring and Control A first step is to use the project’s business case (discussed in Section 15.3) as a means of monitoring the actual business value of the capabilities to be delivered by the project. This involves continuing update of the business case to reflect changes in business model assumptions, market conditions, organizational priorities, and progress with respect to enabling initiatives. Monitoring the delivered value of undelivered capabilities is difficult; therefore, this approach works best when the project is organized to produce relatively frequent increments of delivered capability. A related next step is to monitor assumptions and progress with respect to all of the Initiatives and Outcomes involved in the project’s Results Chain discussed in Section 15.1 and shown in Figure 15.1. The suggested monitoring approach in (Thorp, 1998) involves coloring in the degree to which Initiatives and Outcomes have been realized. This can be extended to monitor Contributions and validity of Assumptions as well. For example, monitoring the Contribution, “Reduce time to deliver product” in Figure 15.1 could uncover the problem that speeding up order entry will create more order fulfillment delays unless a complementary order-fulfillment Initiative is established. The resulting value realization feedback process is shown in Figure 15.6. With respect to the order-entry example just above, finding out that value was not being realized via reduced delivery times would lead to some corrective action, most likely the establishment of an order-fulfillment speedup Initiative. This would require updates of the overall plans and business case, and new time-phased cost and benefit flows to monitor.
Develop/update business case;
time-phased cost, benefit flows; plans
Perform to plans
Value being
realized?
Assump-
tions still valid?
Determine corrective actions
Yes
Yes
No
No
Figure 15.6. Value Realization Feedback Process

A further option in the value realization feedback process involves adjusting the
value function to reflect progress with respect to the product’s production function as illustrated in Figure 15.7. The usual economic production function is an S-shaped curve in which the early “Investment” segment involves development of infrastructure and architecture which does not directly generate benefits, but which is necessary for realization of the benefits in the High-payoff and Diminishing-returns segment of the curve. This means that tracking direct benefits realized usually produces pessimistic results during the Investment segment of the curve. One can either manage stakeholders’ expectations to accept low early benefit flows (as with the ROI profiles in Figure 15.3), or use an alternative value function (the dotted line in Figure 15.7), which ascribes additional indirect value to the early investments in infrastructure and architecture. (Actually, the real-options techniques in (Sullivan et. al., 2001) and Chapters 11, 24, and 41 can estimate such values). The preferred approach will depend on the project’s stakeholders and their expectations. Of course, the actual and potential benefit values realized by each increment of capability need to be monitored and adjusted for changes. For example, a low-cost and user-friendly animated graphics package may increase the net value of animated graphics for certain classes of applications (e.g. education and training), and limited-domain speech understanding systems have shown considerable labor-saving value.
Val
ue o
f sof
twar
e pr
oduc
t to
orga
niza
tion
Investment High-payoff Diminishing returns
Operating system
Middleware
Basic application functions
Main application functions
Operational support functions
Secondary application functions
Animated graphics Natural speech input
Level of investment
Adjusted infrastructure value function
Figure 15.7. Example Production Function for Software Product Features

Value-Based Monitoring and Control at the Organization Level Several useful techniques are available for organizing and managing multi-dimensional improvement strategies. The Balanced Scorecard technique (Kaplan and Norton, 1996) organizes goals, strategies, and initiatives into four perspectives: financial; customer; internal business process; and learning and growth. The BTOPP business system (Scott Morton, 1991; Thorp, 1998) uses five perspectives: business, technology, organization, process, and people. Both are similar; organizations can choose the one that best fits or develop an alternative as appropriate. Chapters 12 and 22 provide good examples of value-based monitoring and control.
15.7 Change as Opportunity
Expending resources to adapt to change is frequently lumped into “rework costs”
and treated as a negative factor to avoid. Software change tracking systems often treat changes as defects in the original requirements. Quality cost systems often treat change adaptations as a quality cost to be minimized. These criteria tend to push projects and organizations toward change-aversion.
Nowadays, changes are continually going on in technology, in the marketplace, in organizations, and in stakeholders’ value propositions and priorities. And the rate of change is increasing. Organizations that can adapt to change more rapidly than their competition will succeed better at their mission or in the marketplace. Thus the ability to adapt to change has business value.
Software is the premier technology for adaptation to change. It can be organized to make the cost of changes small as compared to hardware. It can be updated electronically, in ways that preserve continuity of service as the change is being made. Thus, change as opportunity for competitive success is a key economic and architectural driver for software projects and organizations.
Examples of Change as Opportunity
The main sources of change as opportunity come from changes in technology or in the marketplace that open up new opportunities to create value. These are of course other opportunity sources such as changes in legislation, organizational alignments, and international relations.
An excellent example of technology change as opportunity has been the Internet and the Web and their effect on electronic commerce. Organizations that learned early how to capitalize on this technology made significant competitive gains. Other good examples of technology change as opportunity have been agent technology, mobile computing, and the Global Positioning System (GPS).
A good example of marketplace change as opportunity is the existence of GPS and mobile computing in automobiles as an opportunity to provide mobile location-based services. Another is the opportunity to add mobile electronic collect-on-delivery billing and collection systems at the delivery point of rapid-delivery services such as Federal Express and United Parcel Service. Techniques for Enhancing Adaptability to Change
As documented in Microsoft Secrets (Cusumano and Selby, 1995), the world’s leading software business uses a number of techniques for enhancing its adaptability to change. Its synchronize-and-stabilize approach focuses on concurrent evolutionary development, in which each feature team has the flexibility to adapt to change, while buffer periods are built into each increment to enable the teams to synchronize their results. Nightly build techniques also accommodate flexibility in the integration schedule and adaptability to change. Also, Microsoft uses a number of techniques to enhance organizational learning and adaptation, such as customer feedback analysis, project postmortems, and technology-watch and marketplace-watch activities.
Project techniques for enhancing adaptability to change tend to fall into two categories: architecture-based and refactoring-based. Architecture-based techniques focus on identifying the product’s most likely sources of change, or evolution requirements, and using information-hiding modularity techniques to hide the sources of change within architectural modules (Parnas, 1979). Then, when the changes come, they can be accommodated within modules rather than causing ripple effects across the entire product. A related technique is schedule-as-independent-variable (SAIV), which uses prioritized requirements as potential sources of change to ensure delivery of the highest-priority requirements within a fixed schedule (Boehm et al., 2002b).
Refactoring-based change focuses on keeping the product as simple as possible, and reorganizing the product to accommodate the next set of desired changes. A number of the agile methods discussed in Section 21.3.4 rely on refactoring to accommodate change, while the plan-driven methods rely on architecture. Which one is more likely to succeed for a given project is largely based on the validity of the Extreme Programming slogan, “You Aren’t Going to Need It (YAGNI).” If the evolution requirements are knowable in advance and stable, the architecture-based approach will easily accommodate them, while the YAGNI approach will incur a steady stream of excess refactorings. On the other hand, if the requirements changes are frequent and highly unpredictable, pre-architected frameworks will continually break, and refactoring simpler designs will be preferable. Traceability tools such as those in Chapter 31 can help with change impact analysis. The value-based release prioritization approach in Chapter 22 is another good approach for addressing change as opportunity.

Economic Value of Adaptability to Change
Developing a change-anticipatory modular design can be considered as an investment in real options which can be exercised in the future to execute changes which enhance the system’s value (Amram and Kulatilaka, 1998; Baldwin and Clark, 2000). More specifically, (Sullivan et al., 2001) uses the options-pricing approach to analyze the economic value of Parnas’ information-hiding technique to modularization around anticipated sources of change. This approach can also be combined with other economic approaches, such as buying information to reduce the risk of anticipating the wrong set of changes (e.g. via prototypes, user surveys, marketplace watch, or technology watch activities).
Another perspective on the value of adaptability to change comes from studies of complex adaptive systems (Kauffman, 1995). These studies show that for various “fitness landscapes” or value functions, one can tune a set of adaptation parameters so that a high-value operational solution will emerge over time via the interaction of a set of adaptive agents. A too-rigid set of adaptation parameters will lead to gridlock; a too-flexible set will lead to chaos. (Highsmith, 2000) shows numerous parallels between software development and complex adaptive systems, including the value of relatively agile over highly rigorous approaches to software development in domains undergoing rapid change.
15.8 Integrating Ethical Considerations Into Software Engineering Practice 15.8.1 Motivation and Context
Software engineers have increasingly many and significant opportunities to influence the outcome of software projects in ways that produce harmful or positive results for some of the stakeholders involved. The field has produced some good codes of ethics such as the ACM/IEEE Software Engineering Code of Ethics and Professional Practice (ACM/IEEE, 1998). Its content covers a number of value-intensive topics such as intellectual property, privacy, confidentiality, quality of work, fairness, liability, risk disclosure, conflict of interest, and unauthorized access (Anderson et. al., 1993).
However, the codes provide only general guidelines, and it has been difficult to
integrate their value-oriented objectives into the value-neutral techniques and practices constituting traditional software engineering. One of the major benefits of the value-based software engineering approaches presented in this book is the opportunity to naturally integrate value-oriented ethical considerations into daily software engineering practice.

The approach presented in this chapter follows the principles in John Rawls’ seminal book, A Theory of Justice (Rawls, 1971). The socioeconomic aspect of this theory is based on the following principle:
Social and economic inequalities are to be arranged so that they are both (a) to the greatest benefit of the least advantaged and (b) attached to offices and positions open to all under conditions of fair
equality of opportunity.
This principle recognizes the fact that some individuals are better able to increase everyone’s benefits than are others. It holds that it is fair for such individuals to operate with more resources than others, to the extent that they thereby generate benefits for others, and particularly maximize the benefits of least-advantaged people.
The Theory W or stakeholder win-win approach (Boehm and Ross, 1989) to value-
based software engineering presented in Section 15.2 and Chapter 36 provides a way to apply Rawls’ Theory of Justice to daily software engineering practice, by recognizing the class of least-advantaged people as one of the success-critical stakeholders in a software project.
A good start toward this approach was provided by Collins et al. (Collins et. al.,
1994). They developed an interpretation of the Theory of Justice that identifies the least-advantaged class or penumbra as an essential stakeholder in software engineering decisions, along with the providers, buyers, and users of a prospective software system. They provide and exemplify a matrix of obligations of each of the stakeholder classes to the others, and identify techniques for addressing other aspects of the Theory of Justice. These include the concept of risking harm and the publicity test for ethical appropriateness (how would you like it if your software engineering decision were discussed on the evening news?). 15.8.2 Fire Dispatching Cast Study
The synthesized case study includes ethical problems encountered in several urban
emergency services software projects.
Several years ago, the city of Zenith suffered a major fire disaster in its central
business district, causing over $300 million in property damage. An investigation concluded that much of the loss could have been avoided with a modern automated fire dispatching system instead of the current largely manual system originally developed for Zenith in the 1920s.

The mayor of Zenith then pledged to ensure that Zenith would have a modern automated fire dispatching system in 2 years (just before the next election). His staff chose a consultant company to rapidly prepare specifications and a competitive procurement package for the system. In three months, the company prepared the package, including an algorithm that would dispatch fire equipment based on minimizing property damage and an $8 million cost estimate. Bidding was opened for a fixed-price contract to develop the system to the specifications, and three months later, the contract was awarded to Integrated Logistics, Inc. (ILI), for their bid price of $4.4 million. ILI was new to urban emergency services but planned to reuse an extensive library of reusable logistics software. They also indicated that their automated system would reduce Zenith’s annual operating costs for fire dispatching by 50%.
ILI delivered an automated system on schedule, and demonstrated its impressive
user interface to city leaders and the press with much fanfare. However, three months later, the Fire Department had discovered several problems:
• There were major delays and shortfalls in the cutover from the old system to the new system due to inadequate budgeting, planning, and preparation for conversion, installation, and training for users, administrators, and maintainers.
• The automated algorithm would send equipment to false alarms in rich people’s neighborhoods while poor people’s houses burned, which did not look good in the newspapers.
• The labor savings were not realized after the Firemen’s Union went on a one-day sick-out in protest over the potential loss of dispatchers’ jobs.
• The delivered system had weak off-nominal capabilities that resulted in numerous dispatching delays and work-arounds (at least, these provided the extra dispatchers with things to do). The system was contractually compliant, but gave signs of being very risky to use in a crisis, requiring expensive post-delivery rework to improve safety.
• The reused logistics software was weak not only on safety but on privacy safeguards, putting confidential identity and financial information at risk.
• The English-only user interface caused numerous usage problems with the general public and multilingual hot-line operators.
Clearly, these problems raise ethical concerns in such areas as fairness, quality of work, liability, risk disclosure, privacy, confidentiality, and unauthorized access. Let us see how the seven key elements of VBSE presented above can be applied to integrate ethical considerations into software engineering considerations.
1. Benefits Realization Analysis. The Results Chain approach can be used to
identify missing success-critical stakeholders, particularly if maximizing benefits to the least advantaged is added to the desired outcomes.
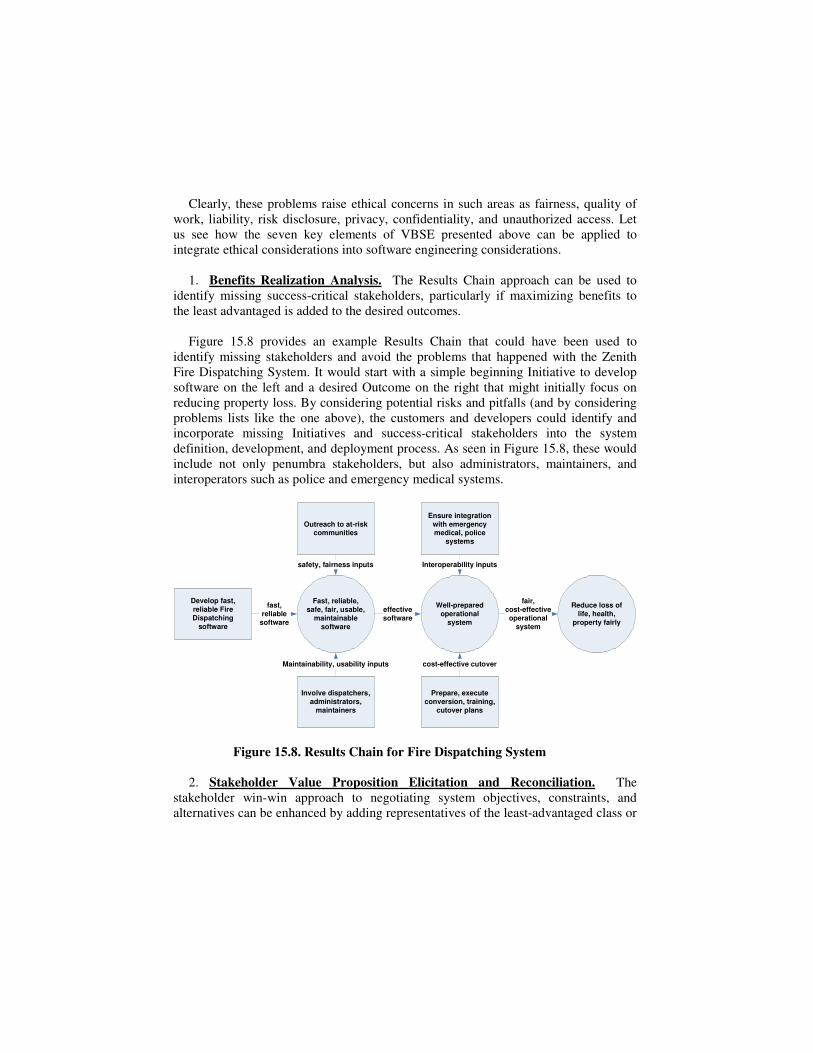
Figure 15.8 provides an example Results Chain that could have been used to identify missing stakeholders and avoid the problems that happened with the Zenith Fire Dispatching System. It would start with a simple beginning Initiative to develop software on the left and a desired Outcome on the right that might initially focus on reducing property loss. By considering potential risks and pitfalls (and by considering problems lists like the one above), the customers and developers could identify and incorporate missing Initiatives and success-critical stakeholders into the system definition, development, and deployment process. As seen in Figure 15.8, these would include not only penumbra stakeholders, but also administrators, maintainers, and interoperators such as police and emergency medical systems.
Develop fast,
reliable Fire Dispatching
software
Outreach to at-risk communities
Ensure integration
with emergency medical, police
systems
Prepare, execute
conversion, training, cutover plans
Fast, reliable,
safe, fair, usable, maintainable
software
Well-prepared operational
system
Reduce loss of life, health,
property fairly
Involve dispatchers,
administrators, maintainers
Maintainability, usability inputs
safety, fairness inputs
effectivesoftware
Interoperability inputs
cost-effective cutover
fair,
cost-effectiveoperational
system
fast, reliable
software
Figure 15.8. Results Chain for Fire Dispatching System
2. Stakeholder Value Proposition Elicitation and Reconciliation. The stakeholder win-win approach to negotiating system objectives, constraints, and alternatives can be enhanced by adding representatives of the least-advantaged class or

penumbra, and by expanding the checklist of negotiation topics to identify the most critical system attributes for each class of stakeholder.
Table 15.1 shows a modification of one of the obligation matrices in (Collins et. al., 1994) that provides guidance on negotiation topics. The figure extends the “buyer” stakeholder to an “owner” stakeholder including not only system acquisition but also system transition, operations, and maintenance. It also adds a number of initiatives identified in the Results Chain. As with many systems, a full obligation matrix would include an additional column for interoperator stakeholders, and perhaps others such as upper management and insurance providers. The negotiation might include arrangements for Zenith software engineers to work on the developer’s team, to enhance visibility and maintainability.
Table 15.1. Obligations of the Software Owner
To the provider To the owner To the user To the penumbra
� negotiate in good faith, recognizing the importance of provider’s fair profit
� learn enough
about the software to make informed decisions
� facilitate
adequate
communication with users, administrators, maintainers, and the penumbra
� involve
administrators,
maintainers in system definition, development, and transition planning
� proactively
address risks of delivery shortfalls and overruns
� provide quality software appropriate to user’s needs within reasonable budget constraints
� prudent
introduction of automation
� informed
consent to using software
� involve user
representatives in system definition, review, and prototype exercise
� buy software only with reasonable
safeguards for the public
� open about
software capabilities and limitations
� involve
penumbra representatives in system definition, review, and prototype exercise

Similar example artifacts can be provided for the remaining five key elements, but space limitations constrain their description to the short summaries below.
3. Business Case Analysis. Return on investment techniques can be applied for each class of stakeholder to validate that the developed system will deliver cost-effective results, particularly for the penumbra.
4. Continuous Risk and Opportunity Management. The concept of risking harm can be expanded into a full set of risk and opportunity management techniques including risk identification, risk assessment, risk prioritization, risk planning and control, and the use of risk analysis to determine “how much is enough” of each software engineering activity.
5. Concurrent System and Software Engineering. The anchor point milestones in the WinWin Spiral Model provide a framework for controlled concurrent engineering, feasibility validation, and stakeholder concurrence on in-process software decisions and plans.
6. Value-Based Monitoring and Control. Techniques such as the Balanced Scorecard and Earned Stakeholder Value can be applied to monitor and control progress toward meeting ethical as well as product and financial goals.
7. Change as Opportunity. The pace of change in technology, organizations, environments, and stakeholder value propositions will continue to increase. Techniques such as evolution requirements, architectural encapsulation of sources of change, and agile methods can help ensure fair accommodation to change.
This partial single-thread application of the 7 key elements provides an example of how VBSE techniques can integrate ethical considerations into a software engineer’s daily practice. Clearly, there are many other ethical considerations for which VBSE can provide similar assistance. Besides the references (ACM/IEEE, 1998; Anderson et. al., 1993; Boehm and Ross, 1989; Collins et. al., 1994, Rawls, 1971), some further good treatments of software engineering ethics considerations are the books (Ermann and Shauf, 2003; Johnson and Nissenbaum, 1995; and Baird et. al., 2000).
15.9 References
ACM/IEEE, “The Software Engineering Code of Ethics and Professional Practice,” available at www.acm.org and www.computer.org, 1998. D. Ahern, A.Clouse, and R. Turner, CMMI Distilled, Addison Wesley, 2001. M. Al-Said, “Identifying, Analyzing, and Avoiding Software Model Clashes”, Ph.D. Dissertation, USC, 2003. M. Amram and N. Kulatilaka, Real Options, Harvard Business School Press, 1999.

R. Anderson, D. Johnson, D. Gotterbarn, and J. Perolle, “Using the New ACM Code of Ethics in Decision Making,” Comm.ACM, February 1993, pp. 98-105. R. Baird, R. Ramsower, and S. Rosenbaum, Cyberethics, Prometheus Books, 2000. C. Baldwin and K. Clark, Design Rules: The Power of Modularity, MIT Press, 2000. B. Boehm and R. Turner, Balancing Agility and Discipline, Addison Wesley, 2004. B. Boehm, D. Port, and M. Al-Said, “Avoiding the Software Model-Clash Spiderweb,” Computer, November 2000, pp. 120-122. B. Boehm, D. Port, A. Jain, & V. Basili, “Achieving CMMI Level 5 Improvements with MBASE and the CeBASE Method,” Cross Talk, May 2002. B. Boehm, D. Port, L. Huang, and A. W. Brown, “Using the Spiral Model and MBASE to Generate New Acquisition Process Models: SAIV, CAIV, and SCQAIV”, Cross Talk, January 2002. B. Boehm and D. Port, “Balancing Discipline and Flexibility with the Spiral Model and MBASE”, Cross Talk, December 2001. See also http://cse.usc.edu/mbase B. Boehm, and R. Ross, “Theory-W Software Project Management: Principles and Examples,” IEEE Trans. SW Engr., July 1989, pp. 902-916. D. Carr, “Sweet Victory”, Baseline, December 2002. R. Charette, Software Engineering Risk Analysis and Management, McGraw Hill, 1989 W. Collins, K. Miller, B. Spielman, and J. Wherry, “How Good is Good Enough?”, Comm. ACM, January 1994, pp. 81-91. M. Cusumano and R. Selby, Microsoft Secrets, How the World's Most Powerful Software Company Creates Technology, Shapes Markets, and Manages People, The Free Press,1995. M.D. Ermann and M. Shauf, Computers, Ethics, and Society (3rd ed.), Oxford U. Press, 2003.
Federal Aviation Administration, “The Integrated Capability Maturity Model,” 1997.

S Faulk, D. Harmon, and D. Raffo, “Value-Based Software Engineering (VBSE): A Value-Driven Approach to Product-Line Engineering,” Proceedings, First International Conference on Software Product Line Engineering, August 2000. J. Highsmith, Adaptive Software Development, Dorset House, 2000. J. Highsmith, Agile Software Development Ecosystems, Addison Wesley, 2002. I. Jacobson, G. Booch, and J. Rumbaugh, The Unified Software Development Process, Addison Wesley, 1999. D. Johnson and H. Nissenbaum, Computers, Ethics, and Social Values, Prentice Hall, 1995. R. Kaplan and D. Norton, The Balanced Scorecard: Translating Strategy into Action, Harvard Business School Press, 1996. S. Kauffman, At Home in the Universe, Oxford University Press, 1995. P. Kruchten, The Rational Unified Process, (2nd ed.), Addison Wesley, 2001. M. Paulk, C. Weber, B. Curtis, and M. Chrissis, The Capability Maturity Model, Addison Wesley, 1994. D. Parnas, “Designing Software for Ease of Extension and Contraction,” IEEE Trans. Software Engr., March 1979, pp. 128-137. J. Rawls, A Theory of Justice, Belknap/Harvard U. Press, 1971, 1999. D. Reifer, Making the Software Business Case, Addison Wesley, 2002. W. E. Royce, Software Project Management, Addison-Wesley, 1998. M. Scott Morton, The Corporation of the 1990s: Information Technology and Organization Transformation, Oxford University Press, 1991. Software Engineering Institute, Capability Maturity Model Integration (CMMI), Version 1.1., CMU/SEI-2002-TR-012, March 2002. Software Productivity Consortium, “The Evolutionary Spiral Process,” SPC Technical Report, Herndon, VA, 1992.

K. Sullivan, Y. Cai, B. Hallen, and W. Griswold, “The Structure and Value of Modularity in Software Design,” Proceedings, ESEC/FSE, 2001, ACM Press, pp. 99-108. J. Thorp and DMR, The Information Paradox, McGraw Hill, 1998.
Author Biography
Barry Boehm is the TRW Professor of Software Engineering and Director of the Center for Software Engineering at USC. His current research interests include software process modeling, software requirements engineering, software architectures, software metrics and cost models, software engineering environments, and value-based software engineering. His contributions to the field include the Constructive Cost Model (COCOMO), the Spiral Model of the software process, and the Theory W (win-win) approach to software management and requirements determination. He is a Fellow of the primary professional societies in computing (ACM), aerospace (AIAA), electronics (IEEE), and systems engineering (INCOSE), and a member of the US National Academy of Engineering.