value based steering on a multi-regional level in...
TRANSCRIPT

Value Based Steering on a multi-regional level in Sweden

2
Introduction
• Jonas Wohlin
• PhD candidate Karolinska Institutet
• CEO Ivbar Institute

Increase efficiency
(outcomes in
relation
to cost)
Major potential
(given proven variation in
methodology, outcomes and
cost)
Fundamental challenge in Health
Care faced by OECD Countries
Potential actions by
healthcare policy
makers Increase Health
Care spend
Feasibility long/short
term Not sustainable long
term • High and growing cost for
healthcare
+24%
7,2% 8,9%
2000 2013
HC Cost, % of GDP
Prioritization and
rationing Variation
ILLUSTRATIVE
+X%
Ø
Predikterad
Observerad Ethically and politically
complex
Macro challenges: There are three main line of
actions that policy makers can pursue in order to
meet health care challenges
• Major variations in methodology,
outcomes and costs
• Slow diffusion of best practice
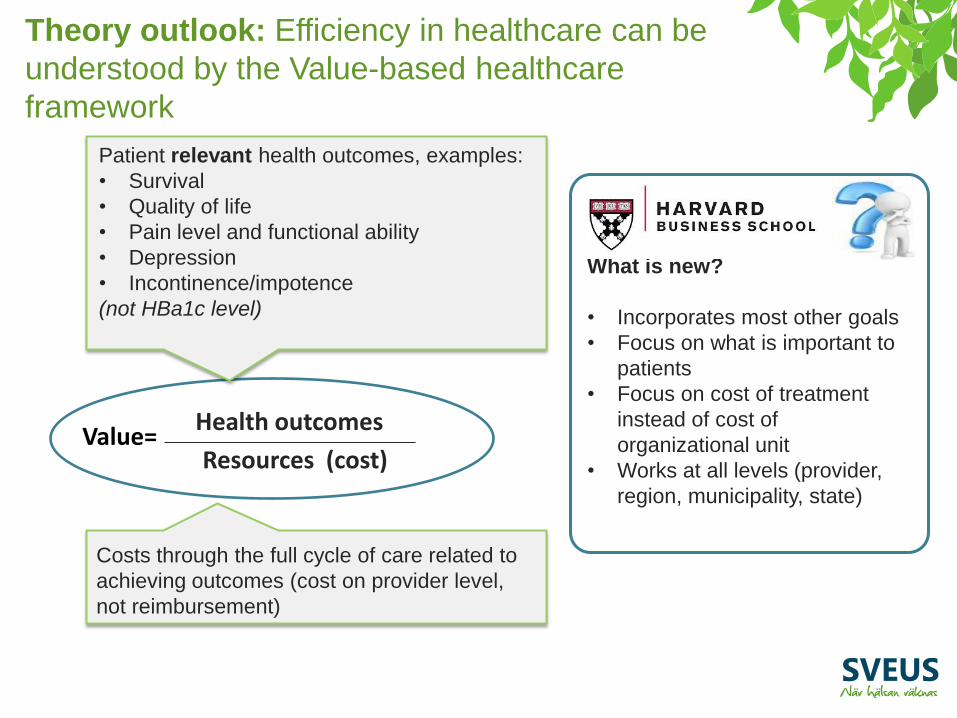
Value= Health outcomes
Resources (cost)
Patient relevant health outcomes, examples:
• Survival
• Quality of life
• Pain level and functional ability
• Depression
• Incontinence/impotence
(not HBa1c level)
Costs through the full cycle of care related to
achieving outcomes (cost on provider level,
not reimbursement)
What is new?
• Incorporates most other goals
• Focus on what is important to
patients
• Focus on cost of treatment
instead of cost of
organizational unit
• Works at all levels (provider,
region, municipality, state)
Theory outlook: Efficiency in healthcare can be
understood by the Value-based healthcare
framework
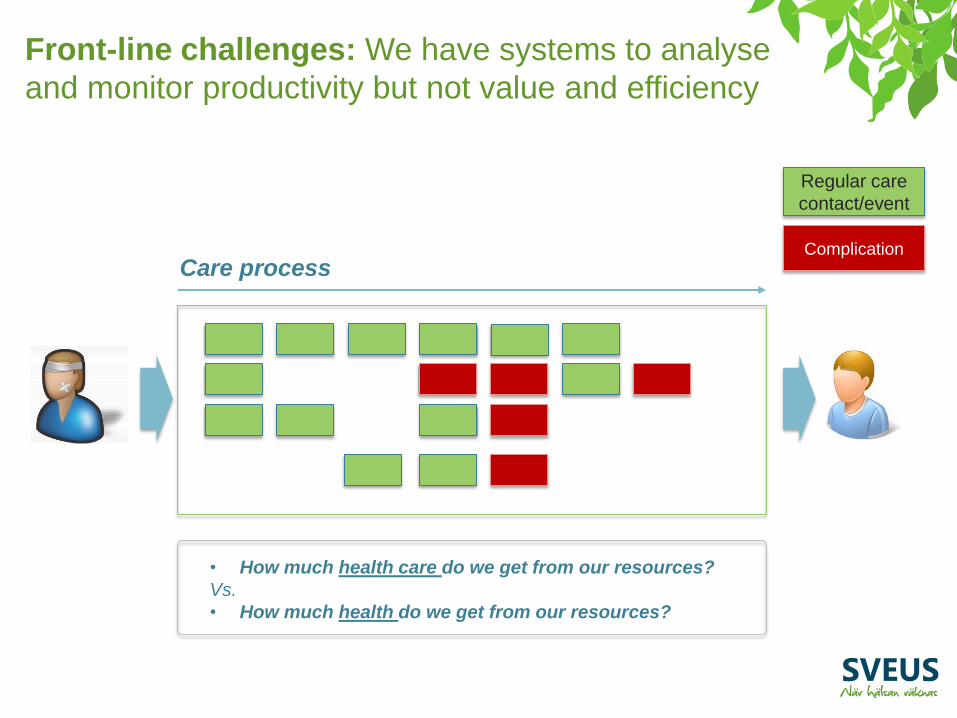
Care process Complication
Regular care
contact/event
• How much health care do we get from our resources?
Vs.
• How much health do we get from our resources?
Front-line challenges: We have systems to analyse
and monitor productivity but not value and efficiency
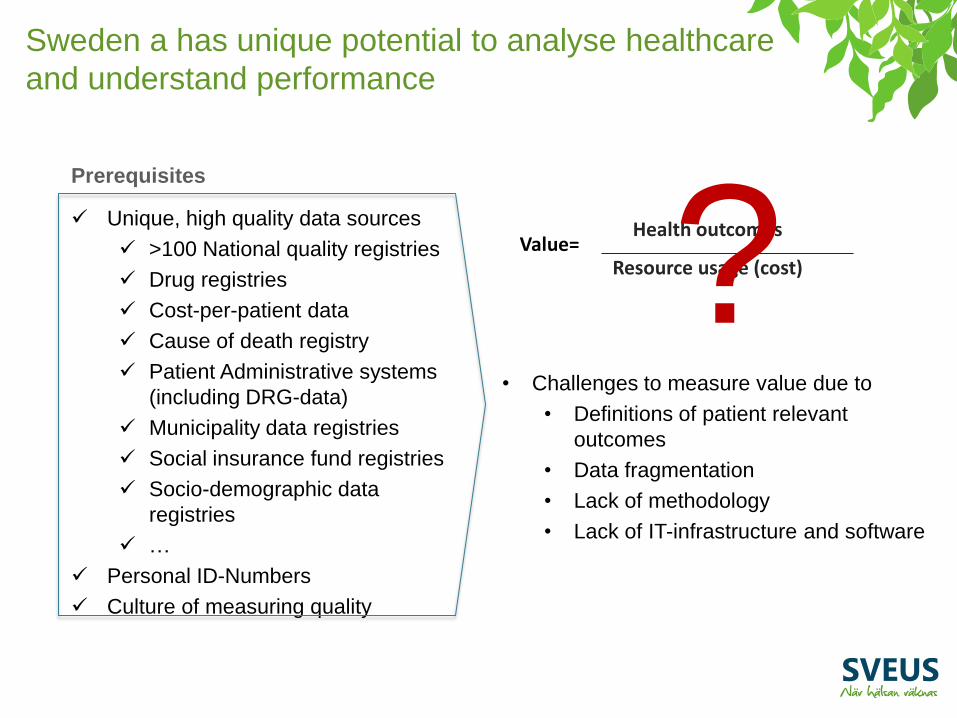
Sweden a has unique potential to analyse healthcare
and understand performance
Unique, high quality data sources
>100 National quality registries
Drug registries
Cost-per-patient data
Cause of death registry
Patient Administrative systems
(including DRG-data)
Municipality data registries
Social insurance fund registries
Socio-demographic data
registries
…
Personal ID-Numbers
Culture of measuring quality
Prerequisites
Value= Health outcomes
Resource usage (cost)
• Challenges to measure value due to
• Definitions of patient relevant
outcomes
• Data fragmentation
• Lack of methodology
• Lack of IT-infrastructure and software
?

• Development of methodology and IT-
systems to enable analysis and
monitoring of value in Swedish Health
care
• > 50 participating organizations
• Financed by MoH & 7 regions 2013 to
2017
• Initially covering 8 pilot patient groups and
>25 databases
Program objectives and scope Contribution to health care
system New analysis
platform
A new tool for professionals on all levels of the health
care system to identify potential to improve
performance!
In 2013, the Sveus program was established to
realize this potential

8
A broad approach was taken with both “general
components” and “patient group” specific
components
Descriptive
analytics
How are we
performing (in
terms of
value?)
Diagnostic
analytics
How can we
explain our
performance?
Prescriptive
analytics
How can we
improve our
performance?
New analysis capacity
…
Spine surgery
Logic for monitoring
of stroke care
Patient group components
Legal aspects
Health care informatics
Technical infrastructure
Method for analysis
General components
9
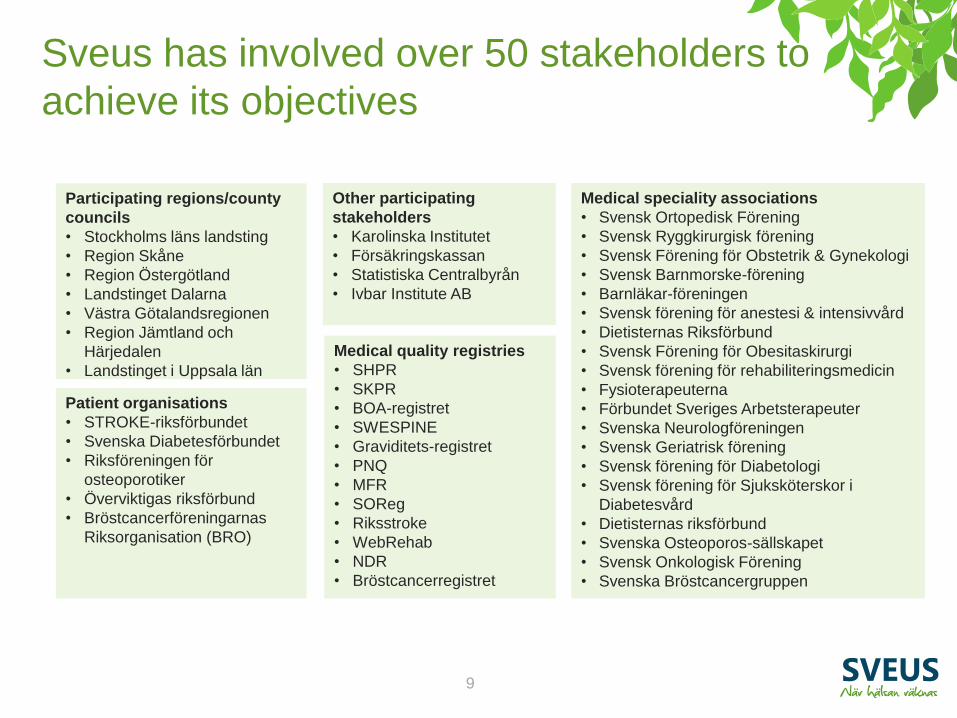
Sveus has involved over 50 stakeholders to
achieve its objectives
Participating regions/county
councils
• Stockholms läns landsting
• Region Skåne
• Region Östergötland
• Landstinget Dalarna
• Västra Götalandsregionen
• Region Jämtland och
Härjedalen
• Landstinget i Uppsala län
Medical quality registries
• SHPR
• SKPR
• BOA-registret
• SWESPINE
• Graviditets-registret
• PNQ
• MFR
• SOReg
• Riksstroke
• WebRehab
• NDR
• Bröstcancerregistret
Patient organisations
• STROKE-riksförbundet
• Svenska Diabetesförbundet
• Riksföreningen för
osteoporotiker
• Överviktigas riksförbund
• Bröstcancerföreningarnas
Riksorganisation (BRO)
Medical speciality associations
• Svensk Ortopedisk Förening
• Svensk Ryggkirurgisk förening
• Svensk Förening för Obstetrik & Gynekologi
• Svensk Barnmorske-förening
• Barnläkar-föreningen
• Svensk förening för anestesi & intensivvård
• Dietisternas Riksförbund
• Svensk Förening för Obesitaskirurgi
• Svensk förening för rehabiliteringsmedicin
• Fysioterapeuterna
• Förbundet Sveriges Arbetsterapeuter
• Svenska Neurologföreningen
• Svensk Geriatrisk förening
• Svensk förening för Diabetologi
• Svensk förening för Sjuksköterskor i
Diabetesvård
• Dietisternas riksförbund
• Svenska Osteoporos-sällskapet
• Svensk Onkologisk Förening
• Svenska Bröstcancergruppen
Other participating
stakeholders
• Karolinska Institutet
• Försäkringskassan
• Statistiska Centralbyrån
• Ivbar Institute AB

10
The program organisation was set up with 12 sub-
projects with project ownership distributed between
the counties and regions
Local groups within county councils/regions
1- Expert group
Hip & knee (SLL)
Steering group consist of representatives of:
• Ministry of Health
• Each participating county council/region
• Swedish Association of Local Authorities and Regions (SKL)
• Karolinska Institutet
• Ivbar Institute AB
9- Technical implementation
Ad
jace
nt
rese
arch
3- Expert group
Child Birth (SLL)
5- Expert group
Stroke (Skåne)
7- Expert group Osteoporosis (Östergötland)
2- Expert group
Spine surgery (SLL)
4- Expert group
Bariatric surgery (VGR)
6- Expert group
Diabetes (Jämtland,
Dalarna)
8- Expert group
Breast Cancer (Uppsala)
Program office
10- FK/SCB
11- Trans. maintenance
12- Analysis patient groups
Functional network groups
Law &
Information security Communication
Health Care informatics
Reimbursement systems

11
Each patient group was treated as a
separate research project
System specification for configuration of analysis platform
Benchmarking report
Publications
1. Define patient group and sub
groups
2. Define patient relevant health
outcomes and other KPIs
3. Identify KPIs in historic data
4. Develop prediction models for
selected KPIs
5. Perform benchmarking on historic
data
1- Expert group
Hip & knee (SLL)
Output from each
group
12
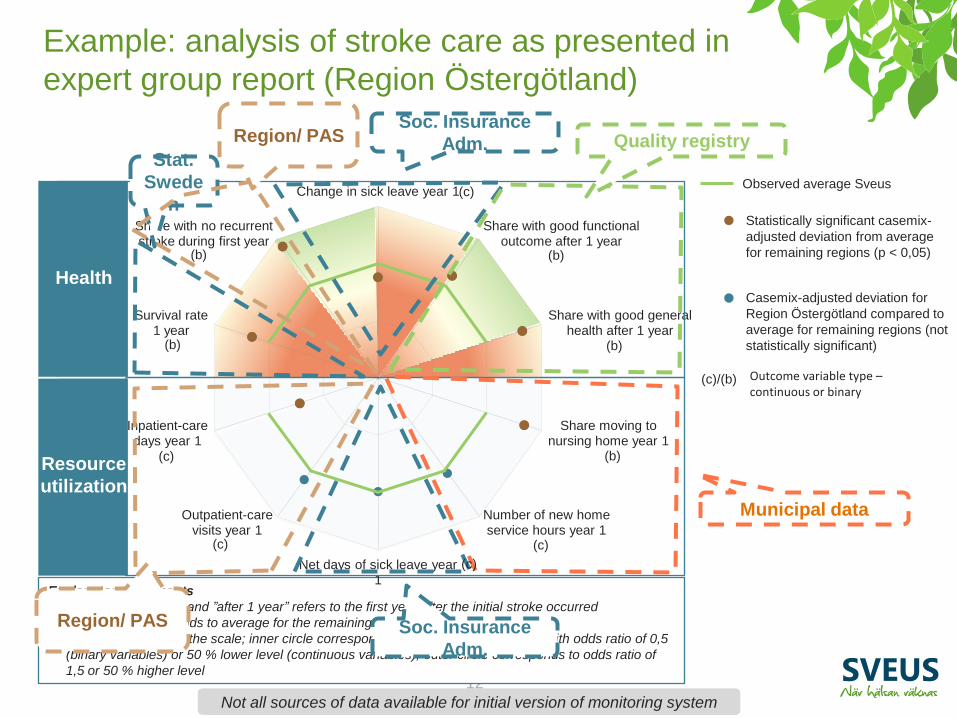
Example: analysis of stroke care as presented in
expert group report (Region Östergötland)
Explanatory comments
• ”First year”, ”year 1” and ”after 1 year” refers to the first year after the initial stroke occurred
• Green line corresponds to average for the remaining regions
• Grey circles indicate the scale; inner circle corresponds to deviation from average with odds ratio of 0,5
(binary variables) or 50 % lower level (continuous variables), outer circle corresponds to odds ratio of
1,5 or 50 % higher level
Change in sick leave year 1
Share with good functional outcome after 1 year
Share with good general health after 1 year
Share moving to nursing home year 1
Number of new home service hours year 1
Net days of sick leave year 1
Outpatient-care visits year 1
Inpatient-care days year 1
Survival rate 1 year
Share with no recurrent stroke during first year
Municipal data
Soc. Insurance
Adm.
Soc. Insurance
Adm. Stat.
Swede
n
Region/ PAS
Region/ PAS
Quality registry
Health
Resource
utilization
Observed average Sveus
(c)/(b) Outcome variable type – continuous or binary
Not all sources of data available for initial version of monitoring system
(c)
(b)
(b)
(c)
(b)
(b)
(b)
(c)
(c)
(c)
Statistically significant casemix-
adjusted deviation from average
for remaining regions (p < 0,05)
Casemix-adjusted deviation for
Region Östergötland compared to
average for remaining regions (not
statistically significant)

13
Example: analysis of stroke care as presented in
expert group report (Region Jämtland Härgedalen)
Change in sick leave year 1
Share with good functional outcome after 1 year
Share with good general health after 1 year
Share moving to nursing home year 1
Number of new home service hours year 1
Net days of sick leave year 1
Outpatient-care visits year 1
Inpatient-care days year 1
Survival rate 1 year
Share with no recurrent stroke during first year
Health
Resource
utilization
Explanatory comments
• ”First year”, ”year 1” and ”after 1 year” refers to the first year after the initial stroke occurred
• Green line corresponds to average for the remaining regions
• Grey circles indicate the scale; inner circle corresponds to deviation from average with odds ratio of 0,5 (binary
variables) or 50 % lower level (continuous variables), outer circle corresponds to odds ratio of 1,5 or 50 % higher
level
(c)
(b)
(b)
(c)
(b)
(b)
(b)
(c)
(c)
(c)

14
Example: analysis of stroke care as presented in
expert group report (Stockholm County)
Change in sick leave year 1
Share with good functional outcome after 1 year
Share with good general health after 1 year
Share moving to nursing home year 1
Number of new home service hours year 1
Net days of sick leave year 1
Outpatient care visits year 1
Inpatient care days year 1
Survival rate 1 year
Share with no recurrent stroke during first year
Health
Resource
utilization
(k)
(b)
(b)
(k)
(b)
(b)
(b)
(k)
(k)
(k)
Explanatory comments
• ”First year”, ”year 1” and ”after 1 year” refers to the first year after the initial stroke occurred
• Green line corresponds to average for the remaining regions
• Grey circles indicate the scale; inner circle corresponds to deviation from average with odds ratio of 0,5 (binary
variables) or 50 % lower level (continuous variables), outer circle corresponds to odds ratio of 1,5 or 50 % higher
level

15
Childbirth
Stroke
Hip/knee
arthoplasty
Spine
surgery
Obesity
surgery
Diabetes**
Improved health outcomes, # (%) Cost/ resource
use; MSEK
Reduction
perineal tears
# of patients
Reduced
Infections
# of patients
~1 600
(-30%)
~2 300
(-30%) length of stay 230
Ceasarion sections >800 MSEK
520
~830
(-40%)
Apgar<7
at 5 min
# newborns
Reduced
complications
(30 days)
# of patients
Red. severe
complication
(30 days)
# of patients
Reduced
complication
(31-730 days)
# of patients
~500
(-45%)
~160
(-80%)
~300
(-50%)
70
inpatient care
due to comp.
75
length of stay ~220
>350 MSEK
Pain relief # of patients
Back to
work (1y)
# of patients
Patient satisfaction
# of patients,
thousands
~2 100
(+25%)
~4 800
(+50%) ~1800
(+20%)
length of stay
Other direct
100
~1.500
sick-leave >1 600 MSEK
Direct
Indirect*
~250
(-40%) ~130
(-20%) 25
>400 MSEK
length of stay 375
Outpatient
visits Orthopedic hip
complications
# of patients
Orthopedic
knee
complications
# of patients
Non-orthopedic
complications
# of patients
~400
(+10%) ~240
(-30%) ~70
length of stay
>650 MSEK
140
Outpatient
visits
425
High level of
activity ability
# of patients
Re-occurrence
of stroke
# of patients
Good state
of health
# of patients
>400 MSEK
Other
Doctor visits 400
~370
(-50%)
~500
(+10%)
T Estimates. Detailed calculations with case-mix adjusted analysis available in Sveus reports at www.sveus.se
* Estimated sick-days for some patient groups (~1200 SEK/day)
** Examples based on type 2 diabetes
*** 1 ppt equals ~4000 SEK in avoided hospital care over 3 future years, when costs is measured as DRG points
~1,2ppt
(-7%) ~4 400
(-20%) Five-year risk
of heart
disease***
Absolute risk
Cardiovascular
hospital
admissions
# of patients Sick leave
# of days
~787 000
(-8%)
What if identified variation did not existT (not exhaustive)
Example of potential identified during development
of Sveus monitoring systems

Harmonization and calculation is performed centrally Information is pushed back locally
Not: Each provider owns and is responsible for its own data
to enable decision support on all levels of
the health care system to enable benchmarking and prediction
PAS-data
QR-data
Other data (i.e.
Insurance fund)
Integration
platform
Information model
Calculation
engine
Structured
data
Calculated
data
Technical specifications
(1 per patient group)
Providers BI-systems
For research
Other plattforms
Payers BI-systems
Sveus web-plattform
In the Sveus analytics platform, data is harmonized and
calculated centrally, and thereafter pushed back to local
BI-systems

In the new platform, performance analysis is
adjusted for case-mix (patient characteristics)
Importance of case-mix adjustment – Likelihood of successful
treatment in spine surgery
43%
84%
0%
10%
20%
30%
40%
50%
60%
70%
80%
90%
Patient 1 Patient 2
PA
IN G
ON
E O
R M
UC
H
IMP
RO
VE
D 2
YE
AR
S P
OS
T
SU
RG
ER
Y
• High school
• Outside EU
• Yes
• Yes
• University
• Within EU
• No
• No
Education
level
Country of
birth
Smoker
Co-
morbidities
Patientegenskap/
Casemix
Almost 50 difference in
expected outcomes

18
Demo of platform using historic bariatric surgery
data in Region Uppsala as example
• Question No 1 – How is Uppsala performing compared to other regions?
• Question No 2 – Where is potential to improve value?
• Question No 3 – How is patient characteristics affecting performance?
Should Uppsala focus improvement efforts on specific patient groups?
• Question No 4 – Can identified potential be addressed without expected
negative effects for patients
Caveat: System still under development

19
Live Demo

20
Demo of platform using historic bariatric
surgery data in Region Uppsala as example
• Question No 1 – How is Uppsala performing compared
to other regions?
– Well on health outcomes but potential to reduce resource use
• Question No 2 – Where is potential to improve value?
– For example by reducing Length of Stay (LoS)
• Question No 3 – How is patient characteristics
affecting performance? Should Uppsala focus
improvement efforts on specific patient groups?
– Uppsala has average case-mix and performance is not
different for any subgroups
• Question No 4 – Can identified potential be addressed
without expected negative effects for patients
– Yes, there does not seem to be any correlation between
shorter LoS and better outcomes
Potential to reduce
LoS for Bariatric
Surgery in Uppsala

Main challenges
• Coordination and engagement of 50+ organisations
– Keeping excitement from all stakeholders over time
• Data
– Harmonization and connection of many data sources
– Missing data
– Legal aspects of patient data analysis

Next steps
• Plan to move Sveus to permanent organization from 2018
(probably within SKL)
• Work led by Västra Götaland Region
• Adding more patient groups
• Breast cancer is piloted in 5 weeks (compared to 2 years)
• Connect all interested counties

Relevance for other countries: Denmark
performed a feasibility study in 2015 to evaluate
opportunity to move towards value based steering
and support models
1) Assess starting point and general prerequisites for Denmark to adopt
value-based steering and support models (based on learnings from
Sweden)
2) Assess potential and ‘ease of implementation’ through deep-
dives in selected patient groups (medical conditions)
Project objectives

Relevance for other countries: Potential and ease of
implementation was studied for selected patient
groups
Po
ten
tia
l
“Ease of implementation”
Reumathoid arthritis Stroke
Childbirth
Diabetes
Breast cancer
Prostate cancer
Multiple sclerosis
Obesity (surgery)
Knee-replacement
Hip-replacement
Approach (see appendix for details)
Summary of potential by disease
area
A
1 A
2
A
B
Burden of disease
Variation (cost and/or outcomes)
Synthesis “Ease of
implementation”
• Organizational complexity
• Data availability
INDICATIVE
Complex ‘Easy’
Hig
h
Low

Relevance for other countries: Danish Regions
decided to launch a nation-wide program in value
based steering
• Denmark has the general pre-requisites to deploy value based steering
models, with respect to:
Organisational readiness (interview-based)
Technical / data landscape (Swedish algorithms tested on Danish data)
Legal framework
Danish Regions decided in 2015 to initiate a nationwide program in value
based steering
