value chain analysis of the sea cucumber fishing industry
TRANSCRIPT

Value chain analysis of the sea cucumber fishing industry in Sri Lanka
D.C.T. Dissanayake & K. Dayarathne

oPracticed for several centurieso Confine to the north, east and northwest coastso Provides significant income to the coastal communitieso No tradition of consuming sea cucumbers in Sri Lanka o Entire harvest is processed as bêche-de-mer and exported to Singapore Taiwan China
~ 250 MtUS$ 11 million
SEA CUCUMBER FISHERY IN SRI LANKA

Beche-de mer production chain involves several stake holders No detailed work on value chain analysis of sea cucumber
industry in Sri Lanka
So this study aimed to carry out
Comprehensive analysis of value chain of the sea cucumber fishing industry in Sri Lanka
critical factors within and outside of each link in the chain affecting their inputs, activity, production and marketing
Identify potential solutions to the critical factors

•Key players in the sea cucumber fishing industry in Sri Lanka were identified
•Following two approaches were carried to collect dataExisting literature and secondary data
• General information on sea cucumber fishing industry and market structure
Questionnaires, focus group discussion and semi structured interviews • To gather information on existing value chain from harvest to
consumption
•Data were collected from February 2014 to January 2015
METHODOLOGY – DATA COLLECTION

Sample frame used to collect required data
Link in supply chain
Location Number consulted
during study
Total operating
Diver/boatowners
(Questionnaires)
Northwest coast (Kalpitiya & Mannar)
North coast (Jaffna)
Northeast (Mullaithieve)
East coast (Trincomalee, Batticoloa andKalmunei)
45
38
47
29
~250
~109
~187
~59Diver non-boatowners
(Focus groupinterview)
Northwest coast (Kalpitiya & Mannar)
North coast (Jaffna)
Northeast (Mullaithieve)
East coast (Trincomalee, Batticoloa andKalmunei)
71
47
62
44
~650
~347
~480
~128

Link in supply chain
Location Number consulted
during study
Total operating
Collectors(Questionnaires)
Northwest coast (Kalpitiya & Mannar)North coast (Jaffna)Northeast (Mullaithieve)East coast (Trincomalee, Batticoloa andKalmunei)
4
443
13
686
Processors(Questionnaires)
Northwest coast (Kalpitiya & Mannar)North coast (Jaffna)Northeast (Mullaithieve)East coast (Trincomalee, Batticoloa andKalmunei)
3
343
6
554
Processor/exporters
(Questionnaires)
Puttalam
Colombo
1
2
2
4
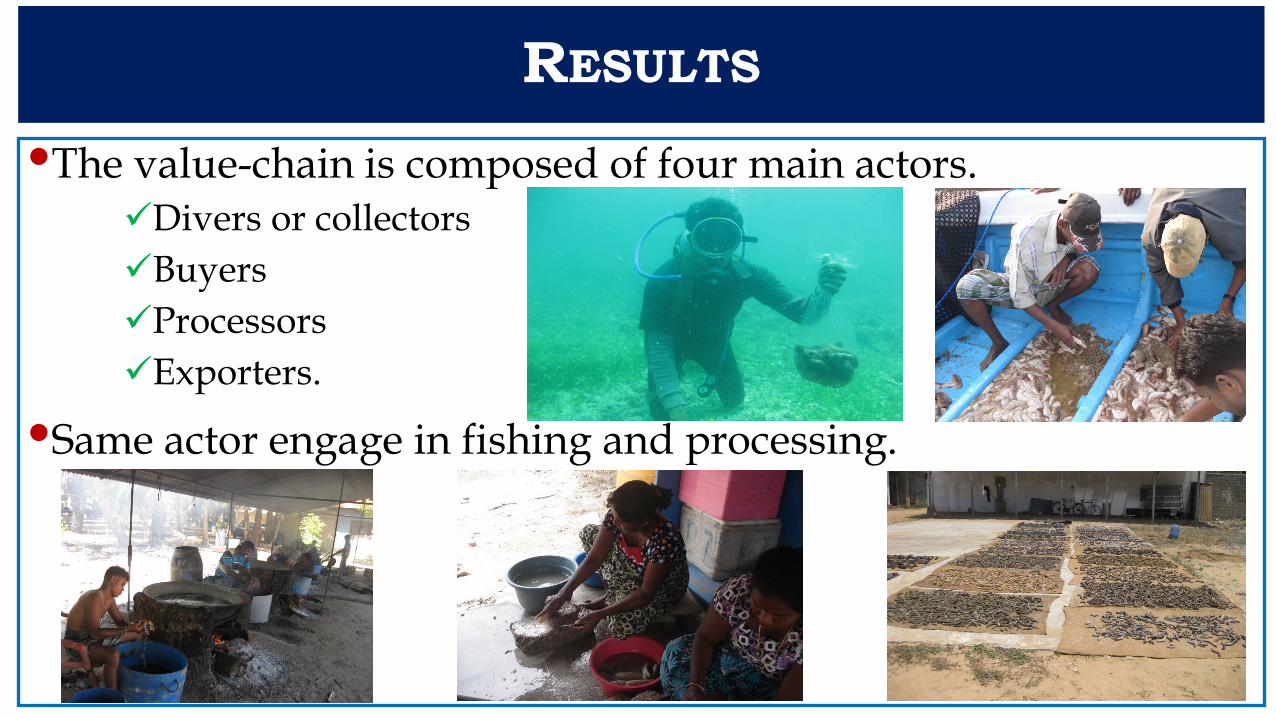
•The value-chain is composed of four main actors.Divers or collectorsBuyersProcessors Exporters.
•Same actor engage in fishing and processing.
RESULTS

•~3,300 to 3,600 divers engage in sea cucumber fishery
•Practice both skin (3%) and SCUBA divingSCUBA diving - 2 to 3 divers are onboard
Skin diving 5-7 divers are onboard
•Day and night fishing activities
•No or very low postharvest losses
•Selling their catch immediately on landing to buyers
•Women do not involve in diving activities
1. DIVERS

•Diversstrong social interaction between themshare information and support each otherpositive and enthusiastic feeling on their job away for around 5-6 hours per day skill and knowledge to assess whether sea cucumbers are mature
enough aware on the value of each species skills to do fishing at night do not complain about national security issues
•Night fishing generates higher income than day fishing

Operational InformationSea cucumber pieces per trip (day) 49Average daily income per boat (day) 5,865.00Average daily income per boat from sea cucumbers (day) 4,067.00Average daily income per boat from other sources (day) 1,798.00Average number of fishing trips per boat per year (Scuba) 127Average number of boats operated for sea cucumber fishery 227Annual income per boat from sea cucumbers 516,509.00
Capital investmentBoat investment cost 133,764.00Engine investment cost 230,700.00Others (Fins, masks, O2 tanks, etc.) 79,000.00
Operational cost / yrDaily operational cost 2,757.00Annual operational cost 350,139.00
Operational costs / yr as percentageFuel as % of operational costs 55O2 cylinders as % of operational costs 18Boatman as % of operational costs 20Others as % of operational costs 7
Fixed / investment costAnnual depreciation 78,527.00Boat as % of investment cost 35Engine as % of investment cost 52Others as % of investment cost 13
Net income from sea cucumber operation 166,370.00Net income per day 1,310.00Annual net profit 87,843.00
Operational InformationSea cucumber pieces per trip (day) 107Average daily income per boat (day) 10,260.00Average daily income per boat from sea cucumbers (day) 9,737.00Average daily income per boat from other souces (day) 523.00Average number of fishing trips per boat per year (Scuba) 92
Average number of boats operated for sea cucumber fishery 254Annual income per boat from sea cucumbers 895,804.00
Capital investmentBoat investment cost 133,764.00Engine investment cost 230,700.00Others (Fins, masks, O2 tanks, ectc) 79,000.00
Operational cost / yrDaily operational cost 2,233.00Annual operational cost 205,436.00
Operational costs / yr as percentageFuel as % of operational costs 55O2 cylinders as % of operational costs 18Boatman as % of operational costs 20Others as % of operational costs 7
Fixed / investment costAnnual depreciation 78,527.00Boat as % of investment cost 35Engine as % of investment cost 52Others as % of investment cost 13
Net income from sea cucumber operation 690,368.00Net income per day 7,504.00Annual net profit 611,841.00
Cost and benefits associated with day diving (LKR) Cost and benefits associated with night diving (LKR)
1 LKR=
140 US$

Summary analysis: Diver ResultsOperational informationBDM catch val/trip Rs 8,088 Total catch val/trip Rs (BDM and chank) 15,202 No. trips/yr 113 BDM as % total sales 55%Pieces of BDM per season 7,765 Average price per piece of BDM 88 BDM pieces/trip 80Boat investment cost 130,714 Engine investment cost 229,524 Other (fins, masks, suits etc) 71,957 Average employment during season per boat 2.7Sales revenues/yr RsValue BDM 679,623 Value/kg (live weight) 244
Operational costs/yr (BDM+chank) RsOperational costs 834,179 Fuel as % of op costs 52%Cylinders as % of op costs 18%Boatman as % of op costs 22%Battery as % of op costs 3%Other as % of op costs 5%Operational profits RsOperational profits on BDM catch (with op costs shared with chank) 262,534 Operational profit as % of sales on BDM catches (with op costs shared equally with Chank) 38.6%Fixed/investment costs (BDM+chank)Annual depreciation 75,698 Boat as % of invest costs 30%Engine as % of invest costs 54%Other as % of invest costs 16%Net profitNet profits on BDM catch with op + invest costs shared with chank 224,684
Net profit as % of sales on BDM catches (with op + investment costs shared equally with Chank) 33.1%
Annual costs and earnings model Diver

Critical issues faced by divers and proposed solutions
Issues Solutions1 High fuel costs Sea ranching, associated culture
technologies, trainingand capital from government
2 Declining quantity of wild catch
Collecting very small sizes of sea cucumbers or juveniles which command very low prices
Divers have to go deeper areas for catch seacucumbers
Control license, introduce size limitand quota system
Introduce and strength searanching programme
Promote artificial breeding and seacucumber culture activities
3 Conflicts among wild sea cucumbercollectors and sea cucumber farmers
Ensure security of sea farms
Prohibit fattening of wild collectedsea cucumber juveniles
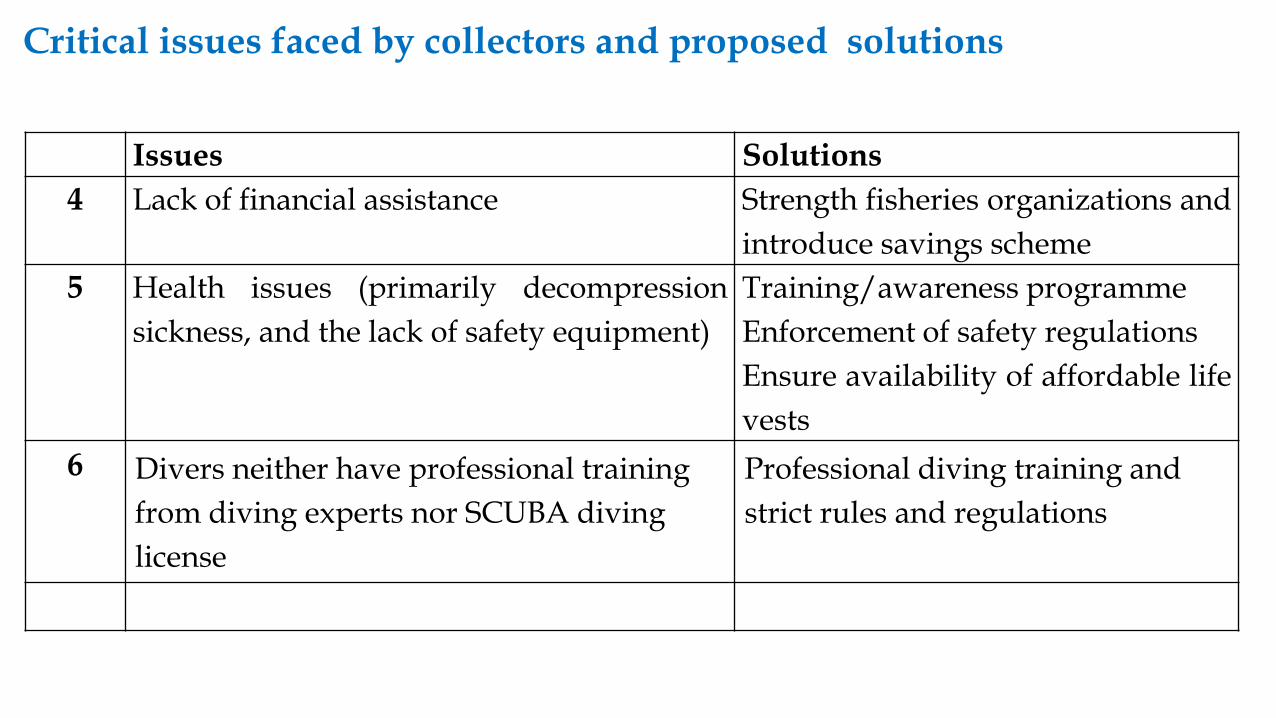
Critical issues faced by collectors and proposed solutions
Issues Solutions4 Lack of financial assistance Strength fisheries organizations and
introduce savings scheme5 Health issues (primarily decompression
sickness, and the lack of safety equipment)Training/awareness programmeEnforcement of safety regulationsEnsure availability of affordable lifevests
6 Divers neither have professional training from diving experts nor SCUBA diving license
Professional diving training and strict rules and regulations
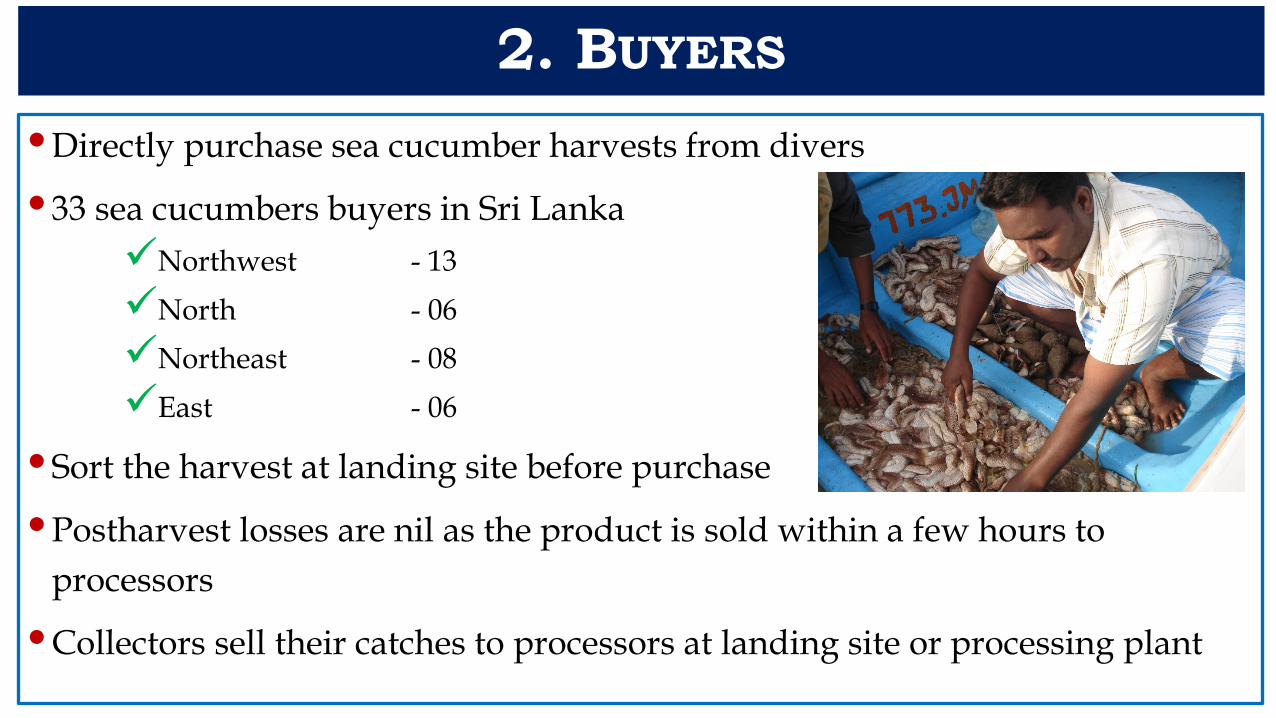
• Directly purchase sea cucumber harvests from divers
• 33 sea cucumbers buyers in Sri LankaNorthwest - 13North - 06Northeast - 08East - 06
• Sort the harvest at landing site before purchase
• Postharvest losses are nil as the product is sold within a few hours to processors
• Collectors sell their catches to processors at landing site or processing plant
2. BUYERS

•Activities are fairly simpleBuying sea cucumbers from divers
Store it few hours before sale
•Processors organize their own transport
•Operation costs for collectors are limited Purchase sea cucumbers
•Sometime processors directly purchase catches from divers
2. BUYERS

Summary analysis: Collector ResultsSales revenues/yr Rspieces 73,250 liveweight kg 34,112 sales revenue Rs 9,112,500 average price/kg Rs 267 Operational costs RsFish purchases 8,511,075 Operational profit RsOperational profit 601,425 Operating margin 6.6%Operating profit/kg 17.6Operating profit/pc 8.2Investment costs Rsannual depreciation buildings, storage facilitie 17,375 Net profit Rsnet profit on BDM sales 584,050 net margin on BDM sales 6.4%
Annual costs and earnings model
Buyer

Critical issues faced by buyers and proposed solutions
Issues Proposed solutions1 Declining quantity of catch Sea ranching, associated culture
technologies, control license,introduce size limit and quotasystem
2 Highly variable market price for seacucumber species
Introduce relatively fix price foreach species

•Processing steps found to be similar in all areas
•Major processing steps involveEvisceration
Boiling
Salting
cleaning
sun drying
•Some modifications from species to species
3. PROCESSORS

1. Evisceration
2. Boiling

Boiled Products
Salting Removing chalky
materials

Sun drying Processed product
o Processing may take 3 to 7 dayso Processors keep processed products ~7 days before sellingo Postharvest losses is around 10 – 12 % due to spoiling and damage o Both commercial and domestic level processing o Twenty processing plants at commercial scale
Northwest - 6 North - 5Northeast - 5East - 4
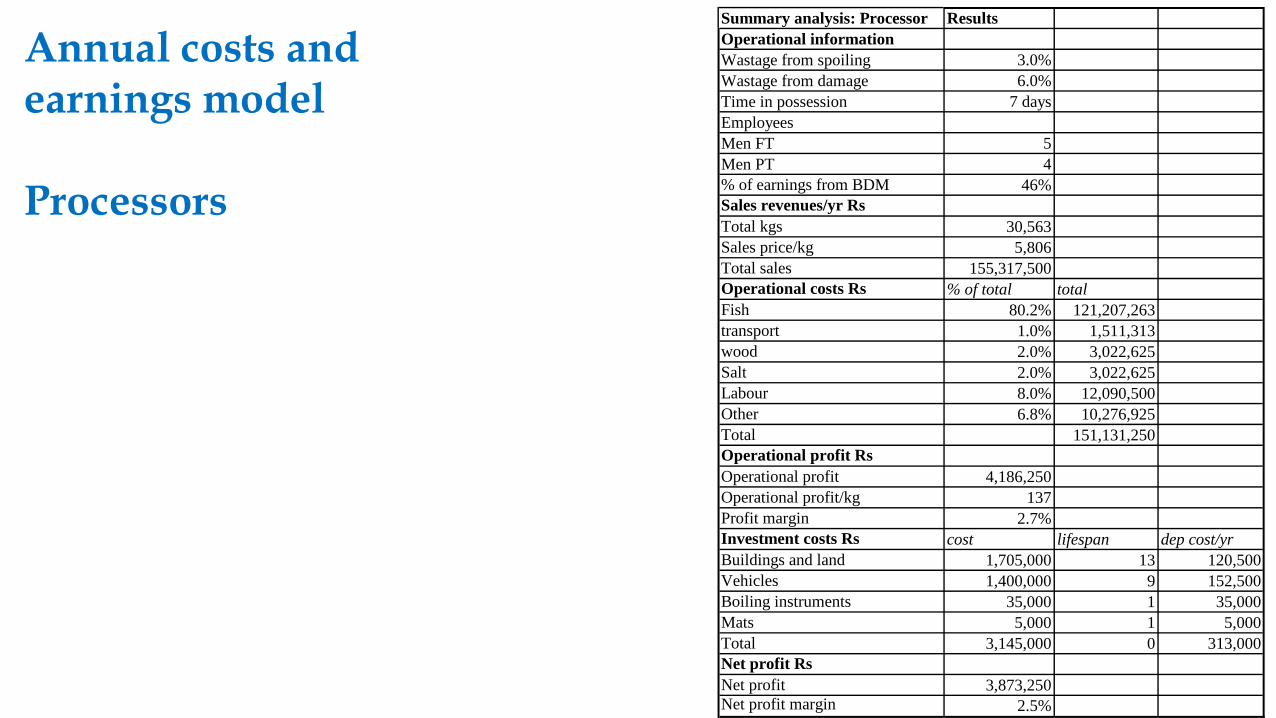
Summary analysis: Processor ResultsOperational informationWastage from spoiling 3.0%Wastage from damage 6.0%Time in possession 7 daysEmployeesMen FT 5Men PT 4% of earnings from BDM 46%Sales revenues/yr RsTotal kgs 30,563Sales price/kg 5,806Total sales 155,317,500Operational costs Rs % of total totalFish 80.2% 121,207,263transport 1.0% 1,511,313wood 2.0% 3,022,625Salt 2.0% 3,022,625Labour 8.0% 12,090,500Other 6.8% 10,276,925Total 151,131,250Operational profit RsOperational profit 4,186,250Operational profit/kg 137Profit margin 2.7%Investment costs Rs cost lifespan dep cost/yrBuildings and land 1,705,000 13 120,500Vehicles 1,400,000 9 152,500Boiling instruments 35,000 1 35,000Mats 5,000 1 5,000Total 3,145,000 0 313,000Net profit RsNet profit 3,873,250Net profit margin 2.5%
Annual costs and earnings model
Processors

Critical issues faced by processors and proposed solutions
Issues Possible solutions1 Declining quantity of sea cucumber catch Sea ranching, associated culture
technologies, Control license,introduce size limit and quotasystem
2 Poor processing practices and high levelof postharvest losses
Develop guidelines on bestpractices for sea cucumberprocessing and conduct trainingsessions for sea cucumberprocessors.
3 Declining of sale prices Need to produce high qualitybêche-de-mer.
4 Increasing of all input costs related toprocessing
No obvious solution to this issuebut margins can be protectedthrough improvements inprocessing standards

• Two major exporters and 11 small companies
• Exporters need licenses
• Major exporters have their own suppliers, collectors and processing plants
• In some instances, fresh or partially processed sea cucumbers are imported and beche-de-mer is re-exported
• Imports are sourced from Maldives (around 85% of yearly quantities), Nigeria (around 10%), Somalia and the United Arab Emirates
• Properly documented import quantities are not available.
• Main exporters are Hong Kong (40%), Singapore (32%) Malaysia (10%) and Taiwan (18%).
4. EXPORTERS

Export quantities of Beche-de-mer from Sri Lanka and annual income earned
Export volume in 2013 was 260 MtEarned 1351.00 million rupees and this is the reported highest income since the start of this
industry

Summary analysis: Export sectorOperational informationExchange rate Rs:1$ 117Weight loss from drying on imports for re-export 5%Weight loss on local product 2%% of product air frieghted 50%% of product sea freighted 50%Export sales % value Singapore 30% Hongkong/China 39% Malaysia 11% Taiwan 18% Other 2%Imports for re-exports % of value Male 85% 54,647 Nigeria 10% 6,429 Other (UAE, Somalia) 5% 3,215 Total 64,290 % of SL product from Kalpitya 40%
Species composition of sales values 40% BDM 50% Chank10% Shark fins/other
average price/kg 7,391
Sales revenues/yr Rs total kgs total sales
Total 179,460 1,326,397,833 Re-exports 61,076 Sri Lankan caught product 118,385 NW product 47,354 Operational costs/yr Rs unti costs/kg total % of totalAir freight 146 13,123,013 1.1%Sea freight 2 209,968 0.0%Labour 9 1,679,746 0.1%Finance costs 74 13,333,333 1.1%Cash advances to sector 163 29,250,000 2.4%Fish purchases 6,530 1,171,873,800 94.6%Packing materials 2 419,936 0.0%Other 50 8,973,000 0.7%Total 6,978 1,238,862,796 100.0%Operational profits RsOperational profit 87,535,037 Operational profit/kg 488Profit margin 6.6%Investment costs RsVehicles, land, buildings 66,666,667 Annual depreciation 4,444,444 Net profit RsNet profit 83,090,593 Net profit/kg 463 Net profit margin 6.3%
Annual costs and earnings model – Export Sector
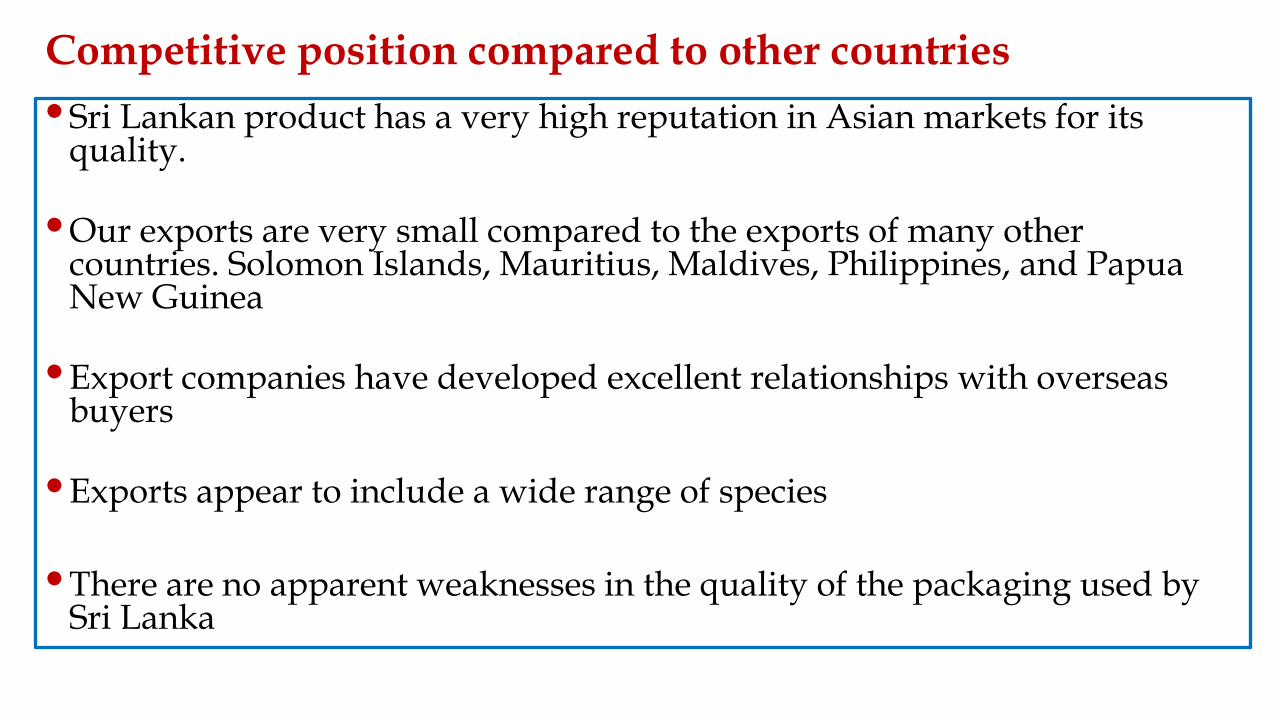
Competitive position compared to other countries• Sri Lankan product has a very high reputation in Asian markets for its
quality.
• Our exports are very small compared to the exports of many other countries. Solomon Islands, Mauritius, Maldives, Philippines, and Papua New Guinea
• Export companies have developed excellent relationships with overseas buyers
• Exports appear to include a wide range of species
• There are no apparent weaknesses in the quality of the packaging used by Sri Lanka

Critical issues faced by exporters and proposed solutions
Issues Possible solutions1 Export markets reluctant to buy some
species (due to processing quality andmarket demand)
Proper negotiation with overseasbuyers
2 Continuously fluctuation of species pricedue to high competition
Improve processing andmarketing strategies
3 Seasonality of supply Need to produce high qualitybêche-de-mer.
4 No centralized market, have to dependon intermediate buyers
Improve marketing strategies andmake necessary steps to deal withbuyers in the central marketrather than going through severalintermediate buyers

DIVERS / COLLECTORS
EXPORTERS
INPUTSUPPLIERS
FuelFishing
implements
Buyers
Agents
Processors
Buying stations
SUPPORTSERVICES
Local & international
transport
Financial services
INTERNATIONAL
Commerce
Exchange
Traders
Industries
Wholesalers
Retailers
SUPPORTINGAND
REGULATORYAUTHORITIES
Ministry of Fisheries
NARA
Navy
Cooperative societies
Stakeholder InteractionsDivers are key upstream player
Exporters are key downstream player

Diver / Collector
Intermediate buyers / Processors
Processors
ExporterDomestic processors
Local trader
International market
6 – 8 hours
1 – 2 hours
3 – 8 days
1 – 7 days
1-3 months1-3 days
Product Flow
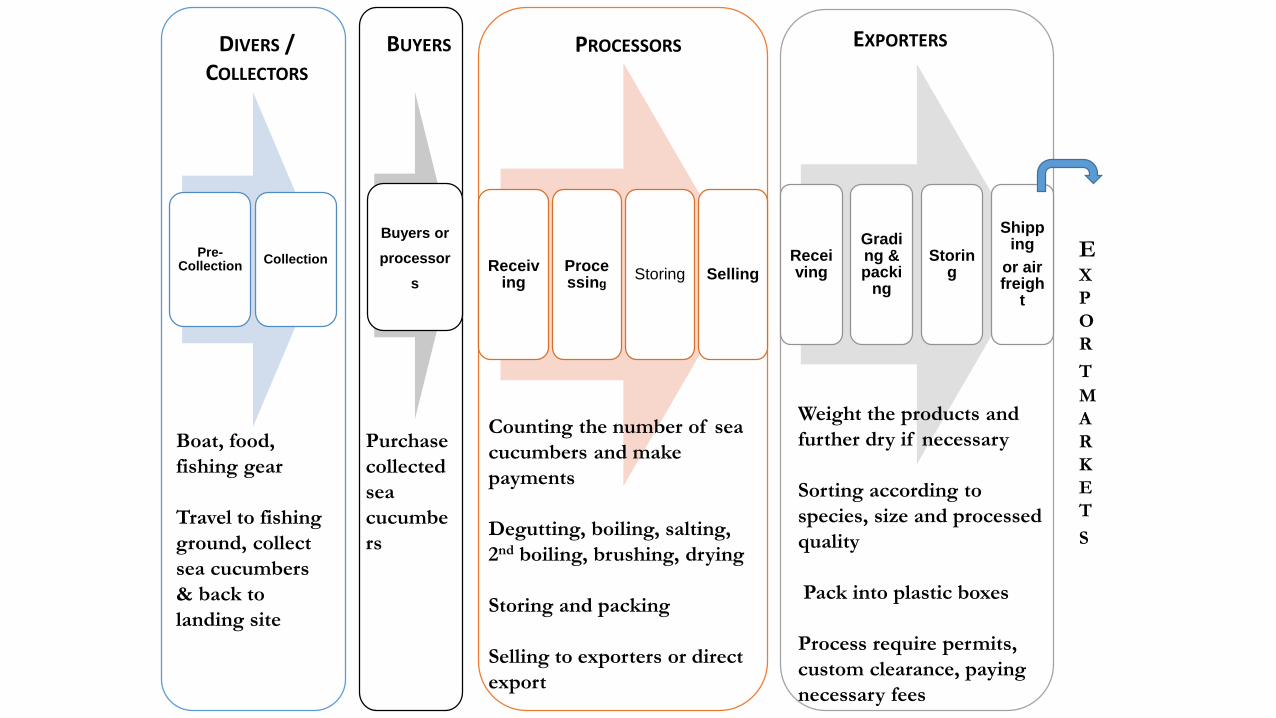
DIVERS / COLLECTORS
Receiving
Processing Storing Selling
PROCESSORS
Receiving
Grading & packi
ng
Storing
Shipping
or air freigh
t
EXPORTERS
Buyers or processor
s
Pre-Collection Collection
BUYERS
Boat, food, fishing gear
Travel to fishing ground, collect sea cucumbers & back to landing site
Purchase collected sea cucumbers
Counting the number of sea cucumbers and make payments
Degutting, boiling, salting, 2nd boiling, brushing, drying
Storing and packing
Selling to exporters or direct export
EXPORTMARKETS
Weight the products and further dry if necessary
Sorting according to species, size and processed quality
Pack into plastic boxes
Process require permits, custom clearance, paying necessary fees

•Replace SCUBA diving
• Impose size regulation
•Standard processing protocols for each and every species
•Training workshops on processing
•Build direct relationship between collectors, processors and exporters.
•Develop efficient way of getting market and price information on beche-de-mer
•Product development
•Promotion of culture practices
VALUE CHAIN UPGRADING
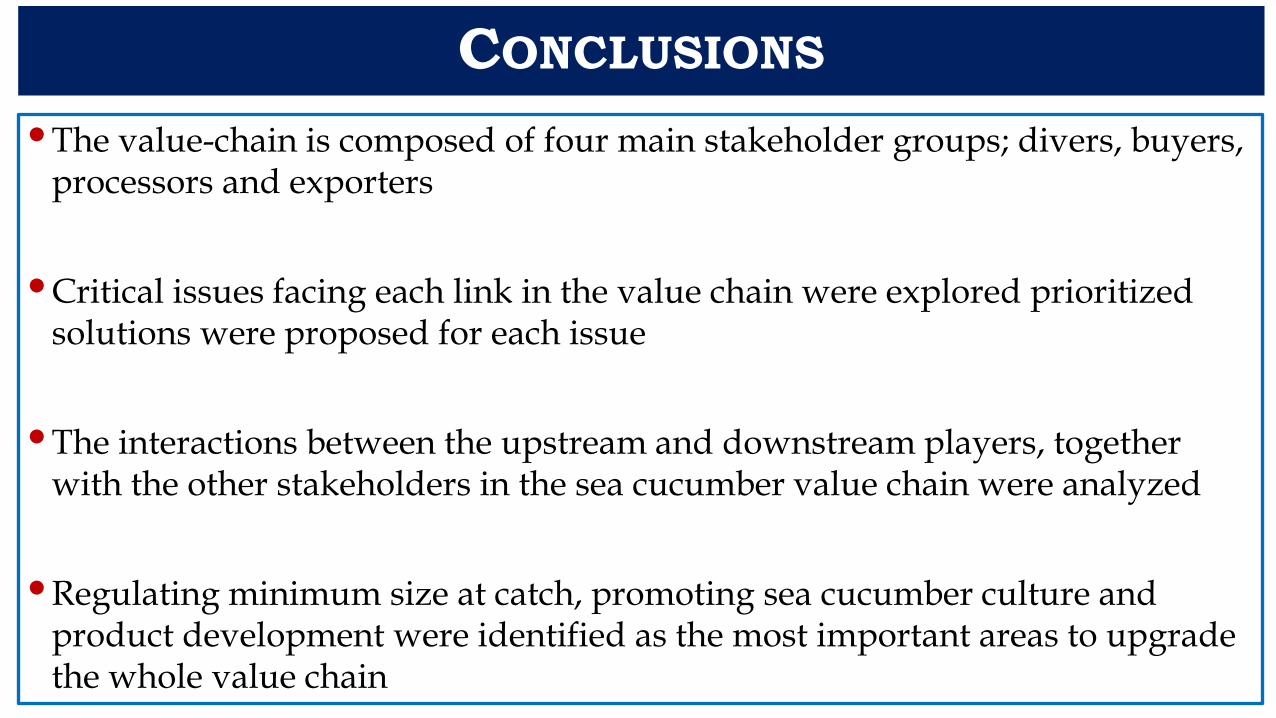
• The value-chain is composed of four main stakeholder groups; divers, buyers, processors and exporters
• Critical issues facing each link in the value chain were explored prioritized solutions were proposed for each issue
• The interactions between the upstream and downstream players, together with the other stakeholders in the sea cucumber value chain were analyzed
• Regulating minimum size at catch, promoting sea cucumber culture and product development were identified as the most important areas to upgrade the whole value chain
CONCLUSIONS

This study was supported by research grant ASP/06/RE/SCI/2013/18, University of Sri Jayewardenepura,
Gangodawila, Nugegoda, Sri Lanka
The United Nations University-Fisheries Training Programme(UNU-FTP) for providing me financial assistance to participate
this programme
Acknowledgement

35
THANK YOU