value driven six sigma - mc associates incmcassociatesinc.com/pdf/building champions 6sigma applied...
TRANSCRIPT

Six Sigma Applied to Human Resources
Building Champions
January 26, 2010
Sharon GregoryHexagon Solutions and Beyond, [email protected]
Michael A. CouchMichael Couch & Associates Inc.412-952-9036Michael@mcassociatesinc.comwww.mcassociatesinc.com

2
Workshop Objectives
• Understand the basic concepts and techniques of Six Sigma
• Know how to identify and select HR projects that will have an impact on the business
• Experience real-life examples of successful HR Six Sigma Projects
• Understand the role that HR can play in Six Sigma

3
Workshop Objectives
• Understand the basic concepts and techniques of Six Sigma
• Know how to identify and select HR projects that will have an impact on the business
• Experience real-life examples of successful HR Six Sigma Projects
• Understand the role that HR can play in Six Sigma

History of Six Sigma
•
Originated in the early 1980’s at Motorola.
TQM was not achieving the desired results.
•
Focused on reducing product and process variability in order to prevent defects.
•
Used to achieve the goal of “doing it right the first time”.
•
Established and communicated the process they termed “Six Sigma”.

What Is Six Sigma?
Six Sigma is a variation reduction process used by cross-functional
project teams to improve customer satisfaction, create revenue growth &
reduce costs.
Six Sigma will DRAMATICALLY improve the BOTTOM LINE!
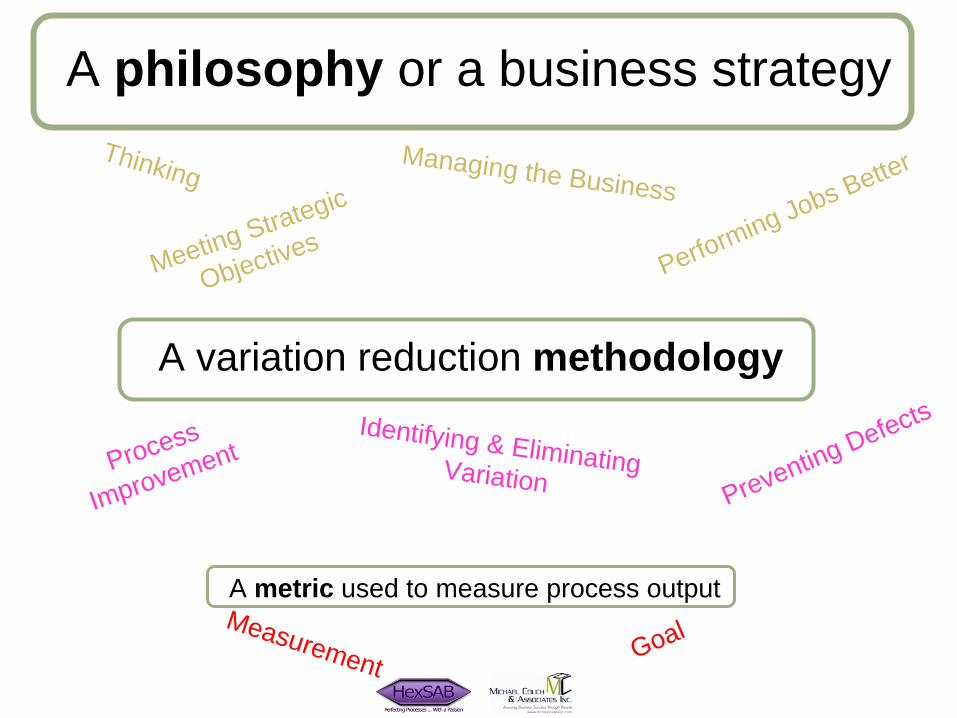
A philosophy or a business strategy
A variation reduction methodology
A metric used to measure process output
ThinkingManaging the Business
Performing Jobs Better
Meeting Strategic
Objectives
Process
ImprovementIdentifying & Eliminating Variation Preventing Defects
Measurement Goal

Six Sigma: A Philosophy
Six Sigma: A philosophy or business strategy for achieving
Operational Excellence within manufacturing and business processes.
Operational Excellence: Understanding customer expectations and meeting them with a high quality product
and/or service.

Six Sigma: A Methodology
•
Statistical “Tool Box”
including:Measurement System Evaluations
Control Charts
Hypothesis Testing
Components of Variation Studies
Design of Experiments
Analysis of Variance
Regression Analysis
Capability Studies
•
“Roadmap”
for gaining process knowledge:
Define, Measure, Analyze, Improve, Control
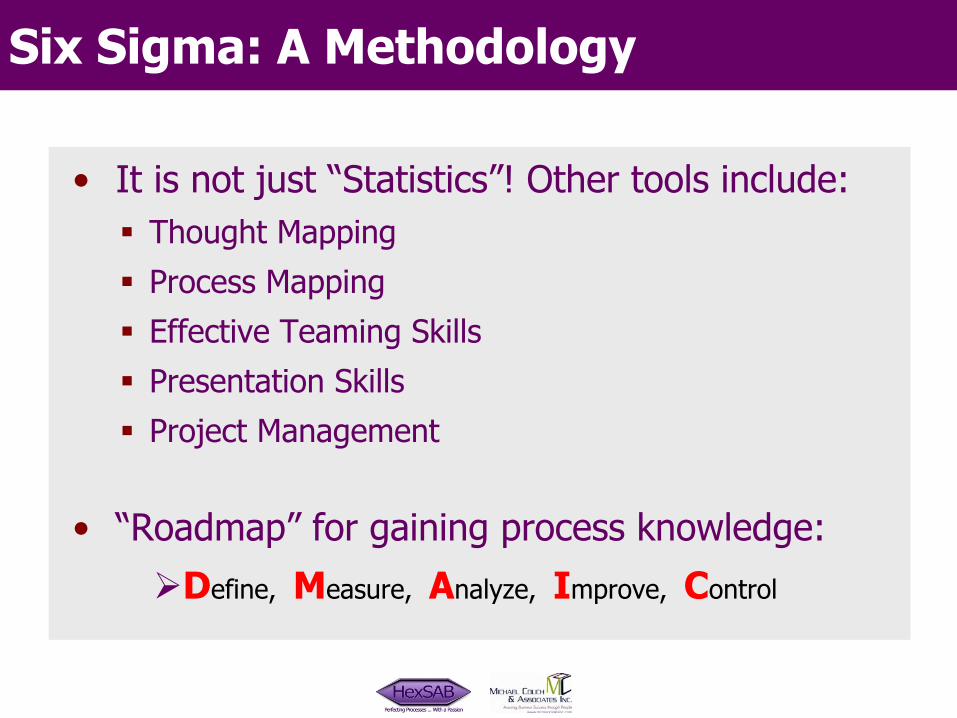
Six Sigma: A Methodology
•
It is not just “Statistics”! Other tools include:
Thought Mapping
Process Mapping
Effective Teaming Skills
Presentation Skills
Project Management
•
“Roadmap”
for gaining process knowledge:
Define, Measure, Analyze, Improve, Control

DEFINE
MEASURE
ANALYZE
IMPROVE
CONTROL
Six Sigma DMAIC
Methodology

DMAIC -
Define
DEFINE
the project (i.e. the process improvement opportunity):
•
Develop a clear definition of the project opportunity.
•
Collect background information on the current process & the customers’
needs/requirements.

DMAIC -
Measure
MEASURE
the current situation:
•
Gather data/information on the current situation (baseline) to provide a clearer focus for the improvement effort.
•
Verify integrity of the data.

DMAIC -
Analyze
ANALYZE
to identify causes:
•
Identify the root causes of defects & variation.
•
Confirm them with data.

DMAIC -
Improve
IMPROVE by implementing solutions:
•
Develop, test and implement solutions that address root causes.
•
Use data to evaluate results for the solutions and the plans used to carry them out.

DMAIC -
Control
CONTROL:
•
Maintain the gains that have been achieved
Standardizing work procedures or processes
•
Anticipate future improvements
•
Preserve the lessons learned from this improvement effort
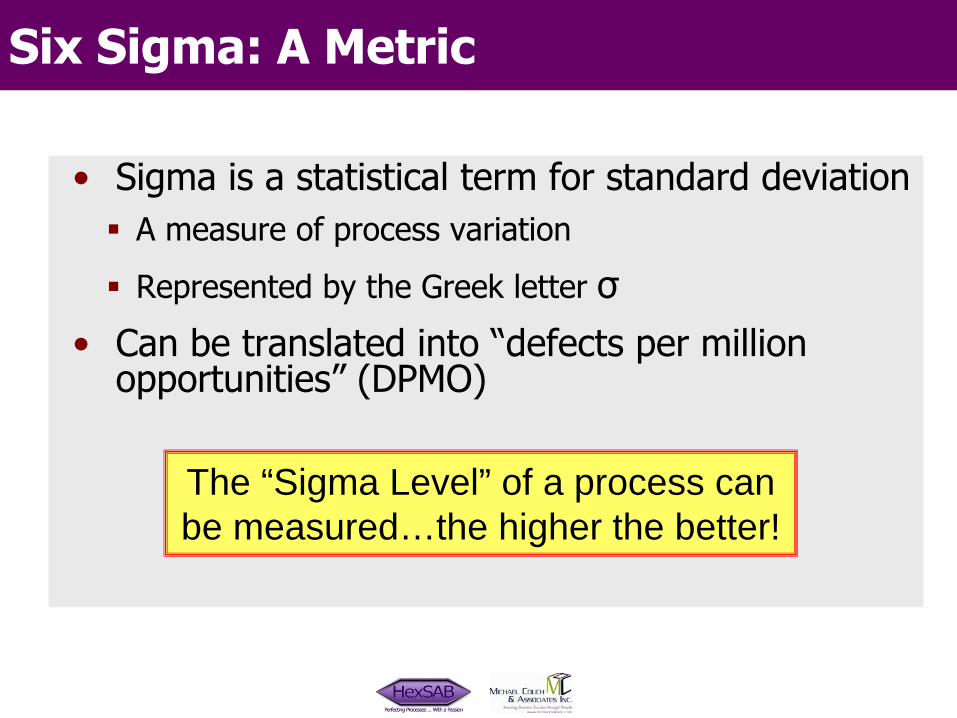
Six Sigma: A Metric
•
Sigma is a statistical term for standard deviation
A measure of process variation
Represented by the Greek letter σ
•
Can be translated into “defects per million opportunities”
(DPMO)
The “Sigma Level” of a process can be measured…the higher the better!

Practically Speaking…
Where do you think your processes are?
20,000 lost articles of mail/hour
Seven lost articles/hour
Two short/long landings/day
One short/long landing/five years
200,000 wrong drug prescriptions/year
Sixty-eight wrong drug prescriptions/year
Four Sigma Six Sigma

•
Identify, isolate, and eliminate variation.
•
Prevent defects rather than detect defects.
•
Problem solve pro-actively instead of “fire- fighting”.
The Six Sigma Goal
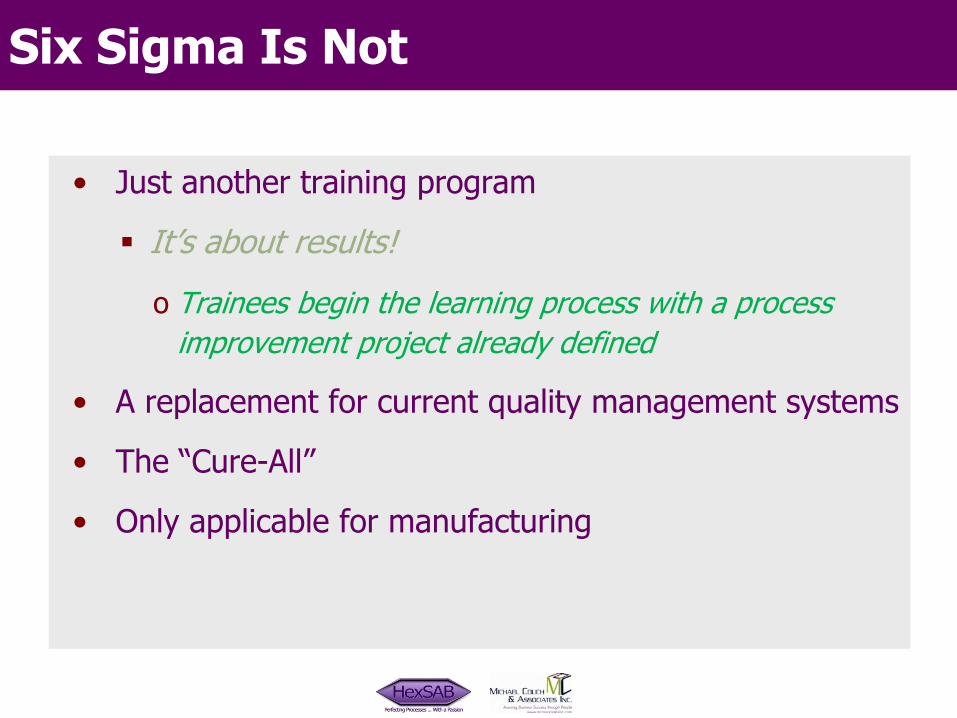
Six Sigma Is Not
•
Just another training program
It’s about results!
o
Trainees begin the learning process with a process improvement project already defined
•
A replacement for current quality management systems
•
The “Cure-All”
•
Only applicable for manufacturing

… Lord Kelvin
Data/Knowledge Is Power!
•
We don’t know what we don’t know.
•
If we can’t express what we know in the form of numbers, we don’t know much about it.
•
If we don’t know much about it, we can’t control it.
•
If we can’t control it, we are at the mercy of chance!

Do We Measure the Right Things?

Benefits to Be Expected
•
A Common language and set of tools for strengthening systems & processes
•
An effective method for data-driven decision making
•
Bottom-line improvements:
Cost savings, profits, quality, growth, customer satisfaction
Each 6σ
project is expected to have business benefits
o
From $5,000 to over $1,000,000 in annual savings
o
An average “Green Belt”
project can save approximately $50K
o
An average “Black Belt”
project can save approximately $150K

Differentiating Characteristics
•
Strong emphasis upon understanding customer requirements
•
Focused problem-solving projects aligned with business goals
•
Packaging of the tools•
Disciplined rigor of data-based decision making
•
Intense financial focus and visibility of bottom- line business results

•
Administrative•
Transactional
•
Design•
Purchasing
•
Manufacturing•
Maintenance
•
Customer Service•
Quality Assurance
Six Sigma Applications
Six Sigma strives to eliminate and prevent process “defects”!
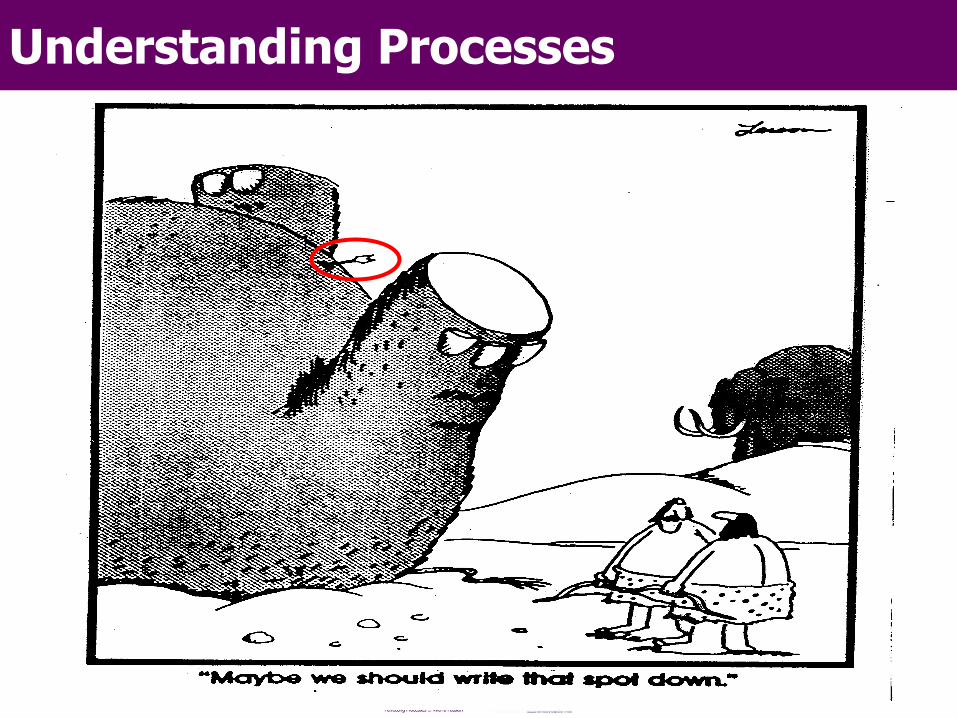
Understanding Processes

26
Workshop Objectives
• Understand the basic concepts and techniques of Six Sigma
• Know how to identify and select HR projects that will have an impact on the business
• Experience real-life examples of successful HR Six Sigma Projects
• Understand the role that HR can play in Six Sigma
10

27
6σ
On-Ramps
Process Management
Process Development
Process Improvement
Business Results

HR’s
Opportunity
HRTransactions
PeopleProcesses
WorkforceProductivity
Organization Capability
Costs
Shareholder Value
Productivity
Customer Value

Strategy Driven Organization DevelopmentSM
29
OrganizationCapability
Business Strategy
Organization Demand
Organization Development Plan

30
The Business Case
“Companies that more closely aligned goals across their organization enjoyed much higher levels of financial success”
How Smart HCM Drives Financial PerformanceWorkforce Intelligence Institute & SuccessFactors, 2006
Do your employees understand the connection between their efforts and overall goals?

31
“Companies that increase employee engagement see improvement in operating margins.”
Towers PerrinNew Realities in Today’s Workforce 2007
What does your engagement picture look like?How does it relate to company performance?
The Business Case

32
“Organizations with strong performance- oriented cultures witnessed far better
financial growth during the same period.”Nohria, Joyce, and Roberson
"What Really Works“Harvard Business Review (July 2003)
What is your company’s culture and how can it be improved to make a difference?
The Business Case

33
The Business Case
Certain Human Capital practices*
explain as much as 43% of the difference in the market-to-book value of one company compared to another.
Deloitte & ToucheHuman Capital ROI Report
*
The practices vary depending on the business’s Driving Force*
Some are universal:
Managing Talent
Rewarding Performance
Communicating Strategically

3434
“Talent issues are at the heart of our rapidly changing
world economy and will continue to present
formidable challenges to business leaders.”

35
Corporate Leadership Council 2008
HR responding to future talentneeds
Succession Planning Process
Talent aligned with Strategy
HR drives business results
% NOT Satisfied
70
80
90
90
How Is HR Handling the Challenge?

36
HR Process
Mission Critical
On‐Boarding Coaching & Feedback Mentoring Deployment Culture Management Knowledge Transfer Recruiting & Selection Retention Communications Employee Engagement
Important
Variable Compensation Performance Management Internal Networking Training & Development
Strategic Im
portance
Maintenance Base Compensation Benefits Planning & Admin Employee Relations
Organization Demand: People Processes
Identifying HR Projects

37
Process Effectiveness Broken/Nonexistent OK Differentiator
Mission Critical
On‐Boarding Coaching & Feedback Mentoring Deployment Culture Management Knowledge Transfer
Recruiting & Selection Retention Communications Employee Engagement
Important
Variable Compensation Performance Management Internal Networking
Training & Development
Strategic Im
portan
ce
Maintenance
Base Compensation Benefits Planning &
Admin Employee Relations
People Process Assessment
Project Opportunities
Identifying HR Projects

38
Identifying HR Projects
Low High
High Investment Required
Continuously Improve
Low Eliminate or Outsource
Reduce Investment
Valu
eEffectiveness
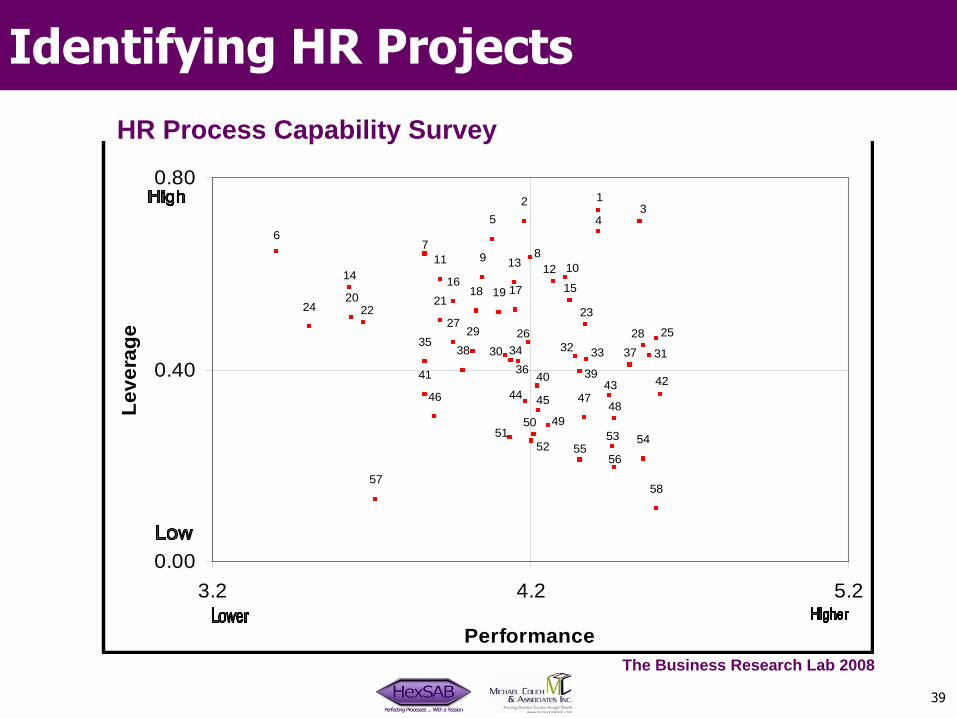
39
Identifying HR Projects
5857
5655
545352
5150 49
484746 4544
43 4241 40 39
38 3736
3534 3332 3130
29 2827
26 25
24 23222120 1918 17
16 1514
13 1211
109 8
76
5 432 1
0.00
0.40
0.80
3.2 4.2 5.2
Performance
Leve
rage
The Business Research Lab 2008
HR Process Capability Survey

40
Workshop Objectives
• Understand the basic concepts and techniques of Six Sigma
• Know how to identify and select HR projects that will have an impact on the business
• Experience real-life examples of successful HR Six Sigma Projects
• Understand the role that HR can play in Six Sigma

41
Real Life Examples
•
Improving Time-To-Hire
DefineMeasureAnalyzeImproveControl
DefineMeasureAnalyzeImproveControl
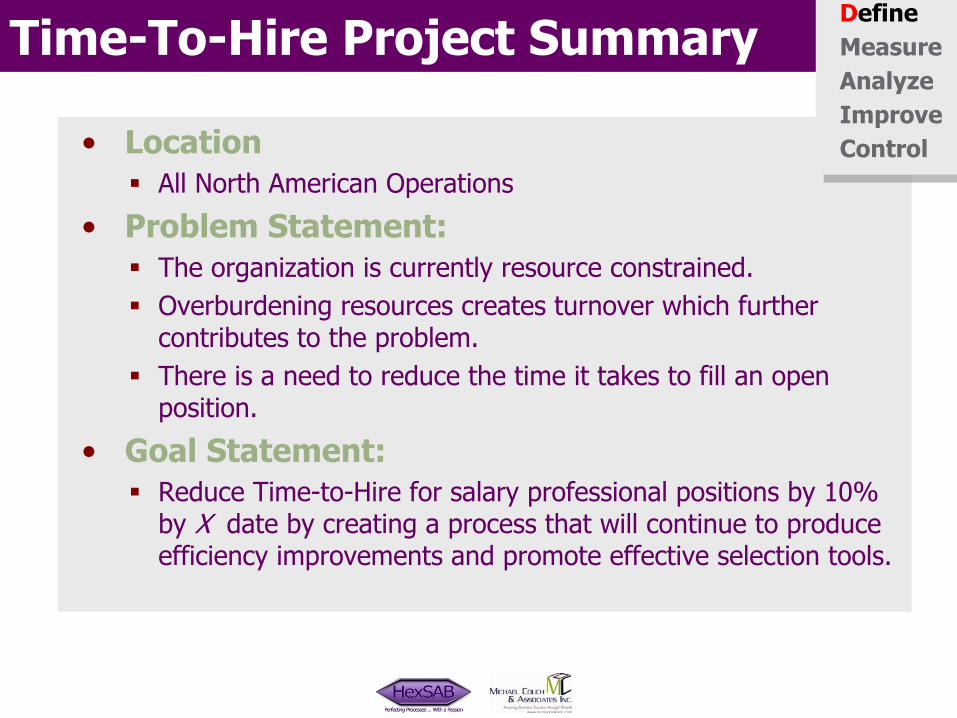
Time-To-Hire Project Summary
•
Location
All North American Operations
•
Problem Statement:
The organization is currently resource constrained.
Overburdening resources creates turnover which further contributes to the problem.
There is a need to reduce the time it takes to fill an open position.
•
Goal Statement:
Reduce Time-to-Hire for salary professional positions by 10% by X date by creating a process that will continue to produce efficiency improvements and promote effective selection tools.
DefineMeasureAnalyzeImproveControl
DefineMeasureAnalyzeImproveControl

Business Case
Business Case:•
The Company is growing in the midst of an overall economic recovery •
The organization is currently resource constrained and facing a future supply shortage of skilled professionals.
o
Changing demographics of the workforceo
Increased skill and experience requirementso
Increased competition for talent available•
Failure to meet professional staffing requirements will affect the ability to meet strategic goals.
•
Improving time-to-hire will contribute to accelerating achievement of strategic business goals.
Benefits to Internal Customer: •
Improved retention of key contributors•
Ability to meet and exceed objectives
External Customer: •
Ability to respond to customer requests faster •
Expand services and product markets
DefineMeasureAnalyzeImproveControl
DefineMeasureAnalyzeImproveControl

Cost Savings
Metrics•
Time-to-Hire•
Cost-to-Hire•
Effectiveness of Recruiting Sources
•
New Hire Retention•
Recruitment Activity
Baseline•
Average time-to-hire 79 days•
Previous Year
Traditional Cost Measures•
Advertising•
Travel reimbursement•
Recruiter fees
The Hidden Cost of Recruitment•
Lost Revenues (Profit)•
Turnover•
Missed Goals and Objectives
DefineMeasureAnalyzeImproveControl
DefineMeasureAnalyzeImproveControl
REVISED METRIC
Daily Profit per Employee = Annual Profit / Total Employees / 250 days
A 10% reduction in time-to-hire = $35/day * 8 days = $280 per Requisition

Project Timeline
Define
Measure
Analyze
Improve
Control
Thought Map, SIPOC, Process Map, Focus Group and Survey feedback
1 Month
Using applicant tracking data to verify baseline & to track effectiveness of recruitment sources
1 Month
Use various charting tools to visually identify time–to– hire process issues
3 Months
Select jobs to trial various process improvements and track performance
2 Months
Apply best process to all openingsTrain all hiring managers Track and measure performance
3 Weeks
DefineMeasureAnalyzeImproveControl
DefineMeasureAnalyzeImproveControl

Thought Map DefineMeasureAnalyzeImproveControl
DefineMeasureAnalyzeImproveControl

SIPOC DiagramDefineMeasureAnalyzeImproveControl
DefineMeasureAnalyzeImproveControl
Inputs Suppliers Requirements
Electronic Posting
Screening of Candidates
Interview Process
Job Offer
Kenexa, Career Builder, Monster
HR Recruiter in combination with Hiring Manager
HR Recruiter in combination with Hiring Manager and hiring team
Hiring Manager and Compensation Manager
Provide visibility to of position to qualified candidates
Identify top candidates for consideration
Convenient schedule; structured interview; compilation of results
Competitive offer with consideration to internal equity
Outputs Customers Requirements
Resumes/Applic
ants received
Prescreen Interviews
Final candidates for consideration
Candidate accepts offer and start date set
Internal Hiring Managers
Internal Hiring Managers/ Screening team
Internal Hiring Managers/ Screening team
Hiring Manger and Candidate
Provide complete job description, defined minimum requirements
Clear understanding of position requirements; information to review qualifications of candidates
Recommendation from HR; follow up on reference checking; facilitation of selection process
Details regarding salary expectations; ability to negotiate where necessary
Process Scope:Signed Requisition to Offer Accepted
Project Goal Statement:
Reduce Time-to-hire window from Time requisition received in HR until Offer accepted.
High Level Process Steps

Process MapAuthorization to Hire Engaged/Most appropriate person Clear,Concise definition of job Good Candidates Identify qualified caSpecific posiiton requirements
Express need Balance of work load Feedback from hiring manager Internet Sources Manager drivenIncrease in Business or turnover Functional expert in the area Job Description Mgr Feedback Recruiter drivenApproval Levels Succesful partnering with Prior postings Budget Prescreen QuestionsSignature Process manager of business uni Target Audience Direct Employer PostingJob Description Prior experience America's job BankJob Grading NewsPaper
Job Fairs
Narrow candidate pool Identify best fit Final selection Decision to hire Offer letter
Cost Cost Panel consultation Availabilty of references Internal equityManager Interest Manager Interest Feedback forms Liability Market dataLocation of candidate Location of candidate HR Input Willingness of references comp managerType of job (Higher level - Type of job (Higher level - Other potential fits for candidates Timing of contact
more liekly) number of interviewers Meets base line qualifications Value added?Panel vs series interviewnumber of on sitesstructured interview
Clear definition of customer(mgr) expectations
INSERT
Competitive compensation Recruiter InitiatedBenefits package Review Job DescriptionRelocation where appropriate Draft posting
Define mode of operationDetermine budget
Posting Entered on Kenexa
External Advertisement
Offer Accepted Meet with Hiring Manager
Compensation review
Review of Candidates Responding
Prescreen Phone Interview
On Site Interview
Evaluation of candidates
Reference Check
Requisition received in HR
Recruiter Assigned Inser
DefineMeasureAnalyzeImproveControl
DefineMeasureAnalyzeImproveControl

Trend Analysis
Calendar Year Total Terms
Greater than 1 year Seniority
Less than One Year
Percent New Hire Turnover
2001 36 30 6 17%2002 32 29 3 9%2003 30 28 2 7%2004 42 26 16 38%2005 6 5 1 17%
Grand Total 146 118 28
Recognition of the percentage of new hire turnover in 2004 initiated a new Six Sigma Project focused on turnover analysis and
improving the selection & assessment processes.
DefineMeasureAnalyzeImproveControl
DefineMeasureAnalyzeImproveControl

Initial Data Analysis
DA T E OPENED
Ind
ivid
ua
l V
alu
e
7/26/20047/1/20045/24/20044/19/20044/1/20041/22/200412/19/200312/1/200310/3/20038/12/2003
300
200
100
0
-100
_X=78.7
UC L=252.9
LC L=-95.5
DA T E OPENED
Mo
vin
g R
an
ge
7/26/20047/1/20045/24/20044/19/20044/1/20041/22/200412/19/200312/1/200310/3/20038/12/2003
200
150
100
50
0
__MR=65.5
UC L=214.0
LC L=0
111
22
22
22
2
2
1
I-MR Chart of TIME TO HIRE FY04 BASELINE
DefineMeasureAnalyzeImproveControl
DefineMeasureAnalyzeImproveControl
Average time to
Hire
Average time to
Hire
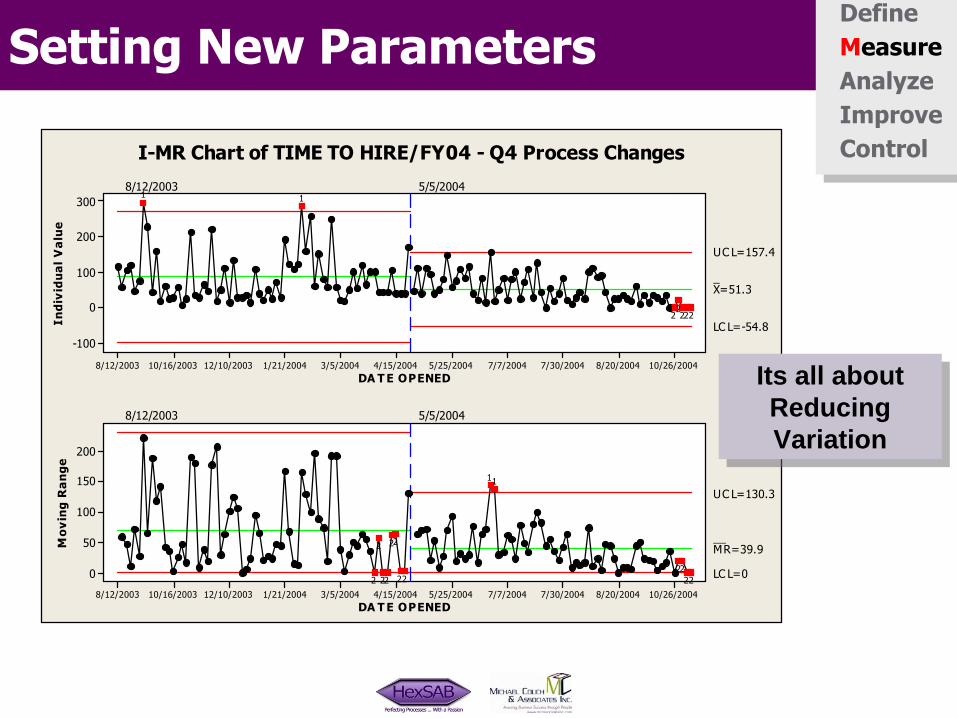
Setting New ParametersDefineMeasureAnalyzeImproveControl
DefineMeasureAnalyzeImproveControl
DA T E OPENED
Ind
ivid
ua
l V
alu
e
10/26/20048/20/20047/30/20047/7/20045/25/20044/15/20043/5/20041/21/200412/10/200310/16/20038/12/2003
300
200
100
0
-100
_X=51.3
UC L=157.4
LC L=-54.8
8/12/2003 5/5/2004
DA T E OPENED
Mo
vin
g R
an
ge
10/26/20048/20/20047/30/20047/7/20045/25/20044/15/20043/5/20041/21/200412/10/200310/16/20038/12/2003
200
150
100
50
0
__MR=39.9
UC L=130.3
LC L=0
8/12/2003 5/5/2004
2222
2
11
2222
11
22
22
22
2
2
I-MR Chart of TIME TO HIRE/FY04 - Q4 Process Changes
Its all about Reducing Variation
Its all about Reducing Variation

Data Analysis –
Current StateDefineMeasureAnalyzeImproveControl
DefineMeasureAnalyzeImproveControl
Date Opened
Indi
vidu
al V
alue
12/22/200412/1/200410/13/20049/29/20048/9/20047/29/20047/8/20046/8/20045/24/20045/5/2004
200
100
0
_X=55.6
UCL=157.7
LB=0
Date Opened
Mov
ing
Ran
ge
12/22/200412/1/200410/13/20049/29/20048/9/20047/29/20047/8/20046/8/20045/24/20045/5/2004
150
100
50
0
__MR=38.4
UCL=125.4
LCL=0
11
11
1
1
Control Chart for TIme to HirePeriod from May 2004 through February 2005
Non-production positions posted both Internally and Externally
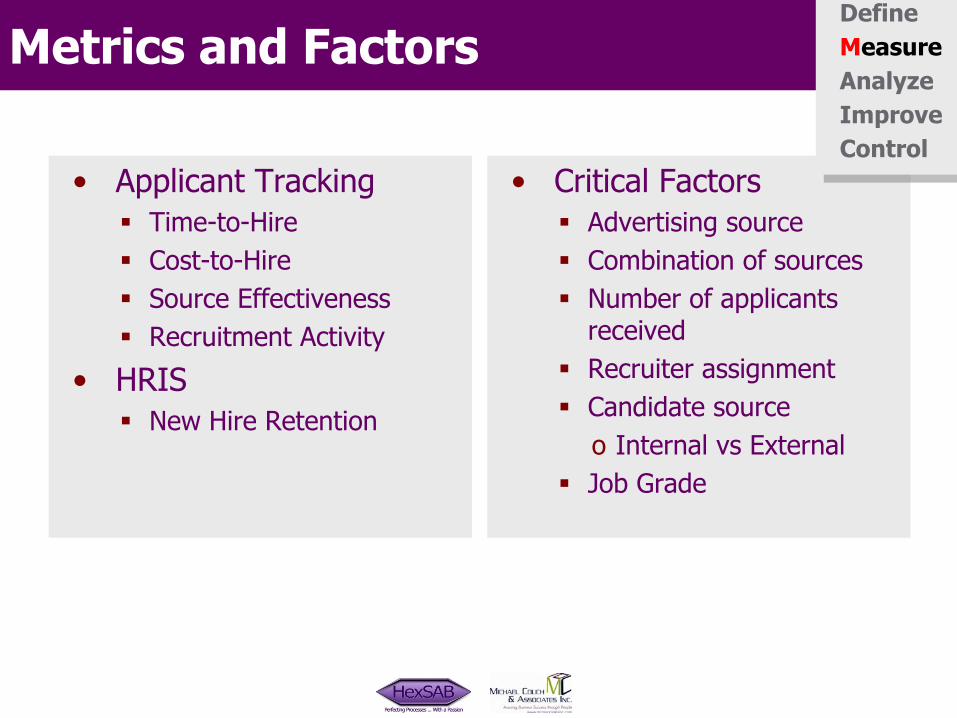
Metrics and Factors
•
Applicant Tracking
Time-to-Hire
Cost-to-Hire
Source Effectiveness
Recruitment Activity
•
HRIS
New Hire Retention
•
Critical Factors
Advertising source
Combination of sources
Number of applicants received
Recruiter assignment
Candidate sourceo
Internal vs
External
Job Grade
DefineMeasureAnalyzeImproveControl
DefineMeasureAnalyzeImproveControl
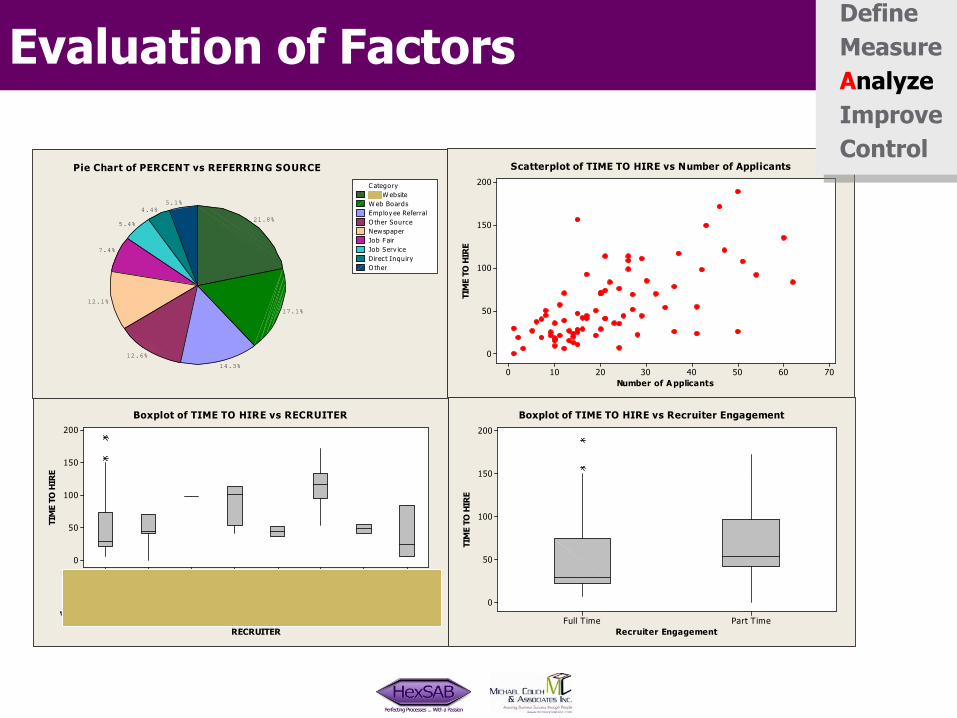
Evaluation of Factors
RECRUITER
TIM
E TO
HIR
E
Wal t
er, C
ather
ine
Suba
sic, S
tephe
n
Helsel,
Jere
my
Gauve
y, Be
th
Garber
, Loy
Barkl
ey, M
atthe
w
Alexa
nder
, Kr is
ta
Adan
usa,
Jane
t
200
150
100
50
0
Boxplot of TIME TO HIRE vs RECRUITER
Recruiter Engagement
TIM
E TO
HIR
E
Part TimeFull Time
200
150
100
50
0
Boxplot of TIME TO HIRE vs Recruiter Engagement
5.1%4.4%
5.4%
7.4%
12.1%
12.6%
14.3%
17.1%
21.8%
C ategory
NewspaperJob FairJob Serv iceDirect InquiryO ther
JLG W ebsiteW eb BoardsEmploy ee ReferralO ther Source
Pie Chart of PERCENT vs REFERRING SOURCE
Number of A pplicants
TIM
E TO
HIR
E
706050403020100
200
150
100
50
0
Scatterplot of TIME TO HIRE vs Number of Applicants
DefineMeasureAnalyzeImproveControl
DefineMeasureAnalyzeImproveControl

Evaluation of Factors
TIME TO HIRE
Inte
rnal
vs
Exte
rnal
1801501209060300
External
Internal
Number of Applicants vs Time to Hire
GR A DE
TIM
E TO
HIR
E
S 5S 4S 3S 159585756555453525046454443424140
200
150
100
50
0
B ox plot o f T IM E T O H IR E v s G R A D E
Gra de Le v e l
TIM
E TO
HIR
E
Non-exem ptM GM T PRO FExem pt
200
150
100
50
0
G rad e Lev elE xem p tM G M T P RO FN o n -exem p t
Boxplot o f TIM E TO H IR E v s G r ade L e v e l
COST
TIM
E TO
HIR
E
2332
9.2
1911
7.8
1800
0.0
1935
.280
9.063
7.159
8.955
5.035
5.020
0.015
5.035.30.0
200
150
100
50
0
Individual Value Plot of TIME TO HIRE vs CO ST
DefineMeasureAnalyzeImproveControl
DefineMeasureAnalyzeImproveControl

Evaluation of FactorsDefineMeasureAnalyzeImproveControl
DefineMeasureAnalyzeImproveControl
Coun
t
Perc
ent
Source
Count 1 1 3Percent 37.3 14.9 10.4 10.4 6.0 6.0
254.5 3.0 1.5 1.5 4.5
Cum % 37.3 52.2 62.7 73.1
10
79.1 85.1 89.6 92.5 94.0 95.5 100.0
7 7 4 4 3 2
Othe
r
Caree
rbuild
erAJB
Newsp
aper
Job Serv
ice
Recrui
ter
Direc
t Inqu
iry
Web Bo
ards
JLG W
ebsit
ei
Emplo
yee R
Eferra
l
Interna
l
70
60
50
40
30
20
10
0
100
80
60
40
20
0
Pareto Chart of Source

Experiments
CombinationsAdvertised on Monster
Advertised on CareerBuilder
1 Yes No2 No Yes3 Yes Yes4 No No
Data available to do 5 repetitions.
Two-way ANOVA: TTH versus CB, Monster
Source DF SS MS F P
CB 1 9636.1 9636.05 3.95 0.063
Monster 1 1140.1 1140.05 0.47 0.504
Error 17 41490.8 2440.64
Total 19 52267.0
S = 49.40 R-Sq = 20.62% R-Sq(adj) = 11.28%
Mea
n of
TTH
yesno
90
80
70
60
50
40
yesno
Monster CB
Main Effects Plot (data means) for TTH
CB
Mea
n
yesno
100
90
80
70
60
50
40
30
Monsternoyes
Interaction Plot (data means) for TTH
DefineMeasureAnalyzeImproveControl
DefineMeasureAnalyzeImproveControl

Evaluating Multiple Factors Time to Hire
Recruiter Full Time Part Time
Grade Level Non Exempt Exempt Mgmt-Prof Non exempt Exempt MGMT Prof
Candidate Internal External Internal External Internal External Internal External Internal External Internal ExternalSource
Mea
n of
TIM
E TO
HIR
E
InternalExternal
70
60
50
40
Part TimeFull Time
Non-exemptMGMT PROFExempt
70
60
50
40
Internal vs External Recruiter Engagement
Grade Level
Main Effects Plot (data means) for TIME TO HIRE
Internal vs External
P art T
ime
F ull T
ime
Non-exe
mpt
MGMT
PRO
F
Exem
pt
90
60
30
Recruiter Engagement
90
60
30
Grade Level
InternalvsExternalExternalInternal
RecruiterEngagementFull TimePart Time
Interaction Plot (data means) for TIME TO HIRE
DefineMeasureAnalyzeImproveControl
DefineMeasureAnalyzeImproveControl

Designed Process Experiment
•
Hiring Manager Interview Step
Establish process alignment
Answer key questions in advance
Increase manager engagement
•
Developed a form for interview process
•
Measured performance using completed Req’s
DefineMeasureAnalyzeImproveControl
DefineMeasureAnalyzeImproveControl
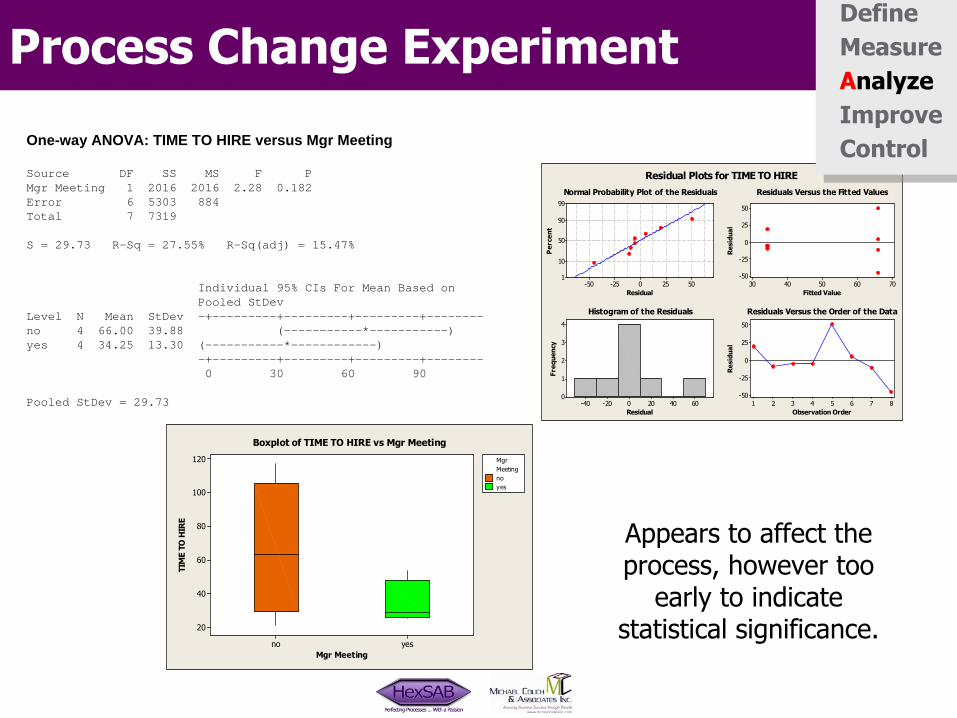
Process Change Experiment
Residual
Per
cent
50250-25-50
99
90
50
10
1
Fitted Value
Res
idua
l
7060504030
50
25
0
-25
-50
Residual
Freq
uenc
y
6040200-20-40
4
3
2
1
0
Observation Order
Res
idua
l
87654321
50
25
0
-25
-50
Normal Probability Plot of the Residuals Residuals Versus the Fitted Values
Histogram of the Residuals Residuals Versus the Order of the Data
Residual Plots for TIME TO HIRE
One-way ANOVA: TIME TO HIRE versus Mgr Meeting
Source DF SS MS F PMgr Meeting 1 2016 2016 2.28 0.182Error 6 5303 884Total 7 7319
S = 29.73 R-Sq = 27.55% R-Sq(adj) = 15.47%
Individual 95% CIs For Mean Based onPooled StDev
Level N Mean StDev -+---------+---------+---------+--------no 4 66.00 39.88 (-----------*-----------)yes 4 34.25 13.30 (-----------*------------)
-+---------+---------+---------+--------0 30 60 90
Pooled StDev = 29.73
Appears to affect the process, however too
early to indicate statistical significance.
Mgr Meeting
TIM
E TO
HIR
E
yesno
120
100
80
60
40
20
MgrMeetingnoyes
Boxplot of TIME TO HIRE vs Mgr Meeting
DefineMeasureAnalyzeImproveControl
DefineMeasureAnalyzeImproveControl

Quantifying ResultsPosition Req Grade Date Opened Date Filled Time to Hire Compared to Baseline Improvement $ER & SALES CHANGE COORDINATOR 2400 42 8/2/2004 8/30/2004 28 51 1785BIG BOX COMMERCIAL SALES MANAGER 2420 S4 8/3/2004 9/14/2004 42 37 1295MHEDA SALES MANAGER 2440 S4 8/6/2004 1/25/2005 172 -93 -3255ACCOUNTS PAYABLE TECHNICIAN 2480 44 8/9/2004 9/3/2004 25 54 1890SERVICE TRAINING DEVELOPER 2501 54 8/9/2004 11/17/2004 99 -20 -700INSIDE SALES COORDINATOR - SERVICE PARTS 2460 S1 8/9/2004 12/22/2004 135 -56 -1960INSIDE SALES COORDINATOR - SERVICE PARTS 2641 S1 8/11/2004 9/24/2004 44 35 1225REGIONAL SERVICE MANAGER 2640 S4 8/11/2004 11/11/2004 92 -13 -455MANUAL DISTRIBUTION CLERK 2920 43 9/7/2004 10/1/2004 24 55 1925PARTS MARKETING ANALYST 2980 54 9/21/2004 9/27/2004 6 73 2555ONLINE EXPRESS ANALYST 3020 53 9/24/2004 10/11/2004 17 62 2170PRODUCT MARKET CHAMPION 3060 59 9/29/2004 1/24/2005 117 -38 -1330DISTICT MANAGER 3180 S5 10/5/2004 1/24/2005 108 -29 -1015ACCOUNTS PAYABLE TECHNICIAN 3280 40 10/11/2004 10/20/2004 9 70 2450ACCOUNTS PAYABLE TECHNICIAN 3280 40 10/11/2004 10/26/2004 15 64 2240DATA ENTRY CLERK 3300 40 10/11/2004 10/26/2004 15 64 2240ACCOUNTS PAYABLE TECHNICIAN 3280 40 10/11/2004 11/16/2004 36 43 1505TACTICAL BUYER/PLANNER 3320 53 10/12/2004 10/19/2004 7 72 2520TACTICAL BUYER/PLANNER 3320 53 10/12/2004 11/16/2004 35 44 1540DISTRICT MANAGER WESTERN REGION 3360 S5 10/13/2004 2/11/2005 121 -42 -1470STRATEGIC BUYER 3400 57 10/21/2004 11/9/2004 19 60 2100MANUFACTURING CLERK 3442 45 10/26/2004 10/26/2004 0 79 2765TACTICAL BUYER/PLANNER 3420 54 10/26/2004 12/2/2004 37 42 1470INDUSTRIAL ENGINEER 3380 55 11/18/2004 11/18/2004 30 49 1715TACTICAL BUYER/PLANNER 3740 53 11/23/2004 12/13/2004 20 59 2065INSIDE SALES COORDINATOR - SERVICE PARTS 3760 50 11/24/2004 1/15/2005 52 27 945COST ESTIMATOR 3800 54 11/29/2004 1/13/2005 45 34 1190CREDIT COLLECTION ANALYST 3840 53 12/1/2004 12/18/2004 18 61 2135WARRANTY VENDOR RECOVERY ANALYST 3940 54 12/2/2004 1/15/2005 44 35 1225PAYMENTS MANAGER 3960 58 12/2/2004 1/25/2005 54 25 875MATERIAL FLOW SPECIALIST 4040 46 12/7/2004 2/22/2005 71 8 280MATERIAL FLOW SPECIALIST 4040 46 12/7/2004 2/22/2005 71 8 280MATERIAL FLOW SPECIALIST 4040 46 12/7/2004 2/22/2005 71 8 280MATERIAL FLOW SPECIALIST 4041 46 12/7/2004 2/22/2005 71 8 280CREDIT & OPERATIONS ANALYST 4080 54 12/14/2004 1/19/2005 36 43 1505CLERK - PS & R 4120 41 12/22/2004 1/12/2005 21 58 2030REGIONAL PARTS SALES MANAGER 4200 S3 1/10/2005 2/4/2005 25 54 1890COST ACCOUNTING MANAGER 4280 58 1/17/2005 2/15/2005 29 50 1750MANAGER INVESTOR RELATIONS & ANALYSIS 4300 58 1/17/2005 2/15/2005 29 50 1750SALES / MARKETING CONTROLLER 4360 58 1/28/2005 2/24/2005 27 52 1820COST ACCOUNTANT - MILITARY PROGRAMS 4362 55 1/28/2005 2/24/2005 27 52 1820CLERK 4380 40 2/3/2005 2/9/2005 6 73 2555
47880
DefineMeasureAnalyzeImproveControl
DefineMeasureAnalyzeImproveControl
SAVINGS
$47,880August to February
SAVINGS
$47,880August to February

Changes Implemented
•
Increased sourcing techniques•
Additional internal recruiter resources
Assign critical positions to full time recruiter
Maintain awareness of recruiter load
•
Focused Planning
Regular recruitment meetings
•
Increased hiring manager involvement •
Enhanced process for internal communication of openings
DefineMeasureAnalyzeImproveControl
DefineMeasureAnalyzeImproveControl

New Process Map
Authorization to Hire Engaged/Most appropriate person Developed Recruiting Strategy Clear,Concise definition of job Specific posiiton requirements
Express need Balance of work load Recruiter Initiated Feedback from hiring manager Internet SourcesIncrease in Business or turnover Functional expert in the area Review Job Description Job Description Mgr FeedbackApproval Levels Succesful partnering with Draft posting Prior postings BudgetSignature Process manager of business unit Define mode of operation Target Audience Direct Employer PostingJob Description Prior experience Determine budget America's job BankJob Grading NewsPaper
Job Fairs
Identify qualified candidates Narrow candidate pool Identify best fit Final selection
Manager driven Cost Cost Panel consultation Availabilty of referencesRecruiter driven Manager Interest Manager Interest Feedback forms LiabilityPrescreen Questions Location of candidate Location of candidate HR Input Willingness of references
Type of job (Higher level - Type of job (Higher level - Other potential fits for candidates Timing of contactmore liekly) number of interviewers Meets base line qualifications Value added?
Panel vs series interviewnumber of on sitesstructured interview
Offer letter
Internal equity Competitive compensationMarket data Benefits packagecomp manager Relocation where appropriate
Recruiter AssignedPosting Entered on
Kenexa
Compensation review
Meet with Hiring Manager
Offer Accepted
External Advertisement
On Site InterviewEvaluation of candidates Reference Check
Review of Candidates Responding
Prescreen Phone Interview
Requisition received in HR
DefineMeasureAnalyzeImproveControl
DefineMeasureAnalyzeImproveControl

Control Plan
•
Develop Recruiting Manual with guidelines
•
Post Manual on the intranet
Distribute at hiring manager training
•
Maintain Time to Hire metric tracking
•
Use weekly recruiter meetings to review process issues
DefineMeasureAnalyzeImproveControl
DefineMeasureAnalyzeImproveControl

FMEA for Control Plan
Part/Process Potential Failure
ModePotential Effects of
Failure
SEV
Potential Causes of Failure
OCC
Current Process Controls
DET
RPN
Actions Recommended
Responsibility and Dates
Description of process or operation
being analyzed.
Manner in which the process could
potentially fail to meet process requirements.
Effects of the failure mode on the customer.
Severity of the effect
(S)
How the failure could occur.
Frequency of failure
occurrence (O)
Descriptions of the controls that prevent or detect the failure
mode.
Extent to which
failure (or cause) can be
identified prior to
reaching customer
(D)
Product of
(S)*(O)*(D)
Actions to be taken on the highest
ranked concerns and critical items.
The individual(s) responsible for the
actions and the target dates for
completion.
Providing recruitment Manual
to guide the process People don't read it Process delays 10
Steps in the process are not
followed 3Post manual on the
intranet 7 210
Create manual for intratnet access
along with training module : Hiring a
new Team Member
C. Walter, J Helsel; J Adanusa; D.
Timbrook target for completion 3/15/05
Inappropriate questions asked 10 No interview training 1
Address training needs in hiring
manager meeting 10 100
Develop Training Guidelines in
Manual
C. Walter, J Helsel; J Adanusa; D.
Timbrook target for completion 3/15/06
Job submitted without Description
Job not graded in a timely manner 10 Rush to process req 3
Require issue resolution prior to
posting 8 240
Train recruiters and track
inconsistencies; develop a
relationship with the hiring manager
C. Walter, J Helsel; J Adanusa; D.
Timbrook target for completion 3/15/07
Delays in signature process
Requistion not acted on 10
Uncertain of signature process 1
Requisition not processed without
signature 2 20Provide access to
guidelines
C. Walter, J Helsel; J Adanusa; D.
Timbrook target for completion 3/15/08
Failure to look on Kenexa
Candidates not reviewed 10
Hiring not a priority; uncomfortable with
the system 5Recruiter review and
refer resumes 8 400
Using hiring manager meeting to
establish relationship with
recruiterAll recruiters - On
Going
Lack of respoense to resumes sent
Good Candidates Missed 10 Hiring not a priority 9 Recruiter follow up 8 720
Using hiring manager meeting to
establish relationship with
recruiterAll recruiters - On
Going
Perception of lack of canddiates 10
Unclear on manager expecations 9 Recruiter follow up 8 720
Using hiring manager meeting to
establish relationship with
recruiterAll recruiters - On
Going
Feedback forms not submitted
Wrong candidate hired 10
Failrue to communicate
concerns about interview red flags 9
Require all forms be returned prior to Job
offer 8 720
Using hiring manager meeting to
establish relationship with
recruiterAll recruiters - On
Going
DefineMeasureAnalyzeImproveControl
DefineMeasureAnalyzeImproveControl
•
What could go wrong•
Likelihood
•
Severity• Causes•
Controls & Prevention
•
What could go wrong•
Likelihood
•
Severity•
Causes
•
Controls & Prevention

Other Considerations
•
Identify and measure process deviations
•
Continue surveys and audits of customer satisfaction and feedback
•
Focus on turnover tracking and analysis
•
Improve applicant tracking system reporting capability
DefineMeasureAnalyzeImproveControl
DefineMeasureAnalyzeImproveControl

Insights and Observations
•
Made us look closely at the process
Truly understand how it works
•
Realized the importance of having a defined process
•
Taught us to be more proactive
Developed a plan of action
•
Provided more insight into 6σ
itself
You can look at anything statistically
•
Excellent project management experience
Superior to any packaged seminar
•
Learned not to make assumptions
•
Ask for help early in the process
DefineMeasureAnalyzeImproveControl
DefineMeasureAnalyzeImproveControl

68
Workshop Objectives
• Understand the basic concepts and techniques of Six Sigma
• Know how to identify and select HR projects that will have an impact on the business
• Experience real-life examples of successful HR Six Sigma Projects
• Understand the role that HR can play in Six Sigma

69
Keys to Success
•
Focus on the customer
Build the Business Case
•
Data-driven/Evidence-based
Measurement, measurement, measurement
•
Identify and plan for stakeholders
•
Process Focus
Cross functional
•
Continuous Improvement
Who is HR’s Customer?

70
HR Strategic Capabilities
Skills
Defining HR’s
RoleStrategy Options
Strategy Decision Making
Strategy Implementati
on
Org.Design
New Business Oppty’s
Assess M&A Oppty’s
HR Technical L
InterpersonalSkills H L L
Business Acumen & Partnering
H H H M L H
Metric Skills H M L L M L
Managing Outsourcing M
Strategic Roles
From: HR as a Strategic Partner: What Makes It HappenEd Lawler & John Boudreau 2009 (Pre-publication Draft)

71
The Importance of Measurement
“Without accurate and reliable human capital data and information, strategic HR professionals cannot make fact-based decisions that provide insights to their business clients”
The Strategic Side of Human ResourcesIBM Corporation 2006

72
CEO’s Perspective
•
Know the business
Be a business person 1st, an HR person 2nd
•
Use data and focus on measurement•
Provide solutions that meet business needs
•
Build business consultants rather than HR People
HR Leadership Forum of Western PA, HR and the C-Suite (2008)
“Being functionally smart gets you to the table. Selling ideas and being a value-add keeps you there.”
Greg Babe, President & CEO - Bayer
“Being functionally smart gets you to the table. Selling ideas and being a value-add keeps you there.”
Greg Babe, President & CEO - Bayer

Thanks!
Sharon GregoryHexagon Solutions and Beyond, [email protected]
Michael A. CouchMichael Couch & Associates Inc.412-952-9036Michael@mcassociatesinc.comwww.mcassociatesinc.com