value investing - colombo stock exchange · ceylon investment plc has consistently focused on value...
TRANSCRIPT

ANNUAL REPORT 2016/17
VALUE INVESTING
CEYLON INVESTMENT PLC
A CARSON CUMBERBATCH COMPANY

www.carsoncumberbatch.com
ContentsPerformance Highlights 2
Chairperson’s Statement 3
Management Discussion and Analysis 4
Risk Management 12
Annual Report of the Board of Directors on the affairs of the Company 18
Profiles of the Directors 30
Management Team Profile 33
Audit Committee Report 34
Related Party Transactions Review Committee Report 36
Financial Calendar 38
Independent Auditors’ Report 39
Statement of Profit or Loss and Other Comprehensive Income 40
Statement of Financial Position 41
Statement of Changes In Equity 42
Statement of Cash Flows 43
Notes to the Financial Statements 44
Five Year Summary 88
Information to Shareholders and Investors 90
Notice of Meeting 93
Form of Proxy 95

Ceylon Investment PLC has consistently focused on value investing and wealth creation, with opportunities for intelligent, high quality investments that promise growing and consistent returns in the medium to long term. Our equity selections are done with a long term horizon.
The year under review in this report has been a complex one, yet your company has succeeded in expanding our existing portfolio, working through an uncertain business environment to deliver good results yet again. We are pleased to report a strong balance sheet in this review with a 10.78% growth in our actively managed portfolio, as we steadily add to the value we create for our shareholders whose loyalty and confidence lies at the core of our success.
Ceylon Investment PLC is a part of the Ceylon Guardian Group. It is focused on investing in listed equity investment portfolios to create long term value to shareholders. The Company hold a total investment portfolio of Rs. 8.7 Bn as at 31st March 2017.
Value investing
Ceylon Investment PLC Annual Report 2016/17 2 3
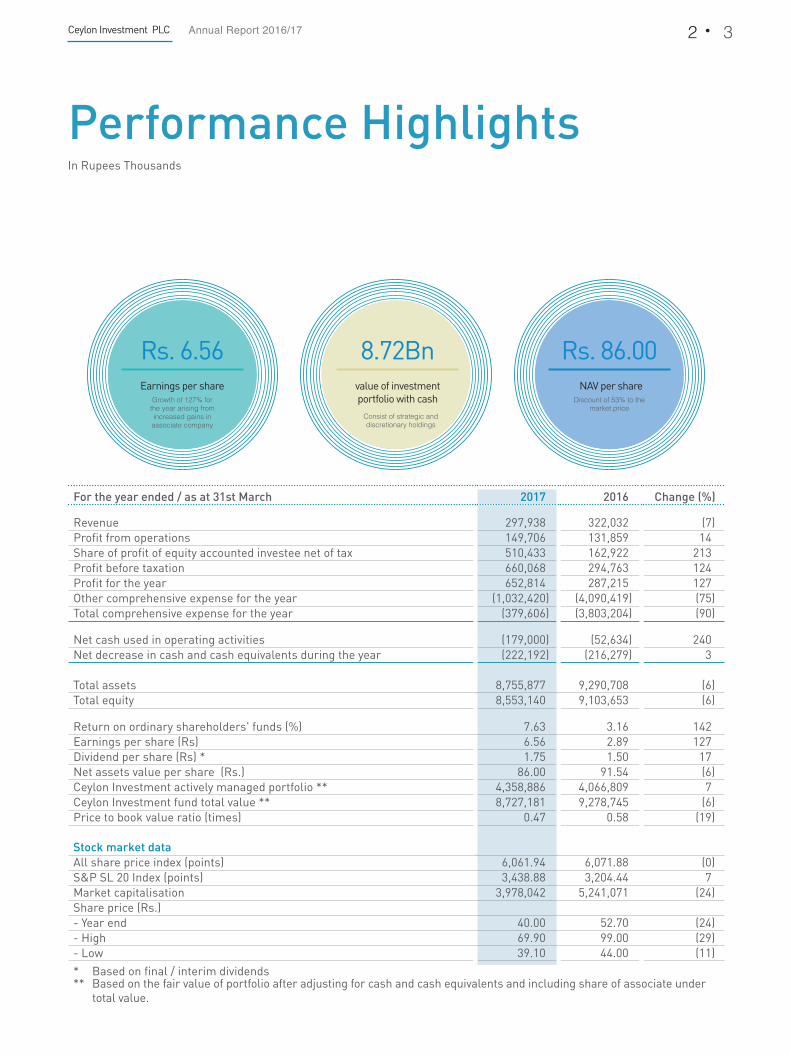
Growth of 127% for the year arising from increased gains in associate company
Earnings per share
Rs. 6.56
Consist of strategic and discretionary holdings
value of investment portfolio with cash
8.72Bn
Discount of 53% to the market price
NAV per share
Rs. 86.00
For the year ended / as at 31st March 2017 2016 Change (%)
Revenue 297,938 322,032 (7)Profit from operations 149,706 131,859 14 Share of profit of equity accounted investee net of tax 510,433 162,922 213 Profit before taxation 660,068 294,763 124 Profit for the year 652,814 287,215 127 Other comprehensive expense for the year (1,032,420) (4,090,419) (75)Total comprehensive expense for the year (379,606) (3,803,204) (90)
Net cash used in operating activities (179,000) (52,634) 240 Net decrease in cash and cash equivalents during the year (222,192) (216,279) 3
Total assets 8,755,877 9,290,708 (6)Total equity 8,553,140 9,103,653 (6)
Return on ordinary shareholders' funds (%) 7.63 3.16 142 Earnings per share (Rs) 6.56 2.89 127 Dividend per share (Rs) * 1.75 1.50 17 Net assets value per share (Rs.) 86.00 91.54 (6)Ceylon Investment actively managed portfolio ** 4,358,886 4,066,809 7Ceylon Investment fund total value ** 8,727,181 9,278,745 (6)Price to book value ratio (times) 0.47 0.58 (19)
Stock market dataAll share price index (points) 6,061.94 6,071.88 (0) S&P SL 20 Index (points) 3,438.88 3,204.44 7 Market capitalisation 3,978,042 5,241,071 (24)Share price (Rs.)- Year end 40.00 52.70 (24)- High 69.90 99.00 (29)- Low 39.10 44.00 (11)
* Based on final / interim dividends** Based on the fair value of portfolio after adjusting for cash and cash equivalents and including share of associate under
total value.
Performance HighlightsIn Rupees Thousands

Our Performance Financial InformationManagement Discussion and Analysis
Supplementary InformationGovernance and Risk Management
It is with pleasure that I welcome you to the 65th Annual General Meeting of Ceylon Investment PLC and present to you the Annual Report of the company for the financial year ended 31 March 2017.
You would be pleased that Ceylon Investment has performed well reporting a 127% growth in profit which is Rs. 652.81Mn for the year ended 31st March 2017, compared to Rs. 287.21Mn for the previous year. This was largely on account of realization of capital gains in the Associate company. The company has performed exceptionally well in the turbulent environment with the discretionary portfolio outperforming the ASPI significantly over a 3 year period by a 7.44% CAGR. Ceylon investment’s philosophy and disciplined investment process continues to add value to its stakeholders. The discretionary portfolio provided a 10.78% return for the financial year in a flat market environment.
Economy
The year ended March 2017 was a challenging year. The economy which recorded a GDP growth of 4.4% for the year 2016 witnessed a notable drop in growth during the first quarter of 2017. The Extended Fund Facility of the IMF which required the government to undertake a series of reforms, saw the introduction of several measures aimed at augmenting revenue and fiscal consolidation. Aiming at correcting a few imbalances in the economy, tightened monetary policy adopted during 2016 was further tightened during the first quarter of 2017. A renewed effort, aimed at achieving sustainable economic development including reforms, structural changes and improving international relationships was put in place. However the high debt burden and adverse weather conditions created a negative impact on the Government's development efforts. With a view to addressing existing structural deficiencies in the economy paving the way for sustainable development, it is imperative that the Government implements a well-structured and co-ordinated coherent set of policies creating a conducive environment for this purpose, through an efficient implementation mechanism.
Business Environment
Sri Lankan capital markets which have experienced limited development in the past are now undergoing a number of structural changes to pave a more diverse pathway. Some of the changes are in the form of a much needed Securities Exchange Commission Act which lays a foundation for new product development such as Real Estate Investment Trusts
Chairperson’s Statement
(REITs), derivatives and also strengthen the much needed regulatory aspects of the market.
Unclear tax policies led to investors holding back investments in capital markets with concerns on implementations of capital gains taxes, changes to corporate taxes and treatment of withholding and notional taxes. The uncertainty also led to the group protecting its investment returns by realizing large capital gains both in the company and associate company given the prospect of potential future tax implications. Though it was not the best of times to sell out, lack of confidence in the direction of capital market taxes forced us to realize gains at a sub-optimal point of time to protect shareholder returns.
The overall performance and trends of Colombo Stock Exchange (CSE) are important indicators of the general business environment to prospective foreign investors interested in bringing capital to the country. Therefore, clear and coherent policy decisions, especially those affecting the operating environment of the CSE directly and indirectly, have to be taken after careful consideration of the implications on various sub sectors of the economy as well as focusing on attracting much wanted capital into the country
Performance of your company against this background has been commendable.
I thank the staff for their commitment, enthusiasm and striving hard to bring in good results operating in a volatile environment, our intermediaries and service providers for their support, and the regulators in taking the industry forward. I thank our shareholders who continue to believe in our ability to deliver. I convey my appreciation to my board members and the members of the Audit Committee, Remuneration Committee, Nomination Committee and Related Party Transactions Review Committee for their diligence. We will continue to build our business for long term opportunities whist managing the volatilities of the short term with care
(Sgd.)M. A. R. C. Cooray (Mrs.)Chairperson
Colombo21st June 2017

Ceylon Investment PLC Annual Report 2016/17 4 5
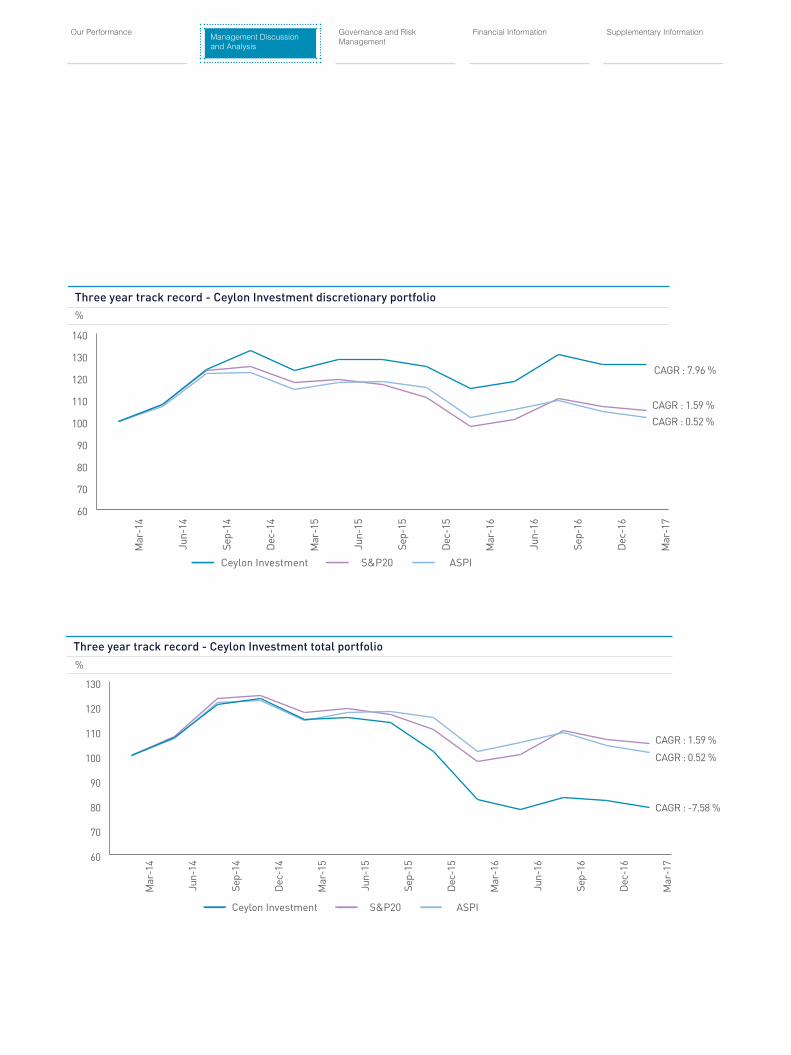
Ceylon Investment holds a portfolio of Rs. 8.7 billion as at 31st March 2017 consisting of a strategic holding of Rs. 4.4 billion and a discretionary holding of Rs. 4.3 billion. The discretionary component is actively managed using a bottom up stock selection process where the fund management team select investments utilizing fundamental research and the widespread experience of the team. The discretionary component performed exceptionally well for the financial year ending
31st March 2017 with the portfolio providing a return of 10.78% outperforming the All Share Price Index by 10.94%. The portfolio has outperformed the ASPI significantly over a 3 year period, whereby the discretionary portfolio performance has been 7.96% compared to the flat ASPI of CAGR 0.52%. The total portfolio declined from Rs. 9.28 billion in 31st March 2016 to Rs. 8.73 billion largely on account of the strategic holding value reducing.
As at As at
31-Mar-17 31-Mar-16 Change % 31-Mar-17 (Dividend adjusted)
Dividend adjusted
performance
Discretionary portfolio (Rs. ‘000) * 4,358,886 4,066,809 7.18% 4,505,198 10.78%
Strategic investment 4,368,295 5,211,936 -16.19% 4,368,295 -16.19%
Total Portfolio (Rs.‘000)* 8,727,181 9,278,745 -5.94% 8,873,493 -4.37%
ASPI (Points) 6,061.94 6,071.88 -0.16% -0.16%
S&P 20 (Points) 3,438.88 3,204.44 7.32% 7.32%
*After adding back the total cash outflow from the distribution of dividend by the Company, which was Rs. 146.31 Mn during the period.
Management Discussion and Analysis
The Ceylon Investment portfolio has outperformed the ASPI significantly for the financial year, whereby the discretionary portfolio performance has been 10.78% compared to the flat ASPI of - 0.16%.
4.3Bn
Discretionary portfolioActively managed component of the Company portfolio
Our Performance Management Discussion and Analysis
Financial Information Supplementary InformationGovernance and Risk Management
60
70
80
90
100
110
120
130
140
Ceylon Investment S&P20 ASPI
CAGR : 0.52 %
CAGR : 7.96 %
CAGR : 1.59 %
Mar
-14
Jun-
14
Sep-
14
Dec
-14
Mar
-15
Jun-
15
Sep-
15
Dec
-15
Mar
-16
Jun-
16
Sep-
16
Dec
-16
Mar
-17
Three year track record - Ceylon Investment discretionary portfolio%
60
70
80
90
100
110
120
130
CAGR : -7.58 %
CAGR : 1.59 %
CAGR : 0.52 %
Mar
-14
Jun-
14
Sep-
14
Dec
-14
Mar
-15
Jun-
15
Sep-
15
Dec
-15
Mar
-16
Jun-
16
Sep-
16
Dec
-16
Mar
-17
Ceylon Investment S&P20 ASPI
Three year track record - Ceylon Investment total portfolio
%

Ceylon Investment PLC Annual Report 2016/17 6 7
Management Discussion and Analysis
60
70
80
90
100
110
120
130
140
150
CAGR : - 6.75%
CAGR : 2.87 %
CAGR : 2.26 %
�Mar
-12
Jun-
12
Sep-
12
Dec
-12
Mar
-13
Jun-
13
Sep-
13
Dec
-13
Mar
-14
Jun-
14
Sep-
14
Dec
-14
Mar
-15
Jun-
15
Sep-
15
Dec
-15
Mar
-16
Jun-
16
Sep-
16
Dec
-16
Mar
-17
Ce���n �n�e���en� S��20 AS��
Five year track record - Ceylon Investment total portfolio%
On a long horizon, supporting Ceylon Investment’s aim of owning high quality businesses within its portfolio, our performance has been 10.13%, which is 7.87% above the benchmark for the last five years.
60
80
100
120
140
160
180
CAGR : 2.26 %
CAGR : 10.13%
CAGR : 2.87 %
Mar
-12
Jun-
12
Sep-
12
Dec
-12
Mar
-13
Jun-
13
Sep-
13
Dec
-13
Mar
-14
Jun-
14
Sep-
14
Dec
-14
Mar
-15
Jun-
15
Sep-
15
Dec
-15
Mar
-16
Jun-
16
Sep-
16
Dec
-16
Mar
-17
Ceylon Investment S&P20 ASPI
Five year track record -Ceylon Investment discretionary portfolio%
Our Performance Management Discussion and Analysis
Financial Information Supplementary InformationGovernance and Risk Management
The local equity market provided a dampened return of -0.16% for the year with economic concerns such as fiscal consolidation, higher interest rates and excessive external debt repayment at the forefront. Higher interest rates in particular hampered domestic participation resulting in lacklustre turnover levels and subdued price levels. Encouraging signs for the economy began to emerge despite the poor performance of the market by way of the country securing the IMF Extended Fund Facility, Fitch sovereign rating outlook improving to stable and renewed foreign interest in the Colombo Stock Exchange in the latter months. On the global front, stocks rallied in a year of volatility and political upheaval. It was a year of surprises with Donald Trump’s surprising victory and the UK referendum leading to Brexit. Improving US economic growth and central bank stimulus led to improved returns from developed markets. Emerging markets saw strong inflows leading to improved performances largely due to rising commodity prices and political reform efforts.
We invested Rs. 211 million in a cement manufacturing company which supplies to 35% of Sri Lankan demand. We are very excited with the prospects of Tokyo Cement which stands to gain from the ongoing construction boom in both the retail and large scale categories. The
Sri Lankan economy which is entering the next phase of its development drive will be spearheaded by numerous public and private large scale construction projects. With increasing demand for cement consumption the company has invested in increasing its manufacturing capacity to 2.8Mn MT from prior 1.8 Mn MT. A combination of
softer input commodity prices and revenue growth led to a phenomenal increase of 72% in its bottom line. Since we acquired the position in Tokyo Cement this financial year, the stock has been a top contributor to the portfolio providing a return of 64%. We are watchful of the fact that the cement prices are regulated prices and that its largest competitor Holcim recently sold out to Siam City Cement Public Company Limited Thailand.
We invested a Rs. 61 million in Cargills which is one of the leading food and beverage companies in Sri Lanka has over 315 supermarket outlets spread across the country making it the largest privately owned supermarket. The company has started showing strong profit growth since the removal of deemed VAT in 2016 where they were obligated to pay VAT on 75% of the revenue regardless of VAT liability products. We are the 5th largest shareholder in the company with a 2% stake and look forward to the company’s rapid growth supported by increased consumption patterns in the medium term with improving GDP per capita.
We maintain significant exposure to HNB which is one of the largest private banks in the country and have monitored the large strides it has made in improving profitability through cost management whilst maintaining high quality lending. The banks strong presence in SME lending differentiates it from its peers. However, the banking space in Sri Lanka is very competitive and we see mid-sized banks increasing their presence. We have invested in one such institution being Sampath Bank which grew rapidly after investing in a heavy branch expansion. Sampath Bank too has grown its loan book and is focused on cost reductions whilst maintaining asset quality. However, it has one of the lowest capital adequacy ratios in the sector and with BASEL
Encouraging signs for the economy began to emerge despite the poor performance of the market by way of the country securing the IMF Extended Fund Facility, Fitch sovereign rating outlook improving to stable and renewed foreign interest in the CSE in the latter months.
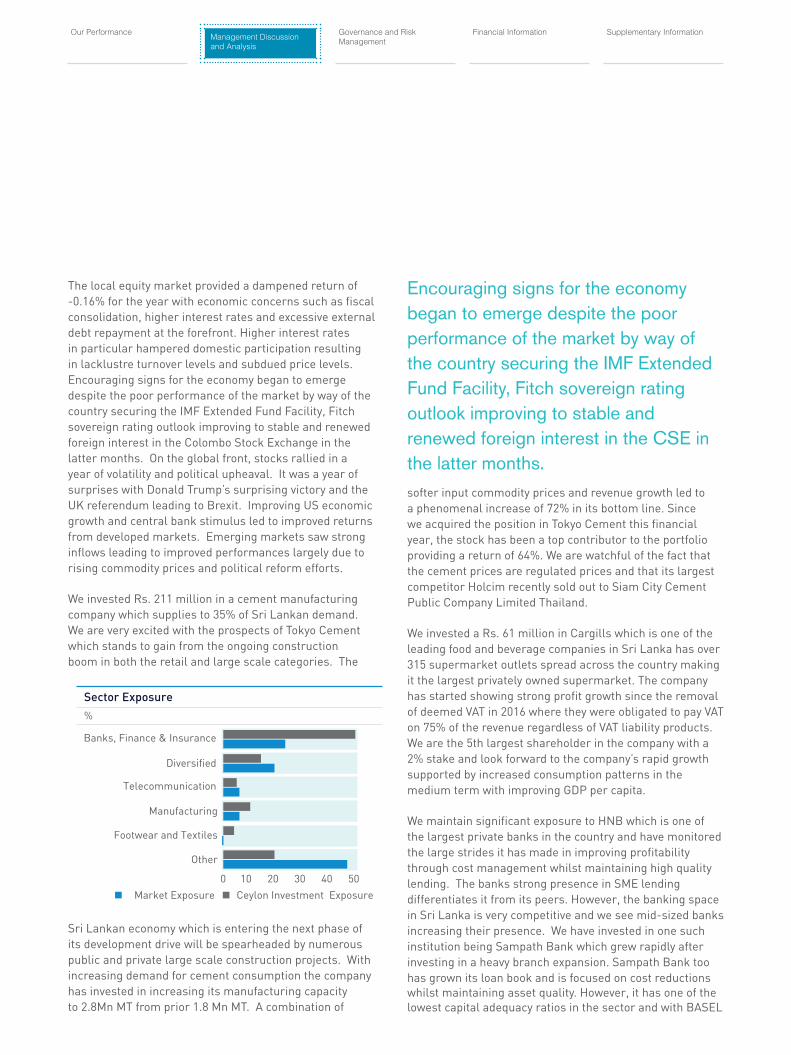
0 10 20 30 40 50
Market Exposure Ceylon Investment Exposure
Other
Footwear and Textiles
Manufacturing
Telecommunication
Diversified
Banks, Finance & Insurance
Sector Exposure
%

Ceylon Investment PLC Annual Report 2016/17 8 9
Management Discussion and Analysis
III requirements expected to be adopted in 2019, capital calls are expected across the sector of which HNB and Commercial Bank have already made announcements.
Top five holdings
Company Market value of the
holding('000)
Holding as a % of
discretionary portfolio
Hatton National Bank PLC 504,252 11.57%
Commercial Bank of Ceylon PLC
477,783 10.96%
Sampath Bank PLC 453,837 10.41%
Melstacorp PLC 344,652 7.91%
Tokyo Cement Company (Lanka) PLC
327,645 7.52%
Total 2,108,169 48.36%
Our holdings in the insurance sector reflect potential growth of the sector due to under-penetration of insurance and profitability in the life segment of the business. The general insurance holdings are more selective as a result of intense competition and unique business models such as Peoples Insurance that caters to the brand loyalty of its parent company. The cyclical nature of the leasing sector poses opportunity for increasing positions due to under-pricing of some businesses.
A significant detractor for the portfolio this year was Hayleys Fabrics which experienced a 66% decline in net profit for the nine months ending Dec-16. The fabric manufacturer which is one of the largest knitting mills in the country was unable to obtain higher margin orders with uncertainty surrounding end –markets. The company came out of its financial troubles in 2010 and successfully turned the business around. The next phase of growth for the company is to shift its buyers to higher value added outputs which has proved challenging. We expect the company to pursue more lucrative segments which will add to bottom line growth in the future.
Another significant underperformer was Aitken Spence Hotel Holdings with recently opened associate properties in Sri Lanka performing poorly as well as the Indian property also falling below expectations. Despite tourist arrivals in Sri Lanka growing, the attraction to 4 and 5 star properties
remains sluggish. The Maldivian sector which had been a key contributor in the past was also performing poorly with occupancies declining as completion intensifies. We expect a medium term recovery with demand for local star class properties eventually returning and other South Asian investments also recovering over time.
Ceylon Investment’s approach to value driven long term investing has resulted in significant capital gains made over a period of time. New legislation to be introduced brought about an uncertainty on introduction of taxes on Ceylon Investment’s unrealized gains. In order to protect shareholder returns we realized profit on investments that had made significant gains over the years. As a result we divested significant positions in Commercial Bank, Sampath Bank and Tokyo Cement to secure gains to shareholders under the present tax regime. The total gains realised thereby amount to Rs. 108.78 Mn. The divestment was prompted by an anticipated tax on share trading as a business. It is of significant concern that tax issues have caused us to sell out at an unsuitable time. Never the less, as a cautionary measure, we decided to realise the higher accumulated gains.
Financial Review and Shareholder ReturnsCeylon Investment together with its share of profit of equity accounted investee, reported a profit after tax of Rs. 652.81 Mn for the year ended 31st March 2017 compared to Rs. 287.21 Mn of the previous year. The increase of Company profit by 127.3% is due to increase in Share of net profit of equity accounted investee “Rubber Investment Trust Limited, resulting from substantial realized gains recorded when compared with last year.
The net fair value losses on Instruments held as “fair value through profit or loss financial assets” amounts to Rs. 2.78 Mn for the current year, due to the fall market prices of shares, as opposed to the net fair value losses of Rs. 89.87 Mn for last year. The impairment loss on account of fall in fair value of Instruments held as “available for sale financial assets” which is either significant or prolonged, amounts to Rs. 95.21 Mn (2016 - Rs. 45.66 Mn) for the period under review on account of investments in Aitken Spence PLC and Aitken Spence Hotel Holding PLC.
Share of other comprehensive income / (expense) of equity accounted investee net of tax, which is the main component of other comprehensive Income, amounts to negative Rs. 1.24 Bn compared to negative of Rs. 3.57 Bn recorded in the previous year. This is mainly due to fair value losses recognised in other comprehensive income of the associate

Our Performance Management Discussion and Analysis
Financial Information Supplementary InformationGovernance and Risk Management
company, resulting from the negative fair value change of the Strategic Investment which experienced a share price drop of 26% (2016: 48%).
The Company’s earnings per share (EPS) increased to Rs. 6.56 from Rs. 2.89, a growth of 127.3%.
The Company declared a first interim dividend of Rs. 1.75/- per share as final. The Company has been maintaining a consistent dividend to match shareholder expectations and this year sees an increase of 17%.
The net asset value per share (NAV) amounted to Rs. 86.00 which is based on fair value of its portfolio.
As at 31st March 2017 2016 Change %
ASPI 6,061.94 6,071.88 (0.16)
NAV per share (Rs.) 86.00 91.54 (6.05)
Market price per share (Rs.) 40.00 52.70 (24.10)
Discount of NAV to market price per share
53.49%
42.43%
The Company’s share has been trading at a discount in the CSE over the past years. As of 31st March 2017, the market price of the Company was at Rs. 40.00 recording a drop of 24.10% for the year, and still trades at a discount of 53.49% to the NAV. Shareholder wealth depreciation during the year was 20.78 % taking into account both share price movement and dividend for the year.
ECONOMY AND MARKET
ECONOMY
The year 2016 saw the economy grow by 4.4% compared to 4.8% in the previous year which remained relatively low on account of higher interest rates and a general slowdown along with construction activity. The economy going forward is expected to gradually accelerate led by service sector and construction activity. Large scale infrastructure projects
and private sector constructions are expected to drive the manufacturing sectors contribution to the overall economy. Although within the service sector consumption is slowing as a result of higher interest rates and inflation, financial services should continue to expand ensuring growth in the service sector. Meanwhile a major foreign relations effort by the present administration has improved perception of Sri Lanka amongst the international community and trade agreements are being explored providing future opportunity for economic growth.
0
2
4
6
8
10
12
2013 2014 2015 2016 2017
EPS DPS
EPS vs Dividends(Rs.)
0
30
60
90
120
150
2013 2014 2015 2016 2017NAV per share at Market Value Price per share
NAV per share (Market value) vs Share price (Rs.)

Ceylon Investment PLC Annual Report 2016/17 10 11
Management Discussion and Analysis
An overheating economy saw Central Bank increasing policy rates in July 2016 and Mar 2017 in an attempt to stem credit growth and curtail the trade deficit. As a result, interest rates remain elevated with the 1 year Treasury bill auction at 10.98% and 5 year Treasury bond trading at 12.55% as at 31st March 2017. We expect interest rates to trend down towards the second half of CY 2017 with lower external repayments falling in this time period and fiscal consolidation measures to take place increasing confidence in the economy. However, risks still persist on the inflation side with increasing commodity prices and weather patterns. Also, external risks can impact the rupee and domestic interest rates such as investor reactions to Fed rate hikes and geo-political tensions.
Sri Lanka’s economy continues to grapple with a high debt burden, at 79% of GDP, which dampens growth prospects and creates pressure on the Balance of Payments. The country must take steps to attract the much elusive foreign direct investment which is required to get out of this debt trap. To attract capital, structural reforms are required of which part has been addressed through the IMF programme which is currently underway. The IMF programme also addresses the key area of fiscal consolidation through the implementation of a new Inland Revenue Act and promoting a more equitable, efficient and predictable tax structure. The IMF program also addresses public financial management reform, state enterprise
reform, flexible exchange rate, inflation targeting and reforms in trade and investment. Once these reforms are successfully implemented, we expect the Sri Lankan economy to be on a much better footing.
EQUITY MARKET REVIEW
Economic concerns loomed over the Colombo Stock Exchange like a dark cloud as the country continued to grapple with its excessive debt burden resulting in higher interest rates and slower economic activity. The financial year ending March 2017 saw the All Share Price Index give a dismal -0.16% return. It was natural for domestic retail and institutional investors to take a back seat and allocate their funds to more attractive fixed income investments. However, opportunities were available for experienced bottom up stock pickers such as Ceylon Investment whose discretionary portfolio provided a return of 10.78%.
The staff level agreement announced in April 2016 for USD 1.5 Bn, with the IMF brought about a level of confidence that steps are being taken to get the economy back on track with the guidance of the IMF. This brought about a sense of optimism at the start of the financial year with the ASPI providing a return of 7.3% for the month of April 2016. However, net foreign selling along with the dawning in domestic investors’ minds that fiscal consolidation, a pillar of the IMF program, will result in increases in effective
-10
-5
0
5
10
15
20
25
Foods and Beverage Wholesale and Retail Construction Tourism Financial Services GDP
2Q 2
015
3Q 2
015
4Q 2
015
1Q 2
016
2Q 2
016
3Q 2
016
4Q 2
016
1Q 2
017
GDP and Sector Growth Rates %

taxation saw them adopting a ‘wait and see’ approach. ASPI returns from May to Dec 2016 saw the market decline by 4.4%.
Geopolitical uncertainty and a wave of nationalism sweeping across the globe, saw unforeseen changes taking place such as Brexit and the rise to presidency of Donald Trump. Brexit continues to apply pressure to the idealism of an integrated Europe and negotiations will be ongoing to determine the fate of Britain and its trading partners. However, a wave of optimism across markets emanating from Trump’s policies and US economic recovery has seen global investors utilizing a more ‘risk-on’ approach. The past few months have seen equities across developed economies showing strong returns and a renewed interest in emerging and frontier markets. Foreign inflows for the 6 months preceding March 2017 has been a total of Rs. 10.5 billion and have dominated market participation with interest centred around liquid blue chip stocks.
Sectors that performed well for the financial year included Manufacturing (+10.5%), Healthcare (+9.48%) and beverage food and tobacco (+6.14%). Manufacturing did well on account of softer commodity prices for part of the year and volume growth for construction related companies.
Consumption related stocks in the beverage food and tobacco also did well with major slowdown from higher interest rates yet to take full effect. Sectors that didn’t
perform included Hotels (-3.98%) which continue to struggle as tourists demand for lower and unrated accommodation demand grows. Banks Finance and Insurance sector return (-1.65%) is largely account of poor market participation in these liquid stocks and capital raising requirements coming up. However, underlying fundamentals in banking stocks continues to improve and leasing companies continue to be challenged with higher interest rates and economic conditions.
Market capitalization as at 31st March 2017 was Rs. 2.66 trillion compares with Rs. 2.58 trillion a year ago. This can increase in the near term with the CSE's move to include non-voting shares in the overall market capitalization. The All Share Price Index remains attractive at current levels with a 1 year and 2 year forward PER of 11.8X and 11.2x based on our coverage which accounts for 72% of the market capitalization. Earnings growth is expected to be 10.1% and 8.4% as the economy continues to slow-down with higher interest rates and balance of payment concerns. Based on our universe of stocks which we track, earnings growth over the last five years has outpaced market price growth. Relative to peer regional markets, the CSE looks attractive and shows strong return potential over the medium term. Efforts to list even small stakes of key state-owned enterprises will give a boost to market size, liquidity and trading opportunities.
0
5
10
15
20
25
Frontier
Sri L
anka
Paki
stan
Viet
nam
Arge
ntin
a
Rus
sia
Bra
zil
Shan
ghai
Jaka
rta
Thai
land
Chile
Mal
aysi
a
Mex
ico
Phili
pine
se
Bom
bay
Hon
g K
ong
Ger
man
y
Sing
apor
e
Lond
on
Aust
ralia
New
Yor
k
Toky
o
Emerging Developed
Peer Market PE(Forward PE)
Our Performance Management Discussion and Analysis
Financial Information Supplementary InformationGovernance and Risk Management

Ceylon Investment PLC Annual Report 2016/17 12 13
Overview of Risk Management
Risk Management is the process of identification and assessment of risks arising due to factors which are internal and external to the entity, and implementation of identified, mitigating actions to address such risks. Management of risk helps to avoid or minimise unanticipated losses being incurred. It is not a one time or periodic assessment, rather it is a continuous process, which is also an integral part of normal business operations and the management of the entity.
Risk Management Structure at Ceylon Investment
The Risk Management structure established at Ceylon Guardian Group is applicable across the parent company and all other entities of the Group which includes Ceylon Investment PLC. The Company’s Board of Directors has
overall responsibility for the establishment and oversight of the Company’s risk management framework. The Board of Directors has delegated this function to the Management of Guardian Fund Management Limited (GFM) which is a fully owned subsidiary of the parent company, the Fund Managers and Carsons Management Services (Private) Limited (CMSL), the Managers; who are responsible for developing and monitoring the Ceylon Guardian Group’s risk management policies and reports regularly to the Board of Directors on its activities. The Ceylon Guardian Group’s risk management policies are established to identify and analyse the risks faced by the Group, to set appropriate risk limits and controls, and to monitor risks and adherence to limits. Risk management policies, and systems are reviewed regularly to reflect changes in market conditions and the Group’s activities.
Risk Management
The Management team
• Risk identification, analysis and risk assessment.
• Formulation of risk management policies, strategies and tools.
• Implementation, control of risk mitigating actions.
The Board of Directors
• Overall responsibility for risk management.
• Review group risk profile.
The Investment committee
• Provides advice and insights to the fund management team.
Audit committee
• Oversight over the financial reporting function of the Group and the system of internal controls.
• Monitor the audit function, compliance and risk management process.
Risk and Compliance team
• Evaluation of management’s risk assessment / strategies.
• Monitor deviations from pre set standards.
• Provide recommendations for improvements
Compliance audit / periodic reviews
Direct and monitor
Report for evaluation
Business units and Processes

Management Discussion and Analysis
Our Performance Governance and Risk Management
Financial Information Supplementary Information
The Audit Committee of the Company has oversight over the financial reporting function of the Company, the system of internal controls as well as the audit, compliance and risk management processes. Group Internal Audit conducts periodic compliance audits / review and reports to the Audit Committee. Further, an Investment Committee provides advice and insights to the fund management team to further sharpen and refine their decision making process. This organisation structure determines the objectives and policies of our risk management framework and promotes a culture of risk awareness and balanced risk-taking within the Company.
Risk Categories
Ceylon Investments PLC is within the Ceylon Guardian Group which operates the portfolio and asset management
sector of the Carson’s Group. The Company's business operations include holding an investment portfolio which consist of listed equity securities and fixed income securities. The Company faces various types of risk, some of which are applicable across all the assets classes under management while some are applicable to specific asset category.
The key risks are monitored and managed as a continuous process.
Risk Category Impact and mitigating strategies
Macro environmental risks: Overall macro-economic conditions and political factors affect the risk profile of the Company. The variations of macro-economic variables like Gross Domestic Product (GDP), interest rate, inflation, exchange rates and changes in the political environment and government policies affect the achievement of Company business and financial objectives.
Country risks
The risk associated with operations which are subject to various exchange control regulations, currency fluctuations, transaction costs & taxes and other actions that may be imposed by the government or policy making bodies of the particular foreign country or Sri Lanka.
• This is a new risk area for which we are looking to build a framework as the Group intends to exploit new markets in the future, when regulations permit.
• Company has invested in The Sri Lanka Fund, which is domiciled in Cayman Island, is subject to laws and regulations imposed by regulatory authorities there. Changes in Cayman Island regulatory environment, in the context of The Sri Lanka Fund is continuously monitored with the assistance of the Fund’s Lawyers who have the necessary expertise.

Ceylon Investment PLC Annual Report 2016/17 14 15
Risk Management
Risk Category Impact and mitigating strategies
Currency risks
The risk associated with any fluctuations of foreign exchanges rates against Sri Lanka Rupee.
• The Sri Lanka Fund, of which the reporting currency is US dollars, is exposed to risk of currency impact on translation.
Market risk - domestic
The exposure to adverse movements in both equity / fixed income securities market, which can result in value loss as well as variations in the anticipated returns from those securities. This is mainly caused by macro variables such as interest rates, currency, inflation and availability of credit which affect both capital and money markets, and the value of securities.
• Market risks are inherent in every security and are thus collectively considered at the portfolio level to take into account the asset allocation decisions of the portfolio. The risks affecting a particular class of security are mitigated by switching to asset classes that are assessed to be less risky in a particular scenario. The sectoral and security exposure is continuously monitored.
• A sound research base to determine changing economic fundamentals of the country, determine the impact on equity vs fixed income investments and the prompt shifting of funds between asset classes. The sensitivity of stock valuations to changes in economic indicators are continuously monitored.
• The returns of money market funds the Company has invested in, is sensitive to changes in the financial sector. Hence the behaviour of interest rate determinants are monitored, and anticipated interest rate trends are considered in pursuing investment strategy.
Market risk - international and external
The risk that the domestic market will have an indirect impact from other markets, international trade and capital inflows / outflows, changing economic indicators and policies in the global context. The entry and exit of foreign investors from the local market is also determined by the macro economic trends prevailing in foreign markets and relative valuations of our market vis-a-vis developed and other comparative Asian markets.
• Commodity risk is somewhat high for the domestic economy, since Sri Lanka is import dependent for vital commodities. We continuously monitor global developments in capital markets which is vital to assess and mitigate this risk.
• Building of expertise in foreign markets will take place going forward, as we would look to invest overseas gradually. In mitigating the risk we would tie up or collaborate with foreign entities that have expertise in such markets in order to gain knowledge.

Risk Category Impact and mitigating strategies
Portfolio Risks: The risk arising due to investment strategy, factors inherent to investment instruments and composition of the portfolio which affect the return of the portfolio.
General securities risk
Inherent investment risks associated with the particular investment instrument or issuing entity of the security. The price or value of any security may fluctuate, resulting in possible loss not only of returns and profits, but even all or part of the principal sums.
• General securities risk is applicable, regardless of whether the instrument is equity listed / unlisted or fixed income, but the magnitude of risk will vary with the type of the instrument.
• Portfolio management and investment selection process which is a bottom up approach, is designed to optimise the risk/return trade off. Risk mitigating methodology is based on the internal research process, and prospective investments are selected from fundamental analysis and contact with corporate management of the issuing company through company visits. A continuous process of monitoring the performance of investee companies is adopted, after the investment is made.
Concentration risk
This is the risk that the portfolio is over exposed to a particular sector / sectors or a security / securities resulting in the risk and return of the portfolio being over dependent on the performances / risk profiles of those sectors or securities.
• Monitoring sector exposure and single company / group exposure of the portfolio as a diversification and a mitigation strategy.
• Loss limits are set to monitor stocks performing below their cost of acquisition to determine whether temporary capital erosion is a concern.
• Monitoring by the compliance team takes place as a routine process.
Liquidity risk
Liquidity is the tradability of the securities in the market or the ability realise cash with minimum loss of capital. The risk is that if the investment instruments of the portfolio are less liquid, execution of fund management decisions are affected.
• Lower liquidity of securities could affect the fund manager’s ability to transact, which in turn, could affect the fund’s overall performance. This might be due to poor market sentiment of a security, or low levels of publicly traded quantities. On acquisition of shares, we consider on the factors like size of free float, tradability of the stock, market turnover, major shareholders etc.
Management Discussion and Analysis
Our Performance Governance and Risk Management
Financial Information Supplementary Information

Ceylon Investment PLC Annual Report 2016/17 16 17
Risk Management
Risk Category Impact and mitigating strategies
Operational Risks : Guardian Fund Management Limited (GFM), the Investment managers is responsible for the Company’s investment management operations, hence the operational risk arises within the process and systems of GFM. This is the risk of losses being incurred resulting from disruptions, disturbance of business operations caused by events due to inadequate or failed internal processes, people and systems within the organisation. The management of operational risk is a continuous process which includes identification, assessment of risk and implementation of measures to address such risk, which specifically covers following key areas which are significant in the context of Investment operations.
Systems and process risks
The Company’s business operations are structured in a way that, those are performed as interconnected / interdependent processes. The divisions of the company, either separately or collectively are responsible for the functions of these process which utilise human / physical resources and information systems
• The management of systems and process risk consist of identifying risks and formulating plans promoting best practices, implementing internal controls / systems and monitoring compliance with these internal guidelines.
• The processes are continuously monitored to identify the areas of weakness and to implement improvements.
• Correct application of recommended practices where back up procedures are followed on a routine basis to ensure data and Information security. Our accounting systems and portfolio management systems are regularly backed up to prevent loss of data.
• Business continuity plan which describes how to resume business after a disruption occurs in business process, location and the system. A Disaster Recovery Plan is available at the Carson’s Group level which deals with recovering Information Technology infrastructure, facilitating of critical operations to be in active in an alternate location etc. after a disastrous interruption.
• Systems support and the maintenance agreements with for the portfolio management software is made available through an annual maintenance agreement with the software vendor which ensures on line support for system issues and queries.
• The internal audit function of the Carson’s Group ensures the safeguarding of Company assets, recommends process improvements in areas where process control failures are noted and compliance with regulatory requirements etc.

Risk Category Impact and mitigating strategies
Reputation risk
This is a critical risk in that as a financial entity any loss / theft or misappropriation of cash / financial assets can cause permanent and long term loss of business
• A sound system of internal controls and quarterly internal audits are carried out by the outsourced auditors BDO Partners.
• A code of ethics signed by all staff and constant education and awareness.
• Regular staff communication.
Staff risks
A fund management operational unit requires qualified professionals with experience in the fund management industry. Knowledge of the operating mechanism of the market as well as its norms and ethics is of importance.
• Having diversity in the team, developing a strong second level, providing training and development opportunities, are standard practices of the industry with which we benchmark ourselves. A performance related incentive scheme for the staff is in place and is being reviewed regularly. The networking ability of key staff to source clients and deals is important in running a successful fund management operation by being shown important deals by market intermediaries.
• The staff of GFM are all professionally qualified with a track record of experience in the industry. A strong research team has been developed to complement the fund management operation and raise the standard of the investment decision making process. Staff training and development is identified as an important area of concern, while retention is managed through a comprehensive reward structure and incentive scheme, opportunities for career progression and a culture of being HR oriented. Collectively these steps help us to work towards having an effective succession plan in place.
Management Discussion and Analysis
Our Performance Governance and Risk Management
Financial Information Supplementary Information

Ceylon Investment PLC Annual Report 2016/17 18 19
The Board of Directors of Ceylon Investment PLC have pleasure in presenting to the shareholders their Report, together with the Audited Financial Statements for the year ended 31st March 2017.
The details set out herein provide the pertinent information required by the Companies Act, No. 07 of 2007, Listing Rules of the Colombo Stock Exchange and are guided by recommended best Accounting Practices.
The Annual Report was approved by the Board of Directors on 21st June 2017.
1. GENERAL
Ceylon Investment PLC (the “Company”) is a public limited liability Company incorporated in Sri Lanka in 1919. The shares of the Company have a primary listing on the Colombo Stock Exchange.
2. PRINCIPAL ACTIVITY OF THE COMPANY
The principal activities of the Company and its associate company are to act as specialised investment vehicle focusing on listed equity investments.
There were no significant changes in the nature of the principal activities of the Company during the financial year under review.
3. REVIEW OF OPERATIONS AND FUTURE DEVELOPMENTS
The Chairperson's Statement and the Management Discussion and Analysis on pages 03 to 11 provide an overall assessment of the business performance of the Company and its future developments. These reports, together with the audited Financial Statements reflect the state of affairs of the Company.
4. FINANCIAL STATEMENTS
The Financial Statements which include the Statement of Profit or Loss and Other Comprehensive Income, Statement of Financial Position, Statement
Annual Report of the Board of Directors on the affairs of the Company
of Cash Flow, Statement of Changes in Equity and Notes to the Financial Statements of the Company for the year ended 31st March 2017 are set out on pages 40 to 87 of this Report. These Financial Statements do comply with the requirements of the Companies Act, No. 07 of 2007.
4.1. REVENUE
The Company generated a revenue of Rs. 298 Mn (2016 – Rs. 322 Mn). A detailed analysis of revenue for the period is given in note 11 to the financial statements.
4.2. Financial results and appropriations
An abridgement of the financial performance of the Company is presented in the table below:
(In Rupees Thousands)
For the year ended 31st March 2017 2016
Retained earnings brought forward from previous year 2,634,502 2,648,757
Super Gain Tax for the year of Assessment 2013/14 - (26,856)
Adjusted retained earnings brought forward from previous year 2,634,502 2,621,901
Profit for the year 142,381 124,293
Dividend received from associate company 108,584 79,957
Forfeiture of unclaimed dividends 3,132 4,214
Scrip Dividend - (98,514)
Dividend (174,039) (149,177)
Transfers - 51,828
2,714,560 2,634,502
4.3. Significant accounting policies
The accounting policies adopted in the preparation of these financial statements are given on pages 44 to 53.

Management Discussion and Analysis
Our Performance Governance and Risk Management
Financial Information Supplementary Information
4.4. Investment in Financial Instruments
Available for sale financial assets / fair value through profit or loss financial assets.
Investments in financial instruments of the Company represents investments in available for sale financial assets and investments in fair value through profit or loss financial assets, categorised into,
• Fair value hierarchy Level 1 - quoted securities / unit trusts
• Fair value hierarchy Level 3 – unlisted equity
The details of financial instruments categorised in to levels in the fair value hierarchy are given in note 27.5 to the financial statements.
4.5. Reserves.
As at 31st March 2017, the total reserves of the Company stood at Rs. 7,789.6 Mn (2016 - Rs. 8,340.2 Mn).
The movements and the details are set out in the Statement of Changes in Equity and in note 24 to the financial statements.
4.6. Available for sale financial assets reserve
During the year, the net positive movement of ‘available for sale financial assets reserve’ amounted to Rs. 213 Mn (2016 - net negative movement of Rs. 519.9 Mn) arising out of transfer of realised gains and adjustment on fair valuation of investments in available for sale financial assets.
5. STATEMENT OF DIRECTORS’ RESPONSIBILITIES
The responsibilities of the Directors in relation to the Financial Statements are detailed in the following paragraphs, whilst the responsibilities of the Auditors are set out in the Independent Auditors’ Report.
According to the Companies Act No. 07 of 2007 and the Sri Lanka Accounting and Auditing Standards Act No. 15 of 1995, the Directors are required to prepare Financial Statements for each financial year, giving
a true and fair view of the state of affairs of the Company as at the end of the financial year and of the performance for the said period.
The financial statements comprise of inter alia:
• a Statement of Financial Position, which presents a true and fair view of the state of affairs of the Company as at the end of the financial year:
• a Statement of Profit or Loss and Other Comprehensive Income of the Company, which presents a true and fair view of the Profit and Loss and Other Comprehensive Income of the Company for the financial year.
In preparing these Financial Statements the Directors are required to ensure that:
- appropriate accounting policies have been selected and applied consistently, while material departures, if any, have been disclosed and explained;
- all applicable Accounting Standards have been complied with;
- reasonable and prudent judgments and estimates have been made; and
- provides information required by and otherwise comply with the Companies Act No. 07 of 2007 and the Listing Rules of the Colombo Stock Exchange.
The Directors are responsible for ensuring that the Company maintains sufficient accounting records to disclose with reasonable accuracy, the financial position of the Company in order to ensure that its Financial Statements have been prepared and presented in accordance with the Sri Lanka Accounting and Auditing Standards Act No. 15 of 1995 and meet with the requirements of the Companies Act, No. 07 of 2007.
They are also responsible for taking reasonable measures to safeguard the assets of the Company and in this regard to give proper consideration to the establishment and effective operation of appropriate

Ceylon Investment PLC Annual Report 2016/17 20 21
Annual Report of the Board of Directors on the affairs of the Company
systems of internal control with a view to prevent, detect and rectify frauds and other irregularities.
These Financial Statements have been prepared on a going concern basis, since the Directors are of the view that the Company has adequate resources to continue in operation, in the foreseeable future from the date of approving these financial statements.
The Directors are also of the view that they have discharged their responsibilities as set out in this statement.
6. OUTSTANDING LITIGATION
There are no litigations currently pending against the Company.
7. INTERESTS REGISTER
The Company maintains the Interests Register conforming to the provisions of the Companies Act No.07 of 2007.
All Directors have made declarations as provided for in Section 192(2) of the Companies Act aforesaid.
The relevant details as required by the Companies Act No. 07 of 2007 have been entered in the Interests Register during the year under review.
The Interests Register is available for inspection as required under the Companies Act. No. 07 of 2007.
7.1. Remuneration of Directors
Directors’ remuneration for the financial year ended 31st March 2017 is given in note 12 to the financial statements.
7.2. Directors’ Interest in contracts and shares
Directors’ interests in contracts of the Company have been declared at Meetings of the Directors. The Directors have had no direct or indirect interest in any other contracts or proposed contracts in relation to the business of the Company except for the following;
Name of the Company
Common directors
Nature of transactions
Value of the transactions
Ceylon Guardian Investment Trust PLC
D. C. R. GunawardenaMrs. M. A. R. C. CoorayV. M. FernandoK. SelvanathanT. C. M. ChiaMrs. W. Y. R. Fernando
Dividend paid 112,019
Rubber Investment Trust Limited
D. C. R. GunawardenaA. P. Weeratunge
Dividends received 103,191
Guardian Fund Management Limited (GFM)
K. SelvanathanA. P. WeeratungeMrs. W. Y. R. Fernando
Portfolio management fees paid 19,398
Carsons Management Services (Private) Limited
K. SelvanathanA. P. Weeratunge
Support service fees paid
Computer fees paid
Secretarial fees paid
10,791
420
403
Hatton National Bank PLC
Mrs. M. A. R. C. Cooray
Interest income received
Placement in demand deposits
Bank charges paid
636
80
2

Management Discussion and Analysis
Our Performance Governance and Risk Management
Financial Information Supplementary Information
The Directors had the following interests in the ordinary shares of the Company as shown in the table below.
Directors No. of shares as at
31st March
2017
31st March
2016
Mrs. M. A. R. C. Cooray (Chairperson)
- -
Mr. D. C. R. Gunawardena 257 257
Mr. A. P. Weeratunge - -
Mr. V. M. Fernando - -
Mr. K. Selvanathan - -
Mr. T. C. M. Chia - -
Mrs. W. Y. R. Fernando* - -
Mr. I. Paulraj** 257 257
*Appointed to the Board with effect from 15th August 2016.
**Resigned with effect from 15th August 2016.
8. DIRECTORS
The names of the Directors who served during the year are given under Corporate Information provided in the inner back cover of the Annual Report.
8.1. Changes in the Directorate
Mr. I Paulraj Chairman / Non-Executive Director resigned from the Board with effect from 15th August 2016. Pursuant to his resignation Mrs. M. A. R. C. Cooray was appointed as the Chairperson of the Board with effect from 1st September 2016.
Mrs. W. Y. R. Fernando was appointed as an Executive Director to the Board with effect from 15th August 2016.
8.2. Directors to Retire by Rotation
In terms of Articles 89, 90 and 91 of the Articles of Association of the Company, Mr. D. C. R. Gunawardena, Mr. V. M. Fernando and Mr. T. C. M. Chia retires by rotation and being eligible offer themselves for re-election.
8.3. Retirement at the First Annual General Meeting following the appointment as a Director
In terms of Articles 88 and 95 of the Articles of Association of the Company Mrs. W. Y. R. Fernando retires from the Board and being eligible offers herself for re-election.
9. CORPORATE GOVERNANCE
The Board has ensured that the Company has complied with the Corporate Governance Rules as per the Listing Rules of the Colombo Stock Exchange.
9.1. Regulatory Benchmarks
The Company’s activities are regulated and are governed by the :
1) Companies Act, No.07 of 2007
2) Listing Rules of the Colombo Stock Exchange (CSE)
3) Rules of the Securities and Exchange Commission of Sri Lanka (SEC)
4) Central Bank of Sri Lanka (CBSL)
Ceylon Investment PLC has been registered as an Underwriter with the Securities and Exchange Commission of Sri Lanka (SEC).
The above registration is renewed on an annual basis and the Company has to fulfil the criteria stipulated by the SEC for such renewal. These include, amongst many other provisions, maintenance of a minimum capital, employment of qualified staff, setting in place clear systems and procedures for handling investor and regular reporting and filings with the Regulator.

Ceylon Investment PLC Annual Report 2016/17 22 23
Annual Report of the Board of Directors on the affairs of the Company
9.2. Board of Directors
The following Directors held office during the period under review and their brief profiles are given on pages 30 to 33 of the Annual Report:
Directors Executive / Non-Executive / Independent
Mrs. M. A. R. C. Cooray (Chairperson)
Non-Executive/ Independent*
Mr. D. C. R. Gunawardena Non-Executive
Mr. A. P. Weeratunge Executive
Mr. V. M. Fernando Non-Executive/ Independent**
Mr. K. Selvanathan Executive
Mr. T. C. M. Chia Non-Executive/ Independent***
Mrs. W. Y. R. Fernando Executive
Mr. I. Paulraj Non-Executive
Mr. I. Paulraj Chairman / Non-Executive Director resigned from the Board with effect from 15th August 2016. Mrs. W. Y. R. Fernando was appointed to the Board with effect from 15th August 2016.
Each of the Non-Executive Directors of the Company has submitted a signed declaration on Independence/Non-Independence as per Rule 7.10.2(b) of the Listing Rules of the Colombo Stock Exchange (CSE). The said declarations were tabled at a Meeting of the Board of Directors of the Company held on 21st June 2017, in order to enable the Board of Directors to determine the Independence/Non-Independence of each of the Non-Executive Directors, in terms of Rule 7.10.3(a) of the Listing Rules of the CSE.
* The Board has determined that Mrs. M.A.R.C. Cooray is an Independent Director in spite of being a Director of Ceylon Guardian Investment Trust PLC, in which a majority of the other Directors of the
Board are also Directors and which has a substantial shareholding in the Company, since she is not directly involved in the management of the Company.
** The Board has determined that Mr. V.M. Fernando is an Independent Director in spite of being a Director of Ceylon Guardian Investment Trust PLC, in which a majority of the other Directors of the Board are also Directors and which has a substantial shareholding in the Company, since he is not directly involved in the management of the Company.
*** The Board has determined that Mr. T.C.M. Chia is an Independent Director in spite of being a Director of Ceylon Guardian Investment Trust PLC, in which a majority of the other Directors of the Board are also Directors and which has a substantial shareholding in the Company, since he is not directly involved in the management of the Company.
9.3. Directors’ Meetings Attendance
Four (04) Board Meetings were convened during the financial year and the attendance of the Directors was as follows:
Directors Meetings attended
Mrs. M. A. R. C. Cooray (Chairperson)
4/4
Mr. D. C. R. Gunawardena 4/4
Mr. A. P. Weeratunge 2/4
Mr. V. M. Fernando 3/4
Mr. K. Selvanathan 4/4
Mr. T. C. M. Chia 3/4
Mrs. W. Y. R. Fernando* 2/2
Mr. I. Paulraj ** 2/2
*Appointed with effect from 15th August 2016. ** Resigned with effect from 15th August 2016.
Management Discussion and Analysis
Our Performance Governance and Risk Management
Financial Information Supplementary Information
9.4. Board Evaluation
The ‘Board Evaluation Form’ of the Company focusses on the following areas;
• Core Board Responsibilities
• Board Meetings
• Committee Meetings (any/ all sub-committees)
• Relationship with Management
• Individual self-assessment
• Stakeholder and Shareholder communication/ relationship
• Suggestions/ comments
The comments made by the Directors in the Board Evaluation Form are collated by the Nomination Committee of the Company and the results and proposed actions are reported to the Board of Directors. The suggestions and recommendations made by the Directors are being reviewed and implemented by the Company.
9.5. Audit Committee
The Parent Company of the Company is Ceylon Guardian Investment Trust PLC (CGIT) and Carson Cumberbatch PLC (CCPLC) in turn is the Parent Company of CGIT. As per Rule 7.10.6 of the Listing Rules of the Colombo Stock Exchange, the Audit Committee of CCPLC functions as the Audit Committee of the Company and comprises of the following Members:
Audit Committee Members
Executive / Non-Executive / Independent
Mr. V. P. Malalasekera (Chairman)
Non-Executive/ Independent Director of CCPLC
Mr. F. Mohideen Non-Executive/ Independent Director of CCPLC
Mr. D. C. R. Gunawardena
Non-Executive Director of CCPLC
The Audit Committee Report is given on pages 34 to 35 of this Annual Report.
9.6. Remuneration Committee
The Parent Company of the Company is Ceylon Guardian Investment Trust PLC (CGIT) and Carson Cumberbatch PLC (CCPLC) in turn is the Parent Company of CGIT.
As per Rule 7.10.5 of the Listing Rules of the Colombo Stock Exchange, the Remuneration Committee of CCPLC functions as the Remuneration Committee of the Company and comprises of the following Members:
Remuneration Committee Members
Executive/ Non-Executive/ Independent
Mr. I. Paulraj (Chairman) Non-Executive Director of CCPLC
Mr. D. C. R. Gunawardena Non-Executive Director of CCPLC
Mr. R. Theagarajah Non-Executive/ Independent Director of CCPLC
Mr. W.M.R.S. Dias Non-Executive/ Independent Director of CCPLC
Mr. T. de Zoysa Non-Executive/ Independent Director of CCPLC
Scope and Objective
The primary objective of the Remuneration Committee is to lead to establish a formal and transparent procedure for the development of a remuneration policy and the establishment of a remuneration structure.
A remuneration policy has been formulated based on market and industry factors and individual performance for all group Companies.
Functions and Proceedings
The Remuneration Committee recommends to the Board the remuneration to be paid to the Chief Executive Officer, Executive Directors and Non-Executive Directors. Based on the recommendation of the Remuneration Committee, the Board approves remuneration to the respective Directors.

Ceylon Investment PLC Annual Report 2016/17 24 25
Annual Report of the Board of Directors on the affairs of the Company
The Chief Executive Officer, Director-in-charge and other members of the senior management may be invited to attend meetings to discuss the performance of the Executive Directors and make proposals as necessary. Neither Executive nor Non-Executive Directors are involved in Remuneration Committee meetings when determinations are made in relation to the remuneration of the respective Directors.
The Committee is authorised by the Board to seek appropriate professional advice internally and externally as and when it is considered necessary.
The Remuneration Committee meets at least twice a year. During the period under review the Committee had two meetings and the attendance of the Members was as follows:-
Remuneration Committee Members
Meetings attended
Mr. I. Paulraj (Chairman) 1/2
Mr. D. C. R. Gunawardena 2/2
Mr. R. Theagarajah 1/2
Mr. W.M.R.S. Dias 2/2
Mr. T. de Zoysa 1/2
Reporting and Responsibilities
The Committee Chairman reports to the Board on its proceedings on all matters within its duties and responsibilities. The Committee makes recommendations to the Board as deemed appropriate on any area within its limit where action or improvements are needed.
Aggregated remuneration paid to the Non-Executive Directors of the Company is disclosed under note 12 to the financial statements. Executive Directors are not compensated for their role on the Board.
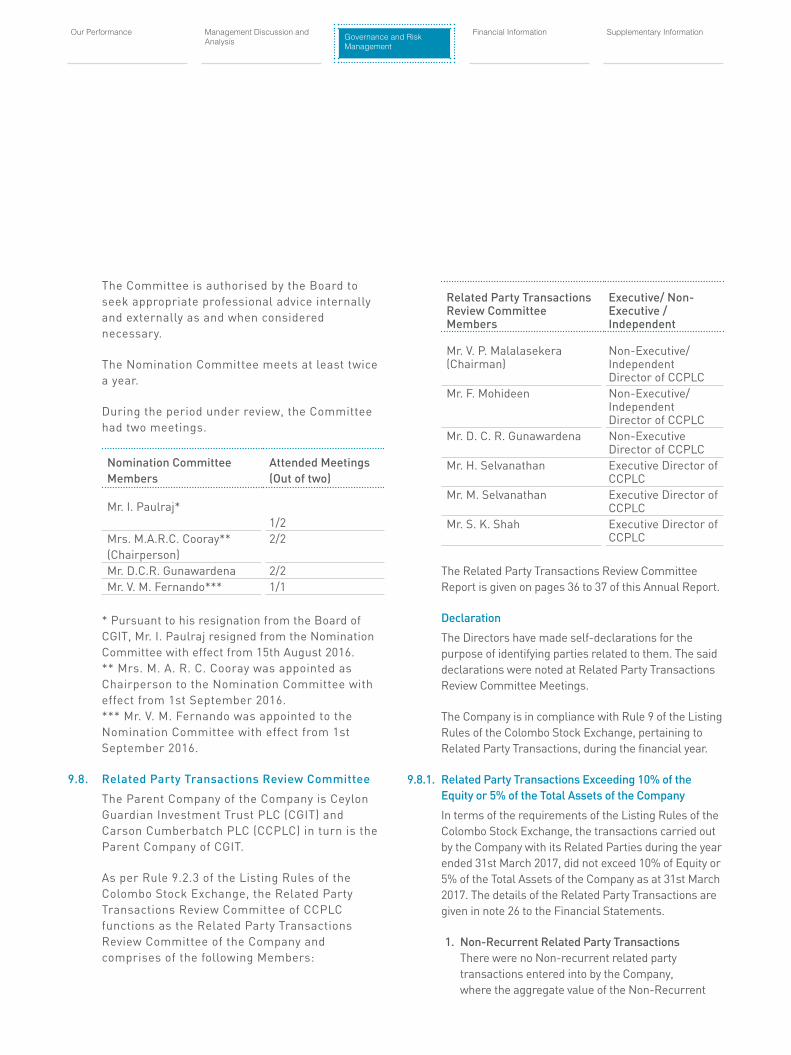
9.7. Nomination Committee
The Nomination Committee of Ceylon Guardian Investment Trust PLC (CGIT), the Parent Company functions as the Nomination Committee of
the Company and comprises of the following Members:-
Nomination Committee Members
Executive / Non-Executive / Independent
Mr. I. Paulraj * Non-Executive Director of CGIT
Mrs. M. A.R. C. Cooray (Chairperson) **
Non-Executive/ Independent Director of CGIT
Mr. D. C. R. Gunawardena
Non-Executive Director of CGIT
Mr. V. M. Fernando *** Non-Executive/ Independent Director of CGIT
* Pursuant to his resignation from the Board of CGIT, Mr. I. Paulraj resigned from the Nomination Committee with effect from 15th August 2016.
** Mrs. M. A. R. C. Cooray was appointed as Chairperson to the Nomination Committee with effect from 1st September 2016.
*** Mr. V. M. Fernando was appointed to the Nomination Committee with effect from 1st September 2016.
Scope and Objective The primary objective of the Nomination
Committee is to lead the process for Board appointments of new Directors to the Board and the nomination of members to represent the Company in group companies/investee companies.
Functions and Proceedings The Nomination Committee recommends
new appointments to the Board. Based on the recommendation of the Nomination Committee, the Board approves the new appointments of Executive and Non-Executive Directors to the Board.
Any Director of the Board and the Chief Executive Officer/ Director-in-Charge and other members of the senior management may be invited to attend Meetings of the Nomination Committee. The Committee may also invite appointed external consultants to aid the Committee in the discharge of its duties.
Management Discussion and Analysis
Our Performance Governance and Risk Management
Financial Information Supplementary Information
The Committee is authorised by the Board to seek appropriate professional advice internally and externally as and when considered necessary.
The Nomination Committee meets at least twice a year.
During the period under review, the Committee had two meetings.
Nomination Committee Members
Attended Meetings (Out of two)
Mr. I. Paulraj* 1/2
Mrs. M.A.R.C. Cooray** (Chairperson)
2/2
Mr. D.C.R. Gunawardena 2/2Mr. V. M. Fernando*** 1/1
* Pursuant to his resignation from the Board of CGIT, Mr. I. Paulraj resigned from the Nomination Committee with effect from 15th August 2016.** Mrs. M. A. R. C. Cooray was appointed as Chairperson to the Nomination Committee with effect from 1st September 2016. *** Mr. V. M. Fernando was appointed to the Nomination Committee with effect from 1st September 2016.
9.8. Related Party Transactions Review Committee
The Parent Company of the Company is Ceylon Guardian Investment Trust PLC (CGIT) and Carson Cumberbatch PLC (CCPLC) in turn is the Parent Company of CGIT.
As per Rule 9.2.3 of the Listing Rules of the Colombo Stock Exchange, the Related Party Transactions Review Committee of CCPLC functions as the Related Party Transactions Review Committee of the Company and comprises of the following Members:
Related Party Transactions Review Committee Members
Executive/ Non-Executive / Independent
Mr. V. P. Malalasekera (Chairman)
Non-Executive/ Independent Director of CCPLC
Mr. F. Mohideen Non-Executive/ Independent Director of CCPLC
Mr. D. C. R. Gunawardena Non-Executive Director of CCPLC
Mr. H. Selvanathan Executive Director of CCPLC
Mr. M. Selvanathan Executive Director of CCPLC
Mr. S. K. Shah Executive Director of CCPLC
The Related Party Transactions Review Committee Report is given on pages 36 to 37 of this Annual Report.
Declaration
The Directors have made self-declarations for the purpose of identifying parties related to them. The said declarations were noted at Related Party Transactions Review Committee Meetings.
The Company is in compliance with Rule 9 of the Listing Rules of the Colombo Stock Exchange, pertaining to Related Party Transactions, during the financial year.
9.8.1. Related Party Transactions Exceeding 10% of the Equity or 5% of the Total Assets of the Company
In terms of the requirements of the Listing Rules of the Colombo Stock Exchange, the transactions carried out by the Company with its Related Parties during the year ended 31st March 2017, did not exceed 10% of Equity or 5% of the Total Assets of the Company as at 31st March 2017. The details of the Related Party Transactions are given in note 26 to the Financial Statements.
1. Non-Recurrent Related Party Transactions There were no Non-recurrent related party
transactions entered into by the Company, where the aggregate value of the Non-Recurrent

Ceylon Investment PLC Annual Report 2016/17 26 27
Annual Report of the Board of Directors on the affairs of the Company
Related Party Transactions exceeds 10% of the Shareholders’ equity or 5% of the total assets, whichever is lower, of the Company as at 31st March 2017.
2. Recurrent Related Party Transactions There were no Recurrent related party
transactions where the aggregate value of the Recurrent Related Party Transactions exceeded 10% of the Gross Revenue/ Income of the Company, as per the latest Audited Financial Statements.
10. INTERNAL CONTROL AND RISK MANAGEMENT
The ultimate responsibility to establish, monitor and review a Company-wide internal control system rests with the Board of Directors. The intensity, depth and the tolerance limits for each component of the internal control system would be based on the weight of the element of risk imposed on the sustenance of the business by the respective area of operation. Whilst a strong internal control system would mitigate the crystallisation of risk elements to a greater extent, employment of external support structures would also be necessary based on the risk assessments made thereon.
Effective maintenance of internal controls, risk identification and mitigation is handed down to the respective members of the senior management within the guidelines of benchmark policies, procedures and authority limits clearly laid down.
Group Internal Audit, whose scope of scrutiny is entirely driven by the grading of the risk involved will be monitoring and providing the feedback to the management and the respective Audit Committee. Regular submission of compliance and internal solvency certificates vouched by the heads of the respective divisions as a mandatory agenda item keeps the Directors abreast of the health of the Company’s resource base and governance requirements.
This allows the Board to have total control of the fulfilment of governance requirements by providing opportunity to take timely preventive action in case of potential deterioration of status quo. A more detailed description of the risk management strategies of the Company’s given on pages 12 to 17.
11. INDEPENDENT AUDITORS
The Company’s Auditors during the year under review were Messrs. KPMG, Chartered Accountants.
A sum of Rs. 365,000/- was paid to them by the Company as audit fees for the year ended 31st March 2017 (2016 – Rs. 365,000/- ). In addition to the above, the Auditors were paid Rs. 150,000/- (2016 – Rs. 170,000/-) as professional fees for audit related services.
The retiring Auditors have expressed their willingness to continue in office. A Resolution to re-appoint them as Auditors of the Company and authorising the Directors to fix their remuneration will be proposed at the forthcoming Annual General Meeting.
The Audit Committee reviewed the appointment of the Auditors, its effectiveness and their relationship with the Company, including the level of audit and non-audit fees paid to the Auditors.
11.1. Auditors’ relationship or any interest with the Company
The Directors are satisfied that, based on written representations made by the Independent Auditors to the Board, the Auditors did not have any interest with the Company that would impair their independence.
12. INDEPENDENT AUDITORS’ REPORT
The Independent Auditors’ Report on the financial statements is given on page 39 of the Annual Report.
13. SIGNIFICANT EVENTS DURING THE YEAR
There were no significant events during the year.
Management Discussion and Analysis
Our Performance Governance and Risk Management
Financial Information Supplementary Information
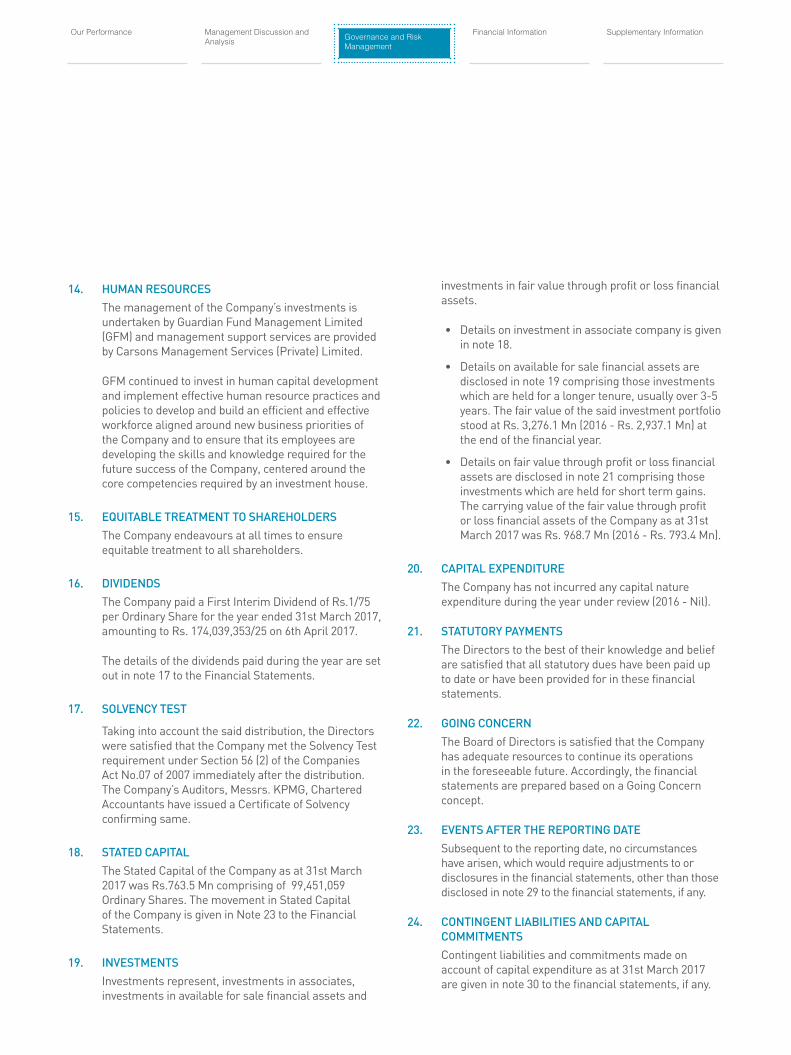
14. HUMAN RESOURCES
The management of the Company’s investments is undertaken by Guardian Fund Management Limited (GFM) and management support services are provided by Carsons Management Services (Private) Limited.
GFM continued to invest in human capital development and implement effective human resource practices and policies to develop and build an efficient and effective workforce aligned around new business priorities of the Company and to ensure that its employees are developing the skills and knowledge required for the future success of the Company, centered around the core competencies required by an investment house.
15. EQUITABLE TREATMENT TO SHAREHOLDERS
The Company endeavours at all times to ensure equitable treatment to all shareholders.
16. DIVIDENDS
The Company paid a First Interim Dividend of Rs.1/75 per Ordinary Share for the year ended 31st March 2017, amounting to Rs. 174,039,353/25 on 6th April 2017.
The details of the dividends paid during the year are set out in note 17 to the Financial Statements.
17. SOLVENCY TEST
Taking into account the said distribution, the Directors were satisfied that the Company met the Solvency Test requirement under Section 56 (2) of the Companies Act No.07 of 2007 immediately after the distribution. The Company’s Auditors, Messrs. KPMG, Chartered Accountants have issued a Certificate of Solvency confirming same.
18. STATED CAPITAL
The Stated Capital of the Company as at 31st March 2017 was Rs.763.5 Mn comprising of 99,451,059 Ordinary Shares. The movement in Stated Capital of the Company is given in Note 23 to the Financial Statements.
19. INVESTMENTS
Investments represent, investments in associates, investments in available for sale financial assets and
investments in fair value through profit or loss financial assets.
• Details on investment in associate company is given in note 18.
• Details on available for sale financial assets are disclosed in note 19 comprising those investments which are held for a longer tenure, usually over 3-5 years. The fair value of the said investment portfolio stood at Rs. 3,276.1 Mn (2016 - Rs. 2,937.1 Mn) at the end of the financial year.
• Details on fair value through profit or loss financial assets are disclosed in note 21 comprising those investments which are held for short term gains. The carrying value of the fair value through profit or loss financial assets of the Company as at 31st March 2017 was Rs. 968.7 Mn (2016 - Rs. 793.4 Mn).
20. CAPITAL EXPENDITURE
The Company has not incurred any capital nature expenditure during the year under review (2016 - Nil).
21. STATUTORY PAYMENTS
The Directors to the best of their knowledge and belief are satisfied that all statutory dues have been paid up to date or have been provided for in these financial statements.
22. GOING CONCERN
The Board of Directors is satisfied that the Company has adequate resources to continue its operations in the foreseeable future. Accordingly, the financial statements are prepared based on a Going Concern concept.
23. EVENTS AFTER THE REPORTING DATE
Subsequent to the reporting date, no circumstances have arisen, which would require adjustments to or disclosures in the financial statements, other than those disclosed in note 29 to the financial statements, if any.
24. CONTINGENT LIABILITIES AND CAPITAL COMMITMENTS
Contingent liabilities and commitments made on account of capital expenditure as at 31st March 2017 are given in note 30 to the financial statements, if any.
Ceylon Investment PLC Annual Report 2016/17 28 29
Annual Report of the Board of Directors on the affairs of the Company
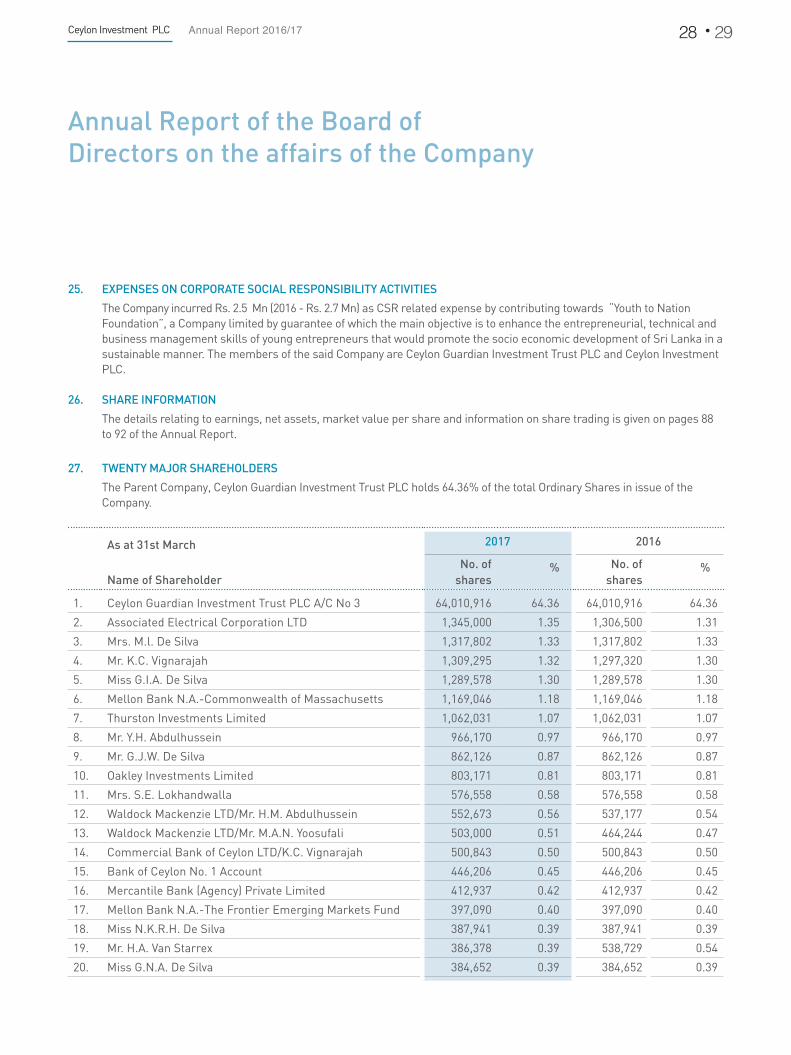
25. EXPENSES ON CORPORATE SOCIAL RESPONSIBILITY ACTIVITIES
The Company incurred Rs. 2.5 Mn (2016 - Rs. 2.7 Mn) as CSR related expense by contributing towards “Youth to Nation Foundation”, a Company limited by guarantee of which the main objective is to enhance the entrepreneurial, technical and business management skills of young entrepreneurs that would promote the socio economic development of Sri Lanka in a sustainable manner. The members of the said Company are Ceylon Guardian Investment Trust PLC and Ceylon Investment PLC.
26. SHARE INFORMATION
The details relating to earnings, net assets, market value per share and information on share trading is given on pages 88 to 92 of the Annual Report.
27. TWENTY MAJOR SHAREHOLDERS
The Parent Company, Ceylon Guardian Investment Trust PLC holds 64.36% of the total Ordinary Shares in issue of the Company.
As at 31st March 2017 2016
Name of ShareholderNo. of
shares% No. of
shares%
1. Ceylon Guardian Investment Trust PLC A/C No 3 64,010,916 64.36 64,010,916 64.36
2. Associated Electrical Corporation LTD 1,345,000 1.35 1,306,500 1.31
3. Mrs. M.l. De Silva 1,317,802 1.33 1,317,802 1.33
4. Mr. K.C. Vignarajah 1,309,295 1.32 1,297,320 1.30
5. Miss G.I.A. De Silva 1,289,578 1.30 1,289,578 1.30
6. Mellon Bank N.A.-Commonwealth of Massachusetts 1,169,046 1.18 1,169,046 1.18
7. Thurston Investments Limited 1,062,031 1.07 1,062,031 1.07
8. Mr. Y.H. Abdulhussein 966,170 0.97 966,170 0.97
9. Mr. G.J.W. De Silva 862,126 0.87 862,126 0.87
10. Oakley Investments Limited 803,171 0.81 803,171 0.81
11. Mrs. S.E. Lokhandwalla 576,558 0.58 576,558 0.58
12. Waldock Mackenzie LTD/Mr. H.M. Abdulhussein 552,673 0.56 537,177 0.54
13. Waldock Mackenzie LTD/Mr. M.A.N. Yoosufali 503,000 0.51 464,244 0.47
14. Commercial Bank of Ceylon LTD/K.C. Vignarajah 500,843 0.50 500,843 0.50
15. Bank of Ceylon No. 1 Account 446,206 0.45 446,206 0.45
16. Mercantile Bank (Agency) Private Limited 412,937 0.42 412,937 0.42
17. Mellon Bank N.A.-The Frontier Emerging Markets Fund 397,090 0.40 397,090 0.40
18. Miss N.K.R.H. De Silva 387,941 0.39 387,941 0.39
19. Mr. H.A. Van Starrex 386,378 0.39 538,729 0.54
20. Miss G.N.A. De Silva 384,652 0.39 384,652 0.39
Management Discussion and Analysis
Our Performance Governance and Risk Management
Financial Information Supplementary Information
28. ANNUAL REPORT
The information provided herein is in pursuance of the requirements of the Companies Act No.07 of 2007 and the Listing Rules of the Colombo Stock Exchange.
The Board of Directors have approved the Financial Statements of the Company together with the Reviews which form part of the Annual Report on 21st June 2017. The appropriate number of copies of the Annual Report will be submitted to the Colombo Stock Exchange, the Sri Lanka Accounting and Auditing Standards Monitoring Board and the Registrar General of Companies, within applicable time frames.
29. ANNUAL GENERAL MEETING
The 71st Annual General Meeting of the Company will be held on Wednesday, the 26th day of July 2017 at 2.00 p.m. at the “Auditorium”, The Institute of Chartered Accountants of Sri Lanka, Ground Floor, 30A, Malalasekera Mawatha, Colombo 07, Sri Lanka.
The Notice of the Annual General Meeting setting out the business which will be transacted thereat is on page 93 of the Annual Report.
Signed on behalf of the Board,
(Sgd.) (Sgd.)M. A. R. C. Cooray (Mrs.) D. C. R. GunawardenaChairperson Director
(Sgd.)K. D. De Silva (Mrs.)Director
Carsons Management Services (Private) LimitedSecretaries
21st June 2017

Ceylon Investment PLC Annual Report 2016/17 30 31
Profiles of the Directors
ROSE COORAY
Rose Cooray is the Chairperson of Ceylon Investment PLC, Ceylon Guardian Investment PLC, HNB Assurance PLC, HNBGI LTD. and Sithma Development (PVT) LTD. She is a Director of Hatton National Bank PLC HNB Grameen Finance Limited and Guardian Capital Partners PLC. She functions as the Chairperson of the Board Integrated Risk Committees of Hatton National Bank and HNB Grameen Finance and is a Member of several other Board sub-committees of companies where she holds the position of Director. She is a retired Deputy Governor of the Central Bank of Sri Lanka where she served for 35 years and counts over 40 years of experience in working in the financial sector.
On release from the Central Bank, she had served the Ministry of Finance in the capacity of Director General Fiscal Policy and Economic Affairs Department for nearly 6 years, represented the Government on the Boards of DFCC Bank, Sri Lanka Institute of Information Technology, Sri Lanka Telecom, Ceylon Electricity Board, De La Rue Currency and Security Print (Pvt) Ltd, Export Development Board, National Housing Development Authority and represented the Monetary Board on West Coast Power (Pvt) Ltd.
She has functioned as the Vice Chairperson of the Institute of Bankers of Sri Lanka for 5 years and has served on a number of Committees at national level covering a variety of subjects representing the Ministry of Finance and the Central Bank. She has also presented papers/been the resource person representing the Central Bank and the Ministry of Finance at various international meetings/seminars.
Mrs. Cooray has been involved extensively in policy making and implementing projects and programmes, especially in the area of regional development and microfinance. She has wide experience in negotiating loans with multilateral and other donors, as well as bilateral trade agreements on behalf of the Government. Her articles/papers have been published in professional journals.
CHANDIMA GUNAWARDENA
Chandima Gunawardena serves as a Non-Independent, Non-Executive Director of most of the Carsons Group Companies in Sri Lanka and overseas. He is also a Director of Bukit Darah PLC. Since assuming Non- Executive status in the Group, he serves as an advisor to the Group's Strategic Planning and Management forums in Sri Lanka and serves on Board Committees, including the Audit Committees of the Group in Sri Lanka and overseas covering all operating sectors of the Group.
Mr. Gunawardena has over four decades of experience in varied fields of business and commercial activities and has held senior positions in Corporate, Mercantile and State Institutions. He was appointed to the Carsons Group Directorate in 1990.
He has served in the Management Committee of The Ceylon Chamber of Commerce for over 10 years and was a Founder Council member of the Sri Lanka Institute of Directors (SLID) and continued to serve in the council for over 10 years. He is a Fellow of the Chartered Institute of Management Accountants, UK.
AJITH WEERATUNGE
Ajith Weeratunge is a Director of the Carson Cumberbatch Group’s Management Company, Carsons Management Services (Private) Limited and holds the position of Head of Finance.
He is also a Director of Group’s Real Estate Sector-Equity One Limited and Equity Two PLC and the Group’s Investment Holding Sector-Ceylon Investment PLC, Rubber Investment Trust Limited and Guardian Fund Management Limited and Leisure Sector-Equity Hotels Limited. He carries more than 35 years of finance related experience in several leading companies in the mercantile sector.
He is a Fellow member of the Chartered Institute of Management Accountants of UK.
MANILAL FERNANDO
Manilal Fernando is a Director of Ceylon Investment PLC , Ceylon Guardian Investment Trust PLC and is currently the Chairman of Shipping Cargo Logistics (Pvt) Ltd., Hyundai Lanka (Pvt) Ltd. and Dynamic AV Technologies (Pvt) Ltd. He is also a Director of Eco Corp Asia Private Limited and a Trustee of Joseph Fraser Memorial Hospital.
He has been the Past President of the Football Federation of Sri Lanka from 1979 to 1999, as well as the Vice President of the National Olympic Committee of Sri Lanka from 1990 to 2014.
He is an Attorney-at-Law & Notary Public.
KRISHNA SELVANATHAN
Krishna Selvanathan is a Director of Carsons Management Services (Private) Limited, Lion Brewery (Ceylon) PLC, Pegasus Hotels of Ceylon PLC and the Investment Sector Companies of the Carsons Group.
He holds a BA Degree in Accounting & Finance and Business Administration from the University of Kent, U.K.
TIMOTHY CHEE MING CHIA
Mr. Timothy C. M. Chia is Chairman of Hup Soon Global Corporation Private Limited and Gracefield Holdings Limited.
He was the President of PAMA Group Inc. (previously known as Prudential Asset Management Asia Limited, the Asian investment and asset management arm of The Prudential Insurance Company of America). He retired from PAMA Group of Companies on 31 December 2004. In 2007, he founded Hup Soon Global Corporation and became its founding Chairman.
Prior to joining PAMA, as one of the original principals in 1986, Mr. Chia was Vice President - Investment of American International Assurance Company Limited (AIA), a major subsidiary of the American International Group, Inc., New York (AIG).
Mr. Chia is currently a Director of Banyan Tree Holdings Ltd, Fraser and Neave Limited, Singapore Power Ltd, The Straits Trading Company Limited, Ceylon Investment PLC, Vertex Venture Holdings Ltd and Malaysia Smelting Corporation Berhad.
He was made Chairman of UBS AG – Asia in October 2009and retired in September 2011. He stepped down as Senior Advisor to JM Financial Singapore Pte Ltd and EQT Funds Management Limited in 2015. He was the Chairman - Asia of Coutts & Co Ltd, the wealth management arm of the Royal Bank of Scotland Group, from January 2012 to March 2016.
He was a board member of Singapore Power Ltd joining the board in September 1998 until his retirement in July 2004. He served as Chairman of one of Singapore Power’s major subsidiaries, Power Gas Ltd from 1998 to 2002.
Amongst his past appointments, Mr. Chia was a Director of SP PowerAsset Ltd, Power Gas Ltd, SPI (Australia) Assets Pty Ltd, Singapore Post Ltd, FJ Benjamin Holdings Ltd, Frasers Centrepoint Ltd, Macquarie Pacific Star Prime REIT Management Ltd, The Hour Glass Ltd, KorAm Bank Co. (Korea), Meritz Securities Co., Ltd (Korea) and Magnecomp Precision Technology Public Co., Ltd (Thailand).
Since January 2004, Mr. Chia was named a Trustee of the Singapore Management University. He is currently a member of its Audit Committee and Chairman of its Committee for Institutional Advancement.
In 2010, The Singapore Venture Capital and Private Equity Association inducted Mr. Chia into the “SVCA Hall of Fame” as its inaugural member by naming him “Pioneer Venture Capitalist & Private Equity Investor since 1986”.
In October 2015, Mr. Chia was appointed as Advisory Council Member of the ASEAN Business Club (“ABC”) and the co-chair of ABC Singapore.
In January 2016, Mr. Chia was appointed as a Member of the Advisory Board of the Asian Civilisation Museum.
He is currently a Fellow of the Singapore Institute of Directors and a member of the World Presidents’ Organisation.
Management Discussion and Analysis
Our Performance Governance and Risk Management
Financial Information Supplementary Information

Ceylon Investment PLC Annual Report 2016/17 32 33
In 1996, Mr. Chia was elected a Director of the Singapore Dance Theatre until he stepped down in March 2004 and in September 2004, was conferred the Arts Supporter Award by the National Arts Council.
Mr. Chia graduated with a cum laude in Management from Fairleigh Dickinson University in the United States.
RUVINI FERNANDO (Appointed with effect from 15th August 2016)
Ruvini Fernando is a Director and CEO of Guardian Fund Management Limited, investment managers of the Ceylon Guardian Investment Trust PLC Group and a Director of Guardian Acuity Asset Management Limited, the Group's licensed Joint Venture for unit trust management. She was appointed to the Ceylon Guardian Group listed company boards as an executive director in 2016. She is a Director of The Sri Lanka Fund, a country fund dedicated to Sri Lankan equities.
The Ceylon Guardian Group presently has business interests in listed and private equity as well as managing mutual funds and institutional client portfolios, a collective portfolio of assets under management of over Rs.35bn, in diverse asset classes. She counts approximately 25 years’ experience in management accounting, finance, strategic planning and investment management, of which 10 years have been with the Ceylon Guardian Group and 23 years with Carson Cumberbatch Group. She was a former visiting faculty member of the MBA programme of the Postgraduate Institute of Management (PIM). She is a Fellow of the Chartered Association of Certified Accountants (ACCA), UK and the Chartered Institute of Management Accountants (CIMA), UK and holds a Masters in Business Administration from the PIM, University of Sri Jayewardenepura. She currently serves as member of the National Agenda Committee on Finance and Capital of the Ceylon Chamber of Commerce.
ISRAEL PAULRAJ (Resigned from the Board with effect from 15th August 2016)
Israel Paulraj is the Chairman of Guardian Capital Partners PLC and Rubber Investment Trust Limited. He serves as a Director of several subsidiary companies within the Carsons Group.
He served as Past Chairman of the Federation of Exporters Associations of Sri Lanka and The Coconut Products Traders Association. He was a member of the Executive Committee of the Ceylon Chamber of Commerce, National Chamber of Commerce of Sri Lanka and Shippers Council. He served on the Board of Arbitrators of the Ceylon Chamber of Commerce. He has served as Hony. General Secretary of the Central Council of Social Services, Hony. Treasurer of The Christian Conference in Asia, President of the Church of Ceylon Youth Movement and Hony. Treasurer of the National Christian Council of Sri Lanka. He has also served as Chairman of the Incorporated Trustees of the Church of Ceylon.
He also served on the Presidential Task Force on Non Traditional Export and Import Competitive Agriculture set up by President R.Premadasa. He served as Chairman of the Ecumenical Loan Fund of Sri Lanka and on its International Board in Geneva. He was a member of the Commercial Law Reform Commission and has served on the Parliamentary Consultative Committee on Internal and International Trade.
He holds a Bachelor of Law Degree and an Executive Diploma in Business Administration
Profiles of the Directors

Management Discussion and Analysis
Our Performance Governance and Risk Management
Financial Information Supplementary Information
Ruvini Fernando (MBA. FCCA, FCMA)
Director / CEO of Guardian Fund Management Limited. She is also a Director of Ceylon Guardian Investment Trust PLC. Refer page 32 for her detailed profile.
Tharinda Jayawardena (CFA,ACMA,B.Sc Finance (Hons))
Director / Head of Research, Guardian Fund Management Ltd. Has over 10 years of experience in investment research. Before joining the Carsons group, he worked as a research analyst at JB Securities (Pvt) Ltd. Is a CFA charter holder and an associate member of the Chartered Institute of Management Accountants. Also holds a BSc Degree from the University of Sri Jayewardenepura specialising in Finance.
Sumith Perera (B.Sc (Hons), ACMA)
Head of Portfolio Management, Guardian Fund Management Ltd. Has over 12 years’ experience in the field of Asset Management working as a Fund Manager for CAAM Saudi Fransi LLC (Kingdom of Saudi Arabia), Investment Analyst for Eagle NDB Fund Management (Sri Lanka) and as a Financial Analyst for John Keells Stockbrokers. He holds a BSc (Hons) in Economics and Business Finance from Brunel University, UK and is an Associate Member of the Chartered Institute of Management Accountants.
Asanka Jayasekera (B.Sc.Finance (Hons), ACMA)
Fund Manager, Guardian Fund Management Limited/ Guardian Acuity Asset Management Ltd and Manager Research, Guardian Fund Management Limited. Has over 9 years’ experience in asset management and investment research and worked as a research analyst at JB Securities (Pvt) Ltd before joining Ceylon Guardian group. He holds a B.Sc. Finance (Hons) degree from the University of Sri Jayewardenepura, Sri Lanka and is an associate member of the Chartered Institute of Management Accountants ,UK. He is a visiting lecturer at department of finance, University of Sri Jayewardenepura.
Lakmal Wickramaarachchi (B.Sc. Finance (Special),ACA)
Accountant, Guardian Fund Management Limited. Commenced career at KPMG, Chartered Accountants, prior to joining the Carsons Group. Counts over 10 years of experience in auditing and accounting. Associate Member of the Institute of Chartered Accountants of Sri Lanka. Holds a B.Sc. Finance (Special) Degree from the University of Sri Jayewardenepura, Sri Lanka.
Management Team Profile

Ceylon Investment PLC Annual Report 2016/17 34 35
Audit Committee Report
The Parent Company of Ceylon Investment PLC is Ceylon Guardian Investment Trust PLC (CGIT) and Carson Cumberbatch PLC (CCPLC) in turn is the Parent Company of CGIT. As provided by the Colombo Stock Exchange Listing Rules, the Audit Committee of CCPLC functions as the Audit Committee of the Company.
The Audit Committee consists of the following Members :
Audit Committee Members Executive/Non-Executive/Independent
Mr.Vijaya Malalasekera (Chairman)
Non-Executive, Independent (CCPLC)
Mr.Chandima Gunawardena Non-Executive (CCPLC)
Mr.Faiz Mohideen Non-Executive, Independent (CCPLC)
Mr.Vijaya Malalasekera is a Non-Executive, Independent Director of CCPLC and a former Director of Ceylon Tobacco Company PLC.
Mr.Chandima Gunawardena is a Non-Executive Director of CCPLC and in most of its Group Companies. He is a Fellow of the Chartered Institute of Management Accountants, U.K.
Mr.Faiz Mohideen, a Non-Executive, Independent Director of CCPLC was a former Deputy Secretary to the Treasury and a former Director of Bank of Ceylon and Securities and Exchange Commission of Sri Lanka.
The purpose of the Audit Committee of CCPLC is as follows:
To assist the Board of Directors in fulfilling its oversight responsibilities for the financial reporting process, the system of internal control over financial reporting, the audit process and the Company’s process for monitoring compliance with laws and regulations, Company policies and procedures and the code of conduct.
To ensure that the internal audit activity is well managed, so that it adds value to the organization by being objective in providing relevant assurance, contributing
to the effectiveness and efficiency of governance, risk management and control processes.
The audit aspects of Ceylon Investment PLC are conducted within the Agenda of CCPLC-Audit Committee.
CCPLC-Audit Committee held five (05) Meetings during the financial year to discuss matters relating to the Company and the attendance of the Members of the Audit Committee was as follows :
Meetings attended (out of 05)
Mr.Vijaya Malalasekera (Chairman) 05
Mr.Chandima Gunawardena 04
Mr.Faiz Mohideen 05
Director-Guardian Fund Management Limited-Investment Managers, Financial Controller-Carsons Management Services (Private) Limited-Managers, internal auditors and senior management staff members of the Investment Sector also attended the Audit Committee Meetings by invitation.
The Committee met the External Auditors, Messrs. KPMG, twice during the year to discuss the audit scope and to deliberate the draft Financial Report and Accounts. The Audit Committee also discussed the draft Financial Report and Accounts, with the External Auditors, without the management being present to foster an unbiased, independent dialogue.
The Audit Committee approved the audit plan for the financial year 2016/2017 and the Group Internal Audit (GIA) carried out 05 audits on the Investment Sector companies based on the plan.
The findings and contents of the Group Internal Audit reports have been discussed with the relevant management staff and subsequently the audit reports were circulated to the Audit Committee and to the senior management.

The objectives of the GIA work was to have an independent review of the system of internal controls as established by the management, its adequacy and integrity vis-à-vis objectives served and to determine the extent of adherence to the controls by staff responsible for the function and to take corrective/preventive action where necessary.
The IT consultancy division of Messrs.KPMG, has during the year completed a comprehensive external IT security and process audit covering the IT environment of Carsons Management Services (Private) Limited (Managers to the Company) which covers the centralized IT services provided to the Investment Sector, as well. This exercise facilitated Carsons Management Services (Private) Limited to obtain IAO/IEC 27001:2013 certification in November 2016.
The interim financial statements of Ceylon Investment PLC have been reviewed by the Audit Committee Members at Audit Committee Meetings, prior to release of same to the Regulatory Authorities and to the shareholders.
The draft financial statements of Ceylon Investment PLC for the year ended 31st March 2017 were reviewed at a Meeting of the Audit Committee, together with the External Auditors, Messrs. KPMG, prior to release of same to the Regulatory Authorities and to the shareholders. The Audit Committee was provided with confirmations and declarations as required, by the Managers, Carsons Management Services (Private) Limited that the said financial statements were prepared in accordance with the Sri Lanka Accounting Standards and the information required by the Companies Act No. 7 of 2007 therein and presented a true and fair view of the Company’s state of affairs as at that date and the Company’s activities during the year under review.
The Audit Committee has determined that Messrs.KPMG, Chartered Accountants, Auditors were independent on the basis that they did not carry out any management related functions of the Company.
The Audit Committee has concurred to recommend to the Board of Directors the re-appointment of Messrs. KPMG, Chartered Accountants, as Auditors for the financial year ending 31st March 2018, subject to the approval of the shareholders of Ceylon Investment PLC at the Annual General Meeting.
(Sgd.)V.P. MalalasekeraChairman – Audit CommitteeCarson Cumberbatch PLC
Colombo21st June 2017
Management Discussion and Analysis
Our Performance Governance and Risk Management
Financial Information Supplementary Information

Ceylon Investment PLC Annual Report 2016/17 36 37
Related Party Transactions Review Committee Report
The Parent Company of Ceylon Investment PLC is Ceylon Guardian Investment Trust PLC (CGIT) and Carson Cumberbatch PLC (CCPLC) in turn is the Parent Company of CGIT. As provided by the Colombo Stock Exchange Listing Rules, the Related Party Transactions Review Committee (RPTRC) of CCPLC functions as the RPTRC of the Company.
Composition of the Committee
The Members of the RPTRC are as follows :
1. Mr.V. P. Malalasekera (Chairman) - Non-Executive/Independent Director of CCPLC
2. Mr. F. Mohideen - Non-Executive/Independent Director of CCPLC
3. Mr. D. C. R. Gunawardena - Non-Executive Director of CCPLC
4. Mr. H. Selvanathan - Executive Director of CCPLC
5. Mr. M. Selvanathan - Executive Director of CCPLC
6. Mr. S. K. Shah - Executive Director of CCPLC
Meetings of the Related Party Transactions Review Committee
CCPLC-RPTRC held Three (03) Meetings during the financial year to discuss matters relating to the Company.
The attendance of the Members of the Committee was as follows:
Meetings attended (out of 03)
Mr.V.P. Malalasekera 03
Mr.F. Mohideen 03
Mr.D.C.R. Gunawardena 03
Mr.H. Selvanathan 02
Mr.M. Selvanathan 02
Mr.S.K. Shah 03
Purpose of the Committee
The objective of the RPTRC is to review all Related Party Transactions (RPTs) of the Listed Companies of the Carsons Group, other than those exempted by the ‘Related Party Transactions Compliance Code’ (RPT Code), prior to the transaction being entered into or, if the transaction is expressed to be conditional on such review, prior to the completion of the transaction.
Policies and procedures
• The RPTRC reviews all the Related Party Transactions of the Listed Companies of the Carsons Group and where the Committee decides that the approval of the Board of Directors of the respective Companies is necessary to approve a Related Party Transaction, such Board approval is obtained prior to entering into the relevant Related Party Transaction.
• When reviewing a transaction, the RPTRC would decide whether the proposed transaction is carried out on an arm’s length basis irrespective of whether recurrent or non-recurrent in nature.
• Reviewing and approval would be either by meeting of members (subject to quorum being present) or by circulation.
• In determining whether to obtain the approval of the Board of Directors for a Related Party Transaction, the RPTRC will take into account, among other factors it deems appropriate, whether the proposed RPTs pose a conflict of interest to the Directors.
The self-declarations from the Directors and Key Management Personnel are obtained for the purpose of identifying parties related to them. Further, the guidelines which senior management must follow in routing Related Party Transactions to the relevant forum, including transaction threshold values and pricing where applicable, have been documented even in the case of once approved recurrent transactions which are of operational nature, which as per the RPT Code need not be repeatedly approved if within the broad thresholds.

The RPTRC in discharging its function has introduced processes and periodic reporting by the relevant entities with a view to ensuring that:
• there is compliance with the Code;
• shareholder interests are protected; and
• fairness and transparency are maintained.
The Committee has a criteria for designating Carsons Group Key Management Personnel (KMP) and the KMPs so designated are required to provide quarterly disclosures.
The Related Party Transactions of the Company for the period 1st April 2016 to 31st March 2017 have been reviewed by the Members of the RPTRC and the comments and observations of the Committee have been communicated to the Board of Directors of the Company.
(Sgd.)V.P. MalalasekeraChairman – Related Party Transactions Review CommitteeCarson Cumberbatch PLC
Colombo21st June 2017
Management Discussion and Analysis
Our Performance Governance and Risk Management
Financial Information Supplementary Information

Financial Calendar
Financial year end 31st March 2017
71st Annual General Meeting to be held on 26th July 2017
ANNOUNCEMENT OF RESULTS
Interim Financial Statements published in terms of the Listing Rules of the Colombo Stock Exchange
1st Quarter ended 30th June 2016 : 12th August 2016
2nd Quarter ended 30th September 2016 : 15th November 2016
3rd Quarter ended 31st December 2016 : 14th February 2017
4th Quarter ended 31st March 2017 : 31st May 2017
38 39

TO THE SHAREHOLDERS OF CEYLON INVESTMENT PLC
Report on the Financial Statements
We have audited the accompanying financial statements of Ceylon Investment PLC, (“the Company”), which comprise the statement of financial position as at March 31, 2017, and the statements of profit or loss and other comprehensive income, changes in equity and, cash flows for the year then ended, and a summary of significant accounting policies and other explanatory information set out on pages 40 to 87.
Board’s Responsibility for the Financial Statements
The Board of Directors (“Board”) is responsible for the preparation of these financial statements that give a true and fair view in accordance with Sri Lanka Accounting Standards, and for such internal control as Board determines is necessary to enable the preparation of financial statements that are free from material misstatement, whether due to fraud or error.
Auditors’ Responsibility
Our responsibility is to express an opinion on these financial statements based on our audit. We conducted our audit in accordance with Sri Lanka Auditing Standards. Those standards require that we comply with ethical requirements and plan and perform the audit to obtain reasonable assurance about whether the financial statements are free from material misstatement.
An audit involves performing procedures to obtain audit evidence about the amounts and disclosures in the financial statements. The procedures selected depend on the auditors’ judgment, including the assessment of the risks of material misstatement of the financial statements, whether due to fraud or error. In making those risk assessments, the auditor considers internal control relevant to the entity’s preparation of the financial statements that give a true and fair view in order to design audit procedures that are appropriate in the circumstances, but not for the
Independent Auditors’ Report
Management Discussion and Analysis
Our Performance Financial InformationGovernance and Risk Management
Supplementary Information
purpose of expressing an opinion on the effectiveness of the entity’s internal control. An audit also includes evaluating the appropriateness of accounting policies used and the reasonableness of accounting estimates made by Board, as well as evaluating the overall presentation of the financial statements.
We believe that the audit evidence we have obtained is sufficient and appropriate to provide a basis for our audit opinion.
Opinion
In our opinion, the financial statements give a true and fair view of the financial position of the Company as at March 31, 2017, and of its financial performance and cash flows for the year then ended in accordance with Sri Lanka Accounting Standards.
Report on Other Legal and Regulatory Requirements
As required by section 163 (2) of the Companies Act No. 07 of 2007, we state the following:
a) The basis of opinion and scope and limitations of the audit are as stated above.
b) In our opinion we have obtained all the information and explanations that were required for the audit and, as far as appears from our examination, proper accounting records have been kept by the Company and the financial statements of the Company, comply with the requirements of section 151 of the Companies Act No 07 of 2007.
CHARTERED ACCOUNTANTSColombo21st June 2017

Ceylon Investment PLC Annual Report 2016/17 40 41
In Rupees Thousands
Statement of Profit or Loss and Other Comprehensive Income
For the year ended 31st March Note 2017 2016
Revenue 11 297,938 322,032
Impairment loss on available for sale financial assets (95,215) (45,661)
Net change in fair value of fair value through profit or loss financial assets (2,782) (89,878)
Profit on investment activities 199,941 186,493
Other operating income - 99
Administrative and other operating expenses (50,235) (54,733)
Profit from operations 12 149,706 131,859
Finance expense 13 (71) (18)
Profit from operations after finance expense 149,635 131,841
Share of profit of equity accounted investee net of tax 14 510,433 162,922
Profit before taxation 660,068 294,763
Income tax expense 15 (7,254) (7,548)
Profit for the year 652,814 287,215
Other comprehensive income
Items that are or may be reclassified to profit or loss
Share of other comprehensive expense of equity accounted investee net of tax 14 (1,245,490) (3,570,466)
Net change in fair value of available for sale financial assets 200,791 (360,276)
Transfer of realised (gains) / losses on disposal of available for sale financial assets 4,835 (173,444)
Foreign currency differences arising on translation of available for sale financial assets 7,444 13,767
Other comprehensive expense for the year (1,032,420) (4,090,419)
Total comprehensive expense for the year (379,606) (3,803,204)
Earnings per share (Rs.) 16 6.56 2.89
The notes to the financial statements from pages 44 to 87 form an integral part of these financial statements. Figures in brackets indicate deductions.

In Rupees Thousands
Statement of Financial Position
As at 31st March Note 2017 2016
ASSETSNon-current assetsInvestment in equity accounted investee 18 4,368,295 5,211,936 Available for sale financial assets 19 3,276,179 2,937,166 Total non-current assets 7,644,474 8,149,102
Current assetsTrade and other receivables 20 22,733 10,138 Fair value through profit or loss financial assets 21 968,707 793,451 Current tax assets 3,315 - Cash and cash equivalents 22 116,648 338,017 Total current assets 1,111,403 1,141,606 Total assets 8,755,877 9,290,708
EQUITY AND LIABILITIESEquityStated capital 23 763,497 763,497 Capital reserves 24.1 187,141 187,141 Revenue reserves 24.2 7,602,502 8,153,015 Total equity 8,553,140 9,103,653
Current liabilitiesTrade and other payables 25 200,089 183,841 Current tax liabilities - 1,389 Bank overdraft 22 2,648 1,825 Total current liabilities 202,737 187,055 Total liabilities 202,737 187,055 Total equity and liabilities 8,755,877 9,290,708
Net assets value per share (Rs.) 86.00 91.54
The notes to the financial statements from pages 44 to 87 form an integral part of these financial statements. I certify that these financial statements have been prepared in compliance with the requirements of the Companies Act, No. 07 of 2007. (Sgd.) V.R. WijesingheFinancial Controller Carsons Management Services (Private) Limited The Board of Directors is responsible for the preparation and presentation of these financial statements.
Approved and signed on behalf of the Investment Managers, Approved and signed on behalf of the Board,
(Sgd.) (Sgd.) (Sgd.)W.Y.R. Fernando (Mrs.) M. A. R. C. Cooray (Mrs.) D.C.R. Gunawardena Director Chairperson DirectorGuardian Fund Management LimitedColombo21st June 2017
Management Discussion and Analysis
Our Performance Financial InformationGovernance and Risk Management
Supplementary Information

Ceylon Investment PLC Annual Report 2016/17 42 43
Statement of Changes In Equity
Stated capital
Capital reserves Revenue reserves Total equityInvestment
reserveOther
capital reserve
Associate company’s
reserve
Fair value through
profit or loss
financial assets
reserve
Available for sale
financial asset
reserve
General reserve
Retained earnings
Balance as at 1st April 2015 673,530 8,401 178,740 8,714,088 51,828 799,609 27,217 2,648,757 13,102,170Super Gain Tax for the year of
Assessment 2013/14 * - - - (14,947) - - - (26,856) (41,803)Adjusted balance as at 1st April
2015 673,530 8,401 178,740 8,699,141 51,828 799,609 27,217 2,621,901 13,060,367Profit for the year - - - 162,922 - - - 124,293 287,215Other comprehensive expense for
the year - - - (3,570,466) - (519,953) - - (4,090,419)Total comprehensive income /
(expense) for the year - - - (3,407,544) - (519,953) - 124,293 (3,803,204)Dividend received from associate
company (gross) - - - (79,957) - - - 79,957 -Forfeiture of unclaimed dividends - - - - - - - 4,214 4,214Scrip Dividend 89,967 - - - - - - (98,514) (8,547)Dividend - - - - - - - (149,177) (149,177)Transfers - - - - (51,828) - - 51,828 -Balance as at 31st March 2016 763,497 8,401 178,740 5,211,640 - 279,656 27,217 2,634,502 9,103,653
Balance as at 1st April 2016 763,497 8,401 178,740 5,211,640 - 279,656 27,217 2,634,502 9,103,653Profit for the year - - - 510,433 - - - 142,381 652,814Other comprehensive income /
(expense) for the year - - - (1,245,490) - 213,070 - - (1,032,420)Total comprehensive income /
(expense) for the year - - - (735,057) - 213,070 - 142,381 (379,606)Dividend received from associate
company (gross) - - - (108,584) - - - 108,584 -
Forfeiture of unclaimed dividends - - - - - - - 3,132 3,132Dividend - - - - - - - (174,039) (174,039)Balance as at 31st March 2017 763,497 8,401 178,740 4,367,999 - 492,726 27,217 2,714,560 8,553,140
The notes to the financial statements from pages 44 to 87 form an integral part of these financial statements. Figures in brackets indicate deductions. *As per the provisions of Part III of the Finance Act, No. 10 of 2015, although the Company did not become liable to pay Super Gain Tax as a stand-alone entity, Rs. 26,856,393/- has been paid as Super Gain Tax on the basis that the Company is part of the Bukit Darah PLC group, of which the consolidated profit before tax exceeded the threshold as stipulated in the aforesaid Act. Further on the same basis, the Super Gain Tax applicable for Associate Company, Rubber Investment Trust Limited, on equity method of accounting amounted to Rs. 14,947,832/-. According to the Act, the Super Gain Tax shall be deemed to be an expenditure in the financial statements relating to the year of assessment which commenced on 1 April 2013.The Act supersedes the requirements of the Sri Lanka Accounting Standards and hence the expense of Super Gain Tax is accounted in accordance with the requirements of the said Act as recommended by the Statement of Alternative Treatment (SoAT) on Accounting for Super Gain Tax issued by the Institute of Chartered Accountants of Sri Lanka, dated 24th November 2015.
In Rupees Thousands

Statement of Cash Flows
For the year ended 31st March Note 2017 2016
Cash flows from operating activities
Profit before taxation 660,068 294,763
Adjustments for:
Impairment loss on available for sale financial assets 95,215 45,661
Net change in fair value of fair value through profit or loss financial assets 2,782 89,878
Finance expense 13 71 18
Share of profit of equity accounted investee net of tax 14 (510,433) (162,922)
Operating profit before changes in working capital 247,703 267,398
(Increase) / decrease in trade and other receivables (12,595) 6,088
Net increase in investments (399,196) (301,847)
Increase / (decrease) in trade and other payables (8,347) 8,479
Cash used in operations (172,435) (19,882)
Super gain tax paid - (26,856)
Income tax paid (6,565) (5,896)
Net cash used in operating activities (179,000) (52,634)
Cash flows from investing activities
Dividend received from equity accounted investee 11 103,191 79,195
Net cash generated from investing activities 103,191 79,195
Cash flows from financing activities
Finance expense paid (71) (18)
Dividend paid (146,312) (242,822)
Net cash used in financing activities (146,383) (242,840)
Net decrease in cash and cash equivalents during the year (222,192) (216,279)
Cash and cash equivalents at the beginning of the year 336,192 552,471
Cash and cash equivalents at the end of the year 22 114,000 336,192
The notes to the financial statements from pages 44 to 87 form an integral part of these financial statements. Figures in brackets indicate deductions.
In Rupees Thousands
Management Discussion and Analysis
Our Performance Financial InformationGovernance and Risk Management
Supplementary Information

Ceylon Investment PLC Annual Report 2016/17 44 45
1. REPORTING ENTITY
(a) Domicile and legal form
Ceylon Investment PLC is a limited liability company which is incorporated in Sri Lanka. The shares of the Company have a primary listing on the Colombo Stock Exchange.
The registered office and principal place of business of the Company is located at No 61 Janadhipathi Mawatha, Colombo 1.
(b) Principal activities and nature of operations
The principal activities of the Company is to act as a specialised investment vehicle to undertake listed equity and fixed income investments.
There were no significant changes in the nature of the principal activities of the Company during the financial year under review.
The investment activities of the Company are managed by Guardian Fund Management Limited (the investment manager) and Carsons Management Services (Private) Limited function as Managers and Secretaries of the Company.
(c) Parent entity and ultimate parent entity
Ceylon Guardian Investment Trust PLC is the immediate Parent Company of Ceylon Investment PLC. In the opinion of the Directors, Carson Cumberbatch PLC is the Parent Company of Ceylon Guardian Investment Trust PLC and Bukit Darah PLC is the Ultimate Parent and Controlling Entity of Ceylon Investment PLC.
(d) Number of Employees
The Company had no employees as at the reporting date (2016 - Nil).
2. BASIS OF PREPARATION
(a) Statement of compliance
The financial statements of the Company comprise the statement of financial position, statement of profit or loss and other comprehensive income, statement of changes in equity and statements of cash flows together with the notes to the financial statements.
The financial statements have been prepared in accordance with Sri Lanka Accounting Standards (LKAS / SLFRS) laid down by the Institute of Chartered Accountants of Sri Lanka and the requirements of the Companies Act, No. 7 of 2007.
The financial statements were authorised for issue by the Board of Directors on 21st June 2017.
(b) Basis of measurement
The financial statements have been prepared on the historical cost basis and applied consistently with no adjustments being made for inflationary factors affecting the financial statements, except for the following material items in the statement of financial position;
• Non-derivative financial instruments classified as fair value through profit or loss are measured at fair value;
• Available-for-sale financial assets are measured at fair value;
These financial statements have been prepared on the basis that the Company would continue as a going concern for the foreseeable future.
(c) Functional and presentation currency
Items included in the financial statements are measured using the currency of the primary economic environment in which the entity operates (‘the functional currency’). The financial statements
Notes to the Financial StatementsIn Rupees Thousands

are presented in Sri Lankan Rupees, which is the Company’s functional and presentation currency.
(d) Use of estimates and judgments
The preparation of the financial statements in conformity with LKAS/SLFRS requires management to make judgments, estimates and assumptions that affect the application of accounting policies and the reported amounts of assets, liabilities, income and expenses. Actual results may differ from these estimates.
Estimates and underlying assumptions are reviewed on an ongoing basis. Revisions to accounting estimates are recognised in the period in which the estimates are revised and in any future periods affected.
Information about assumptions and estimation uncertainties that have a significant risk of resulting in a material adjustment within the next financial year are included in the following notes:
Assumptions and estimation uncertainties:
i. Assessment of impairment - key assumptions used in discounted cash flow projections.
The Company assesses at each reporting date whether there is objective evidence that an asset or portfolio of assets is impaired. The recoverable amount of an asset is the greater of its value in use and its fair value less costs to sell. In assessing value in use, the estimated future cash flows are discounted to present value using appropriate discount rates that reflects the current market assessments of the time value of money and risks specific to the asset.
ii. Current taxation
Current tax liabilities arise to the Company in various jurisdictions. These liabilities are provided for in the financial statements applying the relevant tax statutes and regulations which the management
believes reflect the actual liability. There can be instances where the stand taken by the Company on transactions is contested by revenue authorities. Any additional costs on account of these issues are accounted for as a tax expense at the point the liability is confirmed on the entity.
iii. Measurement of fair values - financial instruments
Where the fair values of financial instruments recorded on the statement of financial position cannot be derived from active markets, they are determined using valuation techniques including the discounted cash flow model. The inputs to these models are derived from observable market data where possible, but where this is not feasible, a degree of judgment is required in establishing fair values. The judgments include considerations of liquidity and model inputs regarding the future financial performance of the investee, its risk profile, and economic assumptions regarding the industry and geographical jurisdiction in which the investee operates. Changes in assumptions about these factors could affect the reported fair value of financial instruments.
(e) Materiality and aggregation
Each material class of similar items is presented in aggregate in the Financial Statements. Items of dissimilar nature or function are presented separately unless they are immaterial.
(f) Comparative figures
Where necessary, comparative figures have been rearranged to conform with the current year’s presentation.
3. SIGNIFICANT ACCOUNTING POLICIES
The accounting policies set out below have been applied consistently to all periods presented in the Financial Statements.
Management Discussion and Analysis
Our Performance Financial InformationGovernance and Risk Management
Supplementary Information

Ceylon Investment PLC Annual Report 2016/17 46 47
(a) Investments in associates (equity-accounted investees)
Associates are those entities in which the Company has significant influence, but not control or joint control, over the financial and operating policies. Significant influence is presumed to exist when the Company holds between 20 percent and 50 percent of the voting power of another entity.
Investments in associates are accounted for under the equity method and are recognised initially at cost. The cost of the investment includes transaction costs.
The financial statements include the Company’s share of the profit or loss and other comprehensive income of equity-accounted investees, after adjustments to align the accounting policies with those of the Company, from the date that significant influence commences until the date that significant influence ceases.
When the Company’s share of losses exceeds its interest in an equity-accounted investee, the carrying amount of the investment, including any long-term interests that form part thereof, is reduced to zero, and the recognition of further losses is discontinued except to the extent that the Company has an obligation or has made payments on behalf of the investee.
(b) Foreign currency
(i) Foreign currency transactions
Transactions in foreign currencies are translated to the respective functional currency of entity at exchange rates as at the dates of the transactions. Monetary assets and liabilities denominated in foreign currencies at the reporting date are retranslated to the functional currency at the exchange rate as at that date.
The foreign currency gain or loss on monetary items is the difference between amortised cost in
the functional currency at the beginning of the year, adjusted for effective interest and payments during the year, and the amortised cost in foreign currency translated at the exchange rate at the end of the year.
Non-monetary assets and liabilities that are measured at fair value in a foreign currency are retranslated to the functional currency at the exchange rate at the date that the fair value was determined. Non-monetary items that are measured based on historical cost in a foreign currency are translated using the exchange rate at the date of the transaction.
Foreign currency differences arising on retranslation are generally recognised in profit or loss. However, foreign currency differences arising from the retranslation of the following items are recognised in other comprehensive income:
• available-for-sale equity investments (except on impairment in which case foreign currency differences that have been recognised in other comprehensive income are reclassified to profit or loss);
(c) Financial instruments
(i) Non-derivative financial assets
The Company initially recognises loans and receivables on the date that they are originated. All other financial assets (including assets designated as at fair value through profit or loss) are recognised initially on the trade date, which is the date that the Company becomes a party to the contractual provisions of the instrument.
The Company derecognises a financial asset when the contractual rights to the cash flows from the asset expire, or it transfers the rights to receive the contractual cash flows in a transaction in which substantially all the risks and rewards of ownership of the financial asset are transferred. Any interest in such transferred financial assets that is created
Notes to the Financial StatementsIn Rupees Thousands

or retained by the Company is recognised as a separate asset or liability.
Financial assets and liabilities are offset and the net amount presented in the statement of financial position when, and only when, the Company has a legal right to offset the amounts and intends either to settle them on a net basis or to realise the asset and settle the liability simultaneously.
The Company classifies non-derivative financial assets into the following categories; financial assets at fair value through profit or loss, loans and receivables and available-for-sale financial assets.
Financial assets at fair value through profit or loss
A financial asset is classified as fair value through profit or loss (FVTPL) or is designated as such on initial recognition if the Company manages such investments and makes purchase and sale decisions based on their fair value in accordance with the Company’s documented investment or risk management strategy. Attributable transaction costs are recognised in profit or loss as incurred. Financial assets at fair value through profit or loss are measured at fair value and changes therein are recognised in profit or loss.
Financial assets designated as fair values through profit or loss comprise equity securities that otherwise would have been classified as available-for-sale.
Loans and receivables
Loans and receivables are financial assets with fixed or determinable payments that are not quoted in an active market. Such assets are recognised initially at fair value plus any directly attributable transaction costs. Subsequent to initial recognition, loans and receivables are measured at amortised cost using the effective interest method, less any impairment losses.
Loans and receivables comprise cash and cash equivalents, and trade and other receivables.
Specific instruments
Cash and cash equivalents
Cash and cash equivalents comprise cash balances, Securities purchased under resale agreements and call deposits with maturities of three months or less from the acquisition date that are subject to an insignificant risk of changes in their fair value, and are used by the Company in the management of its short-term commitments.
Available-for-sale financial assets
Available-for-sale financial assets are non-derivative financial assets that are designated as available-for-sale or are not classified in any of the above categories of financial assets. Available-for-sale financial assets are recognised initially at fair value plus any directly attributable transaction costs.
Subsequent to initial recognition, they are measured at fair value and changes therein, other than impairment losses on available-for-sale debt instruments, are recognised in other comprehensive income and presented in the “Available-for-sale financial assets reserve” in equity. When an investment is derecognised, the gain or loss accumulated in equity is reclassified to profit or loss.
Available-for-sale financial assets comprise equity securities and debt securities.
Management Discussion and Analysis
Our Performance Financial InformationGovernance and Risk Management
Supplementary Information

Ceylon Investment PLC Annual Report 2016/17 48 49
(ii) Non-derivative financial liabilities
The Company initially recognises debt securities issued and subordinated liabilities on the date that they are originated. All other financial liabilities are recognised initially on the trade date, which is the date that the Company becomes a party to the contractual provisions of the instrument.
The Company derecognises a financial liability when its contractual obligations are discharged, cancelled or expire.
The Company classifies non-derivative financial liabilities into the other financial liabilities category. Such financial liabilities are recognised initially at fair value less any directly attributable transaction costs. Subsequent to initial recognition, these financial liabilities are measured at amortised cost using the effective interest method.
Other financial liabilities comprise overdrafts and trade and other payables.
Bank overdrafts that are repayable on demand and form an integral part of the Company’s cash management are included as a component of cash and cash equivalents for the statement of cash flows.
(iii) Stated capital
Ordinary shares
Ordinary shares are classified as equity. Costs attributable to the issue of ordinary shares are recognised as a deduction from equity.
(d) Impairment
(i) Non derivative financial assets
A financial asset not classified as at fair value through profit or loss, including an interest in an equity-accounted investee, is assessed at each
reporting date to determine whether there is objective evidence that it is impaired. A financial asset is impaired if there is objective evidence of impairment as a result of one or more events that occurred after the initial recognition of the asset, and that loss event(s) had an impact on the estimated future cash flows of that asset that can be estimated reliably.
Objective evidence that financial assets are impaired includes default or delinquency by a debtor, restructuring of an amount due to the Company on terms that the Company would not consider otherwise, indications that a debtor or issuer will enter bankruptcy, adverse changes in the payment status of borrowers or issuers, economic conditions that correlate with defaults or the disappearance of an active market for a security. In addition, for an investment in an equity security, a significant or prolonged decline in its fair value below its cost is objective evidence of impairment. The Company considers a decline of 20 percent to be significant and a period of 9 months to be prolonged.
Financial assets measured at amortised cost
The Company considers evidence of impairment for financial assets measured at amortised cost (loans and receivables) at both a specific asset and collective level. All individually significant assets are assessed for specific impairment. Those found not to be specifically impaired are then collectively assessed for any impairment that has been incurred but not yet identified. Assets that are not individually significant are collectively assessed for impairment by grouping together assets with similar risk characteristics.
In assessing collective impairment, the Company uses historical trends of the probability of default, the timing of recoveries and the amount of loss incurred, adjusted for management’s judgement as
Notes to the Financial StatementsIn Rupees Thousands

to whether current economic and credit conditions are such that the actual losses are likely to be greater or lesser than suggested by historical trends.
An impairment loss in respect of a financial asset measured at amortised cost is calculated as the difference between its carrying amount and the present value of the estimated future cash flows discounted at the asset’s original effective interest rate. Losses are recognised in profit or loss and reflected in an allowance account against loans and receivables. When an event occurring after the impairment was recognised causes the amount of impairment loss to decrease, the decrease in impairment loss is reversed through profit or loss.
Available-for-sale financial assets
Impairment losses on available-for-sale financial assets are recognised by reclassifying the losses accumulated in the available for sale financial assets reserve in equity to profit or loss. The cumulative loss that is reclassified from equity to profit or loss is the difference between the acquisition cost, net of any principal repayment and amortisation, and the current fair value, less any impairment loss recognised previously in profit or loss. Changes in cumulative impairment losses attributable to application of the effective interest method are reflected as a component of interest income.
If, in a subsequent period, the fair value of an impaired available-for-sale debt security increases and the increase can be related objectively to an event occurring after the impairment loss was recognised, then the impairment loss is reversed, with the amount of the reversal recognised in profit or loss. However, any subsequent recovery in the fair value of an impaired available-for-sale equity security is recognised in other comprehensive income.
An impairment loss in respect of an equity-accounted investee is measured by comparing the recoverable amount of the investment with its carrying amount.
An impairment loss is recognised in profit or loss. An impairment loss is reversed if there has been a favourable change in the estimates used to determine the recoverable amount.
(ii) Non-financial assets
The carrying amounts of the Company’s non-financial assets are reviewed at each reporting date to determine whether there is any indication of impairment. If any such indication exists, then the asset’s recoverable amount is estimated impairment losses are recognised in profit or loss. An impairment loss is reversed only to the extent that the asset’s carrying amount does not exceed the carrying amount that would have been determined, net of depreciation or amortisation, if no impairment loss had been recognised.
(e) Provisions
A provision is recognised if, as a result of a past event, the Company has a present legal or constructive obligation that can be estimated reliably, and it is probable that an outflow of economic benefits will be required to settle the obligation. Provisions are determined by discounting the expected future cash flows at a pre-tax rate that reflects current market assessments of the time value of money and the risks specific to the liability. The unwinding of the discount is recognised as finance cost.
Management Discussion and Analysis
Our Performance Financial InformationGovernance and Risk Management
Supplementary Information

Ceylon Investment PLC Annual Report 2016/17 50 51
(i) Contingent liabilities and contingent assets
A contingent liability is a possible obligation that arises from past events whose existence will be confirmed by the occurrence or non-occurrence of one or more uncertain future events beyond the control of the Company or a present obligation that is not recognised because it is not probable that an outflow of resources will be required to settle the obligation.
A contingent liability also arises in extremely rare cases where there is a liability that cannot be recognised because it cannot be measured reliably. The Company does not recognise a contingent liability but discloses its existence in the financial statements.
A contingent asset is a possible asset that arises from past events whose existence will be confirmed by the occurrence or non-occurrence of one or more uncertain future events beyond the control of the Company. The Company does not recognise contingent assets but discloses its existence where inflows of economic benefits are probable, but not virtually certain.
(f) Revenue
Revenue is recognised to the extent that it is probable that the economic benefits will flow to the Company, and the revenue and associated costs incurred or to be incurred can be reliably measured. Revenue is measured at the fair value of the consideration received or receivable, net of trade discounts and sales taxes.
The following specific criteria are used for the purpose of recognition of revenue;
(i) Dividend Income
Dividend income is recognised in profit or loss on the date that the Company’s right to receive payment is established, which in the case of quoted securities is normally the ex-dividend date.
(ii) Gain on disposal of financial assets (categorised as available for sale / fair value through profit or loss)
Profits or losses on disposal of investments are accounted for in the profit or loss on the basis of realised net profit.
(iii) Interest income
Interest income comprises the amounts earned on funds invested (including available-for-sale financial assets), and is recognised as it accrues in profit or loss, using the effective interest method.
(iv) Other income
On accrual basis.
(g) Expenditure recognition
(i) Operating expenses
All expenses incurred in day-to-day operations of the business has been charged to revenue in arriving at the profit or loss for the year. Provision has also been made for impaired receivables and all known liabilities.
(ii) Finance income and finance expense
Finance expense comprise interest expense on borrowings and bank overdrafts.
Foreign currency gains and losses on financial assets and financial liabilities are reported on a net basis as either finance income or finance cost depending on whether foreign currency movements are in a net gain or net loss position.
(h) Fee and commission expenses
Fee and commission expenses are recognised in profit or loss when the related services are received.
(i) Income tax expense
Income tax expense comprises current tax and deferred tax. Current tax is recognised in profit or loss.
Notes to the Financial StatementsIn Rupees Thousands

(i) Current taxation
Current tax is the expected tax payable or receivable on the taxable income or loss for the year, using tax rates enacted or substantively enacted at the reporting date, and any adjustment to tax payable in respect of previous years.
(ii) Deferred taxation
Deferred tax is recognised in respect of temporary differences between the carrying amounts of assets and liabilities for financial reporting purposes and the amounts used for taxation purposes.
The measurement of deferred tax reflects the tax consequences that would follow the manner in which the Company expects, at the end of the reporting period, to recover or settle the carrying amount of its assets and liabilities.
Deferred tax is measured at the tax rates that are expected to be applied to temporary differences when they reverse, using tax rates enacted or substantively enacted at the reporting date.
Deferred tax assets and liabilities are offset if there is a legally enforceable right to offset current tax liabilities and assets, and they relate to taxes levied by the same tax authority on the same taxable entity, or on different tax entities, but they intend to settle current tax liabilities and assets on a net basis or their tax assets and liabilities will be realised simultaneously.
A deferred tax asset is recognised for unused tax losses, tax credits and deductible temporary differences to the extent that it is probable that future taxable profits will be available against which they can be utilised. Deferred tax assets are reviewed at each reporting date and are reduced to the extent that it is no longer probable that the related tax benefit will be realised, based on the level of future taxable profit forecasts and tax planning strategies.
(iii) Tax exposures
In determining the amount of current and deferred tax, the Company takes into account the impact of uncertain tax positions and whether additional taxes and interest may be due. This assessment relies on estimates and assumptions and may involve a series of judgements about future events. New information may become available that causes the Company to change its judgement regarding the adequacy of existing tax liabilities; such changes to tax liabilities will impact tax expense in the period that such a determination is made.
(iv) Economic service charge (ESC)
As per the provisions of Economic Service Charge Act No. 13 of 2006 and amendments thereto, is payable on “Liable Turnover” and is deductible from the income tax payments. Any unclaimed ESC can be carried forward and settled against the income tax payable in the four subsequent years.
(j) Related party transactions
Disclosure has been made in respect of the transactions in which one party has the ability to control or exercise significant influence over the financial and operating policies decisions of the other, irrespective of whether a price is charged.
4. EARNINGS PER SHARE
The Company presents basic earnings per share (EPS) data for its ordinary shares. Basic EPS is calculated by dividing the profit or loss attributable to ordinary shareholders of the Company by the weighted average number of ordinary shares outstanding during the period.
5. EVENTS AFTER THE REPORTING PERIOD
All material and important events which occur after the reporting date have been considered and disclosed in notes to the financial statements.
6. DIVIDENDS ON ORDINARY SHARES
Dividends on ordinary shares are recognised as a liability and deducted from equity when they are
Management Discussion and Analysis
Our Performance Financial InformationGovernance and Risk Management
Supplementary Information

Ceylon Investment PLC Annual Report 2016/17 52 53
approved by the Company’s shareholders. Interim dividends are deducted from equity when they are declared and are no longer at the discretion of the Company.
7. SEGMENT REPORTING
Segment results that are reported to the Board of directors include items that are directly attributable to a segment as well as those that can be allocated on a reasonable basis.
8. PRESENTATION
Assets and liabilities are grouped by nature and listed in an order that reflects their relative liquidity and maturity pattern.
(i) Off setting income and expenses
Income and expenses are not offset unless required or permitted by accounting standards.
(ii) Off setting assets and liabilities
Assets and liabilities are offset and the net amount reported in the statement of financial position only where there is;
• a current enforceable legal right to offset the asset and the liability; and
• an intention to settle the liability simultaneously
9. STATEMENT OF CASH FLOWS
Indirect Method of preparing cash flows in accordance with the Sri Lanka Accounting Standard (LKAS) 7, “Statement of cash flows”.
For cash flow purposes, cash and cash equivalents are presented net of bank overdrafts.
10. DETERMINATION OF FAIR VALUES
A number of the company’s accounting policies and disclosures require the determination of fair value, for both financial and non-financial assets and liabilities. Fair values have been determined for measurement and/or disclosure purposes
based on the following methods. Where applicable, further information about the assumptions made in determining fair values is disclosed in the notes specific to that asset or liability.
When measuring the fair value of an asset or a liability, the Company uses market observable data as far as possible. Fair values are categorised into different levels in a fair value hierarchy based on the inputs used in the valuation techniques as follows;
• Level 1- Input that are quoted market prices (unadjusted) in active markets for identifiable assets and liabilities
• Level 2- Inputs other than quoted prices included in Level 1 that are observable from the asset or liability either directly (as prices) or indirectly (derived prices)
• Level 3 – Inputs from the asset or liability that are not based on observable market data (unobservable inputs) This category includes all financial instruments for which the valuation techniques include inputs not based on observable data and unobservable inputs have significant effect on the instrument’s valuation.
If the inputs used to measure the fair value of an asset or a liability might be categorised in different levels of the fair value hierarchy, then the fair value measurement is categorised in its entirety in the same level of the fair value hierarchy as the lowest level input that is significant to the entire measurement.
(a) Equity and debt securities
The fair values of investments in equity and debt securities are determined with reference to their quoted closing bid price at the measurement date, or if unquoted, determined using a valuation technique. Valuation techniques employed include
Notes to the Financial StatementsIn Rupees Thousands

Management Discussion and Analysis
Our Performance Financial InformationGovernance and Risk Management
Supplementary Information
market multiples and discounted cash flow analysis using expected future cash flows and a market-related discount rate.
(b) Trade and other receivables
The fair values of trade and other receivables are estimated at the present value of future cash flows, discounted at the market rate of interest at the measurement date. Short-term receivables with no stated interest rate are measured at the original invoice amount if the effect of discounting is immaterial. Fair value is determined at initial recognition and, for disclosure purposes, at each annual reporting date.
(c) Other non-derivative financial liabilities
Other non-derivative financial liabilities are measured at fair value, at initial recognition and for disclosure purposes, at each annual reporting date.
Directors’ responsibility
The Board of Directors is responsible for the preparation and presentation of the Financial Statements. This is more fully described under the relevant clause in the Directors’ Report.
NEW ACCOUNTING STANDARDS
Standards issued but not effective as at the reporting date
A number of new standards and amendments to standards which have been issued but not yet effective as at the reporting date have not been applied in preparing these Financial Statements. Accordingly, these Accounting Standards have not been applied in preparing these financial statements.
SLFRS 9 Financial Instruments
SLFRS 9, issued in 2014, replaces the existing guidance in LKAS 39 Financial Instruments: Recognition and Measurement. SLFRS 9 includes revised guidance on the classification and measurement of financial instruments. It also
carries forward the guidance on recognition and derecognition of financial instruments from LKAS 39.
Effective date of IFRS 9 is 01st January 2018.
The Company is assessing the potential impact on its financial statements resulting from the application of SLFRS 9.
SLFRS 15 Revenue from Contracts with Customers
SLFRS 15 establishes a comprehensive framework for determining whether, how much and when revenue is recognised. It replaces existing revenue recognition guidance, including LKAS 18 Revenue, and LKAS 11 Construction Contracts.
SLFRS 15 is effective for annual reporting periods beginning on or after 01st January 2018.
The above new standard (SLFRS 15) is not expected to have a significant impact of the Company’s financial statements.
SLFRS 16 LEASES
SLFRS 16 eliminates the current dual accounting model for lessees which distinguishes between On-Balance Sheet finance leases and Off Balance Sheet operating leases. Instead, there will be a single On- Balance Sheet accounting model that is similar to current finance lease accounting.
SLFRS 16 is effective for reporting periods beginning on or after 01 January 2019.
The above new standard (SLFRS 16) is not expected to have a significant impact of the Company's financial statements.

Ceylon Investment PLC Annual Report 2016/17 54 55
For the year ended 31st March 2017 2016
11 REVENUE
Net gain from disposal of fair value through profit or loss financial assets 44,948 19,095
Net gain from disposal of available for sale financial assets (note 11.1) 63,835 177,775
Dividend income 284,674 176,425
Interest income on financial assets carried at amortised cost (note 11.2) 7,672 27,932
401,129 401,227
Dividend received from equity accounted investee (103,191) (79,195)
297,938 322,032
11.1 Net gain from disposal of available for sale financial assets
Proceeds from disposal of available for sale financial assets 558,083 581,614
Carrying value of available for sale financial assets disposed (489,413) (577,283)
Transfer of realised gains / (losses) on disposal of available for sale financial assets (4,835) 173,444
63,835 177,775
11.2 Interest income on financial assets carried at amortised cost
Cash at bank 411 498
Securities purchased under resale agreements 6,625 19,180
Placements with banking institutions 636 8,254
7,672 27,932
12 PROFIT FROM OPERATIONS
Profit from operations is stated after charging all expenses including the following :
Auditors’ remuneration and expenses
- Audit and related fees 515 535
Directors' fees (note 26.3) 6,102 6,149
Personnel cost (note 12.a) - -
Professional services cost 253 -
Expenses on CSR activities 2,500 2,750
Support service fees (note 12.b) 10,791 11,222
Notes to the Financial StatementsIn Rupees Thousands

12.a The Company had no employees of its own during the financial year under review (2016 - nil).
12.b Support service fee refers to the fees paid to Carsons Management Services (Private) Limited, a related company, the Managers and Secretaries of the Company.
13 FINANCE EXPENSE
For the year ended 31st March 2017 2016
Interest on bank overdraft 71 18
71 18
14 SHARE OF PROFIT OF EQUITY ACCOUNTED INVESTEE NET OF TAX
Company’s share of profit net of tax
Company’s share of other comprehensive expense net
of tax
For the year ended 31st March 2017 2016 2017 2016
Rubber Investment Trust Limited 510,433 162,922 (1,245,490) (3,570,466)
510,433 162,922 (1,245,490) (3,570,466)
15 INCOME TAX EXPENSE
For the year ended 31st March 2017 2016
Provision for the year (note 15.1) 1,884 6,803
Dividend tax on dividend received from equity accounted investee 5,393 762
Over provision for previous years (23) (17)
Total tax expense for the year 7,254 7,548
Management Discussion and Analysis
Our Performance Financial InformationGovernance and Risk Management
Supplementary Information

Ceylon Investment PLC Annual Report 2016/17 56 57
Notes to the Financial StatementsIn Rupees Thousands
15. INCOME TAX EXPENSE CONTD.
For the year ended 31st March 2017 2016
15.1 Reconciliation between accounting profit and taxable profits
Accounting profit before taxation 660,068 294,763
Less: share of profit of equity accounted investee net of tax (510,433) (162,922)
Dividend income (excluding dividend received from the associate company) (181,483) (97,230)
Exempt profits on sale of shares / unit trusts (note 15.2 (ii)) (108,783) (196,870)
Net change in fair value of fair value through profit or loss financial assets 2,782 89,878
Impairment loss on available for sale financial assets 95,215 45,661
Disallowed expenses 3,231 4,262
Expenses attributable to exempt profits 46,133 46,753
Taxable profit for the year 6,730 24,295
Current taxation thereon (note 15.2 (i)) 1,884 6,803
15.2 Current taxation on profits
i) In accordance with the provisions of the Inland Revenue Act, No. 10 of 2006 and amendments thereto, the Company is liable to income tax at 28% (2016 - 28%).
ii) In terms of Section 13 (t) and Section 13 (tt) of The Inland Revenue Act, No. 10 of 2006 and amendments thereto, profits derived on the sale of shares on which Share Transaction Levy (STL) has been paid and profit derived on the redemption of units of unit trust are exempted from income tax.

16 EARNINGS PER SHAREThe Company's basic earnings per share is calculated on the profit attributable to the shareholders of Ceylon Investment PLC over the weighted average number of ordinary shares outstanding during the year, as required by Sri Lanka Accounting Standard (LKAS 33) - "Earnings per share".
The following reflects the earning and share data used for the computation of earnings per share:
For the year ended 31st March 2017 2016
Amount used as the numerator
Profit for the year (Rs'000) 652,814 287,215
Amount used as the denominator
Weighted average number of ordinary shares outstanding during the year
No of shares as at the beginning of the year 99,451,059 98,514,874
Issue of ordinary shares as scrip dividends - 936,185
99,451,059 99,451,059
Earnings per share (Rs.) 6.56 2.89
17 DIVIDENDS
17.1 Dividends paid during the year
Interim dividend - scrip - 98,514
Interim dividend - cash 174,039 149,177
17.2 Dividends proposed during the year
First interim dividend - cash
Total dividend paid 174,039 149,177
Dividend per share (Rs.) 1.75 1.50
Management Discussion and Analysis
Our Performance Financial InformationGovernance and Risk Management
Supplementary Information
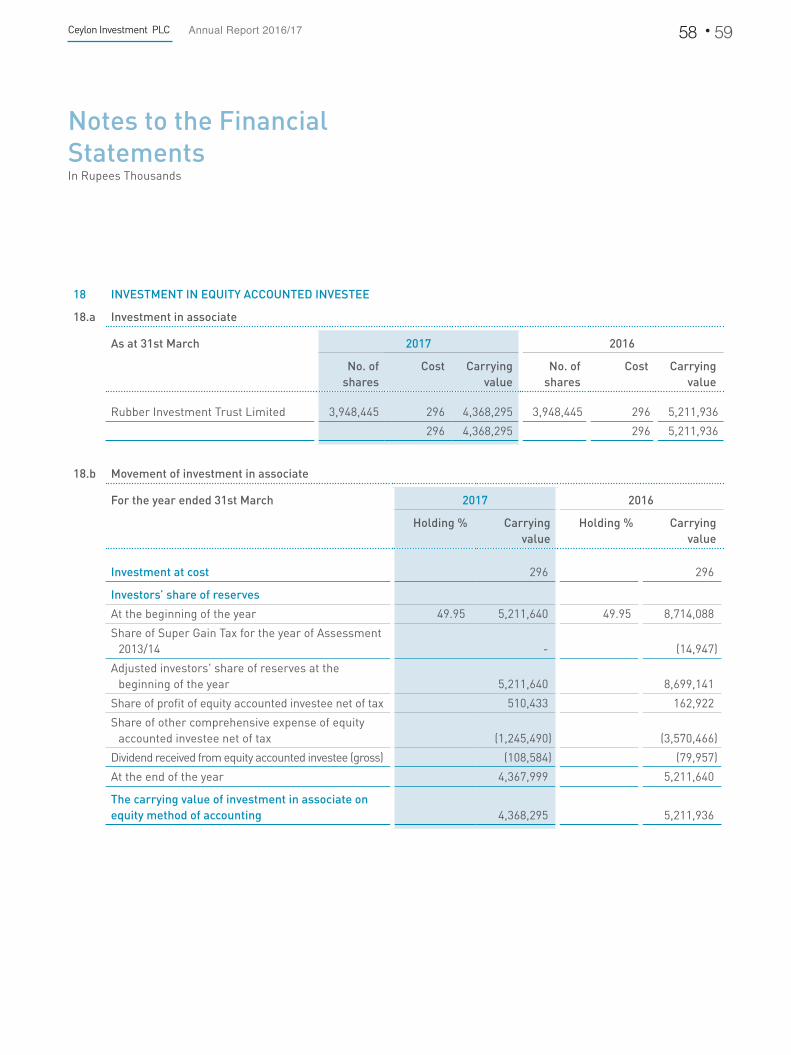
Ceylon Investment PLC Annual Report 2016/17 58 59
Notes to the Financial StatementsIn Rupees Thousands
18 INVESTMENT IN EQUITY ACCOUNTED INVESTEE
18.a Investment in associate
As at 31st March 2017 2016
No. of shares
Cost Carrying value
No. of shares
Cost Carrying value
Rubber Investment Trust Limited 3,948,445 296 4,368,295 3,948,445 296 5,211,936
296 4,368,295 296 5,211,936
18.b Movement of investment in associate
For the year ended 31st March 2017 2016
Holding % Carrying value
Holding % Carrying value
Investment at cost 296 296
Investors’ share of reserves
At the beginning of the year 49.95 5,211,640 49.95 8,714,088
Share of Super Gain Tax for the year of Assessment 2013/14 - (14,947)
Adjusted investors' share of reserves at the beginning of the year 5,211,640 8,699,141
Share of profit of equity accounted investee net of tax 510,433 162,922
Share of other comprehensive expense of equity accounted investee net of tax (1,245,490) (3,570,466)
Dividend received from equity accounted investee (gross) (108,584) (79,957)
At the end of the year 4,367,999 5,211,640
The carrying value of investment in associate on equity method of accounting 4,368,295 5,211,936

18.c Summarised financial information of the Associate Company - Rubber Investment Trust Limited
For the year ended/as at 31st March 2017 2016
Revenue 1,077,417 437,049
Profit for the year 1,021,916 326,179
Other comprehensive expense for the year (2,493,542) (7,148,265)
Total comprehensive expense for the year (1,471,626) (6,822,086)
Current assets 2,178,996 1,151,203
Non - current assets 6,580,811 9,351,020
Current liabilities 14,241 67,643
Total equity 8,745,566 10,434,580
18.d The deferred tax effect on undistributed reserves of the associate company has not been recognised since the Company and the parent entity of the Company, Ceylon Guardian Investment Trust PLC, can control the timing of the reversal of these temporary differences.
Management Discussion and Analysis
Our Performance Financial InformationGovernance and Risk Management
Supplementary Information
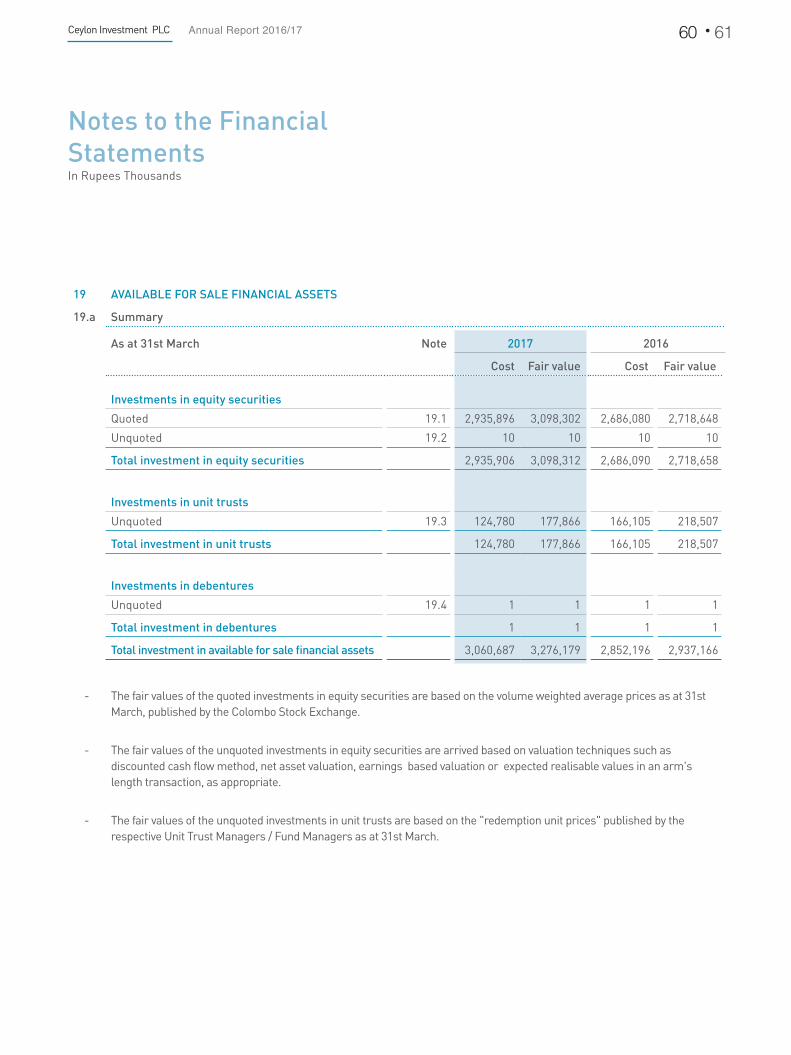
Ceylon Investment PLC Annual Report 2016/17 60 61
Notes to the Financial StatementsIn Rupees Thousands
19 AVAILABLE FOR SALE FINANCIAL ASSETS
19.a Summary
As at 31st March Note 2017 2016
Cost Fair value Cost Fair value
Investments in equity securities
Quoted 19.1 2,935,896 3,098,302 2,686,080 2,718,648
Unquoted 19.2 10 10 10 10
Total investment in equity securities 2,935,906 3,098,312 2,686,090 2,718,658
Investments in unit trusts
Unquoted 19.3 124,780 177,866 166,105 218,507
Total investment in unit trusts 124,780 177,866 166,105 218,507
Investments in debentures
Unquoted 19.4 1 1 1 1
Total investment in debentures 1 1 1 1
Total investment in available for sale financial assets 3,060,687 3,276,179 2,852,196 2,937,166
- The fair values of the quoted investments in equity securities are based on the volume weighted average prices as at 31st March, published by the Colombo Stock Exchange.
- The fair values of the unquoted investments in equity securities are arrived based on valuation techniques such as discounted cash flow method, net asset valuation, earnings based valuation or expected realisable values in an arm's length transaction, as appropriate.
- The fair values of the unquoted investments in unit trusts are based on the "redemption unit prices" published by the respective Unit Trust Managers / Fund Managers as at 31st March.

19.b Movement in available for sale financial assets
For the year ended 31st March 2017 Fair Valueas at
1st April2016
Additions Disposals Change in fairvalue
Fair valueas at
31st March2017
Investments in equity securities 2,718,658 715,406 (459,144) 123,392 3,098,312
Investments in unit trusts 218,507 - (30,269) (10,372) 177,866
Investments in debentures 1 - - - 1
2,937,166 715,406 (489,413) 113,020 3,276,179
For the year ended 31st March 2016 Fair Valueas at
1st April2015
Additions Disposals Change in fairvalue
Fair valueas at
31st March2016
Investments in equity securities 3,188,607 486,458 (577,283) (379,124) 2,718,658
Investments in unit trusts 230,166 1,387 - (13,046) 218,507
Investments in debentures 1 - - - 1
3,418,774 487,845 (577,283) (392,170) 2,937,166
The change in fair value represents net unrealised gains / (losses) on fair value adjustment of investment portfolios including any adjustment on impairment losses.
Due to significant / prolonged decline in fair value of identified equity securities in available for sale financial assets below its cost, an impairment loss which amounted to Rs. 95.21 Mn has been recognised in profit or loss for the year (2016 – Rs. 45.66 Mn) as required by LKAS – 39 “Financial Instruments; recognition and measurement”. LKAS – 39 also requires to recognise fair value gains and losses arising from assets classified as available for sale, other than impairment losses, in other comprehensive income. Accordingly, a gain of Rs. 200.79 Mn and loss of Rs. 360.28 Mn have been recognised in financial years ended 31st March 2017 and 2016 respectively.
Management Discussion and Analysis
Our Performance Financial InformationGovernance and Risk Management
Supplementary Information

Ceylon Investment PLC Annual Report 2016/17 62 63
Notes to the Financial StatementsIn Rupees Thousands
19 AVAILABLE FOR SALE FINANCIAL ASSETS CONTD.
19.1 Investments in equity securities - quoted
As at 31st March 2017 2016
No. of shares
Cost Fair value No. of shares
Cost Fair value
Banks, Finance & Insurance
Central Finance Company PLC 2,410,136 235,798 207,754 1,166,195 235,798 244,901
Ceylinco Insurance PLC - Non voting 126,010 85,300 103,328 126,010 85,300 98,540
Commercial Bank of Ceylon PLC 3,305,927 343,112 431,093 3,355,121 345,516 421,068
Hatton National Bank PLC 1,747,128 356,916 393,628 1,723,625 351,487 343,518
Hatton National Bank PLC - Non voting 623,901 111,027 115,422 614,227 109,092 105,033
Peoples' Insurance PLC 1,765,200 26,478 32,303 1,765,200 26,478 29,832
Peoples' Leasing & Finance PLC 6,288,036 111,938 98,093 5,050,536 88,807 80,809
Sampath Bank PLC 1,752,267 403,196 453,837 1,489,627 344,120 336,656
1,673,765 1,835,458 1,586,598 1,660,357
Beverage, Food & Tobacco
Distilleries Company of Sri Lanka PLC - - - 1,345,061 316,857 277,352
Cargils (Ceylon) PLC 350,250 61,666 65,742 - - -
61,666 65,742 316,857 277,352
Constructions & Engineering
Access Engineering PLC 2,000,000 73,225 47,600 2,000,000 73,225 41,600
73,225 47,600 73,225 41,600

As at 31st March 2017 2016
No. of shares
Cost Fair value No. of shares
Cost Fair value
Diversified
Aitken Spence PLC 1,674,000 168,425 94,079 1,674,000 168,425 123,039
John Keells Holdings PLC 183,693 8,466 25,332 160,732 8,466 23,788
Melstacorp PLC 4,980,244 295,204 294,830 - - -
472,095 414,241 176,891 146,827
Footwear & Textiles
Hayleys Fabric PLC 11,265,372 132,437 153,209 11,265,372 132,437 202,777
132,437 153,209 132,437 202,777
Health Care
Ceylon Hospitals PLC - - - 313,378 17,623 28,204
- - 17,623 28,204
Hotels & Travels
Aitken Spence Hotel Holdings PLC 2,269,575 146,144 79,889 2,269,575 146,144 120,286
Serendib Hotels PLC - - - 549,890 19,462 15,122
146,144 79,889 165,606 135,408
Motors
Diesel & Motor Engineering PLC - - - 62,556 31,443 34,387
- - 31,443 34,387
Manufacturing
Tokyo Cement Company (Lanka) PLC 4,750,000 191,164 289,750 - - -
191,164 289,750 - -
Telecommunication
Dialog Axiata PLC 18,797,647 185,400 212,413 18,797,647 185,400 191,736
185,400 212,413 185,400 191,736
Total investment in equity securities - quoted 2,935,896 3,098,302 2,686,080 2,718,648
Management Discussion and Analysis
Our Performance Financial InformationGovernance and Risk Management
Supplementary Information
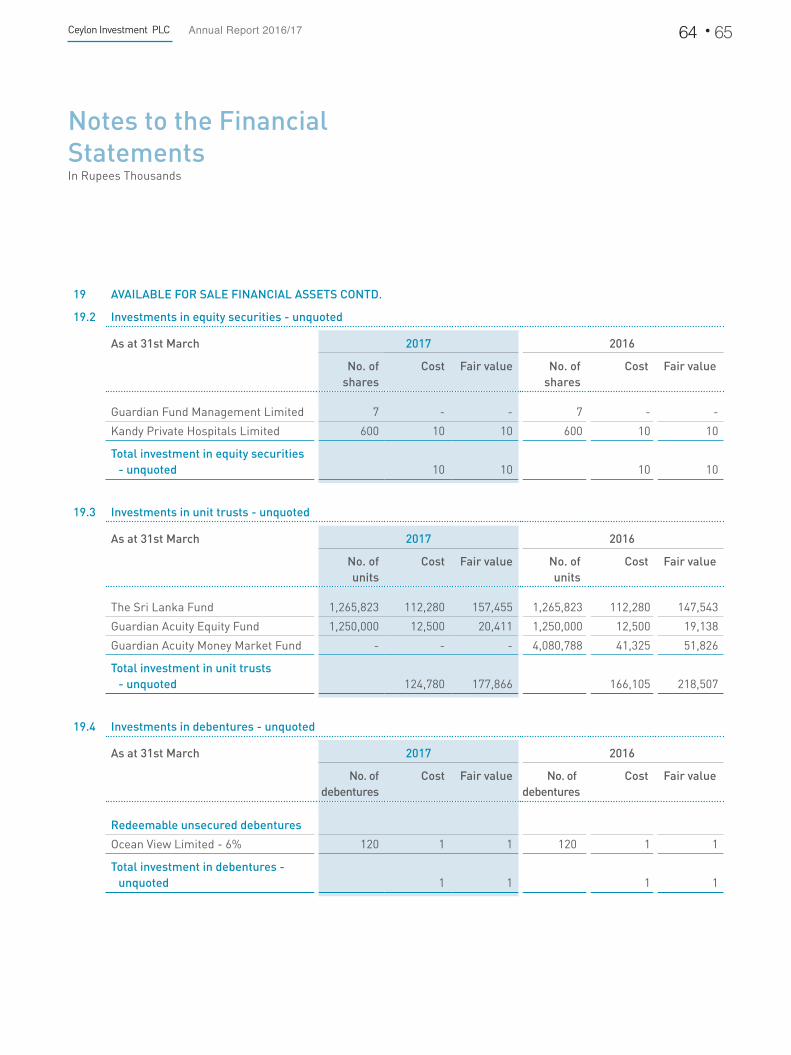
Ceylon Investment PLC Annual Report 2016/17 64 65
Notes to the Financial StatementsIn Rupees Thousands
19 AVAILABLE FOR SALE FINANCIAL ASSETS CONTD.
19.2 Investments in equity securities - unquoted
As at 31st March 2017 2016
No. of shares
Cost Fair value No. of shares
Cost Fair value
Guardian Fund Management Limited 7 - - 7 - -
Kandy Private Hospitals Limited 600 10 10 600 10 10
Total investment in equity securities - unquoted 10 10 10 10
19.3 Investments in unit trusts - unquoted
As at 31st March 2017 2016
No. of units
Cost Fair value No. of units
Cost Fair value
The Sri Lanka Fund 1,265,823 112,280 157,455 1,265,823 112,280 147,543
Guardian Acuity Equity Fund 1,250,000 12,500 20,411 1,250,000 12,500 19,138
Guardian Acuity Money Market Fund - - - 4,080,788 41,325 51,826
Total investment in unit trusts - unquoted 124,780 177,866 166,105 218,507
19.4 Investments in debentures - unquoted
As at 31st March 2017 2016
No. of debentures
Cost Fair value No. of debentures
Cost Fair value
Redeemable unsecured debentures
Ocean View Limited - 6% 120 1 1 120 1 1
Total investment in debentures - unquoted 1 1 1 1

20 TRADE AND OTHER RECEIVABLES
As at 31st March 2017 2016
Financial
Trade receivable 5,240 -
Dividend receivable 17,299 9,836
22,539 9,836
Non financial
Prepaid expenses 194 302
194 302
22,733 10,138
21 FAIR VALUE THROUGH PROFIT OR LOSS FINANCIAL ASSETS
21.a. Summary
Note Fair value
As at 31st March 2017 2016
Investments in equity securities
Quoted 21.1 712,372 639,092
Total investment in equity securities 712,372 639,092
Investments in unit trusts
Unquoted 21.2 256,335 154,359
Total investment in unit trusts 256,335 154,359
Total investment in fair value through profit or loss financial assets 968,707 793,451
- The fair value of the Company’s quoted equity portfolio is based on the volume weighted average price as at 31st March, published by the Colombo Stock Exchange.
- The fair values of the unquoted investments in unit trusts are based on the “redemption unit prices” published by the respective Unit Trust Managers as at 31st March.
Management Discussion and Analysis
Our Performance Financial InformationGovernance and Risk Management
Supplementary Information

Ceylon Investment PLC Annual Report 2016/17 66 67
Notes to the Financial StatementsIn Rupees Thousands
21 FAIR VALUE THROUGH PROFIT OR LOSS FINANCIAL ASSETS CONTD.
21.b. Movement in fair value through profit or loss financial assets
For the year ended 31st March 2017 Fair Valueas at
1st April2016
Additions Disposals Change in fairvalue
Fair valueas at
31st March2017
Investments in equity securities 639,092 340,259 (263,862) (3,117) 712,372
Investments in unit trust 154,359 296,000 (194,359) 335 256,335
793,451 636,259 (458,221) (2,782) 968,707
For the year ended 31st March 2016 Fair Valueas at
1st April2015
Additions Disposals Change in fairvalue
Fair valueas at
31st March2016
Investments in equity securities 665,488 314,374 (246,533) (94,237) 639,092
Investments in unit trust - 150,000 - 4,359 154,359
665,488 464,374 (246,533) (89,878) 793,451
The change in fair value represent unrealised gains / (losses) on fair value adjustment of fair value through profit or loss financial assets.

21.1 Investments in equity securities - quoted
As at 31st March 2017 2016
No. of shares
Fair value No. of shares
Fair value
Banks, Finance & Insurance
Commercial Bank of Ceylon PLC 358,054 46,690 250,000 31,375
DFCC Bank PLC 157,616 17,968 157,616 21,594
Hatton National Bank PLC 214,414 48,307 356,530 71,056
Hatton National Bank PLC- Non voting 336,848 62,317 331,625 56,708
Janashakthi Insurance Company PLC 1,350,000 20,385 1,500,000 24,000
Seylan Bank PLC 400,000 34,800 400,000 34,400
Seylan Bank PLC - Non voting 393,000 21,497 393,000 24,759
Singer Finance (Lanka) PLC 500,000 8,550 500,000 9,050
Softlogic Capital PLC - - 600,000 3,600
Union Bank of Colombo PLC 1,940,775 27,559 1,940,775 32,217
288,073 308,759
Beverage, Food & Tobacco
Distilleries Company of Sri Lanka PLC - - 310,396 64,004
- 64,004
Construction & Engineering
Access Engineering PLC 1,309,609 31,169 409,609 8,520
MTD Walkers PLC 320,104 11,204 320,104 10,659
42,373 19,179
Diversified
Aitken Spence PLC 410,000 23,042 410,000 30,135
Hemas Holdings PLC - - 654,000 52,712
John Keells Holdings PLC 523,571 72,200 100,000 14,800
Melstacorp PLC 841,584 49,822 - -
Softlogic Holdings PLC 3,671,578 43,692 3,671,578 48,832
188,756 146,479
Management Discussion and Analysis
Our Performance Financial InformationGovernance and Risk Management
Supplementary Information

Ceylon Investment PLC Annual Report 2016/17 68 69
Notes to the Financial StatementsIn Rupees Thousands
21 FAIR VALUE THROUGH PROFIT OR LOSS FINANCIAL ASSETS CONTD.
21.1 Investments in equity securities - quoted
As at 31st March 2017 2016
No. of shares
Fair value No. of shares
Fair value
Health Care
The Lanka Hospital Corporation PLC 448,000 27,552 448,000 22,848
27,552 22,848
Hotels & Travels
Serendib Hotels PLC - Non voting 266,296 5,326 266,296 4,660
5,326 4,660
Land & Property
Overseas Realty (Ceylon) PLC 700,000 14,140 2,090,859 48,926
14,140 48,926
Manufacturing
ACL Cables PLC 725,842 39,558 - -
Alumex PLC 2,260,000 42,940 - -
Kelani Tyres PLC 249,432 13,719 249,432 15,964
Tokyo Cement Company (Lanka) PLC - Non Voting 715,000 37,895 - -
134,112 15,964
Power & Energy
Lanka IOC PLC 415,163 12,040 - -
Vallibel Power Erathna PLC - - 1,034,117 8,273
12,040 8,273
Total investment in equity securities - quoted 712,372 639,092
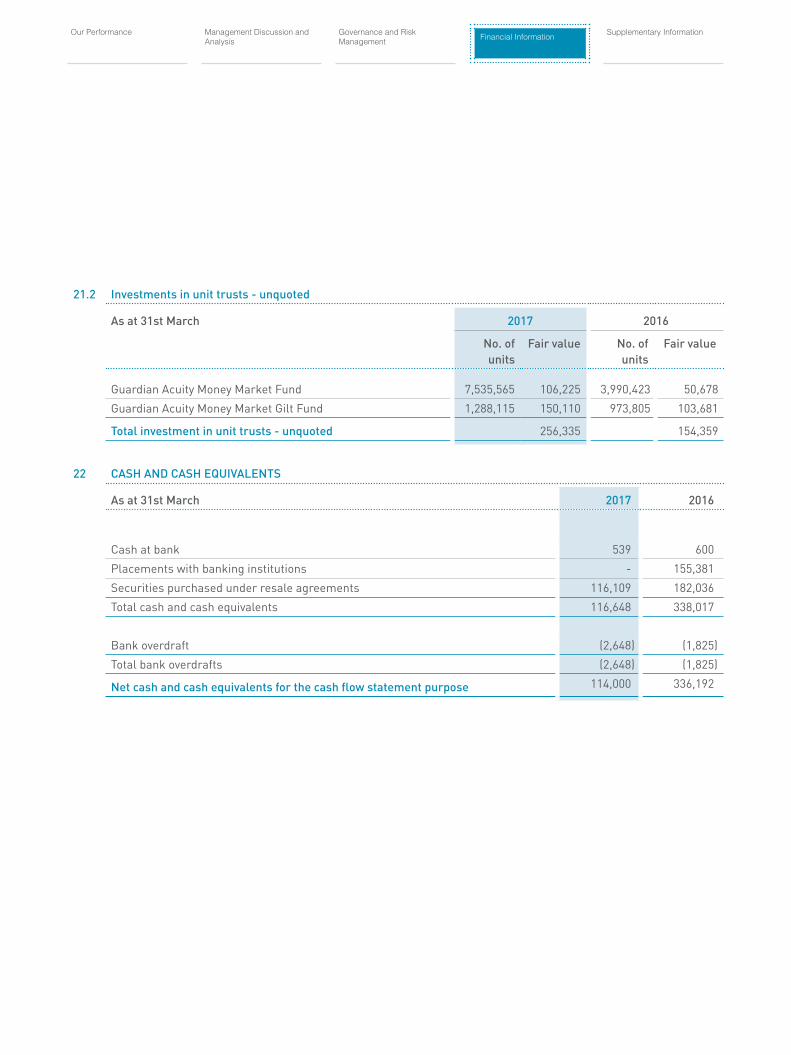
21.2 Investments in unit trusts - unquoted
As at 31st March 2017 2016
No. of units
Fair value No. of units
Fair value
Guardian Acuity Money Market Fund 7,535,565 106,225 3,990,423 50,678
Guardian Acuity Money Market Gilt Fund 1,288,115 150,110 973,805 103,681
Total investment in unit trusts - unquoted 256,335 154,359
22 CASH AND CASH EQUIVALENTS
As at 31st March 2017 2016
Cash at bank 539 600
Placements with banking institutions - 155,381
Securities purchased under resale agreements 116,109 182,036
Total cash and cash equivalents 116,648 338,017
Bank overdraft (2,648) (1,825)
Total bank overdrafts (2,648) (1,825)
Net cash and cash equivalents for the cash flow statement purpose 114,000 336,192
Management Discussion and Analysis
Our Performance Financial InformationGovernance and Risk Management
Supplementary Information

Ceylon Investment PLC Annual Report 2016/17 70 71
Notes to the Financial StatementsIn Rupees Thousands
23 STATED CAPITAL
As at 31st March 2017 2016
Note No.of shares
Value No.of shares
Value
Ordinary shares
Issued and fully paid 23.1 99,451,059 763,497 99,451,059 763,497
763,497 763,497
23.1 Ordinary share - Issued and fully paid
Balance as at the beginning of the year 99,451,059 763,497 98,514,874 673,530
Issue of shares - scrip dividend - - 936,185 89,967
Balance as at the end of the year 99,451,059 763,497 99,451,059 763,497
24 CAPITAL AND REVENUE RESERVES
24.1 Capital reserves
As at 31st March Note 2017 2016
Investment reserve 24.1.1 8,401 8,401
Other capital reserve 24.1.1 178,740 178,740
187,141 187,141
24.1.1 Investment reserve and other capital reserve
These represent the amounts set aside to meet any contingencies.
24.2 Revenue reserves
As at 31st March Note 2017 2016
Available for sale financial assets reserve 24.2.1 492,726 279,656
General reserve 24.2.2 27,217 27,217
Retained earnings 2,714,560 2,634,502
Associate Company's reserve 24.2.3 4,367,999 5,211,640
7,602,502 8,153,015

24.2.1 Available for sale financial assets reserve
This consists of accumulated net unrealised gains arising from fair valuation of available for sale financial assets, excluding the impact arising from impairment of such assets. The movement of this reserve is given in the statement of changes in equity.
24.2.2 General reserve
This represents the amounts set aside to meet any contingencies.
24.2.3 Associate Company's reserve
This represents the Company's share of net assets of the equity accounted investee. The movement of this reserve is given in the statement of changes in equity.
25 TRADE AND OTHER PAYABLES
As at 31st March 2017 2016
Financial
Trade payables 359 8,544
Dividend payable (note 25.1) 174,039 149,177
Other payables 23,572 24,048
197,970 181,769
Non Financial
Provisions and accrued expenses 2,119 2,072
2,119 2,072
200,089 183,841
25.1 Dividend payable
Dividend payable includes dividend payable to parent Company Ceylon Guardian Investment Trust PLC, amounting to Rs. 112 Mn (2016 - Rs. 96 Mn).
Management Discussion and Analysis
Our Performance Financial InformationGovernance and Risk Management
Supplementary Information

Ceylon Investment PLC Annual Report 2016/17 72 73
26 RELATED PARTY TRANSACTIONS
The Company carried out transactions in the ordinary course of its business with parties who are defined as related parties in Sri Lanka Accounting Standard (LKAS 24) - “Related Party Disclosures ”, the details of which are reported below.
26.1 Parent and ultimate controlling entity
Ceylon Guardian Investment Trust PLC is the immediate Parent Company of Ceylon Investment PLC. In the opinion of the Directors, Carson Cumberbatch PLC is the Parent Company of Ceylon Guardian Investment Trust PLC and Bukit Darah PLC is the Ultimate Parent and Controlling Entity of Ceylon Investment PLC.
26.2 Transactions with Key Management Personnel (KMP)
According to Sri Lanka Accounting Standard (LKAS 24) - “Related Party Disclosures”, Key Management Personnel (KMP) are those having authority and responsibility for planning and controlling the activities of the entity directly or indirectly. Accordingly, the Directors of the Company, the Directors of the parent Company, Ceylon Guardian Investment Trust PLC, have been classified as Key Management Personnel of the Company.
Mrs. W. Y. R. Fernando was appointed to the Board on 15th August 2016. Accordingly, she has been classified as KMP from the date of her appointment to the Board.
Mr. I. Paulraj has resigned from the Board with effect from 15th August 2016. Accordingly, he has ceased to be a KMP from the date of his resignation from the Board.
26.3 Compensation paid to the Key management personnel of the company comprised the following;
For the year ended 31st March 2017 2016
Short-term employee benefits 6,102 6,149
Post-employment benefits - -
Termination benefits - -
Other long-term benefits - -
Non cash benefits - -
6,102 6,149
Notes to the Financial StatementsIn Rupees Thousands

26.4 Transactions with the Related Companies
Name of the related company Relationship Nature of transactions Value of transactions
2017 2016
Ceylon Guardian Investment Trust PLC
Parent company Dividend paid 112,019 154,003
Rubber Investment Trust Limited Associate Dividends received 103,191 79,195
Guardian Fund Management Limited (GFM)
Fellow subsidiary Portfolio management fees paid* 19,398 19,835
Carsons Management Services (Private) Limited (CMSL)
Fellow subsidiary Support service fees paid** 10,791 11,222
Computer fees paid 420 420
Secretarial fees paid 403 403
Hatton National Bank PLC Other entity Interest income received 636 11,618
Placement in demand deposits 80 82
Placements with banking institutions - 150,000
Bank charges paid 2 213
Amounts due to related entities are disclosed in note 25.1.
*Portfolio management fee is based on portfolio value of the Company.
**Support service fee is based on the services provided by CMSL.
26.5 Significant Holdings
Holding %
2017 2016
Associate
Rubber Investment Trust Limited 49.95% 49.95%
Management Discussion and Analysis
Our Performance Financial InformationGovernance and Risk Management
Supplementary Information

Ceylon Investment PLC Annual Report 2016/17 74 75
Notes to the Financial StatementsIn Rupees Thousands
27 FINANCIAL INSTRUMENTS
Financial risk management - Overview
The Company has exposure to the following risks arising from financial instruments: • Credit risk • Liquidity risk • Market risk. This note presents information about the Company’s exposure to each of the above risks, the Company’s objectives, policies and processes for measuring and managing such risks, and the Company’s management of capital. Pages 12 to 17 also carry a review of risks faced by the Company and the approach of managing such risks.
Risk management framework
The Company’s Board of Directors has the overall responsibility for the establishment and oversight of the Company’s risk management framework. The Board of Directors has delegated this function to the Management of Guardian Fund Management Limited, the Investment Managers, and Carsons Management Services (Private) Limited, the Managers; who are responsible for developing and monitoring the Company's risk management policies and reports regularly to the Board of Directors on its activities.
The Company’s risk management policies are established to identify and analyse the risks faced by the Company, to set appropriate risk limits and controls, and to monitor risks and adherence to such limits. Risk management policies and systems are reviewed regularly to reflect changes in market conditions and the Company’s activities.
The Company’s investment portfolio comprises of investments in listed / unlisted equity securities and fixed income securities. The Company’s investment manager has been given discretionary authority to manage the assets, in line with the Company’s investment policies and objectives.
Further, an Investment Committee provides advice and insights to the fund management team to further sharpen and refine their decision making process. This comprehensive management structure determines the objectives and policies of the Company’s risk management framework and promotes a culture of risk awareness and balanced risk-taking within the Company.
27.1 Credit risk
Credit risk is the risk of financial loss to the Company, if a customer or a counterparty to a financial instrument or an obliged party to a receivable fails to meet their contractual obligations, and arises primarily on the Company’s investments in fixed income earning securities, investments in unit trusts, placements with banking institutions and receivables from market intermediaries and other counter parties that the Company has dealings with.

27.1.1 Credit risk exposure and managing the riskThe carrying amount of financial assets represents the maximum credit exposure. The maximum exposure to credit risk at the end of the reporting period was as follows.
Carrying Amount
As at 31st March Note 2017 2016
Available for sale financial assets - Investment in unit trusts 19.3 177,866 218,507
Available for sale financial assets - Investment in debentures 19.4 1 1
Fair value through profit or loss financial assets - Investment in unit trusts 21.2 256,335 154,359
Trade and other receivables* 20 22,539 9,836
Cash and cash equivalents - Cash at bank 22 539 600
Cash and cash equivalents - Placements with banking institutions 22 - 155,381
Cash and cash equivalents - Securities purchased under resale agreements 22 116,109 182,036
573,389 720,720
* Prepaid expenses which are non financial assets are excluded.
Investment in corporate debt securitiesThese represent investment in debentures, which yields interest income on a continuing basis. However the Company's exposure to credit risk, arising from these investments is insignificant, considering the net investment value.
Management Discussion and Analysis
Our Performance Financial InformationGovernance and Risk Management
Supplementary Information

Ceylon Investment PLC Annual Report 2016/17 76 77
Notes to the Financial StatementsIn Rupees Thousands
27 FINANCIAL INSTRUMENTS CONTD.
Investment in unit trusts
The Company has invested in following unit trusts;
Name of the fund Fund category Fund's investment instruments
The Sri Lanka Fund Equity fund Listed equity securities
Guardian Acuity Money Market Fund Money market fund Fixed income securities with in the maturity period less than 365 days
Guardian Acuity Equity Fund Equity fund Listed equity securities
Guardian Acuity Money Market Gilt Fund
Money market fund Government securities with in the maturity period less than 365 days
The investment manager of “The Sri Lanka Fund” is Guardian Fund Management Limited which is also the Investment manager of the Company. Guardian Acuity Asset Management Limited, a joint venture company of Ceylon Guardian Investment Trust PLC (the parent entity of the Company) and Acuity Partners Limited, is the Investment Manager of the other unit trust funds that the Company has invested in. The Company continuously monitors the performance, asset allocation, credit quality and maturity profiles of these funds in order to assess and mitigate the credit risk.
Trade and other receivables
A significant portion of the trade and other receivables comprise of proceeds receivable on disposal of quoted securities and dividends receivable.
Settlement procedures surrounding the listed equity market in Sri Lanka are highly structured and regulated. The “T+3” settlement cycle is in place with the involvement of a custodian bank, which is being duly monitored by the regulator, hence provides an assurance on the realisation of the balances. Further, a due evaluation process, including a continuous assessment mechanism is in place in selecting the market intermediaries that the Company transacts with, which involves prior approval from the Board of Directors.
Dividend receivable is accounted for when the right to receive the dividend is established. The balances are settled within a maximum period of 4-6 weeks and no risk of default based on past experience in the industry.

Age profile of trade and other receivablesThe aging of trade and other receivables at the end of the reporting period that were not impaired was as follows,
As at 31st March 2017 2016
Less than 30 days 22,539 9,836
22,539 9,836
The Company has neither recognised an impairment loss nor an allowance for impairment of its trade and other receivables over the past 5 years period.
Cash and cash equivalentsThe Company held cash and cash equivalents in the form of demand deposits with commercial banks, placements with banking institutions and securities purchased under resale agreements. Hence, the Company is exposed to risk of such counter-parties failing to meet their contractual obligations.
The Company minimises credit risk by monitoring the creditworthiness of the underlined counter-parties periodically.
A credit rating analysis of banking / financial institutional counter-parties with whom the balances were held at the end of reporting period is presented below.
As at 31st March 2017 2016
Credit rating
AAA 152 152
AA 116,109 182,036
AA- 81 155,464
Unrated 306 365
116,648 338,017
All government securities if available are classified as risk free and other ratings are obtained based on ratings published by Fitch Ratings Lanka Ltd.
Management Discussion and Analysis
Our Performance Financial InformationGovernance and Risk Management
Supplementary Information
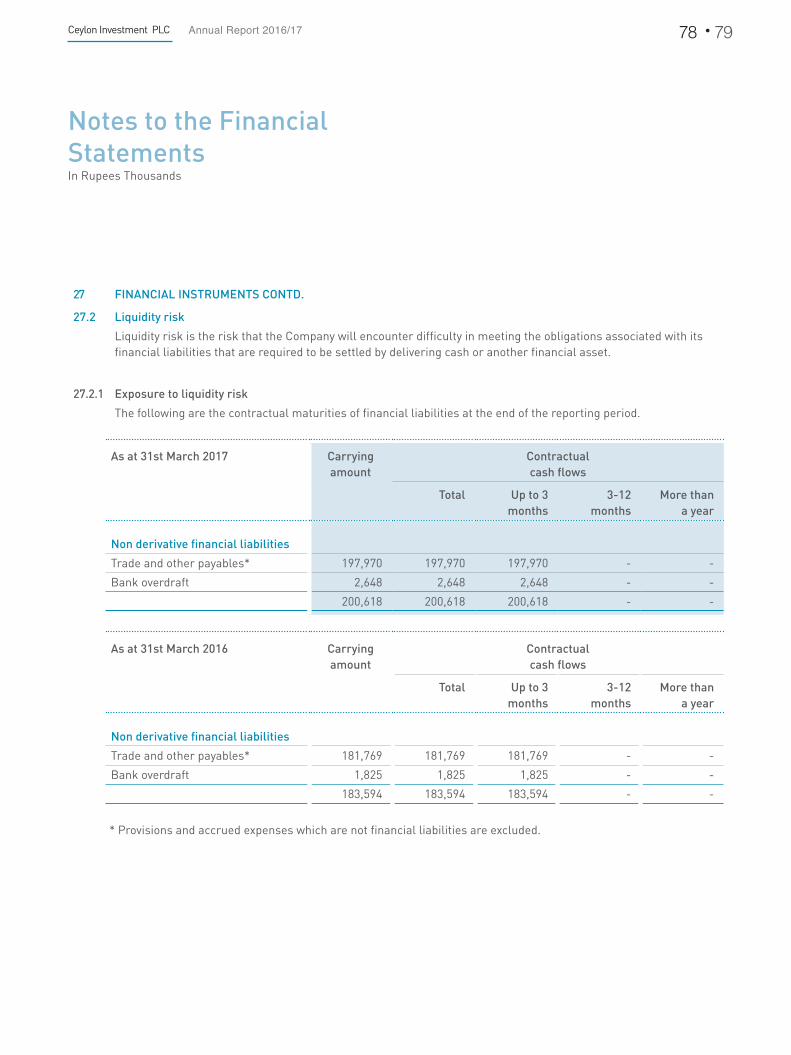
Ceylon Investment PLC Annual Report 2016/17 78 79
Notes to the Financial StatementsIn Rupees Thousands
27 FINANCIAL INSTRUMENTS CONTD.
27.2 Liquidity risk
Liquidity risk is the risk that the Company will encounter difficulty in meeting the obligations associated with its financial liabilities that are required to be settled by delivering cash or another financial asset.
27.2.1 Exposure to liquidity risk
The following are the contractual maturities of financial liabilities at the end of the reporting period.
As at 31st March 2017 Carrying amount
Contractual cash flows
Total Up to 3 months
3-12 months
More than a year
Non derivative financial liabilities
Trade and other payables* 197,970 197,970 197,970 - -
Bank overdraft 2,648 2,648 2,648 - -
200,618 200,618 200,618 - -
As at 31st March 2016 Carrying amount
Contractual cash flows
Total Up to 3 months
3-12 months
More than a year
Non derivative financial liabilities
Trade and other payables* 181,769 181,769 181,769 - -
Bank overdraft 1,825 1,825 1,825 - -
183,594 183,594 183,594 - -
* Provisions and accrued expenses which are not financial liabilities are excluded.

The ratio of liquid assets with a very short expected liquidation period to total net assets is set out below.
As at 31st March 2017 2016
Fair value through profit or loss financial assets - Investment in unit trusts 256,335 154,359
Cash and cash equivalents 116,648 338,017
Total liquid assets 372,983 492,376
Liquid assets as a % of total net assets 4.4% 5.4%
27.2.2 Management of liquidity risk
The Company’s approach to managing liquidity is to ensure, as far as possible, that it will always have sufficient liquidity to meet its liabilities when due, under both normal and stressed conditions, without incurring unacceptable losses or risking the Company’s reputation.
The Company maintains a portion of its assets in highly liquid form; demand deposits with commercial banks, placements with banking institutions, securities purchased under resale agreements and short term investments in money market funds, in order to capitalise the market opportunities and to meet its contractual obligations during the normal course of its operations.
A significant portion of the Company’s investment portfolio comprises of listed equity investments which provides the Company with exposure to adequate liquidity, given the ability to convert in to cash and cash equivalents within a very short period of time if required.
In addition, the Company has access to approved financing arrangements in the form of an interchangeable overdraft facility with Ceylon Guardian Investment Trust PLC, the parent company, an analysis of which is given below as at each of the reporting dates.
As at 31st March 2017 2016
Unutilised overdraft facilities 1,050,000 1,050,000
1,050,000 1,050,000
Management Discussion and Analysis
Our Performance Financial InformationGovernance and Risk Management
Supplementary Information

Ceylon Investment PLC Annual Report 2016/17 80 81
Notes to the Financial StatementsIn Rupees Thousands
27 FINANCIAL INSTRUMENTS CONTD.
27.3 Market risk
The market risk is the exposure to adverse movements in the security markets for both equity and fixed income investments, which can result variations in the anticipated returns from those securities. All financial institutions face market risks, created by changes in the macro environment related to political factors, national security, economic management and globalisation influences which have an impact on systematic risk factors such as interest rates, currency parity, inflation and availability of credit etc.
27.3.1 Interest rate riskThe Company is exposed to interest rate risk, arising from its securities purchased under resale agreements, placements with banking institutions and overdraft facilities, in the event such have been utilised.
Exposure and management of interest rate riskAt the end of the reporting period, the interest rate profile of the Company’s interest-bearing financial instruments are as follows.
Carrying Amount
As at 31st March 2017 2016
Financial assets
Placements with banking institutions - 155,381
Securities purchased under resale agreements 116,109 182,036
116,109 337,417
Financial liabilities
Bank overdraft 2,648 1,825
2,648 1,825
The average base interest rates applied for the above financial instruments are as follows;
As at 31st March 2017 2016
Commercial Banks Averaged Weighted Prime Lending Rate ( AWPLR) * 11.56% 8.87%
Commercial Banks Averaged Weighted Fixed Deposit Rate ( AWFDR) * 11.38% 7.92%
* Monthly average rate as at reporting date.

Sensitivity Analysis
A change of 100 basis points in interest rates at the end of the reporting period would have increased / (decreased) profit or loss by the amounts shown below.
Movement in interest rate Profit or loss
Increase by 1%
Decrease by 1%
As at 31st March 2017
- On interest earning assets 1,161 (1,161)
- On interest bearing liabilities (26) 26
1,135 (1,135)
As at 31 March 2016
- On interest earning assets 3,374 (3,374)
- On interest bearing liabilities (18) 18
3,356 (3,356)
Management Discussion and Analysis
Our Performance Financial InformationGovernance and Risk Management
Supplementary Information

Ceylon Investment PLC Annual Report 2016/17 82 83
Notes to the Financial StatementsIn Rupees Thousands
27 FINANCIAL INSTRUMENTS CONTD.
27.3.2 Exposure and management other market price risks
Equity price riskThe Company is holding an investment portfolio which includes listed equity securities.
Having 87% (2016 - 83%) of its discretionary portfolio as equity investments designated as listed investments in the Colombo Stock Exchange, market volatilities bring in substantial variations to the Company’s earnings and value of its asset base.
The Company monitors its investment portfolio based on market indices, where decisions concerned with the timing of buy / sell are well supported with structured in-house research recommendations. Transactions of a major magnitude within the portfolio are subject to review and approval by the Investment Committee.
The total asset base which is exposed to equity price risk is tabulated below.
Note Carrying Amount
As at 31st March 2017 2016
Available for sale financial assets - investment in equity securities 19.1/19.2 3,098,312 2,718,658
Available for sale financial assets - investment in unit trusts 19.3
- Guardian Acuity Equity Fund 20,411 19,138
- The Sri Lanka Fund 157,455 147,543
Fair value through profit or loss financial assets - investment in equity securities 21.1 712,372 639,092
3,988,550 3,524,431
An analysis of the investments in equity securities made by the Company, based on the industry / sector is given in notes 19.1 and 21.1.

27.3.3 Currency riskThe Company is exposed to currency risk on its investments made that are denominated in a currency other than the respective functional currency of the Company, which is Sri Lankan Rupees. Accordingly, the Company is exposed to currency risk primarily arising from its investment in ‘The Sri Lanka Fund’ – a country fund incorporated in Cayman Islands, to which the Company has infused promoters capital.
The net exposure to currency risk, as at the reporting date is as follows.
Currency Carrying Amount
As at 31st March 2017 2016
Investments in Unit Trusts - The Sri Lanka Fund LKR (000') 157,455 147,543
USD 1,037,978 1,019,718
Exchange rates applied as at the reporting dates - USD / LKR 151.69 144.69
Sensitivity Analysis
A strengthening / (weakening) of the USD against the Sri Lanka Rupee would have increased / (decreased) the investment as at the end of the periods by the amounts shown below. The analysis assumes that all other variables, in particular interest rates, remain constant and ignores any impact of further investments or withdrawals.
Equity
Movement in exchange rate Strengthening Weakening
As at 31 March 2017
- United State Dollars ( 1% movement) 1,575 (1,575)
1,575 (1,575)
As at 31st March 2016
- United State Dollars ( 1% movement) 1,475 (1,475)
1,475 (1,475)
No impact to profit or loss arises from a movement in foreign exchange rates, provided such movements are related to equity instruments classified under ‘Available for sale financial assets’ and are recognised in other comprehensive income, as required by the Sri Lanka Accounting Standard (LKAS - 39) “Financial Instruments; Recognition and measurement”.
Management Discussion and Analysis
Our Performance Financial InformationGovernance and Risk Management
Supplementary Information

Ceylon Investment PLC Annual Report 2016/17 84 85
Notes to the Financial StatementsIn Rupees Thousands
27 FINANCIAL INSTRUMENTS CONTD. 27.4 Accounting classification and fair values
The following table shows the carrying amounts and the fair values of financial assets and financial liabilities. It does not include fair value information for financial assets and financial liabilities not measured at fair value, if the carrying value is a reasonable approximation for fair value.
As at 31st March 2017 Fair value
through profit or
loss
Held to maturity
Loans and
receivables
Available for sale
financial assets
Other financial
liabilities
Total carrying amount
Fair value
Financial assets measured at fair value
Available for sale financial assets - - - 3,276,179 - 3,276,179 3,276,179
Fair value through profit or loss financial assets 968,707 - - - - 968,707 968,707
Financial assets not measured at fair value
Trade and other receivables - - 22,539 - - 22,539
Cash and cash equivalents - - 116,648 - - 116,648
Total financial assets 968,707 - 139,187 3,276,179 - 4,384,073 4,244,886
Financial liabilities not measured at fair value
Trade and other payables - - - - 197,970 197,970
Bank overdraft - - - - 2,648 2,648
Total financial liabilities - - - - 200,618 200,618 -
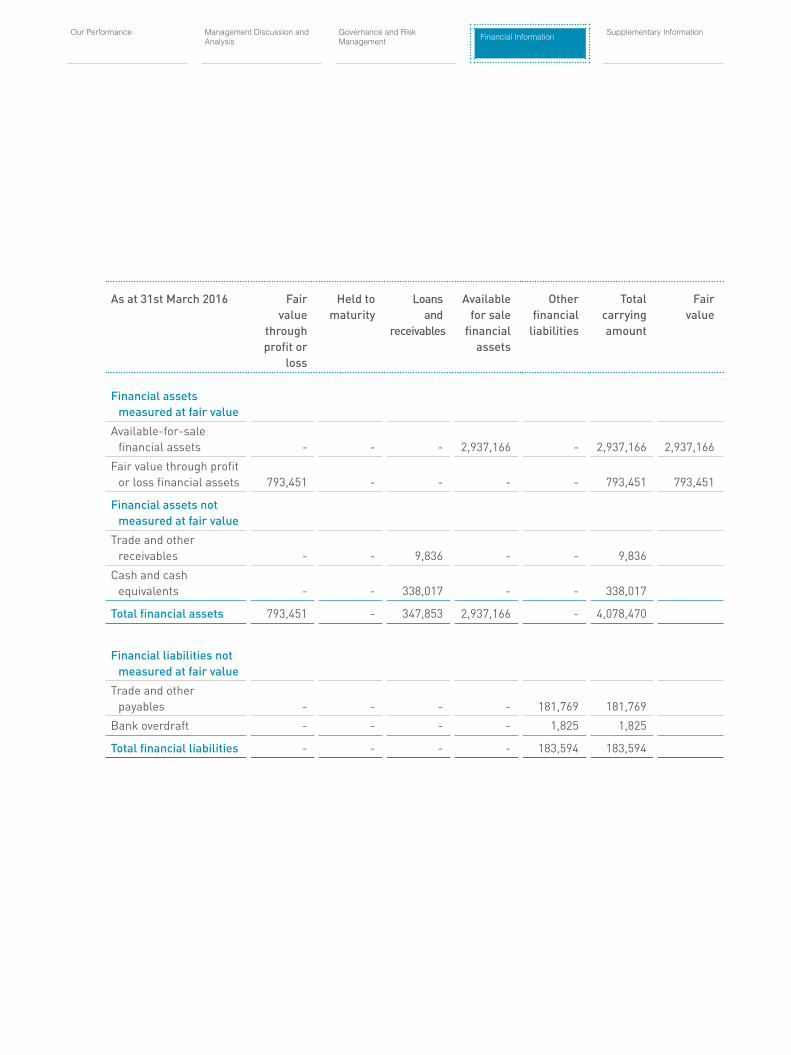
As at 31st March 2016 Fair value
through profit or
loss
Held to maturity
Loans and
receivables
Available for sale
financial assets
Other financial
liabilities
Total carrying amount
Fair value
Financial assets measured at fair value
Available-for-sale financial assets - - - 2,937,166 - 2,937,166 2,937,166
Fair value through profit or loss financial assets 793,451 - - - - 793,451 793,451
Financial assets not measured at fair value
Trade and other receivables - - 9,836 - - 9,836
Cash and cash equivalents - - 338,017 - - 338,017
Total financial assets 793,451 - 347,853 2,937,166 - 4,078,470
Financial liabilities not measured at fair value
Trade and other payables - - - - 181,769 181,769
Bank overdraft - - - - 1,825 1,825
Total financial liabilities - - - - 183,594 183,594
Management Discussion and Analysis
Our Performance Financial InformationGovernance and Risk Management
Supplementary Information

Ceylon Investment PLC Annual Report 2016/17 86 87
27 FINANCIAL INSTRUMENTS CONTD. 27.5 Fair value hierarchy
The table below analyses financial instruments carried at fair value, by the levels in the fair value hierarchy. The different levels have been defined as follows.
Level 1: Availability of quoted prices (unadjusted) in active markets for identical assets or liabilities.Level 2: Use of inputs other than quoted prices that are observable for the asset or liability, either directly (i.e. as
prices) or indirectly (i.e. derived from prices).
Level 3: Use of inputs for the asset or liability that are not based on observable market data (unobservable inputs).
Level 1 Level 2 Level 3 Total
As at 31 March 2017
Available for sale financial assets 3,276,168 - 11 3,276,179
Fair value through profit or loss financial assets 968,707 - - 968,707
4,244,875 - 11 4,244,886
As at 31 March 2016
Available for sale financial assets 2,937,155 - 11 2,937,166
Fair value through profit or loss financial assets 793,451 - - 793,451
3,730,606 - 11 3,730,617
During the year no movements have occurred in the fair value measurements in Level 3 financial instruments of the fair value hierarchy.

28 SEGMENTAL REPORTING The Company’s Chief Operating Decision Maker (CODM) monitors the operating results of the entity as a whole considering the operations as a single segment (Investments holding) for the purpose of making decisions about the resource allocation and performance. Therefore no disclosure is made on operating segments.
29 EVENTS AFTER THE REPORTING DATE
No circumstances have arisen since the reporting date, which would require adjustments to or disclosures in the financial statements.
30 COMMITMENTS AND CONTINGENT LIABILITIES 30.1 Capital expenditure commitments
There were no material capital commitments as at the reporting date.
30.2 Contingent liabilities There were no material contingent liabilities as at the reporting date.
31 COMPARATIVE FIGURES Previous year figures and phrases have been rearranged wherever necessary to conform to the current year's presentation.
32 RESPONSIBILITY FOR FINANCIAL STATEMENTS The Board of Directors is responsible for the preparation and presentation of the financial statements. This is more fully described under the relevant clause in the Directors’ report.
Management Discussion and Analysis
Our Performance Financial InformationGovernance and Risk Management
Supplementary Information

Ceylon Investment PLC Annual Report 2016/17 88 89
For the year ended / As at 31st March 2017 2016 2015 2014 2013
Financial highlights
RevenueNet gain on disposal of investments 108,783 196,870 585,055 323,900 282,639 Dividend income 284,674 176,425 183,292 252,761 134,591 Interest income 7,672 27,932 54,125 115,046 72,180
401,129 401,227 822,472 691,707 489,410 Less :Dividend received from associate company (103,191) (79,195) (83,235) (194,928) (43,433)
297,938 322,032 739,237 496,779 445,977 Net fair value adjustment - unrealised (97,997) (135,539) 11,440 303 52,667 Profit on investment activities 199,941 186,493 750,677 497,082 498,644
Profit before taxation 660,068 294,763 1,001,114 919,541 1,200,571 Income tax expense (7,254) (7,548) (14,252) (30,059) (18,603)Profit for the year 652,814 287,215 986,862 889,482 1,181,968
Dividend paid 174,039 247,691 246,287 418,688 123,144
Statement of Financial Position
Capital employedStated capital 763,497 763,497 673,530 673,530 673,530 Reserves 7,789,643 8,340,156 12,428,640 10,906,886 8,050,259 Total equity 8,553,140 9,103,653 13,102,170 11,580,416 8,723,789
Assets employedNon current assets 7,644,474 8,149,102 12,133,158 10,414,267 7,234,368 Current assets 1,111,403 1,141,606 1,243,829 1,461,023 1,515,020 Total assets 8,755,877 9,290,708 13,376,987 11,875,290 8,749,388 Current liabilities (202,737) (187,055) (274,817) (294,874) (25,599)Net assets 8,553,140 9,103,653 13,102,170 11,580,416 8,723,789
Cash Flow StatementsNet cash generated from / (used in) operating activities (179,000) (52,634) (87,556) (178,891) 449,453 Net cash generated from investing activities 103,191 79,195 83,235 194,928 43,433 Net cash used in financing activities (146,383) (242,840) (249,705) (171,515) (122,305)Net (decrease) / increase in cash & cash equivalents (222,192) (216,279) (254,026) (155,478) 370,581
Five Year SummaryIn Rupees Thousands

For the year ended / As at 31st March 2017 2016 2015 2014 2013
Ratios & statistics
Operational ratio Return on ordinary shareholders funds (%) 7.63 3.15 7.53 7.68 13.55
Liquidity ratioCurrent ratio (times) 5.48 6.10 4.53 4.95 59.18
Investor ratio Earnings per share (Rs.) 6.56 2.89 9.92 9.03 12.00 Dividend per share final/ Interim (Rs.)* 1.75 1.50 3.50 2.50 1.75 Dividend cover (times) 3.75 1.93 2.83 3.61 6.84 Dividend growth (%) 17 (57) 40 43 40 Dividend yield (%) 4.38 2.85 3.85 3.36 2.19 Dividend payout ratio (%) 26.68 51.90 35.28 27.69 14.62 Net assets value per share (Rs.) 86.00 91.54 133.00 117.55 130.74 Market value per share (Rs.)** 40.00 52.70 91.00 74.50 80.00 Price earning ratio (times) 6.10 18.24 9.17 8.25 6.67 Price to book value ratio (times) 0.47 0.58 0.68 0.63 0.61
Fair value of investments portfolio 8,727,181 9,278,745 13,351,117 11,865,566 12,855,629 Market capitalisation 3,978,042 5,241,071 8,964,854 7,339,358 7,881,190 All Share Price Index (points) 6,062 6,072 6,820 5,968 5,736 S&P SL 20 Index (points) 3,439 3,204 3,852 3,280 3,294
* Based on final / interim dividends **As at 31st March.
Management Discussion and Analysis
Our Performance Financial InformationGovernance and Risk Management
Supplementary Information

Ceylon Investment PLC Annual Report 2016/17 90 91
Information to Shareholders and Investors
1. Stock Exchange Listing
Ceylon Investment PLC is a Public Quoted Company, the Ordinary Shares of which are listed on the main board of the Colombo Stock Exchange.
Stock Exchange code for Ceylon Investment PLC shares is “CINV”.
2 Share Valuation
The market price of the Company’s shares as at 31st March 2017 was Rs.40/- per share (2016 – Rs.52/70/-).
3. Ordinary Shareholders
As at 31st March 2017 2016
Number of Shareholders 2,641 2,625
The number of ordinary shares held by non-residents as at 31st March, 2017 was 4,654,012 which amounts to 4.67% (2016 – 4,637,767/ 4.66%), of the total number of ordinary shares in issue.
Frequency Distribution of shareholdings as at 31st March 2017
Residents Non - Residents Total
Distribution of Shares
No. of share-
holders
No. of Shares
% No. of share-
holders
No. of Shares
% No. of share-
holders
No. of Shares
%
1 - 1,000 1,466 341,184 0.34 5 572 0 1,471 341,756 0.34
1001 - 10,000 813 2,606,927 2.62 25 109,873 0.11 838 2,716,800 2.73
10,001 - 100,000 237 7,236,536 7.27 30 816,616 0.82 267 8,053,152 8.10
100,001 - 1,000,000 52 15,339,809 15.42 6 1,495,874 1.5 58 16,835,683 16.93
Above 1,000,000 5 69,272,591 69.65 2 2,231,077 2.24 7 71,503,668 71.90
Total 2,573 94,797,047 95.32 68 4,654,012 4.68 2,641 99,451,059 100.00
Categories of ShareholdersAs at 31st March 2017
No. of Shareholders
No. of Shares
%
Individuals 2,404 21,486,119 21.60
Institutions 237 77,964,940 78.40
Total 2,641 99,451,059 100.00

Public Shareholding
Percentage of ordinary shares held by the public as at 31st March 2017 was 35.63% and the number of public shareholders were 2,628 (2016 – 35.19%).
4. Market performance - Ordinary shares
For the year ended 31st March 2017 2016
Share price as at 31 March (Rs.) 40.00 52.70
Highest (Rs.) 69.90 99.00
Lowest (Rs.) 39.10 44.00
Value of the shares traded (Rs.000) 89,503 157,616
No. of shares traded 1,686,633 1,937,082
Volume of transactions (Nos.) 2,847 2,752
5 Market capitalisation
Market capitalisation of the Company, which is the number of ordinary shares in issue multiplied by the market value of an ordinary share was Rs 3,978,042,360/- as at 31st March 2017 (as at 31st March 2016 – Rs. 5,241,070,809/-).
Management Discussion and Analysis
Our Performance Governance and Risk Management Supplementary InformationFinancial Information

Ceylon Investment PLC Annual Report 2016/17 92 93
6 Record of Bonus Issues, Rights Issues, Repurchase and Subdivision of shares
The undermentioned share issues/repurchase have been made by the Company to date, in relation to its ordinary shares.
Year ended 31st March
Month Issue Basis No. of shares Cumulative No. of shares
1919 Initial Capital - 547,343 547,343 1954 Bonus 1:10 54,734 602,077 1956 Bonus 1:10 60,208 662,285 1988 Bonus 1:1 662,285 1,324,570 1991 Bonus 1:5 264,914 1,589,484 1999 Bonus 1:4 397,371 1,986,855 2000 Bonus 1:4 496,714 2,483,569 2002 April Rights 1:4 620,892 3,104,461
May Bonus 1:4 776,115 3,880,576 2003 June Rights 1:3 1,293,525 5,174,101
August Bonus 1:6 862,350 6,036,451 2004 July Rights 1:2 3,018,225 9,054,676
September Bonus 1:2 4,527,338 13,582,014 2005 March Rights 1:3 4,527,338 18,109,352
June Bonus 1:3 6,036,451 24,145,803 2009 October Repurchase 1:5 (4,829,161) 19,316,642 2010 October Subdivision 5:1 77,266,568 96,583,210
October Capitalisation of reserves
1:50 1,931,664 98,514,874
2015 August Scrip Dividend 1:105.083934 936,185 99,451,059
7 Dividends
For the financial year ended 31st March 2017, a First Interim Dividend of Rs.1/75 per Ordinary Share amounting to Rs. 174,039,353/25 was declared and paid on 6th April 2017.
8 Major shareholders
A list of major shareholders of the Company as at the balance sheet date is provided in the Annual Report of the Board of Directors, on page 28.
Information to Shareholders and Investors
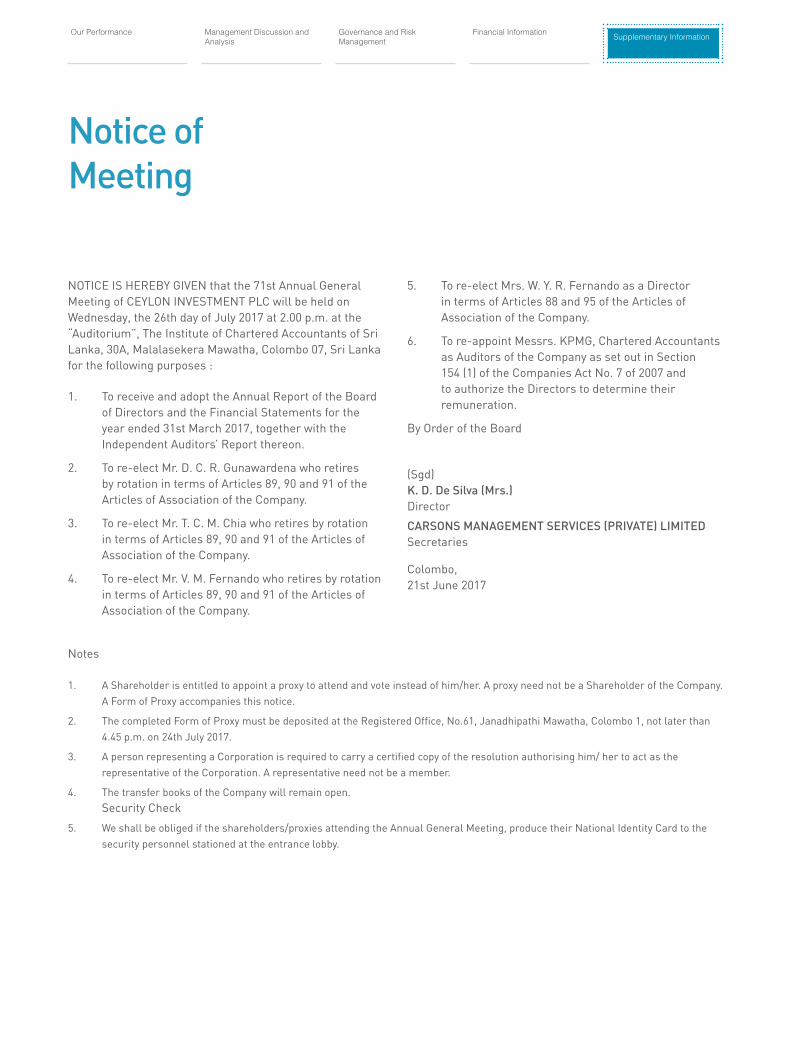
Notice of Meeting
NOTICE IS HEREBY GIVEN that the 71st Annual General Meeting of CEYLON INVESTMENT PLC will be held on Wednesday, the 26th day of July 2017 at 2.00 p.m. at the “Auditorium”, The Institute of Chartered Accountants of Sri Lanka, 30A, Malalasekera Mawatha, Colombo 07, Sri Lanka for the following purposes :
1. To receive and adopt the Annual Report of the Board of Directors and the Financial Statements for the year ended 31st March 2017, together with the Independent Auditors’ Report thereon.
2. To re-elect Mr. D. C. R. Gunawardena who retires by rotation in terms of Articles 89, 90 and 91 of the Articles of Association of the Company.
3. To re-elect Mr. T. C. M. Chia who retires by rotation in terms of Articles 89, 90 and 91 of the Articles of Association of the Company.
4. To re-elect Mr. V. M. Fernando who retires by rotation in terms of Articles 89, 90 and 91 of the Articles of Association of the Company.
5. To re-elect Mrs. W. Y. R. Fernando as a Director in terms of Articles 88 and 95 of the Articles of Association of the Company.
6. To re-appoint Messrs. KPMG, Chartered Accountants as Auditors of the Company as set out in Section 154 (1) of the Companies Act No. 7 of 2007 and to authorize the Directors to determine their remuneration.
By Order of the Board
(Sgd)K. D. De Silva (Mrs.)Director
CARSONS MANAGEMENT SERVICES (PRIVATE) LIMITEDSecretaries
Colombo, 21st June 2017
Notes
1. A Shareholder is entitled to appoint a proxy to attend and vote instead of him/her. A proxy need not be a Shareholder of the Company. A Form of Proxy accompanies this notice.
2. The completed Form of Proxy must be deposited at the Registered Office, No.61, Janadhipathi Mawatha, Colombo 1, not later than 4.45 p.m. on 24th July 2017.
3. A person representing a Corporation is required to carry a certified copy of the resolution authorising him/ her to act as the representative of the Corporation. A representative need not be a member.
4. The transfer books of the Company will remain open. Security Check
5. We shall be obliged if the shareholders/proxies attending the Annual General Meeting, produce their National Identity Card to the security personnel stationed at the entrance lobby.
Management Discussion and Analysis
Our Performance Governance and Risk Management Supplementary InformationFinancial Information

Ceylon Investment PLC Annual Report 2016/17 94 95
Notes
...........................................................................................................................................................................................................
...........................................................................................................................................................................................................
...........................................................................................................................................................................................................
...........................................................................................................................................................................................................
...........................................................................................................................................................................................................
...........................................................................................................................................................................................................
...........................................................................................................................................................................................................
...........................................................................................................................................................................................................
...........................................................................................................................................................................................................
...........................................................................................................................................................................................................
...........................................................................................................................................................................................................
...........................................................................................................................................................................................................
...........................................................................................................................................................................................................
...........................................................................................................................................................................................................
...........................................................................................................................................................................................................
...........................................................................................................................................................................................................
...........................................................................................................................................................................................................
...........................................................................................................................................................................................................
...........................................................................................................................................................................................................
...........................................................................................................................................................................................................
...........................................................................................................................................................................................................
...........................................................................................................................................................................................................
...........................................................................................................................................................................................................
...........................................................................................................................................................................................................
...........................................................................................................................................................................................................
...........................................................................................................................................................................................................
...........................................................................................................................................................................................................
...........................................................................................................................................................................................................
...........................................................................................................................................................................................................
...........................................................................................................................................................................................................
...........................................................................................................................................................................................................

Form of Proxy
*I/ We.................................................................................................................................................................................................
of.......................................................................................................................................................................................................
being *a Shareholder/Shareholders of Ceylon Investment PLC
hereby appoint..................................................................................................................................................................................
of........................................................................................................................................................................................................
bearing NIC No./ Passport No........................................................................................................................ or failing him/her
Mirihana Arachchige Rose Chandralatha Cooray or failing her,Don Chandima Rajakaruna Gunawardena or failing him,Ajith Prashantha Weeratunge or failing him,Vernon Manilal Fernando or failing him,Krishna Selvanathan or failing him,Timothy Chee Ming Chia or failing him, Wedage Yasanthi Ruvini Fernando
as *my/our proxy to attend at the 71st Annual General Meeting of the Company to be held on Wednesday, the 26th day of July 2017 at 2.00 p.m. at the “Auditorium”, The Institute of Chartered Accountants of Sri Lanka, 30A, Malalasekera Mawatha, Colombo 07, Sri Lanka and at any adjournment thereof and at every poll which may be taken in consequence thereof. For Against
(1) To adopt the Annual Report of the Board of Directors and the Financial Statements for the year ended 31st March 2017, together with the Independent Auditors’ Report thereon.
(2) To re-elect Mr. D. C. R. Gunawardena who retires by rotation in terms of Articles 89, 90 and 91 of the Articles of Association of the Company.
(3) To re-elect Mr. T. C. M. Chia who retires by rotation in terms of Articles 89, 90 and 91 of the Articles of Association of the Company.
(4) To re-elect Mr. V. M. Fernando who retires by rotation in terms of Articles 89, 90 and 91 of the Articles of Association of the Company.
(5) To re-elect Mrs. W. Y. R. Fernando as a Director in terms of Articles 88 and 95 of the Articles of Association of the Company.
(6) To re-appoint Messrs. KPMG, Chartered Accountants as Auditors of the Company as set out in Section 154 (1) of the Companies Act. No. 07 of 2007 and to authorize the Directors to determine their remuneration.
Signed this……………………day of …………………… Two Thousand and Seventeen.
…………………………………. Signature /sNote: (a) * Please delete the inappropriate words.(b) A shareholder entitled to attend and vote at a General meeting of the Company, is entitled to appoint a proxy to attend
and vote instead of him/her and the proxy need not be a shareholder of the Company. A proxy so appointed shall have the right to vote on a show of hands or on a poll and to speak at the general meeting of the shareholders.
(c) A shareholder is not entitled to appoint more than one proxy to attend on the same occasion.(d) Instructions are noted on the reverse hereof.
Ceylon Investment PLC Annual Report 2016/17 96
INSTRUCTIONS AS TO COMPLETION
1. Kindly perfect the form of proxy after filling in legibly your full name and address, and sign in the space provided. Please fill in the date of signature.
2. If you wish to appoint a person other than the Directors as your proxy, please insert the relevant details in the space provided overleaf.
3. In terms of Article 71 of the Articles of the Association of the Company:
The instrument appointing a proxy shall be in writing and :
(i) in the case of an individual shall be signed by the appointor or by his attorney; and
(ii) in the case of a corporation shall be either under its common seal or signed by its attorney or by an officer on behalf of the corporation.
The Company may, but shall not be bound to, require evidence of the authority of any such attorney or officer. A proxy need not be a member of the Company.
4. In terms of Article 66 of the Articles of Association of the Company:
In the case of joint-holders of a share, the senior who tenders a vote, whether in person or by proxy or by attorney or by representative, shall be accepted to the exclusion of the votes of the other joint-holders and for this purpose seniority shall be determined by the order in which the names stands in the Register of Members in respect of the joint holding.
5. To be valid the completed form of proxy should be deposited at the Registered Office of the Company situated at No. 61, Janadhipathi Mawatha, Colombo 1 not later than 4.45 p.m. on 24th July 2017.
Please fill in the following details
Name :……………………………………………………………………….............................................................………………….
Address :……………………………………………………………………….............................................................………………….
.……………………………………………………………………….............................................................………………….
Jointly with :……………………………………………………………………….............................................................………………….
Share folio no. :……………………………………………………………………….............................................................………………….

Corporate Information
NAME OF COMPANYCeylon Investment PLC (A Carson Cumberbatch Company)
COMPANY REGISTRATION NO.PQ 68
DOMICILE AND LEGAL FORMCeylon Investment PLC, is a Public Quoted Company with limited liability domiciled in Sri Lanka.The Company was incorporated in Sri Lanka in 1919.
PRINCIPAL ACTIVITY AND NATURE OF OPERATIONSDuring the year, the principal activity of the Company was holding and managing of an investment portfolio.
PARENT ENTERPRISE Ceylon Guardian Investment Trust PLC is the immediate Parent Company of Ceylon Investment PLC. In the opinion of the Directors Carson Cumberbatch PLC is the Parent Company of Ceylon Guardian Investment Trust PLC and Bukit Darah PLC is the Ultimate Parent and Controlling Entity of Ceylon Guardian Investment Trust PLC.
DIRECTORSMrs. M.A.R.C. Cooray (Chairperson)Mr. D.C.R. GunawardenaMr. A.P. WeeratungeMr. V.M. FernandoMr. K. Selvanathan Mr. T.C.M. Chia Mrs. W.Y.R. Fernando Mr. I. Paulraj (Resigned w.e.f. 15th August 2016)
BANKERSStandard Chartered Bank HSBCCommercial Bank of Ceylon PLCDeutsche Bank AG
AUDITORSMessrs. KPMG Chartered Accountants,No. 32A, Sir Mohamed Macan Markar Mawatha, Colombo 3,Sri Lanka.
MANAGERS & SECRETARIESCarsons Management Services (Private) LimitedNo. 61, Janadhipathi Mawatha,Colombo 1.Sri LankaTelephone No.: +94-11-2039200 Fax No.: +94-11-2039300
INVESTMENT MANAGERSGuardian Fund Management LimitedNo. 61, Janadhipathi Mawatha,Colombo 1,Sri Lanka.Telephone No.: +94-11-2039200Fax No: +94-11-2039385
REGISTERED OFFICE AND PRINCIPAL PLACE OF BUSINESSNo. 61, Janadhipathi Mawatha, Colombo 1,Sri LankaTelephone No.: +94-11-2039200 Fax No.: +94-11-2039300
CORPORATE WEBSITEwww.carsoncumberbatch.com
Designed & produced by
Printed by Printage (Pvt) Ltd

www.carsoncumberbatch.com
Ceylon Investment PLC Annual R
eport 2016/17
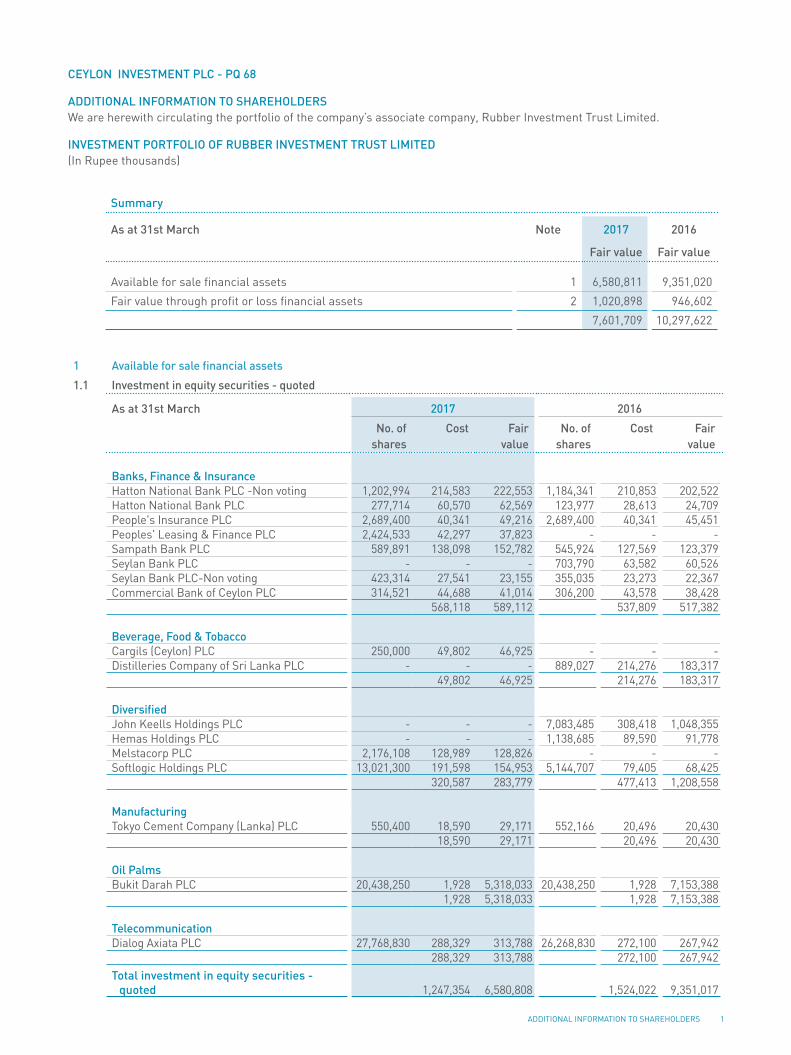
ADDITIONAL INFORMATION TO SHAREHOLDERS 1
CEYLON INVESTMENT PLC - PQ 68
ADDITIONAL INFORMATION TO SHAREHOLDERSWe are herewith circulating the portfolio of the company’s associate company, Rubber Investment Trust Limited.
INVESTMENT PORTFOLIO OF RUBBER INVESTMENT TRUST LIMITED(In Rupee thousands)
Summary
As at 31st March Note 2017 2016
Fair value Fair value
Available for sale financial assets 1 6,580,811 9,351,020
Fair value through profit or loss financial assets 2 1,020,898 946,602
7,601,709 10,297,622
1 Available for sale financial assets
1.1 Investment in equity securities - quoted
As at 31st March 2017 2016
No. of shares
Cost Fair value
No. of shares
Cost Fair value
Banks, Finance & InsuranceHatton National Bank PLC -Non voting 1,202,994 214,583 222,553 1,184,341 210,853 202,522 Hatton National Bank PLC 277,714 60,570 62,569 123,977 28,613 24,709 People's Insurance PLC 2,689,400 40,341 49,216 2,689,400 40,341 45,451 Peoples' Leasing & Finance PLC 2,424,533 42,297 37,823 - - - Sampath Bank PLC 589,891 138,098 152,782 545,924 127,569 123,379 Seylan Bank PLC - - - 703,790 63,582 60,526 Seylan Bank PLC-Non voting 423,314 27,541 23,155 355,035 23,273 22,367 Commercial Bank of Ceylon PLC 314,521 44,688 41,014 306,200 43,578 38,428
568,118 589,112 537,809 517,382
Beverage, Food & TobaccoCargils (Ceylon) PLC 250,000 49,802 46,925 - - - Distilleries Company of Sri Lanka PLC - - - 889,027 214,276 183,317
49,802 46,925 214,276 183,317
DiversifiedJohn Keells Holdings PLC - - - 7,083,485 308,418 1,048,355 Hemas Holdings PLC - - - 1,138,685 89,590 91,778 Melstacorp PLC 2,176,108 128,989 128,826 - - - Softlogic Holdings PLC 13,021,300 191,598 154,953 5,144,707 79,405 68,425
320,587 283,779 477,413 1,208,558
ManufacturingTokyo Cement Company (Lanka) PLC 550,400 18,590 29,171 552,166 20,496 20,430
18,590 29,171 20,496 20,430
Oil PalmsBukit Darah PLC 20,438,250 1,928 5,318,033 20,438,250 1,928 7,153,388
1,928 5,318,033 1,928 7,153,388
TelecommunicationDialog Axiata PLC 27,768,830 288,329 313,788 26,268,830 272,100 267,942
288,329 313,788 272,100 267,942 Total investment in equity securities -
quoted 1,247,354 6,580,808 1,524,022 9,351,017
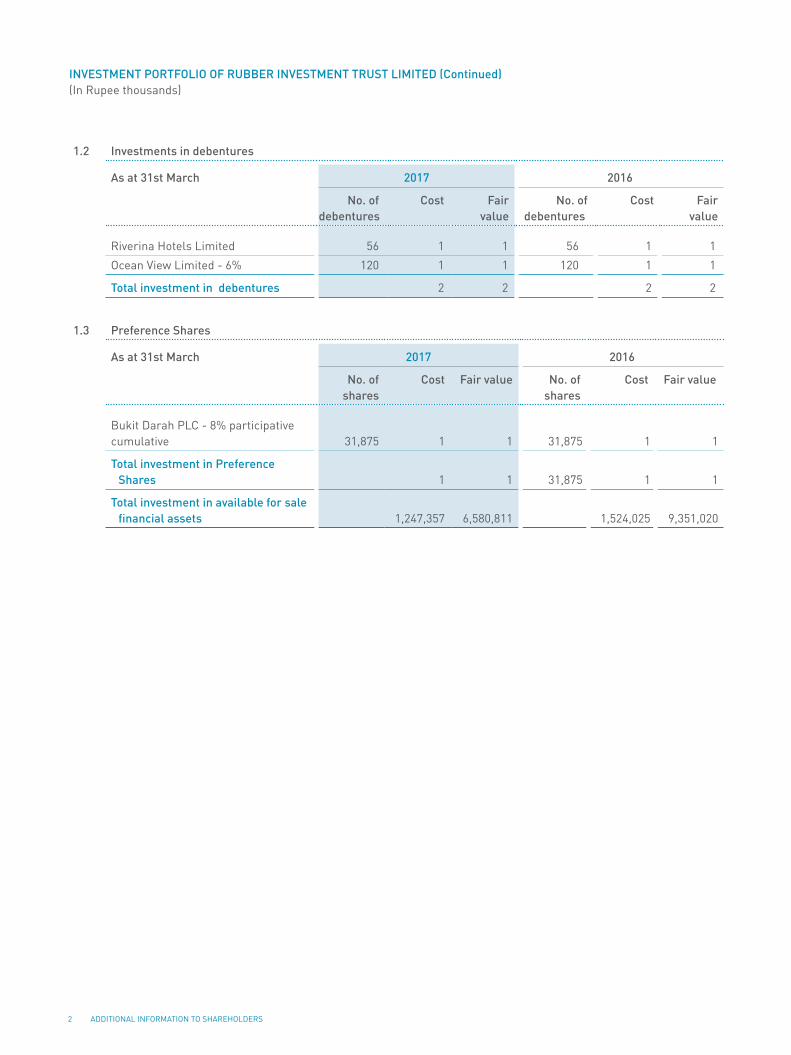
2 ADDITIONAL INFORMATION TO SHAREHOLDERS
1.2 Investments in debentures
As at 31st March 2017 2016
No. of debentures
Cost Fair value
No. of debentures
Cost Fair value
Riverina Hotels Limited 56 1 1 56 1 1
Ocean View Limited - 6% 120 1 1 120 1 1
Total investment in debentures 2 2 2 2
1.3 Preference Shares
As at 31st March 2017 2016
No. of shares
Cost Fair value No. of shares
Cost Fair value
Bukit Darah PLC - 8% participative cumulative 31,875 1 1 31,875 1 1
Total investment in Preference Shares 1 1 31,875 1 1
Total investment in available for sale financial assets 1,247,357 6,580,811 1,524,025 9,351,020
INVESTMENT PORTFOLIO OF RUBBER INVESTMENT TRUST LIMITED (Continued)(In Rupee thousands)

ADDITIONAL INFORMATION TO SHAREHOLDERS 3
2 Fair value through profit or loss financial assets
2.1 Investment in equity securities-quoted
As at 31st March 2017 2016
No. of shares
Fair value No. of shares
Fair value
Banks, Finance & InsuranceDFCC Bank PLC 139,699 15,926 139,699 19,139 Hatton National Bank PLC 293,569 66,141 289,620 57,721 National Development Bank PLC 337,189 47,072 - - Peoples' Leasing & Finance PLC 137,500 2,145 - - Seylan Bank PLC 73,790 6,420 370,000 31,820 Seylan Bank PLC - Non voting 198,755 10,872 198,755 12,522 Sinhaputhra Finance PLC - - 100,000 1,670 Union Bank of Colombo PLC 443,345 6,295 1,832,145 30,414
154,871 153,286
Beverage, Food & TobaccoDistilleries Company of Sri Lanka PLC - - 201,278 41,504
- 41,504
Construction & Engineering Access Engineering PLC 1,700,000 40,460 1,700,000 35,360 MTD Walkers PLC 238,013 8,330 428,242 14,260
48,790 49,620
DiversifiedAitken Spence PLC 370,218 20,806 370,218 27,211 Expolanka Holdings PLC 4,373,348 26,240 - - Hemas Holdings PLC - - 604,986 48,762
Hayleys PLC - - 12,457 3,061 Melstacorp PLC 125,112 7,407 - - Softlogic Holdings PLC 2,835,888 33,747 2,656,410 35,330
88,200 114,364
Hotels & TravelsAitken Spence Hotel Holdings PLC 792,093 27,882 792,093 41,981 Serendib Hotels PLC - - 270,067 7,427
27,882 49,408
Land & PropertyOverseas Reality (Ceylon) PLC - - 400,000 9,360
- 9,360
INVESTMENT PORTFOLIO OF RUBBER INVESTMENT TRUST LIMITED (Continued)(In Rupee thousands)

4 ADDITIONAL INFORMATION TO SHAREHOLDERS
As at 31st March 2017 2016
No. of shares
Fair value No. of shares
Fair value
ManufacturingKelani Tyres PLC 267,316 14,702 267,316 17,108 Lanka Tiles PLC - - - - Chevron Lubricants Lanka PLC 354,746 60,307 75,381 22,991 Swisstek (Ceylon) PLC 240,000 15,744 - - Tokyo Cement Company (Lanka) PLC 374,674 22,855 - -
113,608 40,099
TelecommunicationsDialog Axiata PLC 4,400,000 49,720 3,400,000 34,680
49,720 34,680
Total investment in equity securities - quoted 483,071 492,321
2.2 Investments in unit trusts - unquoted
As at 31st March 2017 2016
No of units Fair value No of units Fair value
Guardian Acuity Money Market Fund 21,308,180 300,371 26,205,435 332,809
Guardian Acuity Money Market GILT Fund 2,037,642 237,456 1,140,906 121,472
Total investment in unit trusts - unquoted 537,827 454,281
Total investment in equity securities - quoted 1,020,898 946,602
INVESTMENT PORTFOLIO OF RUBBER INVESTMENT TRUST LIMITED (Continued)(In Rupee thousands)