value of output of agriculture and allied · pdf filestatewise estimates of value of output...
TRANSCRIPT

STATEWISE ESTIMATES OF VALUE OF OUTPUT
FROM AGRICULTURE AND ALLIED ACTIVITIES
WITH NEW BASE-YEAR 1999-2000
(1999-2000 to 2005-06)
2008
CENTRAL STATISTICAL ORGANISATION
MINISTRY OF STATISTICS AND PROGRAMME IMPLEMENTATION
GOVERNMENT OF INDIA

CONTENTS
Page No
PREFACE ivMETHODOLOGY viSTATEMENTS (1-176)State-wise Value of Agricultural Crops
1. paddy 1
2. wheat 3
3. jowar 5
4. bajra 7
5. barley 9
6. maize 11
7. ragi 13
8. small millets & other cereal 15
1- 8 total cereals 179. gram 19
10. arhar 21
11. urd 23
12. moong 25
13. masoor 27
14. horsegram 29
15. other pulses 31
9-15 total pulses 3316. linseed 35
17. sesamum 37
18. groundnut 39
19. rapeseed 41
20. castor 43
21. coconut 45
22. nigerseed 47
23. safflower 49
24. sunflower 51
25. soyabean 53

26. other oilseeds 55
16- 26 total oilseeds 57
27. sugarcane & gur 59
28. other sugar 61
27- 28 total sugar 63
29. kapas 65
30. jute 67
31. sanhemp 69
32. mesta 71
33. other fibers 73
29- 33 total fibers 75
34. indigo, dyes & tanning materials 77
35. tea 79
36. coffee 81
37. tobacco 83
38. other drugs & narcotics 85
35- 38 total drugs & narcotics 87
39. cardamom 89
40. dry chillies 91
41. black pepper 93
42. dry ginger 95
43. turmeric 97
44. arecanut 99
45. garlic 101
46. coriander 103
47. other condiments & spices 105
39- 47 total condiments & spices 107
48. banana 109
49. cashewnut 111
50. potato 113
51. sweet potato 115
52. tapioca 117
53. onion 119

54. other horticulture crops 121
55. floriculture 123
48- 55 total fruits & vegetables 125
56. rubber 127
57. guarseed 129
58. miscellaneous crops 131
56- 58 total other crops 133
59. straw and stalks 135
60. other by products 137
59- 60 total by- products 139
61. kitchen garden 141
1- 61 all agricultural crops 143
State-wise Value of Livestock products
62. milk 145
63. eggs 147
64. wool 149
65. dung 151
66. silk worm cocoons & honey 153
67. increment in stock 155
68. meat 157
62- 68 total livestock products 159
State-wise Value of Forestry
69. industrial wood 161
70. fuel wood 163
71. minor forest products 165
69-71 total forest products 167
State-wise Value of Fisheries
72. inland fish 169
73. marine fish 171
72-73 total fish 173
1- 73 total value of output from agriculture and allied
activities
175

PREFACE
The agriculture and allied activities (livestock, forestry and fisheries) play a vital role in the Indian economy. Important developments in this sector have taken place over the years particularly after the green revolution, white revolution and blue revolution. The contribution of this sector to the gross domestic product (GDP) is estimated in terms of gross value added (GVA) using the production approach. The estimation of GVA involves valuation of the products and by-products and ancillary activities at the prices received by the producers and deducting there from the value of inputs of raw materials and services consumed in the process of production at purchasers' prices. In this context, information on state-wise value of output assumes considerable importance. With this in view, a brochure containing state-wise value of output of agriculture and allied activities is published by CSO at regular intervals. The present publication is fifth in the series including the state-wise estimates of value of output of Agricultural crops, Livestock products, Forestry and Fisheries with base year as 1999-2000. Forestry and Fisheries have been included in the brochure for the first time.
The earlier publications containing the state -wise estimates of value of output from Agriculture and Allied Activities are as follows: 1. State -wise estimates of value of output from Agriculture and Allied Activities from 1960-61 to 1980 -81 both at current and constant prices with base year 1970-71 published in 1985. 2. State -wise estimates of value of output from Agriculture and Allied Activities from 1980-81 to 1990 -91 both at current and constant prices with base year 1980-81 published in 1996. 3. State -wise estimates of value of output from Agriculture and Allied Activities from 1990-91 to 2001 -02 both at current and constant prices with base year 1993-94 published in 2004. 4. State -wise estimates of value of output from Agriculture and Allied Activities from 1990-91 to 2002 -03 both at current and constant prices with base year 1993-94 published in 2006. Suggestions and recommendation of the users shall be highly appreciated.

List of officers associated with the preparation of the brochure Additional Director General Shri Ramesh Kolli Tel: 91-11-23362966 email: [email protected] Deputy Director General Shri G.M. Boopathy Tel: 91-11-23345096 email: [email protected] Joint Director Ms P.Bhanumati Senior Statistical Officers: Shri Pramod Kumar
Shri M. A. Khan Shri T.A.Khan
Senior Investigator: Smt. Biju Cyriac Assistant Director: Shri Sanjay Kumar Tel: 91-11-23744620 Extn. 4153, 4132 email: [email protected]

Methodology
(A) Valuation of Output of Agricultural Crops The sources of data used in the preparation of the value of output are as under:
(i) The estimates of area and outturn of 42 crops (25 major crops and 17 minor crops) covered in crop groups: (1) Cereals, (2) Pulses, (3) Oil seeds, (4) Sugar, (5) Fibers (6) Drugs and Narcotics, (7) Condiments and Spices (8) Fruits and Vegetables (9) Other crops (10) By-products and (11) Kitchen Garden, at State level are regularly obtained from the DESAg. The estimates of area and outturn of Fruits and Vegetables, not covered by DESAg are obtained from National Horticulture Board (NHB). The estimates of area and outturn of plantation crops viz., Tea, Coffee, Rubber, Arecanut, Cashewnut and Cocoa are obtained from their respective commodity boards and area and outturn of opium is obtained from Central Bureau of Narcotics. However, in the case of sugarcane, outturn excluding the quantity converted into gur by the cane growers is taken and gur is evaluated separately.
(ii) In the case of tea, the estimates of output available from Tea Board relate to production of processed tea instead of raw tea leaves. Since processing is the activity outside the scope of agriculture, the output of raw tea leaves alone is to be taken into account in the agriculture sector and this is taken to be equal to the input of raw tea leaf in the tea processing industry. The production of tea leaves is estimated as 4.44 times of the processed tea. This norm of 4.44 has been estimated by the Tea Board on the basis of Techno-Economic Surveys. These norms are consistent with the recent study conducted by the DES, Assam.
(iii) The crops which do not have significant contribution in each of the groups are clubbed under ‘other….’ of each category. The data on area under such crops is available from Land Use Statistics. Such information is obtained through state DESs and DESAg.
(iv) Toddy: Toddy, a beverage, has now been included. NSSO Publication entitled “Consumption of some important commodities in India 1999-2000” (National Sample Survey, 55th round), provides monthly per capita quantity and value of consumption for non-food items for each state and UT (with rural and urban break up) and Toddy (in litre) is one of the items (item No.331). The value of Toddy production is estimated by multiplying the value of Toddy consumption in rural and urban area in a State by respective rural and urban population.

(v) Betel Leaf: In Assam, the arecanut consumption to betel leaves is 1:4; and about 20% of arecanut production is used for dying purposes. On the basis of this rate, Betel leaf production is estimated for Assam in the 1999-2000 series of National Accounts. For rest of the States production approach is adopted.
(vi) Kitchen garden: This production of crops in foreyard/backyard of
houses was taken into account for the first time in the national accounts in the 1993-94 series. The information available in the Report “Operational Land Holdings in India, 1991-92 Salient Features” March, 1997 and Livestock Holding Survey, 1991-92, NSS (48th round)” was used to estimate the total area under kitchen garden. Since the Survey is conducted only once in 10 years, estimates of area under kitchen garden are not available on annual basis. Therefore, for the subsequent years, the ratio of total area under kitchen garden to the total rural area operated at all-India level (0.21 per cent) as observed in 1991-92, has been assumed to be constant for the subsequent years. As no data under kitchen garden was compiled during Livestock Holding Survey, NSS (59th round ), old norm i.e., ‘0.21 per cent of the net sown area’ has been used for estimating area under kitchen garden for the new series . The estimates of value of output on account of production of crops in foreyard/backyard were made using these area estimates and the value per hectare of fruits and vegetable crops.
(vii) Floriculture: Data on area, production of loose flowers in quintals and spikes in numbers along with respective prices are available annually in the publication titled ‘Indian Horticulture Database’ of NHB. In 1993-94 series its value was estimated using the NHB data. In the 1999-00 series production is taken from NHB and the prices from the respective State DESs.
(viii) Other crops: Other crops are non-food crops not classified elsewhere. Direct outturn estimates are not available. The estimates of output for these crops are obtained by applying an appropriate average value of yield per hectare to the total area under these crops.
(ix) Fodder and Grass: The rates used for estimating production of fodder in the old series were 7.0 Tonne/Hectare for Karnataka and Rajasthan, 2.82 tonne/hectare for Maharashtra and 9.34 Tonne/Hectare for other states. For the New series, these rates are revised on the basis of the recent study conducted by the Socio-Economic Research Centre, which are as under: Yield of cultivated Green Fodder
• 50 tonne/hec. for Irrigated Land
• 25 tonne/hec. for Un- irrigated Land

(x) Grass is estimated on the basis of the combined area under permanent pasture land, miscellaneous tree crops, fallow lands and net areas sown (using the appropriate weights for different types of areas), which is based on NSS 1955-56 report. Fodder and grass are evaluated at producer prices received from DESs.
(xi) Sugarcane and Gur: Conversion of sugarcane into gur is an activity undertaken by the agriculturists. The total sugarcane production is divided into two parts viz., sugarcane utilized as such and the sugarcane converted into gur. While the former is evaluated at sugarcane prices, the latter is evaluated at corresponding gur prices. Estimates of gur production are not directly available. The estimates are built up using information on quantity of sugarcane used for various purposes. The information on utilization of sugarcane for seed, chewing, juice making etc., is gathered from the State Agricultural Departments, DMI and the CCS. The quantity of sugarcane crushed by the factories for the manufacture of crystal sugar is obtained from the Directorate of Sugar & Vanaspati, Ministry of Agriculture. The consumption of sugarcane for the production of khandsari, bura etc., is estimated separately for the registered and unregistered establishments from the ASI and NSSO respectively. Out of the total sugarcane, the quantity of sugarcane left over after allowing for the above uses is assumed to be converted into gur.
The conversion rates from sugarcane to gur are taken from the production estimates of sugarcane in terms of gur, released by the DESAg. Bagasse obtained as a by-product during conversion of sugarcane into gur was estimated as 35 per cent of gur production. Socio Economic Research Centre (SERC) in a study obtained the quantity of bagasse production in 100 kg. of gur production from Sugarcane Breeding Institute, Coimbatore.
(xii) By-products: In the process of cultivation of crops and their processing by indigenous methods, several by-products are also produced. However, for the estimation of GVA only those by-products which are readily identifiable and have some definite economic value are considered. The value estimates of these by-products are based on the results of Cost of Cultivation Studies (CCS). The value per unit area of the by-products available from the CCS is directly utilized for arriving at the value of output.
(xiii) Valuation of crop production is done by multiplying the quantities of production by the corresponding producers’ prices.
(xiv) For evaluation purposes of these crops, the producers’ prices correspond to average wholesale prices ruling in the primary markets during the peak marketing periods and are furnished by the State Directorates of Economics

and Statistics (DESs) to Central Statistical Organisation (CSO). The wholesale prices are collected by the agriculture produce marketing committees of State Agriculture Departments or by the DESAg under the market intelligence scheme of DESAg. For averaging the weekly wholesale prices available from the selected primary markets, the following procedures are adopted by State DES. (a) Arithmetic averaging of the prices at the various centers within a district is done to get the weekly district prices. (b) Average price for a district is worked out as the arithmetic average over the ‘peak marketing period’ of weekly prices obtained at (a) above. (c) State average price is obtained as a weighted average of the district wise prices derived at (b) above, weights being the district-wise production of the corresponding crops.
(B) Valuation of Output of Livestock Products
For purpose of estimation of value of output, the livestock products are divided into 7 broad groups viz., (i) milk, (ii) meat, (iii) eggs, (iv) wool, (v) dung, (vi) silk worm cocoons & honey, and (vii) increment in stock. The source of data used in the preparation of the value of output is as under:
(i) Milk group: The milk group comprises of milk consumed or sold in fluid
form, ghee, butter and lassi produced by the producer households. It has been observed, during discussions with the DES that the quantity of milk used for conversion into ghee, butter and lassi by the producer households was quite minimal and the products converted are consumed mostly by the households themselves. Thus the evaluation of milk has been done as though it is consumed and sold in the fluid form itself. The milk production estimates released by the Department of Animal Husbandry, Dairying and Fisheries (DAHDF), Ministry of Agriculture are used for working out the value of output. The main source of data for milk production is the Integrated Sample Survey (ISS). In some States goat and buffalo milk are not estimated by DAHD. Production of milk, in such cases, is estimated by using yield rate prevalent in the neighboring States and the production so estimated is added to the production estimated by DAHD. Production of camel milk is also estimated by using the yield per camel in Gujarat.
(ii) Meat group: Meat group comprises of meat (including edible offals & glands and poultry meat), meat products (fats, heads, legs, etc.) and by-products comprising hides (cattle and buffalo hides), skins (goat and sheep skin) and other

products like guts, blood, bones, horns, hoofs etc. The States estimate the total production of meat both from registered and unregistered slaughter houses and furnish the same to the CSO. The estimates of meat products and by products are based on the number of slaughtered animals and fallen animals, wherever applicable and the corresponding yield rates. The old yield rates have been updated using the results of the study conducted by the CSO in 6 states during 2004-05.
(iii) Eggs & poultry meat: The data on production of egg is estimated through ISS and is furnished by the Department of Animal Husbandry, Dairying and Fisheries, Ministry of Agriculture. The estimates of poultry meat are prepared using the information on utilization of eggs and chickens survived. The data are collected through ISS in some of the States. IASRI and some of the State Animal Husbandry Departments also conduct poultry surveys and collect these data. Poultry meat is estimated in terms of number of adult fowls and chickens slaughtered. Poultry meat production equals 50 per cent of the total adult fowls plus chickens & ducklings killed. The latter is worked out as estimated number of chickens during the year plus chickens survived during the year plus 50 per cent of adult fowls minus estimated number of total fowls of the following year.
(iv) Wool and Hair: In the new series of NAS, SERC has suggested that average yield rate of hair from single humped camel as 700 gm./animal/year and that of a double humped camel as 3.0 kg./animal/year. For revising the yield rates of pig bristles, CSO conducted a Study during Pig Fair at Bhongaon, District Mainpuri (UP). Average yield rates of pig bristles are estimated as 155 gm per pig per year.
(v) Dung: The estimates of production of dung are prepared on the basis of information on population and evacuation rates supplied by the Department of Animal Husbandry, Dairying and Fisheries (DAHDF), Ministry of Agriculture. The evacuation rates and population estimates are based on the ISS. For the remaining States, for which estimates are not available, the rates pertaining to the adjoining States along with the annual estimated animal population are used for arriving at the dung production estimates. Dung is used as manure as well as fuel. The utilization rates of dung for (i) dung used as manure and (ii) dung used as fuel is supplied by the (DAHDF), Ministry of Agriculture.
(vi) Silk worm cocoons and honey: The annual outturn estimates of silk worm cocoons by types (viz., mulberry, tasar, ericot and muga) and honey are obtained from Central Silk Board and KVIC respectively on a regular basis.

(vii) Increment in stock: The annual net increase in the population in each state is estimated separately for each category of livestock on the basis of the projected population. The population is projected on the basis of growth rates observed between the two previous Livestock Censuses.
(viii) Evaluation of Livestock production is done by multiplying the quantities of production by the corresponding producers’ prices. The prices of livestock products are obtained in special return by the State DESs to ensure reasonable coverage of state-wise prices of important livestock/livestock products. The state-wise prices are worked out as the simple average of all available price observations.
(c) Valuation of Output of Forestry
The data on production and prices of industrial wood and that on minor forest products, as well as on prices of fuel wood are supplied by the State Forest Departments. The data on production of industrial wood generally relates to the quantities sold/auctioned at the assembling centers by the State Forest Departments. In the case of minor forest products, the information on their production is generally not available. However, information is built up on the basis of royalty received (in value terms) from those authorized to exploit these minor forest products from the forests. The value of minor forest products could be the royalty figures or economic value derived from the royalty figures. The estimates of production of fuel wood are prepared on the basis of five-yearly consumer expenditure surveys of the National Sample Survey Organization (NSSO).
(i) Industrial Wood: The estimates of value of output at current prices are
prepared by multiplying the category-wise production figures with their respective average annual prices (at the assembling centers), both of which are supplied by the State Forest Departments. However, this information relates only to the authorized produce of Government forests. In addition to the production of industrial wood from these Government forests, there would be (i) authorized (but unrecorded) and unauthorized removals of timber from reserved/protected forests and (ii) unrecorded production from private owned forests and non-traditional forest areas (e.g., trees in village common fields, ridges, canal sides, road sides, fruit trees no longer productive etc.). The authorized removals are those done by the right holders staying in the periphery of natural forests and are generally not recorded in the official records of production. In order to account for the production of industrial wood, a norm of 10 per cent of recorded production (as reported by the State Forest Departments) is adopted.

(ii) Minor Forest Products: Data on quantity and producer prices of most of the minor forest products (MFPs) are available from the State Forest Departments. The items of MFPs vary from state to state.
(iii) Fuel wood: It constitutes an important basic need for large segment of the population in India. The quantity/output of fuel wood is estimated through consumption approach, as reliable estimates on production of fuel wood are not directly available. Data on prices are available from state DESs. The estimated production of fuel wood is based on three components, namely (i) household fuel wood consumption, (ii) agricultural by-products used as fuel wood (this amount is to be subtracted from the total consumption of fuel wood by the households, as it is already accounted for in the agriculture sector as by-products) and (iii) fuel wood consumed by industries and on funerals. The estimated value of output of fuel-wood is based on (a) the estimation of fuel wood consumption as available from the Quinquennial Surveys of Consumer Expenditure, conducted in the NSS 43rd (1987-88), 50th (1993-94) and 55th (1999-2000) Rounds (b) subtracting from the household total consumption of fuel wood estimated from NSS data, the actual estimates of value of output of agricultural products, namely, cotton sticks, arhar sticks and jute sticks, and whose value of output is already taken into account in the agriculture sector (this gives the total firewood consumption from forest sources) and (c) estimating afresh the consumption of firewood in the industry and on funerals as given below:
(i) The estimate of consumption of firewood in the industries for the base year was obtained on the basis of the results of the Enterprise Surveys conducted on various activities by the CSO and the NSSO, and as used in the Input Output Transactions Tables (IOTT). The various industries that consume fuel wood are broadly grouped into 7 industry groups, namely, food products, beverage, tobacco and related products, textiles, paper and paper products, structural clay products, hotels and restaurants and others. The consumption of firewood by these industries is estimated for the base year from the IOTT 1993-94 and 1998-99. (ii) The consumption of firewood on funerals was estimated making use of the information on (a) distribution of population by different age groups, (b) mortality rates of different age groups and different religions, (c) population projections, and (d) consumption of firewood per funeral. Estimated annual deaths of only relevant religion and age groups were used for deriving the estimated consumption of firewood on funerals.
It is observed that the total firewood consumption under (i) and (ii) above accounts for 6% in value terms of the total consumption of firewood by households from forest sources (net of total household consumption of firewood, estimated

from NSS consumer expenditure surveys’ data) and agricultural by-products used as fuel by households (cotton sticks, arhar sticks and jute sticks) whose value of output has already been taken into account in the agriculture sector. This ratio built up for the base year is adopted to account for firewood consumed by industries and in funerals, is adopted for subsequent years.
(d) Valuation of Output of Fisheries
(i) Marine fish: Data on estimated landings of marine fish, prices and value of fish catch are directly obtained from the Department of Fisheries, Ministry of Agriculture/ State Fisheries Department of maritime states/union territories. For the estimation of marine fish production almost all maritime States follow the statistical sampling design. The produce of prawns is separately valued.
(ii) Inland fish: The data on inland fish production are also supplied by the State Fisheries Departments. By and large the estimates are prepared on the basis of market arrivals of fish or on the basis of surveys conducted in selected landing centers; the key information that is used in collecting data on inland fish is on the data in respect of inland water bodies. The produce of prawns is separately valued.
(iii) Subsistence fishing: The data supplied by the State Fisheries Departments includes production from subsistence fishing, in the case of most of the states. For other states, it is estimated at 12.5 per cent of inland fish production. This ratio has been arrived at on the basis of type studies conducted by few state Governments.
(iv) Salting, Sun-drying and Frozen Fish: Most maritime states resort to allied activities of fish curing, which include salting and sun drying of fish. The data on quantities and prices of fish let-in (raw fish going into salting, sun drying and frozen purposes) and fish let-out (the resultant salted, sundried and frozen fish) is also available from, the State Fisheries Departments.
(v) Other products: Data on producer prices and value of output in respect of gathering of pearls, chanks, oysters, sea-weeds, lime-shells, sea-shells etc., are not available, as such these are not included. However, from the available data from few states, it is assessed that the contribution of these activities is not significant.
(vi) Prices: For working out the value of output, the average annual auction prices of marine fish (species wise) collected by the State Fisheries

Departments at the landing centers and the inland fish prices reported by the State Fisheries Departments from the assembling centers, are used.
The users may refer for further details on the methodology of estimation, to the CSO publication entitled “National Accounts Statistics, Sources and Methods”, 2007 and “New Series on National Accounts Statistics (Base Year 1999-2000)”. The value of output in respect of 61 crops or crop groups, 7 Livestock groups, 3 Forestry groups and 2 Fisheries groups has been presented in this brochure. For each groups information is given in the form of two statements. The first statement contains information on state-wise value of output group at current prices for 1999-2000 to 2005-06. This is followed by a statement providing information on state-wise value of output of crop/crop group at constant prices (1999-2000) for 1999-2000 to 2005-06.

i
STATEMENTS

Central Statistical OrganisationNational Accounts Division
(Rs. lakhs)
State/U.Ts 1999-00 2000-01 2001-02 2002-03 2003-04 2004-05 2005-06
1 Andhra Pradesh 881910 1038868 979951 677052 808464 878520 1094992
2 Arunachal Pradesh 10717 10951 11781 13343 13584 11745 12829
3 Assam 336834 295932 284817 281710 308549 284168 293297
4 Bihar 331206 354486 354622 404297 407189 209059 292982
5 Goa 16454 11406 8645 11485 13798 12632 13964
6 Gujarat 94276 56782 63111 80122 108954 96595 128405
7 Haryana 228894 244086 274632 267573 298138 341509 370229
8 Himachal Pradesh 16010 20988 17683 11047 16178 10729 21002
9 Jammu & Kashmir 34293 39734 40366 41868 53395 56342 63556
10 Karnataka 334672 322653 274625 235449 245556 347795 536053
11 Kerala 79684 72628 61350 68107 61532 68265 56193
12 Madhya Pradesh 132443 84597 146962 89833 161030 121303 153889
13 Maharashtra 232158 164587 229632 164980 167273 251465 314587
14 Manipur 33890 35043 35453 34811 41544 45909 40664
15 Meghalaya 16324 16788 19656 20621 21676 21700 15950
16 Mizoram 5304 6739 9039 9446 10257 13975 13318
17 Nagaland 8829 17595 17978 13079 14750 15472 23482
18 Orissa 374389 316355 480167 227493 482906 502052 544584
19 Punjab 641604 705369 702510 731770 799480 883720 877987
20 Rajasthan 31634 16329 15781 7550 21278 16513 17933
21 Sikkim 2204 1429 1479 1524 1562 1646 2519
22 Tamil Nadu 563767 563866 497977 280130 256987 381828 397713
23 Tripura 51433 52305 60355 62663 64119 67391 65179
24 Uttar Pradesh 918118 794968 1022052 791698 1074051 805118 980537
25 West Bengal 1118031 861742 1012579 970820 1099168 1192493 1176711
26 A & N Islands 1917 2574 3280 3853 3708 3504 3684
27 Dadra & Nagar Haveli 2109 1917 1859 2202 2144 2250 2279
28 Daman & Diu 510 291 364 310 355 364 337
29 Delhi 1340 1028 1243 1313 1910 3234 2632
30 Lakshadweep 0 0 0 0 0 0 0
31 Puducherry 5632 5301 5716 6148 6604 6135 6018
32 Chandigarh 1117 23 34 30 28 23 23
33 Jharkhand 119433 110401 259050 109334 182889 138354 119905
34 Chattisgarh 367184 186703 423775 219476 466992 368656 429544
35 Uttarakhand 47284 45773 48678 40131 47548 49322 51359
Total 7041604 6460238 7367204 5881266 7263596 7209787 8124334
Statement 1 : Statewise Value of Output( At Current Prices )
Paddy
Page 1

Central Statistical OrganisationNational Accounts Division
(Rs. lakhs)
1999-00 2000-01 2001-02 2002-03 2003-04 2004-05 2005-06 State/U.Ts
881910 1018495 933770 630079 749960 816504 991255 1 Andhra Pradesh
10717 10552 10812 12246 12413 10733 11623 2 Arunachal Pradesh
336834 349127 336014 325535 337262 288647 295440 3 Assam
331206 324788 311593 305563 330014 161363 215779 4 Bihar
16454 11193 9975 10616 13440 11435 11600 5 Goa
94276 55782 63132 75770 115390 92746 117287 6 Gujarat
228894 231145 233966 212141 242635 257939 270241 7 Haryana
16010 16648 17617 10984 15858 9810 14906 8 Himachal Pradesh
34293 36373 36981 36911 44206 43227 48775 9 Jammu & Kashmir
334672 342572 288940 215204 229757 333375 516681 10 Karnataka
79684 77683 72739 70191 58939 71402 61515 11 Kerala
132443 81642 141048 86062 147837 111094 139548 12 Madhya Pradesh
232158 169397 239203 166177 166715 193479 242031 13 Maharashtra
33890 35444 35964 31151 35394 40473 35849 14 Manipur
16324 16049 18068 18254 19187 18523 13614 15 Meghalaya
5304 6220 6343 6552 6876 9369 8928 16 Mizoram
8829 13802 14242 9021 10001 10590 15788 17 Nagaland
374389 332552 516067 234969 486592 473024 491654 18 Orissa
641604 677695 651372 654763 711917 770024 752119 19 Punjab
31634 19124 21597 6591 19459 18674 18960 20 Rajasthan
2204 1341 1342 1333 1331 1356 2025 21 Sikkim
563767 550261 492829 268304 241558 378919 390336 22 Tamil Nadu
51433 52213 59739 61254 62732 58139 56230 23 Tripura
918118 848692 934798 697699 947186 696608 810931 24 Uttar Pradesh
1118031 984006 1210827 1141502 1158473 1176032 1144396 25 West Bengal
1917 1448 1845 2168 2086 1971 2072 26 A & N Islands
2109 1917 1859 2202 2144 2250 2279 27 Dadra & Nagar Haveli
510 291 364 310 355 364 337 28 Daman & Diu
1340 1098 1160 1241 1710 2713 2308 29 Delhi
0 0 0 0 0 0 0 30 Lakshadweep
5632 5501 6186 5529 6442 5872 5759 31 Puducherry
1117 21 30 27 24 19 19 32 Chandigarh
119433 115238 127640 96760 161857 117502 109168 33 Jharkhand
367184 181892 393675 200542 425561 328374 377290 34 Chattisgarh
47284 47718 47409 37947 42685 42941 44257 35 Uttarakhand
7041604 6617922 7239147 5635597 6807994 6555488 7221002 Total
Statement 1 : Statewise Value of Output( At 1999-00 Prices)
Paddy
Page 2

Central Statistical OrganisationNational Accounts Division
(Rs. lakhs)
State/U.Ts 1999-00 2000-01 2001-02 2002-03 2003-04 2004-05 2005-06
1 Andhra Pradesh 843 811 1041 1552 731 485 952
2 Arunachal Pradesh 281 372 334 437 438 609 430
3 Assam 9310 7229 5207 5506 4984 5211 4315
4 Bihar 269768 248613 249506 250517 239087 213198 262942
5 Goa 0 0 0 0 0 0 0
6 Gujarat 74309 59634 79185 74390 152289 134058 216684
7 Haryana 554770 587725 583448 577300 572758 579218 611901
8 Himachal Pradesh 40364 18202 52583 42351 42557 58892 58055
9 Jammu & Kashmir 30966 10602 23228 27771 32526 33825 31657
10 Karnataka 17219 21755 15431 12728 8382 19044 22959
11 Kerala 0 0 0 0 0 0 0
12 Madhya Pradesh 516153 306461 394551 337124 501030 515559 474100
13 Maharashtra 102987 67606 79479 75847 61679 84572 118035
14 Manipur 0 420 0 0 0 0 0
15 Meghalaya 364 380 288 282 90 101 76
16 Mizoram 0 0 0 0 0 0 0
17 Nagaland 500 472 747 1054 1240 1116 118
18 Orissa 530 981 823 477 581 403 429
19 Punjab 924038 948248 960994 889715 915048 933351 974298
20 Rajasthan 441324 377051 428211 327499 398766 399853 496733
21 Sikkim 69 582 583 549 514 543 604
22 Tamil Nadu 0 5 0 0 0 0 0
23 Tripura 117 111 126 96 273 160 165
24 Uttar Pradesh 1511400 1508454 1450207 1509369 1652874 1579127 1947944
25 West Bengal 57172 63188 55525 55031 66965 56182 62039
26 A & N Islands 0 0 0 0 0 0 0
27 Dadra & Nagar Haveli 71 63 47 110 78 86 86
28 Daman & Diu 0 0 0 0 0 0 0
29 Delhi 8373 6783 6359 5915 6986 6060 6360
30 Lakshadweep 0 0 0 0 0 0 0
31 Puducherry 0 0 0 0 0 0 0
32 Chandigarh 291 250 296 264 190 154 155
33 Jharkhand 6505 5963 8967 8881 9217 12000 5688
34 Chattisgarh 6214 6980 8508 8502 8818 7097 7755
35 Uttarakhand 48470 50755 45062 50778 48559 55316 54651
Total 4622407 4299693 4450738 4264047 4726658 4696219 5359131
Wheat
Statement 2 : Statewise Value of Output
( At Current Prices )
Page 3

Central Statistical OrganisationNational Accounts Division
(Rs. lakhs)
1999-00 2000-01 2001-02 2002-03 2003-04 2004-05 2005-06 State/U.Ts
843 749 889 1394 655 431 843 1 Andhra Pradesh
281 341 292 347 347 479 336 2 Arunachal Pradesh
9310 8142 8104 7410 6935 6470 5102 3 Assam
269768 261139 263825 237788 217079 193027 190615 4 Bihar
0 0 0 0 0 0 0 5 Goa
74309 54226 71543 64450 140498 124561 170612 6 Gujarat
554770 557681 543950 529013 524785 520175 507364 7 Haryana
40364 17373 44065 34284 34450 47665 46987 8 Himachal Pradesh
30966 10602 24463 28655 32755 33825 31657 9 Jammu & Kashmir
17219 19773 15731 11691 7612 16325 17171 10 Karnataka
0 0 0 0 0 0 0 11 Kerala
516153 292120 359846 295592 442013 439490 358171 12 Madhya Pradesh
102987 67984 77235 70566 55793 72860 93227 13 Maharashtra
0 210 0 0 0 0 0 14 Manipur
364 359 250 244 78 83 62 15 Meghalaya
0 0 0 0 0 0 0 16 Mizoram
500 400 600 680 800 720 76 17 Nagaland
530 889 730 400 517 344 310 18 Orissa
924038 902924 900029 823166 841380 853587 842058 19 Punjab
441324 361744 419257 320866 386771 376553 388351 20 Rajasthan
69 545 529 481 437 448 486 21 Sikkim
0 5 0 0 0 0 0 22 Tamil Nadu
117 107 122 88 249 137 142 23 Tripura
1511400 1487635 1507574 1405040 1512096 1332737 1425752 24 Uttar Pradesh
57172 71136 64611 59632 66237 56547 51978 25 West Bengal
0 0 0 0 0 0 0 26 A & N Islands
71 63 47 110 78 86 86 27 Dadra & Nagar Haveli
0 0 0 0 0 0 0 28 Daman & Diu
8373 6184 5923 5340 5665 5522 5447 29 Delhi
0 0 0 0 0 0 0 30 Lakshadweep
0 0 0 0 0 0 0 31 Puducherry
291 238 278 248 174 139 139 32 Chandigarh
6505 6536 7281 7173 7445 9464 4902 33 Jharkhand
6214 5659 7367 7018 7730 6064 6456 34 Chattisgarh
48470 51561 44155 46127 45138 48144 39210 35 Uttarakhand
4622407 4186325 4368695 3957804 4337718 4145884 4187538 Total
Statement 2 : Statewise Value of Output( At 1999-00 Prices)
Wheat
Page 4

Central Statistical OrganisationNational Accounts Division
(Rs. lakhs)
State/U.Ts 1999-00 2000-01 2001-02 2002-03 2003-04 2004-05 2005-06
1 Andhra Pradesh 41528 48967 45162 43890 50699 36497 42869
2 Arunachal Pradesh 0 0 0 0 0 0 0
3 Assam 0 0 0 0 0 0 0
4 Bihar 30 30 111 138 47 67 150
5 Goa 0 0 0 0 0 0 0
6 Gujarat 15168 8428 10986 13002 10204 8645 10330
7 Haryana 1072 1037 851 1178 1547 1703 1749
8 Himachal Pradesh 0 0 0 0 0 0 0
9 Jammu & Kashmir 0 0 0 0 0 234 26
10 Karnataka 128375 67507 73984 76899 49256 90524 168781
11 Kerala 75 11 95 87 73 84 78
12 Madhya Pradesh 27112 24791 27571 30620 46099 32962 36517
13 Maharashtra 301971 180150 194696 211824 164576 234342 251082
14 Manipur 0 0 0 0 0 0 0
15 Meghalaya 0 0 0 0 0 0 0
16 Mizoram 0 0 0 0 0 0 0
17 Nagaland 67 142 132 448 585 470 94
18 Orissa 333 384 341 456 393 310 286
19 Punjab 0 8 20 67 0 0 0
20 Rajasthan 10031 7027 11352 4646 25647 15777 12905
21 Sikkim 0 0 0 0 0 0 0
22 Tamil Nadu 18105 14172 13176 12175 13825 14240 13071
23 Tripura 0 0 0 0 0 0 0
24 Uttar Pradesh 17408 15438 15097 13590 16710 14777 17492
25 West Bengal 26 26 37 68 33 35 39
26 A & N Islands 0 0 0 0 0 0 0
27 Dadra & Nagar Haveli 29 22 22 29 29 29 29
28 Daman & Diu 0 0 0 0 0 0 0
29 Delhi 206 177 213 244 226 386 644
30 Lakshadweep 0 0 0 0 0 0 0
31 Puducherry 0 0 0 0 6 5 5
32 Chandigarh 0 0 0 0 0 0 0
33 Jharkhand 69 87 87 12 67 68 17
34 Chattisgarh 524 386 460 455 442 256 389
35 Uttarakhand 1 0 0 0 0 0 0
Total 562131 368792 394393 409827 380464 451410 556553
Jowar
Statement 3 : Statewise Value of Output
( At Current Prices )
Page 5

Central Statistical OrganisationNational Accounts Division
(Rs. lakhs)
1999-00 2000-01 2001-02 2002-03 2003-04 2004-05 2005-06 State/U.Ts
41528 48048 49213 47117 57596 40053 45642 1 Andhra Pradesh
0 0 0 0 0 0 0 2 Arunachal Pradesh
0 0 0 0 0 0 0 3 Assam
30 30 111 132 45 60 126 4 Bihar
0 0 0 0 0 0 0 5 Goa
15168 9530 13091 12405 10827 8383 9231 6 Gujarat
1072 1121 1072 1072 1267 1267 1169 7 Haryana
0 0 0 0 0 0 0 8 Himachal Pradesh
0 0 0 0 0 234 26 9 Jammu & Kashmir
128375 110897 98366 87813 55997 97398 119364 10 Karnataka
75 12 86 75 63 75 69 11 Kerala
27112 24096 30362 31594 49978 32563 32861 12 Madhya Pradesh
301971 256624 251611 249829 185840 233201 251218 13 Maharashtra
0 0 0 0 0 0 0 14 Manipur
0 0 0 0 0 0 0 15 Meghalaya
0 0 0 0 0 0 0 16 Mizoram
67 67 62 207 259 207 41 17 Nagaland
333 333 296 238 267 229 238 18 Orissa
0 7 21 70 0 0 0 19 Punjab
10031 7790 14734 3967 30546 15400 9829 20 Rajasthan
0 0 0 0 0 0 0 21 Sikkim
18105 16021 14398 11037 12880 13199 12115 22 Tamil Nadu
0 0 0 0 0 0 0 23 Tripura
17408 17891 16783 13260 17044 13699 13135 24 Uttar Pradesh
26 26 36 64 31 31 31 25 West Bengal
0 0 0 0 0 0 0 26 A & N Islands
29 22 22 29 29 29 29 27 Dadra & Nagar Haveli
0 0 0 0 0 0 0 28 Daman & Diu
206 206 245 222 228 353 584 29 Delhi
0 0 0 0 0 0 0 30 Lakshadweep
0 0 0 0 5 5 5 31 Puducherry
0 0 0 0 0 0 0 32 Chandigarh
69 69 69 11 60 51 6 33 Jharkhand
524 411 548 411 453 262 351 34 Chattisgarh
1 0 0 0 0 0 0 35 Uttarakhand
562131 493201 491127 459552 423414 456699 496071 Total
( At 1999-00 Prices)
Jowar
Statement 3 : Statewise Value of Output
Page 6

Central Statistical OrganisationNational Accounts Division
(Rs. lakhs)
State/U.Ts 1999-00 2000-01 2001-02 2002-03 2003-04 2004-05 2005-06
1 Andhra Pradesh 5540 8549 4226 3493 9149 4863 5064
2 Arunachal Pradesh 0 0 0 0 0 0 0
3 Assam 0 0 0 0 0 0 0
4 Bihar 32 41 22 32 51 44 167
5 Goa 0 0 0 0 0 0 0
6 Gujarat 53403 49421 67370 68086 83419 65490 69573
7 Haryana 32212 26325 27661 25931 44311 36877 38982
8 Himachal Pradesh 8 17 8 8 17 15 8
9 Jammu & Kashmir 205 198 898 887 650 624 507
10 Karnataka 12172 12418 4839 5956 9391 16306 22073
11 Kerala 0 0 0 0 0 0 0
12 Madhya Pradesh 5760 8591 8801 6677 14100 12932 14843
13 Maharashtra 66703 51226 40859 65081 50413 67268 64336
14 Manipur 0 0 0 0 0 0 0
15 Meghalaya 0 0 0 0 0 0 0
16 Mizoram 0 0 0 0 0 0 0
17 Nagaland 70 143 135 464 595 478 370
18 Orissa 84 85 98 101 75 81 108
19 Punjab 219 238 286 324 395 407 301
20 Rajasthan 78683 89710 136118 42689 302294 160767 181793
21 Sikkim 0 0 0 0 0 0 0
22 Tamil Nadu 11460 6869 6813 4794 8404 6329 5552
23 Tripura 0 0 0 0 0 0 0
24 Uttar Pradesh 62291 62440 33427 38923 47997 57864 70527
25 West Bengal 5 16 17 18 12 0 0
26 A & N Islands 0 0 0 0 0 0 0
27 Dadra & Nagar Haveli 0 0 0 0 0 0 0
28 Daman & Diu 0 0 0 0 0 0 0
29 Delhi 216 64 246 164 211 162 223
30 Lakshadweep 0 0 0 0 0 0 0
31 Puducherry 27 27 23 27 24 30 30
32 Chandigarh 0 0 0 0 0 0 0
33 Jharkhand 104 83 76 6 110 100 7
34 Chattisgarh 0 4 1 1 0 1 1
35 Uttarakhand 1 0 0 0 0 0 0
Total 329197 316463 331924 263664 571618 430639 474467
Statement 4 : Statewise Value of Output
( At Current Prices )
Bajra
Page 7

Central Statistical OrganisationNational Accounts Division
(Rs. lakhs)
1999-00 2000-01 2001-02 2002-03 2003-04 2004-05 2005-06 State/U.Ts
5540 8424 4014 3250 8367 4579 4636 1 Andhra Pradesh
0 0 0 0 0 0 0 2 Arunachal Pradesh
0 0 0 0 0 0 0 3 Assam
32 41 22 32 51 41 147 4 Bihar
0 0 0 0 0 0 0 5 Goa
53403 52386 82077 63110 87051 59448 58328 6 Gujarat
32212 36308 46049 25349 55679 41289 37581 7 Haryana
8 17 8 8 17 17 8 8 Himachal Pradesh
205 198 259 256 320 307 250 9 Jammu & Kashmir
12172 16507 5426 5802 9251 12901 20343 10 Karnataka
0 0 0 0 0 0 0 11 Kerala
5760 8591 8599 5283 11786 10421 11276 12 Madhya Pradesh
66703 63956 48868 67409 52704 66232 60703 13 Maharashtra
0 0 0 0 0 0 0 14 Manipur
0 0 0 0 0 0 0 15 Meghalaya
0 0 0 0 0 0 0 16 Mizoram
70 70 65 216 270 216 168 17 Nagaland
84 84 97 76 71 67 67 18 Orissa
219 273 383 328 437 383 273 19 Punjab
78683 123802 231054 43427 402672 181599 166906 20 Rajasthan
0 0 0 0 0 0 0 21 Sikkim
11460 8086 7260 4209 8178 5899 4499 22 Tamil Nadu
0 0 0 0 0 0 0 23 Tripura
62291 68279 51757 57345 59879 65440 66638 24 Uttar Pradesh
5 16 16 16 11 0 0 25 West Bengal
0 0 0 0 0 0 0 26 A & N Islands
0 0 0 0 0 0 0 27 Dadra & Nagar Haveli
0 0 0 0 0 0 0 28 Daman & Diu
216 98 294 162 265 180 180 29 Delhi
0 0 0 0 0 0 0 30 Lakshadweep
27 27 27 21 21 27 27 31 Puducherry
0 0 0 0 0 0 0 32 Chandigarh
104 104 96 6 120 80 4 33 Jharkhand
0 5 1 1 1 1 1 34 Chattisgarh
1 0 0 0 0 0 0 35 Uttarakhand
329197 387272 486374 276307 697152 449127 432032 Total
Statement 4 : Statewise Value of Output( At 1999-00 Prices)
Bajra
Page 8

Central Statistical OrganisationNational Accounts Division
(Rs. lakhs)
State/U.Ts 1999-00 2000-01 2001-02 2002-03 2003-04 2004-05 2005-06
1 Andhra Pradesh 0 0 0 0 0 0 0
2 Arunachal Pradesh 0 0 0 0 0 0 0
3 Assam 0 0 0 0 0 0 0
4 Bihar 1898 1219 1131 1331 1284 1035 1221
5 Goa 0 0 0 0 0 0 0
6 Gujarat 766 742 849 727 0 0 0
7 Haryana 5152 4903 4171 4324 3727 3062 4969
8 Himachal Pradesh 2454 2140 3470 4500 3100 2561 1461
9 Jammu & Kashmir 239 202 225 298 533 319 260
10 Karnataka 0 0 0 0 0 0 0
11 Kerala 0 0 0 0 0 0 0
12 Madhya Pradesh 4822 4857 5340 5359 6657 5791 5643
13 Maharashtra 140 80 100 64 80 204 160
14 Manipur 0 0 0 0 0 0 0
15 Meghalaya 0 0 0 0 0 0 0
16 Mizoram 0 0 0 0 0 0 0
17 Nagaland 245 146 792 997 1000 1111 737
18 Orissa 0 0 0 0 0 0 0
19 Punjab 4963 5857 3427 4504 4088 4160 3969
20 Rajasthan 21752 18216 25656 27045 20518 24900 34457
21 Sikkim 71 97 113 123 85 87 81
22 Tamil Nadu 0 0 0 0 0 0 0
23 Tripura 0 0 0 0 0 0 0
24 Uttar Pradesh 36914 26139 31062 30880 27304 25837 30794
25 West Bengal 292 113 159 143 262 273 337
26 A & N Islands 0 0 0 0 0 0 0
27 Dadra & Nagar Haveli 0 0 0 0 0 0 0
28 Daman & Diu 0 0 0 0 0 0 0
29 Delhi 5 7 5 5 7 12 14
30 Lakshadweep 0 0 0 0 0 0 0
31 Puducherry 0 0 0 0 0 0 0
32 Chandigarh 2 2 2 2 2 2 2
33 Jharkhand 559 497 497 735 678 702 0
34 Chattisgarh 261 137 142 134 250 182 183
35 Uttarakhand 1742 1279 1259 2336 2015 1947 1348
Total 82277 66634 78401 83506 71591 72185 85638
Statement 5 : Statewise Value of Output
( At Current Prices )
Barley
Page 9

Central Statistical OrganisationNational Accounts Division
(Rs. lakhs)
1999-00 2000-01 2001-02 2002-03 2003-04 2004-05 2005-06 State/U.Ts
0 0 0 0 0 0 0 1 Andhra Pradesh
0 0 0 0 0 0 0 2 Arunachal Pradesh
0 0 0 0 0 0 0 3 Assam
1898 1324 1334 1169 1199 914 939 4 Bihar
0 0 0 0 0 0 0 5 Goa
766 782 895 766 0 0 0 6 Gujarat
5152 5960 4344 4091 3687 2930 3839 7 Haryana
2454 1616 2620 3398 2341 2544 1389 8 Himachal Pradesh
239 202 225 247 377 225 184 9 Jammu & Kashmir
0 0 0 0 0 0 0 10 Karnataka
0 0 0 0 0 0 0 11 Kerala
4822 4632 5404 5093 6176 5133 5003 12 Madhya Pradesh
140 81 93 58 116 198 233 13 Maharashtra
0 0 0 0 0 0 0 14 Manipur
0 0 0 0 0 0 0 15 Meghalaya
0 0 0 0 0 0 0 16 Mizoram
245 105 561 701 701 771 512 17 Nagaland
0 0 0 0 0 0 0 18 Orissa
4963 5103 3652 3979 3605 3464 2949 19 Punjab
21752 24343 26600 26630 24349 24879 29310 20 Rajasthan
71 50 59 63 63 63 59 21 Sikkim
0 0 0 0 0 0 0 22 Tamil Nadu
0 0 0 0 0 0 0 23 Tripura
36914 33486 32793 31259 26888 22806 22900 24 Uttar Pradesh
292 112 174 143 254 248 186 25 West Bengal
0 0 0 0 0 0 0 26 A & N Islands
0 0 0 0 0 0 0 27 Dadra & Nagar Haveli
0 0 0 0 0 0 0 28 Daman & Diu
5 5 5 5 5 11 11 29 Delhi
0 0 0 0 0 0 0 30 Lakshadweep
0 0 0 0 0 0 0 31 Puducherry
2 2 2 2 2 2 2 32 Chandigarh
559 539 539 649 599 584 0 33 Jharkhand
261 221 215 176 244 181 181 34 Chattisgarh
1742 1439 1422 2016 1904 1848 1008 35 Uttarakhand
82277 80003 80938 80444 72511 66802 68705 Total
Statement 5 : Statewise Value of Output( At 1999-00 Prices)
Barley
Page 10

Central Statistical OrganisationNational Accounts Division
(Rs. lakhs)
State/U.Ts 1999-00 2000-01 2001-02 2002-03 2003-04 2004-05 2005-06
1 Andhra Pradesh 72644 75705 72452 76816 128592 109840 164228
2 Arunachal Pradesh 2560 2877 3032 3271 3188 3245 3445
3 Assam 823 865 630 646 712 1074 1059
4 Bihar 65143 72884 59788 65924 87482 75469 75876
5 Goa 24 26 26 26 26 46 29
6 Gujarat 28348 20435 45852 46060 42144 25711 35420
7 Haryana 2616 1675 2111 1758 2153 2161 2083
8 Himachal Pradesh 47698 47852 53774 33831 51072 44540 39728
9 Jammu & Kashmir 32890 36701 33039 29580 34619 32935 30339
10 Karnataka 74959 78359 64426 69017 60991 120898 145402
11 Kerala 0 0 0 0 0 0 0
12 Madhya Pradesh 59944 57205 72809 76332 91304 64807 66762
13 Maharashtra 20948 12358 25410 38651 37150 40354 52819
14 Manipur 437 540 469 409 370 445 395
15 Meghalaya 1109 1130 1184 1295 1295 1248 1253
16 Mizoram 594 1312 1336 1267 1991 1350 1952
17 Nagaland 1200 1970 2173 3240 3413 3925 4366
18 Orissa 3708 3258 2228 2558 3205 4634 4881
19 Punjab 23034 22620 22032 18039 27548 29741 27589
20 Rajasthan 53203 52844 62667 56996 99943 74233 67261
21 Sikkim 2420 2914 2774 2815 3072 3235 3226
22 Tamil Nadu 6179 5240 5512 10125 12022 13769 12302
23 Tripura 42 71 102 107 107 152 111
24 Uttar Pradesh 70448 70932 62454 50195 68222 64462 63340
25 West Bengal 5412 7320 5429 3480 7094 9997 6991
26 A & N Islands 0 0 0 0 36 49 18
27 Dadra & Nagar Haveli 0 0 0 0 0 0 0
28 Daman & Diu 0 0 0 0 0 0 0
29 Delhi 3 0 5 13 29 8 8
30 Lakshadweep 0 0 0 0 0 0 0
31 Puducherry 0 0 0 0 0 0 0
32 Chandigarh 16 14 30 25 12 8 8
33 Jharkhand 7147 5545 10837 16851 18780 18590 13881
34 Chattisgarh 6904 6235 3517 6165 7227 6914 7285
35 Uttarakhand 2376 2981 2718 2431 3985 2607 2735
Total 592827 591867 618814 617921 797784 756445 834793
Maize
Statement 6 : Statewise Value of Output
( At Current Prices )
Page 11

Central Statistical OrganisationNational Accounts Division
(Rs. lakhs)
1999-00 2000-01 2001-02 2002-03 2003-04 2004-05 2005-06 State/U.Ts
72644 78023 71904 73335 122241 101860 152345 1 Andhra Pradesh
2560 2772 2783 2989 2889 2915 3069 2 Arunachal Pradesh
823 858 823 823 823 817 805 3 Assam
65143 68347 67927 61618 67265 68019 62152 4 Bihar
24 24 24 24 24 24 15 5 Goa
28348 17846 46643 41039 40189 19928 27054 6 Gujarat
2616 1853 2562 1581 2235 2180 1853 7 Haryana
47698 47852 53774 33831 51072 44540 38017 8 Himachal Pradesh
32890 36701 37559 32464 37175 34363 31654 9 Jammu & Kashmir
74959 99844 67867 62785 56563 117310 127534 10 Karnataka
0 0 0 0 0 0 0 11 Kerala
59944 56743 78302 69631 86954 57348 58196 12 Madhya Pradesh
20948 14659 28403 35993 36380 36661 48184 13 Maharashtra
437 445 412 347 306 363 322 14 Manipur
1109 1118 1159 1191 1191 1104 1109 15 Meghalaya
594 984 1002 894 1218 942 1362 16 Mizoram
1200 1500 1650 2401 2410 2506 2788 17 Nagaland
3708 3154 2138 1941 3607 4683 4665 18 Orissa
23034 25283 24625 17002 25173 23144 22102 19 Punjab
53203 55790 81334 47842 113716 69344 60529 20 Rajasthan
2420 2732 2494 2463 2617 2668 2590 21 Sikkim
6179 6295 5330 8620 11290 13256 10849 22 Tamil Nadu
42 66 87 91 91 125 91 23 Tripura
70448 76758 79030 44737 68707 64132 54940 24 Uttar Pradesh
5412 6856 6708 4294 9822 14791 9969 25 West Bengal
0 0 0 0 36 49 18 26 A & N Islands
0 0 0 0 0 0 0 27 Dadra & Nagar Haveli
0 0 0 0 0 0 0 28 Daman & Diu
3 0 6 13 32 8 8 29 Delhi
0 0 0 0 0 0 0 30 Lakshadweep
0 0 0 0 0 0 0 31 Puducherry
16 13 28 23 9 5 5 32 Chandigarh
7147 5857 10757 13841 15426 14706 12264 33 Jharkhand
6904 6275 3539 6205 7318 6574 5301 34 Chattisgarh
2376 3106 2667 2009 3543 2293 2293 35 Uttarakhand
592827 621754 681537 570027 770324 706656 742085 Total
Maize
Statement 6 : Statewise Value of Output( At 1999-00 Prices)
Page 12

Central Statistical OrganisationNational Accounts Division
(Rs. lakhs)
State/U.Ts 1999-00 2000-01 2001-02 2002-03 2003-04 2004-05 2005-06
1 Andhra Pradesh 6010 7021 5949 4551 6111 5235 4782
2 Arunachal Pradesh 0 0 0 0 0 0 0
3 Assam 0 0 0 0 0 0 0
4 Bihar 1025 919 610 518 427 460 495
5 Goa 52 23 16 14 24 23 43
6 Gujarat 1385 930 1375 906 1318 1411 1200
7 Haryana 0 0 0 0 0 0 0
8 Himachal Pradesh 226 226 288 254 254 282 225
9 Jammu & Kashmir 0 0 0 0 0 0 0
10 Karnataka 69367 89014 57666 32787 64086 77359 87596
11 Kerala 47 88 98 77 84 77 21
12 Madhya Pradesh 129 26 3 8 4 5 6
13 Maharashtra 10471 8438 12438 9906 13297 11900 9607
14 Manipur 0 0 0 0 0 0 0
15 Meghalaya 0 0 0 0 0 0 0
16 Mizoram 0 0 0 0 0 0 0
17 Nagaland 0 0 0 0 0 0 0
18 Orissa 2514 2239 2151 1867 2252 2236 2285
19 Punjab 0 0 0 0 0 0 0
20 Rajasthan 0 0 0 0 0 0 0
21 Sikkim 213 203 210 192 192 225 225
22 Tamil Nadu 11737 12219 10544 7085 10023 7582 7095
23 Tripura 0 0 0 0 0 0 0
24 Uttar Pradesh 32 45 27 41 45 41 41
25 West Bengal 881 1219 786 818 658 556 625
26 A & N Islands 0 0 0 0 0 0 0
27 Dadra & Nagar Haveli 128 134 134 128 117 117 117
28 Daman & Diu 0 0 0 0 0 0 0
29 Delhi 0 0 0 0 0 0 0
30 Lakshadweep 0 0 0 0 0 0 0
31 Puducherry 24 16 13 14 18 11 11
32 Chandigarh 0 0 0 0 0 0 0
33 Jharkhand 1628 1052 1044 374 594 495 414
34 Chattisgarh 0 95 171 98 147 127 176
35 Uttarakhand 8548 8699 7920 7394 8343 9110 10254
Total 114417 132603 101442 67031 107993 117252 125217
Statement 7 : Statewise Value of Output
( At Current Prices )
Ragi
Page 13

Central Statistical OrganisationNational Accounts Division
(Rs. lakhs)
1999-00 2000-01 2001-02 2002-03 2003-04 2004-05 2005-06 State/U.Ts
6010 6532 5586 4239 5488 4728 4293 1 Andhra Pradesh
0 0 0 0 0 0 0 2 Arunachal Pradesh
0 0 0 0 0 0 0 3 Assam
1025 1013 685 582 427 431 463 4 Bihar
52 24 14 14 19 14 24 5 Goa
1385 862 1400 907 1201 1285 1096 6 Gujarat
0 0 0 0 0 0 0 7 Haryana
226 216 241 205 205 228 174 8 Himachal Pradesh
0 0 0 0 0 0 0 9 Jammu & Kashmir
69367 90794 76154 35322 55659 79845 85286 10 Karnataka
47 84 84 58 63 58 16 11 Kerala
129 26 4 7 4 4 4 12 Madhya Pradesh
10471 8011 11312 7724 10590 9157 8223 13 Maharashtra
0 0 0 0 0 0 0 14 Manipur
0 0 0 0 0 0 0 15 Meghalaya
0 0 0 0 0 0 0 16 Mizoram
0 0 0 0 0 0 0 17 Nagaland
2514 2205 2139 1684 2115 1935 1911 18 Orissa
0 0 0 0 0 0 0 19 Punjab
0 0 0 0 0 0 0 20 Rajasthan
213 190 190 168 163 186 181 21 Sikkim
11737 12386 11231 6692 8419 7356 6334 22 Tamil Nadu
0 0 0 0 0 0 0 23 Tripura
32 45 27 41 45 41 41 24 Uttar Pradesh
881 887 864 911 911 881 893 25 West Bengal
0 0 0 0 0 0 0 26 A & N Islands
128 134 134 128 117 117 117 27 Dadra & Nagar Haveli
0 0 0 0 0 0 0 28 Daman & Diu
0 0 0 0 0 0 0 29 Delhi
0 0 0 0 0 0 0 30 Lakshadweep
24 14 14 12 14 10 10 31 Puducherry
0 0 0 0 0 0 0 32 Chandigarh
1628 1042 1033 361 574 451 361 33 Jharkhand
0 52 127 44 62 54 54 34 Chattisgarh
8548 8699 7920 6940 7830 8550 8550 35 Uttarakhand
114417 133215 119161 66037 93905 115329 118030 Total
Statement 7 : Statewise Value of Output( At 1999-00 Prices)
Ragi
Page 14

Central Statistical OrganisationNational Accounts Division
(Rs. lakhs)
State/U.Ts 1999-00 2000-01 2001-02 2002-03 2003-04 2004-05 2005-06
1 Andhra Pradesh 1430 1695 1470 997 1262 982 1103
2 Arunachal Pradesh 906 2137 775 844 935 947 1000
3 Assam 220 240 149 138 508 238 226
4 Bihar 103 156 154 179 102 401 535
5 Goa 0 0 0 0 0 0 0
6 Gujarat 1264 1027 1640 804 231 3164 4775
7 Haryana 5 0 0 0 13 0 20
8 Himachal Pradesh 1084 699 685 611 708 300 313
9 Jammu & Kashmir 321 83 628 338 213 90 100
10 Karnataka 1383 1711 1311 1312 1677 1289 1397
11 Kerala 160 129 183 151 129 100 25
12 Madhya Pradesh 13241 4012 6892 3865 5092 4368 5200
13 Maharashtra 9083 5792 3492 5636 4850 6285 2335
14 Manipur 0 0 0 0 0 0 0
15 Meghalaya 79 80 78 86 83 90 90
16 Mizoram 0 0 0 0 0 0 0
17 Nagaland 368 1050 1263 631 388 412 776
18 Orissa 657 838 852 646 557 402 394
19 Punjab 4831 810 817 758 1085 1240 629
20 Rajasthan 35 21 206 47 386 334 265
21 Sikkim 55 56 42 667 544 151 76
22 Tamil Nadu 2124 2198 2030 3268 2733 2550 1987
23 Tripura 0 0 0 0 0 0 0
24 Uttar Pradesh 2208 2238 1225 1785 2182 1950 2388
25 West Bengal 193 178 142 145 123 105 122
26 A & N Islands 0 0 0 0 0 0 0
27 Dadra & Nagar Haveli 125 118 104 105 111 111 111
28 Daman & Diu 0 0 0 0 0 0 0
29 Delhi 0 0 0 0 0 0 0
30 Lakshadweep 0 0 0 0 0 0 0
31 Puducherry 0 0 0 0 0 0 0
32 Chandigarh 0 0 0 0 0 0 0
33 Jharkhand 443 435 448 435 402 428 439
34 Chattisgarh 22342 3451 3847 3286 4356 3713 3578
35 Uttarakhand 2122 3260 3070 2502 3807 3300 3155
Total 64784 32416 31501 29237 32479 32950 31040
Statement 8 : Statewise Value of Output
( At Current Prices )
Small Millets&Other Cereal
Page 15

Central Statistical OrganisationNational Accounts Division
(Rs. lakhs)
1999-00 2000-01 2001-02 2002-03 2003-04 2004-05 2005-06 State/U.Ts
1430 1705 1503 990 1257 949 1052 1 Andhra Pradesh
906 2059 712 771 847 851 890 2 Arunachal Pradesh
220 238 194 176 588 181 172 3 Assam
103 147 175 168 79 362 438 4 Bihar
0 0 0 0 0 0 0 5 Goa
1264 1046 1869 738 234 2783 3922 6 Gujarat
5 0 0 0 16 0 18 7 Haryana
1084 692 674 593 697 300 300 8 Himachal Pradesh
321 83 352 362 225 93 103 9 Jammu & Kashmir
1383 2200 1617 1362 1620 1299 1162 10 Karnataka
160 125 161 123 104 82 22 11 Kerala
13241 3954 7382 3625 4987 3955 4509 12 Madhya Pradesh
9083 7884 4345 6250 5217 6132 2277 13 Maharashtra
0 0 0 0 0 0 0 14 Manipur
79 79 76 79 76 79 79 15 Meghalaya
0 0 0 0 0 0 0 16 Mizoram
368 762 848 351 218 230 404 17 Nagaland
657 812 825 511 570 383 359 18 Orissa
4831 865 910 707 990 975 500 19 Punjab
35 26 309 43 492 353 239 20 Rajasthan
55 51 34 564 460 123 62 21 Sikkim
2124 2443 2152 2214 1861 1753 1359 22 Tamil Nadu
0 0 0 0 0 0 0 23 Tripura
2208 2513 1555 1959 2349 1988 2066 24 Uttar Pradesh
193 162 173 174 169 154 169 25 West Bengal
0 0 0 0 0 0 0 26 A & N Islands
125 118 104 105 111 111 111 27 Dadra & Nagar Haveli
0 0 0 0 0 0 0 28 Daman & Diu
0 0 0 0 0 0 0 29 Delhi
0 0 0 0 0 0 0 30 Lakshadweep
0 0 0 0 0 0 0 31 Puducherry
0 0 0 0 0 0 0 32 Chandigarh
443 438 446 455 418 446 459 33 Jharkhand
22342 2798 3904 2605 3434 2850 2622 34 Chattisgarh
2122 3205 3099 2480 3788 3244 3069 35 Uttarakhand
64784 34406 33419 27406 30807 29675 26364 Total
Statement 8 : Statewise Value of Output( At 1999-00 Prices)
Small Millets&Other Cereal
Page 16

Central Statistical OrganisationNational Accounts Division
(Rs. lakhs)
State/U.Ts 1999-00 2000-01 2001-02 2002-03 2003-04 2004-05 2005-06
1 Andhra Pradesh 1009905 1181616 1110249 808351 1005009 1036423 1313992
2 Arunachal Pradesh 14463 16336 15922 17895 18144 16546 17704
3 Assam 347187 304265 290803 287999 314753 290691 298898
4 Bihar 669205 678348 665944 722936 735668 499733 634368
5 Goa 16529 11454 8686 11526 13849 12701 14035
6 Gujarat 268919 197400 270368 284097 398559 335075 466387
7 Haryana 824722 865752 892874 878064 922648 964531 1029933
8 Himachal Pradesh 107844 90123 128491 92603 113885 117321 120792
9 Jammu & Kashmir 98913 87521 98385 100743 121935 124369 126445
10 Karnataka 638147 593415 492282 434147 439339 673214 984262
11 Kerala 79967 72857 61726 68422 61818 68527 56318
12 Madhya Pradesh 759604 490540 662929 549818 825316 757726 756961
13 Maharashtra 744460 490237 586105 571988 499317 696391 812961
14 Manipur 34327 36003 35922 35221 41913 46354 41059
15 Meghalaya 17876 18377 21206 22285 23143 23139 17368
16 Mizoram 5898 8051 10375 10713 12248 15326 15270
17 Nagaland 11281 21519 23220 19913 21971 22984 29944
18 Orissa 382216 324140 486661 233598 489969 510118 552967
19 Punjab 1598689 1683149 1690086 1645177 1747645 1852620 1884773
20 Rajasthan 636661 561199 679991 466472 868833 692377 811348
21 Sikkim 5033 5281 5201 5869 5968 5888 6732
22 Tamil Nadu 613373 604569 536053 317578 303995 426299 437721
23 Tripura 51592 52487 60583 62866 64499 67702 65455
24 Uttar Pradesh 2618819 2480654 2615551 2436480 2889384 2549174 3113062
25 West Bengal 1182012 933802 1074675 1030524 1174315 1259641 1246864
26 A & N Islands 1917 2574 3280 3853 3744 3553 3702
27 Dadra & Nagar Haveli 2462 2253 2166 2574 2480 2594 2623
28 Daman & Diu 510 291 364 310 355 364 337
29 Delhi 10143 8058 8071 7653 9367 9861 9880
30 Lakshadweep 0 0 0 0 0 0 0
31 Puducherry 5683 5344 5752 6189 6651 6181 6064
32 Chandigarh 1426 290 363 322 233 187 188
33 Jharkhand 135888 124063 281006 136627 212738 170737 140350
34 Chattisgarh 403429 203991 440422 238118 488232 386946 448911
35 Uttarakhand 110545 112747 108707 105572 114257 121602 123502
Total 13409644 12268705 13374418 11616500 13952182 13766888 15591173
Total Cereal
Statement 1-8 : Statewise Value of Output
( At Current Prices )
Page 17

Central Statistical OrganisationNational Accounts Division
(Rs. lakhs)
1999-00 2000-01 2001-02 2002-03 2003-04 2004-05 2005-06 State/U.Ts
1009905 1161976 1066880 760404 945564 969104 1200066 1 Andhra Pradesh
14463 15724 14598 16353 16494 14977 15918 2 Arunachal Pradesh
347187 358364 345134 333943 345607 296114 301518 3 Assam
669205 656830 645671 607053 616159 424216 470660 4 Bihar
16529 11241 10013 10654 13483 11473 11638 5 Goa
268919 192460 280651 259185 395390 309134 387530 6 Gujarat
824722 834067 831943 773247 830305 825780 822065 7 Haryana
107844 84413 118999 83304 104640 105104 101782 8 Himachal Pradesh
98913 84160 99840 98895 115059 112274 112649 9 Jammu & Kashmir
638147 682588 554101 419978 416459 658452 887541 10 Karnataka
79967 77903 73071 70447 59169 71616 61621 11 Kerala
759604 471803 630947 496887 749734 660008 609568 12 Madhya Pradesh
744460 588596 661070 604006 513354 617919 706096 13 Maharashtra
34327 36099 36376 31498 35700 40836 36172 14 Manipur
17876 17605 19553 19769 20532 19789 14864 15 Meghalaya
5898 7204 7345 7446 8094 10311 10290 16 Mizoram
11281 16707 18028 13577 14659 15240 19777 17 Nagaland
382216 340029 522292 239817 493739 480666 499204 18 Orissa
1598689 1612150 1580991 1500016 1583502 1651578 1620002 19 Punjab
636661 592619 794886 449368 978004 686802 674123 20 Rajasthan
5033 4911 4648 5070 5072 4845 5403 21 Sikkim
613373 595499 533201 301077 284185 420380 425492 22 Tamil Nadu
51592 52387 59948 61433 63072 58400 56463 23 Tripura
2618819 2535299 2624319 2251338 2634194 2197450 2396401 24 Uttar Pradesh
1182012 1063201 1283409 1206734 1235908 1248685 1207623 25 West Bengal
1917 1448 1845 2168 2122 2020 2090 26 A & N Islands
2462 2253 2166 2574 2480 2594 2623 27 Dadra & Nagar Haveli
510 291 364 310 355 364 337 28 Daman & Diu
10143 7591 7634 6983 7906 8786 8537 29 Delhi
0 0 0 0 0 0 0 30 Lakshadweep
5683 5542 6228 5562 6483 5913 5801 31 Puducherry
1426 275 338 300 210 166 166 32 Chandigarh
135888 129824 147862 119257 186500 143285 127164 33 Jharkhand
403429 197313 409377 217002 444802 344361 392257 34 Chattisgarh
110545 115727 106673 97520 104889 107019 98385 35 Uttarakhand
13409644 12554097 13500398 11073174 13233826 12525660 13291827 Total
Statement 1-8 : Statewise Value of Output( At 1999-00 Prices)
Total Cereal
Page 18

Central Statistical OrganisationNational Accounts Division
(Rs. lakhs)
State/U.Ts 1999-00 2000-01 2001-02 2002-03 2003-04 2004-05 2005-06
1 Andhra Pradesh 14310 37921 61376 63934 76542 59338 107969
2 Arunachal Pradesh 0 0 0 0 0 0 0
3 Assam 207 268 268 242 200 220 240
4 Bihar 10675 11979 11759 12558 12890 10416 9893
5 Goa 0 0 0 0 0 0 0
6 Gujarat 4588 2028 4019 4883 17827 14272 27592
7 Haryana 7854 13883 19401 6510 14379 13003 13815
8 Himachal Pradesh 548 274 235 221 410 292 162
9 Jammu & Kashmir 36 27 59 40 59 27 27
10 Karnataka 24361 36523 42924 37774 26497 35650 41724
11 Kerala 0 0 0 0 0 0 0
12 Madhya Pradesh 277615 246653 341164 246437 352315 343223 401939
13 Maharashtra 75224 54446 67730 67081 59180 67310 134644
14 Manipur 0 0 0 0 0 0 0
15 Meghalaya 54 60 62 68 71 72 72
16 Mizoram 0 0 0 0 0 0 0
17 Nagaland 168 128 160 162 330 384 67
18 Orissa 2879 1497 3008 2485 3199 3371 4435
19 Punjab 819 1060 1174 1146 1002 1008 810
20 Rajasthan 93912 74279 113666 52790 97141 115280 103456
21 Sikkim 0 0 0 0 0 0 0
22 Tamil Nadu 741 644 998 783 797 742 838
23 Tripura 29 32 59 52 35 41 41
24 Uttar Pradesh 99873 118340 121900 131174 127280 108814 122173
25 West Bengal 3099 7899 6726 6275 8286 6594 6928
26 A & N Islands 0 0 0 0 0 0 0
27 Dadra & Nagar Haveli 13 27 16 16 16 16 16
28 Daman & Diu 0 0 0 0 0 0 0
29 Delhi 2 1 2 0 12 9 10
30 Lakshadweep 0 0 0 0 0 0 0
31 Puducherry 0 0 0 0 0 0 0
32 Chandigarh 0 0 0 1 1 1 1
33 Jharkhand 2216 0 0 4608 4608 5783 4422
34 Chattisgarh 12059 11651 20135 18707 28194 17416 31765
35 Uttarakhand 145 176 187 187 182 353 229
Total 631429 619797 817028 658132 831452 803636 1013268
Gram
Statement 9 : Statewise Value of Output
( At Current Prices )
Page 19

Central Statistical OrganisationNational Accounts Division
(Rs. lakhs)
1999-00 2000-01 2001-02 2002-03 2003-04 2004-05 2005-06 State/U.Ts
14310 34458 54621 57480 68765 51912 94345 1 Andhra Pradesh
0 0 0 0 0 0 0 2 Arunachal Pradesh
207 269 269 251 207 228 207 3 Assam
10675 10635 9000 9743 10621 8135 7581 4 Bihar
0 0 0 0 0 0 0 5 Goa
4588 1407 3063 3630 15644 11648 16792 6 Gujarat
7854 10834 16521 5552 13542 12323 9750 7 Haryana
548 274 201 183 338 241 128 8 Himachal Pradesh
36 24 48 32 48 24 24 9 Jammu & Kashmir
24361 33269 39134 35001 23778 32102 31824 10 Karnataka
0 0 0 0 0 0 0 11 Kerala
277615 185156 275192 195795 295389 282780 270964 12 Madhya Pradesh
75224 44006 56481 56293 52782 58424 88389 13 Maharashtra
0 0 0 0 0 0 0 14 Manipur
54 57 57 57 60 60 60 15 Meghalaya
0 0 0 0 0 0 0 16 Mizoram
168 112 140 140 280 322 56 17 Nagaland
2879 1440 2764 1872 2548 2865 3282 18 Orissa
819 981 833 900 725 591 403 19 Punjab
93912 54942 101891 47184 97971 107086 66344 20 Rajasthan
0 0 0 0 0 0 0 21 Sikkim
741 560 757 636 651 590 605 22 Tamil Nadu
29 29 43 43 29 29 29 23 Tripura
99873 90218 104893 98230 101054 86302 84813 24 Uttar Pradesh
3099 7072 6086 5227 6720 5480 5142 25 West Bengal
0 0 0 0 0 0 0 26 A & N Islands
13 27 13 13 13 13 13 27 Dadra & Nagar Haveli
0 0 0 0 0 0 0 28 Daman & Diu
2 1 2 0 9 9 9 29 Delhi
0 0 0 0 0 0 0 30 Lakshadweep
0 0 0 0 0 0 0 31 Puducherry
0 0 0 0 0 0 0 32 Chandigarh
2216 0 0 4224 4224 4224 3311 33 Jharkhand
12059 8226 14215 12903 22509 13656 18641 34 Chattisgarh
145 140 140 140 140 280 140 35 Uttarakhand
631429 484137 686364 535529 718048 679326 702852 Total
Statement 9 : Statewise Value of Output( At 1999-00 Prices)
Gram
Page 20

Central Statistical OrganisationNational Accounts Division
(Rs. lakhs)
State/U.Ts 1999-00 2000-01 2001-02 2002-03 2003-04 2004-05 2005-06
1 Andhra Pradesh 25352 32688 28342 23095 34781 36394 50418
2 Arunachal Pradesh 71 64 83 75 65 67 84
3 Assam 794 1076 1291 1259 1260 1205 1148
4 Bihar 8272 8327 8547 6989 7744 7750 7544
5 Goa 0 0 0 0 0 0 0
6 Gujarat 49105 18636 29770 34203 44126 37153 28302
7 Haryana 1518 1358 1672 4266 3978 4223 4598
8 Himachal Pradesh 26 26 26 26 0 0 0
9 Jammu & Kashmir 0 0 0 0 0 0 0
10 Karnataka 44534 36439 21554 38165 36279 43691 76999
11 Kerala 59 52 51 23 0 0 0
12 Madhya Pradesh 30367 27582 34077 27950 39222 36372 37140
13 Maharashtra 137729 91415 111167 124395 115874 109375 137597
14 Manipur 0 0 0 0 0 0 0
15 Meghalaya 111 120 133 136 137 138 138
16 Mizoram 29 42 15 46 36 36 36
17 Nagaland 600 877 1260 1545 2064 1939 1965
18 Orissa 14610 12302 13664 14161 18276 17087 21384
19 Punjab 767 828 958 1040 1553 1425 1291
20 Rajasthan 3481 1567 2748 607 2374 1908 1937
21 Sikkim 0 0 0 0 0 0 0
22 Tamil Nadu 5654 5750 5288 3758 4022 4191 4183
23 Tripura 117 187 211 231 208 198 223
24 Uttar Pradesh 84840 68291 75482 57153 68498 67273 68010
25 West Bengal 465 1407 758 540 1054 199 329
26 A & N Islands 0 0 0 0 0 0 0
27 Dadra & Nagar Haveli 242 178 242 226 226 210 210
28 Daman & Diu 0 0 0 0 0 0 0
29 Delhi 19 44 71 52 119 47 60
30 Lakshadweep 0 0 0 0 0 0 0
31 Puducherry 0 0 0 0 0 0 0
32 Chandigarh 1 1 1 1 1 1 1
33 Jharkhand 4542 4114 3399 8889 9003 10290 10349
34 Chattisgarh 7498 2938 3164 3796 5286 5168 4795
35 Uttarakhand 207 0 232 234 167 334 294
Total 421007 316309 344207 352860 396354 386676 459036
Statement 10 : Statewise Value of Output
( At Current Prices )
Arhar
Page 21

Central Statistical OrganisationNational Accounts Division
(Rs. lakhs)
1999-00 2000-01 2001-02 2002-03 2003-04 2004-05 2005-06 State/U.Ts
25352 35866 30839 24632 35703 35866 49296 1 Andhra Pradesh
71 56 71 63 56 56 71 2 Arunachal Pradesh
794 826 814 794 794 762 714 3 Assam
8272 9193 8397 6711 7507 7647 6711 4 Bihar
0 0 0 0 0 0 0 5 Goa
49105 20465 33348 34388 42614 38980 46248 6 Gujarat
1518 1778 2131 4614 4752 4614 4906 7 Haryana
26 26 26 26 0 0 0 8 Himachal Pradesh
0 0 0 0 0 0 0 9 Jammu & Kashmir
44534 40534 22675 37027 30704 44611 67224 10 Karnataka
59 59 59 23 0 0 0 11 Kerala
30367 29108 34670 25996 35376 34255 32982 12 Madhya Pradesh
137729 104772 122592 123480 110278 104407 125670 13 Maharashtra
0 0 0 0 0 0 0 14 Manipur
111 111 117 117 118 118 118 15 Meghalaya
29 44 15 44 29 29 29 16 Mizoram
600 840 1200 1440 1920 1800 1824 17 Nagaland
14610 12891 14025 12633 16449 15280 16930 18 Orissa
767 787 870 787 932 798 715 19 Punjab
3481 2129 3038 865 3526 2794 2927 20 Rajasthan
0 0 0 0 0 0 0 21 Sikkim
5654 5885 5402 3145 3588 3784 2662 22 Tamil Nadu
117 187 210 233 210 187 210 23 Tripura
84840 79506 71147 53305 63302 59294 58889 24 Uttar Pradesh
465 1194 668 567 688 223 324 25 West Bengal
0 0 0 0 0 0 0 26 A & N Islands
242 178 242 226 226 210 210 27 Dadra & Nagar Haveli
0 0 0 0 0 0 0 28 Daman & Diu
19 50 75 54 112 37 56 29 Delhi
0 0 0 0 0 0 0 30 Lakshadweep
0 0 0 0 0 0 0 31 Puducherry
1 1 1 1 1 1 1 32 Chandigarh
4542 4542 2325 6780 6867 7647 8412 33 Jharkhand
7498 3092 2947 3515 4595 4493 3734 34 Chattisgarh
207 0 218 218 156 312 156 35 Uttarakhand
421007 354119 358119 341684 370504 368207 431017 Total
Statement 10 : Statewise Value of Output( At 1999-00 Prices)
Arhar
Page 22

Central Statistical OrganisationNational Accounts Division
(Rs. lakhs)
State/U.Ts 1999-00 2000-01 2001-02 2002-03 2003-04 2004-05 2005-06
1 Andhra Pradesh 46876 72610 69655 61560 32088 43894 44541
2 Arunachal Pradesh 0 0 0 0 0 135 136
3 Assam 3685 3798 3757 2748 2562 3137 3086
4 Bihar 2890 2933 3290 2846 2340 2608 3169
5 Goa 0 0 0 0 0 0 0
6 Gujarat 4623 6556 9328 9960 7661 6466 7148
7 Haryana 27 43 68 72 40 103 133
8 Himachal Pradesh 1176 1470 1043 588 642 970 1260
9 Jammu & Kashmir 1260 1001 1536 1642 1669 1614 1778
10 Karnataka 8112 9772 10010 3858 4702 2491 4030
11 Kerala 560 334 312 176 22 22 111
12 Madhya Pradesh 17762 17889 26493 20790 33198 26791 24405
13 Maharashtra 42277 40753 46182 45435 43503 32383 42364
14 Manipur 0 0 0 0 0 0 0
15 Meghalaya 0 0 0 0 0 0 0
16 Mizoram 0 0 0 0 0 0 0
17 Nagaland 0 0 0 0 0 0 0
18 Orissa 4748 4906 7881 4390 5313 5157 8567
19 Punjab 359 342 383 410 496 447 416
20 Rajasthan 6386 7958 13018 6504 12773 7331 6927
21 Sikkim 575 504 578 560 576 615 610
22 Tamil Nadu 19438 24972 18193 10559 10268 13955 18931
23 Tripura 95 258 139 162 162 168 151
24 Uttar Pradesh 23656 28791 31460 34959 26582 37069 51045
25 West Bengal 9170 7121 8974 6337 6725 7050 9542
26 A & N Islands 0 0 0 0 0 0 0
27 Dadra & Nagar Haveli 140 248 202 186 217 217 233
28 Daman & Diu 0 0 0 0 0 0 0
29 Delhi 0 0 0 0 0 0 0
30 Lakshadweep 0 0 0 0 0 0 0
31 Puducherry 492 497 49 45 57 86 86
32 Chandigarh 0 0 0 0 0 0 0
33 Jharkhand 3518 4031 6228 4676 4619 5873 5707
34 Chattisgarh 6636 6107 7520 5488 6157 5779 7969
35 Uttarakhand 860 859 1515 1515 584 949 5335
Total 205321 243755 267812 225464 202956 205310 247679
Statement 11 : Statewise Value of Output
( At Current Prices )
Urd
Page 23

Central Statistical OrganisationNational Accounts Division
(Rs. lakhs)
1999-00 2000-01 2001-02 2002-03 2003-04 2004-05 2005-06 State/U.Ts
46876 62030 60855 59749 31770 41157 39839 1 Andhra Pradesh
0 0 0 0 0 122 122 2 Arunachal Pradesh
3685 3504 3872 3354 3504 3354 2887 3 Assam
2890 2551 2702 2337 2262 2249 2438 4 Bihar
0 0 0 0 0 0 0 5 Goa
4623 3603 7294 5329 8982 6122 4573 6 Gujarat
27 27 55 82 55 96 110 7 Haryana
1176 1437 1019 575 627 967 1202 8 Himachal Pradesh
1260 980 1080 1200 1220 1180 1300 9 Jammu & Kashmir
8112 10496 11285 4356 7229 3380 4506 10 Karnataka
560 293 293 210 27 27 133 11 Kerala
17762 13869 21288 19380 29821 25732 20868 12 Madhya Pradesh
42277 31235 39962 55404 55587 33337 31433 13 Maharashtra
0 0 0 0 0 0 0 14 Manipur
0 0 0 0 0 0 0 15 Meghalaya
0 0 0 0 0 0 0 16 Mizoram
0 0 0 0 0 0 0 17 Nagaland
4748 4394 7179 4357 5924 5328 5425 18 Orissa
359 321 359 359 415 340 246 19 Punjab
6386 6122 12376 8894 23584 9927 6612 20 Rajasthan
575 473 524 490 490 507 490 21 Sikkim
19438 24501 19287 14701 14054 15348 13092 22 Tamil Nadu
95 206 111 142 142 158 142 23 Tripura
23656 27100 29612 31725 25020 34536 39760 24 Uttar Pradesh
9170 6227 7911 6885 7197 6874 6959 25 West Bengal
0 0 0 0 0 0 0 26 A & N Islands
140 248 202 186 217 217 233 27 Dadra & Nagar Haveli
0 0 0 0 0 0 0 28 Daman & Diu
0 0 0 0 0 0 0 29 Delhi
0 0 0 0 0 0 0 30 Lakshadweep
492 414 53 53 79 98 98 31 Puducherry
0 0 0 0 0 0 0 32 Chandigarh
3518 3506 3305 4109 4059 5089 4800 33 Jharkhand
6636 5401 5955 4656 5543 5195 5448 34 Chattisgarh
860 732 1313 1388 707 1058 4068 35 Uttarakhand
205321 209671 237889 229922 228515 202398 196784 Total
Statement 11 : Statewise Value of Output( At 1999-00 Prices)
Urd
Page 24

Central Statistical OrganisationNational Accounts Division
(Rs. lakhs)
State/U.Ts 1999-00 2000-01 2001-02 2002-03 2003-04 2004-05 2005-06
1 Andhra Pradesh 34705 29134 26519 20315 51519 27039 28657
2 Arunachal Pradesh 0 0 90 91 91 92 0
3 Assam 1070 918 999 742 984 890 914
4 Bihar 16289 17872 20073 21172 15263 15077 16978
5 Goa 0 0 0 0 0 0 0
6 Gujarat 5637 8382 15259 7644 18022 12041 12234
7 Haryana 317 333 539 801 594 1241 1374
8 Himachal Pradesh 52 27 27 27 27 27 31
9 Jammu & Kashmir 238 226 312 346 265 265 265
10 Karnataka 23927 27193 12903 5050 6441 13091 18351
11 Kerala 577 376 467 86 29 29 171
12 Madhya Pradesh 3984 3815 5382 4180 5646 4476 5043
13 Maharashtra 50803 36745 49637 61274 56516 37407 42164
14 Manipur 0 0 0 0 0 0 0
15 Meghalaya 0 0 0 0 0 0 0
16 Mizoram 0 0 0 0 0 0 0
17 Nagaland 0 0 489 489 489 0 0
18 Orissa 6934 5490 9480 8142 12236 11048 16537
19 Punjab 3732 3337 2105 2250 3986 3072 2682
20 Rajasthan 8058 15513 45327 7725 73157 35922 33699
21 Sikkim 0 0 0 0 0 0 0
22 Tamil Nadu 9462 10151 9831 8889 7692 9846 11074
23 Tripura 135 238 131 129 129 186 186
24 Uttar Pradesh 7684 5330 4889 5027 8063 5194 9208
25 West Bengal 1842 1387 1529 1622 1259 1153 1257
26 A & N Islands 0 0 0 0 0 0 0
27 Dadra & Nagar Haveli 0 0 0 0 0 0 0
28 Daman & Diu 0 0 0 0 0 0 0
29 Delhi 0 0 0 0 0 0 0
30 Lakshadweep 0 0 0 0 0 0 0
31 Puducherry 310 341 1 55 72 116 140
32 Chandigarh 0 0 0 0 0 0 0
33 Jharkhand 163 115 166 973 953 1187 1344
34 Chattisgarh 574 698 711 920 820 900 1236
35 Uttarakhand 17 0 6 7 7 7 9
Total 176510 167624 206872 157953 264260 180303 203556
Statement 12 : Statewise Value of Output
( At Current Prices )
Moong
Page 25

Central Statistical OrganisationNational Accounts Division
(Rs. lakhs)
1999-00 2000-01 2001-02 2002-03 2003-04 2004-05 2005-06 State/U.Ts
34705 30297 25572 19425 51374 26181 27449 1 Andhra Pradesh
0 0 78 78 78 78 0 2 Arunachal Pradesh
1070 1103 1200 1067 1298 1233 1103 3 Assam
16289 17690 18211 19302 15165 14823 16517 4 Bihar
0 0 0 0 0 0 0 5 Goa
5637 7755 13864 6158 19745 11681 8716 6 Gujarat
317 248 428 566 552 842 842 7 Haryana
52 26 26 26 26 26 26 8 Himachal Pradesh
238 214 262 294 214 214 214 9 Jammu & Kashmir
23927 32924 12013 5024 7483 14965 16034 10 Karnataka
577 351 401 75 25 25 151 11 Kerala
3984 3176 4068 3288 4486 3859 3580 12 Madhya Pradesh
50803 39449 48037 61737 63888 37184 31362 13 Maharashtra
0 0 0 0 0 0 0 14 Manipur
0 0 0 0 0 0 0 15 Meghalaya
0 0 0 0 0 0 0 16 Mizoram
0 0 161 161 161 0 0 17 Nagaland
6934 5210 9086 6819 10686 9982 11771 18 Orissa
3732 2985 1801 1704 2564 1947 1606 19 Punjab
8058 15509 40524 6350 100449 40074 25425 20 Rajasthan
0 0 0 0 0 0 0 21 Sikkim
9462 9650 8383 7541 8356 9689 7196 22 Tamil Nadu
135 226 113 113 113 158 158 23 Tripura
7684 5458 5006 4386 6579 4487 6027 24 Uttar Pradesh
1842 1330 1228 1034 982 901 941 25 West Bengal
0 0 0 0 0 0 0 26 A & N Islands
0 0 0 0 0 0 0 27 Dadra & Nagar Haveli
0 0 0 0 0 0 0 28 Daman & Diu
0 0 0 0 0 0 0 29 Delhi
0 0 0 0 0 0 0 30 Lakshadweep
310 334 1 48 95 119 143 31 Puducherry
0 0 0 0 0 0 0 32 Chandigarh
163 114 98 814 798 994 928 33 Jharkhand
574 515 647 589 706 603 647 34 Chattisgarh
17 0 6 6 6 6 6 35 Uttarakhand
176510 174564 191214 146606 295831 180071 160844 Total
Statement 12 : Statewise Value of Output( At 1999-00 Prices)
Moong
Page 26

Central Statistical OrganisationNational Accounts Division
(Rs. lakhs)
State/U.Ts 1999-00 2000-01 2001-02 2002-03 2003-04 2004-05 2005-06
1 Andhra Pradesh 0 0 0 0 0 0 0
2 Arunachal Pradesh 0 0 0 0 0 0 0
3 Assam 2216 1940 2207 2203 2334 2254 2164
4 Bihar 23108 24497 20126 22934 23721 21491 20027
5 Goa 0 0 0 0 0 0 0
6 Gujarat 0 0 0 0 0 0 0
7 Haryana 752 723 1309 934 869 766 711
8 Himachal Pradesh 0 0 0 0 0 0 29
9 Jammu & Kashmir 22 23 25 23 28 28 28
10 Karnataka 0 0 0 0 0 0 0
11 Kerala 0 0 0 0 0 0 0
12 Madhya Pradesh 37612 29457 33496 26680 36977 40380 45949
13 Maharashtra 553 298 603 265 501 250 676
14 Manipur 0 0 0 0 0 0 0
15 Meghalaya 0 0 0 0 0 0 0
16 Mizoram 0 0 0 0 0 0 0
17 Nagaland 0 0 0 0 0 210 0
18 Orissa 0 0 0 0 0 0 0
19 Punjab 488 582 629 562 571 407 280
20 Rajasthan 9171 4381 2747 1073 4766 4604 2943
21 Sikkim 0 0 0 0 0 0 0
22 Tamil Nadu 0 0 0 0 0 0 0
23 Tripura 42 27 47 42 47 49 49
24 Uttar Pradesh 75969 61987 76115 80285 106976 93767 91901
25 West Bengal 11567 13516 8748 6968 10695 7542 9487
26 A & N Islands 0 0 0 0 0 0 0
27 Dadra & Nagar Haveli 0 0 0 0 0 0 0
28 Daman & Diu 0 0 0 0 0 0 0
29 Delhi 0 0 0 0 0 0 0
30 Lakshadweep 0 0 0 0 0 0 0
31 Puducherry 0 0 0 0 0 0 0
32 Chandigarh 1 1 1 1 1 1 1
33 Jharkhand 517 0 588 1320 2420 2853 1953
34 Chattisgarh 797 521 743 809 917 761 1061
35 Uttarakhand 2220 2306 1329 1677 1597 1555 2109
Total 165036 140259 148714 145777 192419 176916 179369
Statement 13 : Statewise Value of Output
( At Current Prices )
Masoor
Page 27

Central Statistical OrganisationNational Accounts Division
(Rs. lakhs)
1999-00 2000-01 2001-02 2002-03 2003-04 2004-05 2005-06 State/U.Ts
0 0 0 0 0 0 0 1 Andhra Pradesh
0 0 0 0 0 0 0 2 Arunachal Pradesh
2216 2010 2104 2104 2254 2160 1859 3 Assam
23108 22972 19071 21287 21722 17807 15564 4 Bihar
0 0 0 0 0 0 0 5 Goa
0 0 0 0 0 0 0 6 Gujarat
752 723 1106 796 752 693 634 7 Haryana
0 0 0 0 0 0 29 8 Himachal Pradesh
22 22 22 21 22 22 22 9 Jammu & Kashmir
0 0 0 0 0 0 0 10 Karnataka
0 0 0 0 0 0 0 11 Kerala
37612 28419 33085 24907 33085 36154 39567 12 Madhya Pradesh
553 276 566 235 414 193 497 13 Maharashtra
0 0 0 0 0 0 0 14 Manipur
0 0 0 0 0 0 0 15 Meghalaya
0 0 0 0 0 0 0 16 Mizoram
0 0 0 0 0 210 0 17 Nagaland
0 0 0 0 0 0 0 18 Orissa
488 581 619 506 431 300 188 19 Punjab
9171 4676 2791 1040 5220 5184 3045 20 Rajasthan
0 0 0 0 0 0 0 21 Sikkim
0 0 0 0 0 0 0 22 Tamil Nadu
42 25 42 38 42 42 42 23 Tripura
75969 64536 79069 71146 79828 79290 68774 24 Uttar Pradesh
11567 11739 6426 7410 9117 6495 8054 25 West Bengal
0 0 0 0 0 0 0 26 A & N Islands
0 0 0 0 0 0 0 27 Dadra & Nagar Haveli
0 0 0 0 0 0 0 28 Daman & Diu
0 0 0 0 0 0 0 29 Delhi
0 0 0 0 0 0 0 30 Lakshadweep
0 0 0 0 0 0 0 31 Puducherry
1 1 1 1 1 1 1 32 Chandigarh
517 0 557 1038 1903 2216 1522 33 Jharkhand
797 452 691 611 824 638 797 34 Chattisgarh
2220 2235 1341 1771 1358 1358 1582 35 Uttarakhand
165036 138668 147492 132911 156973 152763 142178 Total
Statement 13 : Statewise Value of Output( At 1999-00 Prices)
Masoor
Page 28

Central Statistical OrganisationNational Accounts Division
(Rs. lakhs)
State/U.Ts 1999-00 2000-01 2001-02 2002-03 2003-04 2004-05 2005-06
1 Andhra Pradesh 2554 1614 3362 2440 3258 2258 1790
2 Arunachal Pradesh 0 0 0 0 0 0 0
3 Assam 0 0 0 0 0 0 0
4 Bihar 1070 1140 961 961 1016 1038 1007
5 Goa 0 0 0 0 0 0 0
6 Gujarat 0 0 0 0 0 0 0
7 Haryana 0 0 20 10 81 13 28
8 Himachal Pradesh 261 374 241 241 401 240 278
9 Jammu & Kashmir 201 125 160 160 134 160 0
10 Karnataka 10877 10763 10843 7949 6007 9464 12317
11 Kerala 709 369 389 420 338 193 353
12 Madhya Pradesh 397 581 976 535 1329 543 572
13 Maharashtra 2157 2154 1345 1237 1452 1435 1919
14 Manipur 0 0 0 0 0 0 0
15 Meghalaya 0 0 0 0 0 0 0
16 Mizoram 0 0 0 0 0 0 0
17 Nagaland 0 0 0 0 0 0 0
18 Orissa 1765 1149 2324 1385 2410 2019 2289
19 Punjab 0 0 0 0 0 0 0
20 Rajasthan 0 0 0 0 0 0 0
21 Sikkim 0 0 0 0 0 0 0
22 Tamil Nadu 3711 3237 3395 1713 1475 1891 1712
23 Tripura 0 0 0 0 0 0 0
24 Uttar Pradesh 0 0 0 0 0 0 0
25 West Bengal 592 407 558 510 313 190 256
26 A & N Islands 0 0 0 0 0 0 0
27 Dadra & Nagar Haveli 0 0 0 0 0 0 0
28 Daman & Diu 0 0 0 0 0 0 0
29 Delhi 0 0 0 0 0 0 0
30 Lakshadweep 0 0 0 0 0 0 0
31 Puducherry 0 0 0 0 0 0 0
32 Chandigarh 0 0 0 0 0 0 0
33 Jharkhand 2799 2651 2592 776 764 1001 869
34 Chattisgarh 1706 108 2220 1610 1507 1463 1896
35 Uttarakhand 0 0 0 1220 1220 1220 0
Total 28800 24673 29386 21167 21704 23128 25286
( At Current Prices )
Statement 14 : Statewise Value of Output
Horsegram
Page 29

Central Statistical OrganisationNational Accounts Division
(Rs. lakhs)
1999-00 2000-01 2001-02 2002-03 2003-04 2004-05 2005-06 State/U.Ts
2554 1450 2787 2059 2759 1847 1422 1 Andhra Pradesh
0 0 0 0 0 0 0 2 Arunachal Pradesh
0 0 0 0 0 0 0 3 Assam
1070 1203 1025 1025 1016 1079 865 4 Bihar
0 0 0 0 0 0 0 5 Goa
0 0 0 0 0 0 0 6 Gujarat
0 0 25 8 58 8 17 7 Haryana
261 366 235 235 392 235 261 8 Himachal Pradesh
201 125 151 151 125 151 0 9 Jammu & Kashmir
10877 11053 10463 7675 5414 8386 9199 10 Karnataka
709 369 369 398 321 175 321 11 Kerala
397 446 606 534 652 531 559 12 Madhya Pradesh
2157 1911 980 858 1042 1060 1366 13 Maharashtra
0 0 0 0 0 0 0 14 Manipur
0 0 0 0 0 0 0 15 Meghalaya
0 0 0 0 0 0 0 16 Mizoram
0 0 0 0 0 0 0 17 Nagaland
1765 1126 2166 1104 1912 1611 1619 18 Orissa
0 0 0 0 0 0 0 19 Punjab
0 0 0 0 0 0 0 20 Rajasthan
0 0 0 0 0 0 0 21 Sikkim
3711 2992 2735 1334 1175 1291 1413 22 Tamil Nadu
0 0 0 0 0 0 0 23 Tripura
0 0 0 0 0 0 0 24 Uttar Pradesh
592 343 499 416 281 187 203 25 West Bengal
0 0 0 0 0 0 0 26 A & N Islands
0 0 0 0 0 0 0 27 Dadra & Nagar Haveli
0 0 0 0 0 0 0 28 Daman & Diu
0 0 0 0 0 0 0 29 Delhi
0 0 0 0 0 0 0 30 Lakshadweep
0 0 0 0 0 0 0 31 Puducherry
0 0 0 0 0 0 0 32 Chandigarh
2799 2799 2737 553 544 686 651 33 Jharkhand
1706 60 1478 919 1225 1092 1118 34 Chattisgarh
0 0 0 612 612 612 0 35 Uttarakhand
28800 24244 26256 17880 17527 18950 19013 Total
Statement 14 : Statewise Value of Output( At 1999-00 Prices)
Horsegram
Page 30

Central Statistical OrganisationNational Accounts Division
(Rs. lakhs)
State/U.Ts 1999-00 2000-01 2001-02 2002-03 2003-04 2004-05 2005-06
1 Andhra Pradesh 1122 1485 1362 1121 1748 1447 1501
2 Arunachal Pradesh 527 870 1013 1218 1260 810 1404
3 Assam 3305 3257 11639 9652 2543 2349 2426
4 Bihar 15527 13105 11537 12963 14144 9575 10158
5 Goa 1368 1486 1096 1148 1408 1438 1760
6 Gujarat 5174 5151 6726 7744 4952 3266 8181
7 Haryana 203 199 182 398 219 285 359
8 Himachal Pradesh 1799 2532 1434 2910 1140 1033 2274
9 Jammu & Kashmir 939 1037 2040 930 1246 1725 1360
10 Karnataka 6155 6191 5112 4748 5200 6557 7378
11 Kerala 985 572 578 310 211 117 329
12 Madhya Pradesh 15600 8637 12865 12506 14018 16402 18596
13 Maharashtra 19538 30003 12684 20265 8029 10027 14470
14 Manipur 586 835 976 1143 551 513 774
15 Meghalaya 393 274 297 295 475 496 496
16 Mizoram 945 428 739 1044 721 713 1194
17 Nagaland 1999 3577 2350 4321 4903 3865 6965
18 Orissa 8685 7068 7480 7326 5621 6514 25407
19 Punjab 681 982 2144 2169 722 649 637
20 Rajasthan 11473 35550 50913 10901 110675 32681 43733
21 Sikkim 388 367 396 771 658 627 572
22 Tamil Nadu 3611 3871 3149 3058 2437 2437 2666
23 Tripura 388 439 535 925 441 485 490
24 Uttar Pradesh 54367 38969 41859 56124 72676 74663 66738
25 West Bengal 6117 8245 6257 6551 10443 7694 8379
26 A & N Islands 24 32 16 180 120 120 120
27 Dadra & Nagar Haveli 271 282 135 445 296 350 363
28 Daman & Diu 198 187 158 158 158 172 158
29 Delhi 5 3 4 4 17 0 17
30 Lakshadweep 0 0 0 0 0 0 0
31 Puducherry 18 20 16 36 14 34 17
32 Chandigarh 0 0 0 0 0 0 0
33 Jharkhand 2178 718 1288 5721 4954 5993 4608
34 Chattisgarh 22177 10188 20478 18333 24570 14722 20798
35 Uttarakhand 477 527 528 1544 624 568 657
Total 187222 187087 207985 196961 297190 208325 254982
Statement 15 : Statewise Value of Output
( At Current Prices )
Other Pulses
Page 31

Central Statistical OrganisationNational Accounts Division
(Rs. lakhs)
1999-00 2000-01 2001-02 2002-03 2003-04 2004-05 2005-06 State/U.Ts
1122 1415 1279 1105 1747 1387 1412 1 Andhra Pradesh
527 767 800 952 835 527 909 2 Arunachal Pradesh
3305 3113 11500 10589 3167 3030 2717 3 Assam
15527 13620 12593 11449 12493 8746 8546 4 Bihar
1368 1467 1096 1140 1398 1429 1748 5 Goa
5174 4948 6914 6408 5499 3628 7200 6 Gujarat
203 229 190 395 242 281 344 7 Haryana
1799 2477 1403 2847 1114 1026 605 8 Himachal Pradesh
939 1024 1452 634 912 1261 969 9 Jammu & Kashmir
6155 6738 5216 4667 4947 6806 6405 10 Karnataka
985 565 567 310 210 119 334 11 Kerala
15600 9576 11752 10877 12834 12626 13743 12 Madhya Pradesh
19538 29666 12394 19720 8329 9819 12159 13 Maharashtra
586 573 660 862 472 181 635 14 Manipur
393 253 261 254 409 425 425 15 Meghalaya
945 444 700 780 550 567 949 16 Mizoram
1999 3427 1829 3403 3997 3615 6467 17 Nagaland
8685 7270 7567 5848 5141 5941 18154 18 Orissa
681 982 2055 1962 722 649 637 19 Punjab
11473 33971 61629 8799 140142 42265 35599 20 Rajasthan
388 345 359 675 560 517 460 21 Sikkim
3611 3776 3072 3279 2823 2455 1809 22 Tamil Nadu
388 409 489 866 413 446 450 23 Tripura
54367 36385 38581 41202 47205 53002 44497 24 Uttar Pradesh
6117 7321 5247 5425 8657 3942 4050 25 West Bengal
24 32 16 48 32 32 32 26 A & N Islands
271 282 135 445 296 350 363 27 Dadra & Nagar Haveli
198 161 158 136 136 149 136 28 Daman & Diu
5 4 4 4 16 0 16 29 Delhi
0 0 0 0 0 0 0 30 Lakshadweep
18 18 17 37 19 37 19 31 Puducherry
0 0 0 0 0 0 0 32 Chandigarh
2178 721 975 4809 4050 4832 3789 33 Jharkhand
22177 9158 18987 14149 19064 14638 16211 34 Chattisgarh
477 328 320 1192 320 320 375 35 Uttarakhand
187222 181465 210217 165267 288753 185048 192162 Total
Other Pulses
( At 1999-00 Prices)Statement 15 : Statewise Value of Output
Page 32

Central Statistical OrganisationNational Accounts Division
(Rs. lakhs)
State/U.Ts 1999-00 2000-01 2001-02 2002-03 2003-04 2004-05 2005-06
1 Andhra Pradesh 124919 175452 190617 172464 199936 170369 234877
2 Arunachal Pradesh 598 934 1186 1384 1416 1104 1624
3 Assam 11277 11257 20161 16847 9884 10055 9978
4 Bihar 77831 79853 76292 80423 77118 67955 68777
5 Goa 1368 1486 1096 1148 1408 1438 1760
6 Gujarat 69127 40754 65102 64434 92589 73197 83457
7 Haryana 10672 16539 23192 12992 20158 19633 21018
8 Himachal Pradesh 3863 4703 3005 4013 2618 2561 4034
9 Jammu & Kashmir 2696 2438 4132 3141 3401 3820 3458
10 Karnataka 117966 126882 103346 97544 85125 110944 160799
11 Kerala 2890 1703 1797 1015 599 360 965
12 Madhya Pradesh 383338 334615 454454 339077 482704 468188 533643
13 Maharashtra 328280 255815 289348 319952 285054 258187 373835
14 Manipur 586 835 976 1143 551 513 774
15 Meghalaya 558 454 491 498 684 705 705
16 Mizoram 974 470 754 1090 758 750 1230
17 Nagaland 2767 4581 4258 6516 7785 6397 8997
18 Orissa 39623 32413 43838 37889 47055 45196 78618
19 Punjab 6845 7132 7393 7577 8330 7008 6116
20 Rajasthan 132481 139248 228419 79599 300886 197726 192696
21 Sikkim 962 872 973 1331 1234 1242 1181
22 Tamil Nadu 42618 48627 40854 28759 26692 33061 39405
23 Tripura 806 1181 1122 1540 1021 1126 1138
24 Uttar Pradesh 346389 321708 351705 364721 410074 386780 409075
25 West Bengal 32853 39981 33550 28803 38774 30422 36178
26 A & N Islands 24 32 16 180 120 120 120
27 Dadra & Nagar Haveli 666 734 595 874 756 793 822
28 Daman & Diu 198 187 158 158 158 172 158
29 Delhi 25 48 77 56 148 56 87
30 Lakshadweep 0 0 0 0 0 0 0
31 Puducherry 820 859 66 135 143 237 243
32 Chandigarh 2 2 2 2 2 2 2
33 Jharkhand 15933 11629 14260 26964 27322 32979 29252
34 Chattisgarh 51447 32212 54972 49662 67450 46209 69520
35 Uttarakhand 3926 3868 3797 6383 4382 4987 8634
Total 1815327 1699504 2022003 1758315 2206335 1984294 2383176
Statement 9-15 : Statewise Value of Output
( At Current Prices )
Total Pulses
Page 33

Central Statistical OrganisationNational Accounts Division
(Rs. lakhs)
1999-00 2000-01 2001-02 2002-03 2003-04 2004-05 2005-06 State/U.Ts
124919 165517 175952 164449 192118 158351 213763 1 Andhra Pradesh
598 823 949 1093 970 783 1101 2 Arunachal Pradesh
11277 10825 19759 18159 11224 10767 9487 3 Assam
77831 77864 70998 71854 70786 60486 58221 4 Bihar
1368 1467 1096 1140 1398 1429 1748 5 Goa
69127 38177 64481 55914 92483 72058 83528 6 Gujarat
10672 13839 20456 12014 19954 18858 16602 7 Haryana
3863 4606 2911 3892 2498 2495 2251 8 Himachal Pradesh
2696 2389 3014 2332 2542 2852 2529 9 Jammu & Kashmir
117966 135014 100785 93750 79555 110250 135193 10 Karnataka
2890 1637 1689 1017 582 346 939 11 Kerala
383338 269751 380660 280777 411643 395936 382264 12 Madhya Pradesh
328280 251317 281012 317727 292321 244426 290876 13 Maharashtra
586 573 660 862 472 181 635 14 Manipur
558 421 435 428 587 603 603 15 Meghalaya
974 487 715 824 579 596 978 16 Mizoram
2767 4379 3331 5144 6359 5947 8347 17 Nagaland
39623 32330 42788 32632 42660 41007 57181 18 Orissa
6845 6638 6537 6218 5790 4625 3794 19 Punjab
132481 117349 222249 73132 370892 207330 139951 20 Rajasthan
962 818 883 1165 1050 1024 950 21 Sikkim
42618 47364 39635 30635 30647 33157 26777 22 Tamil Nadu
806 1081 1008 1435 949 1020 1032 23 Tripura
346389 303203 328307 299994 322989 316912 302760 24 Uttar Pradesh
32853 35225 28065 26963 33642 24101 25672 25 West Bengal
24 32 16 48 32 32 32 26 A & N Islands
666 734 592 871 753 790 819 27 Dadra & Nagar Haveli
198 161 158 136 136 149 136 28 Daman & Diu
25 55 80 57 137 46 81 29 Delhi
0 0 0 0 0 0 0 30 Lakshadweep
820 765 71 137 193 255 260 31 Puducherry
2 2 2 2 2 2 2 32 Chandigarh
15933 11682 9997 22328 22446 25689 23413 33 Jharkhand
51447 26904 44920 37342 54466 40314 46598 34 Chattisgarh
3926 3436 3339 5327 3300 3946 6327 35 Uttarakhand
1815327 1566868 1857551 1569799 2076153 1786763 1844850 Total
Statement 9-15 : Statewise Value of Output( At 1999-00 Prices)
Total Pulses
Page 34
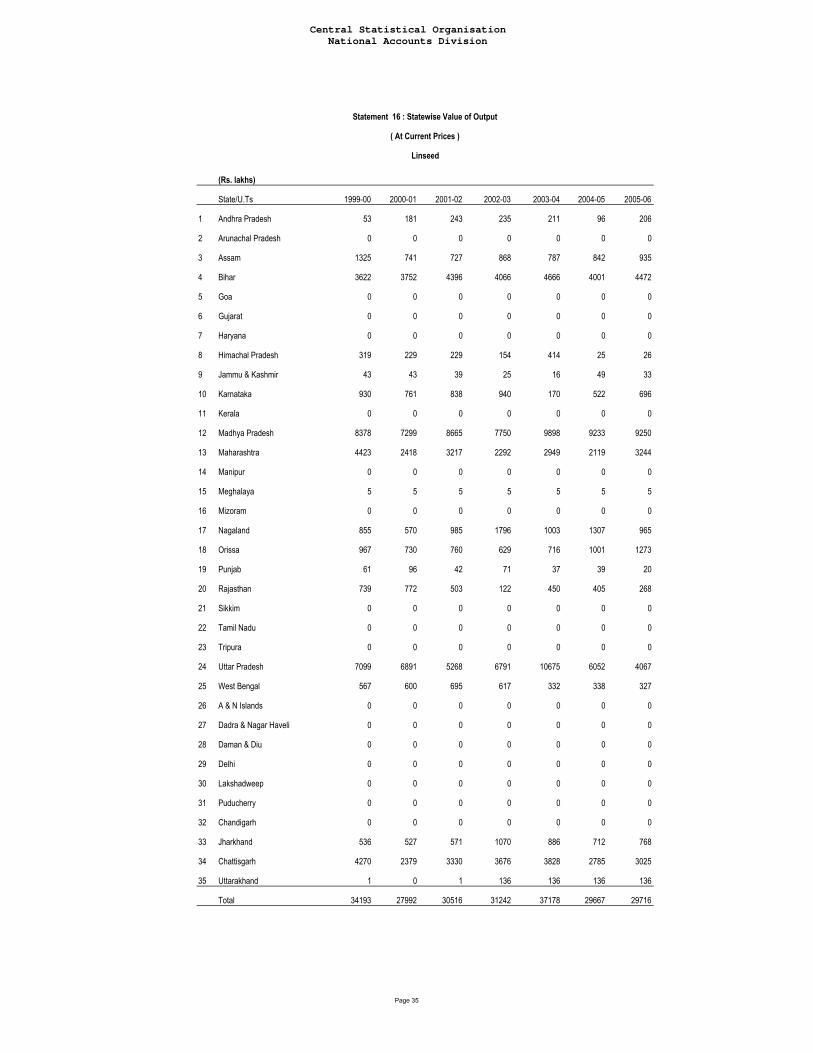
Central Statistical OrganisationNational Accounts Division
(Rs. lakhs)
State/U.Ts 1999-00 2000-01 2001-02 2002-03 2003-04 2004-05 2005-06
1 Andhra Pradesh 53 181 243 235 211 96 206
2 Arunachal Pradesh 0 0 0 0 0 0 0
3 Assam 1325 741 727 868 787 842 935
4 Bihar 3622 3752 4396 4066 4666 4001 4472
5 Goa 0 0 0 0 0 0 0
6 Gujarat 0 0 0 0 0 0 0
7 Haryana 0 0 0 0 0 0 0
8 Himachal Pradesh 319 229 229 154 414 25 26
9 Jammu & Kashmir 43 43 39 25 16 49 33
10 Karnataka 930 761 838 940 170 522 696
11 Kerala 0 0 0 0 0 0 0
12 Madhya Pradesh 8378 7299 8665 7750 9898 9233 9250
13 Maharashtra 4423 2418 3217 2292 2949 2119 3244
14 Manipur 0 0 0 0 0 0 0
15 Meghalaya 5 5 5 5 5 5 5
16 Mizoram 0 0 0 0 0 0 0
17 Nagaland 855 570 985 1796 1003 1307 965
18 Orissa 967 730 760 629 716 1001 1273
19 Punjab 61 96 42 71 37 39 20
20 Rajasthan 739 772 503 122 450 405 268
21 Sikkim 0 0 0 0 0 0 0
22 Tamil Nadu 0 0 0 0 0 0 0
23 Tripura 0 0 0 0 0 0 0
24 Uttar Pradesh 7099 6891 5268 6791 10675 6052 4067
25 West Bengal 567 600 695 617 332 338 327
26 A & N Islands 0 0 0 0 0 0 0
27 Dadra & Nagar Haveli 0 0 0 0 0 0 0
28 Daman & Diu 0 0 0 0 0 0 0
29 Delhi 0 0 0 0 0 0 0
30 Lakshadweep 0 0 0 0 0 0 0
31 Puducherry 0 0 0 0 0 0 0
32 Chandigarh 0 0 0 0 0 0 0
33 Jharkhand 536 527 571 1070 886 712 768
34 Chattisgarh 4270 2379 3330 3676 3828 2785 3025
35 Uttarakhand 1 0 1 136 136 136 136
Total 34193 27992 30516 31242 37178 29667 29716
Linseed
( At Current Prices )
Statement 16 : Statewise Value of Output
Page 35

Central Statistical OrganisationNational Accounts Division
(Rs. lakhs)
1999-00 2000-01 2001-02 2002-03 2003-04 2004-05 2005-06 State/U.Ts
53 180 232 202 163 76 163 1 Andhra Pradesh
0 0 0 0 0 0 0 2 Arunachal Pradesh
1325 1405 1352 1344 1325 1272 1087 3 Assam
3622 4129 4318 3217 3941 3477 3825 4 Bihar
0 0 0 0 0 0 0 5 Goa
0 0 0 0 0 0 0 6 Gujarat
0 0 0 0 0 0 0 7 Haryana
319 203 203 116 290 17 17 8 Himachal Pradesh
43 43 43 23 14 43 29 9 Jammu & Kashmir
930 850 876 812 133 398 531 10 Karnataka
0 0 0 0 0 0 0 11 Kerala
8378 7358 8528 6842 8389 7522 7603 12 Madhya Pradesh
4423 2548 3282 1876 2344 1719 2813 13 Maharashtra
0 0 0 0 0 0 0 14 Manipur
5 5 5 5 5 5 5 15 Meghalaya
0 0 0 0 0 0 0 16 Mizoram
855 570 950 1710 950 1235 912 17 Nagaland
967 730 775 492 657 775 885 18 Orissa
61 91 46 30 30 30 15 19 Punjab
739 739 441 88 327 327 213 20 Rajasthan
0 0 0 0 0 0 0 21 Sikkim
0 0 0 0 0 0 0 22 Tamil Nadu
0 0 0 0 0 0 0 23 Tripura
7099 6814 5213 5009 7873 4466 3000 24 Uttar Pradesh
567 567 666 523 269 283 269 25 West Bengal
0 0 0 0 0 0 0 26 A & N Islands
0 0 0 0 0 0 0 27 Dadra & Nagar Haveli
0 0 0 0 0 0 0 28 Daman & Diu
0 0 0 0 0 0 0 29 Delhi
0 0 0 0 0 0 0 30 Lakshadweep
0 0 0 0 0 0 0 31 Puducherry
0 0 0 0 0 0 0 32 Chandigarh
536 580 580 875 724 580 695 33 Jharkhand
4270 2162 3038 2696 3161 2258 2450 34 Chattisgarh
1 0 1 100 100 100 100 35 Uttarakhand
34193 28974 30548 25960 30697 24585 24613 Total
Linseed
Statement 16 : Statewise Value of Output( At 1999-00 Prices)
Page 36

Central Statistical OrganisationNational Accounts Division
(Rs. lakhs)
State/U.Ts 1999-00 2000-01 2001-02 2002-03 2003-04 2004-05 2005-06
1 Andhra Pradesh 6600 7260 5596 3914 9965 9773 7555
2 Arunachal Pradesh 117 108 141 142 131 134 105
3 Assam 1857 1655 1469 1396 1586 1921 2328
4 Bihar 300 312 356 550 465 480 516
5 Goa 0 0 0 0 0 0 0
6 Gujarat 19621 22339 37008 29961 76639 43300 42514
7 Haryana 386 356 483 1257 299 359 420
8 Himachal Pradesh 525 758 758 686 829 630 649
9 Jammu & Kashmir 266 272 331 344 458 492 204
10 Karnataka 11025 6465 4710 6444 6381 13637 23637
11 Kerala 121 138 71 73 84 7 7
12 Madhya Pradesh 4810 7149 7137 58822 12308 14837 14150
13 Maharashtra 8993 6049 6721 7404 9433 6856 7814
14 Manipur 141 123 33 3 71 83 125
15 Meghalaya 140 175 182 225 210 238 238
16 Mizoram 840 404 360 374 419 482 356
17 Nagaland 432 450 786 896 1000 60 764
18 Orissa 1531 949 1751 1306 1588 2339 2781
19 Punjab 1108 1358 1458 946 741 900 834
20 Rajasthan 3918 7104 18494 2897 39335 47275 16126
21 Sikkim 0 0 0 0 0 0 0
22 Tamil Nadu 9841 8886 7536 5825 6150 6584 6423
23 Tripura 187 220 225 203 178 182 207
24 Uttar Pradesh 5492 5630 6624 5614 10276 9313 8671
25 West Bengal 12189 16660 16902 15794 29502 21244 21066
26 A & N Islands 0 0 0 0 0 0 0
27 Dadra & Nagar Haveli 0 0 0 0 0 0 0
28 Daman & Diu 0 0 0 0 0 0 0
29 Delhi 0 0 0 0 2 2 2
30 Lakshadweep 0 0 0 0 0 0 0
31 Puducherry 16 12 14 55 55 24 24
32 Chandigarh 0 0 0 0 0 0 0
33 Jharkhand 1094 1282 1359 603 431 440 643
34 Chattisgarh 810 776 1468 1280 1286 1956 2099
35 Uttarakhand 125 70 89 213 213 323 281
Total 92484 96959 122064 147226 210034 183870 160536
Statement 17 : Statewise Value of Output
( At Current Prices )
Sesamum
Page 37

Central Statistical OrganisationNational Accounts Division
(Rs. lakhs)
1999-00 2000-01 2001-02 2002-03 2003-04 2004-05 2005-06 State/U.Ts
6600 6461 4637 3134 7468 6600 5037 1 Andhra Pradesh
117 104 130 130 117 117 91 2 Arunachal Pradesh
1857 1904 1880 1880 1880 1763 1810 3 Assam
300 270 300 450 420 405 435 4 Bihar
0 0 0 0 0 0 0 5 Goa
19621 24590 48649 28265 55651 27063 33049 6 Gujarat
386 334 437 1081 257 309 386 7 Haryana
525 735 735 665 700 532 525 8 Himachal Pradesh
266 272 252 262 262 281 116 9 Jammu & Kashmir
11025 8530 5779 6238 5481 11942 18553 10 Karnataka
121 138 52 45 52 35 35 11 Kerala
4810 7250 7197 5237 9071 11668 10350 12 Madhya Pradesh
8993 6883 8580 8259 8718 5965 6653 13 Maharashtra
141 141 47 2 94 94 141 14 Manipur
140 140 140 172 160 180 180 15 Meghalaya
840 400 348 360 400 460 340 16 Mizoram
432 450 720 810 900 54 684 17 Nagaland
1531 1007 1713 1052 1172 1653 1954 18 Orissa
1108 1588 1630 1024 752 857 794 19 Punjab
3918 7961 25779 2845 35237 37109 15672 20 Rajasthan
0 0 0 0 0 0 0 21 Sikkim
9841 9632 6859 4175 4325 5040 4562 22 Tamil Nadu
187 211 211 187 164 164 187 23 Tripura
5492 6100 7887 4770 6081 5511 5131 24 Uttar Pradesh
12189 15224 14977 14762 23587 20634 20304 25 West Bengal
0 0 0 0 0 0 0 26 A & N Islands
0 0 0 0 0 0 0 27 Dadra & Nagar Haveli
0 0 0 0 0 0 0 28 Daman & Diu
0 0 0 0 1 1 1 29 Delhi
0 0 0 0 0 0 0 30 Lakshadweep
16 16 16 47 31 16 16 31 Puducherry
0 0 0 0 0 0 0 32 Chandigarh
1094 1109 1109 420 300 300 435 33 Jharkhand
810 736 1086 1178 1306 1343 1325 34 Chattisgarh
125 81 86 203 203 203 203 35 Uttarakhand
92484 102267 141236 87652 164790 140297 128967 Total
Sesamum
( At 1999-00 Prices)Statement 17 : Statewise Value of Output
Page 38

Central Statistical OrganisationNational Accounts Division
(Rs. lakhs)
State/U.Ts 1999-00 2000-01 2001-02 2002-03 2003-04 2004-05 2005-06
1 Andhra Pradesh 141604 304960 185186 133950 173397 291331 244189
2 Arunachal Pradesh 0 0 0 85 0 67 0
3 Assam 0 0 0 0 0 0 0
4 Bihar 25 26 20 29 29 46 75
5 Goa 278 400 303 520 690 1053 1541
6 Gujarat 98048 101238 346871 181710 727565 319772 548577
7 Haryana 66 61 63 295 171 261 379
8 Himachal Pradesh 112 62 21 27 54 0 0
9 Jammu & Kashmir 0 0 0 6 6 6 6
10 Karnataka 86552 125937 71509 77627 65681 113749 111366
11 Kerala 1098 605 386 456 506 366 517
12 Madhya Pradesh 23367 30399 31461 19424 39043 38106 33729
13 Maharashtra 79883 62463 66318 71937 76218 80173 69295
14 Manipur 0 0 0 0 0 0 0
15 Meghalaya 0 0 0 0 0 0 0
16 Mizoram 0 0 0 0 5 5 5
17 Nagaland 324 1134 238 500 603 806 60
18 Orissa 9962 8245 8435 8009 16043 17613 18613
19 Punjab 699 600 519 509 641 558 465
20 Rajasthan 45515 35908 44379 28280 51119 71385 74202
21 Sikkim 0 0 0 0 0 0 0
22 Tamil Nadu 148146 151399 158776 111924 141221 145649 179593
23 Tripura 224 254 114 215 151 202 179
24 Uttar Pradesh 21212 14942 13033 9460 11204 11678 17070
25 West Bengal 3731 4612 4971 4402 7323 7201 8706
26 A & N Islands 0 0 0 0 0 0 0
27 Dadra & Nagar Haveli 0 0 0 0 0 0 0
28 Daman & Diu 0 0 0 0 0 0 0
29 Delhi 0 0 0 0 0 0 0
30 Lakshadweep 0 0 0 0 0 0 0
31 Puducherry 461 409 347 458 593 735 712
32 Chandigarh 0 0 0 0 0 0 0
33 Jharkhand 795 0 0 2502 2502 2560 2576
34 Chattisgarh 3313 4570 8090 7391 4359 6599 6408
35 Uttarakhand 559 317 150 210 435 383 312
Total 665975 848540 941186 659926 1319561 1110303 1318577
Statement 18 : Statewise Value of Output
( At Current Prices )
Groundnut
Page 39

Central Statistical OrganisationNational Accounts Division
(Rs. lakhs)
1999-00 2000-01 2001-02 2002-03 2003-04 2004-05 2005-06 State/U.Ts
141604 278595 162529 106686 128182 213139 177583 1 Andhra Pradesh
0 0 0 74 0 67 0 2 Arunachal Pradesh
0 0 0 0 0 0 0 3 Assam
25 26 18 26 26 38 64 4 Bihar
278 387 303 520 690 653 956 5 Goa
98048 98864 349907 145187 598610 244385 453075 6 Gujarat
66 53 53 250 145 197 290 7 Haryana
112 56 28 28 56 0 0 8 Himachal Pradesh
0 0 0 6 6 6 6 9 Jammu & Kashmir
86552 121743 65967 60697 48814 83557 75561 10 Karnataka
1098 581 388 388 431 366 517 11 Kerala
23367 27745 29708 16037 30772 29928 28586 12 Madhya Pradesh
79883 65638 68711 62845 61030 64102 57259 13 Maharashtra
0 0 0 0 0 0 0 14 Manipur
0 0 0 0 0 0 0 15 Meghalaya
0 0 0 0 16 16 16 16 Mizoram
324 360 108 225 270 360 27 17 Nagaland
9962 7631 8096 6477 12370 13630 14108 18 Orissa
699 559 573 531 559 503 419 19 Punjab
45515 31030 51076 28499 56963 76683 84269 20 Rajasthan
0 0 0 0 0 0 0 21 Sikkim
148146 152661 140479 80624 103190 112979 123419 22 Tamil Nadu
224 265 109 204 142 183 163 23 Tripura
21212 21662 20269 12044 13348 15595 20336 24 Uttar Pradesh
3731 4351 4538 3854 6176 5825 6770 25 West Bengal
0 0 0 0 0 0 0 26 A & N Islands
0 0 0 0 0 0 0 27 Dadra & Nagar Haveli
0 0 0 0 0 0 0 28 Daman & Diu
0 0 0 0 0 0 0 29 Delhi
0 0 0 0 0 0 0 30 Lakshadweep
461 406 351 377 461 590 572 31 Puducherry
0 0 0 0 0 0 0 32 Chandigarh
795 0 0 2263 2263 2263 2263 33 Jharkhand
3313 3499 4559 4165 3619 4165 3455 34 Chattisgarh
559 317 212 212 423 550 423 35 Uttarakhand
665975 816428 907978 532218 1068560 869782 1050137 Total
Groundnut
Statement 18 : Statewise Value of Output( At 1999-00 Prices)
Page 40

Central Statistical OrganisationNational Accounts Division
(Rs. lakhs)
State/U.Ts 1999-00 2000-01 2001-02 2002-03 2003-04 2004-05 2005-06
1 Andhra Pradesh 200 239 232 231 103 233 439
2 Arunachal Pradesh 2005 2204 2560 2588 3472 3597 3045
3 Assam 15319 18087 17710 18159 24019 24117 16870
4 Bihar 10714 12484 11374 11411 12699 10214 13989
5 Goa 0 0 0 0 0 0 0
6 Gujarat 34013 31089 34104 39070 64739 59508 71587
7 Haryana 68327 64398 98376 117711 159876 133108 130058
8 Himachal Pradesh 2837 3209 2837 2186 2325 1923 1287
9 Jammu & Kashmir 6909 3425 6448 3908 6665 21393 230
10 Karnataka 420 485 374 214 424 503 539
11 Kerala 0 0 0 0 0 0 0
12 Madhya Pradesh 82464 35703 55819 32836 88391 118770 153186
13 Maharashtra 405 258 381 348 462 530 733
14 Manipur 51 90 26 132 0 54 14
15 Meghalaya 322 329 341 350 345 358 366
16 Mizoram 160 180 484 178 169 206 121
17 Nagaland 1820 2080 2480 2853 2042 2880 3392
18 Orissa 502 288 372 339 676 689 887
19 Punjab 8617 7312 6844 9488 11463 11876 12101
20 Rajasthan 294120 157578 242398 192881 484611 614861 651125
21 Sikkim 1252 1112 1215 1362 1470 1554 1445
22 Tamil Nadu 18 18 36 18 18 18 18
23 Tripura 502 547 552 388 547 580 556
24 Uttar Pradesh 117769 111797 113461 132116 145219 137547 165200
25 West Bengal 37830 54834 43955 51158 77520 60618 67164
26 A & N Islands 0 0 0 0 0 0 0
27 Dadra & Nagar Haveli 0 0 0 0 0 0 0
28 Daman & Diu 0 0 0 0 0 0 0
29 Delhi 101 285 853 883 333 1057 474
30 Lakshadweep 0 0 0 0 0 0 0
31 Puducherry 0 0 0 0 0 0 0
32 Chandigarh 1 1 1 1 1 1 1
33 Jharkhand 995 0 254 4709 4709 4761 4172
34 Chattisgarh 3576 2310 3179 2977 4930 4342 3835
35 Uttarakhand 1392 1156 970 1371 2037 1687 1920
Total 692640 511496 647633 629865 1099267 1216982 1304756
( At Current Prices )
Rapeseed & Mustard
Statement 19 : Statewise Value of Output
Page 41

Central Statistical OrganisationNational Accounts Division
(Rs. lakhs)
1999-00 2000-01 2001-02 2002-03 2003-04 2004-05 2005-06 State/U.Ts
200 200 200 200 86 200 400 1 Andhra Pradesh
2005 1957 2185 2138 2062 2071 1748 2 Arunachal Pradesh
15319 16768 16269 15438 16388 15366 11519 3 Assam
10714 12918 11969 9490 10561 9184 11633 4 Bihar
0 0 0 0 0 0 0 5 Goa
34013 34917 33386 27951 49639 50819 57233 6 Gujarat
68327 63619 91409 80040 110816 93476 90731 7 Haryana
2837 3209 2837 2186 2325 2032 1302 8 Himachal Pradesh
6909 3425 5387 3247 5384 16577 178 9 Jammu & Kashmir
420 467 443 265 397 467 467 10 Karnataka
0 0 0 0 0 0 0 11 Kerala
82464 41475 58855 30735 74387 96921 108623 12 Madhya Pradesh
405 275 434 318 434 434 579 13 Maharashtra
51 59 25 84 0 34 8 14 Manipur
322 329 336 327 322 329 336 15 Meghalaya
160 180 440 150 140 170 100 16 Mizoram
1820 2080 2080 2340 1664 2340 2756 17 Nagaland
502 285 368 268 519 502 552 18 Orissa
8617 8754 8289 8207 8480 8330 7386 19 Punjab
294120 155802 228226 140925 322203 461295 524512 20 Rajasthan
1252 1043 1103 1192 1252 1281 1162 21 Sikkim
18 18 36 18 18 18 18 22 Tamil Nadu
502 546 534 371 524 524 502 23 Tripura
117769 105538 98541 81020 89055 89434 101308 24 Uttar Pradesh
37830 56643 45763 44622 56969 46551 52025 25 West Bengal
0 0 0 0 0 0 0 26 A & N Islands
0 0 0 0 0 0 0 27 Dadra & Nagar Haveli
0 0 0 0 0 0 0 28 Daman & Diu
101 397 927 927 286 991 489 29 Delhi
0 0 0 0 0 0 0 30 Lakshadweep
0 0 0 0 0 0 0 31 Puducherry
1 1 1 1 1 1 1 32 Chandigarh
995 0 245 3835 3835 3835 3835 33 Jharkhand
3576 1729 2020 1685 2625 2312 2042 34 Chattisgarh
1392 1174 930 979 1346 1404 1468 35 Uttarakhand
692640 513806 613236 458957 761718 906899 982914 Total
Statement 19 : Statewise Value of Output( At 1999-00 Prices)
Rapeseed & Mustard
Page 42

Central Statistical OrganisationNational Accounts Division
(Rs. lakhs)
State/U.Ts 1999-00 2000-01 2001-02 2002-03 2003-04 2004-05 2005-06
1 Andhra Pradesh 7730 19790 12769 13350 21113 16989 21904
2 Arunachal Pradesh 0 0 0 0 0 0 0
3 Assam 279 199 284 284 284 171 168
4 Bihar 28 22 11 46 31 31 15
5 Goa 0 0 0 0 0 0 0
6 Gujarat 101555 63018 74220 81447 86300 87334 93426
7 Haryana 0 0 0 0 0 0 830
8 Himachal Pradesh 0 0 0 0 0 0 0
9 Jammu & Kashmir 0 0 0 0 0 0 0
10 Karnataka 2515 5204 1834 1769 1742 2397 4071
11 Kerala 0 0 0 0 0 0 0
12 Madhya Pradesh 80 80 98 74 79 79 69
13 Maharashtra 261 437 314 1026 684 410 786
14 Manipur 0 0 0 0 0 0 0
15 Meghalaya 0 5 5 1 1 1 1
16 Mizoram 0 0 0 0 0 0 0
17 Nagaland 0 0 0 0 0 0 0
18 Orissa 1406 865 1238 1093 1255 1266 1327
19 Punjab 0 0 0 0 0 0 0
20 Rajasthan 7340 8347 8748 4132 15945 19016 17722
21 Sikkim 0 0 0 0 0 0 0
22 Tamil Nadu 1268 931 844 679 423 381 404
23 Tripura 0 0 0 0 0 0 0
24 Uttar Pradesh 13 0 13 14 0 0 0
25 West Bengal 0 28 28 30 0 0 0
26 A & N Islands 0 0 0 0 0 0 0
27 Dadra & Nagar Haveli 0 0 0 0 0 0 0
28 Daman & Diu 0 0 0 0 0 0 0
29 Delhi 0 0 0 0 0 0 0
30 Lakshadweep 0 0 0 0 0 0 0
31 Puducherry 0 0 0 0 0 0 0
32 Chandigarh 0 0 0 0 0 0 0
33 Jharkhand 15 0 0 0 0 0 0
34 Chattisgarh 0 4 4 650 2 6 0
35 Uttarakhand 0 0 0 0 0 0 0
Total 122489 98930 100410 104593 127857 128078 140722
Statement 20 : Statewise Value of Output
( At Current Prices )
Castor
Page 43

Central Statistical OrganisationNational Accounts Division
(Rs. lakhs)
1999-00 2000-01 2001-02 2002-03 2003-04 2004-05 2005-06 State/U.Ts
7730 17936 10874 11374 17294 13756 18342 1 Andhra Pradesh
0 0 0 0 0 0 0 2 Arunachal Pradesh
279 195 279 279 279 167 167 3 Assam
28 22 11 32 22 22 11 4 Bihar
0 0 0 0 0 0 0 5 Goa
101555 84082 89677 60972 75878 78992 93253 6 Gujarat
0 0 0 0 0 0 830 7 Haryana
0 0 0 0 0 0 0 8 Himachal Pradesh
0 0 0 0 0 0 0 9 Jammu & Kashmir
2515 4965 2060 2003 1971 2234 3446 10 Karnataka
0 0 0 0 0 0 0 11 Kerala
80 80 80 55 58 58 50 12 Madhya Pradesh
261 562 418 915 653 392 784 13 Maharashtra
0 0 0 0 0 0 0 14 Manipur
0 28 28 3 3 3 3 15 Meghalaya
0 0 0 0 0 0 0 16 Mizoram
0 0 0 0 0 0 0 17 Nagaland
1406 887 1178 811 1102 1163 1115 18 Orissa
0 0 0 0 0 0 0 19 Punjab
7340 8483 12190 4039 16560 19142 24970 20 Rajasthan
0 0 0 0 0 0 0 21 Sikkim
1268 1283 1153 807 418 375 404 22 Tamil Nadu
0 0 0 0 0 0 0 23 Tripura
13 0 13 13 0 0 0 24 Uttar Pradesh
0 28 28 28 0 0 0 25 West Bengal
0 0 0 0 0 0 0 26 A & N Islands
0 0 0 0 0 0 0 27 Dadra & Nagar Haveli
0 0 0 0 0 0 0 28 Daman & Diu
0 0 0 0 0 0 0 29 Delhi
0 0 0 0 0 0 0 30 Lakshadweep
0 0 0 0 0 0 0 31 Puducherry
0 0 0 0 0 0 0 32 Chandigarh
15 0 0 0 0 0 0 33 Jharkhand
0 5 4 736 2 6 0 34 Chattisgarh
0 0 0 0 0 0 0 35 Uttarakhand
122489 118554 117992 82066 114240 116309 143374 Total
Statement 20 : Statewise Value of Output( At 1999-00 Prices)
Castor
Page 44

Central Statistical OrganisationNational Accounts Division
(Rs. lakhs)
State/U.Ts 1999-00 2000-01 2001-02 2002-03 2003-04 2004-05 2005-06
1 Andhra Pradesh 36093 37047 30593 41770 47097 48064 37300
2 Arunachal Pradesh 0 0 0 0 0 0 0
3 Assam 11553 10134 8874 11027 10636 7031 9849
4 Bihar 0 0 0 0 0 0 0
5 Goa 6141 4028 5254 6282 8013 7894 7875
6 Gujarat 3363 3633 3456 4393 5094 4668 5283
7 Haryana 0 0 0 0 0 0 0
8 Himachal Pradesh 0 0 0 0 0 0 0
9 Jammu & Kashmir 0 0 0 0 0 0 0
10 Karnataka 66203 52308 59407 60401 71931 78812 72394
11 Kerala 262191 145652 178615 255395 339135 355133 290344
12 Madhya Pradesh 0 0 0 0 0 0 0
13 Maharashtra 12852 10998 9458 12650 18263 13585 19575
14 Manipur 0 0 0 0 0 0 0
15 Meghalaya 0 0 0 0 0 0 0
16 Mizoram 0 0 14 4 1 1 1
17 Nagaland 0 0 528 532 274 275 275
18 Orissa 7786 6794 8882 13272 19171 21611 19579
19 Punjab 0 0 0 0 0 0 0
20 Rajasthan 0 0 0 0 0 0 0
21 Sikkim 0 0 0 0 0 0 0
22 Tamil Nadu 80384 68712 74788 64969 92709 148336 157319
23 Tripura 419 399 411 420 419 1295 458
24 Uttar Pradesh 0 0 0 0 0 0 0
25 West Bengal 22063 22811 21934 20749 16995 17870 19965
26 A & N Islands 3528 2616 3600 3773 3810 4355 3484
27 Dadra & Nagar Haveli 0 0 0 0 0 0 0
28 Daman & Diu 0 0 0 0 0 0 0
29 Delhi 0 0 0 0 0 0 0
30 Lakshadweep 1145 1133 1658 2090 2701 2701 2701
31 Puducherry 1047 1244 640 861 1702 2118 2110
32 Chandigarh 0 0 0 0 0 0 0
33 Jharkhand 0 0 0 0 0 0 0
34 Chattisgarh 0 0 0 0 0 0 0
35 Uttarakhand 0 0 0 0 0 0 0
Total 514766 367509 408112 498586 637951 713750 648514
Statement 21 : Statewise Value of Output
( At Current Prices )
Coconut
Page 45

Central Statistical OrganisationNational Accounts Division
(Rs. lakhs)
1999-00 2000-01 2001-02 2002-03 2003-04 2004-05 2005-06 State/U.Ts
36093 37496 38604 39758 41006 41154 30609 1 Andhra Pradesh
0 0 0 0 0 0 0 2 Arunachal Pradesh
11553 11558 10467 23563 23106 11884 15781 3 Assam
0 0 0 0 0 0 0 4 Bihar
6141 6318 6318 6162 6171 6237 6330 5 Goa
3363 319 264 271 287 3336 4052 6 Gujarat
0 0 0 0 0 0 0 7 Haryana
0 0 0 0 0 0 0 8 Himachal Pradesh
0 0 0 0 0 0 0 9 Jammu & Kashmir
66203 69791 59543 60401 60554 61448 47908 10 Karnataka
262191 255543 252912 263529 271238 277008 292010 11 Kerala
0 0 0 0 0 0 0 12 Madhya Pradesh
12852 14395 11415 16304 16103 13940 16103 13 Maharashtra
0 0 0 0 0 0 0 14 Manipur
0 0 0 0 0 0 0 15 Meghalaya
0 0 14 4 1 1 1 16 Mizoram
0 0 382 382 191 191 191 17 Nagaland
7786 7772 9927 9794 11605 13093 13093 18 Orissa
0 0 0 0 0 0 0 19 Punjab
0 0 0 0 0 0 0 20 Rajasthan
0 0 0 0 0 0 0 21 Sikkim
80384 82713 85340 74136 66359 106157 126111 22 Tamil Nadu
419 391 391 391 391 1105 391 23 Tripura
0 0 0 0 0 0 0 24 Uttar Pradesh
22063 22485 22560 22055 21600 21151 22010 25 West Bengal
3528 3488 3600 3773 3810 3484 3484 26 A & N Islands
0 0 0 0 0 0 0 27 Dadra & Nagar Haveli
0 0 0 0 0 0 0 28 Daman & Diu
0 0 0 0 0 0 0 29 Delhi
1145 1133 1658 1658 2144 2144 2144 30 Lakshadweep
1047 930 836 902 1156 1054 1050 31 Puducherry
0 0 0 0 0 0 0 32 Chandigarh
0 0 0 0 0 0 0 33 Jharkhand
0 0 0 0 0 0 0 34 Chattisgarh
0 0 0 0 0 0 0 35 Uttarakhand
514766 514330 504231 523084 525722 563389 581269 Total
Statement 21 : Statewise Value of Output( At 1999-00 Prices)
Coconut
Page 46

Central Statistical OrganisationNational Accounts Division
(Rs. lakhs)
State/U.Ts 1999-00 2000-01 2001-02 2002-03 2003-04 2004-05 2005-06
1 Andhra Pradesh 1110 994 1383 1149 1508 1379 1422
2 Arunachal Pradesh 0 0 0 0 0 0 0
3 Assam 985 925 750 907 907 762 553
4 Bihar 114 0 0 0 0 0 0
5 Goa 0 0 0 0 0 0 0
6 Gujarat 0 0 0 0 0 0 0
7 Haryana 0 0 0 0 0 0 0
8 Himachal Pradesh 0 0 0 0 0 0 0
9 Jammu & Kashmir 0 0 0 0 0 0 0
10 Karnataka 1623 1459 988 926 918 1048 1084
11 Kerala 0 0 0 0 0 0 0
12 Madhya Pradesh 3693 2345 3343 2386 4144 3761 3718
13 Maharashtra 3719 2479 2577 2158 3005 4257 2728
14 Manipur 0 0 0 0 0 0 0
15 Meghalaya 0 0 0 0 0 0 0
16 Mizoram 0 0 0 0 0 0 0
17 Nagaland 0 0 85 173 0 0 0
18 Orissa 5877 3705 4626 3441 5297 5532 6304
19 Punjab 0 0 0 0 0 0 0
20 Rajasthan 0 0 0 0 0 0 0
21 Sikkim 0 0 0 0 0 0 0
22 Tamil Nadu 0 0 0 0 0 0 0
23 Tripura 0 0 0 0 0 0 0
24 Uttar Pradesh 0 0 0 0 0 0 0
25 West Bengal 689 772 826 858 1272 1358 957
26 A & N Islands 0 0 0 0 0 0 0
27 Dadra & Nagar Haveli 10 10 10 12 12 12 12
28 Daman & Diu 0 0 0 0 0 0 0
29 Delhi 0 0 0 0 0 0 0
30 Lakshadweep 0 0 0 0 0 0 0
31 Puducherry 0 0 0 0 0 0 0
32 Chandigarh 0 0 0 0 0 0 0
33 Jharkhand 1877 1888 1888 183 141 141 120
34 Chattisgarh 2124 1871 1898 1495 2097 1954 1844
35 Uttarakhand 0 0 0 0 0 0 0
Total 21822 16448 18374 13687 19302 20205 18744
Statement 22 : Statewise Value of Output
( At Current Prices )
Nigerseed
Page 47

Central Statistical OrganisationNational Accounts Division
(Rs. lakhs)
1999-00 2000-01 2001-02 2002-03 2003-04 2004-05 2005-06 State/U.Ts
1110 951 1268 911 1077 1015 951 1 Andhra Pradesh
0 0 0 0 0 0 0 2 Arunachal Pradesh
985 925 985 985 985 886 748 3 Assam
114 0 0 0 0 0 0 4 Bihar
0 0 0 0 0 0 0 5 Goa
0 0 0 0 0 0 0 6 Gujarat
0 0 0 0 0 0 0 7 Haryana
0 0 0 0 0 0 0 8 Himachal Pradesh
0 0 0 0 0 0 0 9 Jammu & Kashmir
1623 1705 1441 1136 1055 1218 1218 10 Karnataka
0 0 0 0 0 0 0 11 Kerala
3693 2345 3343 2386 3221 3194 3194 12 Madhya Pradesh
3719 2558 2853 2755 3345 3345 2755 13 Maharashtra
0 0 0 0 0 0 0 14 Manipur
0 0 0 0 0 0 0 15 Meghalaya
0 0 0 0 0 0 0 16 Mizoram
0 0 60 120 0 0 0 17 Nagaland
5877 3858 4604 2752 4090 4373 4887 18 Orissa
0 0 0 0 0 0 0 19 Punjab
0 0 0 0 0 0 0 20 Rajasthan
0 0 0 0 0 0 0 21 Sikkim
0 0 0 0 0 0 0 22 Tamil Nadu
0 0 0 0 0 0 0 23 Tripura
0 0 0 0 0 0 0 24 Uttar Pradesh
689 729 729 709 985 985 650 25 West Bengal
0 0 0 0 0 0 0 26 A & N Islands
10 10 10 10 10 10 10 27 Dadra & Nagar Haveli
0 0 0 0 0 0 0 28 Daman & Diu
0 0 0 0 0 0 0 29 Delhi
0 0 0 0 0 0 0 30 Lakshadweep
0 0 0 0 0 0 0 31 Puducherry
0 0 0 0 0 0 0 32 Chandigarh
1877 1888 1232 96 74 74 59 33 Jharkhand
2124 1893 2110 1662 1893 1720 1777 34 Chattisgarh
0 0 0 0 0 0 0 35 Uttarakhand
21822 16863 18634 13522 16735 16819 16250 Total
Statement 22 : Statewise Value of Output( At 1999-00 Prices)
Nigerseed
Page 48

Central Statistical OrganisationNational Accounts Division
(Rs. lakhs)
State/U.Ts 1999-00 2000-01 2001-02 2002-03 2003-04 2004-05 2005-06
1 Andhra Pradesh 760 659 651 787 660 1064 1122
2 Arunachal Pradesh 0 0 0 0 0 0 0
3 Assam 0 0 0 0 0 0 0
4 Bihar 34 18 42 9 24 24 24
5 Goa 0 0 0 0 0 0 0
6 Gujarat 0 0 0 0 0 0 0
7 Haryana 0 0 0 0 0 0 0
8 Himachal Pradesh 0 0 0 0 0 0 0
9 Jammu & Kashmir 0 0 0 0 0 0 0
10 Karnataka 8421 6763 7867 8437 6705 7866 8146
11 Kerala 0 0 0 0 0 0 0
12 Madhya Pradesh 14 6 13 13 35 53 53
13 Maharashtra 19014 12439 15751 18906 13987 18752 21237
14 Manipur 0 0 0 0 0 0 0
15 Meghalaya 0 0 0 0 0 0 0
16 Mizoram 0 0 0 0 0 0 0
17 Nagaland 0 0 0 0 0 0 0
18 Orissa 123 207 262 70 122 178 185
19 Punjab 0 0 0 0 0 0 0
20 Rajasthan 0 0 0 0 0 0 0
21 Sikkim 0 0 0 0 0 0 0
22 Tamil Nadu 0 0 0 0 0 0 0
23 Tripura 0 0 0 0 0 0 0
24 Uttar Pradesh 0 0 0 0 0 0 0
25 West Bengal 0 0 0 0 0 0 0
26 A & N Islands 0 0 0 0 0 0 0
27 Dadra & Nagar Haveli 0 0 0 0 0 0 0
28 Daman & Diu 0 0 0 0 0 0 0
29 Delhi 0 0 0 0 0 0 0
30 Lakshadweep 0 0 0 0 0 0 0
31 Puducherry 0 0 0 0 0 0 0
32 Chandigarh 0 0 0 0 0 0 0
33 Jharkhand 5 0 0 32 0 0 0
34 Chattisgarh 27 29 43 40 29 43 42
35 Uttarakhand 0 0 0 0 0 0 0
Total 28397 20121 24631 28294 21562 27981 30809
Statement 23 : Statewise Value of Output
( At Current Prices )
Safflower
Page 49

Central Statistical OrganisationNational Accounts Division
(Rs. lakhs)
1999-00 2000-01 2001-02 2002-03 2003-04 2004-05 2005-06 State/U.Ts
760 625 570 620 475 760 760 1 Andhra Pradesh
0 0 0 0 0 0 0 2 Arunachal Pradesh
0 0 0 0 0 0 0 3 Assam
34 19 39 10 19 19 19 4 Bihar
0 0 0 0 0 0 0 5 Goa
0 0 0 0 0 0 0 6 Gujarat
0 0 0 0 0 0 0 7 Haryana
0 0 0 0 0 0 0 8 Himachal Pradesh
0 0 0 0 0 0 0 9 Jammu & Kashmir
8421 7986 8119 6156 4640 5443 6692 10 Karnataka
0 0 0 0 0 0 0 11 Kerala
14 6 13 13 27 45 45 12 Madhya Pradesh
19014 13255 15102 12604 9453 13038 17276 13 Maharashtra
0 0 0 0 0 0 0 14 Manipur
0 0 0 0 0 0 0 15 Meghalaya
0 0 0 0 0 0 0 16 Mizoram
0 0 0 0 0 0 0 17 Nagaland
123 205 226 51 72 103 82 18 Orissa
0 0 0 0 0 0 0 19 Punjab
0 0 0 0 0 0 0 20 Rajasthan
0 0 0 0 0 0 0 21 Sikkim
0 0 0 0 0 0 0 22 Tamil Nadu
0 0 0 0 0 0 0 23 Tripura
0 0 0 0 0 0 0 24 Uttar Pradesh
0 0 0 0 0 0 0 25 West Bengal
0 0 0 0 0 0 0 26 A & N Islands
0 0 0 0 0 0 0 27 Dadra & Nagar Haveli
0 0 0 0 0 0 0 28 Daman & Diu
0 0 0 0 0 0 0 29 Delhi
0 0 0 0 0 0 0 30 Lakshadweep
0 0 0 0 0 0 0 31 Puducherry
0 0 0 0 0 0 0 32 Chandigarh
5 0 0 29 0 0 0 33 Jharkhand
27 27 41 41 27 40 40 34 Chattisgarh
0 0 0 0 0 0 0 35 Uttarakhand
28397 22123 24111 19525 14712 19448 24915 Total
Safflower
Statement 23 : Statewise Value of Output( At 1999-00 Prices)
Page 50

Central Statistical OrganisationNational Accounts Division
(Rs. lakhs)
State/U.Ts 1999-00 2000-01 2001-02 2002-03 2003-04 2004-05 2005-06
1 Andhra Pradesh 26789 28321 38412 53761 71993 63781 67416
2 Arunachal Pradesh 0 0 52 60 52 52 47
3 Assam 0 0 0 0 0 0 0
4 Bihar 1370 1274 1809 1403 1951 2338 2450
5 Goa 0 0 0 0 0 0 0
6 Gujarat 0 0 0 0 0 0 0
7 Haryana 855 1784 1218 1336 4501 1331 3452
8 Himachal Pradesh 0 0 0 0 0 0 0
9 Jammu & Kashmir 0 0 0 0 0 0 0
10 Karnataka 21106 25486 36245 59582 58629 77462 128470
11 Kerala 0 0 0 0 0 0 0
12 Madhya Pradesh 253 148 135 121 173 175 126
13 Maharashtra 22641 18120 17971 22613 16514 25450 30830
14 Manipur 0 0 0 0 0 0 0
15 Meghalaya 0 0 0 0 0 0 0
16 Mizoram 0 0 0 0 0 0 0
17 Nagaland 577 493 464 1428 1200 1326 169
18 Orissa 470 330 661 282 478 1199 1647
19 Punjab 4161 1182 1187 2332 4832 4199 4362
20 Rajasthan 21 1 2 3 9 10 10
21 Sikkim 0 0 0 0 0 0 0
22 Tamil Nadu 2600 1540 1650 1908 2873 4251 4455
23 Tripura 0 0 0 0 0 0 0
24 Uttar Pradesh 4677 2438 1991 2386 4904 4071 3948
25 West Bengal 12 24 185 570 995 2254 3160
26 A & N Islands 0 0 0 0 0 0 0
27 Dadra & Nagar Haveli 0 0 0 0 0 0 0
28 Daman & Diu 0 0 0 0 0 0 0
29 Delhi 0 0 0 0 0 0 0
30 Lakshadweep 0 0 0 0 0 0 0
31 Puducherry 0 0 0 0 0 0 0
32 Chandigarh 0 0 0 0 0 0 0
33 Jharkhand 32 0 14 37 37 39 41
34 Chattisgarh 84 71 158 134 303 335 210
35 Uttarakhand 57 133 69 51 49 49 49
Total 85704 81345 102222 148008 169494 188320 250840
Statement 24 : Statewise Value of Output
( At Current Prices )
Sunflower
Page 51

Central Statistical OrganisationNational Accounts Division
(Rs. lakhs)
1999-00 2000-01 2001-02 2002-03 2003-04 2004-05 2005-06 State/U.Ts
26789 28305 36898 46502 56105 48861 50208 1 Andhra Pradesh
0 0 47 55 47 47 43 2 Arunachal Pradesh
0 0 0 0 0 0 0 3 Assam
1370 1274 1298 1403 1951 2338 2450 4 Bihar
0 0 0 0 0 0 0 5 Goa
0 0 0 0 0 0 0 6 Gujarat
855 1282 752 735 2625 787 2137 7 Haryana
0 0 0 0 0 0 0 8 Himachal Pradesh
0 0 0 0 0 0 0 9 Jammu & Kashmir
21106 24292 27594 39330 38352 55535 82761 10 Karnataka
0 0 0 0 0 0 0 11 Kerala
253 148 135 121 135 148 108 12 Madhya Pradesh
22641 18842 14129 15388 10761 17927 22167 13 Maharashtra
0 0 0 0 0 0 0 14 Manipur
0 0 0 0 0 0 0 15 Meghalaya
0 0 0 0 0 0 0 16 Mizoram
577 493 240 721 601 661 84 17 Nagaland
470 317 451 165 279 381 495 18 Orissa
4161 1226 1150 1862 3723 3340 3143 19 Punjab
21 1 3 3 10 10 10 20 Rajasthan
0 0 0 0 0 0 0 21 Sikkim
2600 1531 1640 1622 2442 3517 3863 22 Tamil Nadu
0 0 0 0 0 0 0 23 Tripura
4677 2438 2349 2305 4433 3679 3569 24 Uttar Pradesh
12 24 204 386 673 1346 1887 25 West Bengal
0 0 0 0 0 0 0 26 A & N Islands
0 0 0 0 0 0 0 27 Dadra & Nagar Haveli
0 0 0 0 0 0 0 28 Daman & Diu
0 0 0 0 0 0 0 29 Delhi
0 0 0 0 0 0 0 30 Lakshadweep
0 0 0 0 0 0 0 31 Puducherry
0 0 0 0 0 0 0 32 Chandigarh
32 0 6 26 26 26 26 33 Jharkhand
84 67 160 135 283 268 202 34 Chattisgarh
57 133 49 49 49 49 49 35 Uttarakhand
85704 80374 87105 110806 122494 138919 173203 Total
Statement 24 : Statewise Value of Output( At 1999-00 Prices)
Sunflower
Page 52

Central Statistical OrganisationNational Accounts Division
(Rs. lakhs)
State/U.Ts 1999-00 2000-01 2001-02 2002-03 2003-04 2004-05 2005-06
1 Andhra Pradesh 1076 886 1543 3636 10360 11875 19034
2 Arunachal Pradesh 522 609 634 710 729 667 565
3 Assam 0 0 0 0 0 0 0
4 Bihar 0 0 0 0 0 0 0
5 Goa 0 0 0 0 0 0 0
6 Gujarat 671 720 571 1065 1309 809 3267
7 Haryana 0 0 0 0 0 0 0
8 Himachal Pradesh 188 168 168 216 197 10 164
9 Jammu & Kashmir 0 0 0 0 0 0 0
10 Karnataka 5965 6945 4874 6832 5407 16403 13955
11 Kerala 0 0 0 0 0 0 0
12 Madhya Pradesh 398782 334282 387810 342648 685222 542872 608936
13 Maharashtra 130591 119685 132109 197126 303087 250872 289913
14 Manipur 83 86 137 59 75 83 0
15 Meghalaya 140 142 144 163 163 147 164
16 Mizoram 280 320 258 388 443 354 598
17 Nagaland 1400 1650 2813 4200 4500 6048 4032
18 Orissa 0 0 0 0 0 0 0
19 Punjab 0 0 0 0 0 0 0
20 Rajasthan 51803 42991 69084 32337 98573 122447 97693
21 Sikkim 350 373 386 365 387 412 423
22 Tamil Nadu 0 0 0 0 0 0 0
23 Tripura 0 0 0 0 0 0 0
24 Uttar Pradesh 1361 894 768 883 583 292 292
25 West Bengal 38 29 29 34 0 37 38
26 A & N Islands 0 0 0 0 0 0 0
27 Dadra & Nagar Haveli 0 0 0 0 0 0 0
28 Daman & Diu 0 0 0 0 0 0 0
29 Delhi 0 0 0 0 0 0 0
30 Lakshadweep 0 0 0 0 0 0 0
31 Puducherry 0 0 0 0 0 0 0
32 Chandigarh 0 0 0 0 0 0 0
33 Jharkhand 0 0 0 8 8 8 0
34 Chattisgarh 1524 611 769 734 2491 5256 3851
35 Uttarakhand 298 292 829 1483 2965 3168 1724
Total 595072 510685 602926 592886 1116498 961759 1044648
Statement 25 : Statewise Value of Output
( At Current Prices )
Soyabean
Page 53

Central Statistical OrganisationNational Accounts Division
(Rs. lakhs)
1999-00 2000-01 2001-02 2002-03 2003-04 2004-05 2005-06 State/U.Ts
1076 914 1525 3237 8309 9331 14790 1 Andhra Pradesh
522 592 592 663 663 606 508 2 Arunachal Pradesh
0 0 0 0 0 0 0 3 Assam
0 0 0 0 0 0 0 4 Bihar
0 0 0 0 0 0 0 5 Goa
671 797 651 797 972 651 2819 6 Gujarat
0 0 0 0 0 0 0 7 Haryana
188 171 171 188 171 9 137 8 Himachal Pradesh
0 0 0 0 0 0 0 9 Jammu & Kashmir
5965 6546 4030 4788 4541 9975 7118 10 Karnataka
0 0 0 0 0 0 0 11 Kerala
398782 289638 315301 225708 392763 317428 379940 12 Madhya Pradesh
130591 102071 111688 127045 178878 152518 203707 13 Maharashtra
83 86 98 42 49 49 0 14 Manipur
140 140 140 155 155 140 155 15 Meghalaya
280 320 240 360 400 320 540 16 Mizoram
1400 1650 2500 3500 3600 4800 3200 17 Nagaland
0 0 0 0 0 0 0 18 Orissa
0 0 0 0 0 0 0 19 Punjab
51803 39296 61706 20376 59595 76411 73808 20 Rajasthan
350 350 350 319 330 340 340 21 Sikkim
0 0 0 0 0 0 0 22 Tamil Nadu
0 0 0 0 0 0 0 23 Tripura
1361 894 768 748 583 292 292 24 Uttar Pradesh
38 28 28 28 0 29 29 25 West Bengal
0 0 0 0 0 0 0 26 A & N Islands
0 0 0 0 0 0 0 27 Dadra & Nagar Haveli
0 0 0 0 0 0 0 28 Daman & Diu
0 0 0 0 0 0 0 29 Delhi
0 0 0 0 0 0 0 30 Lakshadweep
0 0 0 0 0 0 0 31 Puducherry
0 0 0 0 0 0 0 32 Chandigarh
0 0 0 8 8 8 0 33 Jharkhand
1524 550 694 662 1468 2696 2936 34 Chattisgarh
298 249 722 1079 1743 1909 1245 35 Uttarakhand
595072 444294 501206 389704 654227 577512 691562 Total
Statement 25 : Statewise Value of Output( At 1999-00 Prices)
Soyabean
Page 54

Central Statistical OrganisationNational Accounts Division
(Rs. lakhs)
State/U.Ts 1999-00 2000-01 2001-02 2002-03 2003-04 2004-05 2005-06
1 Andhra Pradesh 1091 1186 1161 527 846 283 63
2 Arunachal Pradesh 0 66 23 71 41 32 31
3 Assam 0 0 0 0 606 0 0
4 Bihar 574 152 12 130 1246 255 269
5 Goa 0 0 42 50 37 53 53
6 Gujarat 2364 829 1313 1486 0 0 982
7 Haryana 0 0 0 0 212 1300 704
8 Himachal Pradesh 184 240 296 281 423 0 0
9 Jammu & Kashmir 0 36 0 0 2 2 2
10 Karnataka 141 44 38 104 40 119 187
11 Kerala 142 0 142 172 0 0 0
12 Madhya Pradesh 906 529 706 2862 766 1116 734
13 Maharashtra 546 383 493 157 1059 1524 1730
14 Manipur 0 0 0 0 0 0 0
15 Meghalaya 0 0 0 0 0 0 0
16 Mizoram 0 0 0 0 0 0 0
17 Nagaland 0 0 0 0 0 0 0
18 Orissa 0 0 0 0 0 0 0
19 Punjab 658 63 70 71 54 70 44
20 Rajasthan 1955 1090 4068 20050 6834 15353 4118
21 Sikkim 0 0 0 0 0 0 0
22 Tamil Nadu 430 421 576 323 364 510 592
23 Tripura 0 0 0 0 0 0 0
24 Uttar Pradesh 0 311 0 0 0 0 0
25 West Bengal 9 16 18 0 209 56 55
26 A & N Islands 0 0 284 4 13 9 9
27 Dadra & Nagar Haveli 0 0 0 0 0 0 0
28 Daman & Diu 0 0 0 0 0 0 0
29 Delhi 0 0 0 0 0 0 0
30 Lakshadweep 0 0 0 0 0 0 0
31 Puducherry 0 0 0 0 0 0 0
32 Chandigarh 3 3 3 3 3 3 3
33 Jharkhand 0 0 0 0 0 0 1
34 Chattisgarh 0 615 770 908 867 826 863
35 Uttarakhand 0 0 0 0 0 0 0
Total 9003 5982 10016 27200 13622 21512 10439
Statement 26 : Statewise Value of Output
( At Current Prices )
Other Oilseed
Page 55

Central Statistical OrganisationNational Accounts Division
(Rs. lakhs)
1999-00 2000-01 2001-02 2002-03 2003-04 2004-05 2005-06 State/U.Ts
1091 1074 989 441 669 215 50 1 Andhra Pradesh
0 63 21 65 37 28 27 2 Arunachal Pradesh
0 0 0 0 760 0 0 3 Assam
574 164 11 104 1058 221 229 4 Bihar
0 0 27 32 24 34 34 5 Goa
2364 1056 1633 1191 0 0 912 6 Gujarat
0 0 0 0 182 962 628 7 Haryana
184 228 281 261 337 0 0 8 Himachal Pradesh
0 36 0 0 1 1 2 9 Jammu & Kashmir
141 52 43 92 34 99 151 10 Karnataka
142 0 103 106 0 0 0 11 Kerala
906 534 703 602 601 898 572 12 Madhya Pradesh
546 415 522 131 864 1151 1463 13 Maharashtra
0 0 0 0 0 0 0 14 Manipur
0 0 0 0 0 0 0 15 Meghalaya
0 0 0 0 0 0 0 16 Mizoram
0 0 0 0 0 0 0 17 Nagaland
0 0 0 0 0 0 0 18 Orissa
658 73 78 74 55 66 42 19 Punjab
1955 1028 3515 14150 4971 11569 3278 20 Rajasthan
0 0 0 0 0 0 0 21 Sikkim
430 468 551 247 262 396 431 22 Tamil Nadu
0 0 0 0 0 0 0 23 Tripura
0 321 0 0 0 0 0 24 Uttar Pradesh
9 15 16 0 167 53 53 25 West Bengal
0 0 44 1 2 1 1 26 A & N Islands
0 0 0 0 0 0 0 27 Dadra & Nagar Haveli
0 0 0 0 0 0 0 28 Daman & Diu
0 0 0 0 0 0 0 29 Delhi
0 0 0 0 0 0 0 30 Lakshadweep
0 0 0 0 0 0 0 31 Puducherry
3 3 3 3 3 3 3 32 Chandigarh
0 0 0 0 0 0 0 33 Jharkhand
0 179 179 179 179 179 179 34 Chattisgarh
0 0 0 0 0 0 0 35 Uttarakhand
9003 5706 8720 17677 10205 15876 8054 Total
Statement 26 : Statewise Value of Output( At 1999-00 Prices)
Other Oilseed
Page 56

Central Statistical OrganisationNational Accounts Division
(Rs. lakhs)
State/U.Ts 1999-00 2000-01 2001-02 2002-03 2003-04 2004-05 2005-06
1 Andhra Pradesh 223106 401523 277768 253311 337252 444869 400650
2 Arunachal Pradesh 2643 2987 3410 3656 4424 4548 3793
3 Assam 31317 31741 29816 32641 38826 34843 30703
4 Bihar 16781 18039 18019 17644 21111 17389 21811
5 Goa 6419 4428 5599 6852 8739 9000 9468
6 Gujarat 259635 222866 497543 339132 961648 515391 765636
7 Haryana 69634 66599 100139 120598 165059 136359 135844
8 Himachal Pradesh 4165 4665 4309 3550 4241 2587 2127
9 Jammu & Kashmir 7218 3776 6818 4283 7148 21943 475
10 Karnataka 204900 231856 188685 223276 218029 312515 364545
11 Kerala 263552 146395 179214 256095 339725 355506 290868
12 Madhya Pradesh 522747 417941 495187 466936 840061 729003 823951
13 Maharashtra 283330 235730 255310 336616 445660 404529 447884
14 Manipur 275 299 196 193 146 220 138
15 Meghalaya 607 655 676 744 723 749 773
16 Mizoram 1280 904 1116 943 1038 1049 1082
17 Nagaland 5408 6377 8378 12376 10621 12701 9657
18 Orissa 28625 22112 26988 28442 45347 51428 52596
19 Punjab 15304 10611 10120 13418 17768 17642 17825
20 Rajasthan 405410 253791 387677 280700 696878 890751 861265
21 Sikkim 1602 1485 1601 1727 1857 1966 1868
22 Tamil Nadu 242686 231906 244206 185645 243757 305729 348804
23 Tripura 1332 1420 1301 1226 1295 2258 1400
24 Uttar Pradesh 157623 142903 141157 157265 182861 168951 199248
25 West Bengal 77129 100386 89541 94212 134147 110977 121439
26 A & N Islands 3528 2616 3884 3777 3822 4364 3493
27 Dadra & Nagar Haveli 10 10 10 12 12 12 12
28 Daman & Diu 0 0 0 0 0 0 0
29 Delhi 101 285 853 883 335 1059 476
30 Lakshadweep 1145 1133 1658 2090 2701 2701 2701
31 Puducherry 1524 1665 1001 1374 2350 2876 2846
32 Chandigarh 3 3 3 3 3 3 3
33 Jharkhand 5349 3697 4087 9144 8713 8661 8320
34 Chattisgarh 15726 13237 19710 19284 20193 24103 22177
35 Uttarakhand 2431 1968 2108 3463 5834 5746 4423
Total 2862544 2586007 3008090 2881513 4772327 4602427 4958302
Statement 16-26 : Statewise Value of Output
( At Current Prices )
Total Oilseed
Page 57

Central Statistical OrganisationNational Accounts Division
(Rs. lakhs)
1999-00 2000-01 2001-02 2002-03 2003-04 2004-05 2005-06 State/U.Ts
223106 372736 258327 213065 260836 335106 298894 1 Andhra Pradesh
2643 2716 2976 3125 2926 2937 2416 2 Arunachal Pradesh
31317 32754 31231 43487 44722 31339 31112 3 Assam
16781 18822 17963 14730 17997 15704 18666 4 Bihar
6419 6705 6647 6714 6885 6924 7319 5 Goa
259635 244624 524167 264634 781039 405246 644393 6 Gujarat
69634 65288 92651 82106 114025 95730 95002 7 Haryana
4165 4602 4255 3444 3879 2590 1981 8 Himachal Pradesh
7218 3776 5682 3538 5668 16909 331 9 Jammu & Kashmir
204900 246926 175896 181919 165971 232315 244406 10 Karnataka
263552 256263 253455 264068 271720 277409 292561 11 Kerala
522747 376580 423863 287737 519423 467810 539072 12 Madhya Pradesh
283330 227442 237135 248438 292584 274532 331559 13 Maharashtra
275 286 171 128 143 177 149 14 Manipur
607 641 648 662 645 657 679 15 Meghalaya
1280 900 1043 874 957 967 997 16 Mizoram
5408 5603 7041 9809 8176 9642 7854 17 Nagaland
28625 22692 27338 21862 31866 35673 37171 18 Orissa
15304 12292 11766 11728 13600 13126 11799 19 Punjab
405410 244339 382935 210924 495867 682545 726733 20 Rajasthan
1602 1393 1453 1511 1581 1621 1502 21 Sikkim
242686 248305 236058 161628 177013 228481 258808 22 Tamil Nadu
1332 1411 1244 1153 1221 1976 1243 23 Tripura
157623 143767 135039 105910 121373 118977 133636 24 Uttar Pradesh
77129 100093 89508 86967 110426 96858 103998 25 West Bengal
3528 3488 3644 3773 3812 3485 3485 26 A & N Islands
10 10 10 10 10 10 10 27 Dadra & Nagar Haveli
0 0 0 0 0 0 0 28 Daman & Diu
101 397 927 927 288 992 490 29 Delhi
1145 1133 1658 1658 2144 2144 2144 30 Lakshadweep
1524 1352 1202 1326 1649 1660 1638 31 Puducherry
3 3 3 3 3 3 3 32 Chandigarh
5349 3577 3171 7552 7230 7086 7313 33 Jharkhand
15726 10847 13890 13139 14563 14988 14406 34 Chattisgarh
2431 1954 2000 2620 3863 4214 3487 35 Uttarakhand
2862544 2663719 2954998 2261171 3484102 3389835 3825259 Total
( At 1999-00 Prices)Statement 16-26 : Statewise Value of Output
Total Oilseed
Page 58

Central Statistical OrganisationNational Accounts Division
(Rs. lakhs)
State/U.Ts 1999-00 2000-01 2001-02 2002-03 2003-04 2004-05 2005-06
1 Andhra Pradesh 148010 150031 152627 123647 140310 164366 199409
2 Arunachal Pradesh 178 158 208 1836 198 378 236
3 Assam 12333 10799 12443 10891 12304 14509 14764
4 Bihar 33569 34004 46290 34763 47320 43287 60725
5 Goa 479 522 574 532 461 485 447
6 Gujarat 160533 156442 162556 143549 171919 235668 263263
7 Haryana 76822 82115 92586 101780 105892 90810 103213
8 Himachal Pradesh 1705 1569 1856 1491 1535 2020 1393
9 Jammu & Kashmir 39 5 54 76 76 62 79
10 Karnataka 304979 470796 315426 292374 157389 163103 258904
11 Kerala 5543 2718 3104 3500 3207 3232 10539
12 Madhya Pradesh 13584 11872 12488 11274 13689 18616 23987
13 Maharashtra 393205 389907 356290 292097 223222 227013 452132
14 Manipur 292 338 325 323 326 383 381
15 Meghalaya 12 13 9 9 9 9 9
16 Mizoram 48 108 261 364 370 147 137
17 Nagaland 225 23 30 1298 2154 2365 3510
18 Orissa 12970 10921 7426 9046 8873 10205 14739
19 Punjab 67098 79727 99821 100196 72549 58404 61800
20 Rajasthan 8024 6227 4957 4568 3173 3371 6274
21 Sikkim 0 0 0 0 0 0 0
22 Tamil Nadu 223433 246123 268085 203987 165585 234284 377454
23 Tripura 653 698 702 1146 993 1247 1251
24 Uttar Pradesh 903410 960011 1059088 1088913 1056552 1425463 1615634
25 West Bengal 21773 17364 24163 14433 14554 13920 21865
26 A & N Islands 105 129 71 397 103 14 21
27 Dadra & Nagar Haveli 0 0 0 0 0 0 0
28 Daman & Diu 0 0 0 0 0 0 0
29 Delhi 0 0 2 2 31 4 4
30 Lakshadweep 0 0 0 0 0 0 0
31 Puducherry 1758 1631 1428 1802 1784 1095 1353
32 Chandigarh 0 0 0 0 0 0 0
33 Jharkhand 897 1508 1515 1380 1334 1546 1891
34 Chattisgarh 744 65 83 155 155 173 150
35 Uttarakhand 56948 67223 68010 70333 69366 69451 72487
Total 2449368 2703047 2692480 2516164 2275433 2785629 3568052
Statement 27 : Statewise Value of Output
( At Current Prices )
Sugarcane & Gur
Page 59

Central Statistical OrganisationNational Accounts Division
(Rs. lakhs)
1999-00 2000-01 2001-02 2002-03 2003-04 2004-05 2005-06 State/U.Ts
148010 143373 146013 119464 122885 128020 145249 1 Andhra Pradesh
178 158 208 168 312 299 186 2 Arunachal Pradesh
12333 10549 10996 9917 10713 9606 9472 3 Assam
33569 33548 44089 37746 45386 43156 48167 4 Bihar
479 456 502 431 403 424 391 5 Goa
160533 156449 146703 137558 119983 157795 157868 6 Gujarat
76822 82202 92877 108865 108988 79910 79424 7 Haryana
1705 1569 1856 1491 1535 1617 1150 8 Himachal Pradesh
39 39 54 76 76 61 77 9 Jammu & Kashmir
304979 352420 267648 259060 124662 109386 146717 10 Karnataka
5543 2590 2629 3266 3031 3044 9914 11 Kerala
13584 11872 11554 11906 13908 21663 25869 12 Madhya Pradesh
393205 366759 333991 315323 199640 176937 287473 13 Maharashtra
292 330 292 284 287 295 292 14 Manipur
12 12 8 8 8 8 8 15 Meghalaya
48 96 221 290 292 150 141 16 Mizoram
225 18 23 45 68 68 99 17 Nagaland
12970 10491 6997 8154 9303 9316 11661 18 Orissa
67098 77139 91713 92265 66242 51433 48225 19 Punjab
8024 6017 4637 4639 3056 2890 5249 20 Rajasthan
0 0 0 0 0 0 0 21 Sikkim
223433 231672 233157 170491 123740 155625 214459 22 Tamil Nadu
653 689 671 714 604 667 670 23 Tripura
903410 882518 981638 1006296 938225 987793 1044013 24 Uttar Pradesh
21773 17693 24096 15085 14836 12285 15004 25 West Bengal
105 116 59 329 91 50 75 26 A & N Islands
0 0 0 0 0 0 0 27 Dadra & Nagar Haveli
0 0 0 0 0 0 0 28 Daman & Diu
0 0 0 0 3 3 3 29 Delhi
0 0 0 0 0 0 0 30 Lakshadweep
1758 1483 1259 1550 1535 942 1164 31 Puducherry
0 0 0 0 0 0 0 32 Chandigarh
897 1313 1313 1273 1230 1282 1286 33 Jharkhand
744 61 73 72 72 72 72 34 Chattisgarh
56948 61181 41437 43234 43961 35545 33640 35 Uttarakhand
2449368 2452814 2446715 2350001 1955074 1990342 2288018 Total
( At 1999-00 Prices)
Sugarcane & Gur
Statement 27 : Statewise Value of Output
Page 60

Central Statistical OrganisationNational Accounts Division
(Rs. lakhs)
State/U.Ts 1999-00 2000-01 2001-02 2002-03 2003-04 2004-05 2005-06
1 Andhra Pradesh 689 698 693 3 2 482 464
2 Arunachal Pradesh 0 0 0 0 0 0 0
3 Assam 0 0 0 0 0 0 0
4 Bihar 0 0 0 0 0 0 0
5 Goa 0 0 0 0 0 0 0
6 Gujarat 0 0 0 0 0 0 0
7 Haryana 0 0 0 0 0 0 0
8 Himachal Pradesh 0 0 0 0 0 0 0
9 Jammu & Kashmir 0 0 0 0 0 0 0
10 Karnataka 736 610 419 474 147 270 350
11 Kerala 6311 291 291 8 8 8 8
12 Madhya Pradesh 0 0 0 0 0 0 0
13 Maharashtra 0 0 0 0 0 0 0
14 Manipur 0 0 0 0 0 0 0
15 Meghalaya 0 0 0 0 0 0 0
16 Mizoram 0 0 0 0 0 0 0
17 Nagaland 0 0 0 0 0 0 0
18 Orissa 0 0 0 0 0 0 0
19 Punjab 0 0 0 0 0 0 0
20 Rajasthan 0 0 0 0 0 0 0
21 Sikkim 0 0 0 0 0 0 0
22 Tamil Nadu 9724 10376 10974 10254 11006 12733 13208
23 Tripura 0 0 0 0 0 0 0
24 Uttar Pradesh 0 0 0 0 0 0 0
25 West Bengal 0 0 0 0 0 0 0
26 A & N Islands 0 0 0 0 0 0 0
27 Dadra & Nagar Haveli 0 0 0 0 0 0 0
28 Daman & Diu 0 0 0 0 0 0 0
29 Delhi 0 0 0 0 0 0 0
30 Lakshadweep 0 0 0 0 0 0 0
31 Puducherry 57 59 61 70 94 66 58
32 Chandigarh 0 0 0 0 0 0 0
33 Jharkhand 0 0 0 0 0 0 0
34 Chattisgarh 0 0 0 0 0 0 0
35 Uttarakhand 0 0 0 0 0 0 0
Total 17516 12033 12438 10810 11258 13559 14088
Statement 28 : Statewise Value of Output
( At Current Prices )
Other Sugar
Page 61

Central Statistical OrganisationNational Accounts Division
(Rs. lakhs)
1999-00 2000-01 2001-02 2002-03 2003-04 2004-05 2005-06 State/U.Ts
689 667 663 3 2 375 338 1 Andhra Pradesh
0 0 0 0 0 0 0 2 Arunachal Pradesh
0 0 0 0 0 0 0 3 Assam
0 0 0 0 0 0 0 4 Bihar
0 0 0 0 0 0 0 5 Goa
0 0 0 0 0 0 0 6 Gujarat
0 0 0 0 0 0 0 7 Haryana
0 0 0 0 0 0 0 8 Himachal Pradesh
0 0 0 0 0 0 0 9 Jammu & Kashmir
736 456 355 420 116 181 198 10 Karnataka
6311 291 291 8 8 8 8 11 Kerala
0 0 0 0 0 0 0 12 Madhya Pradesh
0 0 0 0 0 0 0 13 Maharashtra
0 0 0 0 0 0 0 14 Manipur
0 0 0 0 0 0 0 15 Meghalaya
0 0 0 0 0 0 0 16 Mizoram
0 0 0 0 0 0 0 17 Nagaland
0 0 0 0 0 0 0 18 Orissa
0 0 0 0 0 0 0 19 Punjab
0 0 0 0 0 0 0 20 Rajasthan
0 0 0 0 0 0 0 21 Sikkim
9724 9767 9544 8570 8225 8458 7504 22 Tamil Nadu
0 0 0 0 0 0 0 23 Tripura
0 0 0 0 0 0 0 24 Uttar Pradesh
0 0 0 0 0 0 0 25 West Bengal
0 0 0 0 0 0 0 26 A & N Islands
0 0 0 0 0 0 0 27 Dadra & Nagar Haveli
0 0 0 0 0 0 0 28 Daman & Diu
0 0 0 0 0 0 0 29 Delhi
0 0 0 0 0 0 0 30 Lakshadweep
57 53 54 61 81 57 50 31 Puducherry
0 0 0 0 0 0 0 32 Chandigarh
0 0 0 0 0 0 0 33 Jharkhand
0 0 0 0 0 0 0 34 Chattisgarh
0 0 0 0 0 0 0 35 Uttarakhand
17516 11234 10907 9062 8432 9079 8099 Total
Other Sugar
Statement 28 : Statewise Value of Output( At 1999-00 Prices)
Page 62

Central Statistical OrganisationNational Accounts Division
(Rs. lakhs)
State/U.Ts 1999-00 2000-01 2001-02 2002-03 2003-04 2004-05 2005-06
1 Andhra Pradesh 148698 150729 153320 123651 140312 164848 199873
2 Arunachal Pradesh 178 158 208 1836 198 378 236
3 Assam 12333 10799 12443 10891 12304 14509 14764
4 Bihar 33569 34004 46290 34763 47320 43287 60725
5 Goa 479 522 574 532 461 485 447
6 Gujarat 160533 156442 162556 143549 171919 235668 263263
7 Haryana 76822 82115 92586 101780 105892 90810 103213
8 Himachal Pradesh 1705 1569 1856 1491 1535 2020 1393
9 Jammu & Kashmir 39 5 54 76 76 62 79
10 Karnataka 305715 471406 315845 292848 157536 163373 259254
11 Kerala 11854 3009 3395 3509 3216 3241 10547
12 Madhya Pradesh 13584 11872 12488 11274 13689 18616 23987
13 Maharashtra 393205 389907 356290 292097 223222 227013 452132
14 Manipur 292 338 325 323 326 383 381
15 Meghalaya 12 13 9 9 9 9 9
16 Mizoram 48 108 261 364 370 147 137
17 Nagaland 225 23 30 1298 2154 2365 3510
18 Orissa 12970 10921 7426 9046 8873 10205 14739
19 Punjab 67098 79727 99821 100196 72549 58404 61800
20 Rajasthan 8024 6227 4957 4568 3173 3371 6274
21 Sikkim 0 0 0 0 0 0 0
22 Tamil Nadu 233157 256499 279059 214241 176591 247017 390661
23 Tripura 653 698 702 1146 993 1247 1251
24 Uttar Pradesh 903410 960011 1059088 1088913 1056552 1425463 1615634
25 West Bengal 21773 17364 24163 14433 14554 13920 21865
26 A & N Islands 105 129 71 397 103 14 21
27 Dadra & Nagar Haveli 0 0 0 0 0 0 0
28 Daman & Diu 0 0 0 0 0 0 0
29 Delhi 0 0 2 2 31 4 4
30 Lakshadweep 0 0 0 0 0 0 0
31 Puducherry 1815 1690 1489 1872 1878 1160 1411
32 Chandigarh 0 0 0 0 0 0 0
33 Jharkhand 897 1508 1515 1380 1334 1546 1891
34 Chattisgarh 744 65 83 155 155 173 150
35 Uttarakhand 56948 67223 68010 70333 69366 69451 72487
Total 2466884 2715080 2704917 2526974 2286690 2799188 3582140
Statement 27-28 : Statewise Value of Output
( At Current Prices )
Total Sugar
Page 63

Central Statistical OrganisationNational Accounts Division
(Rs. lakhs)
1999-00 2000-01 2001-02 2002-03 2003-04 2004-05 2005-06 State/U.Ts
148698 144040 146676 119467 122887 128395 145587 1 Andhra Pradesh
178 158 208 168 312 299 186 2 Arunachal Pradesh
12333 10549 10996 9917 10713 9606 9472 3 Assam
33569 33548 44089 37746 45386 43156 48167 4 Bihar
479 456 502 431 403 424 391 5 Goa
160533 156449 146703 137558 119983 157795 157868 6 Gujarat
76822 82202 92877 108865 108988 79910 79424 7 Haryana
1705 1569 1856 1491 1535 1617 1150 8 Himachal Pradesh
39 39 54 76 76 61 77 9 Jammu & Kashmir
305715 352876 268003 259480 124779 109567 146915 10 Karnataka
11854 2881 2920 3274 3040 3053 9923 11 Kerala
13584 11872 11554 11906 13908 21663 25869 12 Madhya Pradesh
393205 366759 333991 315323 199640 176937 287473 13 Maharashtra
292 330 292 284 287 295 292 14 Manipur
12 12 8 8 8 8 8 15 Meghalaya
48 96 221 290 292 150 141 16 Mizoram
225 18 23 45 68 68 99 17 Nagaland
12970 10491 6997 8154 9303 9316 11661 18 Orissa
67098 77139 91713 92265 66242 51433 48225 19 Punjab
8024 6017 4637 4639 3056 2890 5249 20 Rajasthan
0 0 0 0 0 0 0 21 Sikkim
233157 241439 242701 179061 131965 164083 221963 22 Tamil Nadu
653 689 671 714 604 667 670 23 Tripura
903410 882518 981638 1006296 938225 987793 1044013 24 Uttar Pradesh
21773 17693 24096 15085 14836 12285 15004 25 West Bengal
105 116 59 329 91 50 75 26 A & N Islands
0 0 0 0 0 0 0 27 Dadra & Nagar Haveli
0 0 0 0 0 0 0 28 Daman & Diu
0 0 0 0 3 3 3 29 Delhi
0 0 0 0 0 0 0 30 Lakshadweep
1815 1536 1313 1611 1616 999 1214 31 Puducherry
0 0 0 0 0 0 0 32 Chandigarh
897 1313 1313 1273 1230 1282 1286 33 Jharkhand
744 61 73 72 72 72 72 34 Chattisgarh
56948 61181 41437 43234 43961 35545 33640 35 Uttarakhand
2466884 2464048 2457623 2359063 1963506 1999421 2296118 Total
Statement 27-28 : Statewise Value of Output( At 1999-00 Prices)
Total Sugar
Page 64

Central Statistical OrganisationNational Accounts Division
(Rs. lakhs)
State/U.Ts 1999-00 2000-01 2001-02 2002-03 2003-04 2004-05 2005-06
1 Andhra Pradesh 213093 165662 185650 119217 236555 212877 210780
2 Arunachal Pradesh 0 0 0 0 0 0 0
3 Assam 162 157 152 152 152 98 88
4 Bihar 0 0 23 23 23 0 0
5 Goa 0 0 0 0 0 0 0
6 Gujarat 213093 127674 135454 202220 491804 515868 661733
7 Haryana 113508 138403 68838 105332 171725 201896 146894
8 Himachal Pradesh 22 22 25 25 0 25 27
9 Jammu & Kashmir 10 49 49 0 0 0 0
10 Karnataka 62801 85534 48826 33386 26520 54855 57274
11 Kerala 825 633 363 673 575 418 333
12 Madhya Pradesh 39365 25808 35777 40872 79188 73353 83162
13 Maharashtra 325265 192323 270311 268195 317900 334507 284765
14 Manipur 22 21 36 0 0 0 0
15 Meghalaya 280 393 405 402 402 406 406
16 Mizoram 204 122 128 140 176 176 27
17 Nagaland 41 61 441 760 30 30 259
18 Orissa 6359 7187 5947 5684 10303 11025 16283
19 Punjab 80197 117598 122875 117195 180497 191134 237033
20 Rajasthan 88618 71286 24739 25360 91117 66898 77631
21 Sikkim 0 0 0 0 0 0 0
22 Tamil Nadu 29621 27862 25776 7481 12031 14183 17900
23 Tripura 156 204 301 279 297 262 279
24 Uttar Pradesh 1081 909 1222 1015 976 1185 1208
25 West Bengal 285 411 636 211 401 225 918
26 A & N Islands 0 0 0 0 0 0 0
27 Dadra & Nagar Haveli 0 0 0 0 0 0 0
28 Daman & Diu 0 0 0 0 0 0 0
29 Delhi 7 0 0 0 0 0 0
30 Lakshadweep 0 0 0 0 0 0 0
31 Puducherry 184 263 251 140 149 377 39
32 Chandigarh 0 0 0 0 0 0 0
33 Jharkhand 0 0 0 0 0 0 0
34 Chattisgarh 0 15 15 67 11 89 44
35 Uttarakhand 10 0 2 5 0 0 0
Total 1175206 962596 928240 928832 1620832 1679887 1797083
Statement 29 : Statewise Value of Output
( At Current Prices )
Kapas
Page 65

Central Statistical OrganisationNational Accounts Division
(Rs. lakhs)
1999-00 2000-01 2001-02 2002-03 2003-04 2004-05 2005-06 State/U.Ts
213093 166397 191306 109584 192754 218921 209350 1 Andhra Pradesh
0 0 0 0 0 0 0 2 Arunachal Pradesh
162 165 37 37 37 24 22 3 Assam
0 0 3 3 3 0 0 4 Bihar
0 0 0 0 0 0 0 5 Goa
213093 127373 167293 187097 399921 550288 672543 6 Gujarat
113508 120385 62847 90354 122300 180620 130482 7 Haryana
22 22 22 22 0 22 22 8 Himachal Pradesh
10 49 49 0 0 0 0 9 Jammu & Kashmir
62801 80823 57877 31273 24997 59021 52357 10 Karnataka
825 665 418 589 503 471 375 11 Kerala
39365 23126 37204 36808 60293 60591 70304 12 Madhya Pradesh
325265 189197 282295 272471 323271 308472 331667 13 Maharashtra
22 22 38 0 0 0 0 14 Manipur
280 392 402 397 397 397 397 15 Meghalaya
204 122 102 102 133 133 20 16 Mizoram
41 41 296 510 20 20 173 17 Nagaland
6359 6808 5703 5202 9195 11593 15096 18 Orissa
80197 101005 110103 91233 124508 175811 201757 19 Punjab
88618 72519 25283 22726 63839 68845 79281 20 Rajasthan
0 0 0 0 0 0 0 21 Sikkim
29621 27623 28451 7285 10705 16218 18610 22 Tamil Nadu
156 203 297 250 266 235 250 23 Tripura
1081 864 953 792 756 918 936 24 Uttar Pradesh
285 385 641 214 399 218 855 25 West Bengal
0 0 0 0 0 0 0 26 A & N Islands
0 0 0 0 0 0 0 27 Dadra & Nagar Haveli
0 0 0 0 0 0 0 28 Daman & Diu
7 0 0 0 0 0 0 29 Delhi
0 0 0 0 0 0 0 30 Lakshadweep
184 235 224 163 173 296 31 31 Puducherry
0 0 0 0 0 0 0 32 Chandigarh
0 0 0 0 0 0 0 33 Jharkhand
0 14 14 60 10 80 40 34 Chattisgarh
10 0 1 4 0 0 0 35 Uttarakhand
1175206 918434 971860 857176 1334481 1653194 1784569 Total
Statement 29 : Statewise Value of Output( At 1999-00 Prices)
Kapas
Page 66

Central Statistical OrganisationNational Accounts Division
(Rs. lakhs)
State/U.Ts 1999-00 2000-01 2001-02 2002-03 2003-04 2004-05 2005-06
1 Andhra Pradesh 0 0 0 0 0 0 0
2 Arunachal Pradesh 0 0 0 0 0 0 0
3 Assam 9045 8474 11138 9342 7914 6175 11773
4 Bihar 14969 15600 13641 14018 16523 19914 21284
5 Goa 0 0 0 0 0 0 0
6 Gujarat 0 0 0 0 0 0 0
7 Haryana 0 0 0 0 0 0 0
8 Himachal Pradesh 0 0 0 0 0 0 0
9 Jammu & Kashmir 0 0 0 0 0 0 0
10 Karnataka 0 0 0 0 0 0 0
11 Kerala 0 0 0 0 0 0 0
12 Madhya Pradesh 0 0 0 0 0 0 0
13 Maharashtra 0 0 0 0 0 0 0
14 Manipur 3 0 0 0 0 0 0
15 Meghalaya 409 445 316 451 450 388 682
16 Mizoram 0 0 0 0 0 0 0
17 Nagaland 5 7 10 117 129 161 252
18 Orissa 623 599 653 885 320 453 547
19 Punjab 0 0 0 0 0 0 0
20 Rajasthan 0 0 0 0 0 0 0
21 Sikkim 0 0 0 0 0 0 0
22 Tamil Nadu 0 0 0 0 0 0 0
23 Tripura 85 170 167 164 159 156 167
24 Uttar Pradesh 0 0 0 0 0 0 0
25 West Bengal 120239 102998 139574 126797 114986 123015 102498
26 A & N Islands 0 0 0 0 0 0 0
27 Dadra & Nagar Haveli 0 0 0 0 0 0 0
28 Daman & Diu 0 0 0 0 0 0 0
29 Delhi 0 0 0 0 0 0 0
30 Lakshadweep 0 0 0 0 0 0 0
31 Puducherry 0 0 0 0 0 0 0
32 Chandigarh 0 0 0 0 0 0 0
33 Jharkhand 45 21 25 25 25 18 32
34 Chattisgarh 0 0 0 0 0 0 0
35 Uttarakhand 0 0 0 0 0 0 0
Total 145424 128313 165524 151799 140507 150281 137234
Statement 30 : Statewise Value of Output
( At Current Prices )
Jute
Page 67

Central Statistical OrganisationNational Accounts Division
(Rs. lakhs)
1999-00 2000-01 2001-02 2002-03 2003-04 2004-05 2005-06 State/U.Ts
0 0 0 0 0 0 0 1 Andhra Pradesh
0 0 0 0 0 0 0 2 Arunachal Pradesh
9045 8946 9038 9252 8904 5495 7751 3 Assam
14969 15498 13621 13308 15685 16732 17752 4 Bihar
0 0 0 0 0 0 0 5 Goa
0 0 0 0 0 0 0 6 Gujarat
0 0 0 0 0 0 0 7 Haryana
0 0 0 0 0 0 0 8 Himachal Pradesh
0 0 0 0 0 0 0 9 Jammu & Kashmir
0 0 0 0 0 0 0 10 Karnataka
0 0 0 0 0 0 0 11 Kerala
0 0 0 0 0 0 0 12 Madhya Pradesh
0 0 0 0 0 0 0 13 Maharashtra
3 0 0 0 0 0 0 14 Manipur
409 461 323 461 459 260 457 15 Meghalaya
0 0 0 0 0 0 0 16 Mizoram
5 5 5 55 61 67 105 17 Nagaland
623 580 601 814 291 393 392 18 Orissa
0 0 0 0 0 0 0 19 Punjab
0 0 0 0 0 0 0 20 Rajasthan
0 0 0 0 0 0 0 21 Sikkim
0 0 0 0 0 0 0 22 Tamil Nadu
85 157 149 140 137 134 143 23 Tripura
0 0 0 0 0 0 0 24 Uttar Pradesh
120239 117622 139913 134677 132480 124345 126502 25 West Bengal
0 0 0 0 0 0 0 26 A & N Islands
0 0 0 0 0 0 0 27 Dadra & Nagar Haveli
0 0 0 0 0 0 0 28 Daman & Diu
0 0 0 0 0 0 0 29 Delhi
0 0 0 0 0 0 0 30 Lakshadweep
0 0 0 0 0 0 0 31 Puducherry
0 0 0 0 0 0 0 32 Chandigarh
45 21 21 21 21 15 15 33 Jharkhand
0 0 0 0 0 0 0 34 Chattisgarh
0 0 0 0 0 0 0 35 Uttarakhand
145424 143289 163671 158728 158037 147442 153117 Total
( At 1999-00 Prices)
Jute
Statement 30 : Statewise Value of Output
Page 68

Central Statistical OrganisationNational Accounts Division
(Rs. lakhs)
State/U.Ts 1999-00 2000-01 2001-02 2002-03 2003-04 2004-05 2005-06
1 Andhra Pradesh 2 2 4 2 1 6 6
2 Arunachal Pradesh 0 0 0 0 0 0 0
3 Assam 0 0 0 0 0 0 0
4 Bihar 218 286 286 330 220 385 266
5 Goa 0 0 0 0 0 0 0
6 Gujarat 319 319 319 319 319 319 319
7 Haryana 10 10 11 11 10 0 13
8 Himachal Pradesh 0 9 9 9 8 8 9
9 Jammu & Kashmir 25 25 25 182 12 0 12
10 Karnataka 9 37 59 10 11 11 0
11 Kerala 0 0 0 0 0 0 0
12 Madhya Pradesh 328 207 308 293 325 299 267
13 Maharashtra 189 168 99 154 71 82 94
14 Manipur 0 0 0 0 0 0 0
15 Meghalaya 0 0 0 0 0 0 0
16 Mizoram 0 0 0 0 0 0 0
17 Nagaland 0 0 0 0 0 0 0
18 Orissa 491 419 481 852 1021 998 664
19 Punjab 22 43 43 6 11 11 11
20 Rajasthan 102 58 281 47 156 108 106
21 Sikkim 0 0 0 0 0 0 0
22 Tamil Nadu 467 829 527 265 179 118 291
23 Tripura 0 0 0 0 0 0 0
24 Uttar Pradesh 274 301 301 185 360 223 223
25 West Bengal 550 494 513 489 2059 356 2305
26 A & N Islands 0 0 0 0 0 0 0
27 Dadra & Nagar Haveli 0 0 0 0 0 0 0
28 Daman & Diu 0 0 0 0 0 0 0
29 Delhi 0 0 0 0 0 0 0
30 Lakshadweep 0 0 0 0 0 0 0
31 Puducherry 0 0 0 0 0 0 0
32 Chandigarh 0 0 0 0 0 0 0
33 Jharkhand 66 0 0 0 0 0 0
34 Chattisgarh 92 75 75 75 95 79 90
35 Uttarakhand 1 0 1 1 1 1 1
Total 3165 3283 3342 3230 4860 3004 4678
( At Current Prices )
Sanhemp
Statement 31 : Statewise Value of Output
Page 69

Central Statistical OrganisationNational Accounts Division
(Rs. lakhs)
1999-00 2000-01 2001-02 2002-03 2003-04 2004-05 2005-06 State/U.Ts
2 2 3 2 1 1 1 1 Andhra Pradesh
0 0 0 0 0 0 0 2 Arunachal Pradesh
0 0 0 0 0 0 0 3 Assam
218 284 284 328 218 382 262 4 Bihar
0 0 0 0 0 0 0 5 Goa
319 319 319 319 319 319 319 6 Gujarat
10 10 10 10 10 0 10 7 Haryana
0 8 8 8 5 5 5 8 Himachal Pradesh
25 25 25 182 12 0 12 9 Jammu & Kashmir
9 35 56 9 10 10 0 10 Karnataka
0 0 0 0 0 0 0 11 Kerala
328 207 241 220 252 232 207 12 Madhya Pradesh
189 168 158 231 105 105 105 13 Maharashtra
0 0 0 0 0 0 0 14 Manipur
0 0 0 0 0 0 0 15 Meghalaya
0 0 0 0 0 0 0 16 Mizoram
0 0 0 0 0 0 0 17 Nagaland
491 383 383 439 470 545 560 18 Orissa
22 43 43 6 11 11 11 19 Punjab
102 51 157 29 128 77 77 20 Rajasthan
0 0 0 0 0 0 0 21 Sikkim
467 678 432 217 146 97 238 22 Tamil Nadu
0 0 0 0 0 0 0 23 Tripura
274 301 301 115 186 115 115 24 Uttar Pradesh
550 550 488 459 2459 506 2459 25 West Bengal
0 0 0 0 0 0 0 26 A & N Islands
0 0 0 0 0 0 0 27 Dadra & Nagar Haveli
0 0 0 0 0 0 0 28 Daman & Diu
0 0 0 0 0 0 0 29 Delhi
0 0 0 0 0 0 0 30 Lakshadweep
0 0 0 0 0 0 0 31 Puducherry
0 0 0 0 0 0 0 32 Chandigarh
66 0 0 0 0 0 0 33 Jharkhand
92 75 75 75 95 79 90 34 Chattisgarh
1 0 1 1 1 1 1 35 Uttarakhand
3165 3141 2982 2650 4428 2485 4471 Total
Statement 31 : Statewise Value of Output( At 1999-00 Prices)
Sanhemp
Page 70

Central Statistical OrganisationNational Accounts Division
(Rs. lakhs)
State/U.Ts 1999-00 2000-01 2001-02 2002-03 2003-04 2004-05 2005-06
1 Andhra Pradesh 5100 7007 7616 6983 5929 8008 8211
2 Arunachal Pradesh 0 0 0 0 0 0 0
3 Assam 296 251 256 301 325 364 532
4 Bihar 2096 3071 1439 1684 1945 2130 1285
5 Goa 0 0 0 0 0 0 0
6 Gujarat 0 0 0 0 0 0 0
7 Haryana 0 0 0 0 0 0 0
8 Himachal Pradesh 0 0 0 0 0 0 0
9 Jammu & Kashmir 0 0 0 0 0 0 0
10 Karnataka 75 132 102 84 68 45 30
11 Kerala 0 0 0 0 0 0 0
12 Madhya Pradesh 74 24 15 12 20 21 15
13 Maharashtra 218 186 170 151 198 241 237
14 Manipur 0 0 0 0 0 0 0
15 Meghalaya 174 193 228 204 203 295 313
16 Mizoram 0 0 0 0 0 0 0
17 Nagaland 0 0 0 0 0 0 0
18 Orissa 1544 1338 1553 2363 3591 2913 2330
19 Punjab 0 0 0 0 0 0 0
20 Rajasthan 0 1 4 1 1 1 1
21 Sikkim 0 0 0 0 0 0 0
22 Tamil Nadu 39 115 56 136 122 38 11
23 Tripura 125 141 204 138 128 135 136
24 Uttar Pradesh 0 0 0 0 0 0 0
25 West Bengal 1211 1080 1336 785 892 1360 2902
26 A & N Islands 0 0 0 0 0 0 0
27 Dadra & Nagar Haveli 0 0 0 0 0 0 0
28 Daman & Diu 0 0 0 0 0 0 0
29 Delhi 0 0 0 0 0 0 0
30 Lakshadweep 0 0 0 0 0 0 0
31 Puducherry 0 0 0 0 0 0 0
32 Chandigarh 0 0 0 0 0 0 0
33 Jharkhand 81 99 117 117 74 77 90
34 Chattisgarh 243 28 43 31 25 26 30
35 Uttarakhand 0 0 0 0 0 0 0
Total 11275 13666 13138 12990 13521 15653 16122
Mesta
Statement 32 : Statewise Value of Output
( At Current Prices )
Page 71

Central Statistical OrganisationNational Accounts Division
(Rs. lakhs)
1999-00 2000-01 2001-02 2002-03 2003-04 2004-05 2005-06 State/U.Ts
5100 5623 5496 5017 3848 3748 3724 1 Andhra Pradesh
0 0 0 0 0 0 0 2 Arunachal Pradesh
296 280 273 284 307 289 281 3 Assam
2096 2901 1240 1417 1636 1732 1037 4 Bihar
0 0 0 0 0 0 0 5 Goa
0 0 0 0 0 0 0 6 Gujarat
0 0 0 0 0 0 0 7 Haryana
0 0 0 0 0 0 0 8 Himachal Pradesh
0 0 0 0 0 0 0 9 Jammu & Kashmir
75 114 88 71 103 68 46 10 Karnataka
0 0 0 0 0 0 0 11 Kerala
74 12 9 7 11 10 8 12 Madhya Pradesh
218 188 177 145 131 172 174 13 Maharashtra
0 0 0 0 0 0 0 14 Manipur
174 185 212 178 177 164 175 15 Meghalaya
0 0 0 0 0 0 0 16 Mizoram
0 0 0 0 0 0 0 17 Nagaland
1544 1239 1296 1154 1298 1249 1156 18 Orissa
0 0 0 0 0 0 0 19 Punjab
0 0 2 0 0 0 0 20 Rajasthan
0 0 0 0 0 0 0 21 Sikkim
39 641 311 756 678 214 59 22 Tamil Nadu
125 124 151 135 125 132 133 23 Tripura
0 0 0 0 0 0 0 24 Uttar Pradesh
1211 1239 1353 1076 1464 1212 1857 25 West Bengal
0 0 0 0 0 0 0 26 A & N Islands
0 0 0 0 0 0 0 27 Dadra & Nagar Haveli
0 0 0 0 0 0 0 28 Daman & Diu
0 0 0 0 0 0 0 29 Delhi
0 0 0 0 0 0 0 30 Lakshadweep
0 0 0 0 0 0 0 31 Puducherry
0 0 0 0 0 0 0 32 Chandigarh
81 93 93 93 59 61 59 33 Jharkhand
243 154 18 13 16 13 20 34 Chattisgarh
0 0 0 0 0 0 0 35 Uttarakhand
11275 12792 10719 10348 9855 9065 8728 Total
Statement 32 : Statewise Value of Output( At 1999-00 Prices)
Mesta
Page 72

Central Statistical OrganisationNational Accounts Division
(Rs. lakhs)
State/U.Ts 1999-00 2000-01 2001-02 2002-03 2003-04 2004-05 2005-06
1 Andhra Pradesh 260 307 373 494 362 253 1535
2 Arunachal Pradesh 0 0 0 0 0 0 0
3 Assam 0 0 0 0 1053 0 0
4 Bihar 7 25 3 475 25 22 16
5 Goa 0 0 0 0 0 0 0
6 Gujarat 1196 248 179 200 2203 2203 862
7 Haryana 50 81 92 36 0 0 47
8 Himachal Pradesh 0 0 1411 1411 1268 0 0
9 Jammu & Kashmir 0 0 0 0 0 0 0
10 Karnataka 0 0 0 0 0 0 0
11 Kerala 0 0 0 0 0 0 0
12 Madhya Pradesh 18 7 9 4 4 4 5
13 Maharashtra 3 2 14 14 18 19 13
14 Manipur 0 0 0 0 0 0 0
15 Meghalaya 0 0 0 0 0 0 0
16 Mizoram 0 0 0 0 0 0 0
17 Nagaland 0 0 0 0 0 0 0
18 Orissa 0 0 0 0 0 0 0
19 Punjab 77 52 52 129 72 26 188
20 Rajasthan 319 391 1776 114 537 349 285
21 Sikkim 0 0 0 0 0 0 0
22 Tamil Nadu 203 305 274 330 23 1 1
23 Tripura 0 0 0 0 0 0 0
24 Uttar Pradesh 9 0 0 0 0 0 0
25 West Bengal 0 0 0 0 0 0 0
26 A & N Islands 0 0 0 0 0 0 0
27 Dadra & Nagar Haveli 0 0 0 0 0 0 0
28 Daman & Diu 0 0 0 0 0 0 0
29 Delhi 0 0 0 0 0 0 0
30 Lakshadweep 0 0 0 0 0 0 0
31 Puducherry 0 0 0 0 0 0 0
32 Chandigarh 0 0 0 0 0 0 0
33 Jharkhand 0 0 0 0 0 0 0
34 Chattisgarh 86 17 21 20 22 21 20
35 Uttarakhand 0 0 0 0 0 0 0
Total 2228 1435 4202 3229 5587 2896 2971
Statement 33 : Statewise Value of Output
( At Current Prices )
Other Fibres
Page 73

Central Statistical OrganisationNational Accounts Division
(Rs. lakhs)
1999-00 2000-01 2001-02 2002-03 2003-04 2004-05 2005-06 State/U.Ts
260 246 269 355 235 118 696 1 Andhra Pradesh
0 0 0 0 0 0 0 2 Arunachal Pradesh
0 0 0 0 995 0 0 3 Assam
7 24 2 412 21 19 13 4 Bihar
0 0 0 0 0 0 0 5 Goa
1196 386 355 355 355 355 139 6 Gujarat
50 81 81 34 0 0 36 7 Haryana
0 0 1276 1276 723 0 0 8 Himachal Pradesh
0 0 0 0 0 0 0 9 Jammu & Kashmir
0 0 0 0 0 0 0 10 Karnataka
0 0 0 0 0 0 0 11 Kerala
18 6 7 3 3 3 4 12 Madhya Pradesh
3 2 17 18 16 16 11 13 Maharashtra
0 0 0 0 0 0 0 14 Manipur
0 0 0 0 0 0 0 15 Meghalaya
0 0 0 0 0 0 0 16 Mizoram
0 0 0 0 0 0 0 17 Nagaland
0 0 0 0 0 0 0 18 Orissa
77 52 52 125 70 25 182 19 Punjab
319 339 993 71 438 247 206 20 Rajasthan
0 0 0 0 0 0 0 21 Sikkim
203 425 348 801 62 1 1 22 Tamil Nadu
0 0 0 0 0 0 0 23 Tripura
9 0 0 0 0 0 0 24 Uttar Pradesh
0 0 0 0 0 0 0 25 West Bengal
0 0 0 0 0 0 0 26 A & N Islands
0 0 0 0 0 0 0 27 Dadra & Nagar Haveli
0 0 0 0 0 0 0 28 Daman & Diu
0 0 0 0 0 0 0 29 Delhi
0 0 0 0 0 0 0 30 Lakshadweep
0 0 0 0 0 0 0 31 Puducherry
0 0 0 0 0 0 0 32 Chandigarh
0 0 0 0 0 0 0 33 Jharkhand
86 17 17 17 17 17 17 34 Chattisgarh
0 0 0 0 0 0 0 35 Uttarakhand
2228 1581 3419 3468 2937 802 1305 Total
Other Fibres
Statement 33 : Statewise Value of Output( At 1999-00 Prices)
Page 74

Central Statistical OrganisationNational Accounts Division
(Rs. lakhs)
State/U.Ts 1999-00 2000-01 2001-02 2002-03 2003-04 2004-05 2005-06
1 Andhra Pradesh 218455 172978 193642 126697 242847 221143 220533
2 Arunachal Pradesh 0 0 0 0 0 0 0
3 Assam 9503 8883 11545 9795 9444 6636 12393
4 Bihar 17290 18982 15392 16531 18735 22451 22850
5 Goa 0 0 0 0 0 0 0
6 Gujarat 214609 128241 135952 202739 494326 518390 662914
7 Haryana 113568 138494 68941 105378 171735 201896 146953
8 Himachal Pradesh 22 31 1446 1446 1276 34 35
9 Jammu & Kashmir 34 74 74 182 12 0 12
10 Karnataka 62884 85703 48987 33480 26600 54911 57304
11 Kerala 825 633 363 673 575 418 333
12 Madhya Pradesh 39785 26047 36109 41180 79537 73676 83450
13 Maharashtra 325675 192680 270593 268514 318187 334849 285109
14 Manipur 25 21 36 0 0 0 0
15 Meghalaya 863 1030 949 1057 1055 1088 1400
16 Mizoram 204 122 128 140 176 176 27
17 Nagaland 46 67 451 877 160 191 511
18 Orissa 9018 9543 8634 9784 15235 15390 19825
19 Punjab 80296 117693 122970 117329 180580 191171 237232
20 Rajasthan 89039 71736 26799 25522 91810 67356 78022
21 Sikkim 0 0 0 0 0 0 0
22 Tamil Nadu 30329 29111 26633 8212 12355 14341 18202
23 Tripura 367 515 672 581 584 553 582
24 Uttar Pradesh 1364 1210 1523 1200 1336 1408 1431
25 West Bengal 122285 104982 142058 128282 118339 124956 108622
26 A & N Islands 0 0 0 0 0 0 0
27 Dadra & Nagar Haveli 0 0 0 0 0 0 0
28 Daman & Diu 0 0 0 0 0 0 0
29 Delhi 7 0 0 0 0 0 0
30 Lakshadweep 0 0 0 0 0 0 0
31 Puducherry 184 263 251 140 149 377 39
32 Chandigarh 0 0 0 0 0 0 0
33 Jharkhand 192 119 142 142 99 96 122
34 Chattisgarh 420 136 153 192 153 214 184
35 Uttarakhand 10 0 2 6 1 1 1
Total 1337298 1109293 1114446 1100080 1785306 1851721 1958088
Statement 29-33 : Statewise Value of Output
( At Current Prices )
Total Fibres
Page 75

Central Statistical OrganisationNational Accounts Division
(Rs. lakhs)
1999-00 2000-01 2001-02 2002-03 2003-04 2004-05 2005-06 State/U.Ts
218455 172267 197073 114958 196838 222789 213771 1 Andhra Pradesh
0 0 0 0 0 0 0 2 Arunachal Pradesh
9503 9390 9348 9573 10243 5808 8054 3 Assam
17290 18707 15151 15468 17564 18865 19064 4 Bihar
0 0 0 0 0 0 0 5 Goa
214609 128078 167967 187771 400595 550962 673001 6 Gujarat
113568 120476 62939 90398 122310 180620 130528 7 Haryana
22 30 1306 1306 728 27 27 8 Himachal Pradesh
34 74 74 182 12 0 12 9 Jammu & Kashmir
62884 80972 58021 31353 25111 59099 52403 10 Karnataka
825 665 418 589 503 471 375 11 Kerala
39785 23352 37460 37037 60560 60836 70523 12 Madhya Pradesh
325675 189556 282647 272866 323522 308765 331958 13 Maharashtra
25 22 38 0 0 0 0 14 Manipur
863 1037 937 1036 1033 821 1028 15 Meghalaya
204 122 102 102 133 133 20 16 Mizoram
46 46 301 565 81 87 278 17 Nagaland
9018 9010 7983 7609 11254 13780 17204 18 Orissa
80296 101100 110198 91364 124589 175847 201950 19 Punjab
89039 72909 26435 22827 64405 69169 79564 20 Rajasthan
0 0 0 0 0 0 0 21 Sikkim
30329 29367 29542 9059 11593 16530 18908 22 Tamil Nadu
367 484 597 526 528 500 526 23 Tripura
1364 1165 1254 907 942 1034 1052 24 Uttar Pradesh
122285 119796 142395 136425 136801 126282 131672 25 West Bengal
0 0 0 0 0 0 0 26 A & N Islands
0 0 0 0 0 0 0 27 Dadra & Nagar Haveli
0 0 0 0 0 0 0 28 Daman & Diu
7 0 0 0 0 0 0 29 Delhi
0 0 0 0 0 0 0 30 Lakshadweep
184 235 224 163 173 296 31 31 Puducherry
0 0 0 0 0 0 0 32 Chandigarh
192 114 114 114 79 76 74 33 Jharkhand
420 261 124 165 139 189 167 34 Chattisgarh
10 0 2 4 1 1 1 35 Uttarakhand
1337298 1079235 1152651 1032369 1509738 1812987 1952191 Total
Total Fibres
( At 1999-00 Prices)Statement 29-33 : Statewise Value of Output
Page 76

Central Statistical OrganisationNational Accounts Division
(Rs. lakhs)
State/U.Ts 1999-00 2000-01 2001-02 2002-03 2003-04 2004-05 2005-06
1 Andhra Pradesh 0 0 0 0 0 0 0
2 Arunachal Pradesh 0 0 0 0 0 0 0
3 Assam 0 0 0 0 0 0 0
4 Bihar 0 0 0 0 0 0 0
5 Goa 0 0 0 0 0 0 0
6 Gujarat 0 0 0 0 0 0 0
7 Haryana 123 74 104 168 152 152 175
8 Himachal Pradesh 67 205 205 205 205 205 205
9 Jammu & Kashmir 205 205 205 0 0 0 0
10 Karnataka 0 0 0 0 0 0 0
11 Kerala 0 0 0 0 0 0 0
12 Madhya Pradesh 0 0 0 0 0 0 0
13 Maharashtra 0 0 0 0 0 0 0
14 Manipur 0 0 0 0 0 0 0
15 Meghalaya 0 0 0 0 0 0 0
16 Mizoram 0 0 0 0 0 0 0
17 Nagaland 0 0 0 0 0 0 0
18 Orissa 0 0 0 0 0 0 0
19 Punjab 0 0 0 0 0 0 0
20 Rajasthan 1345 1549 1680 1818 6666 6332 6254
21 Sikkim 0 0 0 0 0 0 0
22 Tamil Nadu 41 0 0 0 0 0 0
23 Tripura 0 0 0 0 0 0 0
24 Uttar Pradesh 0 0 0 0 0 0 0
25 West Bengal 0 0 0 0 0 0 0
26 A & N Islands 0 0 0 0 0 0 0
27 Dadra & Nagar Haveli 0 0 0 0 0 0 0
28 Daman & Diu 0 0 0 0 0 0 0
29 Delhi 0 0 0 0 0 0 0
30 Lakshadweep 0 0 0 0 0 0 0
31 Puducherry 0 0 0 0 0 0 0
32 Chandigarh 0 0 0 0 0 0 0
33 Jharkhand 0 0 0 0 0 0 0
34 Chattisgarh 0 0 0 0 0 0 0
35 Uttarakhand 0 0 0 0 0 0 0
Total 1781 2033 2195 2191 7023 6689 6635
Statement 34 : Statewise Value of Output
( At Current Prices )
Indigo, Dyes & Tanning Materials
Page 77

Central Statistical OrganisationNational Accounts Division
(Rs. lakhs)
1999-00 2000-01 2001-02 2002-03 2003-04 2004-05 2005-06 State/U.Ts
0 0 0 0 0 0 0 1 Andhra Pradesh
0 0 0 0 0 0 0 2 Arunachal Pradesh
0 0 0 0 0 0 0 3 Assam
0 0 0 0 0 0 0 4 Bihar
0 0 0 0 0 0 0 5 Goa
0 0 0 0 0 0 0 6 Gujarat
123 77 104 158 143 143 143 7 Haryana
67 205 205 205 205 205 205 8 Himachal Pradesh
205 205 205 0 0 0 0 9 Jammu & Kashmir
0 0 0 0 0 0 0 10 Karnataka
0 0 0 0 0 0 0 11 Kerala
0 0 0 0 0 0 0 12 Madhya Pradesh
0 0 0 0 0 0 0 13 Maharashtra
0 0 0 0 0 0 0 14 Manipur
0 0 0 0 0 0 0 15 Meghalaya
0 0 0 0 0 0 0 16 Mizoram
0 0 0 0 0 0 0 17 Nagaland
0 0 0 0 0 0 0 18 Orissa
0 0 0 0 0 0 0 19 Punjab
1345 1524 1647 1688 1829 2170 2296 20 Rajasthan
0 0 0 0 0 0 0 21 Sikkim
41 0 0 0 0 0 0 22 Tamil Nadu
0 0 0 0 0 0 0 23 Tripura
0 0 0 0 0 0 0 24 Uttar Pradesh
0 0 0 0 0 0 0 25 West Bengal
0 0 0 0 0 0 0 26 A & N Islands
0 0 0 0 0 0 0 27 Dadra & Nagar Haveli
0 0 0 0 0 0 0 28 Daman & Diu
0 0 0 0 0 0 0 29 Delhi
0 0 0 0 0 0 0 30 Lakshadweep
0 0 0 0 0 0 0 31 Puducherry
0 0 0 0 0 0 0 32 Chandigarh
0 0 0 0 0 0 0 33 Jharkhand
0 0 0 0 0 0 0 34 Chattisgarh
0 0 0 0 0 0 0 35 Uttarakhand
1781 2012 2162 2051 2177 2518 2644 Total
Statement 34 : Statewise Value of Output( At 1999-00 Prices)
Indigo, Dyes & Tanning Materials
Page 78

Central Statistical OrganisationNational Accounts Division
(Rs. lakhs)
State/U.Ts 1999-00 2000-01 2001-02 2002-03 2003-04 2004-05 2005-06
1 Andhra Pradesh 0 0 0 0 0 0 0
2 Arunachal Pradesh 0 163 91 74 88 63 756
3 Assam 144350 208512 216330 224306 163267 172153 189348
4 Bihar 0 0 0 0 0 0 0
5 Goa 0 0 0 0 0 0 0
6 Gujarat 0 0 0 0 0 0 0
7 Haryana 0 0 0 0 0 0 0
8 Himachal Pradesh 232 281 281 477 725 747 520
9 Jammu & Kashmir 0 0 0 0 0 0 0
10 Karnataka 909 960 1001 1060 957 1080 1018
11 Kerala 21993 15482 14793 12351 12049 18846 19063
12 Madhya Pradesh 0 0 0 0 0 0 0
13 Maharashtra 0 0 0 0 0 0 0
14 Manipur 0 0 0 0 0 0 0
15 Meghalaya 0 108 257 278 339 341 41
16 Mizoram 0 0 0 0 0 0 0
17 Nagaland 37 216 255 264 334 351 86
18 Orissa 0 0 0 0 0 0 39
19 Punjab 0 0 0 0 0 0 0
20 Rajasthan 0 0 0 0 0 0 0
21 Sikkim 0 0 0 0 0 0 0
22 Tamil Nadu 26777 23975 24287 35091 28692 47441 36092
23 Tripura 705 705 1065 1007 1024 1005 1134
24 Uttar Pradesh 0 0 0 0 0 0 0
25 West Bengal 108987 113354 139541 70169 74462 82847 87190
26 A & N Islands 0 0 0 0 0 0 0
27 Dadra & Nagar Haveli 0 0 0 0 0 0 0
28 Daman & Diu 0 0 0 0 0 0 0
29 Delhi 0 0 0 0 0 0 0
30 Lakshadweep 0 0 0 0 0 0 0
31 Puducherry 0 0 0 0 0 0 0
32 Chandigarh 0 0 0 0 0 0 0
33 Jharkhand 0 0 0 0 0 0 0
34 Chattisgarh 0 0 0 0 0 0 0
35 Uttarakhand 144 31 39 65 127 110 210
Total 304133 363788 397939 345143 282065 324984 335496
Statement 35 : Statewise Value of Output
( At Current Prices )
Tea
Page 79

Central Statistical OrganisationNational Accounts Division
(Rs. lakhs)
1999-00 2000-01 2001-02 2002-03 2003-04 2004-05 2005-06 State/U.Ts
0 0 0 0 0 0 0 1 Andhra Pradesh
0 163 93 93 112 83 1001 2 Arunachal Pradesh
144350 148521 146107 143283 148436 145630 160175 3 Assam
0 0 0 0 0 0 0 4 Bihar
0 0 0 0 0 0 0 5 Goa
0 0 0 0 0 0 0 6 Gujarat
0 0 0 0 0 0 0 7 Haryana
232 232 232 295 299 293 192 8 Himachal Pradesh
0 0 0 0 0 0 0 9 Jammu & Kashmir
909 894 932 929 839 946 892 10 Karnataka
21993 20962 20039 17544 17116 20238 20471 11 Kerala
0 0 0 0 0 0 0 12 Madhya Pradesh
0 0 0 0 0 0 0 13 Maharashtra
0 0 0 0 0 0 0 14 Manipur
0 54 128 138 167 167 20 15 Meghalaya
0 0 0 0 0 0 0 16 Mizoram
37 108 126 131 131 156 38 17 Nagaland
0 0 0 0 0 0 0 18 Orissa
0 0 0 0 0 0 0 19 Punjab
0 0 0 0 0 0 0 20 Rajasthan
0 0 0 0 0 0 0 21 Sikkim
26777 26003 26341 26864 25407 32857 31586 22 Tamil Nadu
705 705 705 622 630 618 697 23 Tripura
0 0 0 0 0 0 0 24 Uttar Pradesh
108987 114987 117573 122215 123380 132633 133820 25 West Bengal
0 0 0 0 0 0 0 26 A & N Islands
0 0 0 0 0 0 0 27 Dadra & Nagar Haveli
0 0 0 0 0 0 0 28 Daman & Diu
0 0 0 0 0 0 0 29 Delhi
0 0 0 0 0 0 0 30 Lakshadweep
0 0 0 0 0 0 0 31 Puducherry
0 0 0 0 0 0 0 32 Chandigarh
0 0 0 0 0 0 0 33 Jharkhand
0 0 0 0 0 0 0 34 Chattisgarh
144 28 34 24 34 24 45 35 Uttarakhand
304133 312658 312310 312137 316551 333645 348939 Total
Statement 35 : Statewise Value of Output( At 1999-00 Prices)
Tea
Page 80

Central Statistical OrganisationNational Accounts Division
(Rs. lakhs)
State/U.Ts 1999-00 2000-01 2001-02 2002-03 2003-04 2004-05 2005-06
1 Andhra Pradesh 1009 755 570 620 912 2537 1516
2 Arunachal Pradesh 0 23 0 13 0 0 0
3 Assam 361 451 36 36 90 152 195
4 Bihar 0 0 0 0 0 0 0
5 Goa 0 0 0 0 0 0 0
6 Gujarat 0 0 0 0 0 0 0
7 Haryana 0 0 0 0 0 0 0
8 Himachal Pradesh 0 0 0 0 0 0 0
9 Jammu & Kashmir 0 0 0 0 0 0 0
10 Karnataka 143579 119257 96963 90868 91502 156342 175393
11 Kerala 25575 29860 28206 31755 30275 20307 21251
12 Madhya Pradesh 0 0 0 0 0 0 0
13 Maharashtra 0 0 0 0 0 0 0
14 Manipur 0 0 0 0 0 0 0
15 Meghalaya 0 0 0 0 0 0 0
16 Mizoram 0 0 0 0 0 0 0
17 Nagaland 0 0 0 0 0 0 0
18 Orissa 167 167 167 167 167 167 167
19 Punjab 0 0 0 0 0 0 0
20 Rajasthan 0 0 0 0 0 0 0
21 Sikkim 0 0 0 0 0 0 0
22 Tamil Nadu 16092 13695 14580 10253 11803 12594 13329
23 Tripura 0 0 0 0 0 0 0
24 Uttar Pradesh 0 0 0 0 0 0 0
25 West Bengal 0 0 0 0 0 0 0
26 A & N Islands 0 0 0 0 0 0 0
27 Dadra & Nagar Haveli 0 0 0 0 0 0 0
28 Daman & Diu 0 0 0 0 0 0 0
29 Delhi 0 0 0 0 0 0 0
30 Lakshadweep 0 0 0 0 0 0 0
31 Puducherry 0 0 0 0 0 0 0
32 Chandigarh 0 0 0 0 0 0 0
33 Jharkhand 0 0 0 0 0 0 0
34 Chattisgarh 0 0 0 0 0 0 0
35 Uttarakhand 0 0 0 0 0 0 0
Total 186782 164208 140522 133712 134749 192098 211852
Statement 36 : Statewise Value of Output
( At Current Prices )
Coffee
Page 81

Central Statistical OrganisationNational Accounts Division
(Rs. lakhs)
1999-00 2000-01 2001-02 2002-03 2003-04 2004-05 2005-06 State/U.Ts
1009 1035 897 912 1423 2623 1122 1 Andhra Pradesh
0 0 0 0 0 0 0 2 Arunachal Pradesh
361 451 36 36 90 135 113 3 Assam
0 0 0 0 0 0 0 4 Bihar
0 0 0 0 0 0 0 5 Goa
0 0 0 0 0 0 0 6 Gujarat
0 0 0 0 0 0 0 7 Haryana
0 0 0 0 0 0 0 8 Himachal Pradesh
0 0 0 0 0 0 0 9 Jammu & Kashmir
143579 148797 147154 134905 130850 140053 138413 10 Karnataka
25575 29860 28206 28206 27005 22966 24034 11 Kerala
0 0 0 0 0 0 0 12 Madhya Pradesh
0 0 0 0 0 0 0 13 Maharashtra
0 0 0 0 0 0 0 14 Manipur
0 0 0 0 0 0 0 15 Meghalaya
0 0 0 0 0 0 0 16 Mizoram
0 0 0 0 0 0 0 17 Nagaland
167 167 167 167 167 167 167 18 Orissa
0 0 0 0 0 0 0 19 Punjab
0 0 0 0 0 0 0 20 Rajasthan
0 0 0 0 0 0 0 21 Sikkim
16092 13686 17917 13064 14723 15180 15615 22 Tamil Nadu
0 0 0 0 0 0 0 23 Tripura
0 0 0 0 0 0 0 24 Uttar Pradesh
0 0 0 0 0 0 0 25 West Bengal
0 0 0 0 0 0 0 26 A & N Islands
0 0 0 0 0 0 0 27 Dadra & Nagar Haveli
0 0 0 0 0 0 0 28 Daman & Diu
0 0 0 0 0 0 0 29 Delhi
0 0 0 0 0 0 0 30 Lakshadweep
0 0 0 0 0 0 0 31 Puducherry
0 0 0 0 0 0 0 32 Chandigarh
0 0 0 0 0 0 0 33 Jharkhand
0 0 0 0 0 0 0 34 Chattisgarh
0 0 0 0 0 0 0 35 Uttarakhand
186782 193996 194377 177290 174258 181123 179463 Total
Coffee
Statement 36 : Statewise Value of Output( At 1999-00 Prices)
Page 82

Central Statistical OrganisationNational Accounts Division
(Rs. lakhs)
State/U.Ts 1999-00 2000-01 2001-02 2002-03 2003-04 2004-05 2005-06
1 Andhra Pradesh 72898 33099 65525 66264 81599 68844 82896
2 Arunachal Pradesh 0 0 0 0 0 0 0
3 Assam 666 355 344 344 573 229 201
4 Bihar 11981 15031 12596 14275 14920 17610 16292
5 Goa 0 0 0 0 0 0 0
6 Gujarat 64664 46622 27648 20903 38189 24641 27610
7 Haryana 0 0 0 0 0 0 0
8 Himachal Pradesh 13 4 3 5 6 7 7
9 Jammu & Kashmir 0 0 0 0 1 1 1
10 Karnataka 27278 40713 31089 35849 32100 45905 41705
11 Kerala 155 929 764 969 818 1003 237
12 Madhya Pradesh 58 53 63 43 111 53 51
13 Maharashtra 5583 5184 4075 3915 2933 3959 4206
14 Manipur 0 0 0 0 0 0 0
15 Meghalaya 102 105 107 124 124 108 108
16 Mizoram 400 220 230 269 531 531 531
17 Nagaland 0 0 0 0 0 0 0
18 Orissa 1553 686 1340 1381 2227 2018 1859
19 Punjab 0 0 0 0 0 0 0
20 Rajasthan 1605 1204 1442 1261 903 269 143
21 Sikkim 0 0 0 0 0 0 0
22 Tamil Nadu 2639 2933 2187 4040 2879 2167 1526
23 Tripura 72 73 76 76 78 84 84
24 Uttar Pradesh 32192 23138 22936 29898 30623 29045 31614
25 West Bengal 3641 3105 3377 3246 6383 13475 13360
26 A & N Islands 0 0 0 0 0 0 0
27 Dadra & Nagar Haveli 0 0 0 0 0 0 0
28 Daman & Diu 0 0 0 0 0 0 0
29 Delhi 0 0 0 0 0 0 0
30 Lakshadweep 0 0 0 0 0 0 0
31 Puducherry 0 0 0 0 0 0 0
32 Chandigarh 0 0 0 0 0 0 0
33 Jharkhand 0 0 0 0 0 0 0
34 Chattisgarh 33 7 13 11 9 10 10
35 Uttarakhand 307 0 89 149 149 149 149
Total 225839 173460 173904 183021 215155 210107 222587
Statement 37 : Statewise Value of Output
( At Current Prices )
Tobacco
Page 83

Central Statistical OrganisationNational Accounts Division
(Rs. lakhs)
1999-00 2000-01 2001-02 2002-03 2003-04 2004-05 2005-06 State/U.Ts
72898 33107 63470 63125 73612 62569 74546 1 Andhra Pradesh
0 0 0 0 0 0 0 2 Arunachal Pradesh
666 400 400 400 666 267 234 3 Assam
11981 12185 10211 11573 10892 12730 11777 4 Bihar
0 0 0 0 0 0 0 5 Goa
64664 46421 44380 56383 31035 28301 25296 6 Gujarat
0 0 0 0 0 0 0 7 Haryana
13 4 4 5 5 5 5 8 Himachal Pradesh
0 0 0 0 1 1 1 9 Jammu & Kashmir
27278 30965 34820 35566 33092 40536 36778 10 Karnataka
155 929 306 388 327 327 77 11 Kerala
58 41 51 33 82 41 38 12 Madhya Pradesh
5583 4961 3973 4636 3452 3452 3452 13 Maharashtra
0 0 0 0 0 0 0 14 Manipur
102 102 102 118 118 102 102 15 Meghalaya
400 200 200 200 400 400 400 16 Mizoram
0 0 0 0 0 0 0 17 Nagaland
1553 675 1208 878 1181 1080 915 18 Orissa
0 0 0 0 0 0 0 19 Punjab
1605 1204 1442 1261 903 903 502 20 Rajasthan
0 0 0 0 0 0 0 21 Sikkim
2639 2794 1997 3688 2628 2015 1728 22 Tamil Nadu
72 72 72 72 72 72 72 23 Tripura
32192 32026 31747 34632 30623 29045 29481 24 Uttar Pradesh
3641 3098 2847 2288 5217 10917 10841 25 West Bengal
0 0 0 0 0 0 0 26 A & N Islands
0 0 0 0 0 0 0 27 Dadra & Nagar Haveli
0 0 0 0 0 0 0 28 Daman & Diu
0 0 0 0 0 0 0 29 Delhi
0 0 0 0 0 0 0 30 Lakshadweep
0 0 0 0 0 0 0 31 Puducherry
0 0 0 0 0 0 0 32 Chandigarh
0 0 0 0 0 0 0 33 Jharkhand
33 8 13 11 12 10 9 34 Chattisgarh
307 0 110 154 154 154 154 35 Uttarakhand
225839 169192 197352 215410 194472 192927 196406 Total
Statement 37 : Statewise Value of Output( At 1999-00 Prices)
Tobacco
Page 84

Central Statistical OrganisationNational Accounts Division
(Rs. lakhs)
State/U.Ts 1999-00 2000-01 2001-02 2002-03 2003-04 2004-05 2005-06
1 Andhra Pradesh 64647 80084 67699 74711 77128 69545 69715
2 Arunachal Pradesh 0 0 0 0 0 0 0
3 Assam 17888 24437 29382 28899 29863 18625 18560
4 Bihar 10796 11393 13629 12625 13358 13729 13290
5 Goa 190 200 209 223 239 213 209
6 Gujarat 9723 10366 8616 6559 12304 3024 3537
7 Haryana 921 968 21 628 0 1178 798
8 Himachal Pradesh 0 0 0 0 0 0 0
9 Jammu & Kashmir 1463 673 57 1223 975 900 900
10 Karnataka 2865 4406 3318 5331 5204 4922 2343
11 Kerala 34395 57651 52311 65936 53228 63061 62643
12 Madhya Pradesh 8187 6897 7680 5185 9823 9404 12282
13 Maharashtra 1468 1546 2116 319 176 295 1762
14 Manipur 0 0 0 0 0 0 0
15 Meghalaya 150 155 157 160 1311 158 158
16 Mizoram 24 30 31 70 70 156 156
17 Nagaland 0 0 0 0 0 0 0
18 Orissa 0 0 0 0 0 0 0
19 Punjab 431 824 515 765 135 276 274
20 Rajasthan 34459 20590 23760 25855 37071 44241 26920
21 Sikkim 0 0 0 0 0 0 0
22 Tamil Nadu 627 695 655 878 1065 1380 1107
23 Tripura 4548 4607 7171 7171 7381 0 0
24 Uttar Pradesh 40521 31067 32056 36968 37199 158875 189147
25 West Bengal 124477 135915 99383 208855 219445 168316 234055
26 A & N Islands 115 120 124 130 137 130 126
27 Dadra & Nagar Haveli 365 381 396 409 426 391 380
28 Daman & Diu 152 159 165 175 190 222 204
29 Delhi 0 0 0 0 0 0 0
30 Lakshadweep 0 0 0 0 0 0 0
31 Puducherry 82 85 89 364 368 288 286
32 Chandigarh 0 0 0 0 0 0 0
33 Jharkhand 0 0 0 0 0 0 0
34 Chattisgarh 0 0 7 12 43 49 59
35 Uttarakhand 0 149 100 100 336 201 201
Total 358494 393398 349646 483552 507474 559578 639112
Other Drugs & Narcotics
Statement 38 : Statewise Value of Output
( At Current Prices )
Page 85

Central Statistical OrganisationNational Accounts Division
(Rs. lakhs)
1999-00 2000-01 2001-02 2002-03 2003-04 2004-05 2005-06 State/U.Ts
64647 77886 61024 62434 62108 57327 56589 1 Andhra Pradesh
0 0 0 0 0 0 0 2 Arunachal Pradesh
17888 19439 22853 19451 2761 4376 4376 3 Assam
10796 11092 12778 11644 11826 13148 13353 4 Bihar
190 195 200 206 212 212 219 5 Goa
9723 10362 7451 8078 10714 2682 2218 6 Gujarat
921 392 8 217 0 406 275 7 Haryana
0 0 0 0 0 0 0 8 Himachal Pradesh
1463 673 57 1223 884 816 816 9 Jammu & Kashmir
2865 3347 3613 3381 2608 3295 813 10 Karnataka
34395 34625 32421 34375 30956 31740 31920 11 Kerala
8187 6583 6964 3049 6966 6030 7599 12 Madhya Pradesh
1468 1483 2066 357 207 266 1459 13 Maharashtra
0 0 0 0 0 0 0 14 Manipur
150 150 150 154 1257 150 150 15 Meghalaya
24 24 24 54 54 119 119 16 Mizoram
0 0 0 0 0 0 0 17 Nagaland
0 0 0 0 0 0 0 18 Orissa
431 400 250 332 59 120 119 19 Punjab
34459 14414 13482 14403 25718 24158 13594 20 Rajasthan
0 0 0 0 0 0 0 21 Sikkim
627 1951 1730 2112 2592 3508 3324 22 Tamil Nadu
4548 4548 6823 6823 6823 0 0 23 Tripura
40521 31532 32670 14797 21119 158873 176291 24 Uttar Pradesh
124477 99202 99853 122989 77322 82238 80016 25 West Bengal
115 117 119 120 122 129 132 26 A & N Islands
365 372 379 378 378 388 399 27 Dadra & Nagar Haveli
152 155 158 162 169 221 214 28 Daman & Diu
0 0 0 0 0 0 0 29 Delhi
0 0 0 0 0 0 0 30 Lakshadweep
82 83 85 357 357 312 315 31 Puducherry
0 0 0 0 0 0 0 32 Chandigarh
0 0 0 0 0 0 0 33 Jharkhand
0 0 7 12 56 46 53 34 Chattisgarh
0 149 100 100 336 201 201 35 Uttarakhand
358494 319174 305265 307207 265602 390763 394565 Total
( At 1999-00 Prices)
Other Drugs & Narcotics
Statement 38 : Statewise Value of Output
Page 86

Central Statistical OrganisationNational Accounts Division
(Rs. lakhs)
State/U.Ts 1999-00 2000-01 2001-02 2002-03 2003-04 2004-05 2005-06
1 Andhra Pradesh 138554 113939 133795 141595 159638 140926 154127
2 Arunachal Pradesh 0 186 91 87 88 63 756
3 Assam 163266 233755 246092 253585 193794 191159 208303
4 Bihar 22777 26424 26225 26900 28278 31339 29582
5 Goa 190 200 209 223 239 213 209
6 Gujarat 74387 56988 36264 27463 50492 27665 31147
7 Haryana 921 968 21 628 0 1178 798
8 Himachal Pradesh 245 285 284 482 732 753 527
9 Jammu & Kashmir 1463 673 57 1223 976 901 901
10 Karnataka 174630 165337 132372 133107 129763 208248 220459
11 Kerala 82118 103921 96073 111011 96371 103217 103193
12 Madhya Pradesh 8244 6950 7743 5228 9935 9457 12333
13 Maharashtra 7051 6730 6190 4234 3109 4254 5968
14 Manipur 0 0 0 0 0 0 0
15 Meghalaya 252 368 521 562 1774 606 306
16 Mizoram 424 250 261 338 600 686 686
17 Nagaland 37 216 255 264 334 351 86
18 Orissa 1719 852 1506 1548 2394 2185 2064
19 Punjab 431 824 515 765 135 276 274
20 Rajasthan 36064 21794 25202 27116 37973 44509 27063
21 Sikkim 0 0 0 0 0 0 0
22 Tamil Nadu 46135 41299 41710 50263 44439 63582 52054
23 Tripura 5326 5385 8311 8254 8484 1089 1218
24 Uttar Pradesh 72712 54205 54993 66867 67821 187920 220761
25 West Bengal 237106 252374 242301 282270 300290 264639 334606
26 A & N Islands 115 120 124 130 137 130 126
27 Dadra & Nagar Haveli 365 381 396 409 426 391 380
28 Daman & Diu 152 159 165 175 190 222 204
29 Delhi 0 0 0 0 0 0 0
30 Lakshadweep 0 0 0 0 0 0 0
31 Puducherry 82 85 89 364 368 288 286
32 Chandigarh 0 0 0 0 0 0 0
33 Jharkhand 0 0 0 0 0 0 0
34 Chattisgarh 33 7 20 23 52 59 69
35 Uttarakhand 451 180 227 313 612 460 560
Total 1075249 1094855 1062011 1145428 1139443 1286767 1409047
Statement 35-38 : Statewise Value of Output
( At Current Prices )
Total Drugs & Narcotics
Page 87

Central Statistical OrganisationNational Accounts Division
(Rs. lakhs)
1999-00 2000-01 2001-02 2002-03 2003-04 2004-05 2005-06 State/U.Ts
138554 112029 125392 126470 137143 122519 132257 1 Andhra Pradesh
0 163 93 93 112 83 1001 2 Arunachal Pradesh
163266 168811 169396 163170 151953 150408 164898 3 Assam
22777 23277 22989 23217 22718 25878 25129 4 Bihar
190 195 200 206 212 212 219 5 Goa
74387 56783 51831 64462 41749 30983 27514 6 Gujarat
921 392 8 217 0 406 275 7 Haryana
245 236 235 300 304 298 197 8 Himachal Pradesh
1463 673 57 1223 885 817 817 9 Jammu & Kashmir
174630 184003 186519 174781 167389 184829 176896 10 Karnataka
82118 86375 80972 80513 75404 75271 76502 11 Kerala
8244 6624 7015 3082 7047 6071 7637 12 Madhya Pradesh
7051 6443 6039 4992 3659 3718 4911 13 Maharashtra
0 0 0 0 0 0 0 14 Manipur
252 306 380 410 1542 420 272 15 Meghalaya
424 224 224 253 453 519 519 16 Mizoram
37 108 126 131 131 156 38 17 Nagaland
1719 842 1375 1044 1348 1247 1081 18 Orissa
431 400 250 332 59 120 119 19 Punjab
36064 15618 14924 15664 26621 25061 14096 20 Rajasthan
0 0 0 0 0 0 0 21 Sikkim
46135 44435 47985 45728 45350 53559 52253 22 Tamil Nadu
5326 5326 7600 7517 7525 690 769 23 Tripura
72712 63558 64417 49429 51742 187918 205772 24 Uttar Pradesh
237106 217286 220274 247492 205920 225788 224678 25 West Bengal
115 117 119 120 122 129 132 26 A & N Islands
365 372 379 378 378 388 399 27 Dadra & Nagar Haveli
152 155 158 162 169 221 214 28 Daman & Diu
0 0 0 0 0 0 0 29 Delhi
0 0 0 0 0 0 0 30 Lakshadweep
82 83 85 357 357 312 315 31 Puducherry
0 0 0 0 0 0 0 32 Chandigarh
0 0 0 0 0 0 0 33 Jharkhand
33 8 20 23 67 56 62 34 Chattisgarh
451 176 244 278 524 379 400 35 Uttarakhand
1075249 995020 1009304 1012044 950883 1098457 1119373 Total
( At 1999-00 Prices)Statement 35-38 : Statewise Value of Output
Total Drugs & Narcotics
Page 88

Central Statistical OrganisationNational Accounts Division
(Rs. lakhs)
State/U.Ts 1999-00 2000-01 2001-02 2002-03 2003-04 2004-05 2005-06
1 Andhra Pradesh 0 0 0 0 0 0 0
2 Arunachal Pradesh 350 350 358 410 504 515 525
3 Assam 0 0 0 0 0 0 0
4 Bihar 0 0 0 0 0 0 0
5 Goa 0 0 0 0 0 0 0
6 Gujarat 0 0 0 0 0 0 0
7 Haryana 0 0 0 0 0 0 0
8 Himachal Pradesh 0 0 0 0 0 0 0
9 Jammu & Kashmir 0 0 0 0 0 0 0
10 Karnataka 4599 5188 6076 6081 4098 2653 2129
11 Kerala 33745 44437 50032 54464 29610 24832 28144
12 Madhya Pradesh 0 0 0 0 0 0 0
13 Maharashtra 0 0 0 0 0 0 0
14 Manipur 0 0 0 0 0 0 0
15 Meghalaya 0 0 0 0 0 0 0
16 Mizoram 0 0 0 0 0 0 0
17 Nagaland 0 0 0 0 1600 1600 1600
18 Orissa 0 0 0 0 0 0 0
19 Punjab 0 0 0 0 0 0 0
20 Rajasthan 0 0 0 0 0 0 0
21 Sikkim 1890 4324 4563 3497 3699 4038 4141
22 Tamil Nadu 1433 1840 2096 2077 2136 1715 1050
23 Tripura 0 0 0 0 0 0 0
24 Uttar Pradesh 0 0 0 0 0 0 0
25 West Bengal 1443 1617 1747 1715 1758 1850 1921
26 A & N Islands 0 0 0 0 0 0 0
27 Dadra & Nagar Haveli 0 0 0 0 0 0 0
28 Daman & Diu 0 0 0 0 0 0 0
29 Delhi 0 0 0 0 0 0 0
30 Lakshadweep 0 0 0 0 0 0 0
31 Puducherry 0 0 0 0 0 0 0
32 Chandigarh 0 0 0 0 0 0 0
33 Jharkhand 0 0 0 0 0 0 0
34 Chattisgarh 0 0 0 0 0 0 0
35 Uttarakhand 0 0 0 0 0 0 0
Total 43459 57756 64873 68243 43404 37204 39510
Statement 39 : Statewise Value of Output
( At Current Prices )
Cardamom
Page 89

Central Statistical OrganisationNational Accounts Division
(Rs. lakhs)
1999-00 2000-01 2001-02 2002-03 2003-04 2004-05 2005-06 State/U.Ts
0 0 0 0 0 0 0 1 Andhra Pradesh
350 350 358 358 392 400 408 2 Arunachal Pradesh
0 0 0 0 0 0 0 3 Assam
0 0 0 0 0 0 0 4 Bihar
0 0 0 0 0 0 0 5 Goa
0 0 0 0 0 0 0 6 Gujarat
0 0 0 0 0 0 0 7 Haryana
0 0 0 0 0 0 0 8 Himachal Pradesh
0 0 0 0 0 0 0 9 Jammu & Kashmir
4599 4434 4490 4446 4434 4434 4542 10 Karnataka
33745 38858 41353 44380 45505 44053 49927 11 Kerala
0 0 0 0 0 0 0 12 Madhya Pradesh
0 0 0 0 0 0 0 13 Maharashtra
0 0 0 0 0 0 0 14 Manipur
0 0 0 0 0 0 0 15 Meghalaya
0 0 0 0 0 0 0 16 Mizoram
0 0 0 0 1400 1400 1400 17 Nagaland
0 0 0 0 0 0 0 18 Orissa
0 0 0 0 0 0 0 19 Punjab
0 0 0 0 0 0 0 20 Rajasthan
1890 4230 4140 3060 3150 3330 3330 21 Sikkim
1433 1572 1791 1665 1712 1612 1791 22 Tamil Nadu
0 0 0 0 0 0 0 23 Tripura
0 0 0 0 0 0 0 24 Uttar Pradesh
1443 1443 1608 1443 1443 1443 1443 25 West Bengal
0 0 0 0 0 0 0 26 A & N Islands
0 0 0 0 0 0 0 27 Dadra & Nagar Haveli
0 0 0 0 0 0 0 28 Daman & Diu
0 0 0 0 0 0 0 29 Delhi
0 0 0 0 0 0 0 30 Lakshadweep
0 0 0 0 0 0 0 31 Puducherry
0 0 0 0 0 0 0 32 Chandigarh
0 0 0 0 0 0 0 33 Jharkhand
0 0 0 0 0 0 0 34 Chattisgarh
0 0 0 0 0 0 0 35 Uttarakhand
43459 50887 53740 55352 58035 56671 62842 Total
( At 1999-00 Prices)
Cardamom
Statement 39 : Statewise Value of Output
Page 90

Central Statistical OrganisationNational Accounts Division
(Rs. lakhs)
State/U.Ts 1999-00 2000-01 2001-02 2002-03 2003-04 2004-05 2005-06
1 Andhra Pradesh 177933 181389 187951 138276 296497 253296 178820
2 Arunachal Pradesh 408 506 298 334 349 380 387
3 Assam 3855 1493 6289 6735 7276 5989 6178
4 Bihar 2105 1724 1435 879 819 696 1141
5 Goa 0 0 0 0 0 0 0
6 Gujarat 8881 7385 9171 8786 3588 1499 2379
7 Haryana 443 579 577 439 456 520 23294
8 Himachal Pradesh 144 216 178 51 72 72 94
9 Jammu & Kashmir 329 329 119 485 133 531 531
10 Karnataka 59463 52131 40281 39363 35020 29670 42075
11 Kerala 104 93 187 275 245 263 451
12 Madhya Pradesh 7702 4715 9158 12677 15616 17949 14447
13 Maharashtra 20498 18030 18207 18334 17704 16982 17344
14 Manipur 3735 2120 3406 4705 4977 3790 3023
15 Meghalaya 240 241 263 253 253 466 289
16 Mizoram 1225 720 777 885 344 344 344
17 Nagaland 1680 1831 1052 1122 125 1604 126
18 Orissa 36734 23252 23853 28524 30806 27214 29082
19 Punjab 9042 9006 10163 3173 3332 2666 3499
20 Rajasthan 20740 12213 17141 5803 11327 10224 5293
21 Sikkim 0 0 0 0 0 0 0
22 Tamil Nadu 13238 11470 10240 11184 9566 6473 5847
23 Tripura 638 550 1056 1166 1127 8322 1174
24 Uttar Pradesh 7518 5548 5163 4899 6283 5712 6353
25 West Bengal 25093 23870 23793 28994 34821 25818 22871
26 A & N Islands 52 96 96 106 163 240 240
27 Dadra & Nagar Haveli 0 0 0 0 0 0 0
28 Daman & Diu 0 0 0 0 0 0 0
29 Delhi 20 43 1 1 1 2 1
30 Lakshadweep 0 0 0 0 0 0 0
31 Puducherry 168 9 5 15 16 11 11
32 Chandigarh 0 0 0 0 0 0 0
33 Jharkhand 35 0 0 0 0 0 0
34 Chattisgarh 489 520 1457 2166 1807 1278 594
35 Uttarakhand 0 0 0 3265 3265 2364 1927
Total 402512 360080 372315 322895 485986 424372 367815
Statement 40 : Statewise Value of Output
( At Current Prices )
Dry Chillies
Page 91

Central Statistical OrganisationNational Accounts Division
(Rs. lakhs)
1999-00 2000-01 2001-02 2002-03 2003-04 2004-05 2005-06 State/U.Ts
177933 188766 212160 146656 285921 268693 192999 1 Andhra Pradesh
408 504 511 552 576 624 635 2 Arunachal Pradesh
3855 4675 4675 4675 4675 4434 4573 3 Assam
2105 1754 1404 702 772 772 1088 4 Bihar
0 0 0 0 0 0 0 5 Goa
8881 7438 8567 6684 2636 1789 1789 6 Gujarat
443 620 650 384 354 413 20076 7 Haryana
144 216 216 63 72 72 94 8 Himachal Pradesh
329 329 152 631 165 659 659 9 Jammu & Kashmir
59463 57107 47803 47801 35739 39550 35739 10 Karnataka
104 104 232 264 235 235 402 11 Kerala
7702 4806 8022 11452 13887 15503 12848 12 Madhya Pradesh
20498 21088 20394 18205 15287 16711 17371 13 Maharashtra
3735 3913 3975 5407 7114 4349 3468 14 Manipur
240 240 262 251 251 459 284 15 Meghalaya
1225 630 735 805 280 280 280 16 Mizoram
1680 1680 960 972 108 1380 108 17 Nagaland
36734 24489 24732 26290 26412 26412 26449 18 Orissa
9042 9134 9849 2929 2929 2231 2929 19 Punjab
20740 15643 22859 6985 14619 14479 8147 20 Rajasthan
0 0 0 0 0 0 0 21 Sikkim
13238 13096 9828 9626 9496 10562 7538 22 Tamil Nadu
638 638 1276 1395 1334 9454 1334 23 Tripura
7518 8328 7750 6246 7403 7865 9311 24 Uttar Pradesh
25093 26148 26163 29828 31810 29459 29123 25 West Bengal
52 48 48 53 82 120 120 26 A & N Islands
0 0 0 0 0 0 0 27 Dadra & Nagar Haveli
0 0 0 0 0 0 0 28 Daman & Diu
20 45 2 2 2 2 2 29 Delhi
0 0 0 0 0 0 0 30 Lakshadweep
168 13 6 16 16 15 15 31 Puducherry
0 0 0 0 0 0 0 32 Chandigarh
35 0 0 0 0 0 0 33 Jharkhand
489 265 712 1075 794 624 284 34 Chattisgarh
0 0 0 3528 3528 2672 2672 35 Uttarakhand
402512 391718 413941 333476 466495 459815 380336 Total
( At 1999-00 Prices)
Dry Chillies
Statement 40 : Statewise Value of Output
Page 92

Central Statistical OrganisationNational Accounts Division
(Rs. lakhs)
State/U.Ts 1999-00 2000-01 2001-02 2002-03 2003-04 2004-05 2005-06
1 Andhra Pradesh 0 0 0 0 0 0 0
2 Arunachal Pradesh 132 154 156 167 130 130 135
3 Assam 5686 5686 5476 3236 6147 6333 8570
4 Bihar 0 0 0 0 0 0 0
5 Goa 82 82 82 89 89 90 123
6 Gujarat 0 0 0 0 0 0 0
7 Haryana 0 0 0 0 0 0 0
8 Himachal Pradesh 0 0 0 0 0 0 0
9 Jammu & Kashmir 0 0 0 0 0 0 0
10 Karnataka 2791 2882 1708 1700 1550 1860 2417
11 Kerala 99336 77955 41413 53779 47589 46428 53598
12 Madhya Pradesh 0 0 0 0 0 0 0
13 Maharashtra 0 0 0 0 0 0 0
14 Manipur 0 0 0 0 0 0 0
15 Meghalaya 260 260 260 251 444 253 458
16 Mizoram 0 0 0 0 0 0 0
17 Nagaland 295 618 115 120 121 121 121
18 Orissa 0 0 0 0 0 0 0
19 Punjab 0 0 0 0 0 0 0
20 Rajasthan 0 0 0 0 0 0 0
21 Sikkim 0 0 0 0 0 0 0
22 Tamil Nadu 1316 1903 2136 1842 1973 1633 1974
23 Tripura 0 0 0 0 0 0 0
24 Uttar Pradesh 0 0 0 0 0 0 0
25 West Bengal 0 0 0 0 0 0 0
26 A & N Islands 70 120 108 144 144 144 144
27 Dadra & Nagar Haveli 0 0 0 0 0 0 0
28 Daman & Diu 0 0 0 0 0 0 0
29 Delhi 0 0 0 0 0 0 0
30 Lakshadweep 0 0 0 0 0 0 0
31 Puducherry 24 23 13 12 12 8 8
32 Chandigarh 0 0 0 0 0 0 0
33 Jharkhand 0 0 0 0 0 0 0
34 Chattisgarh 0 0 0 0 0 0 0
35 Uttarakhand 0 0 0 0 0 0 0
Total 109992 89683 51466 61340 58199 57000 67547
( At Current Prices )
Black Pepper
Statement 41 : Statewise Value of Output
Page 93

Central Statistical OrganisationNational Accounts Division
(Rs. lakhs)
1999-00 2000-01 2001-02 2002-03 2003-04 2004-05 2005-06 State/U.Ts
0 0 0 0 0 0 0 1 Andhra Pradesh
132 154 156 164 172 172 178 2 Arunachal Pradesh
5686 5686 6805 6805 7004 7004 9477 3 Assam
0 0 0 0 0 0 0 4 Bihar
82 82 82 82 82 82 112 5 Goa
0 0 0 0 0 0 0 6 Gujarat
0 0 0 0 0 0 0 7 Haryana
0 0 0 0 0 0 0 8 Himachal Pradesh
0 0 0 0 0 0 0 9 Jammu & Kashmir
2791 2955 4088 3805 3868 4662 5322 10 Karnataka
99336 127453 121687 140738 144210 156663 183042 11 Kerala
0 0 0 0 0 0 0 12 Madhya Pradesh
0 0 0 0 0 0 0 13 Maharashtra
0 0 0 0 0 0 0 14 Manipur
260 260 260 250 442 252 455 15 Meghalaya
0 0 0 0 0 0 0 16 Mizoram
295 295 112 116 116 116 116 17 Nagaland
0 0 0 0 0 0 0 18 Orissa
0 0 0 0 0 0 0 19 Punjab
0 0 0 0 0 0 0 20 Rajasthan
0 0 0 0 0 0 0 21 Sikkim
1316 1185 1329 1146 1228 1198 1448 22 Tamil Nadu
0 0 0 0 0 0 0 23 Tripura
0 0 0 0 0 0 0 24 Uttar Pradesh
0 0 0 0 0 0 0 25 West Bengal
70 70 63 84 84 84 84 26 A & N Islands
0 0 0 0 0 0 0 27 Dadra & Nagar Haveli
0 0 0 0 0 0 0 28 Daman & Diu
0 0 0 0 0 0 0 29 Delhi
0 0 0 0 0 0 0 30 Lakshadweep
24 24 27 27 27 17 17 31 Puducherry
0 0 0 0 0 0 0 32 Chandigarh
0 0 0 0 0 0 0 33 Jharkhand
0 0 0 0 0 0 0 34 Chattisgarh
0 0 0 0 0 0 0 35 Uttarakhand
109992 138164 134607 153217 157232 170249 200251 Total
( At 1999-00 Prices)
Black Pepper
Statement 41 : Statewise Value of Output
Page 94

Central Statistical OrganisationNational Accounts Division
(Rs. lakhs)
State/U.Ts 1999-00 2000-01 2001-02 2002-03 2003-04 2004-05 2005-06
1 Andhra Pradesh 1434 1131 1088 576 1003 2471 1095
2 Arunachal Pradesh 4725 4765 5323 4526 5282 4672 4869
3 Assam 24609 25007 14470 20418 27506 42428 43105
4 Bihar 115 118 46 127 91 182 247
5 Goa 0 0 0 0 0 0 0
6 Gujarat 2425 2142 2102 2280 1600 6264 1774
7 Haryana 1764 1764 1764 1764 1764 1764 1764
8 Himachal Pradesh 3150 927 3429 5558 5558 13230 20898
9 Jammu & Kashmir 0 0 0 0 426 426 426
10 Karnataka 7142 7821 6859 6660 5159 6391 13808
11 Kerala 23919 20916 11014 10431 22348 41825 23233
12 Madhya Pradesh 3238 3112 2364 1852 3499 3652 4048
13 Maharashtra 1072 954 797 679 566 743 793
14 Manipur 80 73 268 105 120 184 241
15 Meghalaya 2459 3143 3332 3341 3730 3438 4008
16 Mizoram 1068 1270 2916 2190 2158 2220 2220
17 Nagaland 1560 2968 1747 1755 1703 1841 8350
18 Orissa 4139 3986 4141 5670 10649 10640 9339
19 Punjab 0 0 0 0 0 0 0
20 Rajasthan 856 760 748 435 435 164 219
21 Sikkim 2840 3096 3532 4109 4878 5217 5351
22 Tamil Nadu 208 207 3391 144 121 1003 13356
23 Tripura 444 486 516 651 480 483 483
24 Uttar Pradesh 595 280 302 439 794 829 628
25 West Bengal 6114 6301 3270 3599 6004 5444 3900
26 A & N Islands 300 300 306 320 406 450 450
27 Dadra & Nagar Haveli 0 0 0 0 0 0 0
28 Daman & Diu 0 0 0 0 0 0 0
29 Delhi 0 0 0 0 0 0 0
30 Lakshadweep 0 0 0 0 0 0 0
31 Puducherry 0 0 0 0 0 0 0
32 Chandigarh 0 0 0 0 0 0 0
33 Jharkhand 0 0 0 0 0 0 0
34 Chattisgarh 190 715 863 847 464 468 458
35 Uttarakhand 1605 929 929 1969 1968 5629 916
Total 96050 93172 75518 80446 108710 162057 165979
Statement 42 : Statewise Value of Output
( At Current Prices )
Dry Ginger
Page 95

Central Statistical OrganisationNational Accounts Division
(Rs. lakhs)
1999-00 2000-01 2001-02 2002-03 2003-04 2004-05 2005-06 State/U.Ts
1434 1294 1255 660 1118 2171 956 1 Andhra Pradesh
4725 4765 5133 4365 5022 4442 4442 2 Arunachal Pradesh
24609 25007 25340 25523 25594 27466 32184 3 Assam
115 115 42 103 51 103 123 4 Bihar
0 0 0 0 0 0 0 5 Goa
2425 2142 2102 2304 1617 10873 1617 6 Gujarat
1764 1764 1764 1764 1764 1764 1764 7 Haryana
3150 810 2610 4230 4230 13230 14580 8 Himachal Pradesh
0 0 0 41 324 324 324 9 Jammu & Kashmir
7142 10157 10157 10285 7761 10261 20210 10 Karnataka
23919 24704 23246 18752 19092 26208 22389 11 Kerala
3238 3112 3786 2966 3499 3279 3501 12 Madhya Pradesh
1072 990 990 990 825 825 825 13 Maharashtra
80 87 280 166 191 225 294 14 Manipur
2459 2470 2563 2570 2849 2591 3020 15 Meghalaya
1068 1016 1866 1248 1184 1184 1184 16 Mizoram
1560 1608 1620 1620 1560 1680 7620 17 Nagaland
4139 3740 3943 4596 4679 4738 4800 18 Orissa
0 0 0 0 0 0 0 19 Punjab
856 761 837 487 487 152 159 20 Rajasthan
2840 2976 3151 3596 4154 4303 4303 21 Sikkim
208 203 3324 141 118 234 4363 22 Tamil Nadu
444 478 559 1086 558 558 558 23 Tripura
595 276 319 232 348 406 276 24 Uttar Pradesh
6114 6117 5771 6541 5923 6085 4515 25 West Bengal
300 300 306 320 406 450 450 26 A & N Islands
0 0 0 0 0 0 0 27 Dadra & Nagar Haveli
0 0 0 0 0 0 0 28 Daman & Diu
0 0 0 0 0 0 0 29 Delhi
0 0 0 0 0 0 0 30 Lakshadweep
0 0 0 0 0 0 0 31 Puducherry
0 0 0 0 0 0 0 32 Chandigarh
0 0 0 0 0 0 0 33 Jharkhand
190 326 356 268 261 261 254 34 Chattisgarh
1605 911 911 2732 2730 4051 911 35 Uttarakhand
96050 96129 102229 97585 96345 127862 135621 Total
Statement 42 : Statewise Value of Output
Dry Ginger
( At 1999-00 Prices)
Page 96

Central Statistical OrganisationNational Accounts Division
(Rs. lakhs)
State/U.Ts 1999-00 2000-01 2001-02 2002-03 2003-04 2004-05 2005-06
1 Andhra Pradesh 81454 96574 56277 68993 90244 120102 151688
2 Arunachal Pradesh 90 114 128 125 95 144 130
3 Assam 2865 531 2195 2024 2626 3275 3314
4 Bihar 805 664 636 636 1033 1037 1259
5 Goa 0 0 0 0 0 0 0
6 Gujarat 448 728 446 490 3430 4318 5180
7 Haryana 0 0 0 0 2577 2577 3534
8 Himachal Pradesh 55 474 37 29 39 39 51
9 Jammu & Kashmir 5 5 10 16 16 16 16
10 Karnataka 42661 19001 24232 12053 9418 9428 8580
11 Kerala 2533 2025 1924 2249 1847 2447 3475
12 Madhya Pradesh 130 80 139 189 285 253 137
13 Maharashtra 2141 1580 1499 2054 2439 2761 2209
14 Manipur 58 13 97 86 157 122 39
15 Meghalaya 3280 3483 3526 3542 3571 3822 3863
16 Mizoram 232 261 267 286 300 183 255
17 Nagaland 230 230 1763 1764 1524 1230 1525
18 Orissa 9421 9461 10352 14719 15013 15084 15591
19 Punjab 0 0 0 0 0 0 0
20 Rajasthan 231 116 135 77 152 75 77
21 Sikkim 479 139 144 166 145 150 153
22 Tamil Nadu 34288 23886 17783 16637 19569 22381 36179
23 Tripura 1125 1787 1842 1219 1356 1207 1365
24 Uttar Pradesh 684 826 1147 994 676 952 1826
25 West Bengal 7577 8708 6388 6082 9453 8062 6489
26 A & N Islands 0 0 0 54 151 455 455
27 Dadra & Nagar Haveli 0 0 0 0 0 0 0
28 Daman & Diu 0 0 0 0 0 0 0
29 Delhi 0 0 0 0 0 0 0
30 Lakshadweep 0 0 0 0 0 0 0
31 Puducherry 0 0 0 0 0 0 0
32 Chandigarh 0 0 0 0 0 0 0
33 Jharkhand 107 0 0 0 0 0 0
34 Chattisgarh 116 155 146 169 270 275 275
35 Uttarakhand 73 0 65 52 52 87 67
Total 191089 170841 131178 134705 166438 200482 247736
Statement 43 : Statewise Value of Output
( At Current Prices )
Turmeric
Page 97

Central Statistical OrganisationNational Accounts Division
(Rs. lakhs)
1999-00 2000-01 2001-02 2002-03 2003-04 2004-05 2005-06 State/U.Ts
81454 97924 65014 73884 83561 108921 135239 1 Andhra Pradesh
90 114 126 120 90 108 98 2 Arunachal Pradesh
2865 3028 3088 3149 3028 3179 3217 3 Assam
805 805 805 805 751 751 913 4 Bihar
0 0 0 0 0 0 0 5 Goa
448 728 308 448 3134 3946 3946 6 Gujarat
0 0 0 0 2577 2577 3534 7 Haryana
55 469 44 33 39 39 49 8 Himachal Pradesh
5 5 10 10 10 10 10 9 Jammu & Kashmir
42661 59103 52388 41199 7985 7985 7985 10 Karnataka
2533 2745 2381 2093 1719 1749 2484 11 Kerala
130 80 107 145 183 170 125 12 Madhya Pradesh
2141 2141 2092 2018 2215 2215 1969 13 Maharashtra
58 78 78 78 155 120 39 14 Manipur
3280 3440 3440 3456 3480 3720 3760 15 Meghalaya
232 232 232 224 216 132 184 16 Mizoram
230 230 1728 1728 1488 1200 1488 17 Nagaland
9421 9331 10137 8618 8688 8746 8791 18 Orissa
0 0 0 0 0 0 0 19 Punjab
231 158 158 67 126 63 65 20 Rajasthan
479 575 575 639 543 543 543 21 Sikkim
34288 32506 24231 13219 13785 24272 29363 22 Tamil Nadu
1125 2325 2456 1609 1609 1425 1613 23 Tripura
684 684 950 1026 608 874 1672 24 Uttar Pradesh
7577 8478 8338 8080 9272 9272 9462 25 West Bengal
0 0 0 54 66 199 199 26 A & N Islands
0 0 0 0 0 0 0 27 Dadra & Nagar Haveli
0 0 0 0 0 0 0 28 Daman & Diu
0 0 0 0 0 0 0 29 Delhi
0 0 0 0 0 0 0 30 Lakshadweep
0 0 0 0 0 0 0 31 Puducherry
0 0 0 0 0 0 0 32 Chandigarh
107 0 0 0 0 0 0 33 Jharkhand
116 193 157 156 180 180 180 34 Chattisgarh
73 0 73 73 73 73 73 35 Uttarakhand
191089 225370 178914 162933 145582 182471 217001 Total
Statement 43 : Statewise Value of Output( At 1999-00 Prices)
Turmeric
Page 98

Central Statistical OrganisationNational Accounts Division
(Rs. lakhs)
State/U.Ts 1999-00 2000-01 2001-02 2002-03 2003-04 2004-05 2005-06
1 Andhra Pradesh 398 1012 710 565 309 131 268
2 Arunachal Pradesh 6 10 10 10 0 0 0
3 Assam 53207 82141 42340 39660 28102 42847 60989
4 Bihar 0 0 0 0 0 0 0
5 Goa 846 1851 1158 1112 1413 1300 1770
6 Gujarat 0 0 0 0 0 0 0
7 Haryana 0 0 0 0 0 0 0
8 Himachal Pradesh 0 0 0 0 0 0 0
9 Jammu & Kashmir 0 0 0 0 0 0 0
10 Karnataka 185020 112519 92023 90374 124052 128347 198980
11 Kerala 107874 57025 32508 43456 46948 47399 47891
12 Madhya Pradesh 0 0 0 0 0 0 0
13 Maharashtra 6521 3528 3755 3564 3725 4376 3983
14 Manipur 0 0 0 0 0 0 0
15 Meghalaya 881 1165 1227 1233 1243 1250 1364
16 Mizoram 56 168 522 522 510 510 509
17 Nagaland 0 0 0 0 113 113 113
18 Orissa 0 0 0 0 0 0 0
19 Punjab 0 0 0 0 0 0 0
20 Rajasthan 0 0 0 0 0 0 0
21 Sikkim 0 0 0 0 0 0 0
22 Tamil Nadu 12363 5715 13802 4880 4145 2550 5291
23 Tripura 2174 3733 4509 4324 4270 5608 4299
24 Uttar Pradesh 0 0 0 0 0 0 0
25 West Bengal 11987 13006 15193 18243 21919 32189 40060
26 A & N Islands 3050 3600 4380 4440 4020 2880 2880
27 Dadra & Nagar Haveli 0 0 0 0 0 0 0
28 Daman & Diu 0 0 0 0 0 0 0
29 Delhi 0 0 0 0 0 0 0
30 Lakshadweep 0 0 0 0 0 0 0
31 Puducherry 231 178 178 170 170 114 114
32 Chandigarh 0 0 0 0 0 0 0
33 Jharkhand 0 0 0 0 0 0 0
34 Chattisgarh 0 0 0 0 0 0 0
35 Uttarakhand 0 0 0 0 0 0 0
Total 384615 285650 212316 212551 240938 269614 368512
Statement 44 : Statewise Value of Output
( At Current Prices )
Arecanut
Page 99

Central Statistical OrganisationNational Accounts Division
(Rs. lakhs)
1999-00 2000-01 2001-02 2002-03 2003-04 2004-05 2005-06 State/U.Ts
398 1158 718 683 354 160 320 1 Andhra Pradesh
6 10 10 10 0 0 0 2 Arunachal Pradesh
53207 72869 74363 74363 69400 69400 67187 3 Assam
0 0 0 0 0 0 0 4 Bihar
846 1350 1125 1125 1215 1125 1160 5 Goa
0 0 0 0 0 0 0 6 Gujarat
0 0 0 0 0 0 0 7 Haryana
0 0 0 0 0 0 0 8 Himachal Pradesh
0 0 0 0 0 0 0 9 Jammu & Kashmir
185020 204767 229923 242540 250123 256462 271285 10 Karnataka
107874 113891 109659 138951 136623 137788 154505 11 Kerala
0 0 0 0 0 0 0 12 Madhya Pradesh
6521 3826 4869 4869 4347 4347 4347 13 Maharashtra
0 0 0 0 0 0 0 14 Manipur
881 966 994 999 1001 1001 1093 15 Meghalaya
56 168 522 522 497 497 496 16 Mizoram
0 0 0 0 113 113 113 17 Nagaland
0 0 0 0 0 0 0 18 Orissa
0 0 0 0 0 0 0 19 Punjab
0 0 0 0 0 0 0 20 Rajasthan
0 0 0 0 0 0 0 21 Sikkim
12363 5600 16562 6157 5673 8631 12013 22 Tamil Nadu
2174 3606 3659 3659 3659 4773 3659 23 Tripura
0 0 0 0 0 0 0 24 Uttar Pradesh
11987 11987 13068 14552 16264 22218 25722 25 West Bengal
3050 3600 3650 3700 3350 2400 2400 26 A & N Islands
0 0 0 0 0 0 0 27 Dadra & Nagar Haveli
0 0 0 0 0 0 0 28 Daman & Diu
0 0 0 0 0 0 0 29 Delhi
0 0 0 0 0 0 0 30 Lakshadweep
231 178 178 181 181 135 135 31 Puducherry
0 0 0 0 0 0 0 32 Chandigarh
0 0 0 0 0 0 0 33 Jharkhand
0 0 0 0 0 0 0 34 Chattisgarh
0 0 0 0 0 0 0 35 Uttarakhand
384615 423977 459299 492310 492800 509051 544436 Total
Arecanut
Statement 44 : Statewise Value of Output( At 1999-00 Prices)
Page 100

Central Statistical OrganisationNational Accounts Division
(Rs. lakhs)
State/U.Ts 1999-00 2000-01 2001-02 2002-03 2003-04 2004-05 2005-06
1 Andhra Pradesh 1248 169 527 60 81 1296 1354
2 Arunachal Pradesh 0 0 0 0 0 0 0
3 Assam 3330 3330 6913 9281 9197 9197 8646
4 Bihar 327 361 339 563 569 496 549
5 Goa 0 0 0 0 0 0 0
6 Gujarat 5542 2360 9313 9399 18496 11625 22724
7 Haryana 477 172 210 584 1856 190 1526
8 Himachal Pradesh 90 0 0 0 0 4275 0
9 Jammu & Kashmir 33 19 42 96 84 84 84
10 Karnataka 763 477 885 1052 506 532 889
11 Kerala 1907 2035 2301 6495 6495 2080 442
12 Madhya Pradesh 58739 13547 19010 26766 48179 59160 48732
13 Maharashtra 7570 7116 9955 12437 13041 7459 9665
14 Manipur 0 0 0 0 0 0 0
15 Meghalaya 0 0 0 0 0 0 0
16 Mizoram 30 15 68 14 1496 34 1496
17 Nagaland 406 1712 1732 1818 15 1888 15
18 Orissa 9902 5445 5591 10814 7367 6233 8376
19 Punjab 1848 1844 1928 1958 2475 1677 3046
20 Rajasthan 9922 2822 12895 18885 19842 12830 9463
21 Sikkim 0 0 0 0 0 0 0
22 Tamil Nadu 318 355 731 699 558 438 376
23 Tripura 0 0 0 0 0 0 0
24 Uttar Pradesh 4293 6379 20133 29175 29175 35887 29175
25 West Bengal 2405 1919 3744 3060 4643 4539 6829
26 A & N Islands 0 0 0 0 0 0 0
27 Dadra & Nagar Haveli 0 0 0 0 0 0 0
28 Daman & Diu 0 0 0 0 0 0 0
29 Delhi 0 0 0 0 0 0 0
30 Lakshadweep 0 0 0 0 0 0 0
31 Puducherry 0 0 0 0 0 0 0
32 Chandigarh 0 0 0 0 0 0 0
33 Jharkhand 0 0 0 1061 1061 0 0
34 Chattisgarh 855 834 871 954 1084 1360 1417
35 Uttarakhand 0 0 0 2189 2189 1071 1397
Total 110004 50912 97186 137359 168409 162349 156201
( At Current Prices )
Statement 45 : Statewise Value of Output
Garlic
Page 101

Central Statistical OrganisationNational Accounts Division
(Rs. lakhs)
1999-00 2000-01 2001-02 2002-03 2003-04 2004-05 2005-06 State/U.Ts
1248 369 1106 113 125 1894 1894 1 Andhra Pradesh
0 0 0 0 0 0 0 2 Arunachal Pradesh
3330 3330 3330 3330 3300 3300 4256 3 Assam
327 295 262 262 295 303 336 4 Bihar
0 0 0 0 0 0 0 5 Goa
5542 2102 5688 6380 23188 19250 19250 6 Gujarat
477 268 326 326 1036 326 2620 7 Haryana
90 0 0 0 0 4275 0 8 Himachal Pradesh
33 19 20 34 30 30 30 9 Jammu & Kashmir
763 866 681 849 598 722 718 10 Karnataka
1907 1211 659 1387 1387 688 146 11 Kerala
58739 13547 19010 17013 30623 39642 30796 12 Madhya Pradesh
7570 7335 6026 7453 7721 6294 7553 13 Maharashtra
0 0 0 0 0 0 0 14 Manipur
0 0 0 0 0 0 0 15 Meghalaya
30 15 45 8 840 19 840 16 Mizoram
406 1694 1708 1708 14 1750 14 17 Nagaland
9902 5356 5356 6408 6500 6610 6711 18 Orissa
1848 1795 1923 1880 2260 1984 2260 19 Punjab
9922 4887 7695 13143 21449 15639 8414 20 Rajasthan
0 0 0 0 0 0 0 21 Sikkim
318 357 410 447 437 344 265 22 Tamil Nadu
0 0 0 0 0 0 0 23 Tripura
4293 6379 11966 17339 17339 21328 17339 24 Uttar Pradesh
2405 1001 1223 1115 1922 1922 2694 25 West Bengal
0 0 0 0 0 0 0 26 A & N Islands
0 0 0 0 0 0 0 27 Dadra & Nagar Haveli
0 0 0 0 0 0 0 28 Daman & Diu
0 0 0 0 0 0 0 29 Delhi
0 0 0 0 0 0 0 30 Lakshadweep
0 0 0 0 0 0 0 31 Puducherry
0 0 0 0 0 0 0 32 Chandigarh
0 0 0 311 311 0 0 33 Jharkhand
855 834 871 954 1084 1000 1042 34 Chattisgarh
0 0 0 1294 1294 1294 1294 35 Uttarakhand
110004 51661 68304 81755 121753 128615 108471 Total
Statement 45 : Statewise Value of Output( At 1999-00 Prices)
Garlic
Page 102

Central Statistical OrganisationNational Accounts Division
(Rs. lakhs)
State/U.Ts 1999-00 2000-01 2001-02 2002-03 2003-04 2004-05 2005-06
1 Andhra Pradesh 2333 4295 5718 3486 4240 2350 3370
2 Arunachal Pradesh 0 0 0 0 0 0 0
3 Assam 2383 3545 3996 3996 4642 4642 5176
4 Bihar 288 212 218 224 291 359 326
5 Goa 0 0 0 0 0 0 0
6 Gujarat 149 269 285 482 1953 3632 3958
7 Haryana 0 0 3805 3805 1179 1179 1554
8 Himachal Pradesh 0 0 0 0 0 0 0
9 Jammu & Kashmir 0 0 0 0 0 0 0
10 Karnataka 264 301 366 219 286 279 435
11 Kerala 0 0 0 0 0 0 0
12 Madhya Pradesh 11449 6243 7208 2753 10209 12068 11093
13 Maharashtra 0 0 0 0 0 0 0
14 Manipur 0 0 0 0 0 0 0
15 Meghalaya 0 0 0 0 0 0 0
16 Mizoram 0 0 0 0 0 0 0
17 Nagaland 22 22 22 22 33 33 33
18 Orissa 1708 680 1079 2506 2606 2521 2492
19 Punjab 0 0 0 0 0 0 0
20 Rajasthan 25523 37474 47027 28777 60332 24476 31992
21 Sikkim 0 0 0 0 0 0 0
22 Tamil Nadu 1929 1395 1588 1133 1938 1730 1442
23 Tripura 0 0 0 0 0 0 0
24 Uttar Pradesh 1188 1221 891 1104 1140 777 991
25 West Bengal 0 0 0 0 0 0 0
26 A & N Islands 0 0 0 0 0 0 0
27 Dadra & Nagar Haveli 0 0 0 0 0 0 0
28 Daman & Diu 0 0 0 0 0 0 0
29 Delhi 0 0 0 0 0 0 0
30 Lakshadweep 0 0 0 0 0 0 0
31 Puducherry 0 0 0 1 1 1 1
32 Chandigarh 0 0 0 0 0 0 0
33 Jharkhand 0 0 0 0 0 0 0
34 Chattisgarh 279 248 310 248 297 254 330
35 Uttarakhand 0 0 0 432 432 213 213
Total 47517 55905 72514 49189 89580 54514 63409
( At Current Prices )
Coriander
Statement 46 : Statewise Value of Output
Page 103

Central Statistical OrganisationNational Accounts Division
(Rs. lakhs)
1999-00 2000-01 2001-02 2002-03 2003-04 2004-05 2005-06 State/U.Ts
2333 3955 4491 2713 3164 1842 2571 1 Andhra Pradesh
0 0 0 0 0 0 0 2 Arunachal Pradesh
2383 2383 2383 2383 2768 2768 3685 3 Assam
288 203 203 203 254 339 288 4 Bihar
0 0 0 0 0 0 0 5 Goa
149 149 209 224 852 1584 2749 6 Gujarat
0 0 3805 3805 1179 1179 1554 7 Haryana
0 0 0 0 0 0 0 8 Himachal Pradesh
0 0 0 0 0 0 0 9 Jammu & Kashmir
264 209 257 155 165 209 196 10 Karnataka
0 0 0 0 0 0 0 11 Kerala
11449 4246 5867 1957 7257 8106 6491 12 Madhya Pradesh
0 0 0 0 0 0 0 13 Maharashtra
0 0 0 0 0 0 0 14 Manipur
0 0 0 0 0 0 0 15 Meghalaya
0 0 0 0 0 0 0 16 Mizoram
22 22 22 22 33 33 33 17 Nagaland
1708 645 1017 1480 1488 1504 1495 18 Orissa
0 0 0 0 0 0 0 19 Punjab
25523 33232 46732 24506 59933 33911 28429 20 Rajasthan
0 0 0 0 0 0 0 21 Sikkim
1929 942 1063 715 1231 1276 976 22 Tamil Nadu
0 0 0 0 0 0 0 23 Tripura
1188 1221 891 1023 1056 891 1056 24 Uttar Pradesh
0 0 0 0 0 0 0 25 West Bengal
0 0 0 0 0 0 0 26 A & N Islands
0 0 0 0 0 0 0 27 Dadra & Nagar Haveli
0 0 0 0 0 0 0 28 Daman & Diu
0 0 0 0 0 0 0 29 Delhi
0 0 0 0 0 0 0 30 Lakshadweep
0 0 0 1 1 1 1 31 Puducherry
0 0 0 0 0 0 0 32 Chandigarh
0 0 0 0 0 0 0 33 Jharkhand
279 187 208 208 249 208 228 34 Chattisgarh
0 0 0 531 531 274 274 35 Uttarakhand
47517 47394 67149 39926 80161 54124 50026 Total
( At 1999-00 Prices)
Coriander
Statement 46 : Statewise Value of Output
Page 104

Central Statistical OrganisationNational Accounts Division
(Rs. lakhs)
State/U.Ts 1999-00 2000-01 2001-02 2002-03 2003-04 2004-05 2005-06
1 Andhra Pradesh 5684 5361 4694 2700 3964 5278 3889
2 Arunachal Pradesh 0 0 0 457 3654 0 0
3 Assam 0 0 0 0 2228 0 0
4 Bihar 63 61 3 7 0 45 64
5 Goa 0 0 0 0 0 5 5
6 Gujarat 37174 15305 57590 51364 58707 68944 94853
7 Haryana 2648 1142 0 0 1712 1468 0
8 Himachal Pradesh 570 198 90 140 181 0 0
9 Jammu & Kashmir 1137 474 119 614 1125 921 921
10 Karnataka 14901 6093 4179 4158 6116 2612 6039
11 Kerala 8241 8426 6859 7386 7666 8025 7972
12 Madhya Pradesh 9853 1639 5558 2641 8494 12691 6717
13 Maharashtra 5204 4627 5032 5505 5993 3874 5840
14 Manipur 0 0 0 0 0 0 0
15 Meghalaya 0 0 0 0 0 0 0
16 Mizoram 0 0 48 44 48 67 67
17 Nagaland 0 6359 3320 0 0 0 0
18 Orissa 0 0 0 0 0 0 0
19 Punjab 842 293 308 266 91 915 583
20 Rajasthan 41120 98498 209574 182749 84754 55337 41004
21 Sikkim 0 0 0 0 0 0 0
22 Tamil Nadu 13977 12485 9232 9222 9285 15138 17153
23 Tripura 0 0 0 0 0 0 0
24 Uttar Pradesh 15312 11505 8278 7943 8661 11845 8262
25 West Bengal 2345 2329 2528 2506 3161 2786 2478
26 A & N Islands 65 32 26 41 79 68 99
27 Dadra & Nagar Haveli 0 0 0 0 0 0 0
28 Daman & Diu 0 0 0 0 0 0 0
29 Delhi 0 0 0 0 0 0 0
30 Lakshadweep 0 0 0 0 0 0 0
31 Puducherry 201 201 188 185 189 77 77
32 Chandigarh 0 0 0 0 0 0 0
33 Jharkhand 0 0 0 0 0 0 0
34 Chattisgarh 113 333 504 727 551 479 297
35 Uttarakhand 0 0 0 1540 327 1587 564
Total 159447 175362 318131 280195 206985 192162 196885
Statement 47 : Statewise Value of Output
( At Current Prices )
Other Condiments & Spices
Page 105

Central Statistical OrganisationNational Accounts Division
(Rs. lakhs)
1999-00 2000-01 2001-02 2002-03 2003-04 2004-05 2005-06 State/U.Ts
5684 5433 4856 2652 3472 4325 2915 1 Andhra Pradesh
0 0 0 457 3593 0 0 2 Arunachal Pradesh
0 0 0 0 2029 0 0 3 Assam
63 62 3 5 0 45 56 4 Bihar
0 0 0 0 0 2 2 5 Goa
37174 22631 44900 43887 61482 71861 89605 6 Gujarat
2648 1162 0 0 1634 1400 0 7 Haryana
570 178 71 107 138 0 0 8 Himachal Pradesh
1137 474 152 850 984 946 946 9 Jammu & Kashmir
14901 6444 4722 4767 6642 3792 6577 10 Karnataka
8241 8363 8409 8698 8813 9121 9020 11 Kerala
9853 1658 5697 2621 7726 11035 5938 12 Madhya Pradesh
5204 5129 5592 5609 5451 4119 6295 13 Maharashtra
0 0 0 0 0 0 0 14 Manipur
0 0 0 0 0 0 0 15 Meghalaya
0 0 61 48 48 67 67 16 Mizoram
0 4206 3067 0 0 0 0 17 Nagaland
0 0 0 0 0 0 0 18 Orissa
842 297 299 245 80 766 488 19 Punjab
41120 74881 152921 127971 116192 70628 50832 20 Rajasthan
0 0 0 0 0 0 0 21 Sikkim
13977 14471 14549 14799 14192 14494 14636 22 Tamil Nadu
0 0 0 0 0 0 0 23 Tripura
15312 16985 12222 9639 9487 14979 11345 24 Uttar Pradesh
2345 2470 2944 2762 2908 3112 3030 25 West Bengal
65 25 21 31 64 58 77 26 A & N Islands
0 0 0 0 0 0 0 27 Dadra & Nagar Haveli
0 0 0 0 0 0 0 28 Daman & Diu
0 0 0 0 0 0 0 29 Delhi
0 0 0 0 0 0 0 30 Lakshadweep
201 201 320 308 308 123 123 31 Puducherry
0 0 0 0 0 0 0 32 Chandigarh
0 0 0 0 0 0 0 33 Jharkhand
113 327 327 327 327 327 327 34 Chattisgarh
0 0 0 1842 391 1335 711 35 Uttarakhand
159447 165397 261131 227625 245961 212535 202990 Total
( At 1999-00 Prices)
Other Condiments & Spices
Statement 47 : Statewise Value of Output
Page 106

Central Statistical OrganisationNational Accounts Division
(Rs. lakhs)
State/U.Ts 1999-00 2000-01 2001-02 2002-03 2003-04 2004-05 2005-06
1 Andhra Pradesh 270484 289930 256965 214656 396338 384925 340485
2 Arunachal Pradesh 5711 5899 6273 6029 10015 5841 6046
3 Assam 95935 121733 81678 85350 87722 114711 135979
4 Bihar 3704 3140 2677 2437 2802 2815 3586
5 Goa 928 1933 1240 1201 1502 1395 1899
6 Gujarat 54619 28189 78906 72801 87774 96282 130869
7 Haryana 5332 3657 6355 6592 9544 7697 31672
8 Himachal Pradesh 4009 1816 3734 5778 5850 17617 21043
9 Jammu & Kashmir 1504 828 289 1209 1783 1977 1977
10 Karnataka 317604 206413 176610 161660 186205 181772 275352
11 Kerala 277659 212913 146238 178534 162747 173299 165206
12 Madhya Pradesh 91111 29335 43438 46878 86281 105773 85174
13 Maharashtra 43006 35834 39246 42573 43467 36194 39834
14 Manipur 3873 2207 3771 4895 5254 4095 3302
15 Meghalaya 7120 8291 8608 8621 9240 9229 9982
16 Mizoram 2611 2435 4597 3940 4855 3358 4891
17 Nagaland 4193 13740 9752 6601 5234 8430 11883
18 Orissa 61904 42826 45016 62233 66441 61692 64880
19 Punjab 11732 11143 12399 5397 5898 5258 7127
20 Rajasthan 98392 151883 287519 236727 176842 103106 88049
21 Sikkim 5209 7559 8239 7771 8721 9404 9646
22 Tamil Nadu 79069 59257 60998 47817 49290 53060 82668
23 Tripura 4382 6556 7924 7360 7233 15619 7322
24 Uttar Pradesh 29590 25758 35914 44555 46729 56001 47236
25 West Bengal 56963 57751 56663 64198 81759 80689 84549
26 A & N Islands 3536 4148 4917 5106 4963 4237 4268
27 Dadra & Nagar Haveli 0 0 0 0 0 0 0
28 Daman & Diu 0 0 0 0 0 0 0
29 Delhi 20 43 1 1 1 2 1
30 Lakshadweep 0 0 0 0 0 0 0
31 Puducherry 624 410 385 384 388 211 211
32 Chandigarh 0 0 0 0 0 0 0
33 Jharkhand 142 0 0 1061 1061 0 0
34 Chattisgarh 2042 2805 4151 5110 4472 4112 3370
35 Uttarakhand 1679 929 994 9447 8233 10951 5085
Total 1544686 1339362 1395496 1346923 1568648 1559753 1673592
Statement 39-47 : Statewise Value of Output
( At Current Prices )
Total Condiments & Spices
Page 107

Central Statistical OrganisationNational Accounts Division
(Rs. lakhs)
1999-00 2000-01 2001-02 2002-03 2003-04 2004-05 2005-06 State/U.Ts
270484 298900 289599 227361 377714 388005 336895 1 Andhra Pradesh
5711 5897 6293 6026 9845 5746 5761 2 Arunachal Pradesh
95935 116979 119983 120228 117797 117551 124579 3 Assam
3704 3235 2719 2080 2123 2312 2803 4 Bihar
928 1432 1207 1207 1297 1209 1274 5 Goa
54619 35190 61774 59927 92908 109302 118956 6 Gujarat
5332 3814 6545 6279 8544 7659 29548 7 Haryana
4009 1673 2941 4433 4479 17616 14723 8 Himachal Pradesh
1504 828 333 1567 1514 1969 1969 9 Jammu & Kashmir
317604 346041 354507 355848 317314 328077 352575 10 Karnataka
277659 317329 307626 355261 357583 376505 421917 11 Kerala
91111 27449 42490 36155 63174 77734 59698 12 Madhya Pradesh
43006 40509 39962 39143 35846 34512 38360 13 Maharashtra
3873 4078 4333 5651 7460 4694 3801 14 Manipur
7120 7376 7519 7527 8023 8022 8611 15 Meghalaya
2611 2061 3461 2854 3065 2179 3051 16 Mizoram
4193 9735 9216 6166 4832 7673 10893 17 Nagaland
61904 43562 45184 47392 47766 48010 48245 18 Orissa
11732 11227 12071 5054 5269 4981 5676 19 Punjab
98392 129562 231202 173159 212807 134872 96046 20 Rajasthan
5209 7781 7866 7295 7847 8176 8176 21 Sikkim
79069 69931 73088 47916 47871 62622 72393 22 Tamil Nadu
4382 7047 7950 7749 7160 16210 7163 23 Tripura
29590 33873 34098 35506 36241 46344 41000 24 Uttar Pradesh
56963 57644 59113 64321 69542 73512 75989 25 West Bengal
3536 4043 4088 4242 4052 3312 3330 26 A & N Islands
0 0 0 0 0 0 0 27 Dadra & Nagar Haveli
0 0 0 0 0 0 0 28 Daman & Diu
20 45 2 2 2 2 2 29 Delhi
0 0 0 0 0 0 0 30 Lakshadweep
624 415 531 532 532 290 290 31 Puducherry
0 0 0 0 0 0 0 32 Chandigarh
142 0 0 311 311 0 0 33 Jharkhand
2042 2130 2629 2987 2895 2600 2315 34 Chattisgarh
1679 911 984 10000 8549 9699 5935 35 Uttarakhand
1544686 1590696 1739315 1644178 1864363 1901393 1901974 Total
Statement 39-47 : Statewise Value of Output( At 1999-00 Prices)
Total Condiments & Spices
Page 108

Central Statistical OrganisationNational Accounts Division
(Rs. lakhs)
State/U.Ts 1999-00 2000-01 2001-02 2002-03 2003-04 2004-05 2005-06
1 Andhra Pradesh 56474 62027 57734 79767 40148 78257 75958
2 Arunachal Pradesh 984 1056 984 1104 1104 1173 1242
3 Assam 26339 28898 32600 42589 52600 63142 82613
4 Bihar 31911 17207 17010 23744 16551 17155 18392
5 Goa 461 485 939 534 608 792 840
6 Gujarat 29820 30529 43529 58790 63333 60804 82715
7 Haryana 0 0 0 0 0 0 0
8 Himachal Pradesh 0 0 0 0 0 0 0
9 Jammu & Kashmir 0 0 0 0 0 0 0
10 Karnataka 96571 47060 43259 68023 53463 59249 66684
11 Kerala 53597 55501 57208 63401 74528 86636 87606
12 Madhya Pradesh 24518 23307 28946 33507 21424 21973 24282
13 Maharashtra 138672 134677 137457 126984 132534 136543 142093
14 Manipur 5227 5335 5634 4845 5166 5586 5975
15 Meghalaya 1300 1314 1340 1412 1438 1492 1577
16 Mizoram 672 706 729 756 752 611 611
17 Nagaland 2052 5225 5299 5475 500 520 520
18 Orissa 4272 4562 7937 8558 7155 8769 8772
19 Punjab 0 0 0 0 0 0 0
20 Rajasthan 0 0 45 39 13 0 0
21 Sikkim 0 50 50 0 0 0 0
22 Tamil Nadu 131427 159706 186804 155490 156942 231179 190785
23 Tripura 2543 5912 6141 6151 6149 6149 6149
24 Uttar Pradesh 2543 2091 2485 4390 3830 3847 3830
25 West Bengal 33391 35435 35886 51892 55740 57558 55817
26 A & N Islands 633 826 845 790 865 1157 1157
27 Dadra & Nagar Haveli 0 0 0 0 0 0 0
28 Daman & Diu 0 0 4 4 4 0 0
29 Delhi 0 0 0 0 0 0 0
30 Lakshadweep 23 23 31 31 31 31 31
31 Puducherry 623 649 713 1298 840 874 874
32 Chandigarh 0 0 0 0 0 0 0
33 Jharkhand 2007 481 1704 1485 1485 1485 3101
34 Chattisgarh 437 1482 836 1664 859 608 609
35 Uttarakhand 0 0 0 0 0 0 0
Total 646495 624542 676147 742722 698060 845589 862231
Statement 48 : Statewise Value of Output
( At Current Prices )
Banana
Page 109

Central Statistical OrganisationNational Accounts Division
(Rs. lakhs)
1999-00 2000-01 2001-02 2002-03 2003-04 2004-05 2005-06 State/U.Ts
56474 59501 55269 74621 37383 71137 67870 1 Andhra Pradesh
984 1056 984 1104 1104 1104 1104 2 Arunachal Pradesh
26339 26660 27378 26637 26863 26248 26099 3 Assam
31911 19751 18298 25542 12501 16259 16259 4 Bihar
461 470 496 502 541 634 672 5 Goa
29820 27838 32124 39048 56564 55084 55084 6 Gujarat
0 0 0 0 0 0 0 7 Haryana
0 0 0 0 0 0 0 8 Himachal Pradesh
0 0 0 0 0 0 0 9 Jammu & Kashmir
96571 107971 110685 92508 58559 58559 58559 10 Karnataka
53597 48494 54114 55081 55797 55797 62110 11 Kerala
24518 23307 21039 24354 17031 16316 15369 12 Madhya Pradesh
138672 146725 147950 136014 136673 136673 136673 13 Maharashtra
5227 5262 6589 5783 6166 6166 6595 14 Manipur
1300 1314 1308 1346 1371 1390 1470 15 Meghalaya
672 706 731 782 689 689 689 16 Mizoram
2052 4950 4968 4978 450 450 450 17 Nagaland
4272 4509 6891 6891 5308 5957 5959 18 Orissa
0 0 0 0 0 0 0 19 Punjab
0 0 34 29 10 0 0 20 Rajasthan
0 50 50 0 0 0 0 21 Sikkim
131427 128796 148706 119036 105517 145257 115986 22 Tamil Nadu
2543 5838 5848 5848 5838 5838 5838 23 Tripura
2543 2091 2485 3550 3685 3685 3685 24 Uttar Pradesh
33391 33773 37169 45595 50590 51639 51639 25 West Bengal
633 699 715 669 732 979 979 26 A & N Islands
0 0 0 0 0 0 0 27 Dadra & Nagar Haveli
0 0 2 2 2 0 0 28 Daman & Diu
0 0 0 0 0 0 0 29 Delhi
23 23 31 31 31 31 31 30 Lakshadweep
623 511 525 1092 707 728 728 31 Puducherry
0 0 0 0 0 0 0 32 Chandigarh
2007 465 1441 1441 1441 1441 3009 33 Jharkhand
437 1347 760 1513 781 553 815 34 Chattisgarh
0 0 0 0 0 0 0 35 Uttarakhand
646495 652106 686590 673997 586333 662614 637674 Total
Statement 48 : Statewise Value of Output( At 1999-00 Prices)
Banana
Page 110

Central Statistical OrganisationNational Accounts Division
(Rs. lakhs)
State/U.Ts 1999-00 2000-01 2001-02 2002-03 2003-04 2004-05 2005-06
1 Andhra Pradesh 30000 24375 30418 32052 35949 33983 36935
2 Arunachal Pradesh 0 0 0 0 0 0 0
3 Assam 0 0 0 0 0 0 0
4 Bihar 0 0 0 0 0 0 0
5 Goa 11400 8050 10440 11262 11219 11752 10544
6 Gujarat 0 0 0 0 0 0 0
7 Haryana 0 0 0 0 0 0 0
8 Himachal Pradesh 0 0 0 0 0 0 0
9 Jammu & Kashmir 0 0 0 0 0 0 0
10 Karnataka 15551 10647 10543 10943 14107 11033 15516
11 Kerala 39690 18968 24102 26565 28242 24369 25512
12 Madhya Pradesh 0 0 0 0 0 0 0
13 Maharashtra 56146 35819 32176 44031 44031 57916 63280
14 Manipur 0 0 0 0 0 0 0
15 Meghalaya 9011 9450 9627 10095 10102 13213 9610
16 Mizoram 0 0 0 0 0 0 0
17 Nagaland 0 0 0 0 0 0 0
18 Orissa 5369 7866 12857 9108 9295 9947 10914
19 Punjab 0 0 0 0 0 0 0
20 Rajasthan 0 0 0 0 0 0 0
21 Sikkim 0 0 0 0 0 0 0
22 Tamil Nadu 16478 21605 16844 18309 18675 25604 21910
23 Tripura 2080 2080 2080 242 242 242 242
24 Uttar Pradesh 0 0 0 0 0 0 0
25 West Bengal 14746 15287 13813 17066 17917 19052 21283
26 A & N Islands 660 200 200 232 232 232 232
27 Dadra & Nagar Haveli 0 0 0 0 0 0 0
28 Daman & Diu 0 0 0 0 0 0 0
29 Delhi 0 0 0 0 0 0 0
30 Lakshadweep 0 0 0 0 0 0 0
31 Puducherry 200 200 281 6 6 17 120
32 Chandigarh 0 0 0 0 0 0 0
33 Jharkhand 0 0 0 0 0 0 0
34 Chattisgarh 0 0 0 0 0 0 0
35 Uttarakhand 0 0 0 0 0 0 0
Total 201330 154546 163382 179911 190016 207360 216096
Statement 49 : Statewise Value of Output
( At Current Prices )
Cashewnut
Page 111
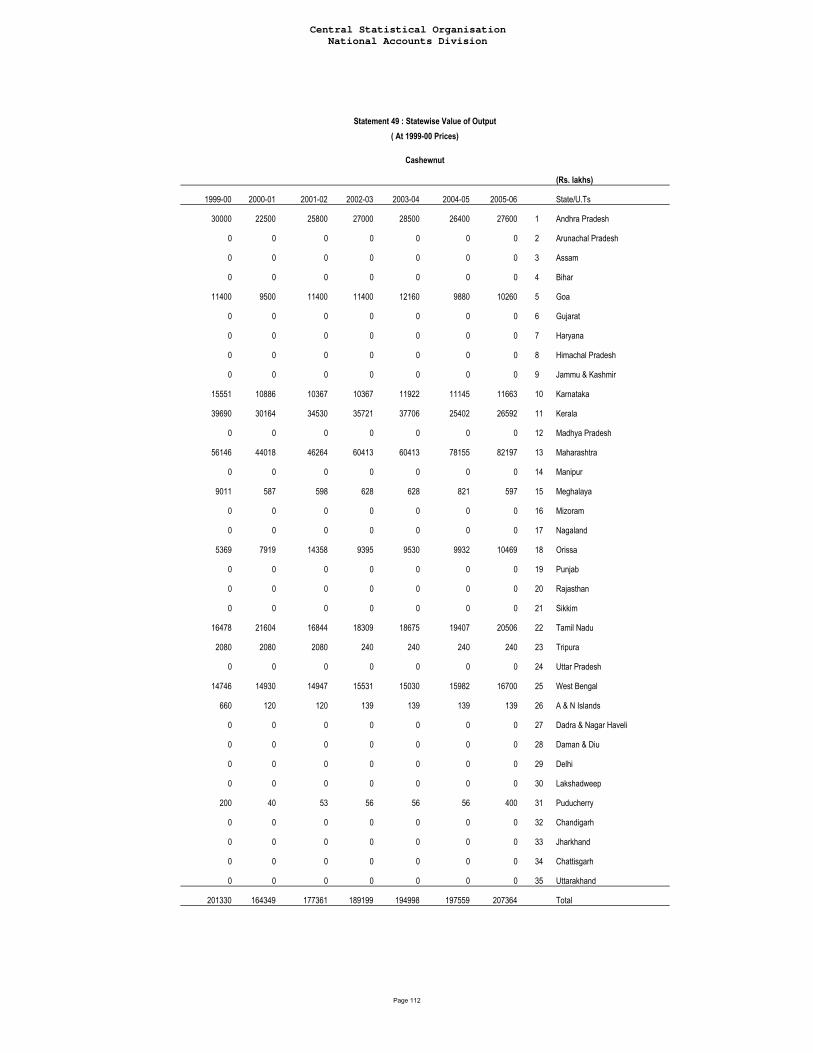
Central Statistical OrganisationNational Accounts Division
(Rs. lakhs)
1999-00 2000-01 2001-02 2002-03 2003-04 2004-05 2005-06 State/U.Ts
30000 22500 25800 27000 28500 26400 27600 1 Andhra Pradesh
0 0 0 0 0 0 0 2 Arunachal Pradesh
0 0 0 0 0 0 0 3 Assam
0 0 0 0 0 0 0 4 Bihar
11400 9500 11400 11400 12160 9880 10260 5 Goa
0 0 0 0 0 0 0 6 Gujarat
0 0 0 0 0 0 0 7 Haryana
0 0 0 0 0 0 0 8 Himachal Pradesh
0 0 0 0 0 0 0 9 Jammu & Kashmir
15551 10886 10367 10367 11922 11145 11663 10 Karnataka
39690 30164 34530 35721 37706 25402 26592 11 Kerala
0 0 0 0 0 0 0 12 Madhya Pradesh
56146 44018 46264 60413 60413 78155 82197 13 Maharashtra
0 0 0 0 0 0 0 14 Manipur
9011 587 598 628 628 821 597 15 Meghalaya
0 0 0 0 0 0 0 16 Mizoram
0 0 0 0 0 0 0 17 Nagaland
5369 7919 14358 9395 9530 9932 10469 18 Orissa
0 0 0 0 0 0 0 19 Punjab
0 0 0 0 0 0 0 20 Rajasthan
0 0 0 0 0 0 0 21 Sikkim
16478 21604 16844 18309 18675 19407 20506 22 Tamil Nadu
2080 2080 2080 240 240 240 240 23 Tripura
0 0 0 0 0 0 0 24 Uttar Pradesh
14746 14930 14947 15531 15030 15982 16700 25 West Bengal
660 120 120 139 139 139 139 26 A & N Islands
0 0 0 0 0 0 0 27 Dadra & Nagar Haveli
0 0 0 0 0 0 0 28 Daman & Diu
0 0 0 0 0 0 0 29 Delhi
0 0 0 0 0 0 0 30 Lakshadweep
200 40 53 56 56 56 400 31 Puducherry
0 0 0 0 0 0 0 32 Chandigarh
0 0 0 0 0 0 0 33 Jharkhand
0 0 0 0 0 0 0 34 Chattisgarh
0 0 0 0 0 0 0 35 Uttarakhand
201330 164349 177361 189199 194998 197559 207364 Total
Statement 49 : Statewise Value of Output( At 1999-00 Prices)
Cashewnut
Page 112

Central Statistical OrganisationNational Accounts Division
(Rs. lakhs)
State/U.Ts 1999-00 2000-01 2001-02 2002-03 2003-04 2004-05 2005-06
1 Andhra Pradesh 596 734 790 986 1096 1432 1945
2 Arunachal Pradesh 1685 2202 2021 1903 1894 1788 1952
3 Assam 26300 28447 37179 32562 30865 33855 20327
4 Bihar 30612 33063 39866 44180 39418 32043 37166
5 Goa 0 0 0 0 0 0 0
6 Gujarat 21425 27806 35184 20943 23206 43602 48461
7 Haryana 6500 5665 11068 6872 13832 6962 13477
8 Himachal Pradesh 8454 11496 10839 10675 12921 11846 7538
9 Jammu & Kashmir 1064 764 1672 1042 872 845 345
10 Karnataka 16313 15901 22700 7447 12166 14422 12984
11 Kerala 0 0 0 0 0 0 0
12 Madhya Pradesh 26429 15700 23770 28855 32276 39656 34203
13 Maharashtra 2744 3530 4332 3280 4431 4226 5286
14 Manipur 778 816 1941 1686 1860 1490 2421
15 Meghalaya 7962 8658 10176 10914 9711 10008 9740
16 Mizoram 320 306 398 80 98 268 419
17 Nagaland 1872 2213 2927 720 2756 6413 7020
18 Orissa 3038 3271 3364 3653 3783 5071 5030
19 Punjab 19833 14549 39260 42007 31426 43045 58266
20 Rajasthan 1155 683 1119 735 805 1832 2690
21 Sikkim 730 774 1251 1197 1711 1739 1784
22 Tamil Nadu 2919 4149 5579 4542 4856 5077 6116
23 Tripura 5000 5528 7032 7660 6185 6454 6454
24 Uttar Pradesh 227922 291172 327473 347757 321252 377919 384272
25 West Bengal 183935 181476 257771 210392 248937 212858 338680
26 A & N Islands 0 0 0 0 0 0 0
27 Dadra & Nagar Haveli 0 0 0 0 0 0 0
28 Daman & Diu 0 0 0 0 0 0 0
29 Delhi 922 862 1486 1165 983 1043 37
30 Lakshadweep 0 0 0 0 0 0 0
31 Puducherry 0 0 0 0 0 0 0
32 Chandigarh 120 122 123 125 210 127 127
33 Jharkhand 10635 0 20263 19313 19313 34213 51918
34 Chattisgarh 3312 3366 3980 4888 3936 4376 3635
35 Uttarakhand 7849 10000 9652 4142 6912 9484 10057
Total 620426 673254 883219 819719 837714 912098 1072350
Statement 50 : Statewise Value of Output
( At Current Prices )
Potato
Page 113

Central Statistical OrganisationNational Accounts Division
(Rs. lakhs)
1999-00 2000-01 2001-02 2002-03 2003-04 2004-05 2005-06 State/U.Ts
596 738 791 986 1265 1423 1529 1 Andhra Pradesh
1685 1908 1695 1570 1539 1430 1550 2 Arunachal Pradesh
26300 24977 23342 22177 20410 22143 13295 3 Assam
30612 33624 33907 35453 32457 25518 29597 4 Bihar
0 0 0 0 0 0 0 5 Goa
21425 22278 24950 24266 22984 33869 37643 6 Gujarat
6500 6438 8525 8028 11003 8098 9360 7 Haryana
8454 11496 8718 8586 10392 9528 5754 8 Himachal Pradesh
1064 712 832 766 762 588 240 9 Jammu & Kashmir
16313 17525 18335 5782 13277 13982 12587 10 Karnataka
0 0 0 0 0 0 0 11 Kerala
26429 14427 17026 16379 22418 25268 18882 12 Madhya Pradesh
2744 2801 2963 2920 2843 2870 2920 13 Maharashtra
778 820 1420 1333 1574 947 1538 14 Manipur
7962 8023 8840 9335 8307 8496 8268 15 Meghalaya
320 272 288 56 72 200 312 16 Mizoram
1872 1916 2297 488 1764 3801 4161 17 Nagaland
3038 3077 2808 2518 2715 2830 2689 18 Orissa
19833 15061 14861 17583 17540 16975 15515 19 Punjab
1155 687 683 668 660 1179 1353 20 Rajasthan
730 726 1135 1047 1456 1434 1434 21 Sikkim
2919 4177 4084 3231 2834 3198 3016 22 Tamil Nadu
5000 5165 5315 5605 4480 4675 4675 23 Tripura
227922 199371 227190 241263 209517 233164 237084 24 Uttar Pradesh
183935 188626 192293 169682 187360 173962 183448 25 West Bengal
0 0 0 0 0 0 0 26 A & N Islands
0 0 0 0 0 0 0 27 Dadra & Nagar Haveli
0 0 0 0 0 0 0 28 Daman & Diu
922 804 689 832 732 670 14 29 Delhi
0 0 0 0 0 0 0 30 Lakshadweep
0 0 0 0 0 0 0 31 Puducherry
120 120 120 120 120 120 120 32 Chandigarh
10635 0 5981 20536 20536 20536 20536 33 Jharkhand
3312 2640 2568 2444 1968 2188 1892 34 Chattisgarh
7849 8067 6101 3301 6359 5823 6175 35 Uttarakhand
620426 576477 617756 606956 607344 624915 625588 Total
Statement 50 : Statewise Value of Output( At 1999-00 Prices)
Potato
Page 114

Central Statistical OrganisationNational Accounts Division
(Rs. lakhs)
State/U.Ts 1999-00 2000-01 2001-02 2002-03 2003-04 2004-05 2005-06
1 Andhra Pradesh 668 1244 1182 1184 425 404 551
2 Arunachal Pradesh 0 0 0 0 0 0 0
3 Assam 1182 1307 1499 1246 1633 1575 1834
4 Bihar 2924 2720 2799 2799 2848 3002 3591
5 Goa 1 1 13 17 0 0 0
6 Gujarat 218 793 879 100 136 142 1493
7 Haryana 83 148 95 104 119 130 130
8 Himachal Pradesh 0 0 0 0 0 0 0
9 Jammu & Kashmir 0 0 0 0 0 0 0
10 Karnataka 1028 1160 673 824 724 731 666
11 Kerala 271 264 283 389 446 384 332
12 Madhya Pradesh 1464 1201 1446 1548 1437 1605 1342
13 Maharashtra 3158 3029 3509 3992 3110 4274 5066
14 Manipur 11 8 12 12 12 0 0
15 Meghalaya 606 609 582 587 576 591 595
16 Mizoram 105 116 147 152 67 68 68
17 Nagaland 400 289 429 455 456 41 41
18 Orissa 14842 11570 15136 25524 24423 26655 27246
19 Punjab 61 3 3 21 21 0 0
20 Rajasthan 111 73 76 60 121 284 256
21 Sikkim 0 0 0 0 0 0 0
22 Tamil Nadu 186 204 204 697 522 769 1409
23 Tripura 294 332 437 463 436 436 436
24 Uttar Pradesh 12694 10924 10924 12411 14773 14773 15430
25 West Bengal 17827 16867 13481 14553 16135 16985 17826
26 A & N Islands 8 51 24 24 156 156 156
27 Dadra & Nagar Haveli 0 0 0 0 0 0 0
28 Daman & Diu 0 0 0 0 0 0 0
29 Delhi 0 0 0 0 0 0 0
30 Lakshadweep 0 0 0 0 0 0 0
31 Puducherry 0 0 0 0 0 0 0
32 Chandigarh 0 0 0 0 0 0 0
33 Jharkhand 3183 0 4072 3206 3206 4120 9270
34 Chattisgarh 1089 1389 1494 1222 1056 1190 1311
35 Uttarakhand 0 0 0 0 0 0 0
Total 62412 54301 59399 71591 72841 78314 89047
( At Current Prices )
Sweet Potato
Statement 51 : Statewise Value of Output
Page 115

Central Statistical OrganisationNational Accounts Division
(Rs. lakhs)
1999-00 2000-01 2001-02 2002-03 2003-04 2004-05 2005-06 State/U.Ts
668 1226 1226 1226 433 385 433 1 Andhra Pradesh
0 0 0 0 0 0 0 2 Arunachal Pradesh
1182 1094 1109 1109 1022 1022 945 3 Assam
2924 2168 2382 2382 2013 1743 1743 4 Bihar
1 1 13 13 0 0 0 5 Goa
218 711 796 120 120 120 1241 6 Gujarat
83 154 99 99 110 110 110 7 Haryana
0 0 0 0 0 0 0 8 Himachal Pradesh
0 0 0 0 0 0 0 9 Jammu & Kashmir
1028 1138 1163 1187 1266 1283 1177 10 Karnataka
271 225 220 265 304 263 228 11 Kerala
1464 1182 1266 1278 1308 1422 1320 12 Madhya Pradesh
3158 2716 2627 3012 2837 3109 3324 13 Maharashtra
11 7 7 7 7 0 0 14 Manipur
606 609 574 574 560 567 571 15 Meghalaya
105 105 105 105 45 45 45 16 Mizoram
400 289 289 295 292 26 26 17 Nagaland
14842 11179 12855 16159 16173 16202 16202 18 Orissa
61 3 3 26 26 0 0 19 Punjab
111 72 75 56 117 169 125 20 Rajasthan
0 0 0 0 0 0 0 21 Sikkim
186 201 201 201 149 210 294 22 Tamil Nadu
294 315 318 318 275 275 275 23 Tripura
12694 10923 10923 11201 10125 10125 10574 24 Uttar Pradesh
17827 18016 14196 14316 15723 15987 15987 25 West Bengal
8 34 16 16 104 104 104 26 A & N Islands
0 0 0 0 0 0 0 27 Dadra & Nagar Haveli
0 0 0 0 0 0 0 28 Daman & Diu
0 0 0 0 0 0 0 29 Delhi
0 0 0 0 0 0 0 30 Lakshadweep
0 0 0 0 0 0 0 31 Puducherry
0 0 0 0 0 0 0 32 Chandigarh
3183 0 3246 3246 3246 3246 3246 33 Jharkhand
1089 1521 1599 1103 992 992 953 34 Chattisgarh
0 0 0 0 0 0 0 35 Uttarakhand
62412 53889 55308 58313 57245 57403 58921 Total
Statement 51 : Statewise Value of Output( At 1999-00 Prices)
Sweet Potato
Page 116

Central Statistical OrganisationNational Accounts Division
(Rs. lakhs)
State/U.Ts 1999-00 2000-01 2001-02 2002-03 2003-04 2004-05 2005-06
1 Andhra Pradesh 4916 7142 5861 3204 5277 7447 6383
2 Arunachal Pradesh 0 0 0 0 0 0 0
3 Assam 192 236 330 293 304 295 300
4 Bihar 0 0 0 0 0 0 0
5 Goa 0 0 0 0 0 0 0
6 Gujarat 0 0 0 0 0 0 0
7 Haryana 0 0 0 0 0 0 0
8 Himachal Pradesh 0 0 0 0 0 0 0
9 Jammu & Kashmir 0 0 0 0 0 0 0
10 Karnataka 401 282 379 380 375 337 367
11 Kerala 94885 89120 84735 97857 95732 96669 101885
12 Madhya Pradesh 0 0 0 0 0 0 0
13 Maharashtra 0 0 0 0 0 0 0
14 Manipur 2 0 3 10 0 0 0
15 Meghalaya 301 307 299 299 309 319 322
16 Mizoram 100 100 72 130 52 52 89
17 Nagaland 426 800 572 662 747 106 106
18 Orissa 0 0 0 0 0 0 0
19 Punjab 0 0 0 0 0 0 0
20 Rajasthan 9 6 16 16 9 9 9
21 Sikkim 41 41 41 41 0 0 0
22 Tamil Nadu 67869 94462 59035 73180 89300 108395 115368
23 Tripura 0 0 0 0 0 0 0
24 Uttar Pradesh 0 0 0 0 0 0 0
25 West Bengal 0 0 0 0 0 0 0
26 A & N Islands 60 92 96 684 294 200 300
27 Dadra & Nagar Haveli 0 0 0 0 0 0 0
28 Daman & Diu 0 0 0 0 0 0 0
29 Delhi 0 0 0 0 0 0 0
30 Lakshadweep 0 0 0 0 0 0 0
31 Puducherry 371 373 611 567 701 887 851
32 Chandigarh 0 0 0 0 0 0 0
33 Jharkhand 0 0 0 0 0 0 0
34 Chattisgarh 0 0 0 0 0 0 0
35 Uttarakhand 0 0 0 0 0 0 0
Total 169573 192962 152049 177324 193100 214717 225981
Statement 52 : Statewise Value of Output
( At Current Prices )
Tapoica
Page 117

Central Statistical OrganisationNational Accounts Division
(Rs. lakhs)
1999-00 2000-01 2001-02 2002-03 2003-04 2004-05 2005-06 State/U.Ts
4916 7336 6466 3511 5388 6493 5565 1 Andhra Pradesh
0 0 0 0 0 0 0 2 Arunachal Pradesh
192 207 207 200 201 193 196 3 Assam
0 0 0 0 0 0 0 4 Bihar
0 0 0 0 0 0 0 5 Goa
0 0 0 0 0 0 0 6 Gujarat
0 0 0 0 0 0 0 7 Haryana
0 0 0 0 0 0 0 8 Himachal Pradesh
0 0 0 0 0 0 0 9 Jammu & Kashmir
401 396 356 420 415 406 346 10 Karnataka
94885 95751 90906 92697 94044 90195 95062 11 Kerala
0 0 0 0 0 0 0 12 Madhya Pradesh
0 0 0 0 0 0 0 13 Maharashtra
2 0 3 3 0 0 0 14 Manipur
301 307 288 288 288 288 291 15 Meghalaya
100 100 60 89 35 35 60 16 Mizoram
426 480 483 484 477 66 66 17 Nagaland
0 0 0 0 0 0 0 18 Orissa
0 0 0 0 0 0 0 19 Punjab
9 6 16 16 9 9 9 20 Rajasthan
41 41 41 41 0 0 0 21 Sikkim
67869 89252 86291 57607 66519 94827 100927 22 Tamil Nadu
0 0 0 0 0 0 0 23 Tripura
0 0 0 0 0 0 0 24 Uttar Pradesh
0 0 0 0 0 0 0 25 West Bengal
60 69 72 342 147 150 150 26 A & N Islands
0 0 0 0 0 0 0 27 Dadra & Nagar Haveli
0 0 0 0 0 0 0 28 Daman & Diu
0 0 0 0 0 0 0 29 Delhi
0 0 0 0 0 0 0 30 Lakshadweep
371 340 544 472 585 683 655 31 Puducherry
0 0 0 0 0 0 0 32 Chandigarh
0 0 0 0 0 0 0 33 Jharkhand
0 0 0 0 0 0 0 34 Chattisgarh
0 0 0 0 0 0 0 35 Uttarakhand
169573 194284 185733 156171 168110 193344 203327 Total
Statement 52 : Statewise Value of Output( At 1999-00 Prices)
Tapoica
Page 118

Central Statistical OrganisationNational Accounts Division
(Rs. lakhs)
State/U.Ts 1999-00 2000-01 2001-02 2002-03 2003-04 2004-05 2005-06
1 Andhra Pradesh 19723 21593 24039 17958 24684 29091 34495
2 Arunachal Pradesh 0 0 0 0 0 0 0
3 Assam 1582 1579 1492 1298 1936 1582 2447
4 Bihar 3405 3669 4015 4339 5336 4397 7037
5 Goa 0 0 0 0 0 0 0
6 Gujarat 13395 4260 14744 19843 41021 27016 89270
7 Haryana 2404 6310 8785 8848 8929 13453 14702
8 Himachal Pradesh 273 707 462 286 529 529 303
9 Jammu & Kashmir 89 56 90 83 90 8 8
10 Karnataka 17282 21073 27306 18871 28047 28043 53862
11 Kerala 0 0 0 0 0 0 0
12 Madhya Pradesh 10473 11939 14211 20700 19712 27039 32890
13 Maharashtra 45013 67915 48734 49495 87188 147501 127946
14 Manipur 0 55 110 39 165 165 290
15 Meghalaya 119 218 236 266 103 104 104
16 Mizoram 0 12 206 35 38 38 38
17 Nagaland 944 3084 2183 2323 1854 1895 1895
18 Orissa 19183 1333 1030 1919 19121 16135 19680
19 Punjab 949 857 446 514 906 937 10789
20 Rajasthan 8823 8172 9844 7212 8270 10854 13892
21 Sikkim 0 0 0 0 0 0 0
22 Tamil Nadu 10653 9638 10084 8004 11406 12128 12132
23 Tripura 17 9 18 18 20 20 20
24 Uttar Pradesh 10875 10243 13540 11913 15764 10806 20901
25 West Bengal 7462 7226 8763 9101 13110 10538 11108
26 A & N Islands 0 0 0 0 0 0 0
27 Dadra & Nagar Haveli 0 0 0 0 0 0 0
28 Daman & Diu 0 0 0 0 0 0 0
29 Delhi 1812 1416 1005 1838 1631 1810 16
30 Lakshadweep 0 0 0 0 0 0 0
31 Puducherry 14 13 19 18 59 106 106
32 Chandigarh 12 0 0 0 0 4 4
33 Jharkhand 1629 0 6378 1795 1795 3447 8961
34 Chattisgarh 2752 1453 1797 1890 1765 1424 1457
35 Uttarakhand 1493 962 960 221 1017 964 1310
Total 180374 183791 200497 188827 294495 350032 465662
Statement 53 : Statewise Value of Output
( At Current Prices )
Onion
Page 119

Central Statistical OrganisationNational Accounts Division
(Rs. lakhs)
1999-00 2000-01 2001-02 2002-03 2003-04 2004-05 2005-06 State/U.Ts
19723 20244 21111 15568 19621 22753 26262 1 Andhra Pradesh
0 0 0 0 0 0 0 2 Arunachal Pradesh
1582 1582 1563 1563 1563 1545 1683 3 Assam
3405 3338 3070 2769 3272 2525 3037 4 Bihar
0 0 0 0 0 0 0 5 Goa
13395 3899 19027 21321 43965 36348 63244 6 Gujarat
2404 6156 9476 9044 11788 11788 12708 7 Haryana
273 707 462 424 688 688 377 8 Himachal Pradesh
89 52 78 78 72 7 7 9 Jammu & Kashmir
17282 19337 20953 15570 10476 24875 25282 10 Karnataka
0 0 0 0 0 0 0 11 Kerala
10473 8798 10473 11131 13428 17281 18455 12 Madhya Pradesh
45013 54545 42246 46125 53171 80294 79805 13 Maharashtra
0 0 49 18 74 74 130 14 Manipur
119 203 210 237 91 91 91 15 Meghalaya
0 10 120 20 20 20 20 16 Mizoram
944 2112 2112 2112 1648 1648 1648 17 Nagaland
19183 1273 989 1546 12512 12596 12698 18 Orissa
949 1316 771 687 1080 1080 8859 19 Punjab
8823 8405 10503 7927 12681 17711 21748 20 Rajasthan
0 0 0 0 0 0 0 21 Sikkim
10653 10218 9415 6682 7127 8652 7889 22 Tamil Nadu
17 8 17 17 17 17 17 23 Tripura
10875 9674 7966 6659 7031 6007 9388 24 Uttar Pradesh
7462 7580 8717 9505 10254 10254 10254 25 West Bengal
0 0 0 0 0 0 0 26 A & N Islands
0 0 0 0 0 0 0 27 Dadra & Nagar Haveli
0 0 0 0 0 0 0 28 Daman & Diu
1812 1529 936 1670 1260 1581 15 29 Delhi
0 0 0 0 0 0 0 30 Lakshadweep
14 14 21 21 70 70 70 31 Puducherry
12 0 0 0 0 4 4 32 Chandigarh
1629 0 2689 1634 1634 1634 1634 33 Jharkhand
2752 1749 2237 2297 2145 1696 1643 34 Chattisgarh
1493 1225 1200 330 920 920 1250 35 Uttarakhand
180374 163973 176412 164955 216608 262156 308219 Total
Statement 53 : Statewise Value of Output( At 1999-00 Prices)
Onion
Page 120

Central Statistical OrganisationNational Accounts Division
(Rs. lakhs)
State/U.Ts 1999-00 2000-01 2001-02 2002-03 2003-04 2004-05 2005-06
1 Andhra Pradesh 291024 335732 379714 415146 518291 593076 708491
2 Arunachal Pradesh 8822 13430 14250 14680 14735 14215 15022
3 Assam 228201 222932 244685 227083 171133 177734 219557
4 Bihar 367580 768934 738522 745386 988396 621024 788525
5 Goa 20626 15252 21111 17600 17494 24964 74256
6 Gujarat 167021 187313 189571 203406 230413 276301 320885
7 Haryana 108868 124136 140194 125960 127292 140546 145366
8 Himachal Pradesh 70395 147914 142902 185697 213828 252329 250345
9 Jammu & Kashmir 149155 174650 182484 243236 227048 273470 273991
10 Karnataka 560906 685330 652661 567246 563540 548028 606637
11 Kerala 186758 179075 210168 207768 60660 158866 420480
12 Madhya Pradesh 140670 285217 178156 199606 198126 206612 228850
13 Maharashtra 824540 805190 1058471 846116 963558 1119173 1363776
14 Manipur 8768 9218 11049 12058 27066 28449 28323
15 Meghalaya 12501 20069 19927 30321 18721 23530 31516
16 Mizoram 6814 8632 11856 8024 5895 5581 6202
17 Nagaland 30646 40002 79071 63742 8212 6485 6484
18 Orissa 433518 470382 460456 643407 746059 677088 693903
19 Punjab 85122 85043 102501 113968 113378 152607 159403
20 Rajasthan 69542 55297 42592 46011 42072 45719 44695
21 Sikkim 2268 4207 4065 3218 3787 4212 5627
22 Tamil Nadu 125867 151332 140509 164664 148748 172834 222817
23 Tripura 36760 57401 92102 69128 73345 76453 81063
24 Uttar Pradesh 516014 659731 698046 1000509 723695 690872 767621
25 West Bengal 1170707 1238584 1360139 1294949 1393839 1440697 1516608
26 A & N Islands 1514 1693 2074 4540 1779 1683 1627
27 Dadra & Nagar Haveli 790 1519 2094 1436 1436 1436 1432
28 Daman & Diu 554 630 703 626 626 222 49
29 Delhi 21441 37295 35334 29799 30734 30247 31144
30 Lakshadweep 79 88 109 88 88 88 87
31 Puducherry 2589 4154 5314 4467 4560 4253 4253
32 Chandigarh 302 257 316 284 336 286 286
33 Jharkhand 81550 124274 168409 176001 155033 251759 410581
34 Chattisgarh 116431 97182 118305 182135 188899 154000 270949
35 Uttarakhand 87310 151169 87301 106546 117317 134312 118267
Total 6336478 7163265 7595162 7954853 8100139 8309148 9819121
Statement 54 : Statewise Value of Output
( At Current Prices )
Other Horticulture Crops
Page 121

Central Statistical OrganisationNational Accounts Division
(Rs. lakhs)
1999-00 2000-01 2001-02 2002-03 2003-04 2004-05 2005-06 State/U.Ts
291024 312831 325233 347225 407590 449118 492789 1 Andhra Pradesh
8822 12748 13076 13457 17842 12751 12790 2 Arunachal Pradesh
228201 217392 227427 265324 159192 161278 156012 3 Assam
367580 823116 711902 719566 791728 601268 667734 4 Bihar
20626 12904 18585 14465 14324 13822 28400 5 Goa
167021 191380 190906 211831 221867 281915 324842 6 Gujarat
108868 107699 120134 108901 121035 131284 136237 7 Haryana
70395 143870 110788 157903 183465 211152 214407 8 Himachal Pradesh
149155 159945 163956 168986 149548 188765 189029 9 Jammu & Kashmir
560906 660676 631673 518478 484201 490743 511328 10 Karnataka
186758 187796 197142 207265 51702 126738 349778 11 Kerala
140670 231726 122188 141667 134331 145202 158814 12 Madhya Pradesh
824540 814714 1038332 922882 1011623 1050080 1191391 13 Maharashtra
8768 9585 9445 10737 25525 25532 25405 14 Manipur
12501 17366 13649 23147 15664 15831 20571 15 Meghalaya
6814 7948 9837 6536 4594 4630 5171 16 Mizoram
30646 34070 74667 54720 6593 5456 5455 17 Nagaland
433518 500622 511087 490020 491766 493011 495109 18 Orissa
85122 111149 121696 130647 128751 149150 148580 19 Punjab
69542 59693 52737 49322 47758 49295 49461 20 Rajasthan
2268 4054 4151 3878 3872 4198 5553 21 Sikkim
125867 145345 136934 145186 125280 127314 139210 22 Tamil Nadu
36760 58014 84349 63919 65639 67675 71277 23 Tripura
516014 545405 467009 724225 493644 477745 525772 24 Uttar Pradesh
1170707 1209733 1310544 1271214 1278315 1296090 1358691 25 West Bengal
1514 1366 1693 3166 1303 1354 1223 26 A & N Islands
790 1323 1366 943 943 943 943 27 Dadra & Nagar Haveli
554 628 701 624 624 222 38 28 Daman & Diu
21441 31858 30446 25278 25588 26151 24752 29 Delhi
79 88 109 88 88 88 88 30 Lakshadweep
2589 3277 3689 3257 3332 2800 2822 31 Puducherry
302 234 287 255 255 256 256 32 Chandigarh
81550 136745 107484 103397 90845 136252 172400 33 Jharkhand
116431 92500 156304 181668 162786 140239 248137 34 Chattisgarh
87310 115253 72443 75962 91399 108555 102416 35 Uttarakhand
6336478 6963052 7041969 7166140 6813012 6996900 7836880 Total
( At 1999-00 Prices)Statement 54 : Statewise Value of Output
Other Horticulture Crops
Page 122

Central Statistical OrganisationNational Accounts Division
(Rs. lakhs)
State/U.Ts 1999-00 2000-01 2001-02 2002-03 2003-04 2004-05 2005-06
1 Andhra Pradesh 69044 66451 64884 26418 18359 29031 37109
2 Arunachal Pradesh 0 0 0 0 0 0 0
3 Assam 63 29 39 771 538 305 305
4 Bihar 187 111 170 210 215 215 273
5 Goa 0 2 645 645 645 90 90
6 Gujarat 4111 5798 5048 7380 9056 30118 51883
7 Haryana 8949 15133 8949 10964 21117 15961 8273
8 Himachal Pradesh 2811 3268 847 852 1156 1484 1450
9 Jammu & Kashmir 28 139 365 108 129 1513 1594
10 Karnataka 160174 161459 167730 170033 120381 114832 121827
11 Kerala 0 0 0 0 0 0 0
12 Madhya Pradesh 658 932 366 390 457 513 513
13 Maharashtra 42223 100280 174753 174753 123107 131230 142398
14 Manipur 28 29 25 23 376 448 472
15 Meghalaya 0 0 0 0 0 0 0
16 Mizoram 0 72 72 84 7 33 33
17 Nagaland 0 413 413 413 373 0 0
18 Orissa 1017 771 981 981 147 11164 14172
19 Punjab 2384 116 565 619 619 639 846
20 Rajasthan 1683 1773 1878 1493 1415 1703 1619
21 Sikkim 63 52 63 88 88 83 22310
22 Tamil Nadu 95777 81385 103641 89435 106922 90388 101727
23 Tripura 70 74 99 99 69 0 0
24 Uttar Pradesh 7661 3413 33363 38264 54236 68677 72540
25 West Bengal 13524 9987 11098 12771 15806 17205 19112
26 A & N Islands 0 2 12 12 14 14 4229
27 Dadra & Nagar Haveli 0 0 0 0 0 0 0
28 Daman & Diu 35 29 39 39 27 32 34
29 Delhi 5465 9406 9406 9409 9406 9827 11521
30 Lakshadweep 0 0 0 0 0 0 0
31 Puducherry 281 202 210 210 210 258 258
32 Chandigarh 0 0 0 0 0 0 0
33 Jharkhand 0 0 0 2410 2410 1878 691
34 Chattisgarh 0 1 1 19 35 980 1155
35 Uttarakhand 172 174 153 140 140 140 140
Total 416408 461500 585815 549032 487460 528762 616575
( At Current Prices )
Floriculture
Statement 55 : Statewise Value of Output
Page 123

Central Statistical OrganisationNational Accounts Division
(Rs. lakhs)
1999-00 2000-01 2001-02 2002-03 2003-04 2004-05 2005-06 State/U.Ts
69044 64913 67796 22163 14894 17791 24405 1 Andhra Pradesh
0 0 0 0 0 0 0 2 Arunachal Pradesh
63 35 35 701 701 701 701 3 Assam
187 87 157 201 201 201 259 4 Bihar
0 15 105 105 105 15 15 5 Goa
4111 1048 1048 3170 3171 21787 41763 6 Gujarat
8949 11769 5923 8489 10693 10383 5936 7 Haryana
2811 3385 3832 3984 5455 7058 7139 8 Himachal Pradesh
28 140 344 105 169 1906 1906 9 Jammu & Kashmir
160174 164956 167730 171937 129723 122561 127454 10 Karnataka
0 0 0 0 0 0 0 11 Kerala
658 738 277 277 314 353 353 12 Madhya Pradesh
42223 44461 45207 45207 72361 77135 83700 13 Maharashtra
28 35 23 21 491 491 491 14 Manipur
0 0 0 0 0 0 0 15 Meghalaya
0 30 30 35 7 33 33 16 Mizoram
0 254 254 254 254 0 0 17 Nagaland
1017 904 904 904 198 12272 15037 18 Orissa
2384 1964 1922 2104 2104 2174 2875 19 Punjab
1683 1964 1707 691 1516 1823 1613 20 Rajasthan
63 63 63 88 88 69 23213 21 Sikkim
95777 105898 109895 94832 113374 131355 141665 22 Tamil Nadu
70 90 90 90 90 0 0 23 Tripura
7661 7675 33098 37553 37553 49224 51068 24 Uttar Pradesh
13524 9263 9460 9991 12675 12979 12940 25 West Bengal
0 0 0 1 1 1 1884 26 A & N Islands
0 0 0 0 0 0 0 27 Dadra & Nagar Haveli
35 35 35 35 35 35 35 28 Daman & Diu
5465 8930 8930 8933 8930 8930 2036 29 Delhi
0 0 0 0 0 0 0 30 Lakshadweep
281 491 491 491 491 470 470 31 Puducherry
0 0 0 0 0 0 0 32 Chandigarh
0 0 0 1477 1477 945 674 33 Jharkhand
0 0 0 18 31 855 1007 34 Chattisgarh
172 210 227 89 89 89 89 35 Uttarakhand
416408 429352 459583 413946 417190 481638 548763 Total
Statement 55 : Statewise Value of Output( At 1999-00 Prices)
Floriculture
Page 124

Central Statistical OrganisationNational Accounts Division
(Rs. lakhs)
State/U.Ts 1999-00 2000-01 2001-02 2002-03 2003-04 2004-05 2005-06
1 Andhra Pradesh 472444 519300 564623 576715 644228 772721 901866
2 Arunachal Pradesh 11491 16688 17255 17687 17733 17176 18216
3 Assam 283859 283428 317824 305843 259009 278488 327384
4 Bihar 436618 825704 802382 820657 1052765 677837 854984
5 Goa 32487 23789 33148 30058 29967 37598 85730
6 Gujarat 235990 256500 288954 310462 367164 437983 594706
7 Haryana 126803 151393 169092 152747 171290 177051 181947
8 Himachal Pradesh 81933 163384 155050 197511 228433 266188 259635
9 Jammu & Kashmir 150336 175608 184611 244469 228139 275835 275938
10 Karnataka 868226 942911 925250 843768 792803 776674 878543
11 Kerala 375200 342928 376496 395980 259608 366924 635815
12 Madhya Pradesh 204212 338296 246895 284607 273433 297399 322080
13 Maharashtra 1112494 1150439 1459434 1248651 1357960 1600863 1849845
14 Manipur 14814 15461 18774 18675 34646 36138 37480
15 Meghalaya 31799 40624 42186 53892 40960 49257 53464
16 Mizoram 8010 9943 13480 9262 6908 6650 7458
17 Nagaland 36340 52026 90894 73789 14899 15459 16065
18 Orissa 481237 499755 501761 693149 809983 754828 779718
19 Punjab 108349 100569 142774 157129 146350 197228 229303
20 Rajasthan 81323 66005 55570 55567 52706 60401 63163
21 Sikkim 3103 5124 5470 4544 5586 6035 29721
22 Tamil Nadu 451176 522481 522700 514322 537371 646374 672264
23 Tripura 46763 71336 107908 83760 86446 89753 94364
24 Uttar Pradesh 777709 977574 1085831 1415245 1133549 1166895 1264593
25 West Bengal 1441592 1504863 1700952 1610725 1761486 1774893 1980434
26 A & N Islands 2875 2864 3251 6282 3339 3441 7702
27 Dadra & Nagar Haveli 790 1519 2094 1436 1436 1436 1432
28 Daman & Diu 590 659 745 668 657 254 83
29 Delhi 29641 48980 47232 42210 42755 42927 42718
30 Lakshadweep 102 111 140 119 119 119 118
31 Puducherry 4077 5592 7148 6565 6376 6394 6462
32 Chandigarh 434 378 440 408 546 417 417
33 Jharkhand 99004 124755 200827 204210 183242 296901 484523
34 Chattisgarh 124021 104872 126412 191819 196549 162578 279116
35 Uttarakhand 96825 162305 98066 111049 125387 144900 129775
Total 8633496 9508162 10315671 10683981 10873825 11446019 13367064
Statement 48-55 : Statewise Value of Output
( At Current Prices )
Total Fruits & Vegetables
Page 125

Central Statistical OrganisationNational Accounts Division
(Rs. lakhs)
1999-00 2000-01 2001-02 2002-03 2003-04 2004-05 2005-06 State/U.Ts
472444 489289 503693 492301 515074 595499 646452 1 Andhra Pradesh
11491 15713 15755 16131 20485 15285 15444 2 Arunachal Pradesh
283859 271947 281062 317711 209953 213130 198931 3 Assam
436618 882083 769716 785914 842172 647513 718630 4 Bihar
32487 22890 30600 26485 27130 24350 39346 5 Goa
235990 247154 268851 299756 348671 429122 523818 6 Gujarat
126803 132216 144157 134561 154629 161663 164351 7 Haryana
81933 159458 123800 170897 199999 228426 227676 8 Himachal Pradesh
150336 160849 165210 169936 150551 191265 191181 9 Jammu & Kashmir
868226 982884 961263 816250 709840 723553 748397 10 Karnataka
375200 362430 376912 391028 239553 298395 533770 11 Kerala
204212 280178 172268 195086 188830 205841 213194 12 Madhya Pradesh
1112494 1109980 1325589 1216573 1339922 1428316 1580011 13 Maharashtra
14814 15709 17536 17901 33836 33209 34158 14 Manipur
31799 28410 25468 35556 26909 27484 31858 15 Meghalaya
8010 9170 11171 7622 5462 5651 6330 16 Mizoram
36340 44072 85070 63331 11479 11446 11806 17 Nagaland
481237 529481 549891 527434 538202 552800 558165 18 Orissa
108349 129492 139252 151046 149501 169379 175829 19 Punjab
81323 70828 65754 58708 62751 70188 74310 20 Rajasthan
3103 4935 5440 5054 5416 5702 30200 21 Sikkim
451176 505491 512370 445083 439475 530221 529492 22 Tamil Nadu
46763 71511 98016 76036 76579 78720 82322 23 Tripura
777709 775139 748671 1024450 761555 779949 837571 24 Uttar Pradesh
1441592 1481921 1587325 1535835 1569945 1576893 1649659 25 West Bengal
2875 2287 2616 4333 2425 2727 4479 26 A & N Islands
790 1323 1366 943 943 943 943 27 Dadra & Nagar Haveli
590 663 738 661 661 258 73 28 Daman & Diu
29641 43121 41001 36712 36511 37332 26817 29 Delhi
102 111 140 119 119 119 119 30 Lakshadweep
4077 4672 5323 5389 5240 4806 5144 31 Puducherry
434 354 407 376 376 381 381 32 Chandigarh
99004 137210 120840 131731 119179 164054 201499 33 Jharkhand
124021 99756 163468 189043 168702 146522 254447 34 Chattisgarh
96825 124756 79972 79683 98767 115387 109931 35 Uttarakhand
8633496 9197482 9400712 9429677 9060840 9476529 10426735 Total
( At 1999-00 Prices)Statement 48-55 : Statewise Value of Output
Total Fruits & Vegetables
Page 126

Central Statistical OrganisationNational Accounts Division
(Rs. lakhs)
State/U.Ts 1999-00 2000-01 2001-02 2002-03 2003-04 2004-05 2005-06
1 Andhra Pradesh 0 0 0 0 0 0 0
2 Arunachal Pradesh 0 14 8 14 13 21 23
3 Assam 752 650 939 810 1057 1569 2698
4 Bihar 0 0 0 0 0 0 0
5 Goa 46 69 72 108 139 146 143
6 Gujarat 0 0 0 0 0 0 0
7 Haryana 0 0 0 0 0 0 0
8 Himachal Pradesh 0 0 0 0 0 0 0
9 Jammu & Kashmir 0 0 0 0 0 0 0
10 Karnataka 3003 3133 3180 3228 3325 3412 3521
11 Kerala 160390 156432 160380 235813 325114 360305 385599
12 Madhya Pradesh 0 0 0 0 0 0 0
13 Maharashtra 23 7 11 13 13 17 20
14 Manipur 26 61 64 87 72 75 45
15 Meghalaya 307 516 768 1099 1378 1104 1273
16 Mizoram 0 18 20 24 34 34 29
17 Nagaland 52 91 127 167 151 163 209
18 Orissa 0 3 3 3 11 11 23
19 Punjab 0 0 0 0 0 0 0
20 Rajasthan 0 0 0 0 0 0 0
21 Sikkim 0 0 0 0 0 0 0
22 Tamil Nadu 5048 5629 5383 6458 8456 9256 11383
23 Tripura 2325 2228 3749 4758 4502 5444 6437
24 Uttar Pradesh 0 0 0 0 0 0 0
25 West Bengal 0 91 97 114 27 33 45
26 A & N Islands 237 314 259 267 244 199 167
27 Dadra & Nagar Haveli 0 0 0 0 0 0 0
28 Daman & Diu 0 0 0 0 0 0 0
29 Delhi 0 0 0 0 0 0 0
30 Lakshadweep 0 0 0 0 0 0 0
31 Puducherry 0 0 0 0 0 0 0
32 Chandigarh 0 0 0 0 0 0 0
33 Jharkhand 0 0 0 0 0 0 0
34 Chattisgarh 0 0 0 0 0 0 0
35 Uttarakhand 0 0 0 0 0 0 0
Total 172208 169255 175059 252964 344537 381790 411616
Statement 56 : Statewise Value of Output
( At Current Prices )
Rubber
Page 127

Central Statistical OrganisationNational Accounts Division
(Rs. lakhs)
1999-00 2000-01 2001-02 2002-03 2003-04 2004-05 2005-06 State/U.Ts
0 0 0 0 0 0 0 1 Andhra Pradesh
0 12 7 12 12 13 14 2 Arunachal Pradesh
752 648 785 567 669 844 874 3 Assam
0 0 0 0 0 0 0 4 Bihar
46 69 72 91 118 123 121 5 Goa
0 0 0 0 0 0 0 6 Gujarat
0 0 0 0 0 0 0 7 Haryana
0 0 0 0 0 0 0 8 Himachal Pradesh
0 0 0 0 0 0 0 9 Jammu & Kashmir
3003 3072 3118 3131 3225 3310 3416 10 Karnataka
160390 162406 162518 166583 183444 193406 206983 11 Kerala
0 0 0 0 0 0 0 12 Madhya Pradesh
23 7 11 11 11 15 17 13 Maharashtra
26 52 51 60 49 51 31 14 Manipur
307 307 429 478 508 523 603 15 Meghalaya
0 16 16 17 23 23 20 16 Mizoram
52 73 95 106 96 104 133 17 Nagaland
0 3 3 3 11 10 22 18 Orissa
0 0 0 0 0 0 0 19 Punjab
0 0 0 0 0 0 0 20 Rajasthan
0 0 0 0 0 0 0 21 Sikkim
5048 5167 5175 5323 5387 5428 5646 22 Tamil Nadu
2325 2425 3250 3059 3189 3451 4081 23 Tripura
0 0 0 0 0 0 0 24 Uttar Pradesh
0 79 79 79 19 23 31 25 West Bengal
237 237 135 143 132 108 90 26 A & N Islands
0 0 0 0 0 0 0 27 Dadra & Nagar Haveli
0 0 0 0 0 0 0 28 Daman & Diu
0 0 0 0 0 0 0 29 Delhi
0 0 0 0 0 0 0 30 Lakshadweep
0 0 0 0 0 0 0 31 Puducherry
0 0 0 0 0 0 0 32 Chandigarh
0 0 0 0 0 0 0 33 Jharkhand
0 0 0 0 0 0 0 34 Chattisgarh
0 0 0 0 0 0 0 35 Uttarakhand
172208 174573 175745 179663 196891 207432 222082 Total
Statement 56 : Statewise Value of Output( At 1999-00 Prices)
Rubber
Page 128

Central Statistical OrganisationNational Accounts Division
(Rs. lakhs)
State/U.Ts 1999-00 2000-01 2001-02 2002-03 2003-04 2004-05 2005-06
1 Andhra Pradesh 0 0 0 0 0 0 0
2 Arunachal Pradesh 0 0 0 0 0 0 0
3 Assam 0 0 0 0 0 0 0
4 Bihar 0 0 0 0 0 0 0
5 Goa 0 0 0 0 0 0 0
6 Gujarat 3384 10782 10162 10240 21008 23342 25601
7 Haryana 17520 21964 23186 12053 10694 41251 44840
8 Himachal Pradesh 0 0 0 0 0 0 0
9 Jammu & Kashmir 0 0 0 0 0 0 0
10 Karnataka 0 0 0 0 0 0 0
11 Kerala 0 0 0 0 0 0 0
12 Madhya Pradesh 0 0 0 0 0 0 0
13 Maharashtra 0 0 0 0 0 0 0
14 Manipur 0 0 0 0 0 0 0
15 Meghalaya 0 0 0 0 0 0 0
16 Mizoram 0 0 0 0 0 0 0
17 Nagaland 0 0 0 0 0 0 0
18 Orissa 0 0 0 0 0 0 0
19 Punjab 1110 2015 3990 4120 4488 3495 3207
20 Rajasthan 60705 47803 69691 4971 111074 47522 91358
21 Sikkim 0 0 0 0 0 0 0
22 Tamil Nadu 0 0 0 0 0 0 0
23 Tripura 0 0 0 0 0 0 0
24 Uttar Pradesh 191 220 239 230 201 201 182
25 West Bengal 0 0 0 0 0 0 0
26 A & N Islands 0 0 0 0 0 0 0
27 Dadra & Nagar Haveli 0 0 0 0 0 0 0
28 Daman & Diu 0 0 0 0 0 0 0
29 Delhi 0 0 0 0 0 0 0
30 Lakshadweep 0 0 0 0 0 0 0
31 Puducherry 0 0 0 0 0 0 0
32 Chandigarh 0 0 0 0 0 0 0
33 Jharkhand 0 0 0 0 0 0 0
34 Chattisgarh 0 0 0 0 0 0 0
35 Uttarakhand 0 0 0 0 0 0 0
Total 82910 82784 107268 31613 147464 115811 165188
Statement 57 : Statewise Value of Output
( At Current Prices )
Guarseed
Page 129

Central Statistical OrganisationNational Accounts Division
(Rs. lakhs)
1999-00 2000-01 2001-02 2002-03 2003-04 2004-05 2005-06 State/U.Ts
0 0 0 0 0 0 0 1 Andhra Pradesh
0 0 0 0 0 0 0 2 Arunachal Pradesh
0 0 0 0 0 0 0 3 Assam
0 0 0 0 0 0 0 4 Bihar
0 0 0 0 0 0 0 5 Goa
3384 7900 14499 8486 26525 20447 20447 6 Gujarat
17520 20460 25300 18200 23440 71740 57800 7 Haryana
0 0 0 0 0 0 0 8 Himachal Pradesh
0 0 0 0 0 0 0 9 Jammu & Kashmir
0 0 0 0 0 0 0 10 Karnataka
0 0 0 0 0 0 0 11 Kerala
0 0 0 0 0 0 0 12 Madhya Pradesh
0 0 0 0 0 0 0 13 Maharashtra
0 0 0 0 0 0 0 14 Manipur
0 0 0 0 0 0 0 15 Meghalaya
0 0 0 0 0 0 0 16 Mizoram
0 0 0 0 0 0 0 17 Nagaland
0 0 0 0 0 0 0 18 Orissa
1110 2015 3811 3811 3957 2833 2599 19 Punjab
60705 126127 215813 7300 304886 95932 155489 20 Rajasthan
0 0 0 0 0 0 0 21 Sikkim
0 0 0 0 0 0 0 22 Tamil Nadu
0 0 0 0 0 0 0 23 Tripura
191 220 239 230 201 201 182 24 Uttar Pradesh
0 0 0 0 0 0 0 25 West Bengal
0 0 0 0 0 0 0 26 A & N Islands
0 0 0 0 0 0 0 27 Dadra & Nagar Haveli
0 0 0 0 0 0 0 28 Daman & Diu
0 0 0 0 0 0 0 29 Delhi
0 0 0 0 0 0 0 30 Lakshadweep
0 0 0 0 0 0 0 31 Puducherry
0 0 0 0 0 0 0 32 Chandigarh
0 0 0 0 0 0 0 33 Jharkhand
0 0 0 0 0 0 0 34 Chattisgarh
0 0 0 0 0 0 0 35 Uttarakhand
82910 156723 259662 38027 359009 191153 236517 Total
Statement 57 : Statewise Value of Output( At 1999-00 Prices)
Guarseed
Page 130

Central Statistical OrganisationNational Accounts Division
(Rs. lakhs)
State/U.Ts 1999-00 2000-01 2001-02 2002-03 2003-04 2004-05 2005-06
1 Andhra Pradesh 89695 86463 87957 97088 107558 112541 112482
2 Arunachal Pradesh 381 381 439 664 664 664 664
3 Assam 7238 6825 8095 10293 10293 10087 10074
4 Bihar 14672 15600 15502 18812 19395 26492 26492
5 Goa 2154 547 733 981 981 984 971
6 Gujarat 180166 165436 141845 215399 195849 228715 227512
7 Haryana 60831 73661 83888 94930 102765 84268 89715
8 Himachal Pradesh 5441 5304 5433 7676 7676 6807 6804
9 Jammu & Kashmir 29298 26974 30564 49261 52537 50859 50755
10 Karnataka 58712 63887 66496 68726 70134 67944 74862
11 Kerala 11899 12280 13043 14661 17668 17827 17595
12 Madhya Pradesh 88789 99906 100147 111881 111064 156986 143570
13 Maharashtra 747508 752051 1187444 1200494 1534252 1511685 1904901
14 Manipur 143 150 150 162 183 184 206
15 Meghalaya 1453 1947 1937 1938 1937 1948 2180
16 Mizoram 677 529 501 696 754 758 848
17 Nagaland 597 732 732 691 696 696 779
18 Orissa 8307 8528 7672 6925 7316 7655 8307
19 Punjab 219617 220259 234513 242144 252901 250435 274075
20 Rajasthan 184488 197104 203992 140822 199310 161851 100884
21 Sikkim 270 352 352 466 527 136 136
22 Tamil Nadu 26540 27246 28332 32394 29546 29690 28254
23 Tripura 271 154 155 214 155 155 155
24 Uttar Pradesh 278804 230249 229438 227496 313209 313227 326516
25 West Bengal 4011 3914 5107 6820 6820 7356 7687
26 A & N Islands 82 82 82 113 113 113 113
27 Dadra & Nagar Haveli 302 302 302 361 361 361 361
28 Daman & Diu 67 18 18 24 24 24 24
29 Delhi 1008 969 820 1118 1128 1130 1092
30 Lakshadweep 2 2 2 3 3 3 3
31 Puducherry 54 54 54 235 220 220 220
32 Chandigarh 681 548 618 853 841 552 551
33 Jharkhand 14980 819 44523 61644 61036 21220 21220
34 Chattisgarh 12152 13693 13424 19256 26563 26669 28550
35 Uttarakhand 15329 17144 13440 18773 18773 18178 18156
Total 2066617 2034111 2527745 2654012 3153253 3118421 3486715
Statement 58 : Statewise Value of Output
( At Current Prices )
Miscellaneous Crops
Page 131

Central Statistical OrganisationNational Accounts Division
(Rs. lakhs)
1999-00 2000-01 2001-02 2002-03 2003-04 2004-05 2005-06 State/U.Ts
89695 84418 84031 85731 88513 95524 94561 1 Andhra Pradesh
381 381 347 381 381 381 381 2 Arunachal Pradesh
7238 7238 7238 7174 7174 6968 6968 3 Assam
14672 15600 15502 15274 15853 16365 16365 4 Bihar
2154 719 761 737 737 740 731 5 Goa
180166 165436 141841 156079 141913 165727 165202 6 Gujarat
60831 67377 69065 70950 68897 55439 54705 7 Haryana
5441 5304 5304 5434 5434 7215 7215 8 Himachal Pradesh
29298 28326 26081 30139 32215 31248 31248 9 Jammu & Kashmir
58712 56951 57892 57979 58997 57096 57523 10 Karnataka
11899 12180 12481 12360 12477 12530 12419 11 Kerala
88789 87575 85657 82098 79982 77755 78482 12 Madhya Pradesh
747508 749696 1251027 1252478 1469377 1469048 1469048 13 Maharashtra
143 150 144 144 144 144 144 14 Manipur
1453 1456 1410 1411 1410 1410 1410 15 Meghalaya
677 529 501 504 546 548 548 16 Mizoram
597 597 597 630 630 630 630 17 Nagaland
8307 8307 7765 6913 6863 7042 7073 18 Orissa
219617 210685 213251 213128 212135 198359 198893 19 Punjab
184488 196779 203173 111166 196725 159575 95758 20 Rajasthan
270 352 352 360 180 99 99 21 Sikkim
26540 27246 28332 32394 29546 29690 28254 22 Tamil Nadu
271 267 268 268 268 268 268 23 Tripura
278804 279293 278316 275824 285009 285018 297702 24 Uttar Pradesh
4011 3922 4461 4471 4471 4140 4061 25 West Bengal
82 82 82 82 82 82 82 26 A & N Islands
302 302 302 302 302 302 302 27 Dadra & Nagar Haveli
67 18 18 18 18 18 18 28 Daman & Diu
1008 969 820 873 875 876 839 29 Delhi
2 2 2 2 2 2 2 30 Lakshadweep
54 54 54 77 62 62 62 31 Puducherry
681 327 294 294 285 190 190 32 Chandigarh
14980 34844 21333 21404 21404 7577 7577 33 Jharkhand
12152 12166 12969 12094 12094 12146 12944 34 Chattisgarh
15329 18969 13348 13355 13355 12815 12815 35 Uttarakhand
2066617 2078515 2545015 2472527 2768357 2717030 2664520 Total
Statement 58 : Statewise Value of Output( At 1999-00 Prices)
Miscellaneous Crops
Page 132

Central Statistical OrganisationNational Accounts Division
(Rs. lakhs)
State/U.Ts 1999-00 2000-01 2001-02 2002-03 2003-04 2004-05 2005-06
1 Andhra Pradesh 89695 86463 87957 97088 107558 112541 112483
2 Arunachal Pradesh 381 395 447 677 677 685 687
3 Assam 7989 7475 9034 11102 11350 11656 12772
4 Bihar 14672 15600 15502 18812 19395 26492 26492
5 Goa 2200 616 805 1088 1120 1130 1114
6 Gujarat 183550 176218 152007 225639 216857 252057 253113
7 Haryana 78351 95625 107073 106983 113459 125519 134556
8 Himachal Pradesh 5441 5304 5433 7676 7676 6807 6804
9 Jammu & Kashmir 29298 26974 30564 49261 52537 50859 50755
10 Karnataka 61715 67020 69676 71954 73459 71357 78383
11 Kerala 172288 168712 173422 250475 342783 378132 403194
12 Madhya Pradesh 88789 99906 100147 111881 111064 156986 143570
13 Maharashtra 747531 752058 1187455 1200507 1534265 1511702 1904922
14 Manipur 169 211 214 249 254 259 251
15 Meghalaya 1760 2463 2705 3037 3315 3051 3453
16 Mizoram 677 547 521 720 788 792 878
17 Nagaland 649 823 859 858 847 859 988
18 Orissa 8307 8531 7675 6928 7327 7665 8330
19 Punjab 220727 222275 238503 246264 257389 253930 277282
20 Rajasthan 245192 244908 273683 145792 310384 209373 192241
21 Sikkim 270 352 352 466 527 136 136
22 Tamil Nadu 31587 32875 33714 38852 38002 38947 39638
23 Tripura 2596 2382 3904 4972 4657 5599 6592
24 Uttar Pradesh 278995 230469 229677 227725 313410 313428 326698
25 West Bengal 4011 4005 5204 6935 6847 7389 7732
26 A & N Islands 319 396 341 380 357 312 280
27 Dadra & Nagar Haveli 302 302 302 361 361 361 361
28 Daman & Diu 67 18 18 24 24 24 24
29 Delhi 1008 969 820 1118 1128 1130 1092
30 Lakshadweep 2 2 2 3 3 3 3
31 Puducherry 54 54 54 235 220 220 220
32 Chandigarh 681 548 618 853 841 552 551
33 Jharkhand 14980 819 44523 61644 61036 21220 21220
34 Chattisgarh 12152 13693 13424 19256 26563 26669 28550
35 Uttarakhand 15329 17144 13440 18773 18773 18178 18156
Total 2321735 2286151 2810072 2938589 3645254 3616021 4063519
Statement 56-58 : Statewise Value of Output
( At Current Prices )
Total Other Crops
Page 133

Central Statistical OrganisationNational Accounts Division
(Rs. lakhs)
1999-00 2000-01 2001-02 2002-03 2003-04 2004-05 2005-06 State/U.Ts
89695 84419 84031 85732 88513 95524 94562 1 Andhra Pradesh
381 393 353 393 393 394 395 2 Arunachal Pradesh
7989 7886 8023 7741 7843 7813 7843 3 Assam
14672 15600 15502 15274 15853 16365 16365 4 Bihar
2200 788 833 829 855 863 852 5 Goa
183550 173336 156339 164564 168438 186174 185649 6 Gujarat
78351 87837 94365 89150 92337 127179 112505 7 Haryana
5441 5304 5304 5434 5434 7215 7215 8 Himachal Pradesh
29298 28326 26081 30139 32215 31248 31248 9 Jammu & Kashmir
61715 60023 61009 61110 62223 60406 60939 10 Karnataka
172288 174586 174999 178943 195921 205936 219403 11 Kerala
88789 87575 85657 82098 79982 77755 78482 12 Madhya Pradesh
747531 749703 1251038 1252489 1469388 1469062 1469065 13 Maharashtra
169 202 195 203 192 195 174 14 Manipur
1760 1763 1839 1889 1918 1933 2013 15 Meghalaya
677 545 517 521 570 571 568 16 Mizoram
649 670 692 737 726 734 763 17 Nagaland
8307 8310 7769 6917 6874 7052 7095 18 Orissa
220727 212700 217062 216939 216093 201192 201493 19 Punjab
245192 322906 418986 118466 501611 255507 251247 20 Rajasthan
270 352 352 360 180 99 99 21 Sikkim
31587 32414 33506 37718 34933 35118 33900 22 Tamil Nadu
2596 2692 3518 3327 3457 3719 4349 23 Tripura
278995 279513 278556 276054 285210 285219 297883 24 Uttar Pradesh
4011 4001 4540 4550 4490 4163 4092 25 West Bengal
319 319 216 225 214 189 172 26 A & N Islands
302 302 302 302 302 302 302 27 Dadra & Nagar Haveli
67 18 18 18 18 18 18 28 Daman & Diu
1008 969 820 873 875 876 839 29 Delhi
2 2 2 2 2 2 2 30 Lakshadweep
54 54 54 77 62 62 62 31 Puducherry
681 327 294 294 285 190 190 32 Chandigarh
14980 34844 21333 21404 21404 7577 7577 33 Jharkhand
12152 12166 12969 12094 12094 12146 12944 34 Chattisgarh
15329 18969 13348 13355 13355 12815 12815 35 Uttarakhand
2321735 2409811 2980423 2690217 3324257 3115615 3123120 Total
Statement 56-58 : Statewise Value of Output( At 1999-00 Prices)
Total Other Crops
Page 134

Central Statistical OrganisationNational Accounts Division
(Rs. lakhs)
State/U.Ts 1999-00 2000-01 2001-02 2002-03 2003-04 2004-05 2005-06
1 Andhra Pradesh 93284 113873 101944 84315 96473 93598 107381
2 Arunachal Pradesh 2919 3066 3055 3227 3287 3206 3186
3 Assam 17743 19143 18367 18488 19680 17785 17172
4 Bihar 110547 106834 100410 102378 111351 100200 98079
5 Goa 1055 1130 968 995 1109 1061 1025
6 Gujarat 120574 120984 122397 124824 132710 119557 118474
7 Haryana 112675 95813 92372 90025 120602 114526 111501
8 Himachal Pradesh 14278 14660 16415 16399 20547 20397 19114
9 Jammu & Kashmir 19802 17701 16691 16569 18915 17897 17268
10 Karnataka 122560 127958 115902 106945 114397 123652 126708
11 Kerala 14200 14095 13030 12656 12415 12021 11159
12 Madhya Pradesh 178177 156293 169830 162117 202046 194950 174045
13 Maharashtra 306520 258476 251560 246673 247893 257610 255632
14 Manipur 2955 3149 3248 3066 3325 3591 3287
15 Meghalaya 2346 2471 2442 2464 2608 2550 2261
16 Mizoram 1003 1129 1212 1255 1431 1233 1284
17 Nagaland 3605 3812 4170 4225 4835 4695 4290
18 Orissa 108633 121008 122189 116857 130760 125617 121844
19 Punjab 113704 97682 104615 104275 104389 101626 98074
20 Rajasthan 278852 310410 294862 225086 348851 292439 299507
21 Sikkim 1253 1266 1267 1177 1245 1205 1215
22 Tamil Nadu 84676 97477 95030 76062 82427 95378 95912
23 Tripura 4342 4789 4872 5087 5442 5228 4858
24 Uttar Pradesh 371610 353407 357008 343205 431273 398956 396644
25 West Bengal 223145 194937 214701 208342 223383 212116 204935
26 A & N Islands 195 213 191 214 224 220 208
27 Dadra & Nagar Haveli 295 321 314 330 340 331 323
28 Daman & Diu 28 39 35 31 37 34 35
29 Delhi 1517 1109 1036 893 790 958 895
30 Lakshadweep 0 0 0 0 0 0 0
31 Puducherry 490 539 523 487 542 521 496
32 Chandigarh 40 31 30 28 32 22 21
33 Jharkhand 26278 26563 27537 25940 27352 25085 24662
34 Chattisgarh 53398 46437 47338 47311 50896 49248 46845
35 Uttarakhand 16670 16802 16609 17885 22322 21725 20781
Total 2409371 2333616 2322174 2169834 2543928 2419238 2389122
Straw & Stalks
( At Current Prices )
Statement 59 : Statewise Value of Output
Page 135

Central Statistical OrganisationNational Accounts Division
(Rs. lakhs)
1999-00 2000-01 2001-02 2002-03 2003-04 2004-05 2005-06 State/U.Ts
93284 98627 88870 73516 80321 79893 95020 1 Andhra Pradesh
2919 2901 2904 3040 2919 2952 3018 2 Arunachal Pradesh
17743 17554 17022 16934 16902 15830 15609 3 Assam
110547 110848 109822 110808 109673 102526 103308 4 Bihar
1055 1059 914 930 978 970 965 5 Goa
120574 115905 118067 119361 120890 113094 115417 6 Gujarat
112675 114841 111716 108019 112859 111156 111429 7 Haryana
14278 14113 14199 14047 14029 14501 13940 8 Himachal Pradesh
19802 20997 20085 19724 20490 20163 20036 9 Jammu & Kashmir
122560 125007 114563 106036 105819 119024 125110 10 Karnataka
14200 14085 13106 12607 11665 11728 11189 11 Kerala
178177 151411 164193 154556 174264 175066 161436 12 Madhya Pradesh
306520 292209 289127 279948 262062 284364 291747 13 Maharashtra
2955 2959 3069 2869 2938 3291 3099 14 Manipur
2346 2351 2326 2323 2302 2335 2130 15 Meghalaya
1003 1060 1144 1176 1264 1129 1207 16 Mizoram
3605 3649 4050 4113 4405 4440 4107 17 Nagaland
108633 104660 106387 100636 106371 105996 105871 18 Orissa
113704 114389 114356 112949 115215 116402 115777 19 Punjab
278852 283915 296206 221959 310017 272289 288630 20 Rajasthan
1253 1213 1235 1128 1106 1109 1158 21 Sikkim
84676 80692 79042 61791 62972 76015 79360 22 Tamil Nadu
4342 4509 4617 4769 4816 4798 4590 23 Tripura
371610 377287 377441 360694 372095 356873 365151 24 Uttar Pradesh
223145 200751 222597 213820 215473 212110 210825 25 West Bengal
195 200 180 200 198 201 196 26 A & N Islands
295 300 294 309 299 302 304 27 Dadra & Nagar Haveli
28 37 33 29 33 31 33 28 Daman & Diu
1517 1305 1244 1046 847 1044 1006 29 Delhi
0 0 0 0 0 0 0 30 Lakshadweep
490 503 493 454 477 475 466 31 Puducherry
40 39 39 35 35 24 24 32 Chandigarh
26278 27193 19788 18707 27075 25685 25688 33 Jharkhand
53398 54069 43421 43006 55754 56034 54850 34 Chattisgarh
16670 16681 10744 11390 17199 17233 17043 35 Uttarakhand
2409371 2357318 2353295 2182930 2333759 2309087 2349741 Total
( At 1999-00 Prices)Statement 59 : Statewise Value of Output
Straw & Stalks
Page 136

Central Statistical OrganisationNational Accounts Division
(Rs. lakhs)
State/U.Ts 1999-00 2000-01 2001-02 2002-03 2003-04 2004-05 2005-06
1 Andhra Pradesh 5676 4541 6446 6389 4770 4740 4870
2 Arunachal Pradesh 88 78 103 102 103 104 108
3 Assam 2869 2343 2659 2593 2407 2250 2131
4 Bihar 2450 2369 2769 3554 3909 3745 3616
5 Goa 29 21 24 24 28 27 24
6 Gujarat 18853 13079 14492 13777 12333 13115 13193
7 Haryana 7559 7665 13214 13823 14114 14893 14624
8 Himachal Pradesh 114 90 115 97 116 123 102
9 Jammu & Kashmir 218 205 276 232 222 399 21
10 Karnataka 6654 5189 6045 5350 6766 5727 6274
11 Kerala 398 205 201 256 247 238 633
12 Madhya Pradesh 10133 7499 9430 7360 11347 8744 9103
13 Maharashtra 45529 49040 47452 46493 37432 33236 40159
14 Manipur 23 19 18 24 9 20 3
15 Meghalaya 130 131 148 149 143 145 148
16 Mizoram 31 31 49 46 19 45 42
17 Nagaland 101 103 155 190 245 238 323
18 Orissa 1311 1271 1336 1193 1286 1357 1492
19 Punjab 6804 6370 8753 7671 7441 7013 7385
20 Rajasthan 4963 4738 5411 3909 5082 7562 8360
21 Sikkim 17 17 21 22 22 22 23
22 Tamil Nadu 15756 11451 14134 9105 8271 10095 10438
23 Tripura 62 67 77 82 82 74 81
24 Uttar Pradesh 67332 59351 63484 64985 64469 61967 65681
25 West Bengal 15311 14995 16433 15778 18329 17419 17264
26 A & N Islands 4 5 3 16 7 7 9
27 Dadra & Nagar Haveli 14 10 13 12 12 13 12
28 Daman & Diu 0 0 0 0 0 0 0
29 Delhi 11 7 16 15 16 19 17
30 Lakshadweep 0 0 0 0 0 0 0
31 Puducherry 64 42 45 48 42 37 48
32 Chandigarh 0 0 0 0 0 0 0
33 Jharkhand 284 249 211 712 858 995 975
34 Chattisgarh 539 364 426 445 487 517 548
35 Uttarakhand 3675 3481 3226 2898 6217 5016 4570
Total 217002 195025 217184 207350 206833 199905 212278
Statement 60 : Statewise Value of Output
( At Current Prices )
Other by Products
Page 137

Central Statistical OrganisationNational Accounts Division
(Rs. lakhs)
1999-00 2000-01 2001-02 2002-03 2003-04 2004-05 2005-06 State/U.Ts
5676 5950 5338 5174 6059 6014 6129 1 Andhra Pradesh
88 85 87 89 89 88 91 2 Arunachal Pradesh
2869 2711 2686 2619 2538 2347 2237 3 Assam
2450 2399 2698 2547 2597 2487 2438 4 Bihar
29 29 27 27 27 27 24 5 Goa
18853 18899 19208 18235 15896 16898 16955 6 Gujarat
7559 7634 8899 9238 8685 8994 8692 7 Haryana
114 108 115 99 106 112 94 8 Himachal Pradesh
218 210 227 192 183 320 18 9 Jammu & Kashmir
6654 7468 6785 5911 5206 4895 5192 10 Karnataka
398 210 208 269 248 244 689 11 Kerala
10133 5151 4649 4187 4855 5817 6057 12 Madhya Pradesh
45529 45714 44248 43482 38390 34361 41519 13 Maharashtra
23 23 19 25 10 20 5 14 Manipur
130 130 127 128 126 126 126 15 Meghalaya
31 37 49 47 18 42 41 16 Mizoram
101 115 149 184 232 224 299 17 Nagaland
1311 1258 1138 1045 1104 1146 1248 18 Orissa
6804 7106 8688 7732 7023 6570 6845 19 Punjab
4963 3636 3867 2847 3433 4865 5306 20 Rajasthan
17 17 17 18 18 18 18 21 Sikkim
15756 13125 17623 11299 9729 12048 13255 22 Tamil Nadu
62 74 73 80 76 69 76 23 Tripura
67332 66113 69438 70183 68402 67759 73431 24 Uttar Pradesh
15311 15698 16566 15954 15852 14710 14344 25 West Bengal
4 6 3 17 7 7 9 26 A & N Islands
14 12 14 12 13 13 12 27 Dadra & Nagar Haveli
0 0 0 0 0 0 0 28 Daman & Diu
11 8 14 13 13 16 14 29 Delhi
0 0 0 0 0 0 0 30 Lakshadweep
64 57 49 53 39 34 48 31 Puducherry
0 0 0 0 0 0 0 32 Chandigarh
284 273 203 661 807 940 901 33 Jharkhand
539 475 479 494 525 544 575 34 Chattisgarh
3675 3685 2627 2813 2693 2275 2112 35 Uttarakhand
217002 208418 216320 205675 194998 194032 208797 Total
Other by Products
Statement 60 : Statewise Value of Output( At 1999-00 Prices)
Page 138

Central Statistical OrganisationNational Accounts Division
(Rs. lakhs)
State/U.Ts 1999-00 2000-01 2001-02 2002-03 2003-04 2004-05 2005-06
1 Andhra Pradesh 98961 118414 108390 90704 101243 98338 112251
2 Arunachal Pradesh 3007 3144 3158 3329 3390 3310 3295
3 Assam 20612 21485 21026 21081 22087 20036 19304
4 Bihar 112996 109203 103179 105933 115260 103945 101695
5 Goa 1084 1150 992 1019 1137 1088 1049
6 Gujarat 139427 134063 136889 138601 145043 132673 131667
7 Haryana 120234 103478 105586 103848 134716 129419 126126
8 Himachal Pradesh 14392 14750 16530 16496 20662 20520 19216
9 Jammu & Kashmir 20020 17906 16968 16801 19137 18296 17289
10 Karnataka 129214 133146 121947 112295 121163 129378 132982
11 Kerala 14598 14300 13231 12912 12662 12259 11792
12 Madhya Pradesh 188310 163792 179260 169478 213393 203695 183148
13 Maharashtra 352049 307516 299012 293166 285325 290847 295790
14 Manipur 2978 3168 3266 3090 3334 3611 3290
15 Meghalaya 2475 2602 2590 2613 2751 2696 2410
16 Mizoram 1034 1160 1260 1301 1451 1278 1326
17 Nagaland 3706 3914 4325 4415 5080 4933 4613
18 Orissa 109944 122280 123525 118050 132046 126975 123337
19 Punjab 120507 104052 113368 111946 111831 108639 105460
20 Rajasthan 283816 315148 300273 228995 353933 300001 307867
21 Sikkim 1270 1283 1289 1199 1267 1228 1238
22 Tamil Nadu 100432 108929 109164 85167 90698 105473 106349
23 Tripura 4405 4855 4949 5169 5524 5302 4939
24 Uttar Pradesh 438943 412758 420493 408190 495742 460923 462325
25 West Bengal 238457 209932 231134 224120 241712 229535 222199
26 A & N Islands 199 218 193 229 231 226 217
27 Dadra & Nagar Haveli 309 331 327 342 353 343 335
28 Daman & Diu 28 39 35 31 37 34 35
29 Delhi 1528 1116 1053 908 806 978 912
30 Lakshadweep 0 0 0 0 0 0 0
31 Puducherry 554 582 567 535 585 558 544
32 Chandigarh 40 31 30 29 32 22 21
33 Jharkhand 26562 26812 27748 26652 28210 26080 25637
34 Chattisgarh 53938 46801 47764 47755 51383 49765 47394
35 Uttarakhand 20345 20282 19835 20783 28538 26740 25351
Total 2626373 2528641 2539358 2377184 2750761 2619143 2601400
Statement 59-60 : Statewise Value of Output
( At Current Prices )
Total By Products
Page 139

Central Statistical OrganisationNational Accounts Division
(Rs. lakhs)
1999-00 2000-01 2001-02 2002-03 2003-04 2004-05 2005-06 State/U.Ts
98961 104577 94208 78690 86379 85908 101148 1 Andhra Pradesh
3007 2986 2990 3129 3007 3041 3108 2 Arunachal Pradesh
20612 20265 19708 19553 19439 18177 17846 3 Assam
112996 113247 112520 113355 112269 105013 105746 4 Bihar
1084 1088 941 956 1004 997 990 5 Goa
139427 134804 137276 137597 136785 129991 132372 6 Gujarat
120234 122475 120615 117258 121544 120150 120121 7 Haryana
14392 14222 14314 14146 14135 14614 14034 8 Himachal Pradesh
20020 21207 20312 19915 20672 20483 20054 9 Jammu & Kashmir
129214 132475 121348 111948 111024 123919 130301 10 Karnataka
14598 14295 13314 12877 11913 11973 11878 11 Kerala
188310 156562 168843 158743 179119 180883 167493 12 Madhya Pradesh
352049 337923 333375 323430 300451 318725 333267 13 Maharashtra
2978 2982 3088 2893 2947 3310 3104 14 Manipur
2475 2480 2454 2451 2428 2461 2256 15 Meghalaya
1034 1097 1194 1223 1281 1172 1248 16 Mizoram
3706 3764 4199 4296 4637 4664 4407 17 Nagaland
109944 105918 107525 101682 107476 107142 107119 18 Orissa
120507 121495 123044 120681 122238 122972 122621 19 Punjab
283816 287551 300074 224806 313450 277155 293935 20 Rajasthan
1270 1230 1252 1146 1124 1127 1175 21 Sikkim
100432 93817 96664 73090 72701 88063 92616 22 Tamil Nadu
4405 4583 4690 4848 4893 4867 4665 23 Tripura
438943 443400 446878 430878 440497 424633 438582 24 Uttar Pradesh
238457 216449 239164 229774 231326 226820 225169 25 West Bengal
199 207 183 217 205 208 205 26 A & N Islands
309 312 308 322 312 315 316 27 Dadra & Nagar Haveli
28 37 33 29 33 31 33 28 Daman & Diu
1528 1312 1258 1059 860 1060 1020 29 Delhi
0 0 0 0 0 0 0 30 Lakshadweep
554 561 542 507 516 510 514 31 Puducherry
40 39 39 35 35 25 25 32 Chandigarh
26562 27465 19991 19369 27882 26625 26589 33 Jharkhand
53938 54544 43900 43500 56279 56578 55425 34 Chattisgarh
20345 20366 13371 14203 19892 19508 19155 35 Uttarakhand
2626373 2565736 2569614 2388605 2528757 2503119 2558538 Total
Statement 59-60 : Statewise Value of Output
Total By Products
( At 1999-00 Prices)
Page 140

Central Statistical OrganisationNational Accounts Division
(Rs. lakhs)
State/U.Ts 1999-00 2000-01 2001-02 2002-03 2003-04 2004-05 2005-06
1 Andhra Pradesh 10011 12355 12221 12400 13436 15728 17915
2 Arunachal Pradesh 54 68 71 65 71 83 87
3 Assam 3399 4446 4768 4772 4902 5262 5948
4 Bihar 10631 10367 10856 11182 14860 9083 11511
5 Goa 168 62 72 70 72 90 193
6 Gujarat 10732 14681 15605 16243 18199 17106 19444
7 Haryana 2896 6004 6017 5262 5283 5442 5498
8 Himachal Pradesh 282 722 775 1051 1102 1293 1257
9 Jammu & Kashmir 659 835 889 1285 1362 1464 1467
10 Karnataka 17351 19297 20246 18802 19845 19558 20960
11 Kerala 1549 1932 2369 2407 2765 2680 2958
12 Madhya Pradesh 22396 35414 44007 44191 44599 45584 45282
13 Maharashtra 32205 40810 43096 37544 31248 33331 37804
14 Manipur 155 213 257 199 248 267 254
15 Meghalaya 161 244 240 37 312 367 331
16 Mizoram 89 77 119 86 66 63 65
17 Nagaland 307 750 651 891 461 367 378
18 Orissa 4145 6159 5817 7903 9876 8794 4182
19 Punjab 4856 5368 7140 7715 7120 9109 9405
20 Rajasthan 16701 19709 16424 11502 9412 15566 17237
21 Sikkim 20 39 36 27 45 47 62
22 Tamil Nadu 7376 8781 8083 7968 7922 10567 10482
23 Tripura 239 382 464 535 536 553 561
24 Uttar Pradesh 19843 29603 33891 40641 31498 35793 36176
25 West Bengal 11479 14961 18636 15434 17957 17868 18649
26 A & N Islands 14 32 32 40 34 30 33
27 Dadra & Nagar Haveli 0 7 0 0 0 0 0
28 Daman & Diu 20 0 0 0 0 0 0
29 Delhi 13 24 22 32 29 26 51
30 Lakshadweep 0 1 1 1 1 1 1
31 Puducherry 25 66 68 62 59 66 37
32 Chandigarh 3 14 15 15 7 12 12
33 Jharkhand 2459 5380 10039 8909 8909 4385 5594
34 Chattisgarh 7694 23 12412 12413 12413 12336 12319
35 Uttarakhand 270 0 684 1154 1236 1131 990
Total 188199 238826 276023 270837 265883 274054 287145
Kitchen garden
Statement 61 : Statewise Value of Output
( At Current Prices )
Page 141

Central Statistical OrganisationNational Accounts Division
(Rs. lakhs)
1999-00 2000-01 2001-02 2002-03 2003-04 2004-05 2005-06 State/U.Ts
10011 11517 10591 10513 10683 12180 12857 1 Andhra Pradesh
54 65 65 59 82 74 75 2 Arunachal Pradesh
3399 4250 4223 4892 3891 4003 3533 3 Assam
10631 11226 10474 10788 11816 8729 9572 4 Bihar
168 67 72 68 72 63 90 5 Goa
10732 14667 14790 15896 17573 17181 17269 6 Gujarat
2896 5299 5187 4655 5055 5107 5002 7 Haryana
282 712 602 892 943 1078 1054 8 Himachal Pradesh
659 759 834 831 884 983 983 9 Jammu & Kashmir
17351 20387 21297 18221 17333 17755 17289 10 Karnataka
1549 2063 2403 2352 2551 2217 2527 11 Kerala
22396 28541 29913 29867 30309 31282 29660 12 Madhya Pradesh
32205 41508 43036 41204 32291 30387 32867 13 Maharashtra
155 218 241 192 241 245 230 14 Manipur
161 165 142 25 205 205 197 15 Meghalaya
89 72 103 74 54 56 58 16 Mizoram
307 638 604 751 351 266 272 17 Nagaland
4145 6570 6380 6042 6550 6381 2962 18 Orissa
4856 6903 6965 7412 7261 7604 6996 19 Punjab
16701 21169 19593 12242 11134 18022 20136 20 Rajasthan
20 38 37 33 46 47 59 21 Sikkim
7376 7922 7683 6530 5961 7474 6993 22 Tamil Nadu
239 377 400 450 442 455 462 23 Tripura
19843 22909 22875 29404 21006 24086 24214 24 Uttar Pradesh
11479 14735 17401 14746 16025 15898 15553 25 West Bengal
14 25 25 28 25 24 26 26 A & N Islands
0 7 0 0 0 0 0 27 Dadra & Nagar Haveli
20 0 0 0 0 0 0 28 Daman & Diu
13 20 18 27 24 22 40 29 Delhi
0 1 1 1 1 1 1 30 Lakshadweep
25 51 48 50 47 47 29 31 Puducherry
3 13 13 13 5 11 11 32 Chandigarh
2459 5720 5907 5656 5656 2428 2512 33 Jharkhand
7694 24 11586 12348 12203 8746 10050 34 Chattisgarh
270 0 569 840 980 909 860 35 Uttarakhand
188199 228637 244080 237102 221703 223965 224437 Total
( At 1999-00 Prices)
Kitchen garden
Statement 61 : Statewise Value of Output
Page 142

Central Statistical OrganisationNational Accounts Division
(Rs. lakhs)
State/U.Ts 1999-00 2000-01 2001-02 2002-03 2003-04 2004-05 2005-06
1 Andhra Pradesh 2805232 3222697 3089547 2617632 3347797 3562831 4009051
2 Arunachal Pradesh 38526 46796 48020 52645 56156 49734 52444
3 Assam 986677 1039269 1045191 1039907 964075 978046 1076426
4 Bihar 1416073 1819663 1782758 1858217 2133311 1502327 1836381
5 Goa 61852 45642 52422 53716 58493 65139 115903
6 Gujarat 1671526 1412340 1840146 1825158 3004570 2641487 3402604
7 Haryana 1430079 1530698 1571980 1595041 1819936 1859686 1917735
8 Himachal Pradesh 223967 287557 321118 332301 388216 437905 437070
9 Jammu & Kashmir 312385 316843 343046 422674 436505 499524 478797
10 Karnataka 2898352 3043387 2595245 2422881 2249866 2701945 3432844
11 Kerala 1282500 1069303 1054325 1281032 1282870 1464564 1681189
12 Madhya Pradesh 2322120 1954708 2282657 2070549 2980012 2866103 3013578
13 Maharashtra 4369287 3857755 4792080 4615844 5026814 5398159 6506084
14 Manipur 57494 58754 63736 63988 86672 91840 86929
15 Meghalaya 63482 75122 80181 93355 83966 90897 90200
16 Mizoram 21249 24066 32874 28899 29259 30273 33050
17 Nagaland 64959 104036 143072 127797 69545 75037 86631
18 Orissa 1139707 1079533 1258846 1208569 1634546 1594476 1701257
19 Punjab 2234833 2342542 2445087 2412913 2555596 2701285 2836597
20 Rajasthan 2034449 1853195 2288195 1564377 2909498 2590869 2651478
21 Sikkim 17469 21995 23161 22934 25204 25946 50584
22 Tamil Nadu 1877979 1944333 1903175 1498825 1531112 1944449 2198249
23 Tripura 118460 147198 197841 177409 181272 190801 184822
24 Uttar Pradesh 5645396 5636853 6029821 6251802 6628958 6752736 7696239
25 West Bengal 3425659 3240399 3618878 3499936 3890179 3914928 4183138
26 A & N Islands 12632 13130 16110 20375 16851 16428 19962
27 Dadra & Nagar Haveli 4904 5537 5890 6008 5824 5931 5966
28 Daman & Diu 1563 1352 1485 1367 1421 1072 841
29 Delhi 42485 59522 58131 52864 54601 56042 55221
30 Lakshadweep 1249 1247 1802 2212 2823 2823 2823
31 Puducherry 15441 16609 16869 17856 19168 18569 18362
32 Chandigarh 2590 1267 1471 1632 1664 1195 1194
33 Jharkhand 301406 298782 584147 476734 532665 562604 716909
34 Chattisgarh 671644 417842 719522 583787 867615 713165 911760
35 Uttarakhand 308760 386647 315869 347278 376618 404147 388962
Total 38283214 37376618 40624698 38648515 45253678 45812965 51881281
Statement 1-61 : Statewise Value of Output
( At Current Prices )
Total Value of Output Agriculture
Page 143

Central Statistical OrganisationNational Accounts Division
(Rs. lakhs)
1999-00 2000-01 2001-02 2002-03 2003-04 2004-05 2005-06 State/U.Ts
2805232 3117266 2952422 2393409 2933750 3113378 3396251 1 Andhra Pradesh
38526 44639 44280 46570 54627 43619 45405 2 Arunachal Pradesh
986677 1012019 1018863 1048375 933384 864715 877273 3 Assam
1416073 1854438 1727794 1697478 1774844 1368238 1493024 4 Bihar
61852 46328 52110 48689 52740 47944 63869 5 Goa
1671526 1421722 1874830 1647264 2595615 2397949 2951897 6 Gujarat
1430079 1467982 1471848 1418907 1577833 1623205 1575566 7 Haryana
223967 277029 276728 289744 338779 381285 372296 8 Himachal Pradesh
312385 303286 321697 328634 330078 378862 361851 9 Jammu & Kashmir
2898352 3224190 2862748 2524638 2196997 2608223 2952856 10 Karnataka
1282500 1296428 1287779 1360369 1217940 1323191 1631415 11 Kerala
2322120 1740287 1990671 1619375 2303729 2185818 2183460 12 Madhya Pradesh
4369287 3909736 4794894 4636191 4802978 4907300 5406443 13 Maharashtra
57494 60499 62931 59612 81280 83143 78716 14 Manipur
63482 60217 59383 69759 63831 62402 62391 15 Meghalaya
21249 21980 26096 22084 20939 22305 24200 16 Mizoram
64959 85740 128630 104552 51500 55922 64534 17 Nagaland
1139707 1109235 1325522 1000585 1297038 1303075 1347089 18 Orissa
2234833 2291537 2299850 2203055 2294143 2402858 2398504 19 Punjab
2034449 1882392 2483321 1365623 3042425 2431711 2377687 20 Rajasthan
17469 21457 21931 21635 22316 22641 47564 21 Sikkim
1877979 1915982 1852433 1337526 1281694 1639689 1739594 22 Tamil Nadu
118460 147588 185642 165187 166428 167224 159664 23 Tripura
5645396 5484343 5666051 5510167 5613975 5370313 5722883 24 Uttar Pradesh
3425659 3328046 3695290 3568893 3628860 3631283 3679110 25 West Bengal
12632 12082 12813 15482 13098 12176 14026 26 A & N Islands
4904 5313 5123 5400 5178 5343 5412 27 Dadra & Nagar Haveli
1563 1325 1469 1316 1372 1040 811 28 Daman & Diu
42485 53510 51740 46641 46605 49120 37828 29 Delhi
1249 1247 1802 1780 2265 2265 2265 30 Lakshadweep
15441 15267 15621 15711 16869 15150 15297 31 Puducherry
2590 1013 1096 1023 916 778 778 32 Chandigarh
301406 351749 330528 328994 391918 378102 397427 33 Jharkhand
671644 404013 702957 527716 766282 626572 788742 34 Chattisgarh
308760 347475 261939 267066 298080 309423 290936 35 Uttarakhand
38283214 37317361 39868829 35699451 40220305 39836262 42567067 Total
Total Value of Output Agriculture
( At 1999-00 Prices)Statement 1-61 : Statewise Value of Output
Page 144

Central Statistical OrganisationNational Accounts Division
(Rs. lakhs)
State/U.Ts 1999-00 2000-01 2001-02 2002-03 2003-04 2004-05 2005-061 Andhra Pradesh 610767 688647 736777 860034 914180 1023159 10754772 Arunachal Pradesh 5793 6343 6793 7949 8544 8995 18543 Assam 106720 109280 109120 119850 123590 139460 1411204 Bihar 321965 345640 373736 403818 447569 672683 7102445 Goa 5865 6237 6234 6369 6642 8637 84846 Gujarat 501435 554646 621509 649058 759539 857551 8995687 Haryana 560183 581130 599497 630404 663232 682095 6925158 Himachal Pradesh 96575 105982 106869 114723 116651 141396 1477879 Jammu & Kashmir 127975 132409 148080 188419 193818 192092 18943910 Karnataka 451239 473344 506531 484104 415457 451219 46331511 Kerala 288574 301685 311106 277393 224565 228441 27531012 Madhya Pradesh 548247 574813 642099 663021 688969 722677 81038613 Maharashtra 743118 809042 837532 864017 950784 1004345 108003114 Manipur 10895 10574 10357 10965 11287 13490 1404215 Meghalaya 6259 6780 7953 8511 8656 8905 930816 Mizoram 2896 2276 2412 2701 3003 3204 300617 Nagaland 6726 6051 6456 6846 7070 8120 895918 Orissa 90355 95834 105534 110473 121634 161443 17646719 Punjab 810410 861329 917231 949791 997620 1059710 110341220 Rajasthan 724315 764997 807579 821843 862242 992958 121609921 Sikkim 3179 3364 3738 4683 5138 4985 530122 Tamil Nadu 475646 502460 534163 489723 492093 542135 59999123 Tripura 10872 11481 13419 12640 13440 15535 1590124 Uttar Pradesh 1460898 1608255 1743654 1825481 2013097 2087520 226574525 West Bengal 394664 414437 437818 478080 529336 565949 58282526 A & N Islands 4440 4400 4641 5827 5603 6500 520027 Dadra & Nagar Haveli 508 1571 1718 1802 1774 1010 5028 Daman & Diu 1381 251 246 258 252 145 14929 Delhi 42406 49809 49468 52209 52795 53639 5477530 Lakshadweep 368 520 372 300 450 171 37531 Puducherry 4201 4165 4296 4712 5017 5126 536832 Chandigarh 4415 4759 4970 4995 5230 5325 569533 Jharkhand 136519 100172 105930 109491 109776 114868 11583434 Chattisgarh 144004 193463 150650 135330 135614 216066 21697235 Uttarakhand 105413 118947 126906 128865 150040 150978 152366
Total 8809223 9455093 10045395 10434684 11044707 12150531 13053372
Statement 62 : Statewise Value of Output From Livestock
( At Current Prices )
Milk
Page 145

Central Statistical OrganisationNational Accounts Division
(Rs. lakhs)
1999-00 2000-01 2001-02 2002-03 2003-04 2004-05 2005-06 State/U.Ts
610767 653446 685194 767267 819390 825878 868091 1 Andhra Pradesh
5793 5437 5435 5962 6031 5996 1236 2 Arunachal Pradesh
106720 109280 109120 112800 116320 118080 119520 3 Assam
321965 338981 362861 390508 432707 635562 678040 4 Bihar
5865 6036 6032 6163 6428 7620 7485 5 Goa
501435 506129 559816 580081 611645 720568 743395 6 Gujarat
560183 579466 593649 610199 620927 600661 609343 7 Haryana
96575 99047 98406 100617 102308 113108 113109 8 Himachal Pradesh
127975 131456 135334 172185 175923 173821 171418 9 Jammu & Kashmir
451239 464054 484032 458001 389187 395242 405838 10 Karnataka
288574 296895 309774 275699 240600 230918 235142 11 Kerala
548247 555897 616347 623159 628222 637890 743774 12 Madhya Pradesh
743118 761606 793506 812125 830614 855093 881525 13 Maharashtra
10895 10574 10886 11042 11365 11845 12329 14 Manipur
6259 6457 6627 6809 6925 7124 7446 15 Meghalaya
2896 2276 2272 2431 2433 2596 2435 16 Mizoram
6726 5914 6170 6263 6468 7310 8063 17 Nagaland
90355 93119 98753 100028 105981 136489 142655 18 Orissa
810410 817678 833774 858906 881637 898655 935715 19 Punjab
724315 740394 768518 771433 799055 661540 694178 20 Rajasthan
3179 3157 3388 4108 4385 5449 5796 21 Sikkim
475646 502460 508983 466736 468611 471197 519361 22 Tamil Nadu
10872 10872 12708 11155 11861 12002 12284 23 Tripura
1460898 1533827 1620897 1691510 1763783 1826647 1919891 24 Uttar Pradesh
394664 395347 400359 410040 419835 431909 443299 25 West Bengal
4440 4440 4641 5247 5045 5310 4248 26 A & N Islands
508 1421 1554 1577 1553 884 44 27 Dadra & Nagar Haveli
1381 227 223 226 221 127 130 28 Daman & Diu
42406 42727 43197 43506 43995 44698 45645 29 Delhi
368 520 372 300 450 171 375 30 Lakshadweep
4201 4165 4147 4118 4376 4458 4671 31 Puducherry
4415 4518 4518 4517 4622 4515 4830 32 Chandigarh
136519 94710 96904 98001 98976 95154 95999 33 Jharkhand
144004 187802 144375 127658 127769 178220 178890 34 Chattisgarh
105413 113446 117975 119411 131451 132114 133329 35 Uttarakhand
8809223 9083779 9450747 9659792 9881100 10258853 10749531 Total
Milk
Statement 62 : Statewise Value of Output From Livestock
( At 1999-00 Prices)
Page 146

Central Statistical OrganisationNational Accounts Division
(Rs. lakhs)
State/U.Ts 1999-00 2000-01 2001-02 2002-03 2003-04 2004-05 2005-061 Andhra Pradesh 122606 131560 150753 168283 176437 178633 1861682 Arunachal Pradesh 1076 1139 1345 1530 1979 2523 26933 Assam 9275 9995 10007 12075 12177 12362 127014 Bihar 10043 11229 11621 11610 11796 13965 126735 Goa 1270 1206 1258 1264 1258 160 1606 Gujarat 5598 5074 5398 5853 5198 8046 93297 Haryana 9277 13472 13633 15729 16448 19001 193978 Himachal Pradesh 1524 1294 1566 1575 1598 1031 9579 Jammu & Kashmir 7676 7319 7581 8968 9963 9747 1003110 Karnataka 26160 28295 27187 26328 21411 23566 2440811 Kerala 28952 33975 28977 19516 18425 20265 2003612 Madhya Pradesh 15094 8801 7705 10091 11381 11795 1230613 Maharashtra 43037 42114 42175 41872 42707 44718 5035714 Manipur 1351 1373 1620 2268 2446 2598 263915 Meghalaya 1506 1346 1441 1713 1701 1719 176816 Mizoram 876 563 703 986 998 1031 106117 Nagaland 748 852 853 1130 1158 1259 144618 Orissa 10940 10720 15412 13514 13911 18872 1984819 Punjab 30569 33556 34272 37485 37069 46744 4471820 Rajasthan 6026 7395 6995 9077 7590 7461 810821 Sikkim 143 160 169 187 240 357 37022 Tamil Nadu 40108 41435 41323 37022 40264 82445 8370723 Tripura 1989 1996 1612 1957 1905 2107 216424 Uttar Pradesh 8605 10595 10593 9830 11656 12364 1277725 West Bengal 38738 39038 39523 39941 42209 41957 4296926 A & N Islands 1509 1555 1279 1818 1921 1697 152727 Dadra & Nagar Haveli 35 42 25 22 20 68 6528 Daman & Diu 77 75 80 86 91 20 2329 Delhi 578 458 415 273 273 309 23030 Lakshadweep 89 94 78 98 125 136 15331 Puducherry 105 115 111 106 128 130 13332 Chandigarh 214 188 190 230 263 296 29633 Jharkhand 765 9467 10499 11186 11618 13935 1302334 Chattisgarh 12017 9259 10305 10048 9784 10776 1076035 Uttarakhand 1234 1129 1195 1206 2476 4365 4377
Total 439811 466886 487898 504879 518625 596458 613377
( At Current Prices )
Egg
Statement 63 : Statewise Value of Output From Livestock
Page 147

Central Statistical OrganisationNational Accounts Division
(Rs. lakhs)
1999-00 2000-01 2001-02 2002-03 2003-04 2004-05 2005-06 State/U.Ts
122606 129455 146005 162983 164407 177226 184702 1 Andhra Pradesh
1076 1139 1345 1530 1759 2018 2155 2 Arunachal Pradesh
9275 9596 9607 9660 9742 9890 10161 3 Assam
10043 11199 11572 11500 11550 13498 13498 4 Bihar
1270 1447 1301 1308 1301 166 166 5 Goa
5598 4048 4330 4502 5198 6676 7666 6 Gujarat
9277 13311 13312 15383 15703 18172 18551 7 Haryana
1524 1552 1566 1575 1598 1396 1296 8 Himachal Pradesh
7676 7333 7818 8704 9670 9460 9737 9 Jammu & Kashmir
26160 26165 26631 26218 22774 23354 24189 10 Karnataka
28952 28721 28258 19013 18039 16906 16879 11 Kerala
15094 8719 7583 9740 11128 11204 11689 12 Madhya Pradesh
43037 43555 44892 46310 47444 48299 49727 13 Maharashtra
1351 1373 1416 1454 1568 1623 1649 14 Manipur
1506 1554 1662 1676 1664 1682 1730 15 Meghalaya
876 563 586 616 623 902 928 16 Mizoram
748 786 768 968 970 1079 1239 17 Nagaland
10940 12355 17663 15401 15765 17560 18468 18 Orissa
30569 32569 32546 34361 33746 40461 38707 19 Punjab
6026 6221 6553 6922 7320 7554 7820 20 Rajasthan
143 151 154 163 204 263 272 21 Sikkim
40108 40985 44045 41674 45324 73344 74466 22 Tamil Nadu
1989 1996 1612 1887 1905 2031 2086 23 Tripura
8605 9986 9912 9198 10753 11263 11405 24 Uttar Pradesh
38738 39038 39301 39865 40900 41876 42978 25 West Bengal
1509 1555 1544 1561 1649 1457 1311 26 A & N Islands
35 39 24 21 20 66 63 27 Dadra & Nagar Haveli
77 70 75 83 88 20 22 28 Daman & Diu
578 435 390 276 276 277 205 29 Delhi
89 94 78 98 125 136 153 30 Lakshadweep
105 106 107 106 113 115 118 31 Puducherry
214 183 181 230 263 301 301 32 Chandigarh
765 10945 11510 11638 12088 10921 10205 33 Jharkhand
12017 9234 10261 10328 10057 10892 10876 34 Chattisgarh
1234 1129 1118 1128 2284 2308 2315 35 Uttarakhand
439811 457608 485723 498083 508020 564396 577733 Total
Statement 63 : Statewise Value of Output From Livestock
( At 1999-00 Prices)
Egg
Page 148

Central Statistical OrganisationNational Accounts Division
(Rs. lakhs)
State/U.Ts 1999-00 2000-01 2001-02 2002-03 2003-04 2004-05 2005-061 Andhra Pradesh 2492 2596 2782 2791 2980 2970 31922 Arunachal Pradesh 178 189 184 128 132 131 1343 Assam 0 0 0 0 0 0 04 Bihar 446 383 441 415 431 465 4095 Goa 54 49 51 53 54 56 586 Gujarat 953 692 1132 1352 1542 1450 15397 Haryana 2133 2364 2563 2919 3520 1885 17138 Himachal Pradesh 2357 2532 2575 2598 2604 2602 26069 Jammu & Kashmir 2547 4264 2916 3024 3307 3544 367810 Karnataka 3028 3366 3455 3930 3471 3338 341211 Kerala 59 60 60 60 61 61 6112 Madhya Pradesh 631 794 830 825 856 851 63913 Maharashtra 904 917 715 978 1142 1055 106914 Manipur 152 170 178 193 218 220 22115 Meghalaya 149 151 153 155 157 139 14116 Mizoram 0 62 60 59 57 56 5517 Nagaland 120 123 125 127 130 132 13418 Orissa 174 170 171 179 192 177 17619 Punjab 588 695 713 668 716 506 61420 Rajasthan 7183 7407 6994 7323 7155 5781 727821 Sikkim 16 18 18 19 18 13 1122 Tamil Nadu 339 340 343 340 347 365 36823 Tripura 4 4 4 4 0 5 524 Uttar Pradesh 2270 2483 2368 2648 3019 8082 305125 West Bengal 580 684 670 757 786 793 84726 A & N Islands 0 0 0 0 0 0 027 Dadra & Nagar Haveli 0 0 0 0 0 0 028 Daman & Diu 0 0 0 0 0 0 029 Delhi 7 7 9 9 10 7 730 Lakshadweep 0 0 0 0 0 0 031 Puducherry 0 0 0 0 0 0 032 Chandigarh 0 0 0 0 0 0 033 Jharkhand 243 595 665 700 716 820 83234 Chattisgarh 350 446 457 489 473 435 44635 Uttarakhand 165 166 134 184 167 147 150
Total 28123 31727 30768 32929 34259 36084 32844
Wool & Hair
Statement 64 : Statewise Value of Output From Livestock
( At Current Prices )
Page 149

Central Statistical OrganisationNational Accounts Division
(Rs. lakhs)
1999-00 2000-01 2001-02 2002-03 2003-04 2004-05 2005-06 State/U.Ts
2492 2607 2730 2737 2924 2901 3120 1 Andhra Pradesh
178 181 184 188 193 131 134 2 Arunachal Pradesh
0 0 0 0 0 0 0 3 Assam
446 363 411 380 394 532 489 4 Bihar
54 56 58 60 62 64 66 5 Goa
953 993 1030 1075 1074 2472 2607 6 Gujarat
2133 2242 2361 2439 2864 1437 1308 7 Haryana
2357 2365 2369 2383 2388 2386 2390 8 Himachal Pradesh
2547 2610 2711 2811 2939 3546 3680 9 Jammu & Kashmir
3028 3170 3208 3553 3224 2498 2555 10 Karnataka
59 60 60 60 61 61 61 11 Kerala
631 651 672 667 686 823 616 12 Madhya Pradesh
904 917 929 935 952 940 954 13 Maharashtra
152 152 153 153 153 154 154 14 Manipur
149 151 153 155 157 16 16 15 Meghalaya
0 0 0 0 0 56 55 16 Mizoram
120 122 124 126 128 130 133 17 Nagaland
174 173 172 171 170 169 168 18 Orissa
588 621 625 580 561 345 426 19 Punjab
7183 7271 7375 7397 7425 5959 6096 20 Rajasthan
16 17 16 17 15 13 11 21 Sikkim
339 340 343 340 347 365 368 22 Tamil Nadu
4 4 4 4 0 5 5 23 Tripura
2270 2316 2366 2408 2457 2412 2295 24 Uttar Pradesh
580 590 600 612 623 898 918 25 West Bengal
0 0 0 0 0 0 0 26 A & N Islands
0 0 0 0 0 0 0 27 Dadra & Nagar Haveli
0 0 0 0 0 0 0 28 Daman & Diu
7 8 8 8 9 5 5 29 Delhi
0 0 0 0 0 0 0 30 Lakshadweep
0 0 0 0 0 0 0 31 Puducherry
0 0 0 0 0 0 0 32 Chandigarh
243 296 346 358 363 419 417 33 Jharkhand
350 421 431 462 446 579 594 34 Chattisgarh
165 166 147 175 159 130 132 35 Uttarakhand
28123 28860 29586 30255 30773 29445 29772 Total
Statement 64 : Statewise Value of Output From Livestock
( At 1999-00 Prices)
Wool & Hair
Page 150

Central Statistical OrganisationNational Accounts Division
(Rs. lakhs)
State/U.Ts 1999-00 2000-01 2001-02 2002-03 2003-04 2004-05 2005-061 Andhra Pradesh 32352 32767 33209 33023 33354 33973 341432 Arunachal Pradesh 392 366 389 414 441 470 5023 Assam 6001 6232 6409 6751 6956 7196 75554 Bihar 40962 47579 49865 61292 79443 84912 1156335 Goa 259 254 285 279 274 277 2736 Gujarat 15303 17128 16854 20614 20899 21045 236647 Haryana 57108 62105 66050 69994 74028 77702 822828 Himachal Pradesh 7224 8330 8935 9532 10282 11219 123839 Jammu & Kashmir 26230 32704 34163 33733 34385 35134 3598110 Karnataka 24314 26750 26211 27713 28087 25268 2564511 Kerala 106100 122545 59792 60572 100468 44668 4530312 Madhya Pradesh 113300 121212 120985 120791 134242 138251 13809313 Maharashtra 26267 26713 36429 27421 27728 21515 2287314 Manipur 393 394 390 402 431 412 39415 Meghalaya 785 823 871 896 968 948 97616 Mizoram 179 164 151 139 130 151 14917 Nagaland 328 258 269 278 289 315 32618 Orissa 6194 5493 4650 3850 3850 3850 385019 Punjab 36832 38342 39123 41289 43602 46129 4674920 Rajasthan 290189 299986 303104 355157 342914 369381 38225621 Sikkim 145 153 166 188 220 85 8522 Tamil Nadu 43316 61889 50462 56969 49607 47324 4747123 Tripura 918 926 1042 1110 1182 1261 134624 Uttar Pradesh 115355 120001 81051 112939 125694 112939 17536225 West Bengal 35464 30191 43684 52937 55467 48599 4918426 A & N Islands 413 431 408 496 534 575 62627 Dadra & Nagar Haveli 140 142 145 148 152 155 15928 Daman & Diu 27 26 25 24 23 22 2129 Delhi 3290 3500 3455 4308 4005 4085 408530 Lakshadweep 149 162 180 52 59 66 7531 Puducherry 509 386 369 374 557 532 51032 Chandigarh 143 155 162 176 192 211 22233 Jharkhand 30868 34321 39348 41860 42426 67560 6850934 Chattisgarh 28038 51982 55630 59620 63989 105769 11383735 Uttarakhand 3823 2338 2998 4079 4880 5571 3945
Total 1053310 1156747 1087261 1209420 1291757 1317570 1444468
( At Current Prices )
Dung
Statement 65 : Statewise Value of Output From Livestock
Page 151

Central Statistical OrganisationNational Accounts Division
(Rs. lakhs)
1999-00 2000-01 2001-02 2002-03 2003-04 2004-05 2005-06 State/U.Ts
32352 33106 33209 32656 33461 31803 31962 1 Andhra Pradesh
392 374 398 424 452 470 502 2 Arunachal Pradesh
6001 5963 6132 6332 6570 6854 7196 3 Assam
40962 43458 46232 49257 52564 97559 104438 4 Bihar
259 254 249 244 239 234 230 5 Goa
15303 19116 18098 18213 19095 17289 18126 6 Gujarat
57108 59491 61936 64726 67917 71581 75801 7 Haryana
7224 7763 8196 8744 9432 10291 11360 8 Himachal Pradesh
26230 32786 33256 33817 34471 48988 50170 9 Jammu & Kashmir
24314 24109 24218 24680 25013 25368 25746 10 Karnataka
106100 97080 86032 87109 64402 110031 111596 11 Kerala
113300 115349 115147 114962 114795 114646 114516 12 Madhya Pradesh
26267 25502 34064 25502 25502 20419 21481 13 Maharashtra
393 360 341 325 309 295 282 14 Manipur
785 806 828 851 875 901 928 15 Meghalaya
179 164 151 139 130 32 32 16 Mizoram
328 254 262 270 279 306 317 17 Nagaland
6194 5493 4650 3850 3850 3850 3850 18 Orissa
36832 37471 37901 38355 38835 39038 39563 19 Punjab
290189 299896 308395 317350 326787 344437 355163 20 Rajasthan
145 143 142 140 139 85 85 21 Sikkim
43316 61629 55361 55252 47885 43336 43471 22 Tamil Nadu
918 926 984 1047 1115 1189 1270 23 Tripura
115355 118477 131856 134021 159689 112939 119368 24 Uttar Pradesh
35464 35846 36239 36646 37067 41305 41801 25 West Bengal
413 436 462 492 528 158 172 26 A & N Islands
140 142 145 148 152 155 159 27 Dadra & Nagar Haveli
27 26 25 24 23 22 21 28 Daman & Diu
3290 3500 3455 3564 3567 2045 2045 29 Delhi
149 162 180 201 225 255 289 30 Lakshadweep
509 386 369 352 337 322 308 31 Puducherry
143 152 157 164 171 176 185 32 Chandigarh
30868 31624 32038 32464 32903 52445 53182 33 Jharkhand
28038 29936 32036 34334 36850 39606 42627 34 Chattisgarh
3823 2239 2754 2969 3406 3877 3877 35 Uttarakhand
1053310 1094419 1115897 1129625 1149036 1242308 1282118 Total
Dung
Statement 65 : Statewise Value of Output From Livestock
( At 1999-00 Prices)
Page 152

Central Statistical OrganisationNational Accounts Division
(Rs. lakhs)
State/U.Ts 1999-00 2000-01 2001-02 2002-03 2003-04 2004-05 2005-061 Andhra Pradesh 38573 44124 56052 66008 70952 59611 596112 Arunachal Pradesh 19 19 14 59 18 6 63 Assam 3428 3990 3625 5809 7258 7770 77704 Bihar 1815 1734 1793 862 860 872 8745 Goa 0 0 0 0 0 0 06 Gujarat 0 0 0 0 0 0 07 Haryana 0 0 0 0 0 0 08 Himachal Pradesh 150 150 122 200 144 144 1449 Jammu & Kashmir 2036 785 1858 2292 1967 2075 207510 Karnataka 72305 79509 104234 57595 81199 75210 7521011 Kerala 424 424 415 415 426 467 46712 Madhya Pradesh 368 688 955 146 241 288 28813 Maharashtra 399 416 607 751 494 428 42814 Manipur 973 976 898 698 679 929 92915 Meghalaya 600 600 537 739 862 847 84716 Mizoram 69 69 63 69 75 79 7917 Nagaland 82 88 153 126 150 168 16818 Orissa 1090 1090 943 1085 866 823 75519 Punjab 100 100 132 143 143 143 14320 Rajasthan 0 0 0 0 0 2 221 Sikkim 3 3 3 3 3 3 322 Tamil Nadu 6942 7870 8078 6164 3786 5088 508823 Tripura 54 54 56 62 56 56 5624 Uttar Pradesh 584 584 565 450 431 435 43525 West Bengal 8361 9086 11070 10694 10712 11176 1117626 A & N Islands 0 0 0 0 0 0 027 Dadra & Nagar Haveli 0 0 0 0 0 0 028 Daman & Diu 0 0 0 0 0 0 029 Delhi 0 0 0 0 0 2 230 Lakshadweep 0 0 0 0 0 0 031 Puducherry 0 0 0 0 0 0 032 Chandigarh 0 0 0 0 0 0 033 Jharkhand 0 0 0 696 1482 1258 125834 Chattisgarh 0 0 0 900 840 911 91135 Uttarakhand 13 264 0 68 98 110 126
Total 138388 152623 192173 156035 183742 168901 168850
Silk Worm Cocoons & Honey
Statement 66 : Statewise Value of Output From Livestock
( At Current Prices )
Page 153

Central Statistical OrganisationNational Accounts Division
(Rs. lakhs)
1999-00 2000-01 2001-02 2002-03 2003-04 2004-05 2005-06 State/U.Ts
38573 38541 48971 57660 61974 52072 52072 1 Andhra Pradesh
19 19 7 30 18 6 6 2 Arunachal Pradesh
3428 3428 3107 4951 5047 5378 5378 3 Assam
1815 1824 1885 873 872 885 885 4 Bihar
0 0 0 0 0 0 0 5 Goa
0 0 0 0 0 0 0 6 Gujarat
0 0 0 0 0 0 0 7 Haryana
150 150 122 200 144 144 144 8 Himachal Pradesh
2036 2036 1858 2292 1967 2075 2075 9 Jammu & Kashmir
72305 72305 94782 60757 64696 79343 79343 10 Karnataka
424 424 415 415 426 467 467 11 Kerala
368 688 955 146 217 262 262 12 Madhya Pradesh
399 416 607 751 494 428 428 13 Maharashtra
973 976 898 698 679 914 914 14 Manipur
600 600 537 739 862 847 847 15 Meghalaya
69 69 63 69 75 79 79 16 Mizoram
82 82 153 126 150 168 168 17 Nagaland
1090 1090 943 1571 1005 966 966 18 Orissa
100 100 132 143 143 143 143 19 Punjab
0 0 0 0 0 2 2 20 Rajasthan
3 3 3 3 3 3 3 21 Sikkim
6942 6942 7097 5390 3269 5064 5064 22 Tamil Nadu
54 54 56 62 56 56 56 23 Tripura
584 584 565 450 431 435 435 24 Uttar Pradesh
8361 8361 10363 10694 10712 11176 11176 25 West Bengal
0 0 0 0 0 0 0 26 A & N Islands
0 0 0 0 0 0 0 27 Dadra & Nagar Haveli
0 0 0 0 0 0 0 28 Daman & Diu
0 0 0 0 0 2 2 29 Delhi
0 0 0 0 0 0 0 30 Lakshadweep
0 0 0 0 0 0 0 31 Puducherry
0 0 0 0 0 0 0 32 Chandigarh
0 0 0 696 1264 1294 1294 33 Jharkhand
0 0 0 1003 924 1002 1002 34 Chattisgarh
13 302 0 68 98 110 110 35 Uttarakhand
138388 138993 173518 149786 155525 163320 163320 Total
( At 1999-00 Prices)
Silk Worm Cocoons & Honey
Statement 66 : Statewise Value of Output From Livestock
Page 154

Central Statistical OrganisationNational Accounts Division
(Rs. lakhs)
State/U.Ts 1999-00 2000-01 2001-02 2002-03 2003-04 2004-05 2005-061 Andhra Pradesh 9050 10241 12005 13803 16097 18257 194612 Arunachal Pradesh 1537 1973 1753 1992 2121 2566 27273 Assam 11145 15553 21046 27296 36098 44141 536654 Bihar 80271 94609 95304 106771 116695 124558 1312215 Goa -120 -114 -106 -101 -95 -90 -836 Gujarat 17396 20397 21718 23232 27587 32360 344697 Haryana 8502 13587 15520 18920 22780 27420 314598 Himachal Pradesh 6806 9612 11788 19735 26217 33188 419559 Jammu & Kashmir 6420 8162 7275 7947 8557 9212 993010 Karnataka 18342 21549 24448 28398 33948 34971 3743411 Kerala 2702 2161 3213 2680 2952 4212 470712 Madhya Pradesh -885 44 428 249 427 556 69113 Maharashtra 25794 26721 20491 28599 30138 46996 5009114 Manipur -1523 -1470 -1385 -1299 -1203 -1142 -103515 Meghalaya 852 912 972 1061 1148 1148 120616 Mizoram -256 -329 -305 -280 -335 -191 -16517 Nagaland 817 847 878 910 943 977 101318 Orissa 9773 10797 11193 12557 13154 14334 1545219 Punjab 7179 9676 9281 4848 13142 15056 1580620 Rajasthan 19334 21592 31949 20593 23944 27957 2927021 Sikkim 86 131 180 238 301 367 43922 Tamil Nadu 805 1602 3201 5779 8916 12198 1582923 Tripura 2087 2192 2704 3267 3564 4872 525424 Uttar Pradesh -9358 -9267 -9033 -8836 -8397 -8056 -769725 West Bengal 10959 11682 12297 13605 14724 14617 1516226 A & N Islands 699 813 917 1177 1332 1521 173727 Dadra & Nagar Haveli 34 37 40 44 48 53 5928 Daman & Diu -5 -5 -4 -4 -4 -3 -329 Delhi 869 921 1008 1100 1228 1174 122230 Lakshadweep 77 83 106 115 128 144 16231 Puducherry -123 -116 -119 -92 -91 -91 -8532 Chandigarh 108 171 141 68 276 323 36333 Jharkhand 4776 5874 6126 6328 6689 7033 732334 Chattisgarh 59405 63840 70985 79310 86961 101984 11172435 Uttarakhand 124 169 199 235 263 469 553
Total 293680 344647 376214 420245 490255 573090 631317
( At Current Prices )
Increment in Stock
Statement 67 : Statewise Value of Output From Livestock
Page 155

Central Statistical OrganisationNational Accounts Division
(Rs. lakhs)
1999-00 2000-01 2001-02 2002-03 2003-04 2004-05 2005-06 State/U.Ts
9050 9719 10430 11751 11923 14827 15836 1 Andhra Pradesh
1537 1632 1732 1840 1952 2071 2198 2 Arunachal Pradesh
11145 14094 17092 16096 19257 23201 28163 3 Assam
80271 86709 93767 101511 110009 119343 129818 4 Bihar
-120 -115 -109 -103 -98 -92 -85 5 Goa
17396 18513 19686 20166 21424 22750 24150 6 Gujarat
8502 9511 10660 17127 19611 22496 25858 7 Haryana
6806 8798 11278 14375 18252 23118 29236 8 Himachal Pradesh
6420 6909 7421 7777 8347 8964 9644 9 Jammu & Kashmir
18342 19644 21040 22537 24140 25860 27705 10 Karnataka
2702 2942 3190 3447 3716 3998 4297 11 Kerala
-885 -752 -615 -475 -333 -186 -36 12 Madhya Pradesh
25794 27270 28861 30579 32434 34439 36606 13 Maharashtra
-1523 -1389 -1265 -1574 -1441 -1318 -1204 14 Manipur
852 895 940 842 885 930 978 15 Meghalaya
-256 -211 -163 -218 -153 -45 40 16 Mizoram
817 847 878 910 943 977 1013 17 Nagaland
9773 10141 10533 10952 11401 11884 12404 18 Orissa
7179 7617 8069 8541 9038 9568 10138 19 Punjab
19334 20235 21185 21827 22895 23463 24631 20 Rajasthan
86 123 163 297 368 448 537 21 Sikkim
805 2513 4384 6550 8702 11481 14777 22 Tamil Nadu
2087 2262 2452 2659 2883 3127 3393 23 Tripura
-9358 -8772 -8221 -7704 -7218 -6758 -6323 24 Uttar Pradesh
10959 11354 11764 11738 12143 12563 13000 25 West Bengal
699 789 893 1015 1160 1332 1539 26 A & N Islands
34 37 40 44 48 53 59 27 Dadra & Nagar Haveli
-5 -5 -4 -4 -4 -3 -3 28 Daman & Diu
869 907 945 969 1010 1414 1466 29 Delhi
77 87 97 110 125 142 163 30 Lakshadweep
-123 -115 -107 -89 -84 -78 -73 31 Puducherry
108 123 139 157 177 199 225 32 Chandigarh
4776 4923 5081 4672 4819 5054 5272 33 Jharkhand
59405 64293 69658 75552 82028 89147 97133 34 Chattisgarh
124 159 197 251 299 354 417 35 Uttarakhand
293680 321688 352090 384122 420661 464724 512973 Total
Increment in Stock
Statement 67 : Statewise Value of Output From Livestock
( At 1999-00 Prices)
Page 156

Central Statistical OrganisationNational Accounts Division
(Rs. lakhs)
State/U.Ts 1999-00 2000-01 2001-02 2002-03 2003-04 2004-05 2005-061 Andhra Pradesh 350819 362466 462798 515058 541387 614242 6297442 Arunachal Pradesh 2309 3611 4205 5021 5952 8521 86343 Assam 32186 36771 41936 44895 41773 45222 476944 Bihar 139950 143090 157947 172966 176719 184150 2046915 Goa 1295 1826 1744 1749 1739 1666 62836 Gujarat 33148 30278 32766 38821 35529 62702 453877 Haryana 22833 30891 32310 36607 37989 43521 466818 Himachal Pradesh 6665 6901 6948 7275 7471 7004 68059 Jammu & Kashmir 31346 35889 38408 40391 43226 42919 4242010 Karnataka 88208 94412 110288 119677 104242 114979 12037411 Kerala 94351 94995 99111 93126 91468 98014 9210912 Madhya Pradesh 26993 16591 18345 21423 25583 28134 2866313 Maharashtra 242773 252561 255822 260285 264574 278161 36290514 Manipur 16636 14723 14554 16939 17783 17981 1833915 Meghalaya 19155 21611 22321 24323 24858 25612 2448116 Mizoram 10938 8424 8956 9793 9765 9451 976517 Nagaland 10510 18095 13664 28260 27191 34770 3459318 Orissa 58116 67471 80939 81965 83701 98029 10664219 Punjab 110796 123637 124723 130086 126676 148344 14177920 Rajasthan 51667 55001 59276 64126 72971 80869 9751521 Sikkim 746 804 909 999 1053 1198 86522 Tamil Nadu 129349 132815 142615 142658 153095 184976 17516323 Tripura 8524 8732 7966 8895 8982 10126 1053824 Uttar Pradesh 206433 216565 227080 244205 271021 301409 31927125 West Bengal 398164 417265 427032 435899 443543 611378 45860826 A & N Islands 1490 1623 1707 1707 1813 1739 117327 Dadra & Nagar Haveli 708 721 683 687 680 1035 102328 Daman & Diu 753 767 773 798 805 361 36529 Delhi 14578 14118 12354 12441 13716 14873 1475830 Lakshadweep 142 156 170 303 308 120 47531 Puducherry 2611 2805 2985 3456 3805 4237 818432 Chandigarh 1551 1436 1501 1645 2297 2417 238933 Jharkhand 6205 11166 12050 12261 15017 14521 1453534 Chattisgarh 66757 64571 67481 69665 69849 79463 8151235 Uttarakhand 5180 5184 5961 6279 7081 8307 9195
Total 2193887 2297970 2498327 2654683 2733663 3180453 3173559
Meat
Statement 68 : Statewise Value of Output From Livestock
( At Current Prices )
Page 157

Central Statistical OrganisationNational Accounts Division
(Rs. lakhs)
1999-00 2000-01 2001-02 2002-03 2003-04 2004-05 2005-06 State/U.Ts
350819 376691 454115 495063 541329 538093 553103 1 Andhra Pradesh
2309 2805 3260 3716 3756 5442 5503 2 Arunachal Pradesh
32186 32011 32776 34477 35685 38082 40177 3 Assam
139950 138510 150997 162098 164899 168093 177867 4 Bihar
1295 1597 1695 1703 1692 1121 4557 5 Goa
33148 30527 31086 36457 33434 34748 38334 6 Gujarat
22833 30801 30867 34296 34879 38973 41636 7 Haryana
6665 6814 6825 6606 6953 6174 6077 8 Himachal Pradesh
31346 31071 32605 38130 39900 39600 40114 9 Jammu & Kashmir
88208 87830 99325 104711 89771 89871 90718 10 Karnataka
94351 93542 94981 89961 90218 89384 69508 11 Kerala
26993 15707 16313 18444 21744 22467 22866 12 Madhya Pradesh
242773 246063 252645 257979 263658 268202 326323 13 Maharashtra
16636 13588 13240 9621 10134 14012 12939 14 Manipur
19155 20205 20412 21232 21703 22387 22353 15 Meghalaya
10938 7601 7720 7588 8014 7420 7483 16 Mizoram
10510 17928 13335 27438 26027 33627 33570 17 Nagaland
58116 62618 75427 73767 74836 86198 89306 18 Orissa
110796 119776 119272 125584 121186 140589 134180 19 Punjab
51667 55110 58839 60415 66730 69243 73035 20 Rajasthan
746 775 855 873 913 983 691 21 Sikkim
129349 131512 140008 144680 148141 185402 177911 22 Tamil Nadu
8524 8574 7757 8492 8577 9292 10036 23 Tripura
206433 209889 219897 235592 245759 253525 266942 24 Uttar Pradesh
398164 404280 408620 411098 421432 429889 434819 25 West Bengal
1490 1517 1509 1248 1487 1259 798 26 A & N Islands
708 714 675 666 658 1016 1003 27 Dadra & Nagar Haveli
753 743 750 763 769 347 351 28 Daman & Diu
14578 13504 13319 12950 12755 14240 14067 29 Delhi
142 153 167 302 309 123 477 30 Lakshadweep
2611 2636 2857 3102 3144 3509 6578 31 Puducherry
1551 1396 1444 1568 2087 2131 2106 32 Chandigarh
6205 10726 11178 11762 13638 13881 13777 33 Jharkhand
66757 61980 47662 64819 64910 65980 66552 34 Chattisgarh
5180 5109 5967 6079 6516 6157 6312 35 Uttarakhand
2193887 2244302 2378399 2513281 2587645 2701461 2792069 Total
( At 1999-00 Prices)
Meat
Statement 68 : Statewise Value of Output From Livestock
Page 158

Central Statistical OrganisationNational Accounts Division
(Rs. lakhs)
State/U.Ts 1999-00 2000-01 2001-02 2002-03 2003-04 2004-05 2005-061 Andhra Pradesh 1166659 1272402 1454377 1658999 1755386 1930845 2007797
2 Arunachal Pradesh 11304 13639 14685 17094 19187 23211 16550
3 Assam 168755 181821 192143 216677 227853 256151 270505
4 Bihar 595450 644264 690706 757734 833513 1081606 1175745
5 Goa 8624 9457 9465 9614 9872 10707 15174
6 Gujarat 573832 628215 699377 738929 850294 983153 1013957
7 Haryana 660037 703549 729573 774573 817997 851624 874048
8 Himachal Pradesh 121301 134801 138802 155638 164967 196584 212637
9 Jammu & Kashmir 204229 221532 240282 284774 295222 294723 293555
10 Karnataka 683594 727225 802354 747745 687815 728550 749797
11 Kerala 521162 555844 502675 453763 438365 396129 437994
12 Madhya Pradesh 703748 722942 791346 816546 861699 902552 991066
13 Maharashtra 1082293 1158482 1193771 1223923 1317567 1397218 1567754
14 Manipur 28876 26740 26612 30167 31641 34488 35528
15 Meghalaya 29305 32224 34248 37399 38350 39318 38727
16 Mizoram 14702 11229 12040 13467 13693 13781 13950
17 Nagaland 19332 26313 22399 37677 36931 45742 46638
18 Orissa 176643 191576 218841 223623 237307 297528 323190
19 Punjab 996475 1067337 1125475 1164310 1218969 1316633 1353222
20 Rajasthan 1098714 1156377 1215896 1278119 1316816 1484409 1740528
21 Sikkim 4318 4633 5183 6316 6973 7008 7074
22 Tamil Nadu 696505 748411 780185 738655 748109 874530 927616
23 Tripura 24448 25386 26802 27934 29130 33961 35263
24 Uttar Pradesh 1784787 1949215 2056278 2186717 2416521 2514694 2768943
25 West Bengal 886929 922383 972094 1031913 1096776 1294470 1160770
26 A & N Islands 8551 8822 8952 11025 11202 12032 10264
27 Dadra & Nagar Haveli 1425 2513 2612 2703 2675 2322 1357
28 Daman & Diu 2233 1114 1120 1163 1167 546 555
29 Delhi 61729 68814 66709 70339 72027 74088 75078
30 Lakshadweep 826 1014 907 868 1071 638 1241
31 Puducherry 7304 7355 7642 8555 9416 9934 14111
32 Chandigarh 6431 6710 6965 7115 8258 8570 8966
33 Jharkhand 179376 161594 174619 182521 187724 219995 221314
34 Chattisgarh 310571 383560 355509 355363 367510 515402 536162
35 Uttarakhand 115953 128198 137394 140915 165006 169946 170712
Total 12956421 13905693 14718036 15412874 16297008 18023086 19117787
( At Current Prices )
Total Value of Output -Livestock
Statement 62-68 : Statewise Value of Output From Livestock
Page 159

Central Statistical OrganisationNational Accounts Division
(Rs. lakhs)
1999-00 2000-01 2001-02 2002-03 2003-04 2004-05 2005-06 State/U.Ts1166659 1243567 1380653 1530117 1635407 1642800 1708888 1 Andhra Pradesh
11304 11587 12361 13690 14161 16135 11735 2 Arunachal Pradesh
168755 174371 177834 184316 192619 201485 210595 3 Assam
595450 621043 667726 716127 772997 1035473 1105035 4 Bihar
8624 9274 9226 9374 9624 9113 12419 5 Goa
573832 579326 634046 660495 691870 804504 834277 6 Gujarat
660037 694823 712786 744170 761902 753320 772498 7 Haryana
121301 126489 128762 134501 141075 156618 163612 8 Himachal Pradesh
204229 214201 221002 265716 273216 286453 286839 9 Jammu & Kashmir
683594 697277 753236 700456 618806 641537 656092 10 Karnataka
521162 519663 522710 475706 417461 451764 437950 11 Kerala
703748 696259 756402 766642 776459 787106 893687 12 Madhya Pradesh
1082293 1105327 1155503 1174181 1201097 1227821 1317043 13 Maharashtra
28876 25634 25669 21719 22769 27526 27064 14 Manipur
29305 30667 31160 32305 33071 33887 34298 15 Meghalaya
14702 10461 10628 10625 11123 11040 11052 16 Mizoram
19332 25932 21689 36102 34966 43599 44501 17 Nagaland
176643 184990 208141 205741 213008 257115 267817 18 Orissa
996475 1015833 1032318 1066470 1085147 1128799 1158872 19 Punjab
1098714 1129128 1170865 1185344 1230211 1112197 1160927 20 Rajasthan
4318 4368 4721 5602 6028 7244 7396 21 Sikkim
696505 746380 760221 720622 722278 790189 835418 22 Tamil Nadu
24448 24689 25573 25305 26397 27701 29129 23 Tripura
1784787 1866307 1977270 2065475 2175655 2200463 2314013 24 Uttar Pradesh
886929 894814 907246 920694 942712 969615 987991 25 West Bengal
8551 8736 9050 9563 9869 9516 8069 26 A & N Islands
1425 2353 2438 2456 2431 2174 1329 27 Dadra & Nagar Haveli
2233 1062 1068 1093 1097 513 521 28 Daman & Diu
61729 61080 61313 61273 61612 62681 63436 29 Delhi
826 1015 894 1011 1234 827 1457 30 Lakshadweep
7304 7179 7372 7588 7887 8327 11603 31 Puducherry
6431 6371 6438 6636 7320 7322 7646 32 Chandigarh
179376 153224 157057 159591 164051 179167 180145 33 Jharkhand
310571 353666 304424 314156 322984 385426 397674 34 Chattisgarh
115953 122550 128159 130081 144214 145050 146492 35 Uttarakhand
12956421 13369649 13985960 14364943 14732760 15424506 16107516 Total
Total Value of Output -Livestock
Statement 62-68 : Statewise Value of Output From Livestock
( At 1999-00 Prices)
Page 160

Central Statistical OrganisationNational Accounts Division
(Rs. lakhs)
State/U.Ts 1999-00 2000-01 2001-02 2002-03 2003-04 2004-05 2005-061 Andhra Pradesh 9781 11010 4395 4870 6536 7736 83862 Arunachal Pradesh 2163 65 707 706 666 957 8533 Assam 977 1007 1043 1078 1136 432 4694 Bihar 3192 3716 534 396 268 562 7365 Goa 397 117 510 723 532 993 10226 Gujarat 1914 2795 3058 3229 3002 4208 44997 Haryana 2428 2459 2964 3049 2455 2649 28628 Himachal Pradesh 14585 20086 25279 30656 32901 40263 472109 Jammu & Kashmir 15865 9519 17025 18048 11299 5659 613410 Karnataka 26377 27037 36408 25299 27818 41748 4525511 Kerala 20098 13806 16305 23250 23250 16273 1764012 Madhya Pradesh 12711 24172 57199 39709 33045 28953 3138513 Maharashtra 8242 8545 6790 8617 9072 7561 802514 Manipur 8 67 181 16 72 156 16915 Meghalaya 329 381 705 570 290 92 10016 Mizoram 30 17 110 371 96 251 27217 Nagaland 597 635 544 642 573 490 53118 Orissa 3083 3094 896 1407 1162 1531 166019 Punjab 1964 3531 1728 2258 1739 1438 155820 Rajasthan 422 872 1332 1380 1503 1643 125621 Sikkim 1 7 30 24 24 9 1122 Tamil Nadu 7510 8925 6589 14415 3753 9093 940923 Tripura 21 38 119 201 152 100 10824 Uttar Pradesh 5245 7860 8631 6008 6807 7002 773425 West Bengal 12632 8172 12434 9368 11895 10396 786726 A & N Islands 3732 3081 348 0 0 223 24227 Dadra & Nagar Haveli 0 0 0 0 0 0 028 Daman & Diu 0 0 0 0 0 0 029 Delhi 0 0 3 3 3 0 030 Lakshadweep 0 0 0 0 0 0 031 Puducherry 0 0 0 21 21 0 032 Chandigarh 0 0 0 0 0 0 033 Jharkhand 5106 4584 5076 5317 5317 5326 577434 Chattisgarh 10082 11322 21844 17488 25122 22115 1763035 Uttarakhand 12284 9208 11814 10937 12202 11387 17967
Total 181778 186125 244602 230055 222711 229247 246763
Statement 69 : Statewise Value of Output From Forestry
( At Current Prices )
Industrial Wood
Page 161

Central Statistical OrganisationNational Accounts Division
(Rs. lakhs)
1999-00 2000-01 2001-02 2002-03 2003-04 2004-05 2005-06 State/U.Ts
9781 11063 2727 4437 4912 5275 5275 1 Andhra Pradesh
2163 65 707 707 663 953 853 2 Arunachal Pradesh
977 1005 1042 1059 1133 180 180 3 Assam
3192 3716 560 409 260 517 620 4 Bihar
397 539 719 869 749 922 919 5 Goa
1914 2440 2440 2694 2275 3061 2949 6 Gujarat
2428 2225 2662 2649 2015 2035 2022 7 Haryana
14585 16031 17358 17078 17377 19701 19474 8 Himachal Pradesh
15865 15865 14472 17094 1070 597 597 9 Jammu & Kashmir
26377 26487 26487 26489 7002 28048 28048 10 Karnataka
20098 17554 18775 20642 20642 43610 43610 11 Kerala
12711 23311 53865 36195 29448 25647 25647 12 Madhya Pradesh
8242 7954 10919 9451 9481 7041 9835 13 Maharashtra
8 72 201 17 76 168 168 14 Manipur
329 1209 27296 22598 2111 882 882 15 Meghalaya
30 16 103 348 90 251 251 16 Mizoram
597 599 505 575 142 484 484 17 Nagaland
3083 3009 930 1315 992 1255 1255 18 Orissa
1964 2362 1710 1710 1636 1193 1193 19 Punjab
422 873 893 1089 1005 837 940 20 Rajasthan
1 0 131 131 0 0 0 21 Sikkim
7510 59 6738 6738 159 1069 1028 22 Tamil Nadu
21 24 80 167 80 73 73 23 Tripura
5245 8592 7547 5534 6759 6311 6310 24 Uttar Pradesh
12632 7684 12807 8921 11378 9923 9923 25 West Bengal
3732 3732 369 0 0 222 222 26 A & N Islands
0 0 0 0 0 0 0 27 Dadra & Nagar Haveli
0 0 0 0 0 0 0 28 Daman & Diu
0 0 0 0 0 0 0 29 Delhi
0 0 0 0 0 0 0 30 Lakshadweep
0 0 0 0 0 0 0 31 Puducherry
0 0 0 0 0 0 0 32 Chandigarh
5106 4580 4584 4593 4584 4580 4580 33 Jharkhand
10082 10747 20267 15788 21597 18914 14967 34 Chattisgarh
12284 8604 10877 10309 9984 8190 8190 35 Uttarakhand
181778 180415 247769 219608 157618 191938 190495 Total
Statement 69 : Statewise Value of Output From Forestry
( At 1999-00 Prices)
Industrial Wood
Page 162

Central Statistical OrganisationNational Accounts Division
(Rs. lakhs)
State/U.Ts 1999-00 2000-01 2001-02 2002-03 2003-04 2004-05 2005-061 Andhra Pradesh 135871 140425 150175 153531 159565 161322 1691242 Arunachal Pradesh 4327 4455 4291 4316 3883 3778 36813 Assam 46769 45259 53436 54300 55122 57368 604884 Bihar 97677 108055 119231 127299 137753 143889 1558925 Goa 647 635 616 743 710 710 6996 Gujarat 38534 45243 73305 62904 69509 75324 808897 Haryana 10337 9615 9593 9780 9393 14243 143148 Himachal Pradesh 23260 25150 26503 28704 27876 28190 287069 Jammu & Kashmir 31496 33025 33381 36699 38660 39459 4216610 Karnataka 146430 155374 159924 163067 172065 182923 19276811 Kerala 115670 124972 134612 120511 133939 124533 13262112 Madhya Pradesh 91839 96304 87319 85211 105502 89791 8967613 Maharashtra 102516 137840 158352 170689 184800 206283 22908814 Manipur 5388 5085 4986 3433 3552 5521 591715 Meghalaya 3457 3774 3985 4247 4648 4672 492316 Mizoram 2305 2632 3104 3663 4200 4672 543817 Nagaland 12619 14248 15668 16864 18821 18719 2057318 Orissa 101537 108774 113279 97505 143222 134881 14480619 Punjab 21942 15363 21414 19407 19054 31002 3167220 Rajasthan 134099 147040 143513 185836 203028 215405 24034121 Sikkim 1215 1285 1353 1444 1478 1519 158022 Tamil Nadu 70587 59891 48452 62089 62774 66437 10065923 Tripura 7122 7237 7345 8185 8659 9165 982624 Uttar Pradesh 199731 233928 240370 248601 254932 281002 37398725 West Bengal 103145 120620 117000 130819 135032 150778 17092626 A & N Islands 850 548 820 821 879 879 92127 Dadra & Nagar Haveli 1416 1412 1457 1422 1454 567 64528 Daman & Diu 116 118 162 167 178 169 16929 Delhi 349 388 446 470 524 1856 210330 Lakshadweep 104 115 135 147 161 163 16431 Puducherry 1269 1367 1531 1536 1677 1615 170932 Chandigarh 170 163 162 169 168 184 19933 Jharkhand 41147 60733 58849 61292 60964 63686 6439134 Chattisgarh 34659 33258 75969 35108 38374 44186 4430635 Uttarakhand 15150 15392 15913 19342 19436 21432 23439
Total 1603752 1759723 1886651 1920321 2081991 2186323 2448806
( At Current Prices )
Fuel Wood
Statement 70 : Statewise Value of Output From Forestry
Page 163

Central Statistical OrganisationNational Accounts Division
(Rs. lakhs)
1999-00 2000-01 2001-02 2002-03 2003-04 2004-05 2005-06 State/U.Ts
135871 135434 135941 136947 136324 136785 136881 1 Andhra Pradesh
4327 4073 3827 3555 3311 3083 2869 2 Arunachal Pradesh
46769 47175 47479 47932 48362 48814 49142 3 Assam
97677 103111 108788 113229 118164 123484 128847 4 Bihar
647 625 606 577 551 551 542 5 Goa
38534 39673 40826 42196 43917 44210 45072 6 Gujarat
10337 10213 9633 9965 9920 9205 9350 7 Haryana
23260 22634 22016 22020 20721 20095 19486 8 Himachal Pradesh
31496 38537 33381 33890 34594 35310 36038 9 Jammu & Kashmir
146430 164959 149218 151342 153361 153768 154835 10 Karnataka
115670 119408 123146 126979 126996 118121 120144 11 Kerala
91839 92976 83987 80338 89151 73272 69931 12 Madhya Pradesh
102516 103824 105912 107419 108652 109199 109764 13 Maharashtra
5388 5467 5538 3733 3819 5935 6075 14 Manipur
3457 3518 3580 3579 3599 3621 3642 15 Meghalaya
2305 2632 3029 3301 3667 4079 4534 16 Mizoram
12619 13757 14989 15361 16103 16905 17740 17 Nagaland
101537 104347 107212 110272 113450 116101 119033 18 Orissa
21942 21631 20142 21135 20763 20060 19344 19 Punjab
134099 143890 154171 164024 174618 185325 196771 20 Rajasthan
1215 1224 1228 1210 1200 1190 1179 21 Sikkim
70587 72755 67102 73066 73339 71246 71835 22 Tamil Nadu
7122 7236 7349 7558 7746 7945 8135 23 Tripura
199731 209050 215120 222763 228294 235699 242713 24 Uttar Pradesh
103145 111702 119872 130444 141347 153750 165906 25 West Bengal
850 831 808 808 816 817 817 26 A & N Islands
1416 1380 1353 1284 1273 506 549 27 Dadra & Nagar Haveli
116 118 119 120 123 169 169 28 Daman & Diu
349 386 421 433 467 582 630 29 Delhi
104 115 128 135 144 452 436 30 Lakshadweep
1269 199 1453 1555 1677 593 599 31 Puducherry
170 163 154 156 151 274 283 32 Chandigarh
41147 39850 38643 37002 35577 34189 33013 33 Jharkhand
34659 33237 31807 30802 29710 28627 27550 34 Chattisgarh
15150 14822 14618 14057 13542 13079 12648 35 Uttarakhand
1603752 1670956 1673594 1719184 1765447 1777040 1816504 Total
( At 1999-00 Prices)
Fuel Wood
Statement 70 : Statewise Value of Output From Forestry
Page 164

Central Statistical OrganisationNational Accounts Division
(Rs. lakhs)
State/U.Ts 1999-00 2000-01 2001-02 2002-03 2003-04 2004-05 2005-061 Andhra Pradesh 18378 17431 9109 10632 7698 9217 92172 Arunachal Pradesh 1300 4670 2780 2370 1160 127 1273 Assam 606 624 646 668 704 750 7504 Bihar 467 395 696 335 236 235 1585 Goa 2 3 52 20 32 44 506 Gujarat 1827 636 646 543 936 550 10967 Haryana 475 290 393 473 549 626 5738 Himachal Pradesh 7856 7961 8395 11122 11143 6091 60929 Jammu & Kashmir 1909 2945 2384 1943 2152 1061 106110 Karnataka 2837 2093 1858 1704 2783 5941 594111 Kerala 173 208 214 192 379 314 31412 Madhya Pradesh 30599 32423 24673 25778 27971 38575 3857513 Maharashtra 73419 62336 74196 62154 53928 42354 4266114 Manipur 445 616 380 355 660 375 37515 Meghalaya 569 716 909 1166 2310 2818 281816 Mizoram 433 454 384 453 461 525 52517 Nagaland 11 18 23 9 10 22 2218 Orissa 18065 19009 18476 19567 16860 12516 1251619 Punjab 439 464 381 466 475 417 41720 Rajasthan 1510 1693 1490 1121 1046 791 48921 Sikkim 123 134 199 216 229 220 23622 Tamil Nadu 3146 1977 2312 2421 3457 4555 64023 Tripura 145 96 119 132 251 121 12124 Uttar Pradesh 6387 5631 4347 4172 3750 335 34225 West Bengal 1051 1140 784 695 453 410 41026 A & N Islands 12 16 9 4 4 20 1627 Dadra & Nagar Haveli 0 0 0 0 0 0 028 Daman & Diu 5 0 0 1 1 0 029 Delhi 0 0 0 0 0 0 030 Lakshadweep 0 0 0 0 0 0 031 Puducherry 0 0 0 0 0 0 032 Chandigarh 0 0 0 0 0 1 133 Jharkhand 5062 5125 5675 5975 6444 9047 904734 Chattisgarh 16194 19650 22220 24503 22904 18481 1838835 Uttarakhand 11639 9567 8664 9121 12274 22435 22435
Total 205084 198321 192414 188310 181259 178974 175413
Statement 71 : Statewise Value of Output From Forestry
( At Current Prices )
Minor Forest Products
Page 165

Central Statistical OrganisationNational Accounts Division
(Rs. lakhs)
1999-00 2000-01 2001-02 2002-03 2003-04 2004-05 2005-06 State/U.Ts
18378 16956 8792 10292 7381 8897 9184 1 Andhra Pradesh
1300 4543 2683 2294 1112 123 127 2 Arunachal Pradesh
606 607 624 647 675 724 747 3 Assam
467 384 672 324 226 227 157 4 Bihar
2 3 50 19 31 42 50 5 Goa
1827 619 624 526 897 531 1092 6 Gujarat
475 282 379 458 526 604 571 7 Haryana
7856 7744 8103 10767 10684 5879 6070 8 Himachal Pradesh
1909 2865 2302 1881 2063 1024 1057 9 Jammu & Kashmir
2837 2036 1793 1650 2668 5735 5920 10 Karnataka
173 202 207 186 363 303 313 11 Kerala
30599 31540 23816 24955 26818 37235 38436 12 Madhya Pradesh
73419 60638 71618 60168 51705 40882 42507 13 Maharashtra
445 599 367 344 633 362 374 14 Manipur
569 696 877 1129 2215 2720 2808 15 Meghalaya
433 442 371 439 442 507 523 16 Mizoram
11 18 22 9 9 21 22 17 Nagaland
18065 18491 17834 18942 16165 12081 12471 18 Orissa
439 451 368 451 455 403 415 19 Punjab
1510 1647 1438 1085 1003 764 487 20 Rajasthan
123 130 193 209 219 212 235 21 Sikkim
3146 1923 2232 2344 3314 4397 638 22 Tamil Nadu
145 93 115 128 240 117 121 23 Tripura
6387 5478 4196 4039 3595 323 341 24 Uttar Pradesh
1051 1109 757 673 434 396 409 25 West Bengal
12 16 9 4 4 19 16 26 A & N Islands
0 0 0 0 0 0 0 27 Dadra & Nagar Haveli
5 0 0 1 1 0 0 28 Daman & Diu
0 0 0 0 0 0 0 29 Delhi
0 0 0 0 0 0 0 30 Lakshadweep
0 0 0 0 0 0 0 31 Puducherry
0 0 0 0 0 1 1 32 Chandigarh
5062 4985 5478 5784 6179 8733 9014 33 Jharkhand
16194 19115 21448 23720 21960 17839 18322 34 Chattisgarh
11639 9306 8363 8830 11768 21655 22354 35 Uttarakhand
205084 192919 185728 182295 173786 172755 174781 Total
Minor Forest Products
Statement 71 : Statewise Value of Output From Forestry
( At 1999-00 Prices)
Page 166

Central Statistical OrganisationNational Accounts Division
(Rs. lakhs)
State/U.Ts 1999-00 2000-01 2001-02 2002-03 2003-04 2004-05 2005-061 Andhra Pradesh 164030 168866 163678 169032 173799 178275 186727
2 Arunachal Pradesh 7791 9190 7777 7392 5709 4862 4660
3 Assam 48351 46889 55125 56046 56963 58551 61707
4 Bihar 101337 112166 120460 128030 138257 144686 156786
5 Goa 1046 755 1178 1486 1274 1747 1771
6 Gujarat 42275 48674 77009 66675 73447 80082 86484
7 Haryana 13240 12364 12950 13302 12397 17518 17749
8 Himachal Pradesh 45700 53197 60177 70482 71920 74544 82008
9 Jammu & Kashmir 49269 45489 52790 56690 52111 46179 49361
10 Karnataka 175644 184504 198190 190069 202666 230612 243964
11 Kerala 135941 138986 151131 143953 157568 141120 150575
12 Madhya Pradesh 135149 152900 169191 150698 166518 157319 159636
13 Maharashtra 184177 208721 239339 241460 247799 256198 279774
14 Manipur 5841 5767 5548 3804 4284 6052 6461
15 Meghalaya 4355 4870 5599 5982 7248 7583 7841
16 Mizoram 2768 3103 3598 4487 4757 5448 6235
17 Nagaland 13228 14901 16235 17516 19404 19231 21126
18 Orissa 122685 130877 132651 118479 161244 148928 158982
19 Punjab 24345 19358 23523 22132 21268 32857 33648
20 Rajasthan 136032 149605 146336 188338 205576 217839 242087
21 Sikkim 1339 1426 1582 1684 1731 1748 1826
22 Tamil Nadu 81243 70793 57353 78925 69984 80084 110708
23 Tripura 7288 7371 7583 8517 9062 9385 10055
24 Uttar Pradesh 211363 247418 253348 258781 265489 288338 382063
25 West Bengal 116828 129932 130218 140881 147380 161584 179203
26 A & N Islands 4594 3645 1177 825 883 1122 1179
27 Dadra & Nagar Haveli 1416 1412 1457 1422 1454 567 645
28 Daman & Diu 121 118 162 168 178 169 169
29 Delhi 349 388 449 473 528 1856 2103
30 Lakshadweep 104 115 135 147 161 163 164
31 Puducherry 1269 1367 1531 1557 1698 1615 1709
32 Chandigarh 170 163 162 169 168 185 200
33 Jharkhand 51315 70442 69600 72584 72726 78059 79212
34 Chattisgarh 60935 64231 120034 77099 86400 84782 80323
35 Uttarakhand 39073 34167 36391 39401 43912 55254 63841
Total 1990614 2144169 2323667 2338686 2485962 2594544 2870982
( At Current Prices )
Total Value of Output -Forestry
Statement 69-71 : Statewise Value of Output From Forestry
Page 167

Central Statistical OrganisationNational Accounts Division
(Rs. lakhs)
1999-00 2000-01 2001-02 2002-03 2003-04 2004-05 2005-06 State/U.Ts164030 163453 147460 151676 148616 150957 151340 1 Andhra Pradesh
7791 8681 7217 6556 5087 4159 3848 2 Arunachal Pradesh
48351 48787 49145 49638 50171 49717 50069 3 Assam
101337 107211 110020 113962 118650 124228 129625 4 Bihar
1046 1167 1376 1465 1331 1515 1511 5 Goa
42275 42731 43890 45416 47090 47802 49113 6 Gujarat
13240 12720 12674 13072 12461 11845 11943 7 Haryana
45700 46410 47478 49864 48782 45675 45030 8 Himachal Pradesh
49269 57267 50154 52865 37728 36931 37692 9 Jammu & Kashmir
175644 193482 177498 179481 163031 187551 188803 10 Karnataka
135941 137165 142127 147806 148001 162034 164067 11 Kerala
135149 147827 161667 141487 145416 136153 134014 12 Madhya Pradesh
184177 172417 188449 177038 169838 157122 162106 13 Maharashtra
5841 6138 6106 4094 4528 6465 6617 14 Manipur
4355 5423 31753 27306 7925 7223 7332 15 Meghalaya
2768 3090 3503 4088 4199 4837 5308 16 Mizoram
13228 14373 15516 15944 16254 17411 18246 17 Nagaland
122685 125848 125976 130529 130607 129437 132758 18 Orissa
24345 24444 22220 23296 22854 21656 20952 19 Punjab
136032 146410 156502 166198 176626 186925 198199 20 Rajasthan
1339 1355 1551 1550 1419 1402 1414 21 Sikkim
81243 74737 76071 82147 76813 76712 73501 22 Tamil Nadu
7288 7354 7544 7853 8066 8135 8329 23 Tripura
211363 223120 226863 232336 238648 242333 249364 24 Uttar Pradesh
116828 120495 133435 140038 153159 164068 176238 25 West Bengal
4594 4579 1185 812 820 1058 1055 26 A & N Islands
1416 1380 1353 1284 1273 506 549 27 Dadra & Nagar Haveli
121 118 119 121 124 169 169 28 Daman & Diu
349 386 421 433 467 582 630 29 Delhi
104 115 128 135 144 452 436 30 Lakshadweep
1269 199 1453 1555 1677 593 599 31 Puducherry
170 163 154 156 151 275 284 32 Chandigarh
51315 49415 48704 47379 46339 47501 46607 33 Jharkhand
60935 63099 73522 70311 73267 65379 60839 34 Chattisgarh
39073 32732 33857 33196 35293 42924 43192 35 Uttarakhand
1990614 2044290 2107091 2121087 2096851 2141733 2181781 Total
Statement 69-71 : Statewise Value of Output From Forestry
( At 1999-00 Prices)
Total Value of Output -Forestry
Page 168

Central Statistical OrganisationNational Accounts Division
(Rs. lakhs)
State/U.Ts 1999-00 2000-01 2001-02 2002-03 2003-04 2004-05 2005-061 Andhra Pradesh 129795 165980 197210 244161 274003 264513 3836982 Arunachal Pradesh 1617 1688 1901 1901 1938 2276 26473 Assam 63694 63853 65893 74554 97582 87709 1169364 Bihar 76279 92227 113351 123405 130381 124449 1279115 Goa 1514 1829 1677 2431 2488 2763 30936 Gujarat 22465 11888 16189 14048 18099 18557 305597 Haryana 7500 8260 8643 9154 10999 12683 144738 Himachal Pradesh 3421 3433 3592 3622 3349 3975 51529 Jammu & Kashmir 12961 12796 13735 14642 17346 17345 1734510 Karnataka 39894 36553 38177 33663 21138 24280 4471711 Kerala 18719 24381 26288 17018 17533 23198 3627312 Madhya Pradesh 20700 22575 22984 19852 24072 30594 3700313 Maharashtra 44552 41917 39066 43267 52081 61347 7148914 Manipur 6644 8947 8704 8882 9475 10782 1359915 Meghalaya 2456 3485 3081 3677 3645 3959 372916 Mizoram 1789 1957 2842 2928 3326 3319 414117 Nagaland 2531 2834 2691 2873 2880 2585 356618 Orissa 35189 41986 56148 78070 70045 66321 9384219 Punjab 18576 20475 22838 26860 32938 30594 3372120 Rajasthan 6142 6072 7476 7096 7742 9427 1072721 Sikkim 71 75 78 81 83 86 9422 Tamil Nadu 33532 31243 36768 37412 29308 33429 8027423 Tripura 17944 19809 20068 12452 9799 13887 2330024 Uttar Pradesh 66944 74116 82102 91295 102753 107773 11645925 West Bengal 368346 422273 443263 473057 546753 544590 73410726 A & N Islands 43 53 51 48 56 66 3627 Dadra & Nagar Haveli 16 28 28 39 35 42 5228 Daman & Diu 0 0 0 0 0 0 029 Delhi 2398 2207 1856 1342 1232 836 46030 Lakshadweep 0 0 0 0 0 0 031 Puducherry 732 757 860 866 928 1021 48632 Chandigarh 15 45 22 54 48 54 7133 Jharkhand 38009 20511 48628 26200 39682 33921 1542234 Chattisgarh 31771 39071 42741 46107 51879 57653 6507235 Uttarakhand 791 802 812 861 865 1010 1256
Total 1077050 1184126 1329762 1421918 1584481 1595045 2091711
Inland Fish
( At Current Prices )
Statement 72 : Statewise Value of Output From Fisheries
Page 169

Central Statistical OrganisationNational Accounts Division
(Rs. lakhs)
1999-00 2000-01 2001-02 2002-03 2003-04 2004-05 2005-06 State/U.Ts
129795 139149 162677 201225 227217 215513 256257 1 Andhra Pradesh
1617 1688 1755 1755 1789 1951 1856 2 Arunachal Pradesh
63694 62782 64202 70268 77534 69773 75282 3 Assam
76279 85941 107856 117098 119561 120018 125412 4 Bihar
1514 1696 1370 1523 1709 1777 1634 5 Goa
22465 11652 13732 11154 13754 15108 24166 6 Gujarat
7500 8260 8643 8795 9779 10513 12050 7 Haryana
3421 3433 3528 3543 3161 3385 3570 8 Himachal Pradesh
12961 12620 12852 12934 12988 12988 13057 9 Jammu & Kashmir
39894 40152 38177 27173 22061 25348 37989 10 Karnataka
18719 23865 26004 21833 22161 22299 29169 11 Kerala
20700 20371 19776 17572 21177 25862 25453 12 Madhya Pradesh
44552 40562 40405 41869 41173 39876 44490 13 Maharashtra
6644 7103 6768 6784 7242 7342 7553 14 Manipur
2456 3245 2610 2834 2722 2880 2164 15 Meghalaya
1789 1794 1953 2014 2286 2282 2317 16 Mizoram
2531 2784 2633 2784 2815 2481 2784 17 Nagaland
35189 37286 45236 53261 53724 49836 56412 18 Orissa
18576 20475 22838 26854 32938 30594 33721 19 Punjab
6142 5741 6759 6347 6774 8017 8763 20 Rajasthan
71 71 71 71 71 71 76 21 Sikkim
33532 31263 31819 28800 22142 24983 47360 22 Tamil Nadu
17944 18678 18362 11473 11489 11506 16132 23 Tripura
66944 70297 76062 84321 90089 93512 97733 24 Uttar Pradesh
368346 373095 390153 398871 419068 431039 472115 25 West Bengal
43 46 44 40 46 54 26 26 A & N Islands
16 24 24 27 27 35 36 27 Dadra & Nagar Haveli
0 0 0 0 0 0 0 28 Daman & Diu
2398 2220 1785 1255 1171 786 390 29 Delhi
0 0 0 0 0 0 0 30 Lakshadweep
732 757 853 854 905 965 374 31 Puducherry
15 39 19 38 38 40 43 32 Chandigarh
38009 19113 45314 19873 33820 33820 15375 33 Jharkhand
31771 38171 39001 40599 44612 48845 53596 34 Chattisgarh
791 825 836 886 891 891 969 35 Uttarakhand
1077050 1085198 1194117 1224728 1306934 1314390 1468324 Total
( At 1999-00 Prices)
Inland Fish
Statement 72 : Statewise Value of Output From Fisheries
Page 170

Central Statistical OrganisationNational Accounts Division
(Rs. lakhs)
State/U.Ts 1999-00 2000-01 2001-02 2002-03 2003-04 2004-05 2005-061 Andhra Pradesh 256822 341226 408559 503355 496905 482743 4688522 Arunachal Pradesh 0 0 0 0 0 0 03 Assam 0 0 0 0 0 0 04 Bihar 0 0 0 0 0 0 05 Goa 14305 23373 21416 21646 27527 28331 317396 Gujarat 145328 136579 162958 187527 161271 163097 2594767 Haryana 0 0 0 0 0 0 08 Himachal Pradesh 0 0 0 0 0 0 09 Jammu & Kashmir 0 0 0 0 0 0 010 Karnataka 28698 32087 25860 45925 49426 51268 5541311 Kerala 175029 171641 177934 169696 171750 208388 20451012 Madhya Pradesh 0 0 0 0 0 0 013 Maharashtra 67688 67483 83128 91375 102701 106261 11619814 Manipur 919 712 1760 1991 0 1973 209215 Meghalaya 0 0 0 0 0 0 016 Mizoram 0 0 0 0 0 0 017 Nagaland 0 0 0 0 0 0 018 Orissa 54785 66464 60503 63663 74624 63021 6159419 Punjab 0 0 0 0 0 0 020 Rajasthan 0 0 0 0 0 0 021 Sikkim 0 0 0 0 0 0 022 Tamil Nadu 185854 196865 205154 201024 210894 175336 17822723 Tripura 232 728 335 330 644 1046 110924 Uttar Pradesh 0 0 0 0 0 0 025 West Bengal 195123 269426 229566 264089 256764 318774 29417926 A & N Islands 9574 11305 11154 12129 12562 6915 466327 Dadra & Nagar Haveli 0 0 0 0 0 0 028 Daman & Diu 7355 7890 9206 7879 8389 7716 1195429 Delhi 0 0 0 0 0 0 030 Lakshadweep 2227 2389 2395 1689 1773 2746 291131 Puducherry 8295 9563 9573 10042 10331 8081 524832 Chandigarh 0 0 0 0 0 0 033 Jharkhand 0 0 0 0 0 0 034 Chattisgarh 0 0 0 0 0 0 035 Uttarakhand 0 0 0 0 0 0 0
Total 1152234 1337730 1409501 1582360 1585561 1625696 1698165
( At Current Prices )
Marine Fish
Statement 73 : Statewise Value of Output From Fisheries
Page 171

Central Statistical OrganisationNational Accounts Division
(Rs. lakhs)
1999-00 2000-01 2001-02 2002-03 2003-04 2004-05 2005-06 State/U.Ts
256822 288772 303532 363737 357221 329188 319800 1 Andhra Pradesh
0 0 0 0 0 0 0 2 Arunachal Pradesh
0 0 0 0 0 0 0 3 Assam
0 0 0 0 0 0 0 4 Bihar
14305 16313 15702 16534 23190 22749 24079 5 Goa
145328 134835 155431 175659 146752 139999 177853 6 Gujarat
0 0 0 0 0 0 0 7 Haryana
0 0 0 0 0 0 0 8 Himachal Pradesh
0 0 0 0 0 0 0 9 Jammu & Kashmir
28698 30681 24053 40655 39614 36278 37166 10 Karnataka
175029 170921 173685 176485 177355 176299 163707 11 Kerala
0 0 0 0 0 0 0 12 Madhya Pradesh
67688 66713 75043 73494 83436 79936 82180 13 Maharashtra
919 679 795 829 0 851 851 14 Manipur
0 0 0 0 0 0 0 15 Meghalaya
0 0 0 0 0 0 0 16 Mizoram
0 0 0 0 0 0 0 17 Nagaland
54785 56703 56594 57878 64992 58683 56115 18 Orissa
0 0 0 0 0 0 0 19 Punjab
0 0 0 0 0 0 0 20 Rajasthan
0 0 0 0 0 0 0 21 Sikkim
185854 191320 196046 194426 198647 161680 158933 22 Tamil Nadu
232 364 282 282 412 628 628 23 Tripura
0 0 0 0 0 0 0 24 Uttar Pradesh
195123 262839 214843 193612 205151 225248 203076 25 West Bengal
9574 9357 9238 10079 10378 5976 3889 26 A & N Islands
0 0 0 0 0 0 0 27 Dadra & Nagar Haveli
7355 7552 8473 7523 7523 6854 10003 28 Daman & Diu
0 0 0 0 0 0 0 29 Delhi
2227 2246 2250 1685 1685 2399 2399 30 Lakshadweep
8295 9258 9550 9284 9279 7081 4073 31 Puducherry
0 0 0 0 0 0 0 32 Chandigarh
0 0 0 0 0 0 0 33 Jharkhand
0 0 0 0 0 0 0 34 Chattisgarh
0 0 0 0 0 0 0 35 Uttarakhand
1152234 1248553 1245517 1322162 1325635 1253849 1244752 Total
Statement 73 : Statewise Value of Output From Fisheries
( At 1999-00 Prices)
Marine Fish
Page 172

Central Statistical OrganisationNational Accounts Division
(Rs. lakhs)
State/U.Ts 1999-00 2000-01 2001-02 2002-03 2003-04 2004-05 2005-061 Andhra Pradesh 386617 507206 605769 747516 770908 747256 8525502 Arunachal Pradesh 1617 1688 1901 1901 1938 2276 26473 Assam 63694 63853 65893 74554 97582 87709 1169364 Bihar 76279 92227 113351 123405 130381 124449 1279115 Goa 15819 25202 23093 24077 30015 31094 348326 Gujarat 167793 148467 179147 201575 179370 181654 2900357 Haryana 7500 8260 8643 9154 10999 12683 144738 Himachal Pradesh 3421 3433 3592 3622 3349 3975 51529 Jammu & Kashmir 12961 12796 13735 14642 17346 17345 1734510 Karnataka 68592 68640 64037 79588 70564 75548 10013011 Kerala 193748 196022 204222 186714 189283 231586 24078312 Madhya Pradesh 20700 22575 22984 19852 24072 30594 3700313 Maharashtra 112240 109400 122194 134642 154782 167608 18768714 Manipur 7563 9659 10464 10873 9475 12755 1569115 Meghalaya 2456 3485 3081 3677 3645 3959 372916 Mizoram 1789 1957 2842 2928 3326 3319 414117 Nagaland 2531 2834 2691 2873 2880 2585 356618 Orissa 89974 108450 116651 141733 144669 129342 15543619 Punjab 18576 20475 22838 26860 32938 30594 3372120 Rajasthan 6142 6072 7476 7096 7742 9427 1072721 Sikkim 71 75 78 81 83 86 9422 Tamil Nadu 219386 228108 241922 238436 240202 208765 25850123 Tripura 18176 20537 20403 12782 10443 14933 2440924 Uttar Pradesh 66944 74116 82102 91295 102753 107773 11645925 West Bengal 563469 691699 672829 737146 803517 863364 102828626 A & N Islands 9617 11358 11205 12177 12618 6981 469927 Dadra & Nagar Haveli 16 28 28 39 35 42 5228 Daman & Diu 7355 7890 9206 7879 8389 7716 1195429 Delhi 2398 2207 1856 1342 1232 836 46030 Lakshadweep 2227 2389 2395 1689 1773 2746 291131 Puducherry 9027 10320 10433 10908 11259 9102 573432 Chandigarh 15 45 22 54 48 54 7133 Jharkhand 38009 20511 48628 26200 39682 33921 1542234 Chattisgarh 31771 39071 42741 46107 51879 57653 6507235 Uttarakhand 791 802 812 861 865 1010 1256
Total 2229285 2521856 2739264 3004278 3170042 3220740 3789876
Statement 72-73 : Statewise Value of Output From Fisheries
( At Current Prices )
Total Value of Output -Fisheries
Page 173

Central Statistical OrganisationNational Accounts Division
(Rs. lakhs)
1999-00 2000-01 2001-02 2002-03 2003-04 2004-05 2005-06 State/U.Ts
386617 427921 466209 564962 584438 544701 576057 1 Andhra Pradesh
1617 1688 1755 1755 1789 1951 1856 2 Arunachal Pradesh
63694 62782 64202 70268 77534 69773 75282 3 Assam
76279 85941 107856 117098 119561 120018 125412 4 Bihar
15819 18009 17072 18057 24899 24526 25713 5 Goa
167793 146487 169163 186813 160506 155107 202019 6 Gujarat
7500 8260 8643 8795 9779 10513 12050 7 Haryana
3421 3433 3528 3543 3161 3385 3570 8 Himachal Pradesh
12961 12620 12852 12934 12988 12988 13057 9 Jammu & Kashmir
68592 70833 62230 67828 61675 61626 75155 10 Karnataka
193748 194786 199689 198318 199516 198598 192876 11 Kerala
20700 20371 19776 17572 21177 25862 25453 12 Madhya Pradesh
112240 107275 115448 115363 124609 119812 126670 13 Maharashtra
7563 7782 7563 7613 7242 8193 8404 14 Manipur
2456 3245 2610 2834 2722 2880 2164 15 Meghalaya
1789 1794 1953 2014 2286 2282 2317 16 Mizoram
2531 2784 2633 2784 2815 2481 2784 17 Nagaland
89974 93989 101830 111139 118716 108519 112527 18 Orissa
18576 20475 22838 26854 32938 30594 33721 19 Punjab
6142 5741 6759 6347 6774 8017 8763 20 Rajasthan
71 71 71 71 71 71 76 21 Sikkim
219386 222583 227865 223226 220789 186663 206293 22 Tamil Nadu
18176 19042 18644 11755 11901 12134 16760 23 Tripura
66944 70297 76062 84321 90089 93512 97733 24 Uttar Pradesh
563469 635934 604996 592483 624219 656287 675191 25 West Bengal
9617 9403 9282 10119 10424 6030 3915 26 A & N Islands
16 24 24 27 27 35 36 27 Dadra & Nagar Haveli
7355 7552 8473 7523 7523 6854 10003 28 Daman & Diu
2398 2220 1785 1255 1171 786 390 29 Delhi
2227 2246 2250 1685 1685 2399 2399 30 Lakshadweep
9027 10015 10403 10138 10184 8046 4447 31 Puducherry
15 39 19 38 38 40 43 32 Chandigarh
38009 19113 45314 19873 33820 33820 15375 33 Jharkhand
31771 38171 39001 40599 44612 48845 53596 34 Chattisgarh
791 825 836 886 891 891 969 35 Uttarakhand
2229285 2333751 2439634 2546890 2632569 2568239 2713076 Total
Statement 72-73 : Statewise Value of Output From Fisheries
( At 1999-00 Prices)
Total Value of Output -Fisheries
Page 174

Central Statistical OrganisationNational Accounts Division
(Rs. lakhs)
State/U.Ts 1999-00 2000-01 2001-02 2002-03 2003-04 2004-05 2005-061 Andhra Pradesh 4522537 5171171 5313371 5193180 6047891 6419206 70561252 Arunachal Pradesh 59239 71312 72382 79033 82990 80084 763013 Assam 1267477 1331833 1358352 1387183 1346472 1380456 15255734 Bihar 2189139 2668319 2707275 2867386 3235462 2853068 32968235 Goa 87342 81056 86158 88893 99654 108688 1676806 Gujarat 2455427 2237696 2795679 2832337 4107681 3886376 47930807 Haryana 2110856 2254871 2323146 2392070 2661329 2741511 28240058 Himachal Pradesh 394390 478988 523690 562043 628452 713009 7368679 Jammu & Kashmir 578844 596661 649853 778780 801184 857771 83905810 Karnataka 3826182 4023756 3659826 3440283 3210911 3736655 452673511 Kerala 2133351 1960155 1912352 2065462 2068086 2233399 251054012 Madhya Pradesh 3181717 2853125 3266178 3057644 4032301 3956567 420128313 Maharashtra 5747997 5334359 6347384 6215869 6746962 7219183 854129914 Manipur 99774 100920 106359 108832 132072 145135 14460915 Meghalaya 99598 115701 123109 140413 133209 141757 14049716 Mizoram 40508 40355 51354 49781 51035 52822 5737617 Nagaland 100049 148085 184397 185862 128759 142594 15796118 Orissa 1529009 1510436 1726989 1692405 2177766 2170274 233886519 Punjab 3274229 3449711 3616923 3626215 3828771 4081369 425718920 Rajasthan 3275337 3165249 3657903 3037930 4439632 4302545 464482021 Sikkim 23196 28129 30005 31016 33991 34788 5957822 Tamil Nadu 2875113 2991645 2982636 2554841 2589407 3107829 349507423 Tripura 168372 200492 252628 226642 229907 249081 25455024 Uttar Pradesh 7708489 7907603 8421549 8788595 9413721 9663542 1096370425 West Bengal 4992886 4984413 5394019 5409876 5937853 6234346 655139726 A & N Islands 35394 36955 37444 44402 41553 36562 3610327 Dadra & Nagar Haveli 7762 9490 9986 10172 9987 8863 801928 Daman & Diu 11272 10475 11972 10577 11156 9503 1351829 Delhi 106961 130930 127145 125018 128387 132822 13286330 Lakshadweep 4407 4765 5239 4916 5828 6370 714031 Puducherry 33041 35651 36475 38876 41540 39220 3991732 Chandigarh 9205 8184 8620 8970 10138 10004 1043133 Jharkhand 570107 551329 876994 758038 832797 894579 103285734 Chattisgarh 1074922 904704 1237806 1062356 1373404 1371002 159331735 Uttarakhand 464577 549814 490465 528454 586402 630357 624771
Total 55459534 55948337 60405665 59404353 67206689 69651336 77659926
Total Value of Output - Agriculture and Allied Activities
( At Current Prices )
Statement 1-73 : Statewise Value of Output From Agriculture and Allied Activities
Page 175

Central Statistical OrganisationNational Accounts Division
(Rs. lakhs)
1999-00 2000-01 2001-02 2002-03 2003-04 2004-05 2005-06 State/U.Ts
4522537 4952207 4946745 4640164 5302212 5451836 5832535 1 Andhra Pradesh
59239 66595 65613 68570 75665 65865 62844 2 Arunachal Pradesh
1267477 1297959 1310043 1352597 1253708 1185690 1213219 3 Assam
2189139 2668633 2613395 2644666 2786052 2647957 2853096 4 Bihar
87342 74779 79784 77586 88594 83098 103512 5 Goa
2455427 2190267 2721928 2539988 3495081 3405362 4037307 6 Gujarat
2110856 2183785 2205950 2184945 2361975 2398882 2372057 7 Haryana
394390 453361 456496 477652 531797 586963 584509 8 Himachal Pradesh
578844 587374 605705 660149 654010 715234 699439 9 Jammu & Kashmir
3826182 4185781 3855712 3472403 3040509 3498938 3872906 10 Karnataka
2133351 2148042 2152305 2182198 1982918 2135587 2426308 11 Kerala
3181717 2604744 2928516 2545076 3246781 3134940 3236614 12 Madhya Pradesh
5747997 5294755 6254294 6102774 6298522 6412054 7012262 13 Maharashtra
99774 100053 102268 93038 115819 125326 120801 14 Manipur
99598 99552 124906 132204 107550 106391 106185 15 Meghalaya
40508 37325 42180 38811 38547 40464 42878 16 Mizoram
100049 128829 168469 159382 105535 119412 130066 17 Nagaland
1529009 1514063 1761469 1447994 1759369 1798146 1860191 18 Orissa
3274229 3352290 3377226 3319675 3435082 3583906 3612049 19 Punjab
3275337 3163671 3817448 2723513 4456036 3738850 3745576 20 Rajasthan
23196 27251 28273 28858 29834 31358 56451 21 Sikkim
2875113 2959682 2916590 2363521 2301574 2693253 2854806 22 Tamil Nadu
168372 198673 237402 210099 212792 215193 213882 23 Tripura
7708489 7644067 7946246 7892299 8118367 7906621 8383992 24 Uttar Pradesh
4992886 4979289 5340967 5222107 5348950 5421254 5518530 25 West Bengal
35394 34800 32329 35976 34211 28780 27065 26 A & N Islands
7762 9070 8937 9168 8909 8058 7326 27 Dadra & Nagar Haveli
11272 10057 11129 10052 10116 8576 11504 28 Daman & Diu
106961 117196 115259 109602 109854 113170 102283 29 Delhi
4407 4623 5075 4611 5328 5944 6557 30 Lakshadweep
33041 32660 34849 34993 36616 32116 31946 31 Puducherry
9205 7586 7708 7853 8424 8415 8751 32 Chandigarh
570107 573502 581603 555836 636128 638590 639554 33 Jharkhand
1074922 858949 1119904 952782 1207145 1126221 1300851 34 Chattisgarh
464577 503583 424792 431229 478478 498287 481589 35 Uttarakhand
55459534 55065051 58401514 54732371 59682486 59970740 63569440 Total
Statement 1-73 : Statewise Value of Output From Agriculture and Allied Activities
( At 1999-00 Prices)
Total Value of Output - Agriculture and Allied Activities
Page 176