value of tb screening among foreign born persons: u.s ... of tb screening... · value of tb...
TRANSCRIPT
Value of TB Screening Among Foreign Born Persons: U.S. (California) Perspective
February 27, 2015
Pennan Barry, MD, MPH
Outline
• Foreign born / Immigration in California
• TB in California among foreign-born
• Current screening programs
• Gaps / Opportunities
• TB in longstanding foreign born residents
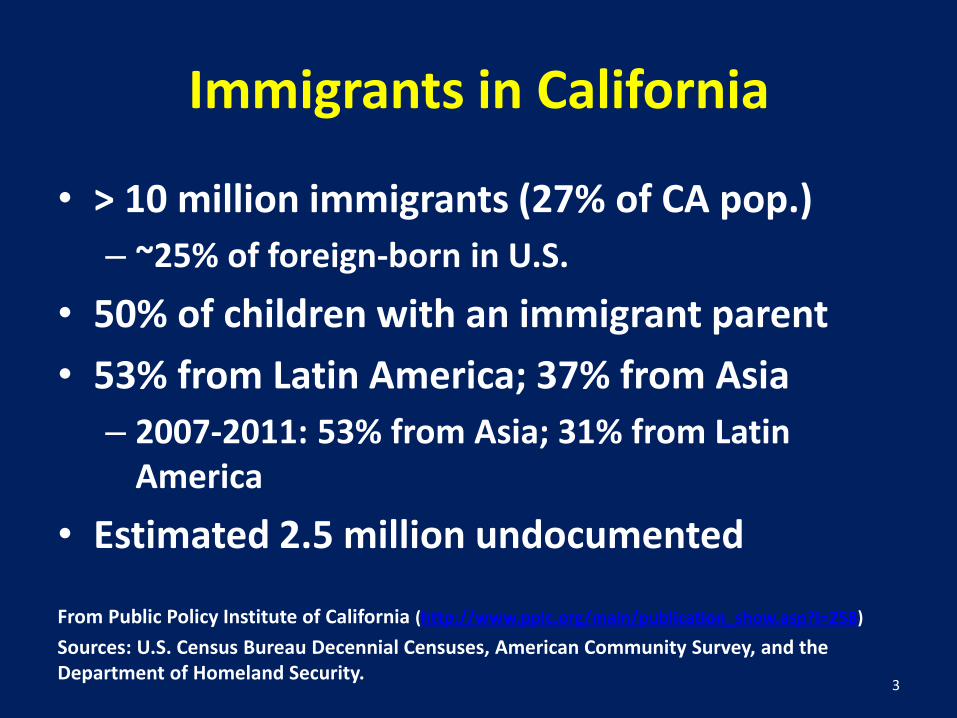
Immigrants in California
• > 10 million immigrants (27% of CA pop.)
– ~25% of foreign-born in U.S.
• 50% of children with an immigrant parent
• 53% from Latin America; 37% from Asia
– 2007-2011: 53% from Asia; 31% from Latin America
• Estimated 2.5 million undocumented
From Public Policy Institute of California (http://www.ppic.org/main/publication_show.asp?i=258)
Sources: U.S. Census Bureau Decennial Censuses, American Community Survey, and the Department of Homeland Security.
3
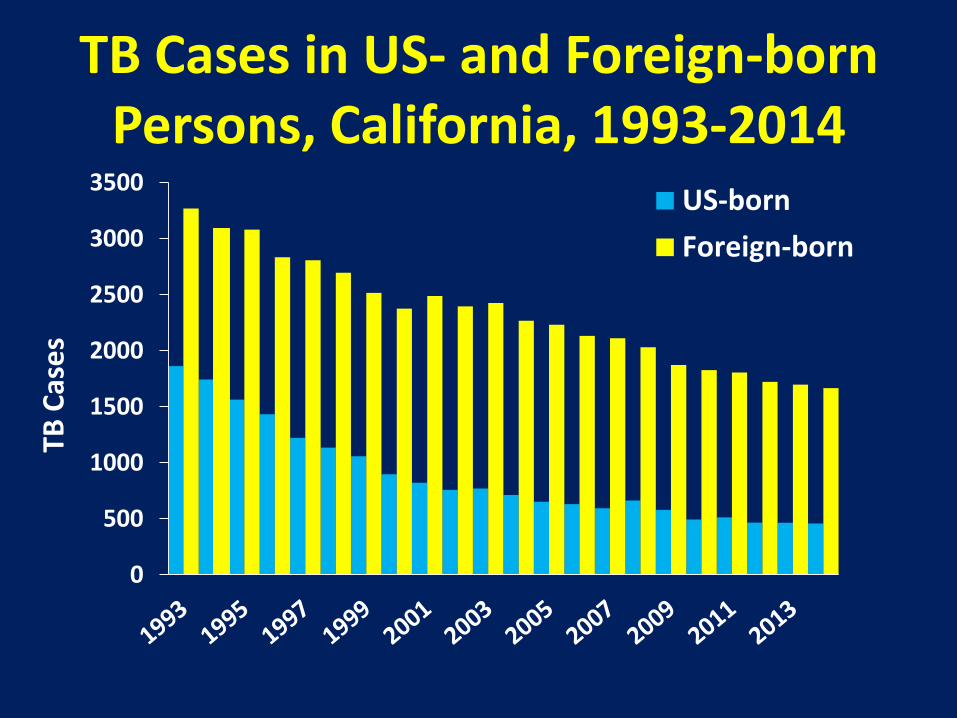
TB Cases in US- and Foreign-born Persons, California, 1993-2014
0
500
1000
1500
2000
2500
3000
3500
TB C
ase
s
US-born
Foreign-born
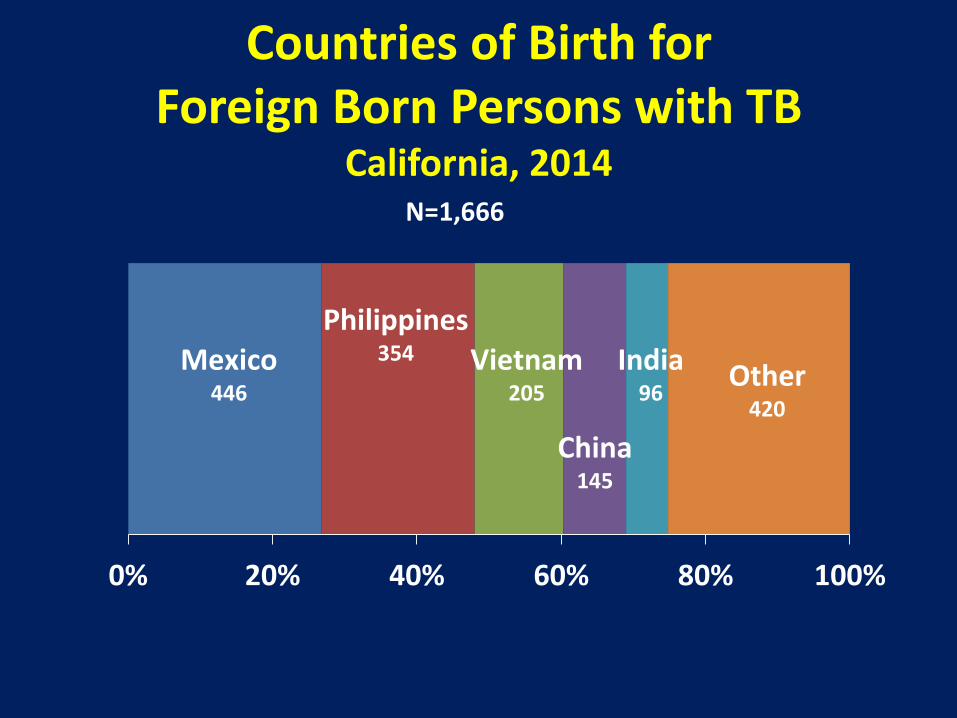
Countries of Birth for Foreign Born Persons with TB
California, 2014
0% 20% 40% 60% 80% 100%
N=1,666
Mexico 446
India 96
China 145
Vietnam 205
Philippines 354
Other 420
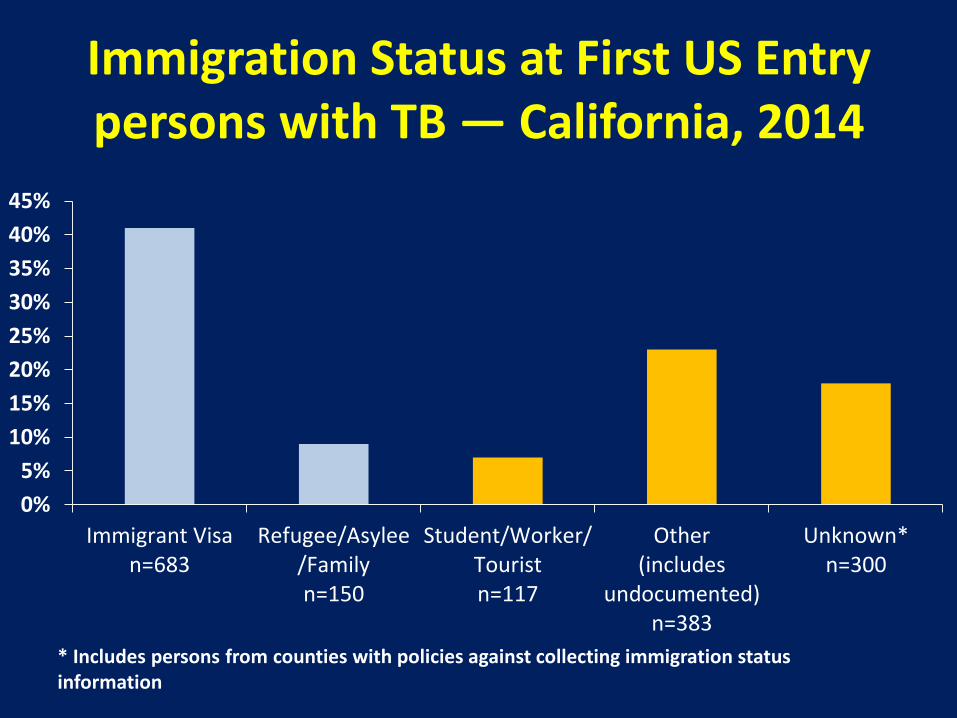
Immigration Status at First US Entry persons with TB ― California, 2014
* Includes persons from counties with policies against collecting immigration status information
0%
5%
10%
15%
20%
25%
30%
35%
40%
45%
Immigrant Visan=683
Refugee/Asylee/Familyn=150
Student/Worker/Touristn=117
Other(includes
undocumented)n=383
Unknown*n=300
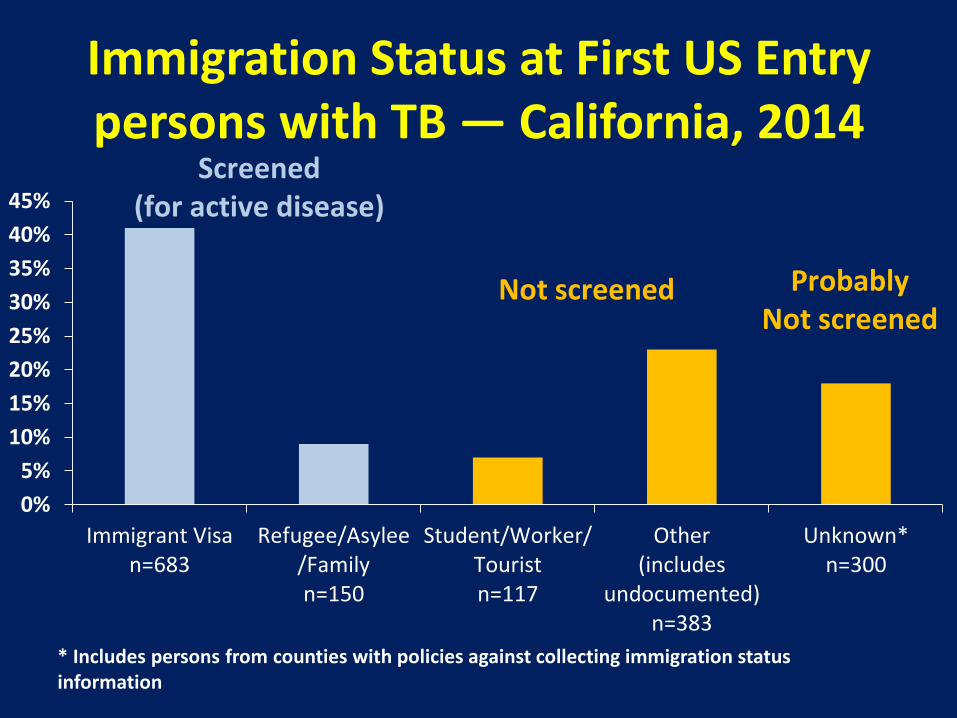
Not screened
Screened (for active disease)
Probably Not screened
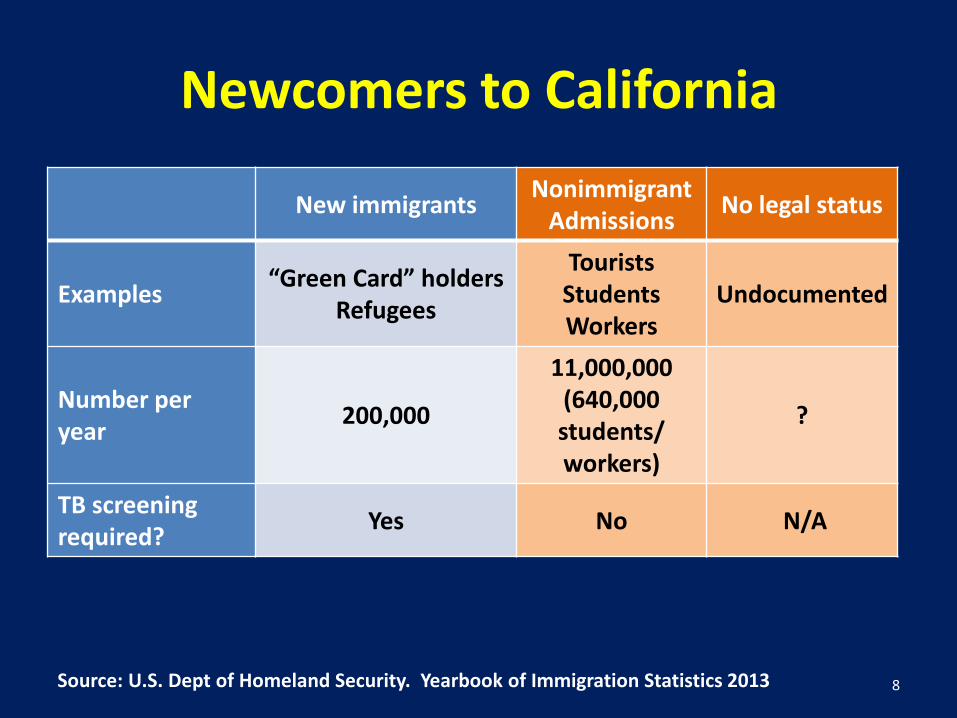
Newcomers to California
New immigrants Nonimmigrant
Admissions No legal status
Examples “Green Card” holders
Refugees
Tourists Students Workers
Undocumented
Number per year
200,000
11,000,000 (640,000 students/ workers)
?
TB screening required?
Yes No N/A
Source: U.S. Dept of Homeland Security. Yearbook of Immigration Statistics 2013 8
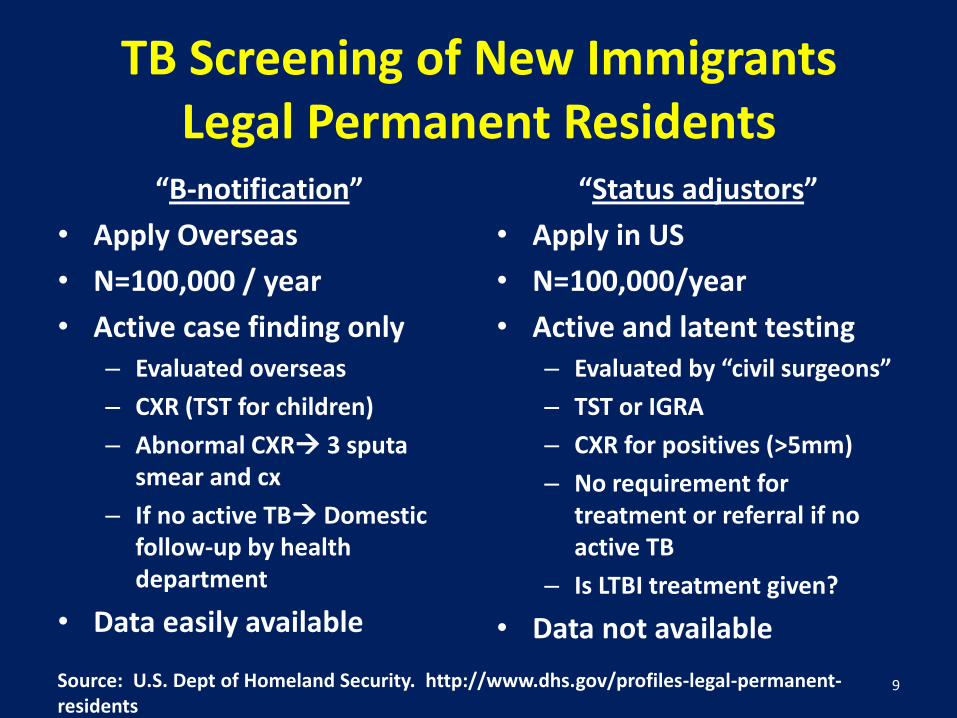
TB Screening of New Immigrants Legal Permanent Residents
“B-notification”
• Apply Overseas
• N=100,000 / year
• Active case finding only – Evaluated overseas
– CXR (TST for children)
– Abnormal CXR 3 sputa smear and cx
– If no active TB Domestic follow-up by health department
• Data easily available
“Status adjustors”
• Apply in US
• N=100,000/year
• Active and latent testing – Evaluated by “civil surgeons”
– TST or IGRA
– CXR for positives (>5mm)
– No requirement for treatment or referral if no active TB
– Is LTBI treatment given?
• Data not available
9 Source: U.S. Dept of Homeland Security. http://www.dhs.gov/profiles-legal-permanent-residents
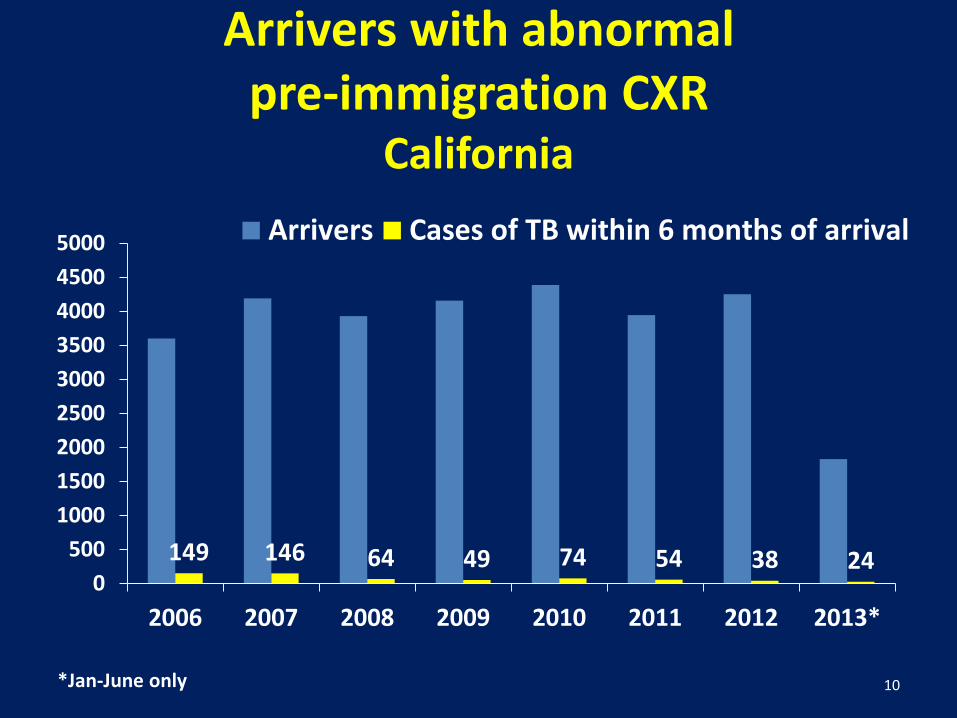
Arrivers with abnormal pre-immigration CXR
California
149 146 64 49 74 54 38 24 0
500
1000
1500
2000
2500
3000
3500
4000
4500
5000
2006 2007 2008 2009 2010 2011 2012 2013*
Arrivers Cases of TB within 6 months of arrival
*Jan-June only 10
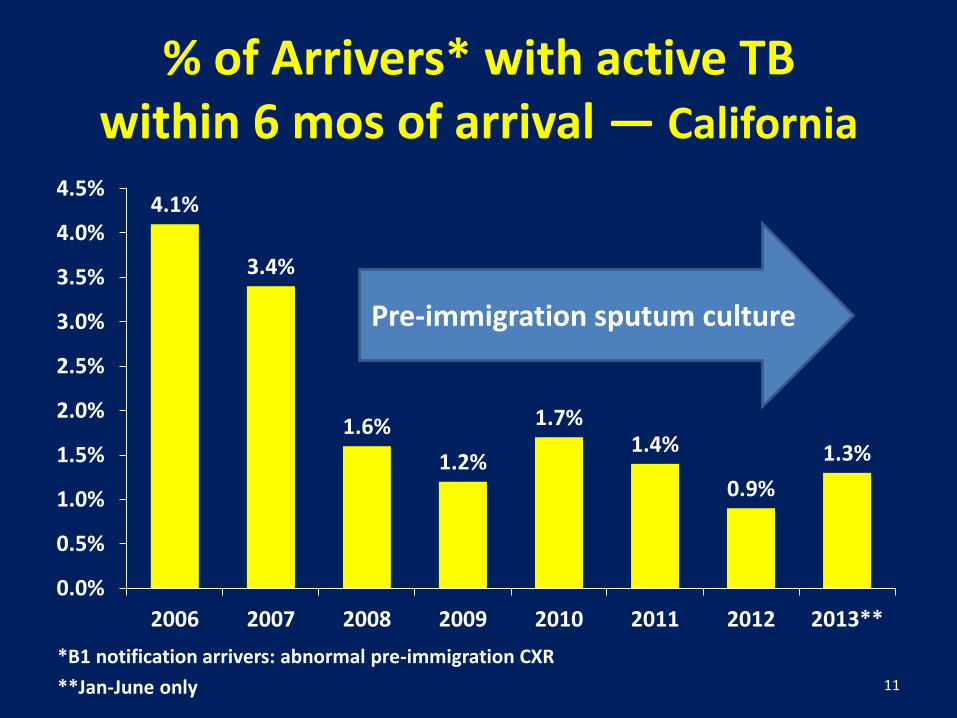
% of Arrivers* with active TB within 6 mos of arrival ― California
*B1 notification arrivers: abnormal pre-immigration CXR
**Jan-June only 11
4.1%
3.4%
1.6%
1.2%
1.7% 1.4%
0.9%
1.3%
0.0%
0.5%
1.0%
1.5%
2.0%
2.5%
3.0%
3.5%
4.0%
4.5%
2006 2007 2008 2009 2010 2011 2012 2013**
Pre-immigration sputum culture
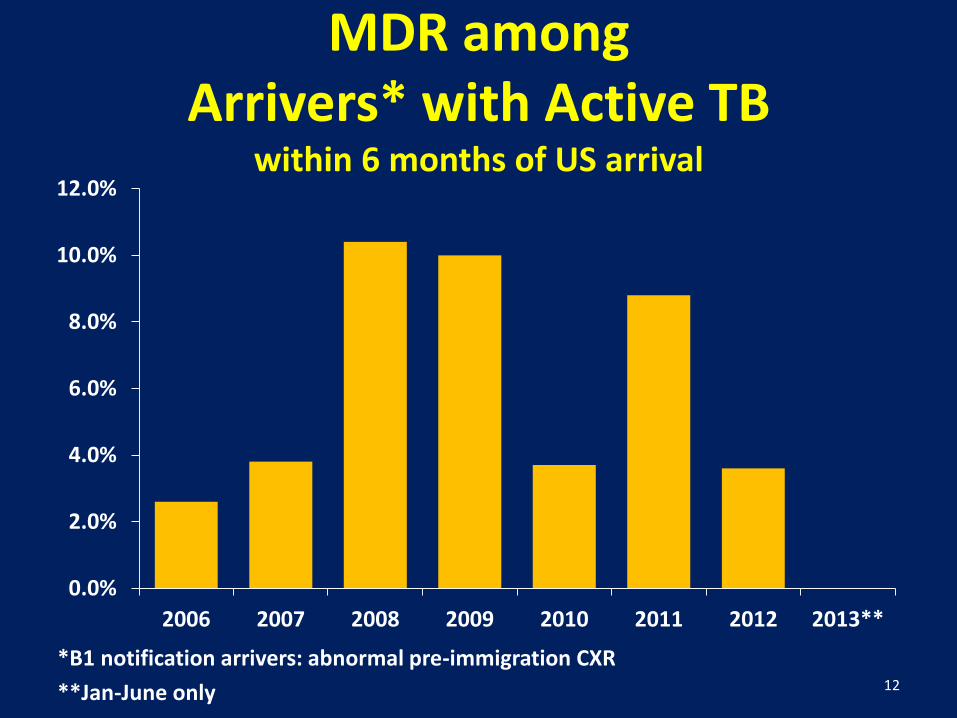
MDR among Arrivers* with Active TB
within 6 months of US arrival
*B1 notification arrivers: abnormal pre-immigration CXR
**Jan-June only 12
0.0%
2.0%
4.0%
6.0%
8.0%
10.0%
12.0%
2006 2007 2008 2009 2010 2011 2012 2013**
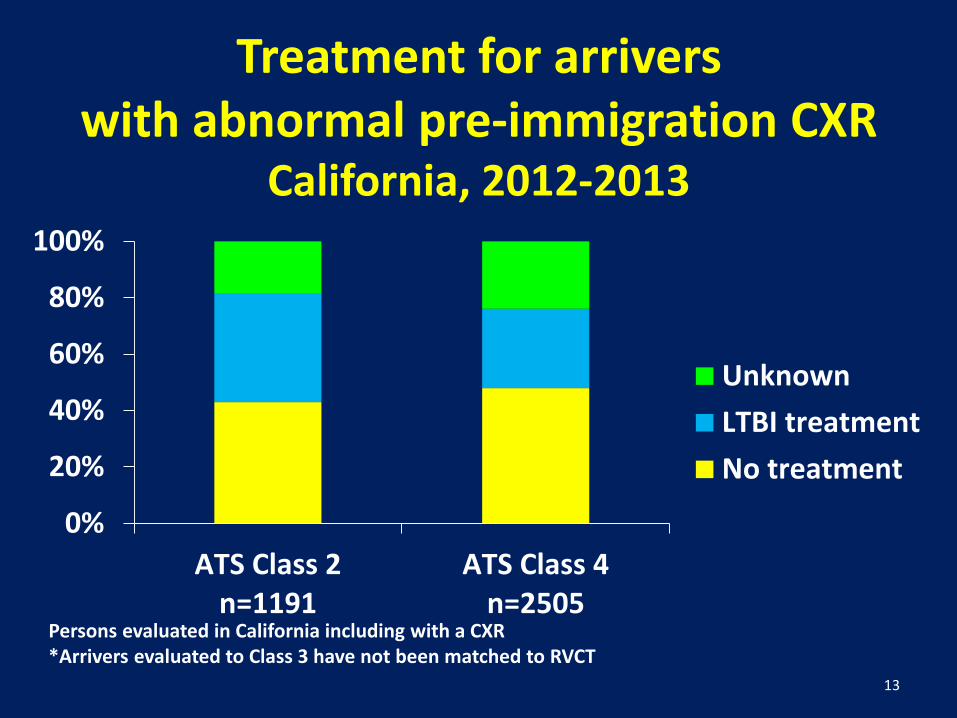
Treatment for arrivers with abnormal pre-immigration CXR
California, 2012-2013
Persons evaluated in California including with a CXR *Arrivers evaluated to Class 3 have not been matched to RVCT
13
0%
20%
40%
60%
80%
100%
ATS Class 2n=1191
ATS Class 4n=2505
Unknown
LTBI treatment
No treatment
New Arriver Screening Gaps
• Many not screened at all (visitors, undocumented)
• Of those screened great majority not screened for LTBI
• Even among those screened by health departments >40% don’t start treatment
– No data from civil surgeons
14
What about longstanding foreign born residents in
California?
15
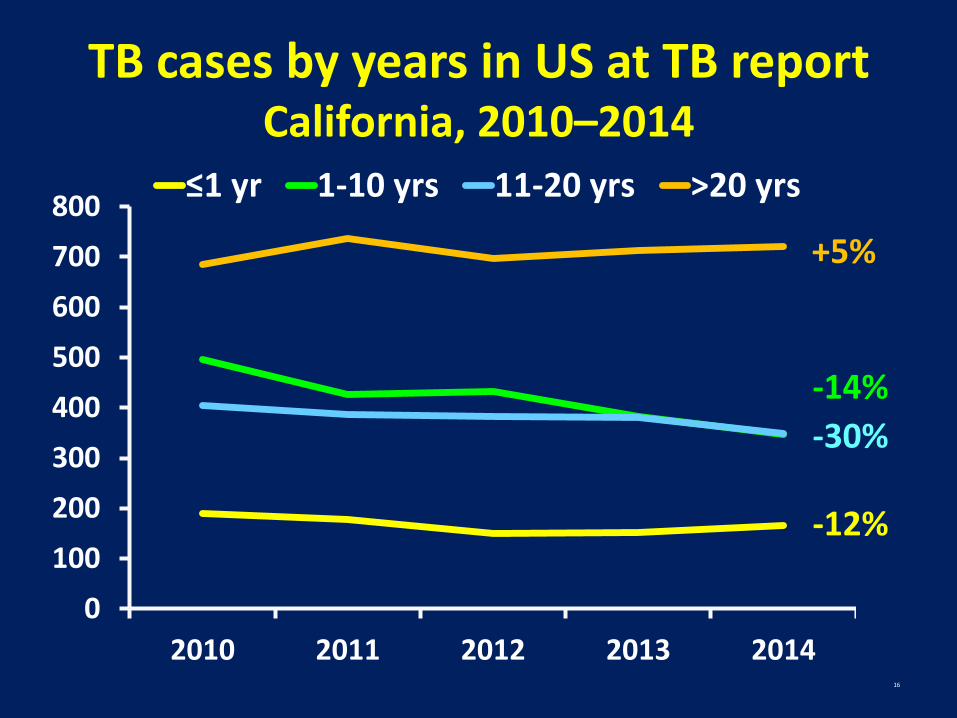
TB cases by years in US at TB report California, 2010–2014
0
100
200
300
400
500
600
700
800
2010 2011 2012 2013 2014
≤1 yr 1-10 yrs 11-20 yrs >20 yrs
16
+5%
-14%
-30%
-12%
Years in US at TB Diagnosis California, 2010-2014
0
100
200
300
400
500
600
700
800
900
TB C
ase
s
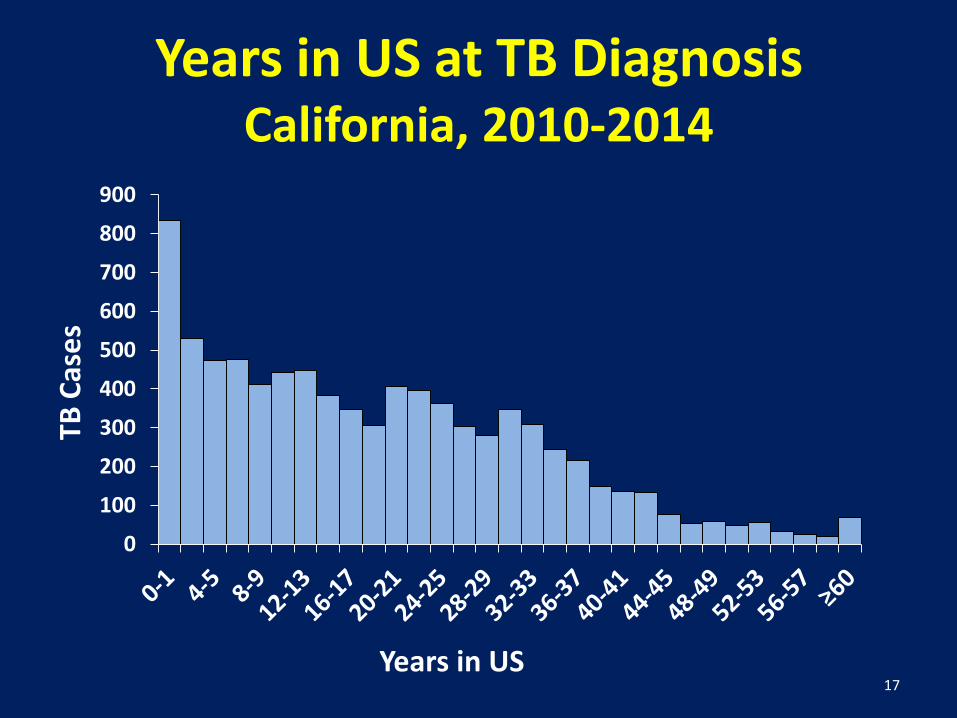
17 Years in US
Years in US at TB Diagnosis California, 2010-2014
0
100
200
300
400
500
600
700
800
900
TB C
ase
s
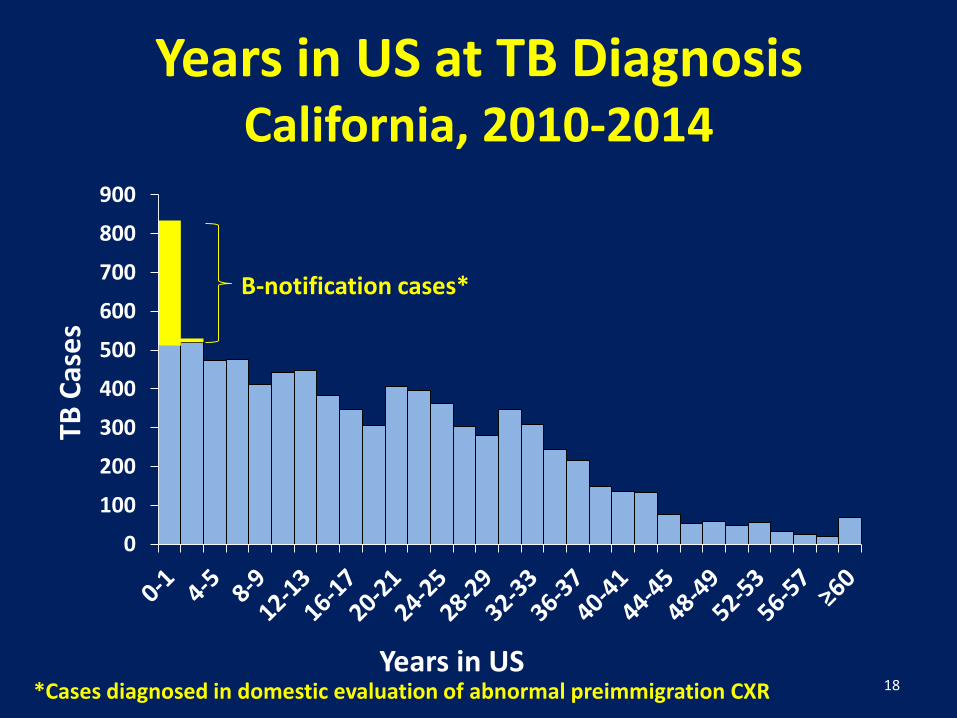
18 Years in US
*Cases diagnosed in domestic evaluation of abnormal preimmigration CXR
B-notification cases*
Years in US at TB Diagnosis California, 2010-2014
0
100
200
300
400
500
600
700
800
900
TB C
ase
s
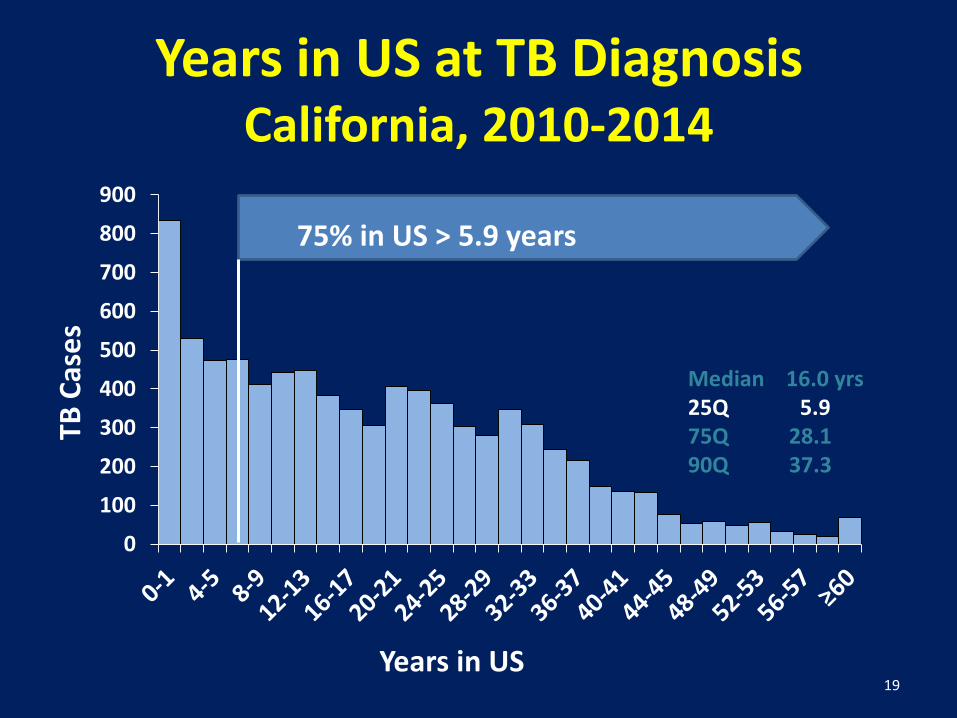
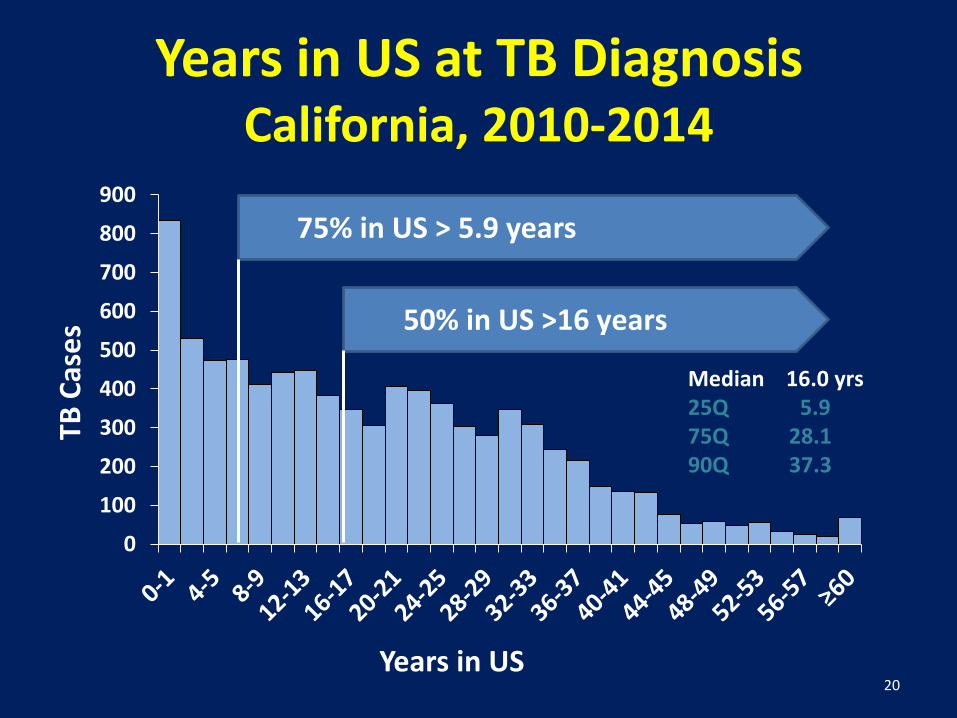
Median 16.0 yrs 25Q 5.9 75Q 28.1 90Q 37.3
19 Years in US
75% in US > 5.9 years
Years in US at TB Diagnosis California, 2010-2014
0
100
200
300
400
500
600
700
800
900
TB C
ase
s
Median 16.0 yrs 25Q 5.9 75Q 28.1 90Q 37.3
50% in US >16 years
20 Years in US
75% in US > 5.9 years
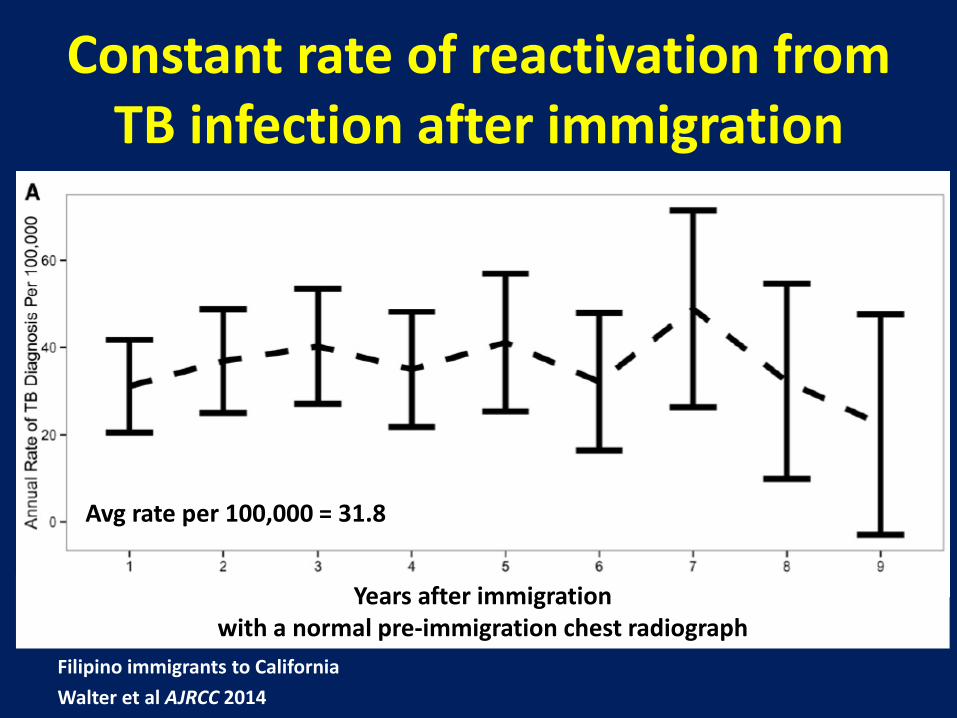
Constant rate of reactivation from TB infection after immigration
Filipino immigrants to California
Walter et al AJRCC 2014
Years after immigration with a normal pre-immigration chest radiograph
Avg rate per 100,000 = 31.8
How to reach long standing foreign-born residents of
California?
22
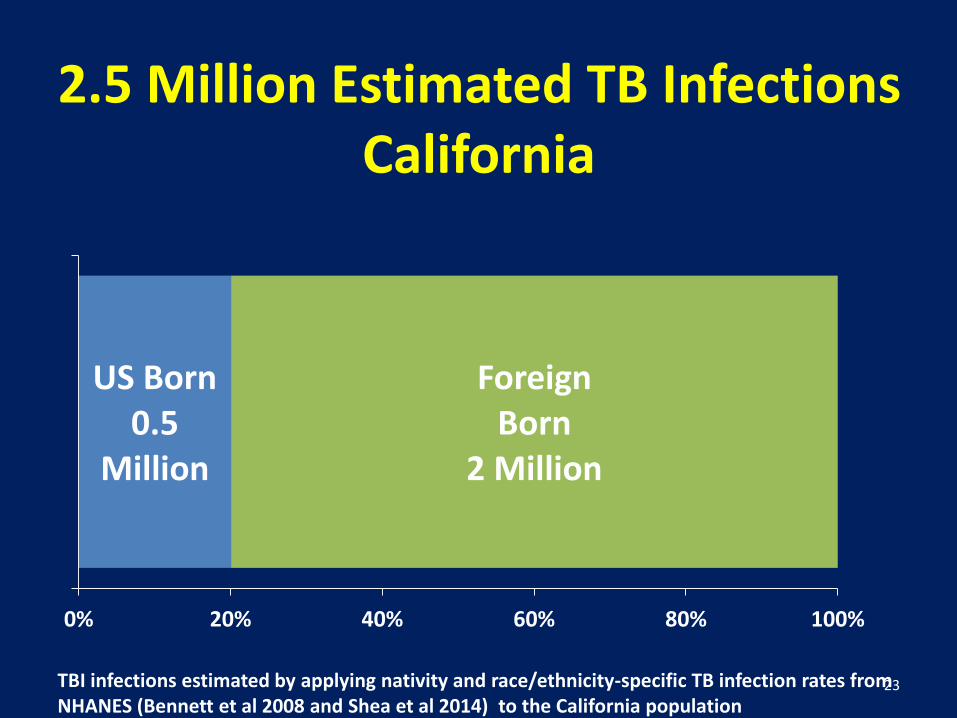
2.5 Million Estimated TB Infections California
US Born 0.5
Million
Foreign Born
2 Million
0% 20% 40% 60% 80% 100%
TBI infections estimated by applying nativity and race/ethnicity-specific TB infection rates from NHANES (Bennett et al 2008 and Shea et al 2014) to the California population
23
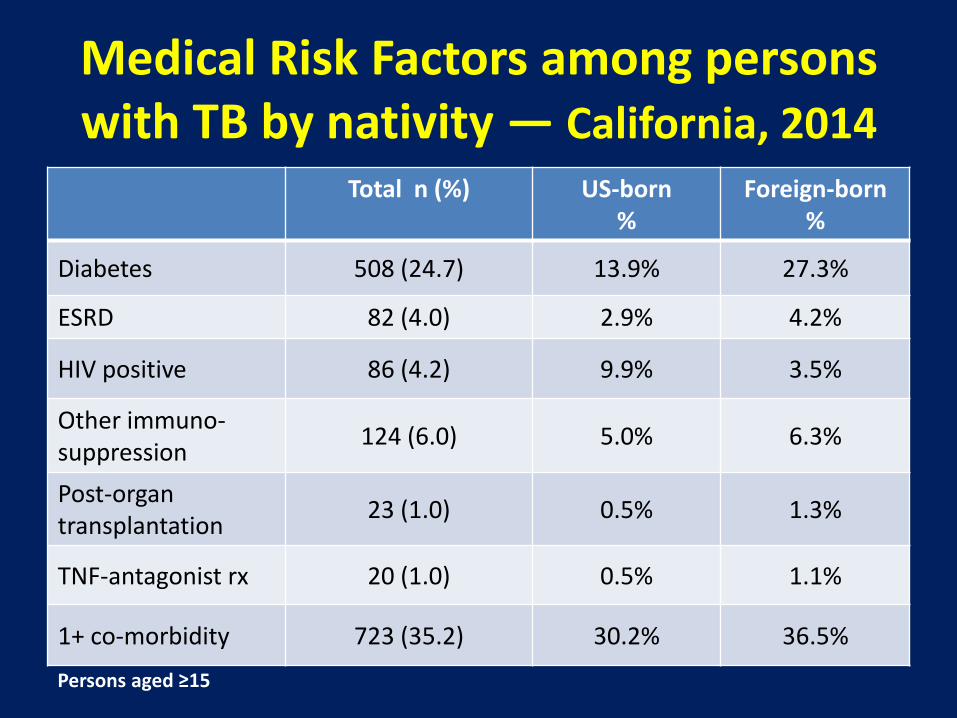
Medical Risk Factors among persons with TB by nativity ― California, 2014
Total n (%) US-born %
Foreign-born %
Diabetes 508 (24.7) 13.9% 27.3%
ESRD 82 (4.0) 2.9% 4.2%
HIV positive 86 (4.2) 9.9% 3.5%
Other immuno-suppression
124 (6.0) 5.0% 6.3%
Post-organ transplantation
23 (1.0) 0.5% 1.3%
TNF-antagonist rx 20 (1.0) 0.5% 1.1%
1+ co-morbidity 723 (35.2) 30.2% 36.5%
Persons aged ≥15
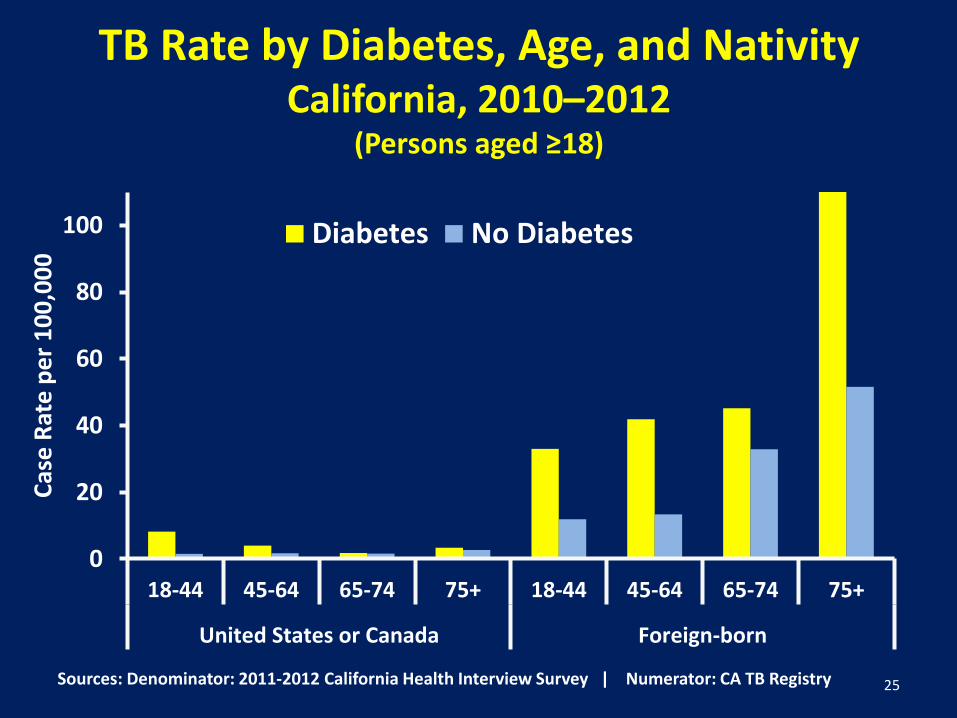
TB Rate by Diabetes, Age, and Nativity California, 2010–2012
(Persons aged ≥18)
0
20
40
60
80
100
18-44 45-64 65-74 75+ 18-44 45-64 65-74 75+
United States or Canada Foreign-born
Cas
e R
ate
pe
r 1
00
,00
0 Diabetes No Diabetes
Sources: Denominator: 2011-2012 California Health Interview Survey | Numerator: CA TB Registry
25
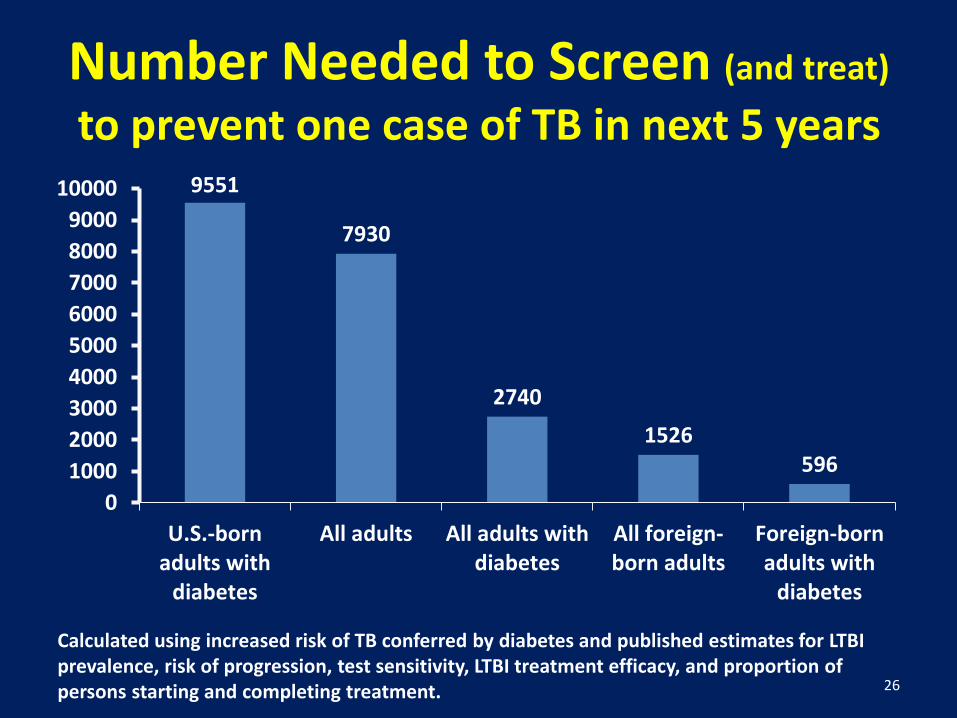
Number Needed to Screen (and treat)
to prevent one case of TB in next 5 years 9551
7930
2740
1526 596
0
1000
2000
3000
4000
5000
6000
7000
8000
9000
10000
U.S.-bornadults with
diabetes
All adults All adults withdiabetes
All foreign-born adults
Foreign-bornadults with
diabetes
Calculated using increased risk of TB conferred by diabetes and published estimates for LTBI prevalence, risk of progression, test sensitivity, LTBI treatment efficacy, and proportion of persons starting and completing treatment. 26
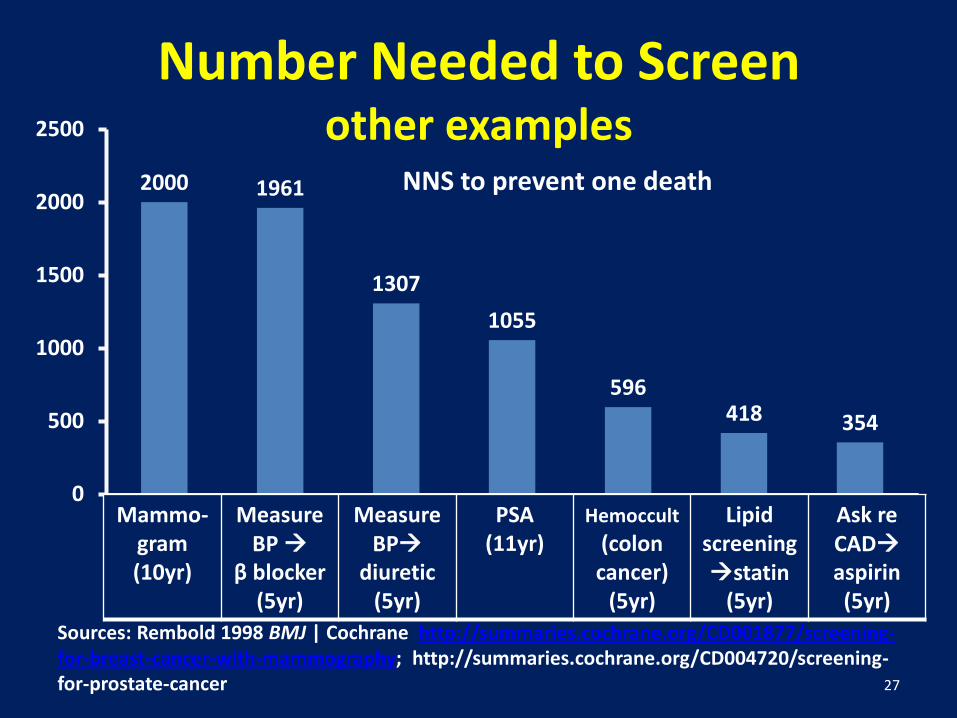
Number Needed to Screen other examples
Sources: Rembold 1998 BMJ | Cochrane http://summaries.cochrane.org/CD001877/screening-for-breast-cancer-with-mammography; http://summaries.cochrane.org/CD004720/screening-for-prostate-cancer 27
2000 1961
1307
1055
596 418 354
0
500
1000
1500
2000
2500
Mammogram10yr
BP measurement- beta blocker
5yr
BP measurement- diuretics
5yr
PSA11yr
hemoccult(colon cancer)
5yrs
lipid screening -statin5yrs
Ask about CAD -aspirin
5 yr
NNS to prevent one death
Mammo-gram (10yr)
Measure BP
β blocker (5yr)
Measure BP
diuretic (5yr)
PSA (11yr)
Hemoccult (colon cancer)
(5yr)
Lipid screeningstatin
(5yr)
Ask re CAD aspirin (5yr)
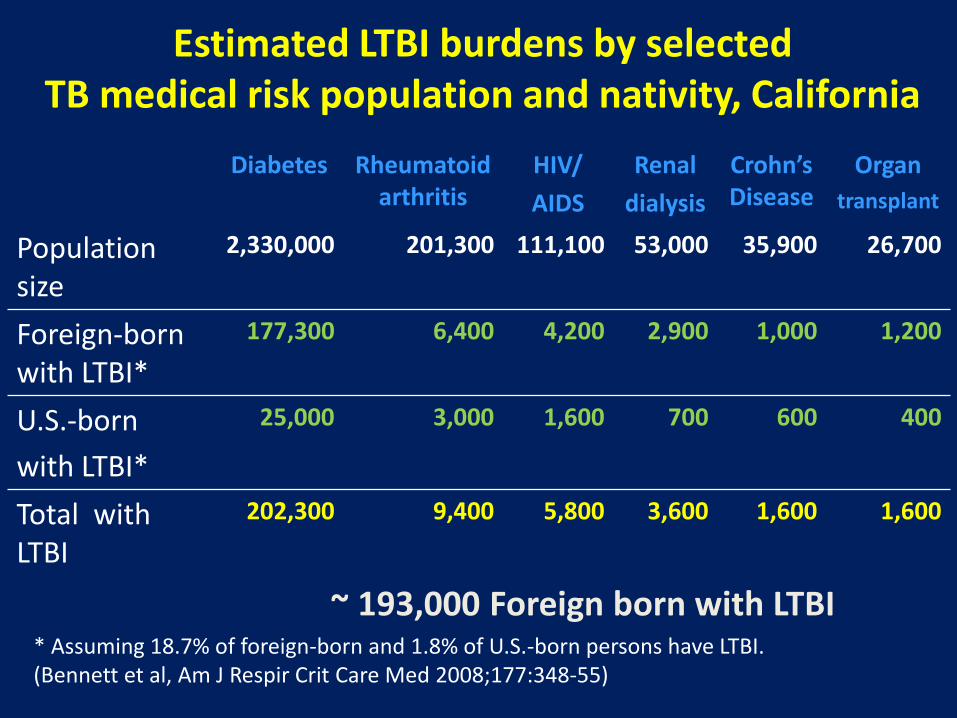
Estimated LTBI burdens by selected TB medical risk population and nativity, California
Diabetes Rheumatoid arthritis
HIV/
AIDS
Renal
dialysis
Crohn’s Disease
Organ
transplant
Population size
2,330,000 201,300 111,100 53,000 35,900 26,700
Foreign-born with LTBI*
177,300 6,400 4,200 2,900 1,000 1,200
U.S.-born
with LTBI*
25,000 3,000 1,600 700 600 400
Total with LTBI
202,300 9,400 5,800 3,600 1,600 1,600
~ 193,000 Foreign born with LTBI * Assuming 18.7% of foreign-born and 1.8% of U.S.-born persons have LTBI. (Bennett et al, Am J Respir Crit Care Med 2008;177:348-55)
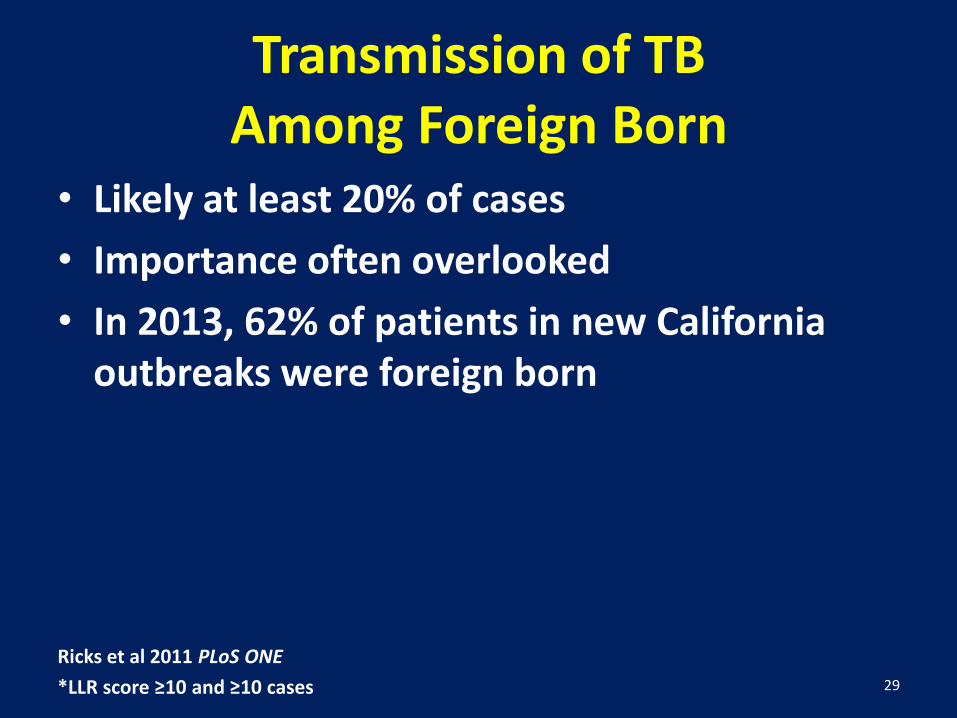
Transmission of TB Among Foreign Born
• Likely at least 20% of cases
• Importance often overlooked
• In 2013, 62% of patients in new California outbreaks were foreign born
Ricks et al 2011 PLoS ONE
*LLR score ≥10 and ≥10 cases 29
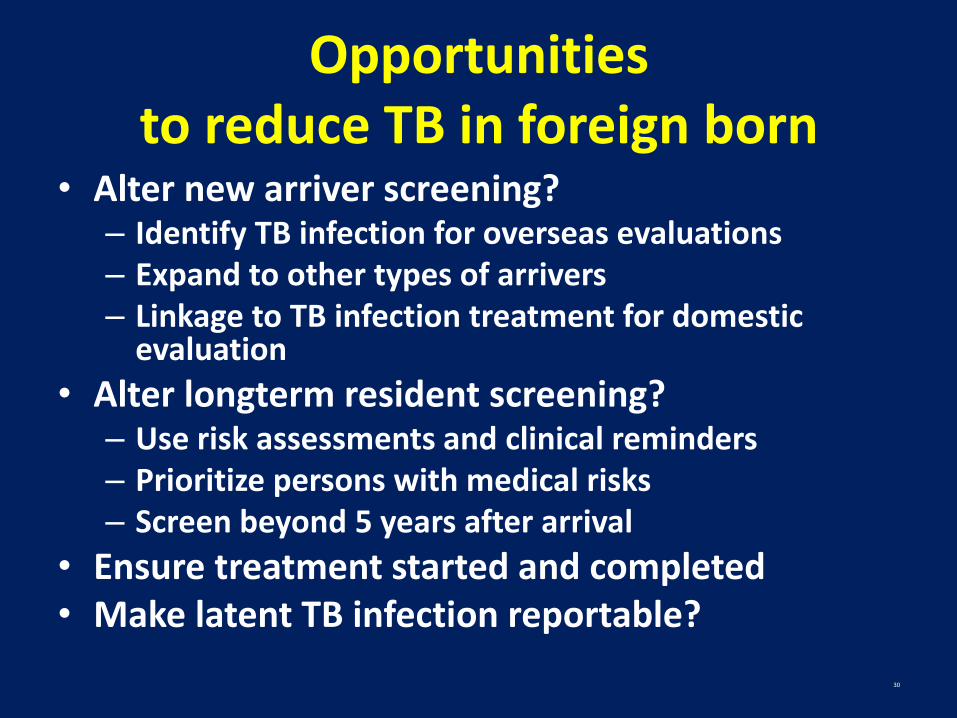
Opportunities to reduce TB in foreign born
• Alter new arriver screening? – Identify TB infection for overseas evaluations – Expand to other types of arrivers – Linkage to TB infection treatment for domestic
evaluation
• Alter longterm resident screening? – Use risk assessments and clinical reminders – Prioritize persons with medical risks – Screen beyond 5 years after arrival
• Ensure treatment started and completed • Make latent TB infection reportable?
30
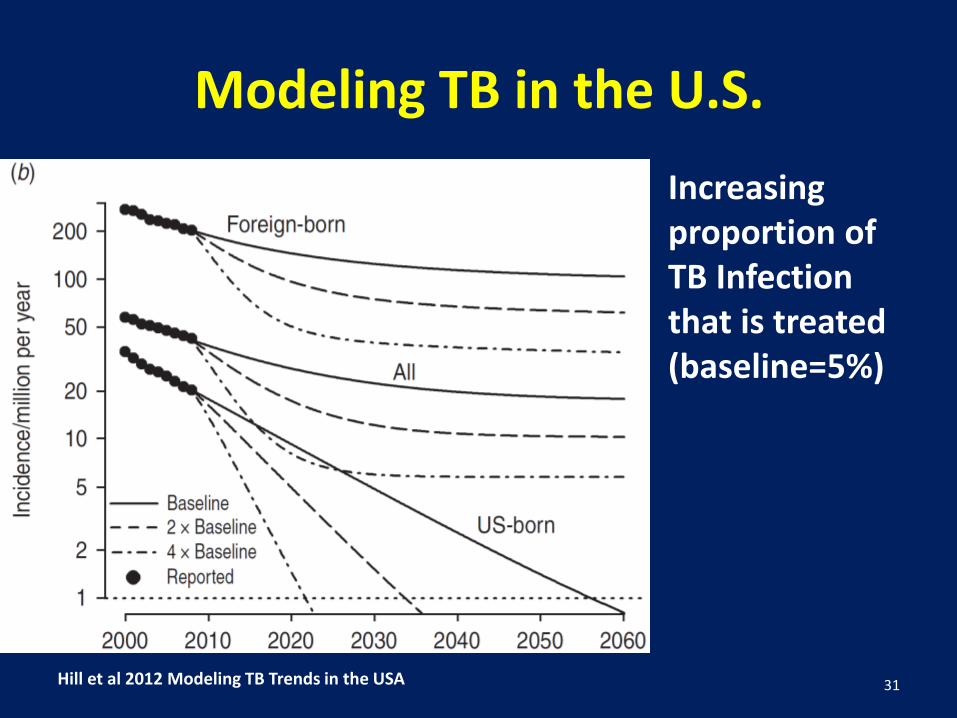
Modeling TB in the U.S.
• Increasing proportion of TB Infection that is treated (baseline=5%)
Hill et al 2012 Modeling TB Trends in the USA 31
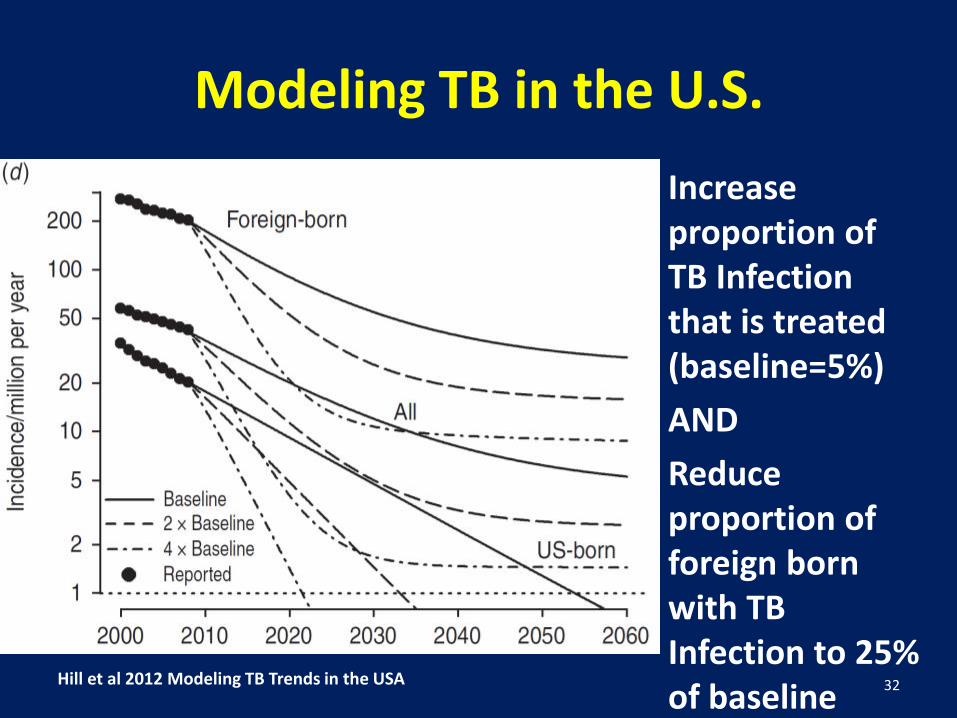
Modeling TB in the U.S.
• Increase proportion of TB Infection that is treated (baseline=5%)
• AND
• Reduce proportion of foreign born with TB Infection to 25% of baseline
Hill et al 2012 Modeling TB Trends in the USA 32
Acknowledgements
Phil Lowenthal
Janice Westenhouse
Tambi Shaw
Peter Oh
Ellen Demlow
Jenny Flood
33