value prediction of materials mechanical properties using
TRANSCRIPT

International Journal of Applied Engineering Research ISSN 0973-4562 Volume 12, Number 24 (2017) pp. 14608-14619
© Research India Publications. http://www.ripublication.com
14608
Value Prediction of Materials Mechanical Properties Using I-kaz Analysis
Method during Impact Test: Experimental Study
Z. Karim11*, A. Y. M. Said1, M. Z. Nuawi2, J. A. Ghani2 and A. R. Bahari3
1 Universiti Kuala Lumpur Malaysia France Institute, 43650 Bangi, Selangor, Malaysia. 2 Universiti Kebangsaan Malaysia, 43650 Bangi, Selangor, Malaysia. 3 Universiti Teknologi MARA, 23200 Dungun, Terengganu, Malaysia.
*Corresponding author
Abstract
The specific mechanical constant of a material can be
determined by examining in detail its dynamic pulse response
or dynamic resonance. This paper proposes the use of the
Multilevel Integrated Kurtosis Algorithm with Z-notch Filter
(I-kaz multilevel) signal analysis method which is used on
dynamic resonance signals to predict the value of specific
mechanical properties of the test materials. Four rectangular
bars made from four different materials were excited in an
anechoic room by an impact test which produces transient
sound radiation and vibration responses. The sound and
vibration signals were recorded using microphones and
accelerometer sensors respectively. An alternative Z-stem
filtering technique was used on the captured signals for noise
removal purpose which may have been captured by the sensor
equipment during the impact test. The filtered signals were
analysed using the I-kaz multilevel analysis method to
determine the pattern of the signal and to estimate the
significant differences between the four materials. The
experimental power curve equations of mechanical loss
coefficient vs. linear coefficient and compressive strength vs.
linear equation can be used to predict the unknown values of
the mechanical loss coefficient and compressive strength of the
test material.
Keywords: Impact test; Material property; I-kaz™ method;
Signal features; Sound; Vibration
INTRODUCTION
In recent years, many techniques have been proposed to
identify the mechanical properties, specifically the elastics
properties, of both orthotropic and isotropic materials [1, 2].
Under these methods, the samples under study were applied to
various experimental setups. The vibration and acoustic signals
produced were picked up and analysed to distinguish the
changes in the vibration and acoustic properties [3-6].
This paper deals with the dynamic characterization of materials
by measuring the vibration and sound signals from the impact
tests which used simple method and calculation, fairly cheap
equipment and non-destructive material. Thus, measurements
could be repeated on the same specimen. The signal feature
(SF) of the captured sound and vibration signals was analysed
using the Multilevel Integrated Kurtosis Algorithm with
Z-notch Filter (I-kaz multilevel) statistical analysis method.
The I-kaz multilevel coefficient values calculated from the
signals were analysed and then correlated with the specific
mechanical properties of the work pieces.
Dynamic signal filtering
Sound and vibration signals were filtered using a Z-stem filter
algorithm based on the frequency components to remove
unwanted noise. In the next stage, the recorded signals were
transformed to the frequency domain using a Fast Fourier
Transform (FFT) algorithm. The values of the frequency
components for sound and vibration signals were compared to
observe the same and different dominant frequencies. The
effectiveness of the Z-stem noise filtering technique in
removing unwanted noise can be proven by finding the
correlation between both signals before and after the filtering
process. For that reason, the correlation coefficient was utilized
to quantify the similarity of the filtered and unfiltered signal
against noise. Eq. (1) shows the correlation coefficient, R
which represents the normalized measure of the strength of the
linear relationship between variables [7-9].
1
2
1
( )( )
R
( )
N
tt t k
tt
x x x x
Nx x
(1)
The effectiveness of the Z-stem filter de-noising technique can
be observed by the value of e as shown in Eq. (2) [10].
1
filtered measured
measured
R Re
R
(2)
The filtered vibration and sound signal was analysed using the
new I-kaz multilevel analysis method to observe the
information characteristic contained in the signal.

International Journal of Applied Engineering Research ISSN 0973-4562 Volume 12, Number 24 (2017) pp. 14608-14619
© Research India Publications. http://www.ripublication.com
14609
I-kaz multilevel method
Signals captured in time domain need to be analysed and
extracted using specific signal features (SF) in order to describe
the signal sufficiently and maintain the relevant information
[11-14]. SFs such as standard deviation, kurtosis, average
values, root mean square (rms) and variance are commonly
used to extract information in any signal in time domain [15-
17].
The average value of �̅� is defined as in Eq. (3) where n is the
number of points and xi is the value of each individual item in
the list of points being averaged.
1
1( )
n
ii
x xn
(3)
The standard deviation value, s is defined as in Eq. (4):
12 2
1
1 n
ii
s x xn
(4)
Where �̅� is the mean of the data and xi is the value of the data
point. The value of kurtosis, for discrete data sets is defined in
Eq. (5).
4
41
1K ( )
n
ii
x xns
(5)
Kurtosis values which are capable of detecting the high
amplitude in signals are commonly used in industries for the
purpose of defect detection [18]. It was also used in a study as
one of the coefficients to predict the fatigue life reliability of a
stub axle [19].
The maximum frequency span in a signal is described
in Eq. (6):
max2.56
sff (6)
Where Fmax is the maximum frequency, fs the sampling
frequency and 2.56 is the Nyquist number which was chosen to
be more than 2 in order to avoid the content of the sampling
signal to be misinterpreted [20].
Previous studies show that the I-kazTM coefficient was used as
the parameter to translate the signal features on the captured
signals. J.A. Ghani in her study used the I-kazTM coefficient to
analyse the tool wear in a turning machining process to predict
the tool wear status during machining [21-23]. The I-kazTM
coefficient also has been used to predict the internal pipe
surface condition by analysing the acoustic signal emitted when
knocking the two sample pipes, the rough pipe and smooth pipe
surfaces [13]. This coefficient in another study was used to
identify the three typical wear curves in a machining process
for certain cutting parameters [24].
The new I-kaz multilevel coefficient (LZ∞) which is more
sensitive towards amplitude and frequency changes in a signal
was developed base on the original I-kazTM (Z∞) [10, 25, 26].
The related I-kaz multilevel coefficient can be calculated as in
Eq. (7):
4 4 4 4
1 1 2 2 3 3
1...L
L LZ K s K s K s K sn
(7)
where K is the kurtosis, s is the standard deviation and L is the
number of order of signal decomposition.
The purpose of this study is to identify the mechanical values
of four different materials by analyzing the vibration and sound
signal captured during the impact test. The signals will be
analysed using I-kaz multilevel method.
METHODOLOGY
Design of experiment
In this impact test experiment, four rectangular bars were used,
medium carbon steel S50C, brass, stainless steel AISI 304 and
cast iron FCD 500 with the size of 250mm, 50mm and 10 mm
for their length, width and thickness respectively.
Process parameters and their levels for this experiment are
shown in Table 1.
Table 1: Process parameters and their levels
Materials
Medium
carbon
steel S50C
Brass Stainless
steel AISI
304
Cast iron
FCD 500
Impact
force (N)
0 0 0 0
420 420 420 420
640 640 640 640
890 890 890 890
1080 1080 1080 1080
1290 1290 1290 1290
EXPERIMENTAL PROCEDURE
The experiment set-up is shown in Fig. 1. The mechanical
properties of the specimens or work pieces are given in Table
2. The force applied during the impact was generated by an
impact hammer model Endevco 2302-10 which was connected
to the computer through the pulse analyzer to measure the
magnitude of the force during the impact. Six different impact
force, 0 N, 420 N, 640 N, 890 N, 1080 N and 1290 N will be
applied on each material. A small size microphone model
GRAS 40SC was placed 5 mm from the edge of the material to
capture the sound signal. The microphone was connected to its

International Journal of Applied Engineering Research ISSN 0973-4562 Volume 12, Number 24 (2017) pp. 14608-14619
© Research India Publications. http://www.ripublication.com
14610
amplifier module and then to the data acquisition equipment,
NI PXI-1031DC. An accelerometer model DJB A/23/E was
placed as far from the nodal point as necessary, to pick up the
vibration signals during and after the impact. The experiment
was conducted in an anechoic room and the procedure was in
accordance with ASTM E1876 [27]. The specimen was
elastically impacted by the impact hammer without plastic
deformation at the impact area. The impact was located at the
centre position of the test materials. The vibration, force and
sound signals were recorded at the same time and stored in the
computer. The signals stored in the computer were analysed
using MATLAB to find the I-kaz multilevel coefficient values
at the analysis stage.
RESULTS
Z-stem filter for removing unwanted modes
The transient sound radiation and vibration responses were
obtained in this experiment and plotted brass cast iron FCD 500
as shown Figure 2 and Figure 3. The selected signals were
based on 90 percent attenuation from the maximum amplitude
of the signal. The time domain characteristics for both sound
and vibration signals were similar for all materials, with high
oscillation as a result of the dynamic response of the impact
testing interaction between the hammer tip and the specimen
surface.
Figure 1: Experimental set-up
Table 2: Mechanical property of the specimens
Material Poisson Ratio Mechanical Loss
Coefficient
Compressive
Strength (Mpa)
Modulus of
Rupture (Mpa)
Brass 0.345 5.74 x 10⁻⁴ 89.98 89.98
Medium Carbon steelS50C 0.290 8.80 x 10⁻⁴ 365.00 365.00
Stainless steel AISI 304 0.270 1.13 x 10⁻³ 257.52 257.52
Cast iron FCD 500 0.260 2.25 x 10⁻² 164.99 95.01
(a)
Data Acquisition
NI PXI-1031DC
Pulse analyzer
Workpiece
Impact Hammer
Endevco 2302 -10
Computer
Sponge base
Microphone
Amplifier Accelerometer
DJB A/23/E
Microphone
GRAS 40SC
0 0.05 0.1 0.15 0.2-0.015
-0.01
-0.005
0
0.005
0.01VIBRATION
Time (s)
Ampli
tude
0 0.05 0.1 0.15 0.2-0.02
-0.015
-0.01
-0.005
0
0.005
0.01
0.015
0.02SOUND
Time (s)
Ampli
tude
Am
pli
tud
e
Am
pli
tud
e

International Journal of Applied Engineering Research ISSN 0973-4562 Volume 12, Number 24 (2017) pp. 14608-14619
© Research India Publications. http://www.ripublication.com
14611
(b)
Figure 2: Time history record (a) brass; (b) cast iron FCD 500
(a)
(b)
Figure 3: Time history record (a) medium carbon steel S50C; (b) stainless steel AISI 304
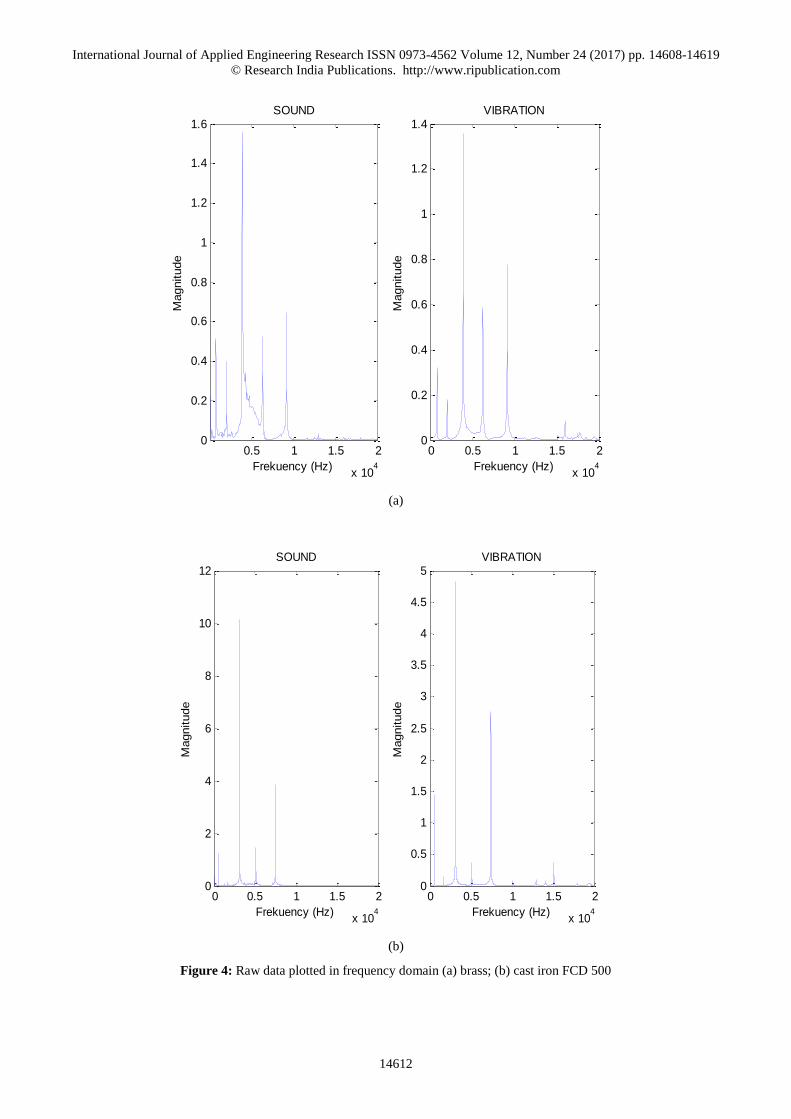
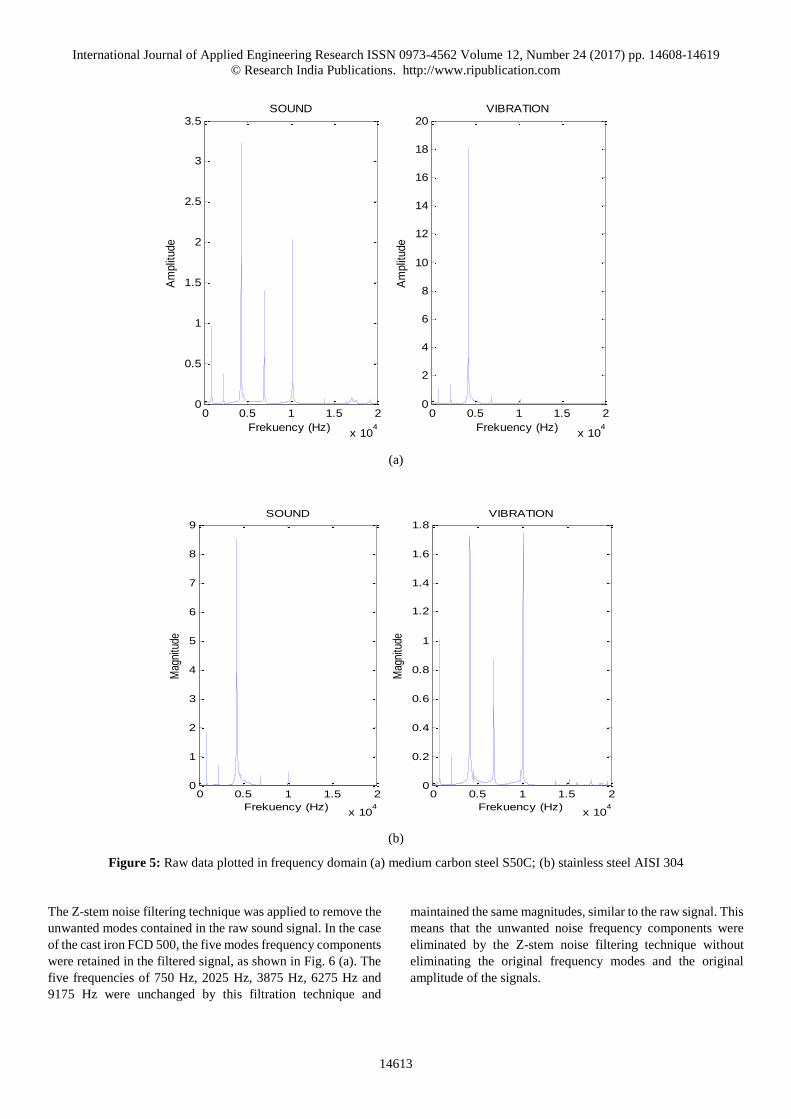
The plot of sound and vibration signals in the frequency domain
after the Fast Fourier Transform (FFT) shows the same modes
generated during the impact excited process (Figure 4 and
Figure 5). However, different modes also exist between the
sound and vibration signals for a particular material. These
unwanted modes need to be filtered by treating the vibration
modes as the reference to obtain a precise sound signal for
analysis purposes.
0 0.02 0.04 0.06-0.015
-0.01
-0.005
0
0.005
0.01
0.015VIBRATION
Time (s)
Ampli
tude
0 0.02 0.04 0.06-0.025
-0.02
-0.015
-0.01
-0.005
0
0.005
0.01
0.015
0.02
0.025SOUND
Time (s)
Ampli
tude
0 0.05 0.1-0.015
-0.01
-0.005
0
0.005
0.01
0.015VIBRATION
Time (s)
Ampli
tude
0 0.05 0.1-0.04
-0.03
-0.02
-0.01
0
0.01
0.02
0.03
0.04SOUND
Time (s)
Ampli
tude
0 0.05 0.1-0.015
-0.01
-0.005
0
0.005
0.01
0.015VIBRATION
Time (s)
Ampl
itude
0 0.05 0.1-0.03
-0.02
-0.01
0
0.01
0.02
0.03SOUND
Time (s)
Ampl
itude
Am
pli
tud
e
Am
pli
tud
e
Am
pli
tude
Am
pli
tude
Am
pli
tude
Am
pli
tude
International Journal of Applied Engineering Research ISSN 0973-4562 Volume 12, Number 24 (2017) pp. 14608-14619
© Research India Publications. http://www.ripublication.com
14612
(a)
(b)
Figure 4: Raw data plotted in frequency domain (a) brass; (b) cast iron FCD 500
0 0.5 1 1.5 2
x 104
0
0.2
0.4
0.6
0.8
1
1.2
1.4VIBRATION
Frekuency (Hz)
Magnitude
0.5 1 1.5 2
x 104
0
0.2
0.4
0.6
0.8
1
1.2
1.4
1.6SOUND
Frekuency (Hz)
Magnitude
0 0.5 1 1.5 2
x 104
0
0.5
1
1.5
2
2.5
3
3.5
4
4.5
5VIBRATION
Frekuency (Hz)
Magnitude
0 0.5 1 1.5 2
x 104
0
2
4
6
8
10
12SOUND
Frekuency (Hz)
Magnitude
International Journal of Applied Engineering Research ISSN 0973-4562 Volume 12, Number 24 (2017) pp. 14608-14619
© Research India Publications. http://www.ripublication.com
14613
(a)
(b)
Figure 5: Raw data plotted in frequency domain (a) medium carbon steel S50C; (b) stainless steel AISI 304
The Z-stem noise filtering technique was applied to remove the
unwanted modes contained in the raw sound signal. In the case
of the cast iron FCD 500, the five modes frequency components
were retained in the filtered signal, as shown in Fig. 6 (a). The
five frequencies of 750 Hz, 2025 Hz, 3875 Hz, 6275 Hz and
9175 Hz were unchanged by this filtration technique and
maintained the same magnitudes, similar to the raw signal. This
means that the unwanted noise frequency components were
eliminated by the Z-stem noise filtering technique without
eliminating the original frequency modes and the original
amplitude of the signals.
0 0.5 1 1.5 2
x 104
0
0.5
1
1.5
2
2.5
3
3.5
Frekuency (Hz)
Am
plit
ude
SOUND
0 0.5 1 1.5 2
x 104
0
2
4
6
8
10
12
14
16
18
20
Frekuency (Hz)
Am
plit
ude
VIBRATION
0 0.5 1 1.5 2
x 104
0
0.2
0.4
0.6
0.8
1
1.2
1.4
1.6
1.8VIBRATION
Frekuency (Hz)
Mag
nitu
de
0 0.5 1 1.5 2
x 104
0
1
2
3
4
5
6
7
8
9SOUND
Frekuency (Hz)
Mag
nitu
de

International Journal of Applied Engineering Research ISSN 0973-4562 Volume 12, Number 24 (2017) pp. 14608-14619
© Research India Publications. http://www.ripublication.com
14614
Figure 6: Filtered sound and vibration signals for cast iron FDC 500 in frequency domain
Table 3: Correlation coefficient of the raw and filtered signals for the materials
Material Signal type Correlation
coefficient
Brass Raw -0.1239
Filtered 0.9840
Cast iron FCD 500 Raw -0.5913
Filtered 0.9234
Medium carbon steel S50C Raw 0.7944
Filtered 0.8847
Stainless steel
AISI 304
Raw 0.3956
Filtered 0.8635
The correlation between the unfiltered and the filtered signals
is important to quantify the effectiveness of the Z-stem filter
technique. The value of the correlation coefficient, R, was
calculated for the unfiltered and filtered signals. The smaller R
value obtained for the signals in the correlation test means less
similarity between the signals. Using Eq. (2), the R value of the
raw and filtered signals for all test samples are shown in Table
3. The effectiveness of the Z-stem filter was quantified by the
deviation between the filtered and raw signal against noise. The
effectiveness for the medium carbon steel S50 is 0.4392. This
effectiveness indicates that 43.92% of the overall unwanted
noise had been removed from the raw signal.
I-kaz multilevel signal analysis for the filtered signals
The filtered vibration and sound signals were analysed using
the I-kaz multilevel method as described in Eq. (7) to calculate
the value of the coefficients for each data set. The coefficient
values for each data set are shown in Table 4 and Table 5. It
can be seen that as the impact force on the specimen increases,
the I-kaz multilevel coefficient, 7Z∞, also increases.
Table 4: I-kaz multilevel coefficient (7Z∞) of the filtered vibration and sound signals for brass and cast iron FCD 500
Impact force (N) Brass Cast iron FCD 500
Vibration Sound Vibration Sound
0 0 0 0 0
420 4.2232 x10⁻¹⁰ 1.8222 x10⁻⁹ 4.88 x10⁻⁹ 8.43 x10⁻⁹
640 1.4884 x10⁻⁹ 6.2744 x10⁻⁹ 1.07 x10⁻⁸ 1.86 x10⁻⁸
890 2.4679 x10⁻⁹ 1.0178 x10⁻⁸ 1.91 x10⁻⁸ 3.12 x10⁻⁸
1080 2.9794 x10⁻⁹ 1.2566 x10⁻⁸ 2.01 x10⁻⁸ 2.97 x10⁻⁸
1290 4.1459 x10⁻⁹ 1.6202 x10⁻⁸ 2.85 x10⁻⁸ 5.48 x10⁻⁸
0 0.5 1 1.5 2
x 104
0
0.2
0.4
0.6
0.8
1
1.2
1.4VIBRATION (FILTERED)
Frekuency (Hz)
Mag
nitu
de
0.5 1 1.5 2
x 104
0
0.2
0.4
0.6
0.8
1
1.2
1.4
1.6SOUND (FILTERED)
Frekuency (Hz)
Mag
nitu
de
International Journal of Applied Engineering Research ISSN 0973-4562 Volume 12, Number 24 (2017) pp. 14608-14619
© Research India Publications. http://www.ripublication.com
14615
Table 5: I-kaz multilevel coefficient (7Z∞) of the filtered vibration and sound signal for medium carbon steel S50C and stainless
steel AISI 304
Impact force (N) Medium Carbon steel S50C Stainless steel AISI 304
Vibration Sound Vibration Sound
0 0 0 0 0
420 1.35 x10⁻⁹ 3.27 x10⁻⁸ 1.8986 x10⁻⁹ 3.02 x10⁻⁸
640 4.08 x10⁻⁹ 1.01 x10⁻⁷ 4.9234 x10⁻⁹ 6.40 x10⁻⁸
890 6.72 x10⁻⁹ 1.44 x10⁻⁷ 8.4800 x10⁻⁹ 1.52 x10⁻⁷
1080 8.37 x10⁻⁹ 1.84 x10⁻⁷ 1.0592 x10⁻⁸ 2.03 x10⁻⁷
1290 1.27 x10⁻⁸ 3.52 x10⁻⁷ 1.5976 x10⁻⁸ 2.98 x10⁻⁷
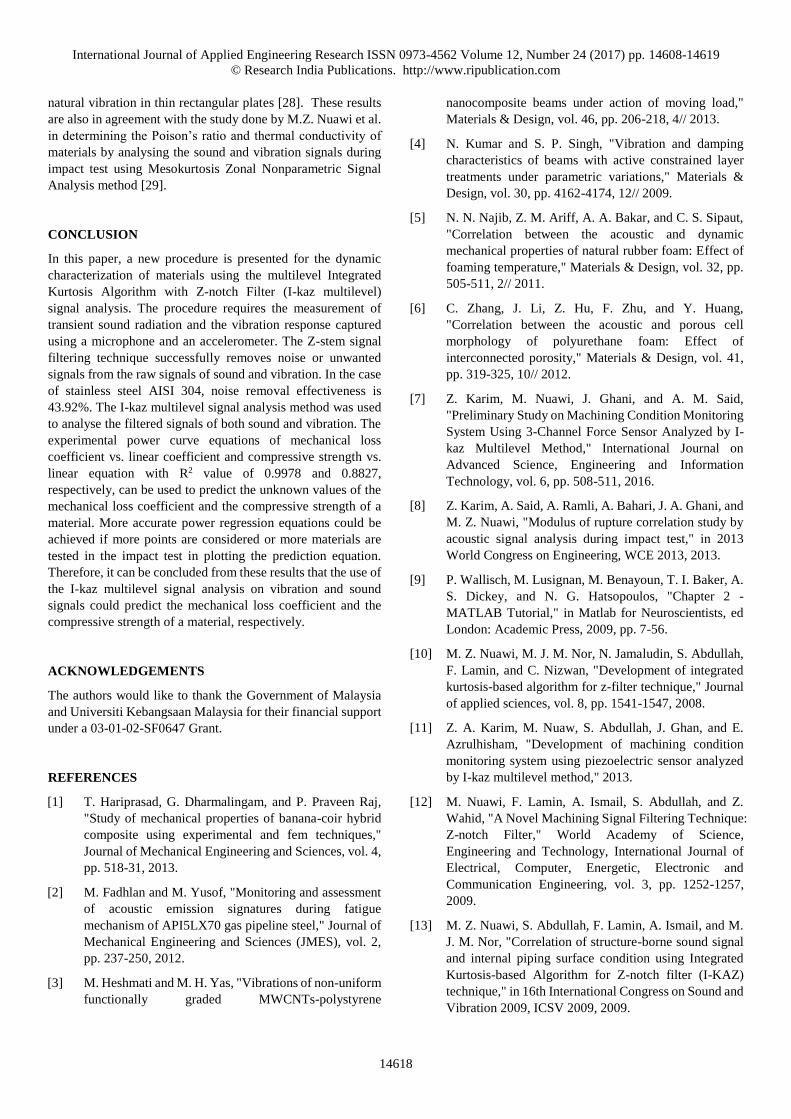
The value of coefficient 7Z∞ increasing with the increase of the
force applied is similar to the other types of material under
testing in this experiment. Vibration and sound amplitude
increased as higher impact force was applied on the specimen.
The I-kaz multilevel coefficient, 7Z∞ also increased as it is very
sensitive to the small changes of amplitude in the vibration and
sound signal. The increase of amplitude in vibration and sound
signals are different from one material to another. Thus, the 7Z∞
values will also show different values depending on the type of
material tested during the impact test. Referring to Table 3 and
Table 4, at impact force equal to 640N, the values of 7Z∞ for the
vibration signals are 1.4884x10⁻⁹ and 4.08 x10⁻⁹ for brass and
medium carbon steel S50C, respectively. This is because
different materials have different mechanical properties and
will respond differently towards impact force applied on their
surface.
The plotted graphs of the I-kaz multilevel versus impact force
for vibration and sound signals as shown in Figure 7 and Figure
8 were used to further investigate the relationship between the
I-kaz multilevel coefficient (7Z∞) values and the impact force.
Figure 7: I-kaz multilevel coefficient for vibration signal vs. force
0 200 400 600 800 1000 1200
0
0.5
1
1.5
2
2.5
x 10-8
Impact force (N)
I-kaz M
ultile
vel coeffic
ient
Brass
Cast Iron
Carbon Steel
StainlessSteel

International Journal of Applied Engineering Research ISSN 0973-4562 Volume 12, Number 24 (2017) pp. 14608-14619
© Research India Publications. http://www.ripublication.com
14616
Figure 8: I-kaz multilevel coefficient for sound signal vs. force
Using the curve fitting tool feature in the MATLAB, both plots
are identified as in the form of linear equations with the average
R2 values equal to 0.913 and 0.867 for vibration signals and
sound signals respectively. The linear equations for vibration
and sound signals for each type of material are as listed in Table
6 below. This table shows that different materials have different
linear equations for both types of signal analysis on vibration
signals and sound signals. From the above linear equation, it
can be therefore concluded that the linear equation can provide
a simple and effective method to study the relationship between
the material mechanical properties versus the vibration signals
and sound signals.
In comparing the material mechanical properties in Table 1 and
the coefficient of linear equations in Table 6, two findings have
been made. Firstly, the linear coefficient values for the
vibration signals are directly related to the mechanical loss
coefficients of the materials. Secondly, the linear coefficients
for the sound signals are directly related to the compressive
strength of the materials. These two findings are summarized
in Table 7 and Table 8 as shown below.
Table 6: Curve fitting equation for vibration and sound signals
Material Linear Line Equation
Medium carbon steel S50C y = 8.360 x 10⁻¹²x
Vibration Stainless steel AISI304 y = 1.054 x 10⁻¹¹x
Cast iron FCD 500 y = 2.005 x 10⁻¹¹x
Brass y = 2.997 x 10⁻¹²x
Medium carbon steel S50C y = 2.080 x 10⁻¹⁰x
Sound Stainless steel AISI304 y = 1.915 x 10⁻¹⁰x
Cast iron FCD 500 y = 3.468 x 10⁻¹¹x
Brass y = 1.219 x 10⁻¹¹x
Table 7: Linear coefficients of vibration signal and mechanical loss coefficients
Material Linear coefficient Mechanical loss coefficient
Cast iron FCD 500 2.005 x 10⁻¹¹ 2.25 x 10⁻²
Stainless steel AISI304 1.054 x 10⁻¹¹ 1.13 x 10⁻³
Medium carbon steel S50C 8.360 x 10⁻¹² 8.80 x 10⁻⁴
Brass 2.997 x 10⁻¹² 5.74 x 10⁻⁴
0 200 400 600 800 1000 12000
0.5
1
1.5
2
2.5
3
3.5x 10
-7
Impact force (N)
I-ka
z M
ulti
leve
l coeffic
ient
Brass
Cast Iron
CarbonSteel
Stainless Steel

International Journal of Applied Engineering Research ISSN 0973-4562 Volume 12, Number 24 (2017) pp. 14608-14619
© Research India Publications. http://www.ripublication.com
14617
Table 8: Linear coefficients of sound signal and compressive strength
Material Linear coefficient Compressive strength (Mpa)
Medium carbon steel S50C 2.080 x 10⁻¹⁰ 365.00
Stainless steel AISI304 1.915 x 10⁻¹⁰ 257.52
Cast iron FCD 500 3.468 x 10⁻¹¹ 164.99
Brass 1.219 x 10⁻¹¹ 89.98
Base on the information in Table 7, the value of the linear
coefficient increases proportional with the increase in the value
of the mechanical loss coefficient. Materials with lower
mechanical loss coefficients will produce lower linear
coefficients whereas materials with higher mechanical loss
coefficients will produce higher linear coefficients. The plot of
mechanical loss coefficient versus linear coefficient is shown
in Figure 9.
Figure 9: Mechanical loss coefficient vs. linear coefficient
The curve fitting in Fig. 9 is in the form of a power equation
with the average R2 values equal to 0.9978. The graph was
plotted using the power regression method because it is the
simplest approach and it gives the highest value of R2. The
relationship between mechanical loss coefficient and linear
coefficient can be written as in Equation 8.
y = (7.994 X 1039) (x) 3.884 (8)
where y is the mechanical loss coefficient and x is the linear
coefficient. Equation 8 can be used to predict the value of an
unknown mechanical loss coefficient of a material when the
experiment is repeated using the same method on the material.
Table 7 shows the relationship between the linear coefficients
of the sound signal and the compressive strength of the
materials. As in Table 7, Table 8 also shows that the linear
coefficients of the sound signals increase proportional with the
increase in the value of the compressive strength. Materials
having higher compressive strength values will produce higher
linear coefficients and materials with lower compressive
strength will produce lower linear coefficients.
From the information in Table 8, it can be therefore inferred
that the use of the I-kaz multilevel signal analysis on the
vibration and sound signals could characterized the mechanical
loss coefficient and the compressive strength of the material,
respectively. The plot of compressive strength versus linear
coefficient is shown in Figure 10.
Figure 10: Compressive strength vs. linear coefficient
The curve fitting in Fig. 10 is in the form of a power equation
with the average R2 values equal to 0.8827. The power
regression method was chosen to plot the graph since it is the
simplest approach and it gives the highest value of R2. The
relationship between the compressive strength and the linear
coefficient can be written as in Eq. (9).
y = (3.337 X 10⁶) (x) 0.4151 (9)
where y is the compressive strength and x is the linear
coefficient. Materials with unknown value of compressive
strength can be predicted by using Eq. (9) when the experiment
is repeated on the material with the same methodology. Similar
finding was reported by Alfano, M. and Pagnotta in their study
to identify the Poisson's ratio and the dynamic Young's
modulus by analysing two of the first four frequencies of
0.4 0.6 0.8 1 1.2 1.4 1.6 1.8 2
x 10-11
0
0.005
0.01
0.015
0.02
Linear coefficient
Me
ch
an
ica
l lo
ss c
oe
ffic
ien
t
0.5 1 1.5 2
x 10-10
100
150
200
250
300
350
Linar coefficient
Co
mp
ressiv
e s
tre
ng
th (
Mp
a)
International Journal of Applied Engineering Research ISSN 0973-4562 Volume 12, Number 24 (2017) pp. 14608-14619
© Research India Publications. http://www.ripublication.com
14618
natural vibration in thin rectangular plates [28]. These results
are also in agreement with the study done by M.Z. Nuawi et al.
in determining the Poison’s ratio and thermal conductivity of
materials by analysing the sound and vibration signals during
impact test using Mesokurtosis Zonal Nonparametric Signal
Analysis method [29].
CONCLUSION
In this paper, a new procedure is presented for the dynamic
characterization of materials using the multilevel Integrated
Kurtosis Algorithm with Z-notch Filter (I-kaz multilevel)
signal analysis. The procedure requires the measurement of
transient sound radiation and the vibration response captured
using a microphone and an accelerometer. The Z-stem signal
filtering technique successfully removes noise or unwanted
signals from the raw signals of sound and vibration. In the case
of stainless steel AISI 304, noise removal effectiveness is
43.92%. The I-kaz multilevel signal analysis method was used
to analyse the filtered signals of both sound and vibration. The
experimental power curve equations of mechanical loss
coefficient vs. linear coefficient and compressive strength vs.
linear equation with R2 value of 0.9978 and 0.8827,
respectively, can be used to predict the unknown values of the
mechanical loss coefficient and the compressive strength of a
material. More accurate power regression equations could be
achieved if more points are considered or more materials are
tested in the impact test in plotting the prediction equation.
Therefore, it can be concluded from these results that the use of
the I-kaz multilevel signal analysis on vibration and sound
signals could predict the mechanical loss coefficient and the
compressive strength of a material, respectively.
ACKNOWLEDGEMENTS
The authors would like to thank the Government of Malaysia
and Universiti Kebangsaan Malaysia for their financial support
under a 03-01-02-SF0647 Grant.
REFERENCES
[1] T. Hariprasad, G. Dharmalingam, and P. Praveen Raj,
"Study of mechanical properties of banana-coir hybrid
composite using experimental and fem techniques,"
Journal of Mechanical Engineering and Sciences, vol. 4,
pp. 518-31, 2013.
[2] M. Fadhlan and M. Yusof, "Monitoring and assessment
of acoustic emission signatures during fatigue
mechanism of API5LX70 gas pipeline steel," Journal of
Mechanical Engineering and Sciences (JMES), vol. 2,
pp. 237-250, 2012.
[3] M. Heshmati and M. H. Yas, "Vibrations of non-uniform
functionally graded MWCNTs-polystyrene
nanocomposite beams under action of moving load,"
Materials & Design, vol. 46, pp. 206-218, 4// 2013.
[4] N. Kumar and S. P. Singh, "Vibration and damping
characteristics of beams with active constrained layer
treatments under parametric variations," Materials &
Design, vol. 30, pp. 4162-4174, 12// 2009.
[5] N. N. Najib, Z. M. Ariff, A. A. Bakar, and C. S. Sipaut,
"Correlation between the acoustic and dynamic
mechanical properties of natural rubber foam: Effect of
foaming temperature," Materials & Design, vol. 32, pp.
505-511, 2// 2011.
[6] C. Zhang, J. Li, Z. Hu, F. Zhu, and Y. Huang,
"Correlation between the acoustic and porous cell
morphology of polyurethane foam: Effect of
interconnected porosity," Materials & Design, vol. 41,
pp. 319-325, 10// 2012.
[7] Z. Karim, M. Nuawi, J. Ghani, and A. M. Said,
"Preliminary Study on Machining Condition Monitoring
System Using 3-Channel Force Sensor Analyzed by I-
kaz Multilevel Method," International Journal on
Advanced Science, Engineering and Information
Technology, vol. 6, pp. 508-511, 2016.
[8] Z. Karim, A. Said, A. Ramli, A. Bahari, J. A. Ghani, and
M. Z. Nuawi, "Modulus of rupture correlation study by
acoustic signal analysis during impact test," in 2013
World Congress on Engineering, WCE 2013, 2013.
[9] P. Wallisch, M. Lusignan, M. Benayoun, T. I. Baker, A.
S. Dickey, and N. G. Hatsopoulos, "Chapter 2 -
MATLAB Tutorial," in Matlab for Neuroscientists, ed
London: Academic Press, 2009, pp. 7-56.
[10] M. Z. Nuawi, M. J. M. Nor, N. Jamaludin, S. Abdullah,
F. Lamin, and C. Nizwan, "Development of integrated
kurtosis-based algorithm for z-filter technique," Journal
of applied sciences, vol. 8, pp. 1541-1547, 2008.
[11] Z. A. Karim, M. Nuaw, S. Abdullah, J. Ghan, and E.
Azrulhisham, "Development of machining condition
monitoring system using piezoelectric sensor analyzed
by I-kaz multilevel method," 2013.
[12] M. Nuawi, F. Lamin, A. Ismail, S. Abdullah, and Z.
Wahid, "A Novel Machining Signal Filtering Technique:
Z-notch Filter," World Academy of Science,
Engineering and Technology, International Journal of
Electrical, Computer, Energetic, Electronic and
Communication Engineering, vol. 3, pp. 1252-1257,
2009.
[13] M. Z. Nuawi, S. Abdullah, F. Lamin, A. Ismail, and M.
J. M. Nor, "Correlation of structure-borne sound signal
and internal piping surface condition using Integrated
Kurtosis-based Algorithm for Z-notch filter (I-KAZ)
technique," in 16th International Congress on Sound and
Vibration 2009, ICSV 2009, 2009.

International Journal of Applied Engineering Research ISSN 0973-4562 Volume 12, Number 24 (2017) pp. 14608-14619
© Research India Publications. http://www.ripublication.com
14619
[14] R. Teti, K. Jemielniak, G. O’Donnell, and D. Dornfeld,
"Advanced monitoring of machining operations," CIRP
Annals-Manufacturing Technology, vol. 59, pp. 717-
739, 2010.
[15] J. Dong, K. Subrahmanyam, Y. San Wong, G. S. Hong,
and A. Mohanty, "Bayesian-inference-based neural
networks for tool wear estimation," The International
Journal of Advanced Manufacturing Technology, vol.
30, pp. 797-807, 2006.
[16] N. Ghosh, Y. Ravi, A. Patra, S. Mukhopadhyay, S. Paul,
A. Mohanty, et al., "Estimation of tool wear during CNC
milling using neural network-based sensor fusion,"
Mechanical Systems and Signal Processing, vol. 21, pp.
466-479, 2007.
[17] B. Sick, "On-line and indirect tool wear monitoring in
turning with artificial neural networks: a review of more
than a decade of research," Mechanical Systems and
Signal Processing, vol. 16, pp. 487-546, 2002.
[18] G. Pontuale, F. Farrelly, A. Petri, and L. Pitolli, "A
statistical analysis of acoustic emission signals for tool
condition monitoring (TCM)," Acoustics Research
Letters Online, vol. 4, pp. 13-18, 2003.
[19] E. Azrulhisham, Y. Asri, A. Dzuraidah, and A. H. Fahmi,
"Accelerated test model in fatigue life reliability
evaluation of stub axle," Advances in Safety, Reliability
and Risk Management: ESREL 2011, p. 227, 2011.
[20] R. S. Figliola and D. E. Beasley, "Theory and design for
mechanical measurements," ed: IOP Publishing, 2001.
[21] J. A. Ghani, M. Rizal, M. Z. Nuawi, M. J. Ghazali, and
C. H. C. Haron, "Monitoring online cutting tool wear
using low-cost technique and user-friendly GUI," Wear,
vol. 271, pp. 2619-2624, 2011.
[22] H. Izatul, Z. A. Karim, M. Nuawi, J. Ghani, S. Azuan, S.
Mastura, et al., "Material Mechanical Property
Correlation Study Using Vibration Signal Analysis,"
2013.
[23] Z. Karim, M. Z. Nuawi, J. A. Ghani, M. J. Ghazali, S.
Abdullah, and N. Mansor, "Sliding wear evaluation of
aluminum alloy (7075-T6) on hardened steel (AISI4340)
via non-contact technique by I-kaz™ multi-level
analysis," Wear, vol. 334, pp. 99-104, 2015.
[24] M. Nuawi, F. Lamin, M. Nor, N. Jamaluddin, S.
Abdullah, and C. Nizwan, "Integration of I-kaz
coefficient and Taylor tool life curve for tool wear
progression monitoring in machining process,"
International journal of mechanics, vol. 3, pp. 45-50,
2007.
[25] Z. Karim, M. Nuawi, J. Ghani, S. Abdullah, and M.
Ghazali, "Optimization of Integrated Kurtosis-Based
Algorithm for Z-Filter (I-KazTM) Coefficient Using
Multi Level Signal Decomposition Technique," World
Applied Sciences Journal, vol. 14, pp. 1541-1548, 2011.
[26] M. Tahir, J. A. Ghani, M. Z. Nuawi, M. Rizal, and C. H.
C. Haron, "Flank wear and I-kaz 3D correlation in ball
end milling process of Inconel 718," Journal of
Mechanical Engineering and Sciences, vol. 9, pp. 1595-
1603, 2015.
[27] A. Standard, "09,“Standard test method for dynamic
Young’s modulus, shear modulus, and Poisson’s ratio by
impulse excitation of vibration,” ASTM International,
West Conshohocken, PA, 2003, DOI: 10.1520/E1876-
09," ed, 1876.
[28] M. Alfano and L. Pagnotta, "Determining the elastic
constants of isotropic materials by modal vibration
testing of rectangular thin plates," Journal of Sound and
Vibration, vol. 293, pp. 426-439, 2006.
[29] M. Nuawi, A. Bahari, S. Abdullah, A. Ihsan, and M. Ali,
"Mesokurtosis zonal nonparametric signal analysis for
dynamic characterisation of metallic material," J.
Kejuruteraan, vol. 24, pp. 21-27, 2013.