value stream mapping at xyz company by madhubala …€¦ · · 2007-11-15submitted in partial...
TRANSCRIPT
Value Stream Mapping at XYZ Company
by
Madhubala Rauniyar
A Research Paper Submitted in Partial Fulfillment of the
Requirements for the Master of Science Degree
In
Technology Management
The Graduate School
University of Wisconsin-Stout
May, 2007

ii
The Graduate School University of Wisconsin-Stout
Menomonie, WI
Author: Madhubala Rauniyar
Title: Value Stream Mapping at XYZ Company
Graduate Degree/ Major: MS Technology Management
Research Adviser: John Dzissah
MonthfYear: May, 2007
Number of Pages: 46
Style Manual Used: American Psychological Association, 5th edition
ABSTRACT
A value stream includes all activities required to transform a product from raw material
into the finished goods. Value Stream Mapping scrutinizes business processes from beginning to
end and a visual representation map is drawn of every process involved in the material and
information flows. Then a future state map is drawn to show how things should work for best
competitive advantage. Value Stream Mapping helps to identify the current flow ofmaterial and
information in processes for a family of products, highlighting the opportunities for improvement
that will most significantly impact the overall production system.
The purpose of this study is to develop a value stream map for a manufacturing company
in Minnesota. The goal is to identify and eliminate waste which is any activity that does not add
value to the final product, in the production process. In order to collect the information needed to
complete the project, the researcher will take a tour ofthe production facility. This will enable
the researcher to be familiar with the activities being performed at the shop floor. It would also
help in getting a vivid idea ofthe production flow. In addition, a classroom environment would

iii
be set with leads from the various departments of the company so that the researcher can observe
and collect information related to product families for the practical mapping and product/process
flow from start to finish. This information would highly assist the researcher to visualize the
current state ofthe process activities by mapping the material and information flow and looking
for opportunities to eliminate wastes and to improve the process flow. Based on all the
information gathered, the company would utilize these results as a plan to map the future state
and implement lean manufacturing techniques so that wastes can be eliminated, flow maximized
and throughput increased.

iv
The Graduate School
University ofWisconsin Stout
Menomonie, WI
Acknowledgments
It is a great pleasure to thank my advisor, John Dzissah who has supported me immensely and
guided me throughout my project work.
I would also like to thank Tom Lacksonen, Lloyd Peterson and Gerry Tietz for supporting me
directly and indirectly in completing my research work.
Many thanks to XYZ Company for giving me an opportunity to do my research work on them.
v
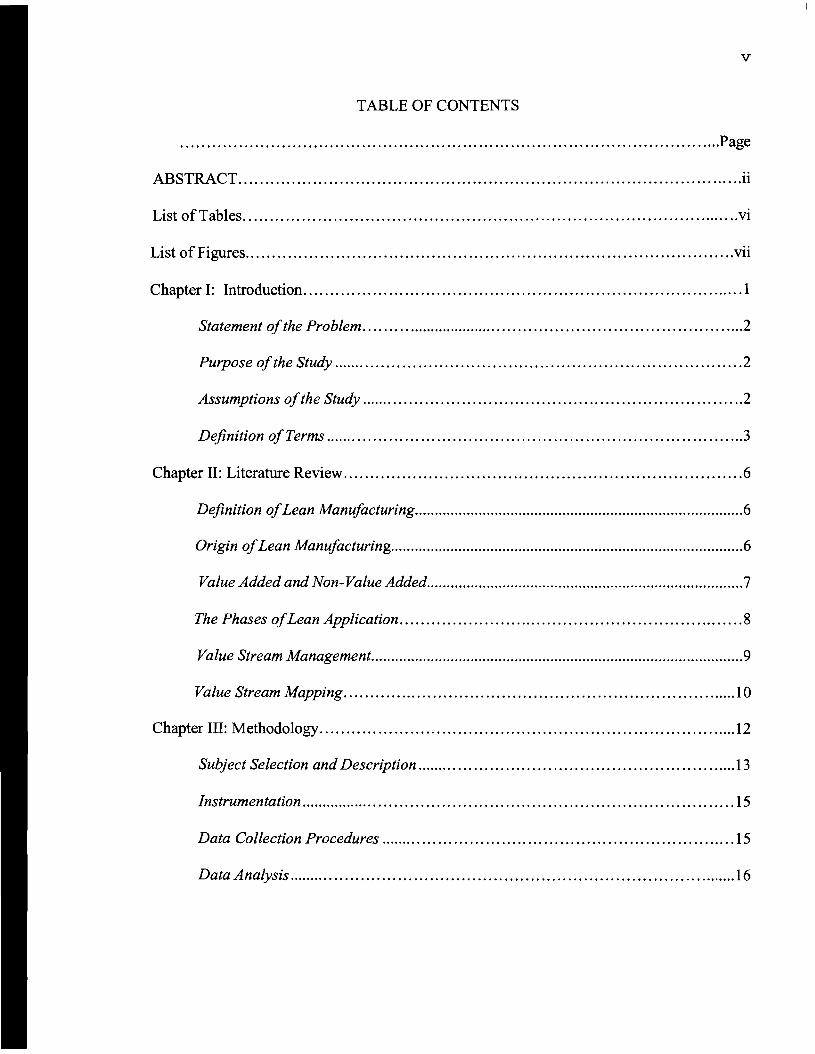
TABLE OF CONTENTS
......................................................................................................Page
ABSTRACT .ii
List ofTables vi
. ..List 0 f FIgures Vll
Chapter I: Introduction 1
Statement ofthe Problem 2
Purpose ofthe Study 2
Assumptions ofthe Study 2
Definition ofTerms 3
Chapter II: Literature Review 6
Definition ofLean Manufacturing 6
Origin ofLean Manufacturing 6
Value Added and Non- Value Added 7
The Phases ofLean Application 8
Value Stream Management 9
Value Stream Mapping 10
Chapter III: Methodology 12
Subject Selection and Description .13
Instrumentation 15
Data Collection Procedures , .. 15
Data Analysis 16
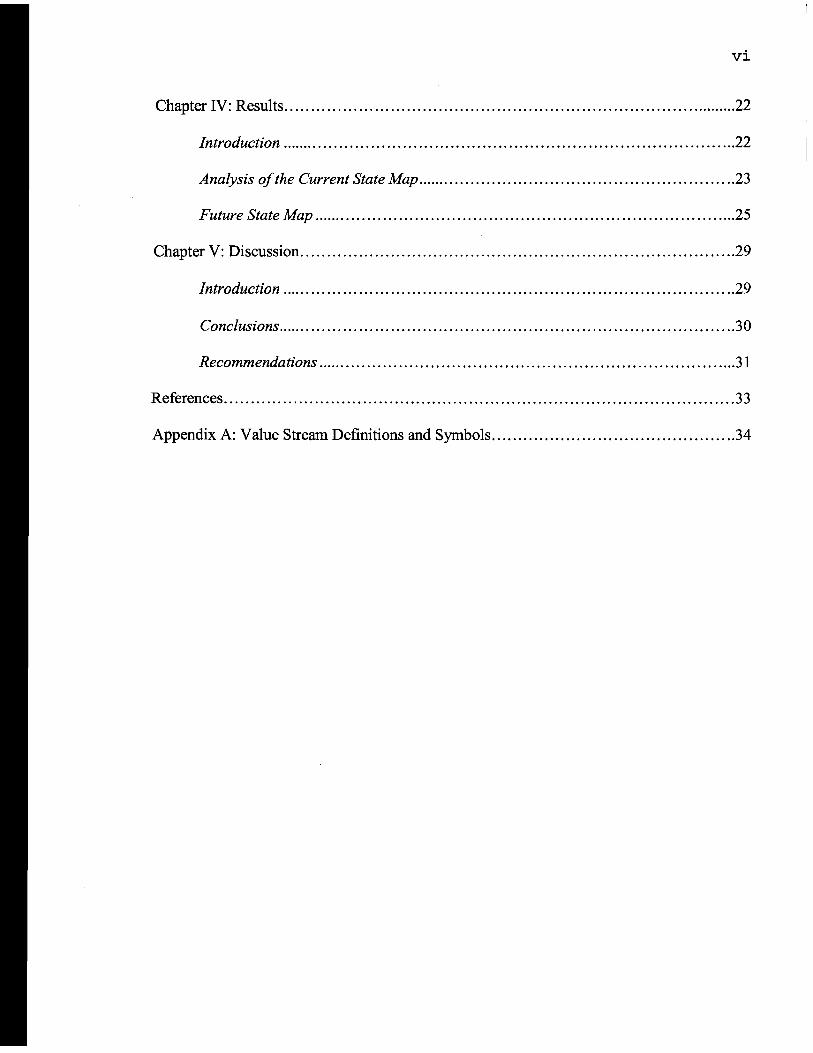
vi
Chapter IV: Results 22
Introduction 22
Analysis ofthe Current State Map .23
Future State Map 25
Chapter V: Discussion 29
Introduction 29
Conclusions 30
Recommendations 31
References 33
Appendix A: Value Stream Definitions and Symbols 34
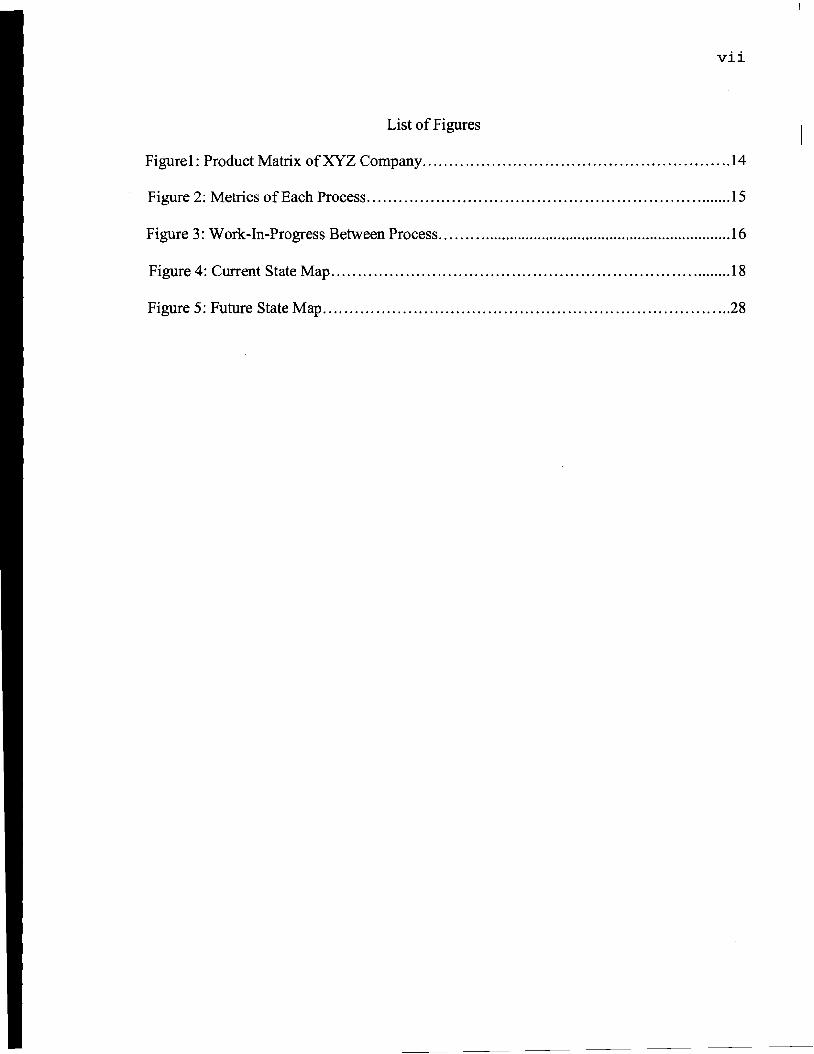
vii
List ofFigures
Figure1: Product Matrix ofXYZ Company 14
Figure 2: Metrics of Each Process 15
Figure 3: Work-In-Progress Between Process 16
Figure 4: Current State Map 18
Figure 5: Future State Map 28

1
Chapter I: Introduction
Every organization is striving hard on getting more work done in less time and with greater
ease. The fundamental aim of any organization has been to continuously minimize waste and
maximize flow which would ultimately lead to customer satisfaction by providing right product
at the right time in the right quantity and the right quality at a reasonable price. This can be
achieved greatly by adopting lean manufacturing system which is more than a cost reduction
program. It aims at eliminating wastes which could be in the form of excess production and
inventory, redundant movement ofmaterial, waiting and delays, over processing, excess worker
motion, rework and corrections.
Part of lean manufacturing is assessing operations and processes or products that add cost
rather than value (Tapping, Luyster & Shuker, 2002). Each step of the manufacturing process is
examined to determine if it adds value to the product. If it does not add value, the process could
be assigned to a subcontractor or outsourcing company in order to focus the workforce on value
added operations of its core business. This is known as value stream which is a set ofprocesses
required to transform raw materials into finished goods that customers value (Womack & Jones,
1996).
This study aims at developing a value stream map for XYZ Company. It is a lead acid
refining and recycling company located in Minnesota and servicing in North America. More than
98% of all automotive batteries are recycled as the state law requires reclamation of used battery
for each battery sold. As a result, the demand for lead-acid batteries is growing. Most of the lead
reclaimed and refined is purchased and used to manufacture the next generation of automotive
and industrial batteries. Recycled lead products are also used for sporting goods equipment, x
ray shielding, pipes and cable sheaths, roofing materials, back-up electrical power, and much
2
more. With the growing demand of lead, the company is seeing a dramatic increase in sales
which demands the need to accelerate production in such a way so that there is minimal of waste
and increased flow with ease thereby increasing throughput.
The company manufactures several product families. This research is focused on the
product family of soft lead pigs that comprises 65% of the total demand. XYZ Company adopts
the traditional concept ofmass production in batches where the product is produced in full
capacity despite the quantity ofproduct ordered. This creates high level of inventory, long lead
time and a reduction of available floor space.
Statement ofthe Problem
XYZ is a manufacturing company that recycles used automotive lead-acid batteries. With
the growing demand of lead- acid batteries and uses of recycled lead in other products, XYZ
Company wants to introduce and implement lean flow technologies in the company so that
customer demand can be met by increasing throughput and capacity. It presently works on the
batch processing system with longer lead time and cycle time. This has thereby led to increased
inventory and higher cost.
Purpose ofthe Study
The purpose of the study is to identify non-value added activities and waste so that it can be
gradually reduced and eliminated, compress production lead time, switch from big batches to
small batches and one-piece flow wherever it is possible in the process flow. Its ultimate aim is
to introduce lean flow in the workplace ofXYZ Company so that continuous improvement can
be made and determine adequate inventory based on customer demand.
Assumptions ofthe Study
1. The result of the study is limited to XYZ Company

3
2. All data is reliable and accurate
3. The research is limited to one product family
4. The research includes the development of current and future state map but not how to
implement the recommended process improvement.
Definition ofTerms
Batch. A mass production approach to operations in which large lots or quantities are
processed and moved to the next process despite the actual quantity needed (Rother and
Shook, 2002)
Continuous Flow. The movement of product from one manufacturing operation or
machine to another without stopping (Tapping et al. 2002)
Current state map. A chart that depicts the present day situation of a manufacturing
process or a product family.
Customer demand. The quantity ofproducts required by a customer.
Cycle time. The time that elapses from the beginning of a process or operation until its
completion.
Flow. The movement of material or information.
Future state map. A chart that suggests ways to adopt lean techniques in order to reduce
and eliminate non-value-added activities and increase throughput.
Heijunka. Balancing the amount ofwork to be done during a shift with the capacity to
complete the work.
Just-in-time production. A production paradigm which ensures right product in the right
quantity, at the right time to the customer.

4
Kanban. An inventory control card at the heart of the pull system specifying what is
needed in terms ofproduct and quantity and at the time required to achieve just-in-time
Kaizen. Small daily improvements performed by everyone in order to eliminate waste.
Lead time. The time taken by a product to be transformed from raw material to finished
goods.
Leveling. Evenly distributing the work required over a shift or a day to fulfill customer
demand.
Muda. A Japanese word for waste which means any activity that consumes resources
without creating value for the customer.
One piece flow. See continuous flow.
Product family. A group ofparts that share common equipment and processing attributes.
Pull production. A method ofproduction control in which downstream activities signal
their needs to upstream activities.
Supermarket, A system used to store a set level of finished goods inventory or work-in
progress and replenish what is pulled to fulfill internal and external customer demand.
Takt Time. The pace at which the process needs to run in order to meet customer
demand. It is calculated by dividing available production time by customer demand.
U-shaped cell. The location in V-shape ofprocessing steps for a product immediately
adjacent to each other so that parts, documents can be processed in a closely continuous
flow.
Value stream. All of the actions, both value-creating and non value-creating, required to
bring a concept to launch and from order to delivery.

5
Value Stream Mapping. A visual representation of the material and information flow of a
specific product family.
Waste (muda). Anything within a value stream that adds cost or time without adding
value.
6
Chapter II: Literature Review
This chapter gives an overview and information of lean manufacturing and value stream
mapping which would help the reader in understanding the details of the study in the later
chapters.
Definition ofLean Manufacturing
Lean manufacturing is a systematic approach to process improvement. It is based on
identifying and reducing waste coupled with continuous improvement. According to Womack,
Jones and Roos (1990), the term "lean" represents a system that utilizes fewer inputs to create
the same outputs than those created by a traditional mass production system, while increasing the
variety of finished goods for the end customer.
Lean manufacturing is also popular by the name Just-In-Time Manufacturing developed by
Toyota, the Japanese car manufacturer. This concept is now applied by diverse industries and
businesses including engineering, administration, project management, manufacturing and
administration. Lean manufacturing aims at transforming an organization into an efficient,
smoothly running, competitive and profitable organization that continues to learn and improvise.
The application oflean paves its way to reduce lead time and increase throughput by eliminating
wastes which comes in various forms.
Origin ofLean Manufacturing
No new idea springs from a void and so is the case with lean manufacturing. During the
post World War II period, Japanese manufacturers were facing the problem ofdeficiency of
materials, financial problems, and human resources (Ohno, 1988). For many decades, America
had cut costs by using the mass production system by producing fewer types of end items while

7
for the Japanese the problem was how to cut costs in order to produce small number ofmany
types of end items.
The history of lean is dated back to 1940 when German worker produced three times as
much as a Japanese worker and an American worker produced three times as much as a German
worker (0000, 1988). Therefore, the ratio ofproduction between American and Japanese work
forces was nine to one. Striving towards improvement, the Japanese leader Toyoda Kiichiro
proposed to reduce the gap with America in three years, resulting in the birth of lean
manufacturing. Eiji Toyoda and Taiichi 0000 at the Toyota Motor Company in Japan pioneered
the concept of lean production (Womack, Jones, Roos, 1991). It was originally called Kanban
and just-in-time (JIT) which are presently the techniques oflean production. Lean production
combines the advantages ofboth craft and mass production. It avoids the high cost ofthe former
and the rigidity ofthe latter. It strives in attaining perfection; continually declining costs, zero
defects, zero inventories, and endless product variety which is an endless quest.
Value- Added and Non-Value Added
Contrary to the conventional business view, all value is defined from the point ofview of
the customer with regard to lean (Carreira, 2005). It makes to think and analyze whether the
activity directly contribute to the customer's product to make it more complete and ifthe
customer is paying for that activity or not. This, in the language of lean is known as value-added
and non-value-added activity. The former refers that the product has been physically changed
and its value to the customer has increased. The latter refers to the activity that consumes time
(people expense), material, and space (facilities expense), yet does not increase its value.
The basic idea of lean is to identify and eliminate non- value added activities from every
aspect of the business (Levinson and Rerick, 2002). Businesses are accustomed to waste so

8
identifying waste is an important aspect of lean manufacturing process. The Japanese call waste
''muda''. Hiroyuki Hirano defined waste as "everything that is not absolutely essential."(Santos,
Wysk and Torres, 2006) He also defined work as any task that adds value to the product. Waste
is a symptom rather than a root cause of the problem. The seven major forms of waste are the
following: (Tapping and Shuker, 2003)
1. The waste of overproducing: It refers to producing more than needed or producing it
ahead of time resulting in consumption of materials, people and storage faster than
required which thereby results in other kinds of waste.
2. The waste of waiting: It refers to anything such as people, paper, machines or information
that causes the workflow to stop. It is the idle time between operations.
3. The waste of over processing: It refers to redundant activities that do not add value and
the customer is not willing to pay for it.
4. The waste of inventory: It refers to excess stock of anything from raw materials to
finished goods.
5. The waste of motion: It refers to any motion that is not necessary to the successful
completion of an operation.
6. The waste of defects or correction: It refers to producing defective work that needs to be
redone which disrupts a normal process and leads to productivity losses.
7. The waste oftransport: It refers to moving something more than necessary.
Three Phases ofLean Application
Customer Demand Phase
This phase determines who the customer is, what the customer's requirements are so that
customer demands can be met (Tapping and Shuker, 2003). It requires the calculation oftakt

9
time which is derived from a German word "takt" meaning rhythm. It is the pacemaker which
determines how fast a process needs to run to meet customer demand. It is calculated by dividing
the total operating time available by the total quantity required by the customer.
Continuous Flow Phase
The heart oflean is just-in-time or continuous flow which means producing only what is
needed, when it is needed and the exact amount needed. It is characterized by the ability to
replenish a single work unit when the customer has pulled it also called "Move one, make one".
Leveling Phase
Leveling involves evenly distributing the work required to fulfill customer demand over a
period of time which could be a week, day or hour. Failure to accomplish work leveling may
lead to processing delay or waiting time.
Value Stream Management
Lean utilizes proper tools to make work flow as smooth as possible so that it reaches its end
customer (Tapping and Shuker, 2003). Value stream management is a process of planning and
linking lean initiatives through systematic data capture and analysis which consists of eight steps.
1. Commit to lean
2. Choose the Value Stream
3. Learn about Lean
4. Map the current State
5. Identify Lean Metrics
6. Map the Future State (using the demand, flow, and leveling concepts)
7. Create Kaizen Plans
8. Implement Kaizen Plans

10
Value stream Management is a systematic approach that tells people how and when to
implement improvements that aids in meeting customer demand. The tools of lean
manufacturing such as value stream mapping, supermarket, heijunka, u-shaped cells and point
kaizen workshops must be applied in a proven, structured process to attain success. The lean
management principles are of great essence to transform an organization into lean. The following
are the lean management principles:
1. Define value from the customer's view perspective.
2. Identify the value Stream
3. Eliminate the seven deadly wastes
4. Make the work flow
5. Pull work, don't push it
6. Pursue to perfection
7. Continue to improve
Value Stream Mapping
It is a tool of lean manufacturing that helps to understand the flow ofmaterial and
information as products make their way through the value stream. The value stream includes the
value adding and non-value adding activities that are required to bring a product from raw
material through delivery to the customer. In other words, value stream mapping is an outline of
a product's manufacturing life cycle that identifies each step throughout the production process.
It is a visual representation of the material and information flow of a particular product family
(Tapping et. al. 2002).
Value stream mapping is a powerful yet simple tool which allows the user to see the waste
throughout the stream (Lovelle, 2001). It consists of sketching the current and future state map.
11
The current state map charts the present flow ofmaterial and information as a product goes
through the manufacturing process. It is a simplified visual blue print that identifies value and
waste throughout the system and encourages systematic approach to eliminating waste. The
future state map is a chart that shows how to create a lean flow. It adopts lean manufacturing
techniques to eliminate waste and reduce non-value added activities to the minimum.
The goal ofValue Stream Mapping is to move from batch and push to one piece flow and
pull through the entire value stream. Introducing a lean value stream that optimizes the flow of
the entire system from information, to material, to finished goods arriving at the customer's door
is the ultimate goal. It helps in reducing lead time, inventory, and overproduction and improves
throughput, efficiency and quality. It aims at continuously improving in a capable, sustainable
manner.
Appendix A shows the various symbols for value stream mapping which would enable the
reader in understanding the current and the future state map in the later chapters.
12
Chapter III: Methodology
The objective of this study is to reduce lead time and increase throughput by identifying
non-value added activities and striving to reduce and eliminate it at XYZ Company so that
customer demand can be met. Batch processing in full capacity and bottlenecks in the production
process are key contributors to long lead times. The results of the research would have direct
impact on product lead time and inventory which would aid in reducing cost and meeting
customer demand.
The research started by taking a three day lean workshop which enhanced the understanding
of lean manufacturing and value stream mapping. Employees from XYZ Company belonging
from different departments participated in the workshop so that the mapping of the value stream
could be done smoothly. After the completion of the certification course, .a company visit at
XYZ was scheduled for three days. The research started by taking a tour of the plant and
observations were made on the shop floor and the entire plant. Then a classroom environment
was set by involving people from different departments ofXYZ Company so that further details
of the current production process could be obtained and discussed. Information regarding cycle
time, lead time, number ofoperators involved in each process, amount of inventory and work-in
progress between processes were determined. Based on the information gathered, a current state
map was drawn which depicts process flow, product flow, information flow and communication
flow. Takt time and cycle time are also calculated. Besides, the inventory between each process
is also determined. The data is then analyzed to see what areas need improvement by identifying
non-value added activities that can be reduced and eliminated. Thereafter, the current state map
is expanded into future state map followed by further discussions and analysis. Lean techniques
are suggested for improvising the product flow, communication flow and information flow.
13
Eventually the benefits oflean manufacturing techniques are projected and savings in lead time
calculated. The current state map would then be used as a guideline for improvement that can be
made. A final presentation is made to XYZ Company demonstrating the areas of improvement
required and the positive impact and benefits the company would have by implementing them. A
need for change management and employee involvement is also brought to their attention.
Subject selection and description
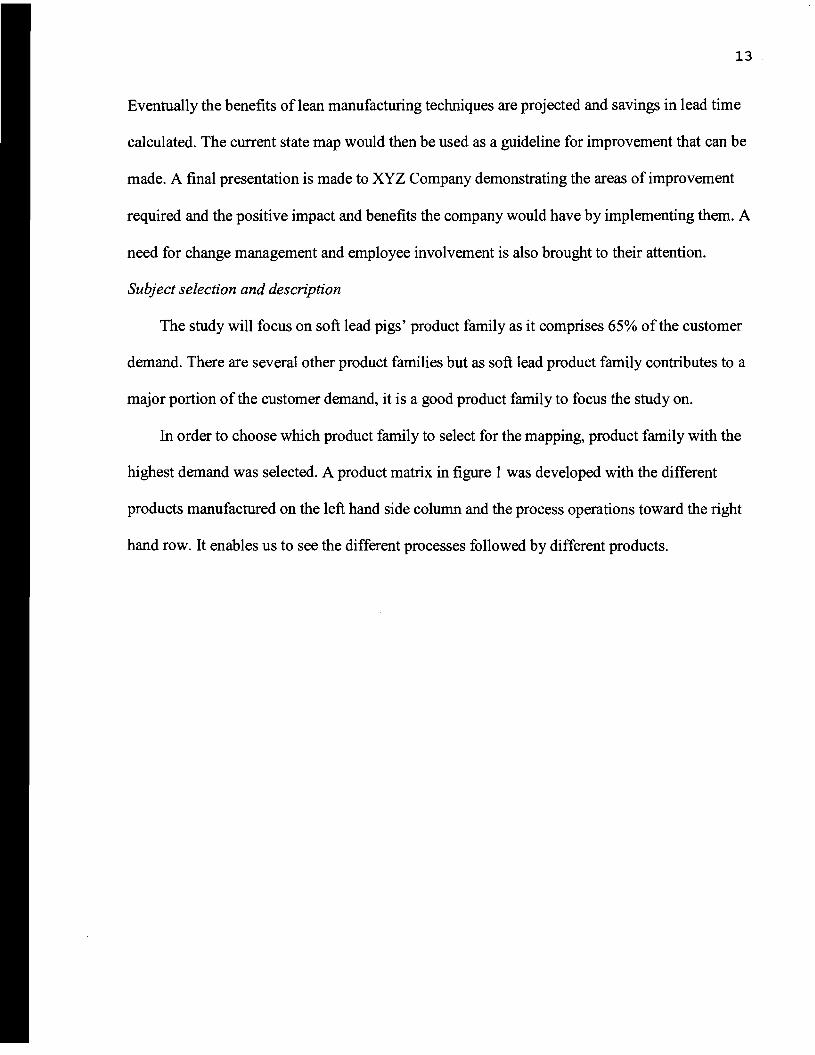
The study will focus on soft lead pigs' product family as it comprises 65% of the customer
demand. There are several other product families but as soft lead product family contributes to a
major portion of the customer demand, it is a good product family to focus the study on.
In order to choose which product family to select for the mapping, product family with the
highest demand was selected. A product matrix in figure 1 was developed with the different
products manufactured on the left hand side column and the process operations toward the right
hand row. It enables us to see the different processes followed by different products.
14
Figure 1: Product Matrix ofXYZ Company
Product Rcv'g RMPC Reverb Blast MTR PI P2 P3 P4 P5 P6 P7 P8 P9 Pig Cst'z Bill Cst'z BIk Cst'g Cooling
PIGs X
FI40 X X X X X X X X X X
GU3 X X X X X X X X X X
CORRODING PIG X X X X X X X X X X X
PB3 X X X X X X X X X X
P4 X X X X X X X X X X X
1.5% LARGE BILLETS X X X X X X X
0% LARGE BILLETS X X X X X X X
10% LARGE BILLETS X X X X X X X
SMALL BILLET X X X X X X
BOLCKS
P3 X X X X X X X X X X X
Corroding block X X X X X X X X X X X X
RED = BASE KETTLES
5,6,9 BASE ONLY-PUMB
7&8 CASTING KETTLES
PIG CASTING 4.5 HRS/POT
CLK CASTING 4 HRS/POT

15
Instrumentation
Value Stream Mapping was used as a tool to map the process and depict the scenario with
the aim of reducing lead time and increase throughput. The main source used to create the maps
was the book Value Stream Mapping Workshop (Rother and Shook, 2002). Besides, the three
day lean certification workshop and the knowledge gained from the books related to value stream
mapping provided the tools to create useful and informative maps.
Data Collection Procedures
In order to collect the data to draw the current and future value stream map a classroom
environment was set with employees from all areas of the company. Data was obtained from the
respective departments as the value stream map was drawn. Plant tour with the company officials
was done prior to the classroom discussion so that the researcher could have a clear
understanding of the process and the entire scenario. Active participation in discussions with
employees and correct information being disseminated assisted in drawing an accurate value
stream map for the company. The figures 2 and 3 below shows the information collected which
facilitated in drawing the current state map.
Figure 2: Metrics for each Process
Process Operators Cycle Time(hours) Uptime
Raw Material Processing Centre
(RMPC)
Reverb Furnace
Refining
Casting
Cooling
Shipping
Total
9 4.3 90%
3 6.8 90%
3 36 98%
3 4.5 90%
2 - -2 2.2 -22 53.8 71%
16
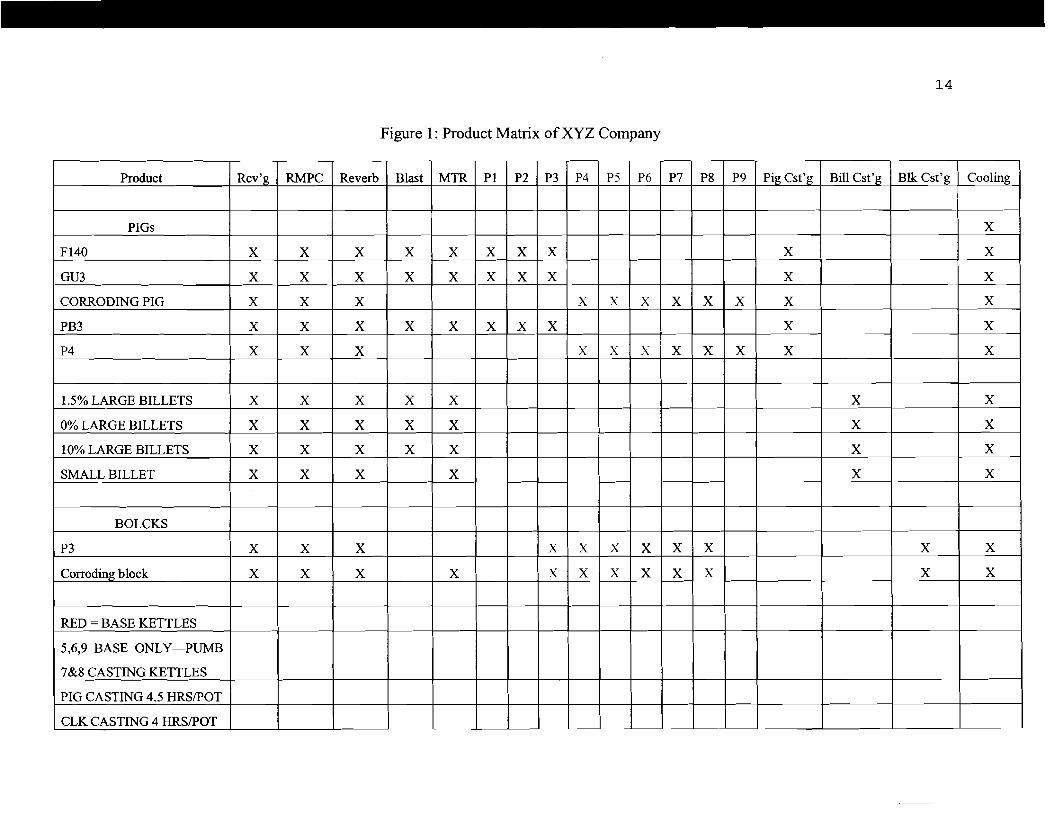
Figure 3: Work-In-Progress (WIP) Between Processes
Process Quantity Quantity WIP in Days
Produced Required per (Columnl/Column2)
(pounds) Day
(1) (Pounds) (2)
Between - - -Receiving &
RMPC
Between RMPC & 6750000 685000 9.85
Reverb Furnace
Between Reverb 271600 28000 9.7 Fumace& Refining
Between Refining - - -& Casting I
Between Casting - - -& Cooling
Between Cooling 6150000 685000 8.9 & Shipping
Total 28.45
From the data and information retrieved from the above tables and discussions from the
leads of different departments, current state map with material flow, communication flow and
information flow was drawn to show the process of soft lead pigs from the point it was ordered
until delivered to the end customer. The last step was to analyze the current state map and
suggest lean techniques for possible improvements in order to reduce lead time and increase
throughput.
Data Analysis
Mapping the value stream always starts with the customer demand. With the product
family, soft lead pigs, specified for the mapping, a product matrix (figurel) was made which
helps see what family of products follow the same manufacturing process. Figure 2 and 3 aids in
17
the proper and accurate mapping of the current state map. An understanding of the value stream
mapping is enabled with the help ofvalue stream symbols and definitions in appendix A. Figure
4 below is the current state map followed by a detailed explanation.

---
18
Figure 4. XYZ Current State Map Soft Lead Pigs
Cu.uxnerDemand: 250MM rbsJYf
685KI<lay 28.5Kfhr.
PO's 3.7 24)OK:b POl:s per 08); (laJrt T",. 3ag";nutes)
6SIn. Product MIX Demand:
~I~ets;~.i 6-.:33%
_ No",xed 'oads
Custaners
6.9da~
,
I CoclJnLJ•.....~ ... r ..
.v.:\
02
ITotal CJT =4.5 m·1 12 ""·1 Uptime·!lO%
DailyCO's
\
......~
03
ffi
D.0542 days
44K lb. loads
-........ Daly COs --~ ---- =-----.; V. 'M<r; Rcv'g S~
11DbucllstNeekeqUv.Deir;Junk [)e,. ------.ffi Sched.Misc. RawMaterial
Lead Time =30.7 da~
Processing Time· 53.8 In
XYZCO. INC. Soft Lead Pigs.
Preliminary Current State

19
As shown in the current state map above in figure 4, the focal point of all information
gathering and dissemination is the production control point. The focus of study for the value
stream mapping is soft lead pigs. Daily, weekly, monthly and annual orders are taken by
customer service and entered in the ERP System. Thereafter, information is sent to the receiving
department as how much raw material, junk batteries need to be delivered at the receiving area.
The production control also lets the supplier know on how much raw material is required soon
after the order is taken. One interesting factor to be noted is that the company receives the raw
material ofjunk batteries at the will of its customers and also buys them from other suppliers. As
it has no control over the amount ofjunk batteries it will receive from its customers there are
times when the inventory for raw material is high. This is a big issue that that the company is
facing currently. There is not a proper scheduled flow ofjunk batteries from sources. When the
daily junk delivery schedule is obtained from the customer it is sent to the receiving department.
Due to lack ofproper flow ofraw material, there is non-value added activity between receiving
and raw material processing centre (RMPC). Thereafter, the processed raw material is taken to
the reverb furnace where all the solids and metal is converted into molten state. Then the metal
from the reverb furnace is refined in kettles where the content of trace element is adjusted to
produce the desired alloy. Common products are soft lead and various alloys ofhard lead. This is
sent for casting into pigs, billets and slugs and left for cooling. Then, the product is ready for
shipping.
Once the orders are received from the customers, it is entered into the ERP system. It is
determined that the demand for soft lead pigs is 65% which is 250000000 pounds per year,
685000 per day, and 28500 per hour. Takt time is 389 minutes or 6.5 hours which is calculated
by dividing the available production time 24 hours (1440 minutes) by total daily quantity

20
required (3.7*200000 pounds pots per day). The total available production time per shift is 8
hours (480 minutes). Two 15 minutes break and one 15 minutes lunch is not taken into
consideration as everyone does not take break at the same time and there are operators available
for service. Thereafter, the production control places the raw material order to the suppliers of
junk batteries. The supply ofjunk batteries is at the will of the customer for which it sends a
weekly or daily schedule to the receiving department. Each day, there are 32 trucks with raw
material coming into the company. Each truck carries 44000 pounds ofjunk batteries from which
only 50% oflead is obtained. It is recorded that the non value added activity is 1.3 hours.
The junk batteries are then transferred to the raw material processing centre where the cycle
time is 4.3 hours and an uptime of 90% with nine operators working per shift. The cycle time is
calculated by dividing 190000 pounds of lead divided by 44000 lead per hour. There is an
inventory equivalent of9.85 days which is calculated by total quantity oflead which is 6750000
pounds divided by the quantity oflead required per day which is 685000 pounds. Thereafter, the
processed raw material is sent to the reverb furnace to convert into molten state. The cycle time
is 6.8 hours which is derived by dividing total quantity ofmolten metal used which is 190000
pounds by the quantity required per hour which is 28000 pounds of lead. The number of
operators in the process is 3. The total cycle time is 6.8 hours with an uptime of90%. The WIP
inventory of slugs after the reverb furnace is worth of 9.7 days. It is calculated by dividing the
total quantity ofmolten metal which is 271600 pounds divided by 28000 pounds ofmolten metal
required per day. Thereafter, the molten metal is refined in kettles. The cycle time is 36 hours
with an uptime of98% with 3 operators. Then it is cast into soft lead pigs for which the cycle
time is 4.5 hours with an uptime of 90%. Then it is left for cooling which takes 2 hours with the
involvement of 2 operators. It is observed that the total of inventory of soft lead pigs at the end of

21
the process is worth of 8.9 days. This implies it produces 6150000 pounds of finished product
while the quantity required per day is only 685000 pounds. Dividing the quantity produced per
day (615000 pounds) by the quantity required per day (685000 pounds) gives the finished
product inventory of 8.9 days. Each truck has a capacity to accommodate 44000 pounds of soft
lead for which the cycle time is 2.2 hours with 2 operators involved. The shipping department
receives the shipping schedule from the production control department based on which it delivers
the finished product to the end customer. The above process described encompasses the material
flow, information flow and the communication flow between the various departments.
After the completion of drawing the current value stream map for the product family of soft
lead pigs; it is observed that the lead time for the entire process is 30.7 days whereas the
processing time required is just 53.8 hours. The total lead time is derived by adding up the cycle
time for each process and the work-in-progress inventory. The total processing time is the sum
total ofonly the time taken in each process. The current map shows the actual value added time
is 53.8 hours which is the sum total of the cycle time of each process (4.3+6.8+36+4.5+2.2
hours). The cumulative uptime is the product of all uptime (90%*90%*98%*90%) which is
71%. Value stream work-in-progress in days is the sum total of all the work-in-progress which is
28.45 days.
The current state map was drawn with the help of information collected from XYZ
Company. With the information collected, a clear understanding of the entire manufacturing
process is depicted for the soft lead pigs' product family. Now, areas associated with non-value
added activities can be traced and waste identified so that avenues of improvement can be seen
clearly and suggestions recommended accordingly for a leaner XYZ company in the following
chapter.

22
Chapter IV: Results
Introduction
The purpose of the study has been to use the pen and paper technique of developing a value
stream map for XYZ Company for soft lead pigs' product family. It thereafter aims in
accomplishing the task of identifying the wastes in the value stream and striving towards
reducing lead time and increasing throughput. The next step of this research study is to observe
the current state map, make recommendations and draw a future state map for the same product
family. This tool oflean manufacturing enables the researcher to document the lead time, cycle
time, work-in-progress and the uptime for each process individually. It helps to determine the
ratio ofvalue added to total lead time.
March I" through 3rd of 2006 was scheduled for the research work. A classroom
environment was set for the study with the participation of leads from all departments. Data and
information for the research was collected through observation during the plant tour and from the
information supplied from the respective departments leads. Active participation
and involvement from the team ofXYZ Company throughout the research work led
to sketching an accurate current state map. This would further enable the researcher
in understanding the movement ofmaterial and information along the value stream, identify and
eliminate wastes and assist in developing a future state map for a vision of ideal value flow for
the selected product family.

23
Analysis ofthe Current State Map
It has been analyzed on the current state map that only 53.8 hours is the processing time
while it takes 30.7 days for the product to be transformed from raw material to finished goods till
it reaches the end customers. The ratio ofvalue added to non-value added activity is lower. The
basic reason behind low rate of value added activity is due to its mode ofproduction. Despite the
quantity ofproduct ordered, production continues in batch mode with the utilization ofmaximum
capacity. The company adopts the traditional concept ofmass production where production in
full capacity leads to low cost and ignores the benefits oflean manufacturing where there are
several hidden wastes and non-value activities which when identified can reduce cost, increase
throughput and eliminate waste. For example, ifthereis a customer demand for 200 blocks of
soft lead pigs, production would still be carried for 314 blocks as this would save the down time
of cleaning up time for kettles, setting up for another product family, cost related with energy
consumption. It ignores the fact that lead time increases and customer demand can be delayed
accompanied by several other factors ofaccumulating inventory, more work force required for
its management and handling, and inefficient use of floor space.
Another serious issue with the value stream is that the raw material is delivered to the
company at the will of the customers. Besides, the quantity to be received is not prescheduled.
Therefore, there are variations in the inflow of raw material resulting in excess of inventory
which is stored at any available floor space. There is no determined floor space allotted for the
raw materials. This leads to waste ofmotion and time in finding the right material at the right
time.
The receiving department has a non-value added activity of 1.3 hours; the reason behind it
being lack of level flow ofjunk batteries from sources. Due to this, the receiving section needs to

24
upload and download the junk: batteries to the RMPC which could be done immediately if the
schedule for the incoming material was planned.
The reverb furnace is a bottleneck for the following process of refining and casting. The
capacity of the reverb furnace is low due to which there is WIP worth of9.85 days piled up
before it. It is also observed that there is WIP of9.7 days before refining. There is a low or
improper supply oflead for refining which leads to the accumulation of smelted metal and
proves to be a hindrance in the smooth production flow. The other reason for high accumulation
of inventory is the method ofproduction in large batch sizes. At times, there is breakdown of
machinery due to which the entire process needs to be stopped. A critical need of total preventive
maintenance (TPM) is required so that the down time due to machinery failure does not come in
the way ofproduction.
After casting, the product is left for cooling. The excess inventory is stored at any available
floor space due to inefficient inventory management and floor space. There is waste of time in
handling material from one point to another. There is no organized method ofproduct leveling as
per demand.
On the information flow front, communication and information flow is smooth and on
timely manner. The only problem that is seen is that the purchasing department needs to closely
look at the inflow ofjunk batteries and negotiate on setting up a standard schedule of receiving
it. Slight fluctuations are negligible but prior notice few days before its arrival can be of good
help.
From the human factor side, it is observed that there is high employee turnover. Due to this,
there are new workforces entering the production floor who may not be very well versed in the
25
job as the existing employees. It adds to extra cost and time to get the new ones acquainted to the
job which poses a hindrance in efficiency.
Continuous improvement is what XYZ Company seeks for and always strives for
development which is a never ending quest. The observations during the tour, discussions and
participation while depicting the current state map made the researcher identify several areas
where improvement could be made. The future state map in the next paragraph would discuss on
what areas and how improvements can be made.
Future State Map
The future state map is a visionary map drawn to propose suggestions and recommendations
for an ideal value flow. Several lean manufacturing techniques are adopted to reduce lead time
and increase throughput. With the aim of continuous improvement, XYZ Company is suggested
to level the flow ofjunk batteries from sources so that raw material inventory can be managed in
an efficient way. It is also suggested that the three processes, the reverb furnace, refining and
casting departments should be combined together as a group of processes so that continuous flow
with small batch sizes can be achieved without any hindrance. As the reverb furnace has a low
capacity and is a major constraint in the process flow, it is suggested to have another reverb
furnace so that the WIP inventory before it can be reduced to some extent and accumulation
reduced. Allocation of space for an additional reverb furnace would not pose a problem at all.
With an additional furnace and a supermarket for refining material before the refining process,
the work-in-progress would be completely vanished and the process would flow without
stopping. The purpose is to move a small batch from one process to another without stopping.
The other thing to be brought into practice is total preventive maintenance (TPM) where the
operators should be trained on handling the equipment and fixing it ifminor problems arise. This

26
requires cross training so that any operator is well versed or capable of doing the others job in his
or her absence. The benefit of cross training is that the operator does not need to wait for another
person to carry on the work and promote continuous flow. It helps eliminate WIP which would
otherwise lead to WIP creation. This would lead to efficient use of available floor space and
better visibility while working.
It is also suggested to have a pull system between the casting and shipping department with
an electronic supermarket. Casting and cooling would be carried out simultaneously and then
moved to the warehouse. An inventory worth of 6 days is estimated to be stored in order to meet
customer demand as and when required. The shipping department would pull the quantity
required based on daily and weekly customer orders. This would automatically be replenished as
information would be updated instantly.
As there is no proper organization of what is stored where, the consequence faced is an
increase in material handling distance. In order to minimize this issue, 5S event needs to be
started which is a Japanese concept meaning, a process of creating workplace cleanliness and
organization. The 5S stand for Sort (Organization), Set in order (Orderliness), Shine
(Cleanliness), Standardize (Standardized Clean-up), Sustain (Discipline). This needs to be
strictly followed so that the following benefits can be achieved.
1. Thoroughly eliminate waste due to excess inventory.
2. Reduce space requirements.
3. Adopt better storage methods.
4. Adhere to strict deadlines and on time delivery.
5. Reduce the cost of 4M's- Man, Material, Machines, and Methods.
6. Reduce wastage oftime looking for merchandise.
27
7. Improve and maintain neat and clean warehouses leading to enhanced customer trust
resulting in reduced defective products.
8. Improve safety and communication.
9. Increase compliance with process and procedures.
10. Boost morale by creating a pleasant workplace.
It is also brought to the company's attention that the employee retention needs to be
improved. Human factor is the only active factor ofproduction without which no other factors of
production will work. The efficiency of existing, experienced workforce is higher than the new
ones. Time and cost of training new employees will be saved.
The future state map below, also in Figure 5 shows all the areas that need improvement and
the ways it can be improved. If all the suggestions are implemented gradually in an incremental
way then the lead time for the soft lead pigs' product family will be 412 hours which is 18.04
days. The processing time is 45.5 hours. The processing time is reduced by 15.43%. It is
therefore analyzed that there is a reduction of41.23% in production lead time and 15.43% in
processing time. It can be concluded that implementing the above stated lean techniques would
reduce the lead time to a large extent and smoothen production flow. The hidden waste,
inventory would be reduced an eliminated.
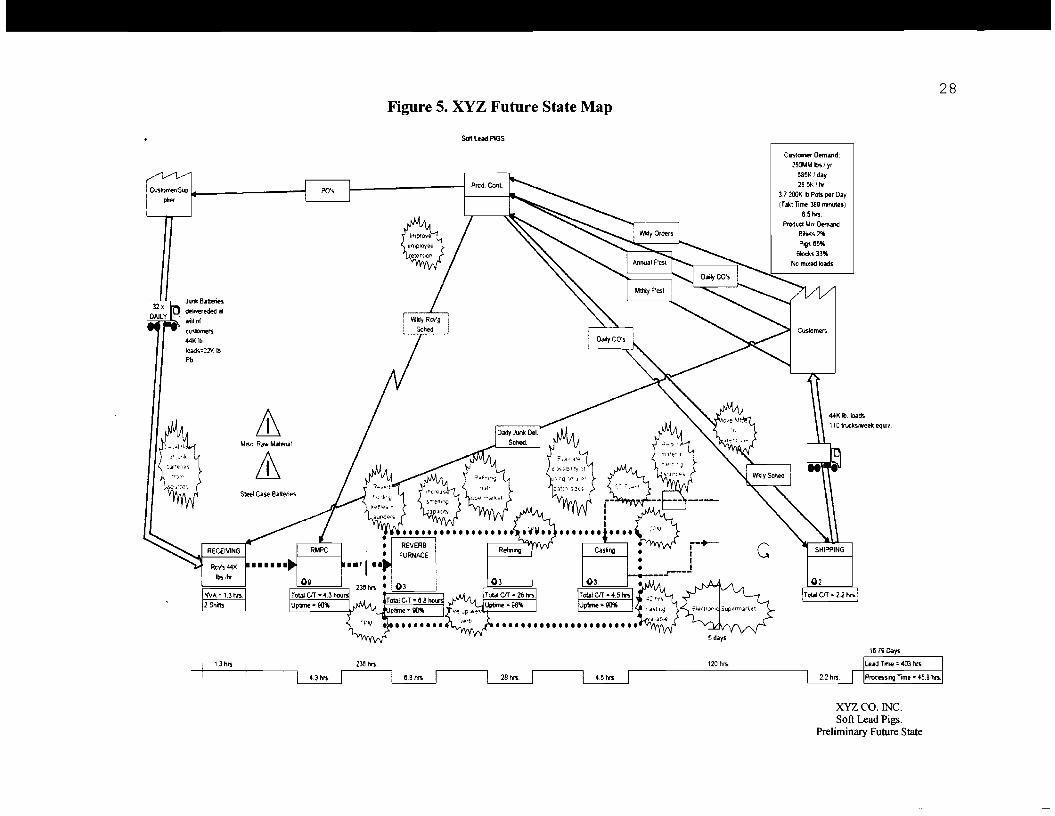
28 Figure 5. XYZ Future State Map
SaIllNd PIGS
C"',,;:,suo~ PO',1L __--'
Cuslo"", Demand: 2~OMM bslyr
1l85K I day
285Klhr 3.7 200K lbPots perDiY (ToklTime:lllgminute.)
6.5hrs. Product MlkDemand
32, DAILY
Junk B,iltl:tOes
delM!rede<l at wiU of
customers 44KIb loads:22Klb Pb
& MISC, Raw Matton.l
& Steel Cue B,ildeties
NVA~ 1.3 hr>. 2 Shilb
5d,ilYs
120hrs.
Billets:24l6 F'lgs.65'11
Bloch 33%
NomlX@dloads
02 ITotoJ CIT, 2.2 hr>1
16.79 Doy>
LeadTime~ 403tes.
Proc..~ng lome~ 45.8hrs.
XYZCO. INC. Soft Lead Pigs.
Preliminary Future State

29
Chapter V: Discussion
Introduction
A value stream includes all activities required to transform a product from raw material into
the finished goods. Value Stream Mapping scrutinizes business processes from beginning to end
and a visual representation map is drawn of every process involved in the material and
information flows. Then a future state map is drawn to show how things should work for best
competitive advantage. Value Stream Mapping helps to identify the current flow ofmaterial and
information in processes for a family ofproducts, highlighting the opportunities for improvement
that will most significantly impact the overall production system.
The purpose of this study was to develop a value stream map for a manufacturing XYZ
Company in Minnesota. The goal was to identify and eliminate waste which is any activity that
does not add value to the final product in the production process. It also aimed at reducing lead
time and increasing throughput of soft lead pigs' product family through the use ofvalue stream
mapping. A current state map was created to understand the process flow, information flow,
document lead time, cycle time and inventory levels. The current state map was also a good tool
to identify the wastes in the process. The future state map was developed based on the current
map which showed the avenues where improvements could be made. Lean manufacturing
techniques were used to create the map that would reduce lead time and increase throughput.
Value stream mapping is an excellent tool to analyze the manufacturing process, identify the
areas ofwaste and suggest ways for potential improvement.

30
Conclusions
It was observed from the current state map that the lead processing time for a product is
53.8 hours whereas the lead time is 30.7 days. The difference between the lead time and the
processing time gives the non-value added time. This clearly shows that there is an enormous
amount ofnon-value-added activities in the process flow which is in the form of waiting for
materials, moving materials and setting-up time, WIP and piled up inventory.
The mode ofproduction is in large batch sizes. The reverb furnace poses to be a bottleneck
which leads to WIP accumulation. It is also a hindrance in the smooth production flow. Overall,
it leads to reduced throughput.
The work-in-progress inventory is worth 19.55 days which is 63.68%. This shows that the
company has enough stock ofwork-in-progress inventory to back up customer demand during
lead time. At the same time it also conveys that a lot of fund is tied up in this inventory which
could be used for other purpose.
There is high employee turnover which conveys that sometimes there are times when
enough operators are not there for a particular process which leads to delay in the operation. It
also leads to reduced efficiency as new operators take charge of the operation.
Many times the work centre does not run due to mechanical problems and poor
maintenance.
The place seems to be disorganized when it comes to storing raw materials, work-in
progress and finished product. There is no specific place for a particular item. Floor space is not
efficiently used.

31
In the future state map, there are no changes made in the number ofoperators working
neither are they expected to work harder and faster. The procedures and layouts are changed
emphasizing on smaller batch sizes to allow smooth flow ofproduction.
Recommendations
The goal of this research was to create the current state map and the future state map so that
the aim of reducing lead time and throughput is achieved.
In order to have a smooth flow ofmanufacturing process, the reverb furnace, refining and
casting needs to be combined together as a group ofprocesses. This would promote small size
batch production in a continuous manner. All the work in progress between the processes will be
eliminated.
The flow ofjunk batteries from sources needs to be leveled so that there is neither excess
nor low level of raw materials at stock.
The reverb furnace has a low capacity for smelting which is considered a bottleneck in the
flow, an additional investment in another reverb furnace is recommended so that throughput can
be increased.
Refining material supermarket is suggested before the refining process so that material can
be pulled when required through the pull kanban system and automatically be replenished
In order to avoid unplanned machinery downtime, Total Preventive Maintenance (TPM) is
suggested to be implemented. It increases efficiency and useful life of the equipment. It also
involves the operator to take care of the work centre, maintain it and report ifdamages occur.
58 event is suggested to be initiated and implemented so that there is workplace
standardization and organization. The finished product storing areas and the warehouse needs
immediate attention.
32
An electronic supermarket worth of 6 days inventory with a pull system is recommended
after the casting process so that product can be shipped based on customers' demand and
production scheduled for immediate replenislunent.
Another recommendation is to reduce material handling distances which lead to waste of
time and labor.
The company is recommended to improve on employee retention.
The goal of this research was to study the manufacturing process ofXYZ Company for the
family product of soft lead pigs. The research was conducted successfully and current and future
state map developed. It served as a significant tool in identifying wastes, documenting details of
the operation and proposing recommendation for potential improvement. It is hoped that XYZ
Company implements the recommendations and the results obtained henceforth is successful as
planned and expected.

33
References
Carreira, B. (2005). Lean manufacturing that works: Powerful tools for dramatically reducing
waste and maximizing profits. New York: Amacom
Levinson, W., & Rerick, R. (2002). Lean enterprise: A synergistic approach to minimizing waste.
Milwaukee, WI: ASQ Quality Press.
Lovelle, J. (2001). Mapping the value stream, lIE Solutions.
Ohno, T. (1988). Toyota production system: Beyond large-scale production. Cambridge,
MA: Productivity Press.
Rother, M. & Shook, 1. (2002). Value Stream mapping workshop. Brookline, MA: Lean Enterprise
Institute
Santos, 1., Wysk, AR., Torres, MJ. (2006). Improving production with lean thinking. Hoboken,
New Jersey: John Wiley & Sons, Inc.
Tapping, D., Luyster, T., & Shuker, T. (2002). Value stream management: Eight steps to planning,
mapping, and sustaining lean improvements. New York, NY: Productivity Press.
Tapping, D., & Shuker, T. (2003). Value stream management/or the lean office: Eight steps to
planning, mapping, and sustaining lean improvements in administrative areas. New York,
NY: Productivity Press.
Value stream mapping symbols. (n. d.).Retrieved January 29,2007 from
http://www.strategosinc.com/value-stream-mapping-3.htm
Womack, J., & Jones, D. (1996). Lean thinking: Banish waste and create wealth in your corporation.
New York, NY: Simon & Schuster.
Womack, P.J., Jones, TD., Roos, D. (1991). The machine that changed the world: The story of
lean production. New York, NY: Harper Perennial

34
Appendix A
Value Stream Process symbols
~ Customerl Supplier
This icon represents the Supplier when in the upper left, the usual starting point for material flow. The customer is represented when placed in the upper right, the usual end point for material flow.
- - -
Iprocessl
This icon is a process, operation, machine or department, through which material flows. Typically, to avoid unwieldy mapping of every single processing step, it represents one department with a continuous, internal fixed flow path.
Dedicated Process
In the case of assembly with several connected workstations, even if some WIP inventory accumulates between machines (or stations), the entire line would show as a single box. If there are separate operations, where one is disconnected from the next, inventory between and batch transfers, then use multiple boxes.
fW~ Shared Process
This is a process operation, department or work center that other value stream families share. Estimate the number of operators required for the Value Stream being mapped, not the number of operators required for processing all products.
This icon goes under other icons that have significant information/data required for analyzing and observing the system. Typical information placed in a Data Box underneath FACTORY icons is the frequency of shipping during any shift, material handling information, transfer batch size, demand quantity per period, etc.
Typical information in a Data Box underneath MANUFACTURING
PROCESS icons: • CIT (Cycle Time) - time (in seconds) that elapses between one part coming off the process to the next part
~ IIQI = Data Box
coming off, • C/O (Changeover Time) - time to switch from
producing one product on the process to another. Uptime-
percentage time that the machine is available for processing. EPE (a measure of production rate/s) - Acronym stands for "Every Part
Every_".• Number of operators - use OPERATOR icon inside
process boxes. Number of product variations. Available
Capacity. Scrap rate. Transfer batch size (based on process
batch size and material transfer rate)
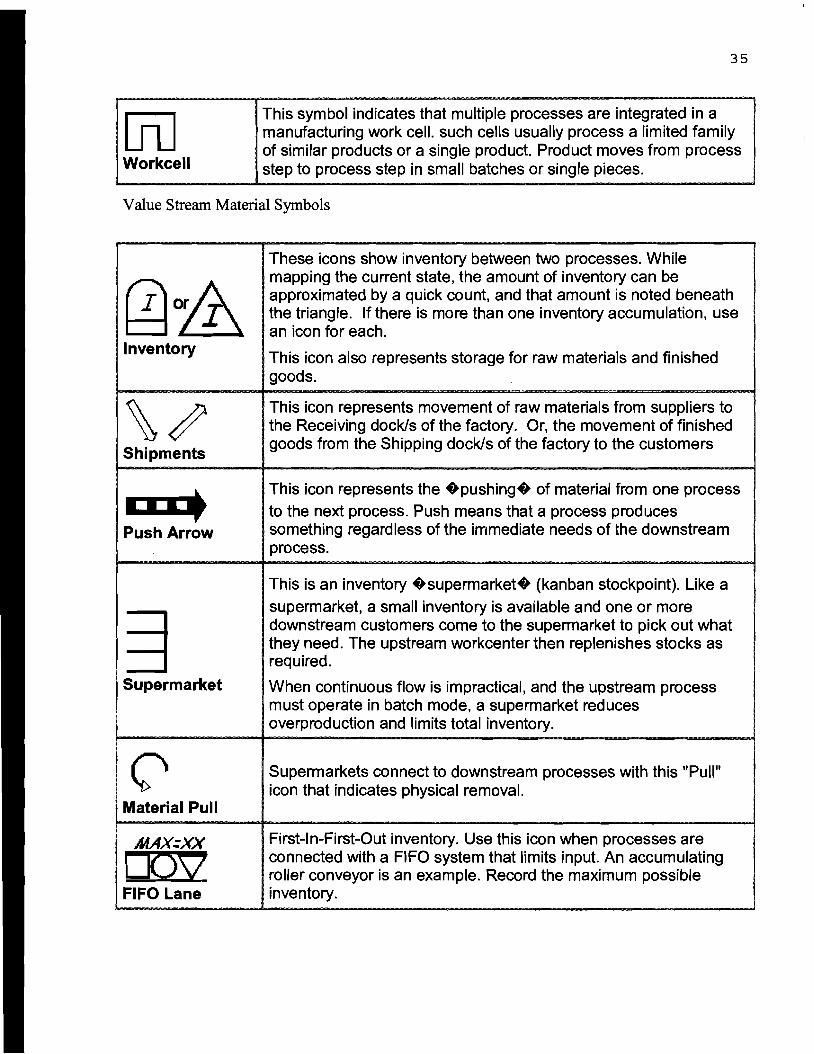
35
Workcell
This symbol indicates that multiple processes are integrated in a manufacturing work cell. such cells usually process a limited family of similar products or a single product. Product moves from process step to process step in small batches or single pieces.
Value Stream Material Symbols
~~ Inventory
These icons show inventory between two processes. While mapping the current state, the amount of inventory can be approximated by a quick count, and that amount is noted beneath the triangle. If there is more than one inventory accumulation, use an icon for each.
This icon also represents storage for raw materials and finished goods.
\~ Shipments
This icon represents movement of raw materials from suppliers to the Receiving dock/s of the factory. Or, the movement of finished goods from the Shipping dock/s of the factory to the customers
~ Push Arrow
This icon represents the +pushing+ of material from one process to the next process. Push means that a process produces something regardless of the immediate needs of the downstream process.
~ Supermarket
This is an inventory +supermarket+ (kanban stockpoint). like a
supermarket, a small inventory is available and one or more downstream customers come to the supermarket to pick out what they need. The upstream workcenter then replenishes stocks as required.
When continuous flow is impractical, and the upstream process must operate in batch mode, a supermarket reduces overproduction and limits total inventory.
(' Material Pull
Supermarkets connect to downstream processes with this "Pull" icon that indicates physical removal.
MAX=XX
DOv First-In-First-Out inventory. Use this icon when processes are connected with a FIFO system that limits input. An accumulating roller conveyor is an example. Record the maximum possible inventory.FIFO Lane

36
§ Safety Stock
l; ~ External Shipment
This icon represents an inventory +hedge+ (or safety stock)
against problems such as downtime, to protect the system against sudden fluctuations in customer orders or system failures. Notice that the icon is closed on all sides. It is intended as a temporary, not a permanent storage of stock; thus; there should be a clearly-stated management policy on when such inventory should be used.
Shipments from suppliers or to customers using external transport.
Value Stream Information Symbols
Iproduction Control This box represents a central production scheduling or control
Production department, person or operation.
Control
~ Manual Info
A straight, thin arrow shows general flow of information from memos, reports, or conversation. Frequency and other notes may be relevant.
~ Electronic Info
;-"Q:I""' Production Kanban
This wiggle arrow represents electronic flow such as electronic data interchange (EDI), the Internet, Intranets, LANs (local area network), WANs (wide area network). You may indicate the frequency of information/data interchange, the type of media used ex. fax, phone, etc. and the type of data exchanged.
This icon triggers production of a pre-defined number of parts. It signals a supplying process to provide parts to a downstream process.
~..~...
Withdrawal Kanban
This icon represents a card or device that instructs a material handler to transfer parts from a supermarket to the receiving process. The material handler (or operator) goes to the supermarket and withdraws the necessary items.
;W··· Signal Kanban
This icon is used whenever the on-hand inventory levels in the supermarket between two processes drops to a trigger or minimum point. When a Triangle Kanban arrives at a supplying process, it signals a changeover and production of a predetermined batch size

37
of the part noted on the Kanban. It is also referred as .one-per
batch. kanban.
LJ Kanban Post
A location where kanban signals reside for pickup. Often used with two-card systems to exchange withdrawal and production kanban.
@ Sequenced Pull
This icon represents a pull system that gives instruction to subassembly processes to produce a predetermined type and quantity of product, typically one unit, without using a supermarket.
This icon is a tool to batch kanbans in order to level the production volume and mix over a period of time
XOXO Load Leveling
LJ MRP/ERP
Scheduling using MRP/ERP or other centralized systems.
tOf(:J Go See
Gathering of information through visual means.
:!Verbal Information
This icon represents verbal or personal information flow.
Value Stream General Symbols
QKaizen Burst
These icons are used to highlight improvement needs and plan kaizen workshops at specific processes that are critical to achieving the Future State Map of the value stream.
6' Operator
This icon represents an operator. It shows the number of operators required to process the VSM family at a particular workstation.
Otnu ~n fOl'Mat ion
Other Other useful or potentially useful information.

38
VA VA The timeline shows value added times (Cycle Times) and non-value ~ added (wait) times. Use this to calculate Lead Time and Total Cycle Timeline Time.