valueguide july12 cover final - rakesh...
TRANSCRIPT


July 2012 Sharekhan ValueGuide2

Sharekhan ValueGuide July 20123
CONTENTS
Many a times, the equitymarkets tend to moveagainst the prevailingconsensus wisdom andconsequently catchmost market participantsby surprise. Just whenthe expectations had hita nadir and equities were threatening to tumble down to new yearly lowstowards the end of 2011, the Indian equity market had surged with anunexpected sharp rally at the beginning of the new year. This time aroundalso, the equity markets climbed the wall of worries to register smartgains in the month of June.
REGULAR FEATURES
Report Card 4
Earnings Guide I
TECHNICALS
Sensex 29
Stock Updates 18Sharekhan Special 25Sector Updates 27Viewpoint 28
From Sharekhan’s Desk EQUITY
06
Markets never fail to surprise FUNDAMENTALS
DERIVATIVES
View 30
TECHNICALS
Crude Oil 31Gold 32Silver 32
FUNDAMENTALSCopper 32Lead 32Zinc 33
Gold 34Silver 34Crude Oil 34
Copper 35Natural Gas 35Nickel 35
TECHNICALS
FUNDAMENTALS
USD-INR 37EUR-INR 37
GBP-INR 37JPY-INR 37
disclaimerDISCLAIMER: “This document has been prepared by Sharekhan Ltd.(SHAREKHAN) This Document is subject to changes without prior notice and is intended only for the person or entity to which it is addressed to and maycontain confidential and/or privileged material and is not for any type of circulation. Any review, retransmission, or any other use is prohibited. Kindly note that this document does not constitute an offer or solicitation for thepurchase or sale of any financial instrument or as an official confirmation of any transaction. Though disseminated to all the customers simultaneously, not all customers may receive this report at the same time. SHAREKHANwill not treat recipients as customers by virtue of their receiving this report. The information contained herein is from publicly available data or other sources believed to be reliable. While we would endeavour to update theinformation herein on reasonable basis, SHAREKHAN, its subsidiaries and associated companies, their directors and employees (“SHAREKHAN and affiliates”) are under no obligation to update or keep the information current.Also, there may be regulatory, compliance, or other reasons that may prevent SHAREKHAN and affiliates from doing so. We do not represent that information contained herein is accurate or complete and it should not be reliedupon as such. This document is prepared for assistance only and is not intended to be and must not alone betaken as the basis for an investment decision. The user assumes the entire risk of any use made of this information.Each recipient of this document should make such investigations as it deems necessary to arrive at an independent evaluation of an investment in the securities of companies referred to in this document (including the meritsand risks involved), and should consult its own advisors to determine the merits and risks of such an investment. The investment discussed or views expressed may not be suitable for all investors. We do not undertake toadvise you as to any change of our views. Affiliates of Sharekhan may have issued other reports that are inconsistent with and reach different conclusion from the information presented in this report. This report is not directedor intended for distribution to, or use by, any person or entity who is a citizen or resident of or located in any locality, state, country or other jurisdiction, where such distribution, publication, availability or use would be contraryto law, regulation or which would subject SHAREKHAN and affiliates to any registration or licensing requirement within such jurisdiction. The securities described herein may or may not be eligible for sale in all jurisdictions orto certain category of investors. Persons in whose possession this document may come are required to inform themselves of and to observe such restriction. SHAREKHAN & affiliates may have used the information set forthherein before publication and may have positions in, may from time to time purchase or sell or may be materially interested in any of the securities mentioned or related securities. SHAREKHAN may from time to time solicit from,or perform investment banking, or other services for, any company mentioned herein. Without limiting any of the foregoing, in no event shall SHAREKHAN, any of its affiliates or any third party involved in, or related to,computing or compiling the information have any liability for any damages of any kind. Any comments or statements made herein are those of the analyst and do not necessarily reflect those of SHAREKHAN.”
Sharekhan Ltd, Regd Add: 10th Floor, Beta Building, Lodha iThink Techno Campus, Off. JVLR, Opp. Kanjurmarg Railway
Station, Kanjurmarg (East), Mumbai – 400 042, Maharashtra. Tel: 022 - 61150000. BSE Cash-INB011073351; F&O-
INF011073351; NSE – INB/INF231073330; CD - INE231073330; MCX Stock Exchange: CD - INE261073330 DP: NSDL-IN-DP-NSDL-
233-2003; CDSL-IN-DP-CDSL-271-2004; PMS INP000000662; Mutual Fund: ARN 20669. Sharekhan Commodities Pvt. Ltd.: MCX-
10080; (MCX/TCM/CORP/0425); NCDEX -00132; (NCDEX/TCM/CORP/0142)
COMMODITY
CURRENCY
PMS DESKProPrime - Top Equity 38ProPrime - Diversified Equity 39ProTech - Diversified 40ProTech - Nifty Thrifty 41ProTech - Trailing Stops 42
MUTUAL FUNDS DESK
Top MF Picks (equity) 44
Top SIP Fund Picks 45
RESEARCH BASED EQUITY PRODUCTS
Market Outlook 07Top Picks Basket 10Switch Ideas 14
INR-GBP 36INR-JPY 36
ADVISORY DESKMID Trades 43
INR-USD 36INR-EUR 36
Derivative Trades 43

July 2012 Sharekhan ValueGuide4
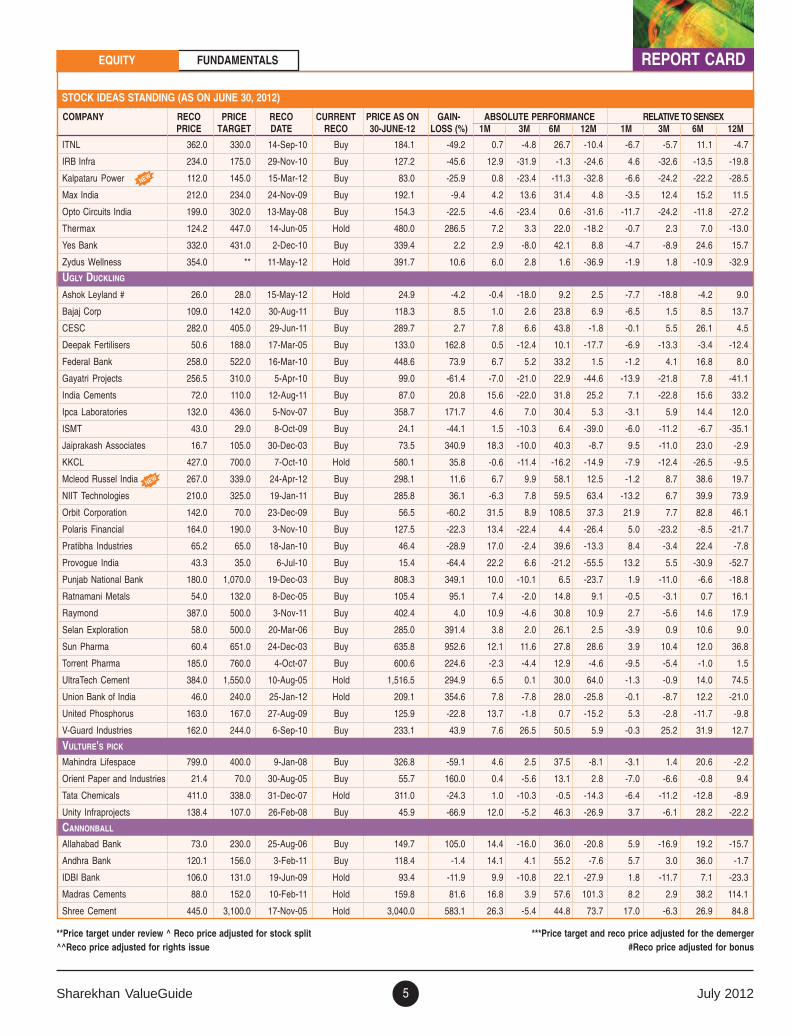
STOCK IDEAS STANDING (AS ON JUNE 30, 2012)
REPORT CARD
COMPANY RECO PRICE RECO CURRENT PRICE AS ON GAIN- ABSOLUTE PERFORMANCE RELATIVE TO SENSEXPRICE TARGET DATE RECO 30-JUNE-12 LOSS (%) 1M 3M 6M 12M 1M 3M 6M 12M
EVERGREEN
GSK Consumers 2,544.0 3,000.0 14-Dec-11 Buy 2,748.6 8.0 -2.5 -0.8 9.7 15.9 -9.7 -1.8 -3.9 23.3
HDFC 540.0 785.0 19-Nov-07 Buy 653.2 21.0 1.5 -1.3 1.9 -5.9 -6.0 -2.3 -10.7 0.1
HDFC Bank 71.6 570.0 23-Dec-03 Hold 563.6 687.1 12.2 9.3 33.1 12.9 3.9 8.1 16.7 20.1
Infosys 689.1 ** 30-Dec-03 Hold 2,509.2 264.1 3.3 -11.3 -8.1 -12.2 -4.3 -12.2 -19.4 -6.5
Larsen & Toubro 1,768.0 1,529.0 18-Feb-08 Buy 1,397.8 -20.9 19.2 6.8 40.5 -22.7 10.4 5.7 23.2 -17.7
Reliance Ind 283.5 800.0 5-Feb-04 Buy 737.9 160.3 4.6 -0.5 7.8 -16.9 -3.1 -1.5 -5.5 -11.6
Tata Consultancy Services 426.3 1,364.0 6-Mar-06 Buy 1,277.5 199.7 3.9 10.7 11.8 10.2 -3.8 9.6 -2.0 17.2
APPLE GREEN
Aditya Birla Nuvo 714.0 943.0 6-Dec-05 Buy 807.0 13.0 7.5 -14.6 9.0 -10.1 -0.5 -15.5 -4.4 -4.4
Apollo Tyres 37.0 91.0 27-Jul-09 Buy 79.0 113.5 -8.8 -0.8 33.7 1.6 -15.5 -1.8 17.2 8.1
Bajaj Auto 1,533.0 1,690.0 18-May-12 Hold 1,572.9 2.6 4.1 -6.3 -1.2 11.8 -3.6 -7.3 -13.3 18.9
Bajaj Finserv 545.0 703.0 26-Apr-08 Hold 684.4 25.6 4.4 11.9 59.4 33.1 -3.3 10.8 39.8 41.6
Bajaj Holdings 741.9 1,134.0 26-May-08 Buy 780.9 5.3 -0.8 -4.2 14.6 7.7 -8.1 -5.2 0.4 14.5
Bank of Baroda 239.0 865.0 22-Feb-12 Buy 732.9 206.7 9.0 -5.7 12.9 -14.0 1.0 -6.7 -1.1 -8.5
Bank of India 309.0 384.0 22-Feb-12 Hold 347.1 12.3 3.9 -2.3 33.0 -13.0 -3.7 -3.3 16.6 -7.4
Bharat Electronics 1,108.0 1,805.0 25-Sep-06 Buy 1,340.5 21.0 7.7 -12.1 0.0 -15.2 -0.2 -13.0 -12.3 -9.8
Bharat Heavy Electricals 120.4 250.0 11-Nov-05 Hold 232.5 93.1 9.6 -9.6 -1.7 -42.2 1.5 -10.5 -13.8 -38.5
Bharti Airtel 313.0 362.0 8-Jan-07 Buy 305.1 -2.5 0.8 -9.7 -11.2 -22.6 -6.6 -10.7 -22.1 -17.6
Corp Bank 218.0 564.0 19-Dec-03 Buy 417.3 91.4 5.4 3.0 25.0 -16.8 -2.3 2.0 9.6 -11.5
Crompton Greaves 50.4 123.0 19-Aug-05 Hold 121.2 140.5 8.2 -12.2 -3.5 -52.7 0.2 -13.1 -15.4 -49.7
Divi's Labs 767.0 1,122.0 31-May-11 Buy 1,025.2 33.7 9.8 33.8 32.0 30.2 1.7 32.4 15.7 38.5
GAIL 476.0 410.0 1-0ct-10 Buy 352.1 -26.0 9.6 -6.4 -7.5 -18.5 1.5 -7.4 -18.9 -13.3
Glenmark Pharmaceuticals 599.0 412.0 17-Jul-08 Buy 363.1 -39.4 1.8 17.4 23.7 14.6 -5.7 16.1 8.5 21.9
Godrej Consumer Products 145.0 590.0 7-May-09 Buy 574.4 296.1 -1.1 20.0 49.8 34.4 -8.4 18.8 31.3 43.0
Grasim 1,119.0 2,775.0 30-Aug-04 Buy 2,640.9 136.0 14.5 0.5 6.1 27.2 6.1 -0.5 -7.0 35.3
HCL Technologies 103.0 550.0 30-Dec-03 Buy 476.5 362.6 -5.5 -1.0 23.9 -1.4 -12.4 -2.0 8.6 4.9
Hindustan Unilever 324.0 ** 29-Jul-11 Hold 454.5 40.3 6.2 10.8 11.6 34.9 -1.6 9.7 -2.2 43.5
ICICI Bank 284.0 1,070.0 23-Dec-03 Buy 899.5 216.7 14.8 3.2 34.1 -16.1 6.4 2.1 17.6 -10.7
Indian Hotel Company 76.6 82.0 17-Nov-05 Buy 61.8 (19.4) 9.9 -3.1 13.6 -19.3 1.8 -4.1 -0.4 -14.1
ITC# 34.8 259.0 12-Aug-04 Hold 258.9 645.0 15.0 16.2 31.0 30.0 6.5 15.0 14.9 38.3
Lupin 80.7 597.0 6-Jan-06 Buy 537.2 565.6 -0.8 1.4 19.9 20.3 -8.1 0.4 5.2 28.0
M&M 116.0 733.0 1-Apr-04 Hold 707.3 509.7 8.4 1.0 3.7 2.4 0.4 0.0 -9.0 8.9
Marico 7.7 ** 22-Aug-02 Hold 183.7 2,285.7 4.9 5.0 26.7 18.6 -2.9 3.9 11.1 26.2
Maruti Suzuki 1,163.0 1,399.0 23-Jan-12 Hold 1,169.8 0.6 6.3 -13.4 27.4 1.5 -1.5 -14.3 11.7 8.0
Oil India 460.0 600.0 11-May-12 Buy 499.4 8.6 14.7 -2.0 8.2 0.5 6.2 -3.0 -5.2 7.0
Piramal Healthcare 445.0 ** 17-Apr-12 Buy 527.9 18.6 20.4 12.0 39.6 37.0 11.5 10.8 22.4 45.8
PTC India 79.0 74.0 22-Mar-11 Buy 64.9 -17.8 16.8 5.7 67.1 -16.6 8.2 4.6 46.5 -11.2
Punj Lloyd 52.2 63.0 2-May-12 Hold 48.9 -6.4 9.2 -11.5 23.5 -35.5 1.1 -12.4 8.3 -31.4
SBI 476.0 2,725.0 13-Feb-12 Buy 2,159.0 353.6 5.0 4.8 35.7 -8.6 -2.7 3.7 19.0 -2.8
Sintex Industries^ 143.0 100.0 26-Sep-08 Buy 61.5 -57.0 14.1 -28.7 -2.4 -65.9 5.7 -29.4 -14.4 -63.8
TGBL (Tata Tea)^ 78.9 123.0 12-Aug-05 Hold 116.0 47.0 7.8 3.2 28.7 22.3 -0.2 2.1 12.8 30.2
Wipro 356.0 450.0 31-Oct-11 Buy 399.9 12.3 -1.5 -8.2 1.8 -2.8 -8.7 -9.2 -10.7 3.4
EMERGING STAR
Axis (UTI) Bank 229.4 1,620.0 24-Feb-05 Buy 1,015.8 342.9 6.3 -10.0 27.7 -20.0 -1.6 -10.9 12.0 -14.9
Cadila Healthcare# 198.3 864.0 21-Mar-06 Hold 770.3 288.4 5.4 1.5 9.4 -15.6 -2.4 0.5 -4.1 -10.2
Eros International Media 186.0 267.0 15-Nov-10 Buy 168.5 -9.4 2.0 -6.6 -17.1 -6.2 -5.5 -7.6 -27.3 -0.2
Gateway Distriparks 131.0 173.0 2-Feb-12 Buy 137.1 4.6 -3.1 -9.2 5.6 13.6 -10.3 -10.1 -7.4 20.8
Greaves Cotton^ 83.0 83.0 25-Jan-12 Hold 70.1 -15.6 2.2 -19.3 -12.3 -17.5 -5.3 -20.1 -23.1 -12.2
EQUITY FUNDAMENTALS
NEW
NEW
NEW
Sharekhan ValueGuide July 20125
COMPANY RECO PRICE RECO CURRENT PRICE AS ON GAIN- ABSOLUTE PERFORMANCE RELATIVE TO SENSEXPRICE TARGET DATE RECO 30-JUNE-12 LOSS (%) 1M 3M 6M 12M 1M 3M 6M 12M
REPORT CARD
STOCK IDEAS STANDING (AS ON JUNE 30, 2012)
EQUITY FUNDAMENTALS
**Price target under review ^ Reco price adjusted for stock split ***Price target and reco price adjusted for the demerger^^Reco price adjusted for rights issue #Reco price adjusted for bonus
NEW
NEW
ITNL 362.0 330.0 14-Sep-10 Buy 184.1 -49.2 0.7 -4.8 26.7 -10.4 -6.7 -5.7 11.1 -4.7
IRB Infra 234.0 175.0 29-Nov-10 Buy 127.2 -45.6 12.9 -31.9 -1.3 -24.6 4.6 -32.6 -13.5 -19.8
Kalpataru Power 112.0 145.0 15-Mar-12 Buy 83.0 -25.9 0.8 -23.4 -11.3 -32.8 -6.6 -24.2 -22.2 -28.5
Max India 212.0 234.0 24-Nov-09 Buy 192.1 -9.4 4.2 13.6 31.4 4.8 -3.5 12.4 15.2 11.5
Opto Circuits India 199.0 302.0 13-May-08 Buy 154.3 -22.5 -4.6 -23.4 0.6 -31.6 -11.7 -24.2 -11.8 -27.2
Thermax 124.2 447.0 14-Jun-05 Hold 480.0 286.5 7.2 3.3 22.0 -18.2 -0.7 2.3 7.0 -13.0
Yes Bank 332.0 431.0 2-Dec-10 Buy 339.4 2.2 2.9 -8.0 42.1 8.8 -4.7 -8.9 24.6 15.7
Zydus Wellness 354.0 ** 11-May-12 Hold 391.7 10.6 6.0 2.8 1.6 -36.9 -1.9 1.8 -10.9 -32.9
UGLY DUCKLING
Ashok Leyland # 26.0 28.0 15-May-12 Hold 24.9 -4.2 -0.4 -18.0 9.2 2.5 -7.7 -18.8 -4.2 9.0
Bajaj Corp 109.0 142.0 30-Aug-11 Buy 118.3 8.5 1.0 2.6 23.8 6.9 -6.5 1.5 8.5 13.7
CESC 282.0 405.0 29-Jun-11 Buy 289.7 2.7 7.8 6.6 43.8 -1.8 -0.1 5.5 26.1 4.5
Deepak Fertilisers 50.6 188.0 17-Mar-05 Buy 133.0 162.8 0.5 -12.4 10.1 -17.7 -6.9 -13.3 -3.4 -12.4
Federal Bank 258.0 522.0 16-Mar-10 Buy 448.6 73.9 6.7 5.2 33.2 1.5 -1.2 4.1 16.8 8.0
Gayatri Projects 256.5 310.0 5-Apr-10 Buy 99.0 -61.4 -7.0 -21.0 22.9 -44.6 -13.9 -21.8 7.8 -41.1
India Cements 72.0 110.0 12-Aug-11 Buy 87.0 20.8 15.6 -22.0 31.8 25.2 7.1 -22.8 15.6 33.2
Ipca Laboratories 132.0 436.0 5-Nov-07 Buy 358.7 171.7 4.6 7.0 30.4 5.3 -3.1 5.9 14.4 12.0
ISMT 43.0 29.0 8-Oct-09 Buy 24.1 -44.1 1.5 -10.3 6.4 -39.0 -6.0 -11.2 -6.7 -35.1
Jaiprakash Associates 16.7 105.0 30-Dec-03 Buy 73.5 340.9 18.3 -10.0 40.3 -8.7 9.5 -11.0 23.0 -2.9
KKCL 427.0 700.0 7-Oct-10 Hold 580.1 35.8 -0.6 -11.4 -16.2 -14.9 -7.9 -12.4 -26.5 -9.5
Mcleod Russel India 267.0 339.0 24-Apr-12 Buy 298.1 11.6 6.7 9.9 58.1 12.5 -1.2 8.7 38.6 19.7
NIIT Technologies 210.0 325.0 19-Jan-11 Buy 285.8 36.1 -6.3 7.8 59.5 63.4 -13.2 6.7 39.9 73.9
Orbit Corporation 142.0 70.0 23-Dec-09 Buy 56.5 -60.2 31.5 8.9 108.5 37.3 21.9 7.7 82.8 46.1
Polaris Financial 164.0 190.0 3-Nov-10 Buy 127.5 -22.3 13.4 -22.4 4.4 -26.4 5.0 -23.2 -8.5 -21.7
Pratibha Industries 65.2 65.0 18-Jan-10 Buy 46.4 -28.9 17.0 -2.4 39.6 -13.3 8.4 -3.4 22.4 -7.8
Provogue India 43.3 35.0 6-Jul-10 Buy 15.4 -64.4 22.2 6.6 -21.2 -55.5 13.2 5.5 -30.9 -52.7
Punjab National Bank 180.0 1,070.0 19-Dec-03 Buy 808.3 349.1 10.0 -10.1 6.5 -23.7 1.9 -11.0 -6.6 -18.8
Ratnamani Metals 54.0 132.0 8-Dec-05 Buy 105.4 95.1 7.4 -2.0 14.8 9.1 -0.5 -3.1 0.7 16.1
Raymond 387.0 500.0 3-Nov-11 Buy 402.4 4.0 10.9 -4.6 30.8 10.9 2.7 -5.6 14.6 17.9
Selan Exploration 58.0 500.0 20-Mar-06 Buy 285.0 391.4 3.8 2.0 26.1 2.5 -3.9 0.9 10.6 9.0
Sun Pharma 60.4 651.0 24-Dec-03 Buy 635.8 952.6 12.1 11.6 27.8 28.6 3.9 10.4 12.0 36.8
Torrent Pharma 185.0 760.0 4-Oct-07 Buy 600.6 224.6 -2.3 -4.4 12.9 -4.6 -9.5 -5.4 -1.0 1.5
UltraTech Cement 384.0 1,550.0 10-Aug-05 Hold 1,516.5 294.9 6.5 0.1 30.0 64.0 -1.3 -0.9 14.0 74.5
Union Bank of India 46.0 240.0 25-Jan-12 Hold 209.1 354.6 7.8 -7.8 28.0 -25.8 -0.1 -8.7 12.2 -21.0
United Phosphorus 163.0 167.0 27-Aug-09 Buy 125.9 -22.8 13.7 -1.8 0.7 -15.2 5.3 -2.8 -11.7 -9.8
V-Guard Industries 162.0 244.0 6-Sep-10 Buy 233.1 43.9 7.6 26.5 50.5 5.9 -0.3 25.2 31.9 12.7
VULTURE'S PICK
Mahindra Lifespace 799.0 400.0 9-Jan-08 Buy 326.8 -59.1 4.6 2.5 37.5 -8.1 -3.1 1.4 20.6 -2.2
Orient Paper and Industries 21.4 70.0 30-Aug-05 Buy 55.7 160.0 0.4 -5.6 13.1 2.8 -7.0 -6.6 -0.8 9.4
Tata Chemicals 411.0 338.0 31-Dec-07 Hold 311.0 -24.3 1.0 -10.3 -0.5 -14.3 -6.4 -11.2 -12.8 -8.9
Unity Infraprojects 138.4 107.0 26-Feb-08 Buy 45.9 -66.9 12.0 -5.2 46.3 -26.9 3.7 -6.1 28.2 -22.2
CANNONBALL
Allahabad Bank 73.0 230.0 25-Aug-06 Buy 149.7 105.0 14.4 -16.0 36.0 -20.8 5.9 -16.9 19.2 -15.7
Andhra Bank 120.1 156.0 3-Feb-11 Buy 118.4 -1.4 14.1 4.1 55.2 -7.6 5.7 3.0 36.0 -1.7
IDBI Bank 106.0 131.0 19-Jun-09 Hold 93.4 -11.9 9.9 -10.8 22.1 -27.9 1.8 -11.7 7.1 -23.3
Madras Cements 88.0 152.0 10-Feb-11 Hold 159.8 81.6 16.8 3.9 57.6 101.3 8.2 2.9 38.2 114.1
Shree Cement 445.0 3,100.0 17-Nov-05 Hold 3,040.0 583.1 26.3 -5.4 44.8 73.7 17.0 -6.3 26.9 84.8
July 2012 Sharekhan ValueGuide6
Markets never fail to surprise
FROM SHAREKHAN’S DESK
from
sha
rekh
an’s
des
k Many a times, the equity markets tend to move against the prevailing consensus wisdomand consequently catch most market participants by surprise. Just when the expectationshad hit a nadir and equities were threatening to tumble down to new yearly lows towardsthe end of 2011, the Indian equity market had surged with an unexpected sharp rally at thebeginning of the new year. This time around also, the equity markets climbed the wall ofworries to register smart gains in the month of June.
After the rather pessimistic mood just a few weeks back, the sudden reversal in marketsentiments is rather surprising, given the recent slew of disappointments and negative news,such as the Reserve Bank of India’s inaction in the policy review meet, the rating down-grade of India’s outlook by another global agency and the weak onset of the monsoon. Theglobal cues also have not been encouraging except for the patchwork of a solution thatwould provide temporary relief to the troubled economies and banks in the euro zone.
Perhaps it is about expectations that were extremely low and consequently triggered atechnical upsurge in the market even at the hint of some positives emerging on the domesticas well as global front. The emerging positives, which are extensively covered in the MarketOutlook report titled “Silver lining in the midst of dark clouds” on page 7, could result ina relatively better performance by the Indian equity market in the near term.
However, this is all about the near-term outlook, which is more unpredictable and volatile.The big picture (or the long-term performance of equities), which ought to be the soleconcern of investors, is essentially driven by only two factors: corporate earnings and li-quidity.
Corporate earnings tend to move in cycles that comprise strong growth periods and alsoperiods when earnings remain sluggish for a few years. Notwithstanding the cycles theaverage growth in corporate earnings has been quite healthy even over a long period ofthree decades. That’s because the average growth in corporate earnings tends to be in line(or marginally higher) with the nominal growth in India’s gross domestic product (GDP;real GDP growth + inflation) that has averaged at annual rate of 14% since 1979. Thus,the growth in corporate India’s financial performance is quite predictable over a longerperiod of time.
On the other hand, the liquidity flows are much more unpredictable. Liquidity flows de-pend on a host of domestic and global factors that are not measurable (intangible) but alsobehavioural in nature. However, the only thing predictable about liquidity flows is thatsooner or later money does chase value. Thus, an undervalued market would eventuallyattract capital flows (though it is difficult to time this).
Having said this, we are not implying that the investors need not track important macroand company-specific information, and take appropriate necessary actions. But investorsmust not miss the wood for the trees, and get disillusioned by the all the noise (issues thatonly affect the near-term performance of the equity market). We also advocate active in-vesting and believe that there are a number of tools available to help trade with part of aninvestor’s portfolio to hedge or improve the near-term returns. Sharekhan offers a wholehost of trading products across various asset classes to cater to every market participant’sneeds and has also partnered with Online Trading Academy to provide quality tradingeducation. By adopting a combination of trading and investing strategies one will be able tonot only hedge one’s portfolio against unexpected market movements but also make thebest of the existing opportunities in all kinds of markets.�

Sharekhan ValueGuide July 20127
Silver lining in the midst of dark clouds
MARKET OUTLOOK JUNE 30, 2012
Market negotiates through a tough global environment and aseasonally weak summer: In our last Market Outlook report releasedin early May (titled “The heat is on”), we had turned cautiousagainst the backdrop of the rising crude prices and the nervousnessprior to some important global and domestic events in the alreadyseasonally weak summer period. The market did lose some groundand the overall pessimism only heightened on the back of the ReserveBank of India (RBI)’s status quo on policy rates, the downgrade ofIndia’s rating outlook and the fragile euro situation during the lasttwo months. However, we believe that the Indian equity markethas negotiated the tough period without much damage and ispotentially poised for relatively better times over the next fewmonths.
Emerging positives amid despondency: Given the slew of negatives,some of the positive developments and pointers have been largelyignored. These are as follows.
� Commodities cool off (including crude): A decent correction incommodities especially crude oil is inherently positive for theIndian economy, the corporates and the equity market. It doesthree things: eases the pressure on fiscal health; positively affectscorporate margins and makes India better placed for foreigninvestors as compared with its commodity exporting peers likeBrazil, Russia and Indonesia.
� Political changes could end policy inertia: The domestic politicalsituation has turned more conducive with the prime ministertaking charge of the finance ministry as well and the SamajwadiParty (SP) formally putting its weight behind the UnitedProgressive Alliance (UPA) II, thereby marginalising thetroublesome coalition partner Trinamool Congress’ importancein forging a political consensus to push forward the pendingand much awaited policy decisions. Mind you, we do not expectany major fireworks or path-breaking reforms but the verybreaking out of the policy inertia is enough to boost the market’sconfidence as expectations are pretty low.
� Valuations and high cash levels supportive: The rupee’sdepreciation has turned the valuations of Indian equities all themore cheaper for foreign investors who are sitting on a recordlevel of free cash (especially the Asian and emerging marketfunds), according to one of the recent surveys done for a globalbank and research house.
Euro zone: kicks the can down the road again: The euro zonemembers have come out with a patchwork of a solution to soothethe unnerved financial markets. The plan to directly supportEuropean banks and intervene in the bond markets to supportmember states has led to a burst of optimism which could fade offafter the initial reaction.
Pressure points: resumption in earnings downgrades and weakbeginning of monsoon season: It could have been better for theIndian equities but for the disappointing Q4FY2012 results of someindex heavyweights and the overall resumption of the downgradein the consensus earnings estimates by research houses after a pause
MARKET OUTLOOKEQUITY FUNDAMENTALS
SENSEX’ P/E (BASED ON ROLLING ONE-YEAR FORWARD EPS)
Source: Bloomberg
of a few months. The higher than expected asset quality concernsin the banking sector was the key negative takeaway from the Q4report card. The monsoon could also play a spoilsport. Thebeginning is weak and the increasing probability of El Nino in thelater part of the monsoon season would put further pressure on theeconomy, which is already suffering from slowing industrial activitywith signs of a slowdown in the services sector also. Moreover, aweaker monsoon would boost inflationary pressures and couldfurther delay the easing of the monetary cycle.
No runaway rally but sentiments could change for better: Havingsaid this, we are not in any way implying that the benchmark indiceswould witness a runaway rally from here but are merely suggestingthat the bias should turn positive from negative in the near term.The important thing to note is that in such an environment thebeaten-down stocks from certain sectors where some policy decisionsare initiated could surprise positively and outperform the currentlyfancied consumer and other defensive stocks in the next couple ofmonths. Beaten-down and high-beta stocks from light engineeringand construction/infrastructure sectors could turn out to berewarding contrarian bets in such a scenario. The delay in the interestrate cuts would act as a drag on the rate sensitive sectors (especiallyautomobiles) and the highly leveraged companies. In terms ofvaluation, the Sensex trades at 13.3x its FY2013 estimated earningsand 12x its FY2014 estimated earnings (in rupee terms). That isclose to 15% discount to its long-term average multiple of 15x itsone-year forward estimated earnings.
6
9
12
15
18
21
24
27
Jun-
00
Jun-
01
Jun-
02
Jun-
03
Jun-
04
Jun-
05
Jun-
06
Jun-
07
Jun-
08
Jun-
09
Jun-
10
Jun-
11
Jun-
12
+1σ
15x
-1σ
Market sails through global and local turbulencesDue to the fragile European financial system, the weak macro dataof the US economy and the sharper than expected deceleration inthe Asian economies (especially China and India) the sentimentweakened for equities. On the domestic front, the policy paralysiscontinued amid threats of a ratings downgrade and even the RBIpreferred to play safe by overruling the strong market expectationof a rate cut. The investment outlook deteriorated as global funds—which were positive on equities in early 2012—became underweighton equities. However, the Indian market weathered the turbulenceswithout any major damage.

July 2012 Sharekhan ValueGuide8
MARKET OUTLOOK EQUITY FUNDAMENTALS
Green shoots wilting but paving way for more easing in the US,euro economiesA weak housing statistics, drop in the manufacturing sector’smomentum, decline in spending and consequent reduction in thegrowth forecast by the US Federal Reserve (Fed) negated the hopesof a recovery, if any, in the near term. In order to support growth,
the Fed extended the Operation Twist ($267 million). The eurozone segment showed a sharp contraction in industrial productionand retail spending with a drop in the business confidence levels.The crisis in the banking sector aggravated leading to the de-ratingof several banks in the euro area. Despite resistances, the EuropeanUnion (EU) members have agreed to take adequate measures tostrengthen the banking system. Going ahead, more measures areexpected by the USA and the euro zone nations to revive the ailingeconomies.
Softening of crude prices to provide some relief on deficit frontThe current account deficit (CAD) spiralled to an all-time high of4.3% of the gross domestic product (GDP; FY2012) led by a rise inthe import bill and slower exports. However, crude oil, whichconstitutes 30% of the India’s imports and whose prices have fallenby 20% in the past three months (though the benefit has been mostlyoffset by the local currency’s depreciation), is likely to stem the risein the CAD. Further, the gold imports (10% of total imports),which have been the key driver of the rise in the CAD, aremoderating after the levies announced in the FY2013 budget.Therefore, the softening of the commodity prices will ease theinflation fears, improve the corporate performance and widen thescope for monetary easing. Traditionally, in a scenario of lowercommodity prices India outperformed the other emerging marketsdue to increased allocation from the foreign investors.
Euro summit: Will the burst of optimism last long enough?There are both good and negative takeaways from the deal announced post-Euro Summit at Brussels. First, the good news that led toa burst of optimism in the financial markets globally. The euro zone members have decided to allow the rescue fund (EuropeanStability Mechanism [$634 billion] and European Financial Stability Facility) to directly support banks and also intervene in the bondmarket to support the troubled countries of Europe. A single banking supervisor will be formed for all the euro zone banks. The aimis to break the vicious cycle between banks and their respective governments who are unable to provide the required financial supportto the banks that are too big to fail. This is seen as the first step of Europe moving towards a “Banking Union”.
The bad news is that the move would only forestall the crisis rather than find a more durable cure. In the past such decisions to kickthe can down the road only led to a burst of optimism that normally would fade away when the euro zone politics would kick in andmake it difficult to enact the announced plan in the right spirit. We keep our fingers crossed.
RISING CASH LEVELS OF GLOBAL FUNDS
Source: Media reports
EURO ZONE MACRO DATA: SLOWDOWN CONTINUES
Source: Bloomberg
- 2 5 .0
- 2 0 .0- 1 5 .0
- 1 0 .0- 5 .0
0 .0
5 .01 0 .0
1 5 .0
Mar
-06
Aug
-06
Jan-
07
Jun-
07
Nov
-07
Apr
-08
Sep
-08
Feb
-09
Jul-0
9
Dec
-09
May
-10
Oct
-10
Mar
-11
Aug
-11
Jan-
12
G DP IP
US MACRO DATA: GROWTH REMAINS FRAGILE
Source: Bloomberg
- 2 0 .0
- 1 5 .0
- 1 0 .0
- 5 .0
0 .0
5 .0
1 0 .0
Mar
-06
Jul-0
6
Nov
-06
Mar
-07
Jul-0
7
Nov
-07
Mar
-08
Jul-0
8
Nov
-08
Mar
-09
Jul-0
9
Nov
-09
Mar
-10
Jul-1
0
Nov
-10
Mar
-11
Jul-1
1
Nov
-11
Mar
-12
G DP IP
IMPACT OF CRUDE PRICES ON SENSEX’ PREMIUM TO EMS
Source: Bloomberg
30
50
70
90
110
130
150
Feb
-07
Jun-
07
Oct
-07
Feb
-08
Jun-
08
Oct
-08
Feb
-09
Jun-
09
Oct
-09
Feb
-10
Jun-
10
Oct
-10
Feb
-11
Jun-
11
Oct
-11
Feb
-12
Jun-
12
-
5 .0
10 .0
15 .0
20 .0
25 .0
30 .0
Crude S ens ex p remium v s EMS
Chorus on policy inaction get shriller, some fiscal actions likelyThe criticism on policy inaction has grown shriller since the GDPgrowth tanked to 6.5% (the lowest in nine years), the rupee slidand the rating agencies threatened with downgrades. The primeminister—who has taken charge of the finance ministry as well—has indicated some measures to stimulate growth. Further, thealigning of the Samajwadi Party with the UPA cushions thegovernment on a number of fronts and may contribute to the passageof a few legislations though path-breaking reforms still look

Sharekhan ValueGuide July 20129
MARKET OUTLOOKEQUITY FUNDAMENTALS
doubtful. The government has already softened the stance on theproposed tax laws (General Anti-Avoidance Rules) to improveinvestor sentiment and is engaging with the aggrieved parties toresolve the issues afflicting the infrastructure sector. Given the lowlevel of expectation, any fiscal measure, no matter how small, willbe taken as a positive by the market.
Earnings expectation gets more conservativeAfter the FY2012 results the consensus earnings estimate for theSensex has fallen by 15% for FY2013 over the past 15 months.This largely factors the weakness in the broader economy and itsimpact on the corporate earnings. The telecommunications sectorhas seen the highest downward revisions whereas consumer goodsand energy sectors have seen a higher number of upgrades.Currently, the earnings of the Sensex are estimated to grow at ~13%in FY2013. This seems quite conservative considering the 14.1%growth delivered by the benchmark index since the 1970s. Therefore,though the incremental risks remain on account of a sluggishmonsoon and global events but the back-ended policy actions andmonetary easing could also lead to upgrades.
SENSEX’ FY2013 EARNINGS ESTIMATES
Source: Bloomberg
1200
1250
1300
1350
1400
1450
1500
1550
Apr
-11
May
-11
Jun-
11
Jul-1
1
Aug
-11
Sep
-11
Oct
-11
Nov
-11
Dec
-11
Jan-
12
Feb
-12
Mar
-12
Apr
-12
May
-12
Jun-
12
Pressure on rupee unabated; weak monsoon and inflation riskspersistThe rupee has depreciated due to a combination of global anddomestic factors. The reversal of the softening of crude oil pricesled by global liquidity or the deepening of the euro zone crisis could
No runaway rally but sentiments could change for betterHaving said this, we are not in any way implying that the benchmarkindices would witness a runaway rally from here but are merelysuggesting that the bias should turn positive from negative in thenear term. The important thing to note is that in such anenvironment the beaten-down stocks from certain sectors wheresome policy decisions are initiated could surprise positively andoutperform the currently fancied consumer and other defensivestocks in the next couple of months. Beaten-down and high-betastocks from light engineering and construction/infrastructure sectorscould turn out to be rewarding contrarian bets in such a scenario.The delay in the interest rate cuts would act as a drag on the ratesensitive sectors (especially automobiles) and the highly leveragedcompanies. In terms of valuation, the Sensex trades at 13.3x itsFY2013 estimated earnings and 12x its FY2014 estimated earnings(in rupee terms). That is close to a 15% discount to its long-termaverage multiple of 15x its one-year forward estimated earnings.
WPI INFLATION TREND
Source: Bloomberg
- 2 %
0 %
2 %
4 %
6 %
8 %
1 0 %
1 2 %
Jan-
09
May
-09
Sep
-09
Jan-
10
May
-10
Sep
-10
Jan-
11
May
-11
Sep
-11
Jan-
12
May
-12
MOVEMENT OF RUPEE VIS-À-VIS USD, EURO
Source: Bloomberg
3 54 0
4 55 05 5
6 06 5
7 07 5
Jan-
00
Aug
-00
Mar
-01
Oct
-01
May
-02
Dec
-02
Jul-0
3
Feb
-04
Sep
-04
Apr
-05
Nov
-05
Jun-
06
Jan-
07
Aug
-07
Mar
-08
Oct
-08
May
-09
Dec
-09
Jul-1
0
Feb
-11
Sep
-11
Apr
-12
US D- INR Eu r o - INR
aggravate the currency risks. According to India MeteorologicalDepartment, the El Nino phenomenon is threatening this year’srainfall, which has had a weak start already. The government hashiked the minimum support price for the kharif crops which couldkeep food inflation at higher levels. A potential shortfall in the rainscould further intensify the consumption slowdown concerns andraise the agriculture related non-performing assets of banks.
SENSEX’ P/E (BASED ON ROLLING ONE-YEAR FORWARD EPS)
Source: Bloomberg
6
9
12
15
18
21
24
27
Jun-
00
Jun-
01
Jun-
02
Jun-
03
Jun-
04
Jun-
05
Jun-
06
Jun-
07
Jun-
08
Jun-
09
Jun-
10
Jun-
11
Jun-
12+1σ
15x
-1σ
Sharekhan Limited, its analyst or dependant(s) of the analyst might be holding orhaving a postition in the companies mentioned in the article.
For detailed report, please visit the Research section of our website, sharekhan.com.

July 2012 Sharekhan ValueGuide10
Sharekhan Top Picks
SHAREKHAN TOP PICKS
Despite the disappointment from the Reserve Bank of India (RBI)’sinaction in the policy review meet and the downgrade of India’srating outlook by another leading global rating agency in June, theSensex and the Nifty have registered handsome gains of 8.8% and8.5% respectively since our last update on June 5, 2012. The TopPicks basket has performed in line with the benchmark indices andappreciated by 8.7% in the same period. However, the blendedreturn stands at 8% after accounting for the cash created (by addingone stock less to the basket) in May this year.
In this month, we are increasing the basket’s exposure to engineering,construction and infrastructure sectors by adding Larsen & Toubro
* CMP as on June 30, 2012
NAME CMP* PER ROE (%) PRICE UPSIDE(RS) FY12 FY13E FY14E FY12 FY13E FY14E TARGET (%)
Divi’s Laboratories 1,027 25.5 20.5 16.7 25.0 27.2 27.5 1,122 9
ICICI Bank 900 1.7 1.6 1.5 11.2 11.5 12.0 1,070 19
IRB 127 8.5 9.8 10.0 18.7 14.2 12.5 175 38
ITC 259 32.8 27.5 22.9 35.5 36.4 37.2 ** **
Kalpataru Power Trans 83 6.8 5.9 4.9 10.8 11.2 12.1 145 74
Larsen & Toubro 1,397 19.3 18.6 17.0 18.8 17.1 16.4 1,529 10
Mcleod Russel 298 11.0 10.0 7.8 18.6 17.7 19.5 339 14
NIIT Technologies 286 8.6 7.1 6.1 23.6 23.8 23.0 325 14
Oil India 499 8.8 8.1 7.6 19.0 19.7 18.5 600 20
Orient Paper 56 5.3 4.9 4.3 21.0 19.1 18.6 70 26
Selan Exploration 285 11.0 7.9 5.1 23.3 26.4 31.5 500 75
ABSOLUTE OUTPERFORMANCE (RETURNS IN %) CONSTANTLY BEATING NIFTY AND SENSEX (RETURNS IN %)
(L&T), IRB Infrastructure Developers (IRB) and Kalpataru PowerTransmission Ltd (KPTL) in the Top Picks basket. IRB replacesIL&FS Transportation Networks to take advantage of the widenedgap in the valuations of the two stocks. L&T, the bellwetherengineering, procurement and construction player, comes in placeof Sun Pharmaceuticals, which has appreciated by close to 28% inthe last five months and sharply outperformed the benchmarkindices since it was introduced in the Top Picks basket in February2012. Lastly, we deploy the cash to bring in KPTL, which has astrong order backlog and a healthy balance sheet.�
0.0%
20.0%40.0%
60.0%
80.0%100.0%
120.0%
140.0%160.0%
180.0%
Apr
-09
Jun-
09
Aug
-09
Oct
-09
Dec
-09
Feb
-10
Apr
-10
Jun-
10
Aug
-10
Oct
-10
Dec
-10
Feb
-11
Apr
-11
Jun-
11
Aug
-11
Oct
-11
Dec
-11
Feb
-12
Apr
-12
Jun-
12
Sharekhan Sensex Nif ty
-40.0%
-20.0%
0.0%
20.0%
40.0%
60.0%
80.0%
100.0%
120.0%
140.0%
160.0%
YTDCY2012
CY2011 CY2010 CY2009 Since Jan2009
Sharekhan (Top Picks) Sensex Nif ty CNX MIDCAP
SHAREKHAN TOP PICKS EQUITY FUNDAMENTALS

Sharekhan ValueGuide July 201211
SHAREKHAN TOP PICKSEQUITY FUNDAMENTALS
ITC 259 32.8 27.5 22.9 35.5 36.4 37.2 ** **
Remarks: � ITC’s cigarette business, which contributes around 60%, continues to be a cash cow for the company. The company endeavours to make a mark in theIndian FMCG market and with successful brands such as Bingo, Sunfeast and Aashirwaad, ITC is already in the reckoning among the best in the industry.With the new portfolio of personal care products gaining market share, its FMCG business promises to compete with the likes of Hindustan Unilever andProcter & Gamble.
� The Government of India has increased the excise duty on cigarettes by ~22% in the finance budget 2012-13. The company has already taken a priceincrease of around 12% which would help in maintaining the cigarette business’ margins at around 30%.
� ITC’s other businesses, such as hotel, agri, non-cigarette FMCG business and paper, paperboard and packaging, are showing a strong upmove and willprovide a cushion to the overall profit in FY2012.
� An increase in the taxation and the government’s intention to curb the consumption of tobacco products remain the key risks to ITC’s cigarette businessover the longer term.
� We expect ITC’s bottom line to grow at a CAGR of about 20% over FY2011-14. At the current market price, the stock trades at 22.9x its FY2014Eearnings. We like the stock from a longer-term perspective.
ICICI BANK 900 1.7 1.6 1.5 11.2 11.5 12.0 1,070 19
Remarks: � ICICI Bank is back on growth path as its advances are growing at a healthy rate (up 17.3% YoY and 3.1% QoQ in Q4FY2012). We expect the advancesof the bank to grow by 20% CAGR over FY2012-14. This should lead to a 15% CAGR growth in the net interest income in the same period.
� ICICI Bank’s asset quality has shown a turnaround as its NPAs have continued to decline over the last six quarters led by contraction in slippages. Thishas led to a sharp reduction in the provisions and an increase in the profitability. Going forward, we expect the NPAs to decline further which will lead tolower NPA provisions and hence aid the profit growth.
� With a pick-up in the business growth and an improvement in the margins the RoEs are likely to expand to about 12% over the next two years while theRoA would improve to 1.4%. This would be driven by a 12% CAGR in profits over FY2012-14.
� The stock trades at 1.4x FY2014E book value. We expect the stock to re-rate, given the improvement in the profitability led by lower NPA provisions, ahealthy growth in the core income and improved operating metrics. We recommend Buy with a price target of Rs1,070.
DIVI’S LABORATORIES 1,027 25.5 20.5 16.7 25.0 27.2 27.5 1,122 9
Remarks: � Strong FY2012 performance (PAT growth 27%) has re-affirmed our confidence in the growth potential of Divi’s Labs.
� The new DSN SEZ facility at Vishakhapatnam that started production from one of its blocks in June 2011 (the remaining blocks of this facility are likely toget operational over FY2012-13) is likely to bring better economies of scale and tax benefits.
� A near debt-free balance sheet and strong cash flow are likely to help build a war chest for pursuing strategic investments (biosimilars) and exploit growthopportunities in niche segments like high potency drugs for oncology and steroids for contraceptives.
� With the order inflow picking up and its new plant getting operational, Divi’s has a strong revenue growth visibility and the operating leverage in thebusiness will boost its margins. At the current market price the stock trades at a PE multiple of 16.7x, discounting its FY2014E earnings. We maintain ourBuy recommendation.
IRB 127 8.5 9.8 10.0 18.7 14.2 12.5 175 38
Remarks: � IRB is the largest toll road BOT player in India and the second largest BOT operator in the country. It has a portfolio of 16 projects which are all toll based,together worth Rs16,468 crore and cover 1,180km of length. Its portfolio is mostly located along the corridors with high traffic density and high growtharound Mumbai and Pune.
� Of these 16 projects, 11 are operational and five are under construction. It has an integrated business model with an in-house construction arm. Thisprovides a competitive advantage in bidding for the larger projects and captures the entire value from the BOT assets.
� Further, seven of its 11 operational projects are already debt-free and generating steady cash for the company. Continuing cash flows from these arelikely to fuel growth.
� Though the charges levied against the promoter of IRB are serious, the correction of over 30% in the stock factors in a lot of the negatives and has madethe stock available at a 40% discount to its mean average valuation multiple. The improving outlook for the road infrastructure developers should limit thedownside risk in the stock though. Moreover, any positive development on the legal issue could result in a sharp re-rating of the stock.
� At the current market price, the stock is trading at 9.8x and 10x its FY2013 and FY2014 estimated earnings respectively and the valuations are veryattractive. We maintain our Buy recommendation on the stock with a price target of Rs175.
NAME CMP PER ROE (%) PRICE UPSIDE(RS) FY12 FY13E FY14E FY12 FY13E FY14E TARGET (%)

July 2012 Sharekhan ValueGuide12
SHAREKHAN TOP PICKS EQUITY FUNDAMENTALS
NAME CMP PER ROE (%) PRICE UPSIDE(RS) FY12 FY13E FY14E FY12 FY13E FY14E TARGET (%)
KALPATARU POWER 83 6.8 5.9 4.9 10.8 11.2 12.1 145 74
Remarks: � Kalpataru Power Transmission Ltd (KPTL) is a leading EPC player in the transmission & distribution (T&D) space in India. The T&D space is poised fora significant growth in India as well as globally.
� Backed by a healthy order book position (ie 2x its FY2012E revenues) the company’s consolidated revenues are expected to grow at 17% CAGR duringFY2012-14.
� On account of a competitive bidding environment, the EBITDA margin of KPTL (stand-alone) is likely to remain subdued in the near term which is alreadypriced in the stock. Further, on account of the tightened payment norms adopted by PGCIL, KPTL could witness strain on its working capital requirementsand cash flows. Nevertheless, KPTL’s balance sheet position is better than that of its peers with relatively less leverage (a consolidated debt-equity ratioof 0.6x). Further, the peaking of the interest rate in the near future could be beneficial, as for KPTL the interest cost is the highest cost component belowthe EBITDA line.
� Given the current economic condition, we believe we are close to the peak of the interest rate hike cycle. However, if the interest rates remain at thecurrent levels, it will adversely affect the company’s performance.
� At the current market price, KPTL is trading at 5.9x and 4.9x FY2013 and FY2014 estimated EPS respectively, which is significantly lower than thehistorical average. We maintain our Buy recommendation on the stock with a price target of Rs145 (we have valued KPTL at 7.5x FY2014E and JMCProjects at 5.5x FY2014E).
LARSEN & TOUBRO 1,397 19.3 18.6 17.0 18.8 17.1 16.4 1,529 10
Remarks: � Larsen & Toubro (L&T), the largest engineering and construction (E&C) company in India, is a direct beneficiary of the strong domestic infrastructuredevelopment and industrial capital expenditure (capex) boom.
� L&T continues to impress us with its good execution skills, reporting decent numbers throughout this year despite the slowdown in the industrial capexcycle. While there has been a growth of 12% YoY in its order backlog to Rs1,45,723 crore; the order inflow remained rather muted in FY2012.
� Despite challenges like deferral of award decisions and stiff competition, the company has given robust guidance of 15-20% in revenue and order inflowfor FY2013- while this seems an uphill task, it instills confidence amongst the investors.
� Although the company reported overall decent results for the quarter, the order inflow guidance would be highly subjective to an uptick in infrastructuredevelopment activities in the country and in the Middle East region. We also feel that its diversity continues to cushion the overall financials in a toughbusiness environment.
� Sound execution track record, bulging order book and strong performance of its subsidiaries reinforce our faith in L&T. With the company entering newverticals, namely solar and nuclear power, railways, and defense, there appears a huge scope for growth. Given its excellent track record, we are quiteconfident about L&T’s success in these initiatives.
� At the current market price, the stock is trading at 17x its FY2014E standalone earnings and at an EV/EBIDTA of 9.6x. We maintain our Buy recommendationon the stock.
MCLEOD RUSSEL 298 11.0 10.0 7.8 18.6 17.7 19.5 339 14
Remarks: � Mcleod Russel India (MCR) is the world’s largest tea producer with a total area of 38,758 hectares under tea cultivation (1.1% of the world’s total areaunder tea cultivation). With a production capacity of close to 100 million kg MCR is well poised to capitalise on the growing demand for Indian black teain the global markets.
� The rising demand-supply gap of tea due to a production shortfall in the key tea exporting countries has created a favourable scenario for the domestictea producers. We expect a growth of Rs10-15 per kg in MCR’s average realisation in the next two years. This will help the margins to improve by 120-130 basis points YoY in the coming years.
� With expectations of strong cumulative operating cash inflow of around Rs680 crore over the next two years, MCR is expected to improve the dividendpay-out and/or build a cash war chest for potential inorganic initiatives in future.
� Since the tea industry is labour intensive, any labour unrest in India is the key risk for the company in the near future. Also any substantial increase in theproduction of the key tea exporting countries will improve the demand-supply gap resulting in an adverse impact on the sales realisation of the Indian teaproducers.
� The stock is currently trading at 7.8x its FY2014E EPS of Rs38.2. We maintain our Buy recommendation on the stock with a price target of Rs339.

Sharekhan ValueGuide July 201213
SHAREKHAN TOP PICKSEQUITY FUNDAMENTALS
NAME CMP PER ROE (%) PRICE UPSIDE(RS) FY12 FY13E FY14E FY12 FY13E FY14E TARGET (%)
NIIT TECHNOLOGIES 286 8.6 7.1 6.1 23.6 23.8 23.0 325 14
Remarks: � NIIT Technologies Ltd (NTL), a mid-sized IT services company, has built strong domain expertise in niche industry verticals like insurance, travel,manufacturing and retail. The company has a balanced mix of revenues coming from across verticals and geographies which would safeguard it from aslowdown in any specific industry or geography.
� The company has a strong order book of $243 million executable over the next 12 months giving it strong revenue visibility going ahead. The companyis gaining traction with a robust order intake of $453 million in FY2012, up 70% over FY2011. The robust order intake comes on the back of the multi-year,multi-million dollar deals won by the company in the past year including the Morris deal worth $85 million, the Rs300-crore worth deals won under theCrime and Criminal Tracking Network System (CCTNS) programme from three states and the euro-40-million Eurostar deal. Currently, the company ischasing at least four large deals of more than $25 million each.
� With a strong executable order book and increasing success in deal conversion NTL has got predictable business visibility for the coming quarters.Further, the strategy of offshore shift of recent large deals has played out as per expectations and the same would result in a margin improvement in thecoming quarters. At the current market price, NTL trades at attractive valuations of 7.1x and 6.1x on FY2013E and FY2014E earnings respectively. Wemaintain our Buy rating on the stock.
OIL INDIA 499 8.8 8.1 7.6 19.0 19.7 18.5 600 20
Remarks: � Oil India Ltd (OIL) has several hydrocarbon discoveries across reserves in Rajasthan and the north-eastern region of India. The total 1P (proven) and 2P(proven and probable) reserves of the company stood at 505 million barrels (mmbbls) and 944mmbbls as on March 2011. In addition to the huge oilreserves, the company’s reserve-replacement ratio (RRR) is quite healthy at 1.42x which implies a comfortable level of accretion of oil reserves throughnew discoveries.
� The recent correction in the crude oil price to $93 per barrel as compared with the peak level of $124 per barrel touched a couple of months back augurswell for the company as it will reduce its subsidy burden.
� Further, OIL has cash of around Rs10,935 crore (Rs182 per share) as on March 2012 and offers a healthy dividend pay-out (dividend yield of 4.3%),which provides comfort to the investor.
� The key risks remain any adverse movement in the price of crude oil and failure in proper utilisation of the huge cash.
� We remain bullish on OIL because its huge reserves and healthy RRR would provide a reasonably stable revenue growth outlook and its stock isavailable at an attractive valuation. The fair value works out to Rs600 per share (based on the average fair value arrived at using the DCF, PE and EV/EBIDTA valuation methods).
ORIENT PAPER 56 5.3 4.9 4.3 21.0 19.1 18.6 70 26
Remarks: � OPIL, a part of CK Birla group, is a diversified conglomerate operating in three segments; cement, paper and fans. The cement division contributes over53% of the total revenue. The company benefits due to its diversified business model.
� Due to the recent increase in cement prices, the present realisation of the company is higher by over 28% over FY2011. The surge in the realisation willbe able to offset the cost inflation and the profitability of the division is likely to improve (marginally).
� In the electrical division, due to the new product launches and gaining market shares, the company has delivered over 13% revenue growth in FY2012.Going forward, the division can witness growth on the back of lighting products (CFL) and household appliances.
� The restructuring plan to demerge the cement division augurs well for the company as the uncertainty in the profitability of the paper division was one ofthe major overhangs on the stock. Hence, the valuation could get re-rated going ahead. The demerger is expected by the end of June 2012.
� However, the key concern remains the poor volume offtake in its key market, ie Andhra Pradesh (which accounts for 37% of the total dispatches).
� At the current market price of Rs56, the stock trades at PE of 4.9x and 4.3x, discounting its FY2013 and FY2014 earnings estimates respectively.
SELAN EXPLORATION 285 11.0 7.9 5.1 23.3 26.4 31.5 500 75
Remarks: � Selan Exploration (Selan) has rights to develop five small discovered (minimal exploration risk) oil fields (Bakrol, Lohar, Indrora, Karjisan and Ognaj) inCambay Basin (Gujarat) with proven oil & gas reserves.
� Between FY2006 and FY2009, Selan ramped up its production by 4x. In the next phase (FY2009-11), with stagnating oil production it did preparatorywork to ramp up drilling in the existing fields and the new field, Indrora (the most prolific one with significant reserves). Currently, the company is waitingfor the final approval for drilling which could ramp up its production significantly in the near future.
� Based on this, we expect the company to ramp up its production more than two times by FY2014 over that of FY2011. It would lead to an earnings growth(CAGR) of 47% during FY2012-14.
� At the current market price, the stock trades at a PE of 5.1x and EV/EBITDA of 2.0x based on our FY2014 estimates. We remain bullish on its productionramp-up plan and recommend Buy with a price target of Rs500.
July 2012 Sharekhan ValueGuide14
SHAREKHAN SPECIAL OCTOBER 06, 2008
Switch from BoI to PNBAnomaly in valuations among PSU banks: The entire basket ofpublic sector banks (PSBs) has corrected significantly and rightlyso, given the asset quality concerns and deterioration in the eco-nomic environment that would affect the growth of their core busi-ness. Yet some of the stocks have been beaten down excessively.Consequently, the situation has created an anomaly in the valua-tions leading to an opportunity for investors. The case in point isBank of India (BoI) vs Punjab National Bank (PNB). For the pastthree years, BoI has traded at an average discount of 16% to PNB.However, after the Q4FY2012 results the situation has reversedand BoI is now trading at a 10% premium to PNB. In our view,this is an aberration driven by a sudden jump in the slippages andrestructured accounts of PNB and a decline in the slippages of BoIin Q4FY2012. But the divergence in the performances is not sus-tainable and the anomaly in the valuations would get correctedgoing ahead.
BOI—valuations run ahead of performanceBoI reported better than expected numbers in Q4FY2012, with asequential decline in the slippages. The sequential decline in thenon-performing assets (NPAs) was contributed by higher recover-ies from the smaller accounts (technical NPAs), though restruc-tured asset rose sharply. Though the management expects to limitthe slippages in the coming quarters, we believe the same would bea tough task as it has still not accounted for the debt recast of AirIndia. Moreover, the core income growth remained volatile withpressure on the margins. Thus, the Q4FY2012 performance seemsunsustainable due to a weaker core income growth, pressure onthe NPAs and a possible decline in the recoveries. With the expec-tations running high, any disappointment in the quarterly perfor-mance would have a sharp impact on the stock price.
PNB—better positioned to manage NPAsGiven the tough macro environment where the stress on asset qualityhas aggravated for the banking sector, PNB is in a better positionto tide over the same due to a relatively better earnings growth,higher capitalisation (tier-I capital of 9.3%) and management con-tinuity. In addition, the bank has already taken a significant hit inthe previous quarters from big-ticket loans to the infrastructuresector (including the state electricity boards), Air India etc and wedo not expect any major negative surprises going ahead. More-over, PNB also has a relatively better liability mix with a currentaccount and savings account (CASA) ratio in the 36-38% range.
Relatively strong liability base to support PNB’s marginsPNB has the second largest network of 5,680 branches and a strongpresence in north India. This contributes to the strong mobilisationof deposits including the current account and savings account(CASA) deposits. The CASA ratio of PNB is quite stable at 36-38% levels compared with 34.2% of BoI. Therefore, due to adiversified advances and liabilities mix, PNB maintains a signifi-cantly higher net interest margin (NIM) compared with BoI whichstrengthens its core income growth. We expect PNB to report a
BANKING JUNE 8, 2012
Sharekhan Limited, its analyst or dependant(s) of the analyst might be holding orhaving a postition in the companies mentioned in the article.
For detailed report, please visit the Research section of our website, sharekhan.com.
healthy growth in its NII, driven by its superior margins and loangrowth.
BoI’s return ratios to lag PNB’s ratiosPNB has consistently maintained its return on equity (RoE) in therange of 18-22% (FY2008-12). Compared with that BoI’s RoE hasdeclined from 24% in FY2008 to 14% in FY2012. Further, thereturn on assets (RoA) of PNB has been steady at around 1.2-1.3%levels while the same has come down to 0.8% for BoI. Going ahead,we expect PNB to maintain its RoE and RoA at 18-19% and 1.1%respectively driven by a 14.5% CAGR in its earnings (FY2012-14).However, BoI’s return ratios are likely to lag (RoE and RoA of15% and 0.8% respectively in FY2014) those of the peer banks.
Management continuity a key positive for PNBManagement sustainability has been one of the key issues with thePSBs as generally shorter tenures have affected the managementinitiatives. BoI’s chairman is expected to superannuate byQ2FY2013 whereas in case of PNB the sustainability of the exist-ing management augurs well for the bank.
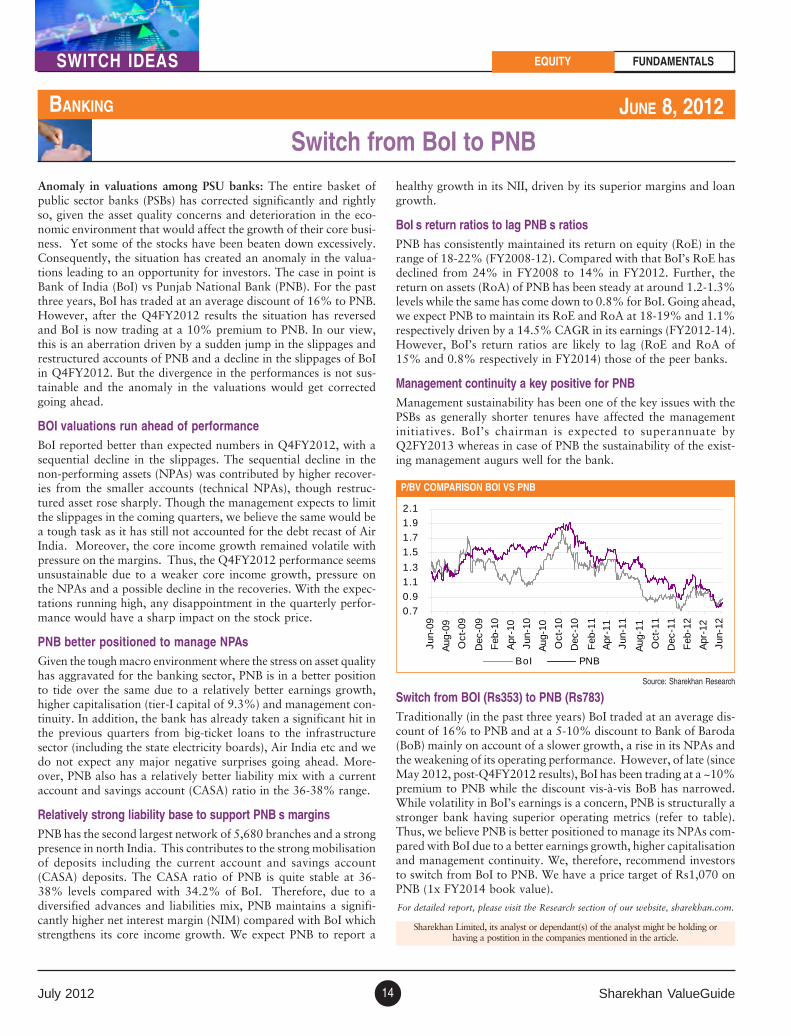
P/BV COMPARISON BOI VS PNB
Source: Sharekhan Research
Switch from BOI (Rs353) to PNB (Rs783)Traditionally (in the past three years) BoI traded at an average dis-count of 16% to PNB and at a 5-10% discount to Bank of Baroda(BoB) mainly on account of a slower growth, a rise in its NPAs andthe weakening of its operating performance. However, of late (sinceMay 2012, post-Q4FY2012 results), BoI has been trading at a ~10%premium to PNB while the discount vis-à-vis BoB has narrowed.While volatility in BoI’s earnings is a concern, PNB is structurally astronger bank having superior operating metrics (refer to table).Thus, we believe PNB is better positioned to manage its NPAs com-pared with BoI due to a better earnings growth, higher capitalisationand management continuity. We, therefore, recommend investorsto switch from BoI to PNB. We have a price target of Rs1,070 onPNB (1x FY2014 book value).
0.7
0.9
1.1
1.3
1.5
1.7
1.9
2.1
Jun-
09
Aug
-09
Oct
-09
Dec
-09
Feb
-10
Apr
-10
Jun-
10
Aug
-10
Oct
-10
Dec
-10
Feb
-11
Apr
-11
Jun-
11
Aug
-11
Oct
-11
Dec
-11
Feb
-12
Apr
-12
Jun-
12
BoI PNB
EQUITY FUNDAMENTALSSWITCH IDEAS

Sharekhan ValueGuide July 201215
SHAREKHAN SPECIAL OCTOBER 06, 2008
Switch from ITNL to IRB
KEY POINTS� Trading premium gap at all-time high; buying opportunity in
IRB: The recent sharp correction in IRB Infrastructure Devel-opers (IRB) has created a huge divergence in the valuations ofIRB and IL&FS Transportation Ltd (ITNL). ITNL trades at a40% premium to IRB as against a mean average of an 11%premium and the usual band of a 5% to 20% premium. Not-withstanding the legal tangles of the IRB promoter, we believethat the divergence of more than 2x standard deviation (2SD)offers a compelling buying opportunity.
CONSTRUCTION JUNE 22, 2012
Sharekhan Limited, its analyst or dependant(s) of the analyst might be holding or having a postition in the companies mentioned in the article.
For detailed report, please visit the Research section of our website, sharekhan.com.
SWITCH IDEASEQUITY FUNDAMENTALS
inflation still at levels beyond the comfort zone of the centralbank), we think the interest rate reversal cycle might be delayedby one or two quarters. For the companies with a high debtburden this would mean continued pain in terms of high inter-est charges for at least the next couple of quarters. Here, wethink IRB is better placed in comparison with ITNL since thedebt/equity ratio of IRB stands at 2.5 vs 3.7 for ITNL. On acloser analysis of the interest payments we find that while IRBpays almost 40% of its operating profit as interest charge, ITNLpays 50% of the same as interest charge (due to the interestpayment on the annuity projects under construction). Further,in the last two years, IRB has been efficient in generating higherreturns on invested capital (RoIC) as compared with ITNL withthe FY2012 RoIC at 11.5% as compared with ITNL’s 9.3%.
� Switch from ITNL (Rs180) to IRB (Rs126): Fundamentally,we like both the companies and believe both would be likelybeneficiaries of the tall target set by the National HighwaysAuthority of India for project awarding this fiscal. In fact, ITNLshall score better than IRB on many financial parameters overthe long term. However, the recent event-driven sharp correc-tion in IRB has thrown open a tactical opportunity to shift fromITNL to IRB for superior returns in the near term.
ITNL’S PREMIUM OVER IRB—AT AN ALL-TIME HIGH
� IRB—sharp correction and clearance from a legal case to limitthe downside: Though the charges levied against the promoterof IRB are serious, the correction of over 30% in the stockfactors in a lot of the negatives and has made the stock avail-able at a 40% discount to its mean average valuation multiple.The improving outlook for the road infrastructure developersshould limit the downside risk in the stock though. Moreover,any positive development on the legal issue could result in asharp re-rating of the stock.
� IRB’s profitability less vulnerable to interest rates: Consideringthe economic turbulence that our country is going through (with
IRB’S ONE-YEAR FORWARD PE BAND
-20.0
-10.0
0.0
10.0
20.0
30.0
40.0
50.0
Apr
-10
Jun-
10
Aug
-10
Oct
-10
Dec
-10
Feb
-11
Apr
-11
Jun-
11
Aug
-11
Oct
-11
Dec
-11
Feb
-12
Apr
-12
Jun-
12
+2σ
+1σ
Mean
-1σ
-2σ
-
50.0
100.0
150.0
200.0
250.0
300.0
350.0
Feb
-08
May
-08
Aug
-08
Nov
-08
Feb
-09
May
-09
Aug
-09
Nov
-09
Feb
-10
May
-10
Aug
-10
Nov
-10
Feb
-11
May
-11
Aug
-11
Nov
-11
Feb
-12
May
-12
20x
16x
12x
8x
VALUATIONS (IRB)Particulars FY2010 FY2011 FY2012 FY2013E FY2014ESales (Rs cr) 1,704.9 2,438.1 3,130.5 3,899.9 4,842.8YoY growth % 71.9 43.0 28.4 24.6 24.2EBITDA (Rs cr) 799.1 1,093.9 1,373.3 1,592.2 1,963.3Margins % 46.9 44.9 43.9 40.8 40.5Adjusted net profit (Rs cr) 385.5 452.4 495.8 431.6 422.8YoY growth % 119.2 17.4 9.6 (13.0) (2.0)Shares in issue (cr) 33.2 33.2 33.2 33.2 33.2EPS (Rs) 11.6 13.6 14.9 13.0 12.7YoY growth % 119.2 17.4 9.6 (13.0) (2.0)PER (x) 10.9 9.3 8.4 9.7 9.9Book value (Rs) 61.4 73.2 86.0 96.8 107.5P/BV (Rs) 2.1 1.7 1.5 1.3 1.2RoCE (%) 14.2 15.3 13.9 11.4 11.5RoNW (%) 20.4 20.2 18.7 14.2 12.5

July 2012 Sharekhan ValueGuide16
SHAREKHAN SPECIAL OCTOBER 06, 2008Impact analysis of sharp fall in rupee on
Sharekhan universeCurrency impact on Sharekhan coverage universeWe applied four conditions on our coverage universe to ascertainthe impact of the rupee’s depreciation on various companies. Ourfindings reflect that Maruti Suzuki (Maruti) and Hero MotoCorp(Hero) have been affected the most due to expensive raw materialimports and royalty pay-outs. Gayetri Projects and Sintex Indus-tries (Sintex) would be affected the most on account of their for-eign currency loan exposures. The companies that will benefit themost are Infosys, Tata Consultancy Services (TCS), Provogue,Bharat Forge, Divi’s Laboratories (Divi’s Labs) and CadillaHealthcare (Cadilla). We have assumed a rupee/dollar rate of 55.5and a rupee/yen rate of 1.40.
Companies affected due to large net forex outflows with limitedhedges� Maruti: Maruti’s direct and indirect (vendor) imports form
approximately 21% of its sales. The exports form roughly 10%of its revenues; the euro-based exports form 4% of its sales andare naturally hedged while the dollar-denominated exports getadjusted against the yen-denominated imports. We estimate thecompany’s net exposure to yen at around 16-17% of its sales.We estimate an impact of 15% on the earnings per share (EPS)if the rupee sustains at 1.40 to the yen, taking into account theimpact for H2FY2013.
FOREX PLAYS JUNE 11, 2012
� Hero: The company’s direct and indirect imports form 16%(direct 2% and indirect 14%) of its net sales while its exportsform roughly 2.0-2.5% of its sales. Hence, net of exports , theraw material cost forms around 14% of its net sales and theraw materials are largely imported by vendors in yen denomi-nation. We estimate an EPS impact of 13% if the rupee sustainsat 1.40 to the yen.
� Apollo Tyres: The imports form roughly 21% of the consoli-dated sales while the exports are pegged at 5.5% of the consoli-dated sales. Usually, the impact is felt with the lag of a quarter.Based on the net import exposure and the fact that there are nohedges, the company would see an EPS impact of 17.7% if therupee sustains at 55.5 to the dollar for the next three quartersof FY2013.
� Tata Chemicals: The company’s fertiliser imports form 22% ofits sales and are largely dollar denominated. Most of the hedgesare taken for one quarter, hence the impact of the local currency’sdepreciation would be felt from Q2YF2013 onwards. The com-pany had been able to offset the cost escalations in the past butif it is unable to pass on the price hikes to the end-customer, theimpact of the rupee’s depreciation on the EPS is expected to be15.5% over the three quarters of FY2013.
Company name Net exposure Traded Rupee’s Imported RM / EPS Hedging strategyFY13 (Rs cr) currency depreciation (%) Fuel % of sales impact (%)
Maruti Suzuki 7675 INR-YEN -13.0 17.0 -15.1 Hedged—H1FY2013Hero MotoCorp 3765 INR-YEN -13.0 14.0 -13.0 No hedgesApollo Tyres 2201 INR-USD -9.0 15.5 -17.7 No hedgesTata Chemicals 3146 INR-USD -9.0 22.0 -15.5 Qtrly. hedgingShree Cement 556.9 INR-USD -9.0 10.2 -5.3 Impact in H2FY13India Cements 544.0 INR-USD -9.0 12.0 -5.2 Impact in H2FY13
CESC 276.0 INR-USD -9.0 5.1 -3.8 No hedging
*Rupee’s depreciation between March 31, 2012 and June 5, 2012
IMPACT ON SHAREKHAN UNIVERSE DUE TO LARGE NET FOREX OUTFLOWS
Companies affected due to royalty exposure to parent with limitedhedges� Maruti: Royalty forms 5.5% of the company’s sales. The com-
pany pays royalty bi-annually. It has hedged its rupee-yen ex-posure for H1FY2013; hence, the impact would be felt inH2FY2013. We estimate an EPS impact of 4.1% if the rupeesustains at 1.40 against the yen.
� Hero: The company pays Rs180 crore as fixed royalty to HondaMotor Co. and charges the same under “depreciation” everyquarter. On new models the royalty payable is around 1% ofsales. We estimate the annual royalty bill to Honda Motor Co.at Rs989 crore for FY2013 and an EPS impact of 3.5% if therupee sustains at the current levels against the yen.
Company name Exposure Trade Rupee’s Royalty EPS Hedging strategyFY13E (Rs cr) currency depreciation (%) % of sales impact (%)
Maruti 2,483 INR-YEN -13.0 5.5 -4.1 Hedged for H1FY13
Hero MotoCorp 989 INR-YEN -13.0 3.7 -3.5 No hedges, full impact
*Rupee’s depreciation between March 31, 2012 and June 5, 2012
IMPACT ON SHAREKHAN UNIVERSE DUE TO LARGE ROYALTY PAYOUTS
EQUITY FUNDAMENTALSSWITCH IDEAS
Sharekhan ValueGuide July 201217
Sharekhan Limited, its analyst or dependant(s) of the analyst might be holding orhaving a postition in the companies mentioned in the article.
For detailed report, please visit the Research section of our website, sharekhan.com.
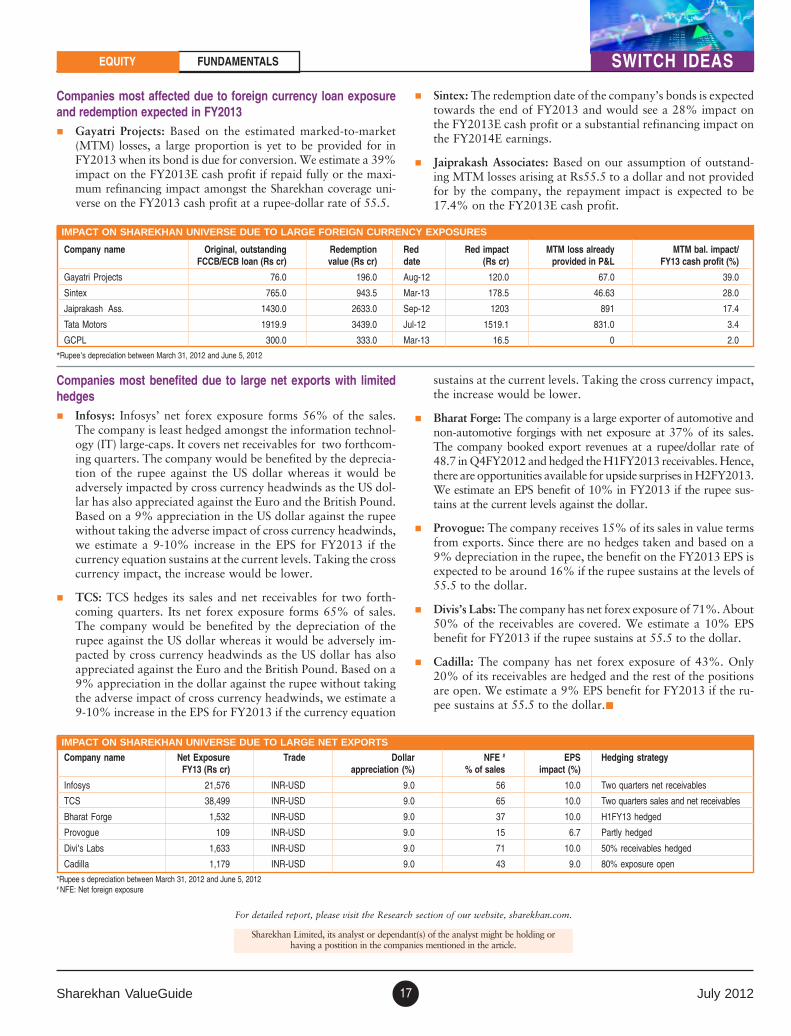
Companies most affected due to foreign currency loan exposureand redemption expected in FY2013� Gayatri Projects: Based on the estimated marked-to-market
(MTM) losses, a large proportion is yet to be provided for inFY2013 when its bond is due for conversion. We estimate a 39%impact on the FY2013E cash profit if repaid fully or the maxi-mum refinancing impact amongst the Sharekhan coverage uni-verse on the FY2013 cash profit at a rupee-dollar rate of 55.5.
� Sintex: The redemption date of the company’s bonds is expectedtowards the end of FY2013 and would see a 28% impact onthe FY2013E cash profit or a substantial refinancing impact onthe FY2014E earnings.
� Jaiprakash Associates: Based on our assumption of outstand-ing MTM losses arising at Rs55.5 to a dollar and not providedfor by the company, the repayment impact is expected to be17.4% on the FY2013E cash profit.
Companies most benefited due to large net exports with limitedhedges� Infosys: Infosys’ net forex exposure forms 56% of the sales.
The company is least hedged amongst the information technol-ogy (IT) large-caps. It covers net receivables for two forthcom-ing quarters. The company would be benefited by the deprecia-tion of the rupee against the US dollar whereas it would beadversely impacted by cross currency headwinds as the US dol-lar has also appreciated against the Euro and the British Pound.Based on a 9% appreciation in the US dollar against the rupeewithout taking the adverse impact of cross currency headwinds,we estimate a 9-10% increase in the EPS for FY2013 if thecurrency equation sustains at the current levels. Taking the crosscurrency impact, the increase would be lower.
� TCS: TCS hedges its sales and net receivables for two forth-coming quarters. Its net forex exposure forms 65% of sales.The company would be benefited by the depreciation of therupee against the US dollar whereas it would be adversely im-pacted by cross currency headwinds as the US dollar has alsoappreciated against the Euro and the British Pound. Based on a9% appreciation in the dollar against the rupee without takingthe adverse impact of cross currency headwinds, we estimate a9-10% increase in the EPS for FY2013 if the currency equation
sustains at the current levels. Taking the cross currency impact,the increase would be lower.
� Bharat Forge: The company is a large exporter of automotive andnon-automotive forgings with net exposure at 37% of its sales.The company booked export revenues at a rupee/dollar rate of48.7 in Q4FY2012 and hedged the H1FY2013 receivables. Hence,there are opportunities available for upside surprises in H2FY2013.We estimate an EPS benefit of 10% in FY2013 if the rupee sus-tains at the current levels against the dollar.
� Provogue: The company receives 15% of its sales in value termsfrom exports. Since there are no hedges taken and based on a9% depreciation in the rupee, the benefit on the FY2013 EPS isexpected to be around 16% if the rupee sustains at the levels of55.5 to the dollar.
� Divis’s Labs: The company has net forex exposure of 71%. About50% of the receivables are covered. We estimate a 10% EPSbenefit for FY2013 if the rupee sustains at 55.5 to the dollar.
� Cadilla: The company has net forex exposure of 43%. Only20% of its receivables are hedged and the rest of the positionsare open. We estimate a 9% EPS benefit for FY2013 if the ru-pee sustains at 55.5 to the dollar.�
IMPACT ON SHAREKHAN UNIVERSE DUE TO LARGE FOREIGN CURRENCY EXPOSURES
Company name Original, outstanding Redemption Red Red impact MTM loss already MTM bal. impact/ FCCB/ECB loan (Rs cr) value (Rs cr) date (Rs cr) provided in P&L FY13 cash profit (%)
Gayatri Projects 76.0 196.0 Aug-12 120.0 67.0 39.0
Sintex 765.0 943.5 Mar-13 178.5 46.63 28.0
Jaiprakash Ass. 1430.0 2633.0 Sep-12 1203 891 17.4
Tata Motors 1919.9 3439.0 Jul-12 1519.1 831.0 3.4
GCPL 300.0 333.0 Mar-13 16.5 0 2.0
*Rupee’s depreciation between March 31, 2012 and June 5, 2012
IMPACT ON SHAREKHAN UNIVERSE DUE TO LARGE NET EXPORTS
Company name Net Exposure Trade Dollar NFE # EPS Hedging strategyFY13 (Rs cr) appreciation (%) % of sales impact (%)
Infosys 21,576 INR-USD 9.0 56 10.0 Two quarters net receivables
TCS 38,499 INR-USD 9.0 65 10.0 Two quarters sales and net receivables
Bharat Forge 1,532 INR-USD 9.0 37 10.0 H1FY13 hedged
Provogue 109 INR-USD 9.0 15 6.7 Partly hedged
Divi's Labs 1,633 INR-USD 9.0 71 10.0 50% receivables hedged
Cadilla 1,179 INR-USD 9.0 43 9.0 80% exposure open
*Rupee’s depreciation between March 31, 2012 and June 5, 2012# NFE: Net foreign exposure
SWITCH IDEASEQUITY FUNDAMENTALS

July 2012 Sharekhan ValueGuide18
FY2012 audited PAT up 9.7% against unaudited numbersCOMPANY DETAILS
Price target: Rs1,805
Market cap: Rs10,360 cr
52 week high/low: Rs1,765/1,199
NSE volume (no. of shares): 44,272
BSE code: 500049
NSE code: BEL
Sharekhan code: BEL
Free float (no, of shares): 1.9 cr
(%) 1m 3m 6m 12m
Absolute 2.3 -17.5 -7.0 -16.7
Relative to Sensex -4.2 -17.0 -14.2 -15.2
PRICE PERFORMANCE
APPLE GREEN BUY; CMP: RS1,295 JUNE 25, 2012BHARAT ELECTRONICS
KEY POINTSFY2012 audited PAT up 9.7%: The audited financial numbers for FY2012 show animproved financial performance for Bharat Electronics Ltd (BEL) against the unauditedfinancials that were declared by the company in April this year. The FY2012 audited netprofit is higher by 9.7% at Rs829.9 crore against the unaudited net profit of Rs756.3crore.
The main reasons for the 9.7% increase in the net profit are� The operating cost decreased by Rs45.8 crore (0.8% of revenues) mainly on the back
of lower consumption of raw materials and a lower employee cost. The raw materialconsumed was lower due to a higher stock adjustment. This led the EBITDA margin torise to 8.7% in the audited financials against 7.8% in the unaudited financials.
� The effective tax rate in the audited financials reduced to 22.8% against 25.9% in theaudited financials.
Valuation and view: With the increase in the defence budget and the focus on modernisationof the defence technology, BEL is best placed to take a sizeable pie of the defence spend.The order book at 4.5x FY2012 sales gives BEL strong revenue visibility for at least thenext three years. The huge cash reserve of Rs847 per share gives the stock further support.The key risks, however, remain the timely delivery of orders and the margin performance,which has deteriorated through FY2012. We maintain our Buy rating on the stock with aprice target of Rs1,805.�
SHAREHOLDING PATTERN
Sharekhan Limited, its analyst or dependant(s) of the analyst might be
holding or having a postition in the companies mentioned in the article. For detailed report, please visit the Research section of our website, sharekhan.com.
Seizing loss in retailCOMPANY DETAILS
Price target: Rs405
Market cap: Rs3,353 cr
52 week high/low: Rs364/186
NSE volume (no. of shares): 2.4 lakh
BSE code: 500084
NSE code: CESC
Sharekhan code: CESC
Free float (no. of shares): 7.0 cr
(%) 1m 3m 6m 12m
Absolute 4.3 -12.9 25.5 -4.3
Relative to Sensex 0.8 -7.1 18.4 3.4
PRICE PERFORMANCE
UGLY DUCKLING BUY; CMP: RS267 JUNE 15, 2012CESC
KEY POINTSConsolidated results show decline in PAT: CESC reported its consolidated results withsatisfactory growth at the operational level. The decline at the net profit level was driven bydiscontinuation of deferred tax benefits this year. The power segment’s performance remainshealthy whereas the retail business continues to be loss making at the operating level.
Slow but steady improvement in reducing losses; but Spencer’s continues to burn cash: Thenet revenue from the retail business (Spencer’s) grew by 23% year on year (YoY) in FY2012.The revenues per sq ft grew by 11% to Rs11,550 in FY2012 but reported an operating lossat~13% which was 30% in FY2009. There was equity infusion of Rs108 crore in Spencer’sduring FY2012. There’s been an improvement in working capital management as inventorydays dropped from 42 days to 32 days.
ABPC yet to see profitability; gets equity injection: The net sales of ABPC jumped by 119%YoY to Rs9 crore in FY2012, driven by new store growth. However, the operating loss grewby 40%, and posted a net loss of Rs7 crore. The business however got an equity infusion ofRs10 crore in FY2012 as the management holds a positive outlook for the business.
Interest free loan from holding company to Music World to pinch investors: The sales ofthe Music World business are falling gradually; they declined by 28% in FY2012, followingan 11% YoY decline in FY2011. The losses were however restricted at Rs11 crore versusa loss of Rs13 crore in FY2011. Rs18.5 crore of interest free loan extended to MusicWorld by the holding company would pinch investors as the very outlook and the businessmodel is bleak.
Valuation and view: As expected the retail business is slowly progressing in reducing losses.However, we continue to have a Buy recommendation on CESC and retain our price targetof Rs405.�
SHAREHOLDING PATTERN
Sharekhan Limited, its analyst or dependant(s) of the analyst might be
holding or having a postition in the companies mentioned in the article. For detailed report, please visit the Research section of our website, sharekhan.com.
STOCK UPDATE EQUITY FUNDAMENTALS
Public & Others
2%
Promoters76%
Non-promoter corporate
2%
Institutions16%
Foreign4%
Promoters52%
Foreign18%
Institutions17%
Others13%

Sharekhan ValueGuide July 201219
Price target revised to Rs410COMPANY DETAILS
Price target: Rs410
Market cap: Rs40,718 cr
52 week high/low: Rs486/326
NSE volume (no. of shares): 12.8 lakh
BSE code: 532155
NSE code: GAIL
Sharekhan code: GAIL
Free float (no. of shares): 54.1 cr
(%) 1m 3m 6m 12m
Absolute -0.4 -14.0 -19.1 -25.8
Relative to Sensex 4.4 -5.6 -15.4 -16.0
PRICE PERFORMANCE
APPLE GREEN BUY; CMP: RS321 JUNE 5, 2012GAIL INDIA
RESULT HIGHLIGHTS� Performance dented by higher subsidy burden and one-off items: GAIL reported a
growth of 18% in its net sales to Rs10,488 crore, however, the operating profit margin(OPM) slipped sharply to 7.3% largely due to a higher subsidy burden of Rs1,390crore and one-time expenses related to a retro effective revision of tariff in parts of itsgas transmission business (close to Rs500 crore). Consequently, the reported net profitdeclined by 38% YoY and 56% QoQ to Rs483 crore.
� Fine-tuned FY2013 numbers and introduced FY2014: We are marginally revisingupwards our FY2013 estimates on better than expected outlook of the petchem business(largely mitigates the increase in the subsidy burden). We expect a subsidy burden ofRs3,350/3,025 crore for FY2013/14. We introduce FY2014 numbers assuming highergas transmission volume ~125mmscmd and estimate an EPS of Rs34.
� Valuation: retain Buy with revised price target of Rs410: GAIL’s share price has correctedsignificantly due to concerns of regulatory uncertainty and decline in the gas transmissionvolumes. However, tariff (of ~80%) for GAIL’s natural gas transmission pipeline hasalready been revised by the regulator, PNGRB; hence no downside risk and also we seeimprovement in petchem business. Hence, we retain Buy rating and prefer to takelonger-term view, despite flattish earnings growth in next two years. Currently it istrading at 7-8x its FY2013 and FY2014 EBITDA. We rate it as a Buy with a revisedprice target of Rs410.�
SHAREHOLDING PATTERN
Sharekhan Limited, its analyst or dependant(s) of the analyst might be
holding or having a postition in the companies mentioned in the article. For detailed report, please visit the Research section of our website, sharekhan.com.
Strong execution, higher margins contribute to growthCOMPANY DETAILS
Price target: Rs310
Market cap: Rs238 cr
52 week high/low: Rs196/76
BSE volume (no. of shares): 15,702
BSE code: 532767
Sharekhan code: GAYAPROJ
Free float (no. of shares): 8.8 cr
(%) 1m 3m 6m 12m
Absolute -11.9 -22.2 4.1 -38.5
Relative to Sensex -6.3 -15.2 2.8 -31.0
PRICE PERFORMANCE
UGLY DUCKLING BUY; CMP: RS99 JUNE 1, 2012GAYATRI PROJECTS
RESULT HIGHLIGHTS� Revenues up 45%; OPM expands; forex loss hits reported PAT: Revenues grew by 45%
YoY led by pickup in execution of BOT assets. The OPM witnessed huge expansion to18.1% in Q4FY2012 from 11.6% in Q4FY2011 and 13.7% in Q3FY2011 due to lowerconstruction cost. On a reported basis, The company reported a loss of Rs2.4 crore dueto 1) Rs67 crore forex translation loss on reclassification of FCCB liability as monetaryitem and 2) Rs11.9 crore being forex fluctuation loss on the buyback of FCCBs. Howeveradjusted PAT grew by 826% YoY led by a robust revenue growth, huge margin expansionand lower tax outgo.
� Healthy order book; Successfully completed Rights issue: The order book of the companystands at Rs9,830 crore which is 5.5x its FY2012 revenues. Out which, nearly 35% isexposed to Andhra Pradesh where progress is satisfactory. On the other hand, companysuccessfully allotted 1.2 crore equity shares of Rs10 each under the rights issue aggregatingto Rs144 crore in the ratio of 1:1 (promoters increased their stake from 55% to 63.47%).
� Revise estimates upwards for FY2013 while retain FY2014’s; maintain Buy (PT:- Rs310):Considering the robust order book, strong execution and margin expansion in FY2012we have revised our revenue estimates upwards for FY2013 and FY2014 by 5% and 2%respectively. However with increased debt and equity commitment required, the interestburden will go up. Hence earnings stand increased by 4% in FY2013 and remainunchanged for FY2014. Going ahead, the key thing to watch out will be the deferment ofthe FCCBs’ redemption and successful completion of the private equity deal. We maintainour Buy recommendation on the stock with a price target of Rs310. At the current marketprice, the stock is trading at 2.3x and 1.8x its FY2013E and FY2014E diluted earningsrespectively.�
SHAREHOLDING PATTERN
Sharekhan Limited, its analyst or dependant(s) of the analyst might be
holding or having a postition in the companies mentioned in the article. For detailed report, please visit the Research section of our website, sharekhan.com.
STOCK UPDATEEQUITY FUNDAMENTALS
Promoters58%
Foreign13%
Others4%
Institutions25%
Promoters64%
Public & others12%
CorporateBodies
3%Institutions
8%
Foreign13%

July 2012 Sharekhan ValueGuide20
Annual report review, downgraded to HoldCOMPANY DETAILS
Price target: Rs259
Market cap: Rs196,242 cr
52 week high/low: Rs253/185
NSE volume (no. of shares): 71.2 lakh
BSE code: 500875
NSE code: ITC
Sharekhan code: ITC
Free float (no. of shares): 781.8 cr
(%) 1m 3m 6m 12m
Absolute 9.1 14.4 26.6 38.6
Relative to Sensex 2.9 17.4 15.6 40.7
PRICE PERFORMANCE
APPLE GREEN HOLD; CMP: RS251 JUNE 22, 2012ITC
KEY POINTS� Further improvement in cash conversion cycle: ITC’s cash conversion cycle (CCC)
further improved to negative eleven days in FY2012 from negative five days in FY2011.The inventory days reduced to 79 days in FY2012 from 84 days in FY2011. This waslargely on account of efficient sourcing of raw materials for its various businesses. Thecreditor days stood at 104 days in FY2012 as against 103 days in FY2011.
� Strong cash generation ability: ITC has one of the strongest balance sheets amongst itspeers with a strong cash-generation ability. The cash generation from operations stoodat 28% of net sales, up from 25% of net sales in FY2011. After the capex the free cashflow of the firm at the stand-alone level grew by 14% YoY in FY2012. The incrementalcash flow was utilised to reward the shareholders with a strong dividend pay-out ofabout 67% in FY2012.
� Sustained improvement in return ratios: The return ratios have continued to improveon a Y-o-Y basis in the past four to five fiscals. The RoNW and the RoCE stood at35.5% and 44.6% respectively in FY2012, up from 33.2% and 42.5% in FY2011.
� Outlook and valuation: We have marginally revised upwards our earnings estimatesfor FY2013 and FY2014 by 1% and 2% respectively to factor in lower than earlieranticipated increase in the VAT rate. At the current market price the stock trades at26.7x its FY2013E EPS of Rs9.4 and 22.3x its FY2014E EPS of Rs11.3. In view oflimited upside from the current level we downgrade our recommendation on ITC fromBuy to Hold with the revised price target of Rs259.�
SHAREHOLDING PATTERN
Sharekhan Limited, its analyst or dependant(s) of the analyst might be
holding or having a postition in the companies mentioned in the article. For detailed report, please visit the Research section of our website, sharekhan.com.
Q4FY2012 earnings ahead of estimatesCOMPANY DETAILS
Price target: Rs105
Market cap: Rs13,092 cr
52 week high/low: Rs89/50
NSE volume (no. of shares): 1.9 cr
BSE code: 532532
NSE code: JPASSOCIAT
Sharekhan code: JPASSOCIAT
Free float (no. of shares): 113.0 cr
(%) 1m 3m 6m 12m
Absolute -16.9 -18.3 0.1 -27.8
Relative to Sensex -11.6 -11.0 -1.2 -19.0
PRICE PERFORMANCE
UGLY DUCKLING BUY; CMP: RS62 JUNE 1, 2012JAIPRAKASH ASSOCIATES
RESULT HIGHLIGHTS� JP Associates Ltd (JAL)’s stand-alone financials for Q4FY2012 include the effect of the
demerger of the cement division with effect from the appointed date of April 1, 2011.Hence, the financials are not comparable with the previous quarter’s financials.
� JAL on a stand-alone basis posted an adjusted net profit of Rs279 crore, which isahead of our estimate primarily on account of better than expected revenue growthand profitability in the construction and real estate divisions.
� The net sales of the company stood at Rs4,026 crore, which was largely supported byrevenue from its cement division. Further, the revenues from its construction and realestate divisions (Rs1,771 crore and Rs560 crore respectively) were ahead of our estimateson account of a pick-up in the execution of the ongoing projects. The operating profitmargin stood at 24.4% as compared with 20.4% a year ago on account of an increasein the profitability of its construction division.
� During the quarter the company was awarded two packages of 720MW each of hydro-electric projects consisting of dam, diversion tunnel, shafts and power house by Hydro-Electric Project Authority, Bhutan. The contract is worth Rs914 crore. The agreementhas been signed and the fund mobilisation work has begun.
� We are upgrading our earnings estimates for FY2013 and FY2014 mainly to factor inthe higher than expected profitability in the construction division. The revised EPSestimates for FY2013 and FY2014 now stand at Rs4.9 and Rs5.5 respectively on astand-alone basis.
� At the current market price, the stock is trading at PE of 12.8x FY2013 and 11.3xFY2014 stand-alone earnings estimates. We maintain our Buy recommendation onstock with target price of Rs105.�
SHAREHOLDING PATTERN
Sharekhan Limited, its analyst or dependant(s) of the analyst might be
holding or having a postition in the companies mentioned in the article. For detailed report, please visit the Research section of our website, sharekhan.com.
STOCK UPDATE EQUITY FUNDAMENTALS
Promoters46%
Public & others20%
Foreign20%
Institutions14%
Domestic Institutions
34%
FIIs49%
Others17%

Sharekhan ValueGuide July 201221
Strategic direction clear but short-term pain persistsCOMPANY DETAILS
Price target: Rs1,399
Market cap: Rs31,170 cr
52 week high/low: Rs1,428/906
NSE volume (no. of shares): 7.3 lakh
BSE code: 532500
NSE code: MARUTI
Sharekhan code: MARUTI
Free float (no. of shares): 13.2 cr
(%) 1m 3m 6m 12m
Absolute -10.3 -19.0 15.8 -9.0
Relative to Sensex -14.0 -15.2 8.8 -3.0
PRICE PERFORMANCE
APPLE GREEN HOLD; CMP: RS1,079 JUNE 14, 2012MARUTI SUZUKI INDIA
Single point thrust on localisation to moderate currency riskMaruti Suzuki (Maruti)’s key agenda is to reduce raw material import content from 20%to 13% in three years and hedge the same by increasing the export proportion from 9% to13% in the same period. The royalty payout to sales is 5.5-6.5% and carries currency risk.Maruti’s management aims at moderating royalty payout over the next three years bystepping up research and development (R&D) investments. Quantitatively, the aim is tobring down imports from $2.5 billion to $1.6 billion and increase exports from $0.8 billionto $1.3 billion over the next three years to create a natural hedge.
Lack of variation in diesel engine may restrict new model launches on dieselMaruti has licensed 1.3 litre diesel engines from Suzuki Motor Corporation (Suzuki) forten years with option to renew. The same engine has been licensed by Suzuki from Fiat.Maruti cannot change the engine specifications as per the agreement. Hence, all diesellaunches such as the Swift, Dzire and Ertiga are positioned around the 1.3 litre engine.
We are lowering our FY2013 volume estimates after incorporating significant stress onpetrol cars and cap on diesel engine capacity. Our new EPS estimates for FY2013 are nowlower by 5% at Rs79.3. We are building in some benefit of pent-up demand coming throughin FY2014. Hence our estimate of decline in EPS has been marginally lowered by 2.3% toRs93.3. Our new target now stands at Rs1,399/share. Given the aggressive medium termheadwinds, we recommend a Hold on the stock.�
SHAREHOLDING PATTERN
Sharekhan Limited, its analyst or dependant(s) of the analyst might be
holding or having a postition in the companies mentioned in the article. For detailed report, please visit the Research section of our website, sharekhan.com.
Stand-alone OPM declined, consolidated margin in lineCOMPANY DETAILS
Price target: Rs339
Market cap: Rs3,005 cr
52 week high/low: Rs290/166
NSE volume (no. of shares): 416,838
BSE code: 532654
NSE code: MCLEODRUSS
Sharekhan code: MCLEODRUSS
Free float (no. of shares): 5.9 cr
(%) 1m 3m 6m 12m
Absolute -0.3 20.3 26.1 5.7
Relative to Sensex 6.0 31.0 24.5 18.6
PRICE PERFORMANCE
UGLY DUCKLING BUY; CMP: RS275 JUNE 1, 2012MCLEOD RUSSEL INDIA
RESULT HIGHLIGHTS� FY2012 results—consolidated margins in line: The company’s consolidated net sales
grew by 13.9% YoY to Rs1,445.3 crore in FY2012 with sales volume growth standingat 8% YoY; the consolidated average realisation grew by 5% YoY. Though the stand-alone operating profit margin (OPM)declined by 350 basis points YoY to 24.6%, theconsolidated OPM stood at 26.9%. This was largely on account of a 53-basis-point Y-o-Y improvement to 37.5% in the margin of the Ugandan business and the strongEBIDTA margin of ~57% for the Rwandan business. The strong growth of 27% YoYin the other income and a 46.8% Y-o-Y decline in the tax resulted in a 21.5% Y-o-Ygrowth in the adjusted profit after tax (PAT) to Rs302.9 crore.
� Global tea shortfall on cards, tea prices to move up: The year 2012 started with aproduction decline in most of the key tea exporting nations including Kenya and SriLanka. Cumulatively (January-April 2012), tea production in Kenya and Sri Lankawas down by about 22% YoY and 7% YoY respectively. India’s tea production declinedby 10.5% YoY during the same period. On the other hand, the tea consumption globallyis increasing by about 3% per annum. This will have a favourable impact on the pricesgoing ahead. The tea prices in India are currently higher by Rs30 per kg as comparedwith the prices in the previous year.
� Outlook and valuation: We expect the company’s top line and bottom line to grow ata CAGR of 17% and 21% respectively over FY2012-14 on the back of a strongimprovement in the average realisation. At the current market price the stock is tradingat 9.2x its FY2013E EPS of Rs29.9 and 7.2x its FY2014E EPS of Rs38.2. We maintainour Buy recommendation on the stock with a price target of Rs339.�
SHAREHOLDING PATTERN
Sharekhan Limited, its analyst or dependant(s) of the analyst might be
holding or having a postition in the companies mentioned in the article. For detailed report, please visit the Research section of our website, sharekhan.com.
STOCK UPDATEEQUITY FUNDAMENTALS
Promoters45%
FIIs33%
Others16%
Domestic institutions
6%
Promoters54%
Foreign21%
Institutions16%
Public & Others3%Non Promoter
corporate6%
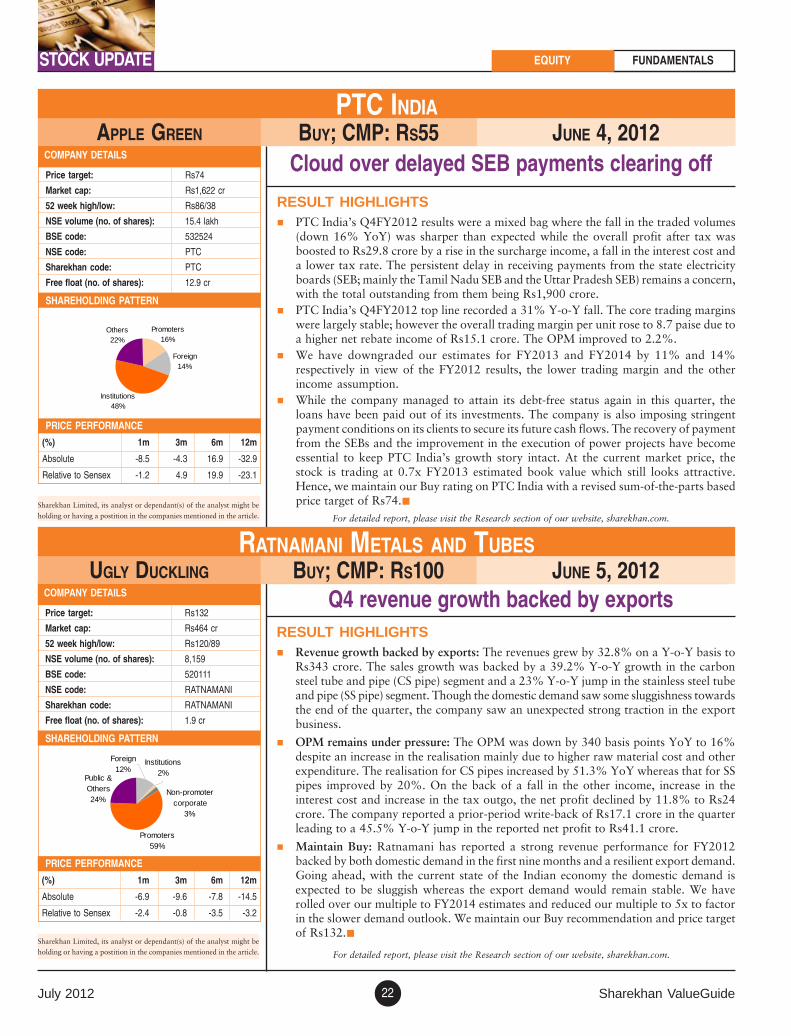
July 2012 Sharekhan ValueGuide22
Cloud over delayed SEB payments clearing offCOMPANY DETAILS
Price target: Rs74
Market cap: Rs1,622 cr
52 week high/low: Rs86/38
NSE volume (no. of shares): 15.4 lakh
BSE code: 532524
NSE code: PTC
Sharekhan code: PTC
Free float (no. of shares): 12.9 cr
(%) 1m 3m 6m 12m
Absolute -8.5 -4.3 16.9 -32.9
Relative to Sensex -1.2 4.9 19.9 -23.1
PRICE PERFORMANCE
APPLE GREEN BUY; CMP: RS55 JUNE 4, 2012PTC INDIA
RESULT HIGHLIGHTS� PTC India’s Q4FY2012 results were a mixed bag where the fall in the traded volumes
(down 16% YoY) was sharper than expected while the overall profit after tax wasboosted to Rs29.8 crore by a rise in the surcharge income, a fall in the interest cost anda lower tax rate. The persistent delay in receiving payments from the state electricityboards (SEB; mainly the Tamil Nadu SEB and the Uttar Pradesh SEB) remains a concern,with the total outstanding from them being Rs1,900 crore.
� PTC India’s Q4FY2012 top line recorded a 31% Y-o-Y fall. The core trading marginswere largely stable; however the overall trading margin per unit rose to 8.7 paise due toa higher net rebate income of Rs15.1 crore. The OPM improved to 2.2%.
� We have downgraded our estimates for FY2013 and FY2014 by 11% and 14%respectively in view of the FY2012 results, the lower trading margin and the otherincome assumption.
� While the company managed to attain its debt-free status again in this quarter, theloans have been paid out of its investments. The company is also imposing stringentpayment conditions on its clients to secure its future cash flows. The recovery of paymentfrom the SEBs and the improvement in the execution of power projects have becomeessential to keep PTC India’s growth story intact. At the current market price, thestock is trading at 0.7x FY2013 estimated book value which still looks attractive.Hence, we maintain our Buy rating on PTC India with a revised sum-of-the-parts basedprice target of Rs74.�
SHAREHOLDING PATTERN
Sharekhan Limited, its analyst or dependant(s) of the analyst might be
holding or having a postition in the companies mentioned in the article. For detailed report, please visit the Research section of our website, sharekhan.com.
Q4 revenue growth backed by exportsCOMPANY DETAILS
Price target: Rs132
Market cap: Rs464 cr
52 week high/low: Rs120/89
NSE volume (no. of shares): 8,159
BSE code: 520111
NSE code: RATNAMANI
Sharekhan code: RATNAMANI
Free float (no. of shares): 1.9 cr
(%) 1m 3m 6m 12m
Absolute -6.9 -9.6 -7.8 -14.5
Relative to Sensex -2.4 -0.8 -3.5 -3.2
PRICE PERFORMANCE
UGLY DUCKLING BUY; CMP: RS100 JUNE 5, 2012RATNAMANI METALS AND TUBES
RESULT HIGHLIGHTS� Revenue growth backed by exports: The revenues grew by 32.8% on a Y-o-Y basis to
Rs343 crore. The sales growth was backed by a 39.2% Y-o-Y growth in the carbonsteel tube and pipe (CS pipe) segment and a 23% Y-o-Y jump in the stainless steel tubeand pipe (SS pipe) segment. Though the domestic demand saw some sluggishness towardsthe end of the quarter, the company saw an unexpected strong traction in the exportbusiness.
� OPM remains under pressure: The OPM was down by 340 basis points YoY to 16%despite an increase in the realisation mainly due to higher raw material cost and otherexpenditure. The realisation for CS pipes increased by 51.3% YoY whereas that for SSpipes improved by 20%. On the back of a fall in the other income, increase in theinterest cost and increase in the tax outgo, the net profit declined by 11.8% to Rs24crore. The company reported a prior-period write-back of Rs17.1 crore in the quarterleading to a 45.5% Y-o-Y jump in the reported net profit to Rs41.1 crore.
� Maintain Buy: Ratnamani has reported a strong revenue performance for FY2012backed by both domestic demand in the first nine months and a resilient export demand.Going ahead, with the current state of the Indian economy the domestic demand isexpected to be sluggish whereas the export demand would remain stable. We haverolled over our multiple to FY2014 estimates and reduced our multiple to 5x to factorin the slower demand outlook. We maintain our Buy recommendation and price targetof Rs132.�
SHAREHOLDING PATTERN
Sharekhan Limited, its analyst or dependant(s) of the analyst might be
holding or having a postition in the companies mentioned in the article. For detailed report, please visit the Research section of our website, sharekhan.com.
STOCK UPDATE EQUITY FUNDAMENTALS
Promoters59%
Foreign12%
Institutions2%
Non-promoter corporate
3%
Public & Others24%
Foreign14%
Institutions48%
Others22%
Promoters16%

Sharekhan ValueGuide July 201223
Annual report reviewCOMPANY DETAILS
Price target: Rs500
Market cap: Rs2,444 cr
52 week high/low: Rs439/300
NSE volume (no. of shares): 4.4 lakh
BSE code: 500330
NSE code: RAYMOND
Sharekhan code: RAYMOND
Free float (no. of shares): 3.7 cr
(%) 1m 3m 6m 12m
Absolute 10.6 -0.6 18.0 10.8
Relative to Sensex 5.4 -0.6 10.4 17.7
PRICE PERFORMANCE
UGLY DUCKLING BUY; CMP: RS398 JUNE 27, 2012RAYMOND
KEY POINTS� Strong double-digit growth in consolidated revenues in FY2012 but profitability suffers:
FY2012 was the second consecutive fiscal when Raymond posted an over 20% growth.The revenue growth at 20.5% was driven by volume as well as improvement in blendedrealisations. Like other apparel retail plays, Raymond too saw a consumer slowdownhitting its business by end of Q2FY2012, that dragged the overall operating performanceon a consolidated basis.
� Disclosure norms improved; in terms of segments denim witnessed highest profitabilityimprovement: As opposed to the erstwhile structure of reporting the stand-aloneperformance on a quarterly basis and providing the overall consolidated picture onlyon an annual basis, from H1FY2012 onwards Raymond started reporting results onboth stand-alone and consolidated basis. Dissecting the segmental results, we observethat the denim business showed a tremendous improvement on the profitability front—
� Maintain our Buy rating and price target for the stock: We believe that Raymond, witha continuous focus on its power brands and a strong distribution franchise, is all set toencash on the strong secular consumer wave waiting ahead. Hence, we continue withour bullish view on the company. Further, any development with regard the Thaneland in the form of either joint development or disposal would lead to value unlockingand provide significant cash for the company. We maintain our Buy rating on the stockwith a sum-of–the-parts (SOTP) based price target of Rs500 (valuing the core businessat 10x FY2014E earnings plus 50% value for the Thane land bank parcel).�
SHAREHOLDING PATTERN
Sharekhan Limited, its analyst or dependant(s) of the analyst might be
holding or having a postition in the companies mentioned in the article. For detailed report, please visit the Research section of our website, sharekhan.com.
Niko cuts KG-D6 reserves; price target revised to Rs800COMPANY DETAILS
Price target: Rs800
Market cap: Rs237,595 cr
52 week high/low: Rs906/671
NSE volume (no. of shares): 40.8 lakh
BSE code: 500325
NSE code: RELIANCE
Sharekhan code: RELIANCE
Free float (no. of shares): 181.6 cr
(%) 1m 3m 6m 12m
Absolute 5.9 0.3 -3.8 -16.0
Relative to Sensex 1.0 0.4 -10.0 -10.8
PRICE PERFORMANCE
EVERGREEN BUY; CMP: RS723 JUNE 27, 2012RELIANCE INDUSTRIES
KEY POINTS� Niko Resources (Niko), which holds a 10% stake in the Krishna-Godavari D-6 (KG-
D6) has cut estimate of the natural gas field’s proven plus probable (2P) reserves by80% to 1.93 tcf which includes producing D1/D3 and MA fields and excludes theaddition possible from satellite discoveries and R-series discoveries. As per revisedestimates the 2P reserves at the KG-D6 block stand at 1.93 trillion cubic feet (tcf) asagainst previous estimates of 9.6-9.9 tcf. The key reasons for this downgrade as sitedby Niko are 1) field performance at the D1/D3 field demonstrated higher than expectedpressure draw-downs, and 2) the current D1/D3 producing wells did not appear to bereceiving any contribution from outside the main channel areas.
� As per RIL’s annual report for FY2012, the 1P reserves of KG-D6 stood at 3.7 tcf includingreserves from the Panna-Mukta-Tapti (PMT) field, other satellite blocks and coal bedmethane (CBM) blocks. In line with the revised estimates, we are also revising down outassumption of recoverable reserves to around 8 tcf (as against 11 tcf estimated earlier).
� The impact of the downgrade in reserves estimates for KG-D6 from 11 tcf to 8 tcf willbe neutral on our FY2013 and FY2014 earnings estimates. However, on the valuationfront we are downgrading our valuation for KG-D6 to Rs75 per share and accordinglyarrive at a revised target price of Rs800 per share.
� In terms of positives, the depreciation of the rupee (INR) is a positive for the exportoriented business of RIL. But the declining prices of crude oil are likely to result insome inventory losses in the near term. We are also hopeful about the potential upturnin refining margins by H2FY2013 and better spread between light/heavy crude margindifferential.�
SHAREHOLDING PATTERN
Sharekhan Limited, its analyst or dependant(s) of the analyst might be
holding or having a postition in the companies mentioned in the article. For detailed report, please visit the Research section of our website, sharekhan.com.
STOCK UPDATEEQUITY FUNDAMENTALS
Foreign10%
Institutions27%
Non-promoter corporate
3%
Promoters40%
Public & Others20%
Promoters45%
Institutions28%
Bodies Corporate
5%
Others22%
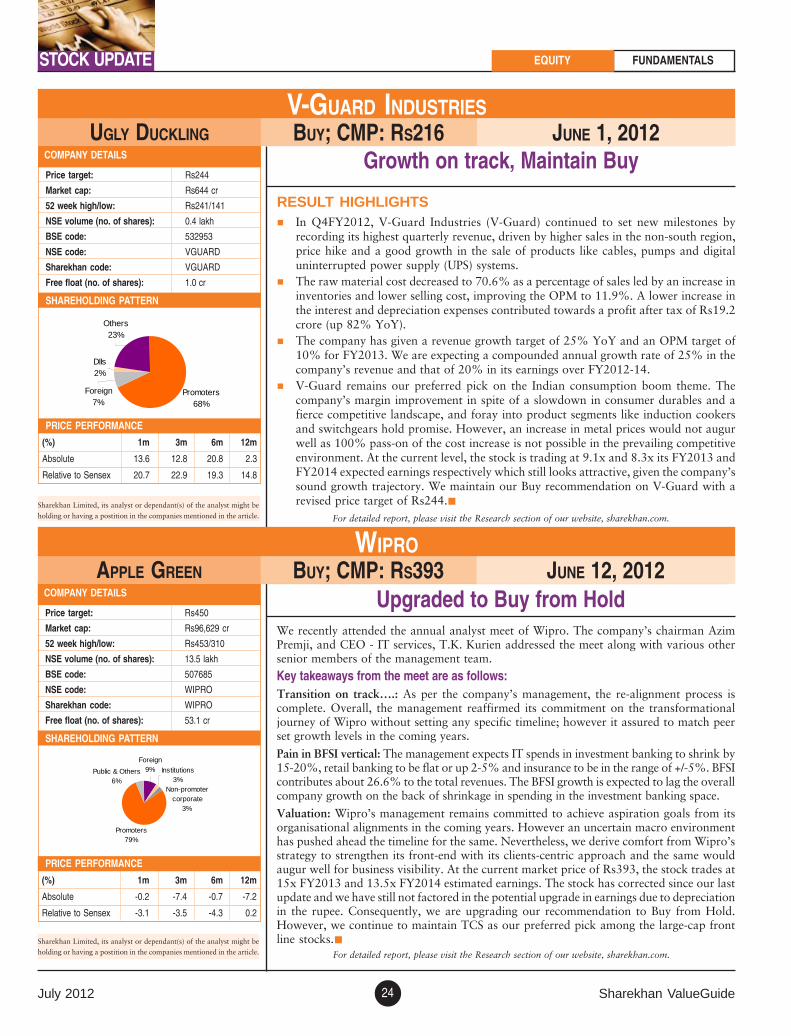
July 2012 Sharekhan ValueGuide24
Growth on track, Maintain BuyCOMPANY DETAILS
Price target: Rs244
Market cap: Rs644 cr
52 week high/low: Rs241/141
NSE volume (no. of shares): 0.4 lakh
BSE code: 532953
NSE code: VGUARD
Sharekhan code: VGUARD
Free float (no. of shares): 1.0 cr
(%) 1m 3m 6m 12m
Absolute 13.6 12.8 20.8 2.3
Relative to Sensex 20.7 22.9 19.3 14.8
PRICE PERFORMANCE
UGLY DUCKLING BUY; CMP: RS216 JUNE 1, 2012V-GUARD INDUSTRIES
RESULT HIGHLIGHTS� In Q4FY2012, V-Guard Industries (V-Guard) continued to set new milestones by
recording its highest quarterly revenue, driven by higher sales in the non-south region,price hike and a good growth in the sale of products like cables, pumps and digitaluninterrupted power supply (UPS) systems.
� The raw material cost decreased to 70.6% as a percentage of sales led by an increase ininventories and lower selling cost, improving the OPM to 11.9%. A lower increase inthe interest and depreciation expenses contributed towards a profit after tax of Rs19.2crore (up 82% YoY).
� The company has given a revenue growth target of 25% YoY and an OPM target of10% for FY2013. We are expecting a compounded annual growth rate of 25% in thecompany’s revenue and that of 20% in its earnings over FY2012-14.
� V-Guard remains our preferred pick on the Indian consumption boom theme. Thecompany’s margin improvement in spite of a slowdown in consumer durables and afierce competitive landscape, and foray into product segments like induction cookersand switchgears hold promise. However, an increase in metal prices would not augurwell as 100% pass-on of the cost increase is not possible in the prevailing competitiveenvironment. At the current level, the stock is trading at 9.1x and 8.3x its FY2013 andFY2014 expected earnings respectively which still looks attractive, given the company’ssound growth trajectory. We maintain our Buy recommendation on V-Guard with arevised price target of Rs244.�
SHAREHOLDING PATTERN
Sharekhan Limited, its analyst or dependant(s) of the analyst might be
holding or having a postition in the companies mentioned in the article. For detailed report, please visit the Research section of our website, sharekhan.com.
Upgraded to Buy from HoldCOMPANY DETAILS
Price target: Rs450
Market cap: Rs96,629 cr
52 week high/low: Rs453/310
NSE volume (no. of shares): 13.5 lakh
BSE code: 507685
NSE code: WIPRO
Sharekhan code: WIPRO
Free float (no. of shares): 53.1 cr
(%) 1m 3m 6m 12m
Absolute -0.2 -7.4 -0.7 -7.2
Relative to Sensex -3.1 -3.5 -4.3 0.2
PRICE PERFORMANCE
APPLE GREEN BUY; CMP: RS393 JUNE 12, 2012WIPRO
We recently attended the annual analyst meet of Wipro. The company’s chairman AzimPremji, and CEO - IT services, T.K. Kurien addressed the meet along with various othersenior members of the management team.
Key takeaways from the meet are as follows:Transition on track….: As per the company’s management, the re-alignment process iscomplete. Overall, the management reaffirmed its commitment on the transformationaljourney of Wipro without setting any specific timeline; however it assured to match peerset growth levels in the coming years.
Pain in BFSI vertical: The management expects IT spends in investment banking to shrink by15-20%, retail banking to be flat or up 2-5% and insurance to be in the range of +/-5%. BFSIcontributes about 26.6% to the total revenues. The BFSI growth is expected to lag the overallcompany growth on the back of shrinkage in spending in the investment banking space.
Valuation: Wipro’s management remains committed to achieve aspiration goals from itsorganisational alignments in the coming years. However an uncertain macro environmenthas pushed ahead the timeline for the same. Nevertheless, we derive comfort from Wipro’sstrategy to strengthen its front-end with its clients-centric approach and the same wouldaugur well for business visibility. At the current market price of Rs393, the stock trades at15x FY2013 and 13.5x FY2014 estimated earnings. The stock has corrected since our lastupdate and we have still not factored in the potential upgrade in earnings due to depreciationin the rupee. Consequently, we are upgrading our recommendation to Buy from Hold.However, we continue to maintain TCS as our preferred pick among the large-cap frontline stocks.�
SHAREHOLDING PATTERN
Sharekhan Limited, its analyst or dependant(s) of the analyst might be
holding or having a postition in the companies mentioned in the article. For detailed report, please visit the Research section of our website, sharekhan.com.
STOCK UPDATE EQUITY FUNDAMENTALS
Promoters68%
DIIs2%
Foreign7%
Others23%
Foreign9% Institutions
3%Non-promoter
corporate3%
Promoters79%
Public & Others6%

Sharekhan ValueGuide July 201225
Q4FY2012 earnings reviewSHAREKHAN SPECIAL JUNE 8, 2012
KEY POINTS� Earnings beat estimates, but skewed by a couple of companies:
The aggregate adjusted earnings growth of the Sensex companiescame in at 20.5% year on year (YoY), higher than our estimateof 14.8% and way ahead of the Street’s expectation. However,the robust growth is more of an optical illusion and the resultof the low base effect in case of State Bank of India (SBI) andOil and Natural Gas Corporation (ONGC). Excluding SBI andONGC, the Sensex’ adjusted earnings growth drops to 5.3% inQ4FY2012 as compared with the Q4FY2011 performance.
� Top performers/losers: On an overall basis, one-third of theSensex companies reported a decline in their adjusted net profitduring the quarter. Among the top three Sensex companies thatbeat our and the consensus estimates are ICICI Bank, SBI andSun Pharmaceutical Industries (Sun Pharma). On the other hand,among the Sensex companies the key disappointments camefrom Tata Steel, GAIL and Bharti Airtel.
� Revenue growth moderates but still above 20%: The aggregaterevenue growth of the Sensex companies stood at 20.3%, whichis lower than 25% in Q3FY2012 but still reasonably strong,given the macro environment; it is also in line with expectations.The growth in the revenues was led by the automobile (auto),information technology (IT) services and pharmaceutical
(pharma) sectors apart from a robust net interest income (NII)growth of banks. On the other hand, real estate, capital goodsand metal companies were the laggards.
� Margins remain under pressure: The margin of the Sensexcompanies (ex banks) declined to 19.5% from 22.4% inQ4FY2011. The major stress was seen across the power sectoras well as in Reliance Industries, where the decline in the outputof high-margin gas production significantly dented itsprofitability.
� Earnings downgrades resume; valuations quite supportive now:After a lull of a few months, the Q4 results season witnessedthe resumption of the downgrade of consensus earnings estimateby analysts. The FY2013 consensus earnings estimate hasdeclined by around 1.4% in the past four to six weeks. Afterthe downgrade of the earnings estimates, the Street is factoringin a growth of around 10% in the aggregate earnings of theSensex during FY2013 which is a far cry from the lofty consensusestimate of a 22% growth about 15 months back. We believethe revised expectation of the Street is much more achievableand realistic now. Currently, the Sensex trades at ~13x FY2013consensus earnings estimate and 11.5x its FY2014 consensusearnings estimate.�
TREND IN SENSEX’ (EX OIL) GROWTH—ACTUAL VS ESTIMATED SECTOR-WISE CONTRIBUTION TO SENSEX’ EARNINGS GROWTH (EX OIL & SBI)
6 .1%
4.1%
2.6%
-0 .5%-0 .5%0.3%1.1%1.1%2.2%
2.2%
2.6%5.2%
0%
2%
4%
6%
8%
10%
12%
14%
16%
18%
Aut
o IT
Cap
ital g
oods
Ban
k (e
x S
BI)
FM
CG
Pha
rma
Rea
l est
ate
Pow
er
Tel
ecom
Div
ersi
fied
Met
al
Sen
sex
-20%
-10%
0%
10%
20%
30%
40%
50%
Q4F
Y05
Q2F
Y06
Q4F
Y06
Q2F
Y07
Q4F
Y07
Q2F
Y08
Q4F
Y08
Q2F
Y09
Q4F
Y09
Q2F
Y10
Q4F
Y10
Q2F
Y11
Q4F
Y11
Q2F
Y12
Q4F
Y12
Ex pec ted A djus ted PA T
-60% -40% -20% 0% 20% 40% 60% 80%
Pharma
Auto
Energy
FMCG
Banking & Finance (ex-SBI)
Capital goods
IT
Pow er
Diversified
Telecom
Metal
Real estate
SECTOR-WISE EARNINGS GROWTH IN Q4FY2012 (EX SBI) OUTPERFORMERS UNDERPERFORMERS
Sharekhan Limited, its analyst or dependant(s) of the analyst might be holding orhaving a postition in the companies mentioned in the article.
For detailed report, please visit the Research section of our website, sharekhan.com.
TCS, HCL Tech Infosys
ICICI Bank, SBI Corporation Bank, Andhra Bank
ITC, HUL, Godrej Consumer Zydus Wellness
L&T, V-Guard Thermax, Crompton Greaves
Apollo Tyres, ITNL Maruti, Pratibha Industries
Sun Pharma, Divi’s Lab Cadila Healthcare, GAIL,Bharti Airtel
UltraTech, Deepak Fertilisers RIL, United Phosphorous
SHAREKHAN SPECIALEQUITY FUNDAMENTALS
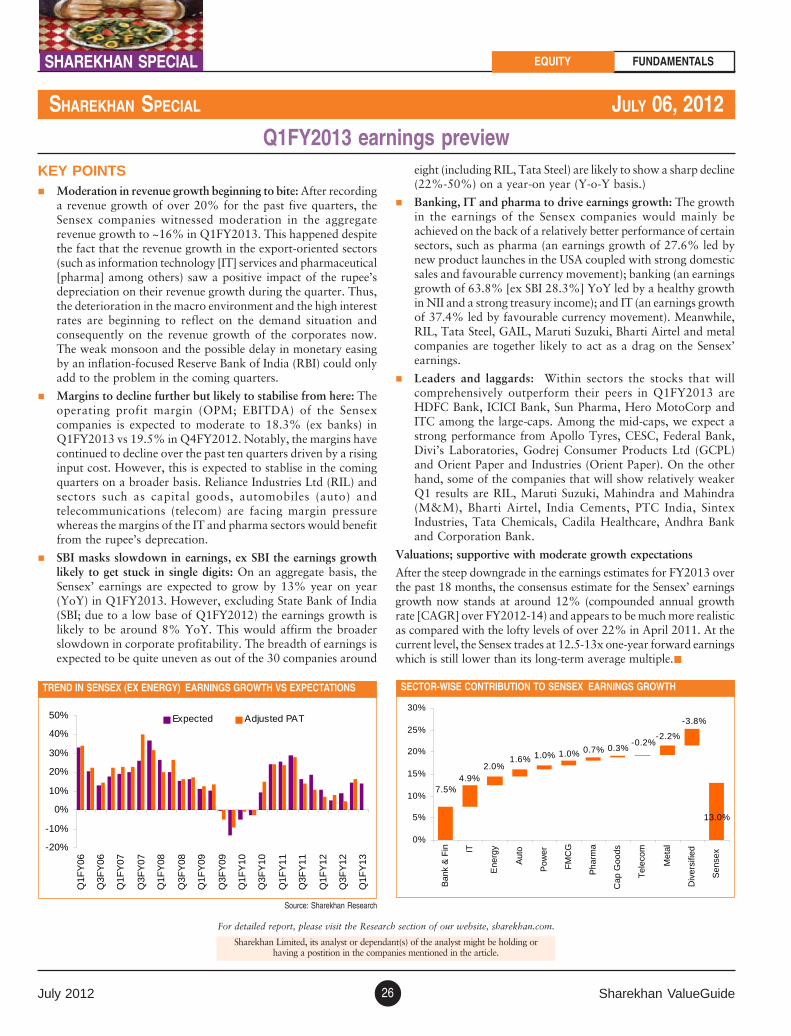
July 2012 Sharekhan ValueGuide26
Q1FY2013 earnings previewSHAREKHAN SPECIAL JULY 06, 2012
KEY POINTS� Moderation in revenue growth beginning to bite: After recording
a revenue growth of over 20% for the past five quarters, theSensex companies witnessed moderation in the aggregaterevenue growth to ~16% in Q1FY2013. This happened despitethe fact that the revenue growth in the export-oriented sectors(such as information technology [IT] services and pharmaceutical[pharma] among others) saw a positive impact of the rupee’sdepreciation on their revenue growth during the quarter. Thus,the deterioration in the macro environment and the high interestrates are beginning to reflect on the demand situation andconsequently on the revenue growth of the corporates now.The weak monsoon and the possible delay in monetary easingby an inflation-focused Reserve Bank of India (RBI) could onlyadd to the problem in the coming quarters.
� Margins to decline further but likely to stabilise from here: Theoperating profit margin (OPM; EBITDA) of the Sensexcompanies is expected to moderate to 18.3% (ex banks) inQ1FY2013 vs 19.5% in Q4FY2012. Notably, the margins havecontinued to decline over the past ten quarters driven by a risinginput cost. However, this is expected to stablise in the comingquarters on a broader basis. Reliance Industries Ltd (RIL) andsectors such as capital goods, automobiles (auto) andtelecommunications (telecom) are facing margin pressurewhereas the margins of the IT and pharma sectors would benefitfrom the rupee’s deprecation.
� SBI masks slowdown in earnings, ex SBI the earnings growthlikely to get stuck in single digits: On an aggregate basis, theSensex’ earnings are expected to grow by 13% year on year(YoY) in Q1FY2013. However, excluding State Bank of India(SBI; due to a low base of Q1FY2012) the earnings growth islikely to be around 8% YoY. This would affirm the broaderslowdown in corporate profitability. The breadth of earnings isexpected to be quite uneven as out of the 30 companies around
Sharekhan Limited, its analyst or dependant(s) of the analyst might be holding orhaving a postition in the companies mentioned in the article.
For detailed report, please visit the Research section of our website, sharekhan.com.
eight (including RIL, Tata Steel) are likely to show a sharp decline(22%-50%) on a year-on year (Y-o-Y basis.)
� Banking, IT and pharma to drive earnings growth: The growthin the earnings of the Sensex companies would mainly beachieved on the back of a relatively better performance of certainsectors, such as pharma (an earnings growth of 27.6% led bynew product launches in the USA coupled with strong domesticsales and favourable currency movement); banking (an earningsgrowth of 63.8% [ex SBI 28.3%] YoY led by a healthy growthin NII and a strong treasury income); and IT (an earnings growthof 37.4% led by favourable currency movement). Meanwhile,RIL, Tata Steel, GAIL, Maruti Suzuki, Bharti Airtel and metalcompanies are together likely to act as a drag on the Sensex’earnings.
� Leaders and laggards: Within sectors the stocks that willcomprehensively outperform their peers in Q1FY2013 areHDFC Bank, ICICI Bank, Sun Pharma, Hero MotoCorp andITC among the large-caps. Among the mid-caps, we expect astrong performance from Apollo Tyres, CESC, Federal Bank,Divi’s Laboratories, Godrej Consumer Products Ltd (GCPL)and Orient Paper and Industries (Orient Paper). On the otherhand, some of the companies that will show relatively weakerQ1 results are RIL, Maruti Suzuki, Mahindra and Mahindra(M&M), Bharti Airtel, India Cements, PTC India, SintexIndustries, Tata Chemicals, Cadila Healthcare, Andhra Bankand Corporation Bank.
Valuations; supportive with moderate growth expectations
After the steep downgrade in the earnings estimates for FY2013 overthe past 18 months, the consensus estimate for the Sensex’ earningsgrowth now stands at around 12% (compounded annual growthrate [CAGR] over FY2012-14) and appears to be much more realisticas compared with the lofty levels of over 22% in April 2011. At thecurrent level, the Sensex trades at 12.5-13x one-year forward earningswhich is still lower than its long-term average multiple.�
EQUITY FUNDAMENTALSSHAREKHAN SPECIAL
TREND IN SENSEX (EX ENERGY)’ EARNINGS GROWTH VS EXPECTATIONS SECTOR-WISE CONTRIBUTION TO SENSEX’ EARNINGS GROWTH
-20%
-10%
0%
10%
20%
30%
40%
50%
Q1F
Y06
Q3F
Y06
Q1F
Y07
Q3F
Y07
Q1F
Y08
Q3F
Y08
Q1F
Y09
Q3F
Y09
Q1F
Y10
Q3F
Y10
Q1F
Y11
Q3F
Y11
Q1F
Y12
Q3F
Y12
Q1F
Y13
Expected Adjusted PAT
Source: Sharekhan Research
7.5%4.9%
2.0%1.6% 1.0% 1.0% 0.7% 0.3%
-0.2%-2.2%
-3.8%
13.0%
0%
5%
10%
15%
20%
25%
30%
Ban
k &
Fin IT
Ene
rgy
Aut
o
Pow
er
FM
CG
Pha
rma
Cap
Goo
ds
Tel
ecom
Met
al
Div
ersi
fied
Sen
sex

Sharekhan ValueGuide July 201227
SECTOR UPDATEEQUITY FUNDAMENTALS
Infra investment catches PM’s attention finally
CONSTRUCTION JUNE 26, 2012
Key points� Recent meeting of PM promises to push infrastructure develop-
ment: In a recent meeting of the Planning Commission, the min-isters and secretaries of the key infrastructure, the prime ministerpromised a big push to infrastructure development in FY2013.This comes on the back of a series of steps taken by the PMOover the past six months to stimulate investment. The govern-ment proposes to award (1) 9,500km of road projects, (2) 42ports including two major ports, (3) seven airports including threegreenfield airports, (4) PPP initiative in railways, (5) 18,000MWof power generation capacity, and (6) 470 mt of coal dispatch byCoal India Ltd (CIL).
� But will the government walk the talk? Direct intervention bythe PMO should stimulate infrastructure investment in FY2013,outcome of which will be reflected over the next two to threequarters. Since January 2012 a series of steps have been takenin this respect. These include: (1) 17 PSUs advised to speed uptheir capex; (2) Dedicated freight corridor given top priority;(3) CIL directed to sign FSAs with power plants; and (4) aninvestment tracking system to be set up for infrastructureprojects. Further to speed up the implementation of the largeprojects by fast tracking approvals and clearances The Deputychairman of commission, Montek Singh Ahluwalia, has hintedto soon announce measures. Sharekhan Limited, its analyst or dependant(s) of the analyst might be holding or
having a postition in the companies mentioned in the article.
For detailed report, please visit the Research section of our website, sharekhan.com.
DAS deadline gets an extension
MEDIA JUNE 21, 2012
On the back of a lower than expected seeding of set-top boxes (STBs)in the Phase I in the four metros (24% seeding till June 1, 2012), themuch anticipated deadline for the implementation of the DigitalAddressable System (DAS) in the four metros has now been extendedby four months from June 30, 2012 to October 31, 2012. The infor-mation & broadcasting ministry has, however, maintained statusquo on the sunset date for the other regions and for the pan-Indiadigitisation by December 2014. The major beneficiary of the phasedmandatory digitisation will be direct-to-home players (Dish TV),multi-system operators (MSOs; Hathway Cable & Datacom, DenNetworks) and broadcasters (Zee Entertainment Enterprises and SunTV). We remain positively biased on Dish TV.
Event: DAS phase I deadline extended by four months� The Ministry of Information & Broadcasting has extended the
DAS deadline by four months. The ministry has decided to modifythe June 30th deadline for a complete switchover to October 31,2012 for all four metro cities, ie Delhi, Mumbai, Chennai andKolkata. All the Telecom Regulatory Authority of India (TRAI)regulations for DAS will come into effect from November 1, 2012.
STB seeding at 24% till June 1, 2012: As per data released by theinformation and broadcasting ministry till June 1, 2012 against acombined requirement of 12.3 million digital STBs across Delhi,
Sharekhan Limited, its analyst or dependant(s) of the analyst might be holding orhaving a postition in the companies mentioned in the article.
For detailed report, please visit the Research section of our website, sharekhan.com.
Mumbai, Kolkata and Chennai, only 2.9 million STBs were actuallyseeded, a seeding rate of 24%.
Among the four metros, Mumbai leads with the highest penetrationof digital STBs at 38.5% till June 1, 2012 while Chennai fares theworst with 12.5%. Delhi has managed to seed digital STBs in nearly19.9% cable homes while Kolkata has seen seeding of 20.7% of thetotal requirement.
View: The extension of the deadline for the implementation ofdigitisation in four metros was imminent after the lower than ex-pected seeding in the first phase. However, a four-month extensionwas better than the expectations of an extension of five to six months.However, the extension will set a precedent for future extensions ofdeadlines for the others regions (digitisation of the cable services inthe entire country by December 2014), which will create uncertain-ties in the mind of investors. Although the process of digitisation willbe a herculean task for the government, yet we derive comfort fromthe government’s commitment to bring digitisation to the forefront.We remain positively biased on Dish TV.�
� Order inflow continues its lacklustre show even in Q1FY2013:The order inflow continues its downslide even in Q1FY2013 withnew projects announced so far standing at merely Rs243 billion(with only five days left for the quarter to end). Currently, theinflows are down 51% Y-o-Y and 46% Q-o-Q. It’s only the build-ing and urban infrastructure segments that have seen higher in-flows. Otherwise, the critical segments like power, oil & gas andindustrial have been a major disappointment. Even the road BOTsegment, which has been the main driving force over the last fewquarters, has been tepid this quarter with only Rs65 billion worthof projects announced against an average of Rs200 billion worthof projects announced over the last three to four quarters.
� Outlook: The direct intervention of the PM in providing an im-petus to infrastructure investment seems to be a positive step buta lack of clear deadline, methods to accelerate clearances, fastland acquisition process and concrete execution detailing seemto be taking the steam out. Thus, measures to be taken to imple-ment projects will be the key monitorables. However, if the pro-cedural delays are addressed then it will be a huge positive forthe infrastructure sector. Thus, we believe that one can start ac-cumulating infrastructure stocks from a long-term perspective asthe downside now seems limited.�

July 2012 Sharekhan ValueGuide28
EQUITY FUNDAMENTALSVIEWPOINT
Capacity addition pace needs to be ramped up...
NTPCVIEWPOINT JUNE 13, 2012CMP: RS154
As per media reports, NTPC has lowered its capacity addition tar-
get from 29,000MW to 14,500MW in the 12th Five-Year Plan.
Nevertheless, the management had clarified during the Q4FY2012
earnings conference call that there was no target on the line of
29,000MW from the company’s side. Rather, it was highlighted by
the management in the call that as part of the plan of the Govern-
ment of India, NTPC’s capacity to be commissioned is 11,878MW
and over that it would take the commitment of the spill-over ca-
pacity from the 11th Five-Year Plan which is 2,610MW, taking the
total to approximately 14,500MW.
We believe a target addition of 29,000MW in the five-year period
which indicates an average of close to 5,800MW annually. That is
Sharekhan Limited, its analyst or dependant(s) of the analyst might be holding orhaving a postition in the companies mentioned in the article.
For detailed report, please visit the Research section of our website, sharekhan.com.
Volumes drive the overall results in Q4
RAMA PHOSPHATESVIEWPOINT JUNE 5, 2012CMP: RS53
Result highlights� Q4FY2012 results mostly in line with expectations: During
Q4FY2012 Rama Phosphates posted a good revenue growth inthe single super phosphate (SSP) and soy business segments.The revenues were largely in line with our expectations mainlyon the back of a higher volume as the demand for SSP washigher as compared with the other fertilisers. The total revenuesearned during quarter increased by 183% to Rs185 crore com-pared over Q4FY2011. The SSP volume remained robust in-creasing from 40,178 tonne in Q4FY2011 to 1.09 lakh tonnein Q4FY2012, an increase of 172% during the quarter. InQ4FY2012 the reported profit after tax (RPAT) stood at Rs3.25crore, 259% higher than the Q4FY2011 RPAT.
� Input cost pressure; marginal decline in operating profit: Theoperating profit margin (OPM) in Q4FY2012 declined by 20basis points to 5.1% mainly due to the higher prices of the keyinputs, such as rock phosphate and sulphuric acid. Despite therising input cost (which was accentuated by the weakening ofthe rupee) and pressure on the margin, the company posted a170% growth in its operating profit and a 273% growth in itsnet profit to Rs9.4 crore and Rs3.25 crore respectively duringthe quarter. During the quarter the maximum retail price (MRP)of SSP remained in the range of Rs6,000 per tonne, which wasmarginally lower as compared with the price in the same quar-ter of the previous year. During Q4FY2012 the company alsopaid tax because the loss in the balance sheet had been wipedoff; the company had not paid any tax in Q4FY2011.
Sharekhan Limited, its analyst or dependant(s) of the analyst might be holding orhaving a postition in the companies mentioned in the article.
For detailed report, please visit the Research section of our website, sharekhan.com.
too tall a figure given the historical figures. The company has added
9,610MW in the last Five-Year Plan ending FY2012, which is
around 2,000MW per annum. Going forward, the company is plan-
ning to add 4,160MW in FY2013 and 4,298MW in FY2014.
In the last six months, with the attention of the Prime Minister’s
Office, concerns related to coal supply and state electricity boards
are being addressed. It is the least corrected stock in this space and
its earnings growth is likely to be steady. While NTPC should be
held with a long-term view, for better returns investors should look
out for stocks that are sharper re-rating candidates in this space
currently. We have no rating on this stock currently.�
� Volume growth further driven by capacity addition: Rama Phos-phates is going to add capacity at Udaipur and Indore in orderto meet the incremental demand and increase its geographicalreach through strengthening of the distribution network for SSP.The company is going to increase the capacity at Indore andUdaipur by 85,000 tonne and 69,000 tonne respectively whichwill require a total capital expenditure (capex) of Rs8 crore.The total capacity after expansion will increase by 32% to 6.32lakh tonne. Going ahead, we believe the company will main-tain good growth in terms of volume and realisation as SSP isseen as a substitute of DAP, which is currently trading atRs18,000 per tonne vs SSP’s Rs6,000 per tonne.
� Outlook and valuation: The timely expansion of the manufac-turing capacities would enable the company to tap the oppor-tunity and grow its volume sales by around 25% over the nexttwo years. In terms of valuations, the stock trades at around2.1x and 1.8x its FY2013 and FY2014 rough estimates respec-tively and below its book value (on full depreciated assets). Thismakes it one of the cheapest stocks in the fertiliser space. More-over, the potential reduction of the promoter’s stake at a pre-mium to the current valuation is another trigger for the stock.We are positive on the stock and see scope for handsome ap-preciation from the current level.�

Sharekhan ValueGuide July 201229
Positive Momentum
� The Sensex has broken a bullish triangular pattern on the up-side with a break-away gap and is now expected to retrace theprevious fall by 78.6%, ie 17900, in the short term.
� The momentum indicator has given a positive crossover and istrading above the zero line, which is a positive sign for themarket.
� The key support would be around 16800 and resistance wouldbe around 17664 and 17900.
� The Sensex has taken support around the 40-daily moving av-erage (DMA) and started forming higher tops and higher bot-toms. This is a positive sign for the market. �
� The Sensex has taken support around 15748 levels and beenpositive since the last four weeks. It is also in the process ofretesting the previous swing high and go even higher.
� According to the Elliott wave theory, the index has completedwave W correction and a new move on the upside has startedas wave X for a target of 18846.
� The momentum indicators have given a positive crossover andare trading around the zero line, which is a positive sign for themarkets in the medium term.
� The index has retraced almost 78.6% of the entire rise as wave2 or B from 2011 December lows, ie 15135, to the currenthigh, ie 18523, as wave 1 or A. Now the next move up hasstarted as wave 3 or C.�
� The Sensex has formed a double top around the all-time high,ie 21207, which is a crucial resistance going forward.
� The index has formed a positive close this month and is stilltrading below the 20-monthly moving average (MMA), ie17800, which will act as a very crucial resistance in the me-dium term.
� The momentum indicators have given a positive crossover andare trading around the zero line, which is a positive sign for themarket.
� The Sensex has formed higher lows and is expected to bounce,which would retrace the entire fall from the November 2010highs.�
Sensex: Daily view
Sensex: Weekly view
Sensex: Monthly view
Trend Trend reversal Support Resistance Target
Up 16600 16600 18000 18000/18846
Medium term
Trend Trend reversal Support Resistance Target
Up 16900 16900 17600 17600
Short term
EQUITY TECHNICALS TREND & VIEW
2April
9 16 23 30May
7 14 21 28 4June
11 18 25 2July
9 16-5-4-3-2-10123KST (2.36857)
15600
15700
15800
15900
16000
16100
16200
16300
16400
16500
16600
16700
16800
16900
17000
17100
17200
17300
17400
17500
17600
17700
17800
Apr May Jun Jul Aug Sep Oct Nov Dec 2011 Mar Apr May Jun Jul Aug Sep Oct Nov Dec 2012 Feb Mar Apr May Jun Jul Aug Se
-10
-5
0
5
10KST (-0.23878)
15000
15500
16000
16500
17000
17500
18000
18500
19000
19500
20000
20500
21000
21500
W
X
Y
X
Z
1 OR A
2 OR B
A S O N D 2008 A M J J A S O N D 2009 A M J J A S O N D 2010 A M J J A S O N D 2011 A M J J A S O N D 2012 A M J J A S O N D 2013 A M-40-30-20-10
010203040
KST (-3.46359)
8000
9000
10000
11000
12000
13000
14000
15000
16000
17000
18000
19000
20000
21000
22000
23000
0.0%
23.6%
38.2%
50.0%
61.8%
100.0%

July 2012 Sharekhan ValueGuide30
Derivative view: Bulls rejoiceConcerns, both domestic and international, continued to weigh oninvestor sentiments even in the June series, resulting in the marketwitnessing a weak start. In spite of the rupee further depreciating,from the very second day of the June series, the bulls ditched thebears and led the market to commence its upward journey. Thegains came on the back of positive news flowing in from the inter-national markets. Later in the month, the status quo maintainedby the Reserve Bank of India (RBI) on interest rates in its creditpolicy applied breaks to the ongoing uptrend. This resulted in theNifty consolidating in the range of 5000-5200. The eventful Juneseries settled with a gain of 4.57% as uncertainties prevailed allthrough the series.
MARKET WIDE VS NIFTY ROLL-OVER
Hopes of positives being dished out by the RBI in its next monetarypolicy meet later during this month and of policy action from thegovernment supported the Nifty to finally break through and sus-tain above the hurdle of 5200 after a gestation. The volatility index(India VIX) has cooled off significantly by around 26% while theput-call ratio (PCR) is hovering around 1.25. These are indicationthat the upward momentum in the market would continue and 5600(on the Nifty) on the higher side could be on the cards.�
View
Top five stock options with the highest open interest in the current series
STOCK OPTIONS (SHAREKHAN SCRIP CODE) OPEN INTEREST (RS CR)
SBIN 413.75
INFY 216.42
TATAMOTORS 175.15
RELIANCE 166.27
LT 162.25
PAY-OFF DIAGRAM
A ratio call spread is generally formed when the market/stock isexpected to move in an upward direction. It is a limited profit andunlimited loss strategy with a favorable risk: reward ratio. A ratiocall spread can be constructed by buying slightly out-of-the-moneycall options and selling higher out-of-the-money call options of twodifferent strikes.
Strategy for the month: Nifty Ratio Call Spread Strategy
FORMATIONTYPE BUY/SELL STRIKE PREMIUM OUTFLOW
CE Buy 5300 97.80
CE Sell 5400 54.70 16.15
CE Sell 5500 26.95
MONTHLY VIEW EQUITY DERIVATIVES
STOCK FUTURES (SHAREKHAN SCRIP CODE) OPEN INTEREST (RS CR)
SBIN 1318.85
ICICIBANK 1008.05
HDFCBANK 797.23
RELIANCE 795.92
HDFC 778.58
Top five stock futures with the highest open interest in the current series
A statement from the new finance minister, Dr Manmohan Singh,about executing corrective measures on policy inaction and thedepreciating rupee boosted the market sentiments and led the Julyseries to put up a stupendous start. The July series started the monthwith an open interest of Rs9,905 crore vs Rs7,365 crore in Niftyfutures, Rs23,654 crore vs Rs22,159 crore in stocks futures,Rs45,716 crore vs Rs44,556 crore in index options and Rs1,949crore vs Rs1,934 in stocks options. The Nifty rollover stood at68.34%, which is above its three- and six-month average rolloverof 63.06% and 66.30% respectively. The market-wide rolloverstood at 85.46%, which is higher than its three- and six-monthaverage rollover of 81.53% and 81.59% respectively.
On the options front, the 5300-strike call stands with the highestnumber of shares in open interest followed by 5200-strike call. Onthe put side, the combined open interest in strikes of 5000-5100has crossed the mark of 1 crore shares, clearly indicating that 5000on a closing basis in the short term will act as a good support andon the higher side, any close above the 5400 levels would opengates for 5600 on the Nifty.
68.3
4%
58.8
6%
71.8
6%
58.4
6%
67.4
7%
73.7
6%
67.3
7%
85.4
6%
82.4
2%
83.3
1%
78.8
5%
82.5
0%
81.8
1%
80.6
7%
0.00%10.00%20.00%30.00%40.00%50.00%60.00%70.00%80.00%90.00%
July
June
May
Apr
il
Mar
ch
Feb
ruar
y
Janu
ary
Nif ty Market Wide
The strategy has an initial outflow of 16.15 points, which amountsto Rs1,615 (16.15 x 100). The maximum profit potential amountsto Rs8,385 (83.85 x 100), which is 83.85 points. There are twobreak-even points in the strategy. The higher break-even point forthe strategy is 5584 and the lower break-even point for the strategyis 5316. The maximum profit will be achieved if the Nifty expiresbetween 5400 and 5500 levels. A maximum loss would be incurredabove 5584 (which is the higher break-even point for the strategy).If it reaches this level (5584) it’s advisable to close the strategy as itwould get converted into a short future.�
-200
-150
-100
-50
0
50
100
5000
5050
5100
5150
5200
5250
5300
5350
5400
5450
5500
5550
5600
5650
5700
5750
PROFIT/LOSS

Sharekhan ValueGuide July 201231
Commodities—mixed performance amid huge volatility
Key points
� European governments drop their seniority clause on the loansto Spanish banks
� European Stability Mechanism (ESM) could recapitalise banksautomatically
� Single banking supervisor for flexibility in usage of ESM/European Financial Stability Facility (EFSF) funds
� Borrowing cost of Spain and Italy could decline in near-term
� European developments could lead to formation of a bankingunion, which would be a positive step for forming fiscal unioneventually
� Pro bailout parties win narrowly in Greece elections
� Europe’s AAA members at risk as crisis worsens, Fitch says
� Egan-Jones downgrades France and Germany
� Euro-Area manufacturing, services shrink as debt crisis worsens
� German exports dropped as fiscal crisis curbs demand in Europe
� IMF says Spain likely to miss 2012 deficit target
� US debt to top 70% of GDP by end of 2012: CBO
� Job openings in US decrease by most in almost four years
� Fed expands operation twist to year-end, cuts growth outlook
� China cuts borrowing costs for the first time since 2008; likelyto cut further in Q3
� China’s economy to bottom out in Q2, PBOC adviser says
� China manufacturing slump may match that of 2008 crisis
� UK likely to go for another round of quantitative easing soon
� India’s growth at lowest since 2003
� Japan Lower House passes sales tax hike bill
� Japan output falls most since quake as recovery falters
� Commodities rally sharply on the last trading day of the monthon European developments
COMMODITY PRICES IN JUNE 2012 (IN $)
Commodity High Low Close % Mon chg
Copper 7745.0 7219.5 7685.0 3.5
Zinc 1924.8 1745.0 1877.0 0.4
Lead 1953.0 1742.0 1861.0 -3.1
Gold 1640.8 1546.1 1597.5 2.4
Silver 29.9 26.2 27.5 -0.8
Crude oil 87.3 77.3 85.0 -1.8
MONTHLY CHANGE IN SHFE STOCKS (MAY-JUN 2012)
Copper Lead Zinc
Change (in tonne) -7602 -1488 -7672
31-May-12 147044 28047 338871
Change (in %) -5.17 -5.31 -2.26
MONTHLY CHANGE IN DOE CRUDE STOCKS (MAY-JUN 2012)
Crude oil Dist. Gasoline
Change in (000' bbls) 2426 1067 4643
25-May-12 384740 117784 200179
Change in (%) 0.63 0.91 2.32
Refinary utlisation rate was at 92.6% in the last week of June.
MONTHLY CHANGE IN LME STOCKS (MAY-JUN 2012)
Copper Lead Zinc
Change (in tonne) 26475 725 51250
31-May-12 230675 349575 940775
Change (in %) 11.48 0.21 5.45
Note—LME: London Metal Exchange , SHFE: Shanghai Futures Exchange, DOE: Department of Energy (US)
Macro-economy
Crude oil: Expect range trading with a downward biasKey points
� IAEA disappointed as Iran fails to agree to wider atom probe
� IEA raises forecast for Japan 2012 oil demand
� Crude oil inventories in the US at the highest level since 1990
� IEA sees economic growth risks in better-supplied oil market
� OPEC agrees to cap production at current levels
� Noda ends Japan nuclear freeze
� China crude imports from Iran climb to highest level this year
� OPEC crude supplies rose in May to the highest level since October 2008
� Oil consumption to fall in Europe in 2012, 2013
Downside pressure continued on the industrial commodities in June due to worsening European debt crisis. Spanish bond yields reached to recordhigh level. Concerns about global economy on account of sluggish growth in the US and slowdown in the Brazil, Russia, India, China (BRIC)nations added to the selling pressure. However, central bankers came to the rescue once again with China cutting rates, the US Fed extendingoperation twist and finally some positive developments at the 13th European summit. However, we note that though measures taken at the recentlyconcluded summit are in the right direction, these steps are unlikely to keep markets supported for long as the European bailout fund size is way toosmall to address the debt issues. Also, it would be quite some time before the mechanism to directly recapitalise the banks is put in place. We lookfor a range of $75-$92 with a downward bias for the month.
WTI NYMEX crude oil CMP: $84.96
COMMODITY FUNDAMENTALS MONTHLY VIEW

July 2012 Sharekhan ValueGuide32
COMMODITY FUNDAMENTALSMONTHLY VIEW
Gold CMP: $1597
Precious metals: Downside pressure to remain
Silver CMP: $27.48
Silver imports by China were 226.6 metric tonne in May. That compares with 236.9 tonne in April. We look for a range of $24.50 to$30.50 with a downward bias. The outlook remains weak due to huge surplus, weak industrial demand and inability of gold to rise on theEuropean sovereign debt crisis.
Copper CMP: Rs430
Base metals: Limited upsideKey points
� Jiangxi Copper considers halting LME exports as prices decline
� Standard Bank lowers China copper demand forecast to 5.5% gain from 6.5%
� China’s May refined copper imports were 301,990 tonne
� LME copper inventories in mini rising trend due to weak demand in China
� Chinese zinc output falls 3% in May due to weak demand, low prices
� Refined zinc output exceeded demand in April, study group says
� Refined Lead output exceeded demand in April, ILZSG report shows
� Base metals can rise, however concerns remain
Copper traded in a range of $500 in June. The metal fared better than its peers on account of relatively lower levels of inventories. Refinedcopper imports by China were 301,990 metric tonne in May. Shipments were 272,903 tonne in April and 149,235 tonne a year earlier.A decline in Shanghai inventories is supportive for the metal. The LME inventories are in a mini rising trend as China’s demand turnsweaker. SHFE-LME arbitrage opportunity has disappeared again. The base metals can extend their month-end advance in near-term onEuropean developments, however rallies would be susceptible to a sell-off as the global economy faces a slowdown and European crisisis yet to be addressed in a meaningful way. The red metal can extend its rally to $8,100 in the near-term, however a stronger Rupee wouldlimit the gains. Thus, upside is likely to be capped around Rs440. The downside is seen limited to Rs406 in July.
Lead CMP: Rs104Imports of lead ore and concentrate also rose by 3.4% month-on-month to 139,128 tonne in May, 66% higher year-on-year on SHFE-LME arbitrage. China’s lead production can decline in near-term as smelters in Henan province close for maintenance. We look for aRs98-Rs108 range in July.
Gold movements depended mainly on Euro-Dollar gyrations in June, though occasionally the metal slipped into its safe haven role on theEuropean debt crisis. The US Fed’s “Operation Twist” belied the expectations of an immediate further quantitative easing, which wentagainst the yellow metal. Gold failed to overcome the strong resistance at $1,640 and settled lower for the month. India’s demand remainspoor due to a record drop in the Indian Rupee that prevented gold from undergoing a sharp correction in Rupee terms. Indian demand isunlikely to pick up this month due to lack of weddings and festivals. A lot would depend on the monsoon. However, in dollar terms goldis likely to get support from an expected easing by the central banks of Japan, England and Europe, though demand for risk assets becauseof latest European developments is somewhat bearish for the metal. The upside is likely to be capped around $1,675. The downside couldextend to $1,450 should the central banks refrain from easing further.
Key points
� India gold demand seen ‘very poor’ through July – Bombay Bullion Association
� India’s gold demand to depend on monsoon in near-term – Bombay Bullion Association
� India’s purchases may drop to 20 metric tonne to 25 tonne in June, from 55 tonne to 60 tonne a year ago - Bombay BullionAssociation
� Gold sold aggressively in India as prices trade near record
� Central bank 2012 gold purchases seen topping last year’s total
� Disinflationary environment ‘difficult’ for gold, WGC Says
� Gold for now being sold as a source of liquidity – WGC
� Gold concerns include stronger dollar, higher interest rates – WGC
� Silver imports by China were 226.6 tonne in May, customs says

Sharekhan ValueGuide July 201233
Zinc CMP: Rs104
Refined zinc production was 1.047 million metric tonne in April, exceeding demand of 1.042 million tonne, according to a report by theInternational Lead and Zinc Study Group. LME inventories are at their highest level since 1995, and China’s demand remains weak. Welook for a range of Rs98-106 in July.
Major economic events in July 2012
CMP as on June 29, 2012
Date Region Event Forecast Actual Prior Impact
1-Jul-12 China Manufacturing PMI 49.9 50.2 50.4 Somewhat supportive for industrial commodities, though borderline case.
2-Jul-12 USA ISM Manufacturing 52 -- 53.5 To be above 50, however data likely to show loss of momentum.
2-Jul-12 UK PMI Manufacturing 46.5 48.6 45.9 Though better than forecast, however overall bearish for GBP, commodities.
4-Jul-12 UK PMI Services 52.8 -- 53.3 Very bearish for GBP, commodities if services also contract.
5-Jul-12 UK BOE announces rates 0.50% -- 0.50% Focus would be on possibility of further quantitative easing.
6-Jul-12 Germany Industrial Production MoM (sa) 0.002 -- -0.022 Germany in forcus as the Europe's growth engine slows down.
6-Jul-12 USA Change in non-farm payrolls 90K -- 69K Crucial for all commodities and currencies. Likely to be disappointing,thus could weigh on risk assets.
6-Jul-12 USA Unemployment Rate 8.20% -- 8.20% Only statistically important as pool size itself is shrinking.
9-Jul-12 Japan Current Account Balance YoY% -- -- -21.20% Important for yen.
9-Jul-12 Japan Trade Balance - BOP basis -- -- -¥463.9B Negative balance bearish for yen, commodities.
11-Jul-12 USA Trade Balance -$48.0B -- -$50.1B Focus on both external and internal demand in the wake of impending slowdown.
12-Jul-12 Japan BOJ target rate -- -- 0.10% Focus would be on assessment of economy, hints of easing.
13-Jul-12 China Industrial Production (YoY) -- -- 9.60% Important for industrial commodities.
13-Jul-12 Japan Industrial Production (MoM) -- -- -3.10% Important for industrial commodities.
13-Jul-12 USA U. of Michigan Confidence -- -- -- Higher confidence would support industrial commodities. Gold can fall.
16-Jul-12 USA Advance retail sales -- -- -0.20% Important for industrial commodities.
17-Jul-12 UK CPI (MoM) -- -- -0.10% Lower number would be bearish for the pound.
17-Jul-12 Germany ZEW Survey (Econ. Sentiment) -- -- -16.9 Important for industrial commodities as sentiments turn sour.
17-Jul-12 Euro Zone ZEW Survey (Econ. Sentiment) -- -- -20.1 Important for industrial commodities as sentiments turn sour.
18-Jul-12 UK Jobless claims change -- -- 8.1K Important for GBP, industrial commodities.
18-Jul-12 USA Housing starts MoM% -- -- -4.80% Notion that housing is recovering needs support from the data.
18-Jul-12 USA Building permits MoM% -- -- 7.90% Notion that housing is recovering needs support from the data.
19-Jul-12 USA Existing home sales MoM -- -- -1.50% Notion that housing is recovering needs support from the data.
23-Jul-12 Euro Zone Euro Zone Consumer Confidence -- -- -19.8 Worsening scenario, hence bearish data negative for euro, commoditities.
25-Jul-12 UK GDP (QoQ) -- -- -0.30% UK economy contracting; weaker data would be bearish for GBP, commodities.
25-Jul-12 Germany IFO - current assessment -- -- 113.9 Important for industrial commodities.
25-Jul-12 USA New home sales MoM -- -- 7.60% Notion that housing is recovering needs to be supported by data.
26-Jul-12 USA Durable goods orders -- -- 1.10% Important for industrial commodities as the USA slows down.
27-Jul-12 USA U. of Michigan Confidence -- -- -- Higher confidence would support industrial commodities. Gold can fall.
31-Jul-12 Japan Jobless rate -- -- 4.40% Higher rate bearish for JPY as easing prospects rise.
31-Jul-12 Germany Retail sales (MoM) -- -- -0.30% Important for euro.
31-Jul-12 Germany Unemployment rate (s.a) -- -- 6.80% German economy getting affected by debt crisis in the zone; bearish datawould weigh on the euro, commodities.
31-Jul-12 Euro Zone Euro Zone unemployment rate -- -- -- Crucial for the euro and commodities as unemployment rises.
COMMODITY FUNDAMENTALS MONTHLY VIEW

July 2012 Sharekhan ValueGuide34
Gold: Channelised fall
� Gold faced selling pressure near the 61.8% retracement mark.
� The down move, which originated from the key Fibonacci level,is subdividing into lower degree waves.
� It is falling in a channelised manner. Gold recently found sup-port near the previous low and is forming a minor degree bounce.
� However it is unlikely to extend beyond its key weekly movingaverages and the upper end of the falling channel.
� It can form a triangular pattern in this region. The weekly mo-mentum indicator is in a sell mode.
� The targets on the downside are $1,478 and $1,365. Reversalwould be above $1,640.5.
Silver: Test of the low
� Silver kissed and tumbled from the medium-term falling channelline. The white metal has fallen from the weekly upper BollingerBand towards the lower one. The fall is unfolding in a channelisedmanner.
� Silver is trading near its previous low of $26.04. Once that isbroken on a closing basis, a sharp sell off is expected.
� The weekly momentum indicator is also in a bearish mode.
� The channel line (blue) and the penultimate week’s high, ie $29will act as a reversal level on a closing basis.
� The targets on the downside are $24.5 - $21.5, ie short-term andmedium-term channel targets respectively.
Trend Trend Supports Resistances Targetreversal
Down $29.00 $26.04/25.00 $28.00/28.77 $24.50$21.50
� Crude oil had crossed the long-term falling trendline, however,it couldn’t sustain at the higher level.
� From there the oil has fallen sharply.
� On the way down crude oil has broken the long-term risingtrendline.
� The wave structure shows that the oil has formed a five-wavedecline and is attempting a retracement of the fall.
� The 38.2 - 50% retracement, ie $90 - 94 is a resistance zonewhere fresh short position can be initiated.
� Reversal can be kept above $98.
� On the downside, the equality target is $72.30.
Trend Trend Supports Resistances Targetreversal
Down $98 $80.00/77.28 $90/94 $72.3
Trend Trend Supports Resistances Targetreversal
Down $1,640.5 $1,521/1,450 1,615/1,634 $1,478/$1,365
Light sweet crude oil: Retracement
COMMODITY TECHNICALSTREND & VIEW
Mar Apr May Jun Jul Aug Sep Oct Nov Dec 2012 Mar Apr May Jun Jul Aug Sep Oct Nov Dec
1300
1350
1400
1450
1500
1550
1600
1650
1700
1750
1800
1850
1900
1950
0.0%
23.6%
38.2%
50.0%
61.8%
100.0%
1640.5
1365
1478
0
50
100MACD (-20.4306)
ov Dec 2011 Mar Apr May Jun Jul Aug Sep Oct Nov Dec 2012 Mar Apr May Jun Jul Aug Sep Nov Dec
20
25
30
35
40
45
50
0.0%
23.6%
38.2%
50.0%
61.8%
100.0%
24.5
29.00
21.5
SILVER [CASH] (26.8500, 27.9100, 26.1100, 27.4400, +0.54000)
-100
10203040KST (-10.4365)
S O N D 2011 M A M J J A S O N D 2012 M A M J J A S O N
65
70
75
80
85
90
95
100
105
110
115
120
0.0%
23.6%
38.2%
50.0%
61.8%
78.6%
100.0%
98
72.3
90
94
LIGHT CRUDE CONTINUOUS 1000 BARRELS [NYMEX] (80.2000, 85.3400, 77.2800, 84.9600, +5.20000)
-15-10-505
101520KST (-15.1292)

Sharekhan ValueGuide July 201235
Trend Trend Supports Resistances Targetreversal
Down $3.65 $3.2/$3.0 $3.5/3.6 $2.994/$2.58
NG: Bullish breakout
� Natural gas (NG) had formed a channel within a channel.
� In the last week, it had broken out from the inner channel.
� Also it has broken out from the inverted head-and-shoulders(H&S) pattern.
� The weekly momentum indicator is in sync with the pricebreakout.
� Thus NG is unlikely to fall below the neckline and the last week’slow ($2.64) on a closing basis.
� The pattern target on the upside is $3.98 whereas the channeltarget is $4.24.
Trend Trend Supports Resistances Targetreversal
Up $2.64 $2.75/2.70 $3.50/4.00 $3.98/$4.24.
Nickel: Right shoulder in formation
� Nickel formed a three-wave pullback that retraced 50% ofthe previous fall. From there it has started its next leg down,which is subdividing into lower degree waves.
� The weekly momentum indicator is trading in the negativeterritory and can start a new cycle down from the equilibriumline.
� In terms of price pattern, the right shoulder of an H&S isbeing formed. The neckline and the previous low, ie Rs855and Rs845 respectively, are a crucial support zone. Below thatthe equality target is Rs695.
� Reversal of the bearish view can be trailed to Rs1,008, ie abovethe falling trendline.
Trend Trend Supports Resistances Targetreversal
Down Rs1,008 Rs861/Rs750 Rs967/Rs1,000 Rs695
Copper: Opportunity for bears
� With the triangle breakout copper formed the third leg on theupside, which achieved its equality target ($3.91).
� The base metal also reached near the 61.8% retracement mark ($4.02).From there it tumbled towards the weekly lower Bollinger Band.
� Currently it is forming a short-term pullback, which should beused as a selling opportunity. The weekly momentum indicator isin a bearish mode.
� The targets on the downside would be $2.99, ie the previous low,and $2.58, ie the equality target. On the other hand, the junctionof the 20-week moving average (WMA) and the 40-week expo-nential moving average (WEMA), ie $3.65 will act as a crucialresistance.
TREND & VIEWCOMMODITY TECHNICALS
M J J A S O N D 2011 M A M J J A S O N D 2012 M A M J J A S2.4
2.5
2.6
2.7
2.8
2.9
3.0
3.1
3.2
3.3
3.4
3.5
3.6
3.73.83.94.04.14.24.34.44.54.64.74.84.9
0.0%
23.6%
38.2%
50.0%
61.8%
100.0%
3.65
2.994
2.58
HG COPPER CONTINUOUS 25000 LBS [COMEX] (3.30700, 3.51500, 3.27850, 3.49650, +0.19050)
-15-10-505
1015KST (-7.52826)
09 A M J J A S O N D 2010 A M J J A S O N D 2011 A M J J A S O N D 2012 A M J J A S O
2.0
2.5
3.0
3.5
4.0
4.5
5.0
5.5
6.0
6.5
7.0
7.5
8.08.59.09.5
0.0%
23.6%38.2%50.0%61.8%
78.6%
100.0%
2.64
3.98
4.24
NATURAL GAS CONTINUOUS 10000 MMBTU [NYMEX] (2.66000, 2.94600, 2.64400, 2.82400, +0.19900)
-20-10
0102030
KST (11.7417)
2008 2009 2010 2011 2012
400
450
500
550
600
650
700
750
800
850
900
950
1000
1050
110011501200125013001350140014501500
0.0%
23.6%
38.2%
50.0%
61.8%
100.0%
1008
845
695
NICKEL 1 KG - 1 MONTH (941.700, 941.700, 918.600, 927.600, -16.1000)
0
KST (-2.16720)

July 2012 Sharekhan ValueGuide36
Currency market : Rupee likely to gain in near-term; outlook remains bearish though
Key points
� Rupee falls to new low against dollar amid European Union crisisand domestic slowdown
� Rating agency Fitch downgraded India’s outlook to negative
� Greek elections preserved Europe’s status quo - slow motion trainwreck
� High possibility of another round of QE by the Bank of England
� The Indian Rupee to be affected more by global rather than do-mestic factors for now
� The Indian Rupee can gain against its peers in near term
� Reviving investor confidence in the nation is one of his top priorities — PM
CURRENCY LEVELS IN JUNE 2012 (IN RS)
Currency High Low Close Monthly chg (%)
INR-USD 57.39 55.07 57.20 -2.87
INR-EUR 71.83 68.74 71.44 -2.45
INR-GBP 89.40 85.11 89.40 -2.52
INR-JPY 72.27 69.31 71.92 -2.84
INR-USD CMP: Rs55.6375 (spot)
The rupee (INR) continued its downward spiral against the dollar to make a new lifetime low of 57.32. The INR had consolidated beforethe Greek elections. However subsequent developments in the European Union (EU) and half hearted attempts of the Reserve Bank ofIndia (RBI) to bolster the rupee resulted in the rupee hitting an all-time low. India’s trade deficit narrowed 12% in May. Both exports andimports fell by 4.16% and 7.36% respectively. A fall in the price of crude oil was offset by the weakening rupee to some extent. The rupeecould appreciate to 54.30-54.85 (spot) in the near term. The upside for the dollar could remain capped around at 56.50 (spot) in the shortterm. Overall the outlook remains weak for the rupee as the currency is likely to fall to a new low.
INR-GBP CMP: Rs86.9006 (spot)The GBP-USD has been moving in line with the EUR-USD pair. Bank of England (BOE) officials have repeatedly warned of the potentialdangers that the UK economy faces due to every increase in the EU crisis. UK’s trade deficit reached its highest point as exports to both,the EU and the non-EU countries, contracted. Though the BOE refrained from rate cuts or increasing the asset purchase program, itlaunched two new stimulus packages worth 140 billion pounds in order to boost bank lending. The pound will weaken in case the eurocrisis worsens further. The GBP-INR can fall to 84.90 while the upside will be capped around 88.40.
INR-JPY CMP: Rs69.37 (spot)The Japanese economy expanded 1.2% in the first quarter of 2012, slightly higher than forecast. However the ascent may not last in thecoming quarters as domestic consumption and investment are expected to fall. Japanese exports are hurt and increasing energy importshave made matters worse. The industrial production in May fell most since the 2011 earthquake. The foreign demand for Japanesegovernment bonds is at the highest level since 1979. The JPY-INR pair can decline to Rs67.70 levels on European developments. Still, theweakness is unlikely to last. The upside is seen capped at Rs71 (spot) in the short term.
June 2012 contract price movement June 2012 contract price movement
CMP as on June 29, 2012
INR-EUR CMP: Rs70.0920 (spot)
The euro-USD pair rose 2.25% in June. Rating agencies downgraded a host of European banks on account of their exposure to sovereigndebt. The German economy, the strongest one so far, has been showing signs of weakness. Ten-year German bunds started decliningbefore the Greek elections highlighting that any financial help to debt ridden nations will be at Germany’s cost. The euro-dollar canextend its advance to 1.2850 levels in the near term on the positive developments at the recently concluded EU summit. Euro INR can fallto 68.70 (spot) while the upside will be capped around 71.50 (spot).
MONTHLY VIEW CURRENCY FUNDAMENTALS
55
55.5
56
56.5
57
57.5
29-M
ay-1
2
31-M
ay-1
2
2-Ju
n-12
4-Ju
n-12
6-Ju
n-12
8-Ju
n-12
10-J
un-1
2
12-J
un-1
2
14-J
un-1
2
16-J
un-1
2
18-J
un-1
2
20-J
un-1
2
22-J
un-1
2
24-J
un-1
2
26-J
un-1
2
6969.57070.57171.57272.5USDINR JPYINR
69
69.5
70
70.5
71
71.5
72
29-M
ay-1
2
31-M
ay-1
2
2-Ju
n-12
4-Ju
n-12
6-Ju
n-12
8-Ju
n-12
10-J
un-1
2
12-J
un-1
2
14-J
un-1
2
16-J
un-1
2
18-J
un-1
2
20-J
un-1
2
22-J
un-1
2
24-J
un-1
2
26-J
un-1
2
85
86
87
88
89
90EURINR GBPINR

Sharekhan ValueGuide July 201237
GBP-INR: Channel test� GBP-INR has recently formed a five-wave advance. It has been
rising in a channelised manner and is currently trading near thelower end of the rising channel. The immediate supports are atthe 20-day moving average (DMA; 87.0) and the 40-dayexponential moving average (DEMA; 86.54).
� Once they are broken the price will tumble significantly. Thedaily momentum indicator has triggered a bearish crossover.
� Overall the price is expected to correct till the junction of 61.8%retracement mark and the lower end of the larger channel(81.55). A key resistance is the high of 89.466.
Currency View Reversal Supports Resistances Target
USD-INR Down 57.325 54.82/53 56/56.8 52.15
GBP-INR Down 89.466 85.89/84.83 88/89 81.55
EUR-INR Down 71.895 69.74/68.23 71/71.71 66.74
JPY-INR Down 0.7212 0.6877/0.6721 0.705/0.7174 0.657-0.642
USD-INR: Correction on the cards
� USD-INR has been rallying in a channelised manner. It crossedthe high of 54.32.
� However it hit a hurdle at the 150% retracement mark. Fromthere it has entered a short-term corrective phase.
� The price has broken the lower end of the rising channel.
� The daily momentum indicator has triggered a bearish cross-over. Thus the price is expected to fall towards the lower end ofthe larger channel, ie 52.15.
� The high of 57.325 will act as a key resistance.
EUR-INR: Bearish setup� In case of EUR-INR the fall from 71.278 found support near
the long-term rising trendline.
� From there the new leg started on the upside, which is unfold-ing in a channelised manner.
� The price crossed the high of 71.278; however it couldn’t sus-tain in the higher territory. The daily momentum indicator hastriggered a bearish crossover. This makes a case for a short-term correction. A key level for that is 66.74, ie the 61.8%retracement mark.
� The high of 71.895 will act as a hurdle on the upside.
JPY-INR: Weak structure� JPY-INR had formed an inverted head and shoulders (H&S)
pattern and had turned bullish.
� Since then it was moving up along a rising trendline. Howeverthe trendline has been broken, indicating a break in the trend.
� From a short-term perspective the price is trading in a broadrange of 0.7212–0.6877.
� Overall, the structure suggests that there is high probability ofa breach of the lower end of the range. The daily momentumindicator is showing a negative divergence and has started anew cycle down. On the weekly chart the price has formed abearish outside bar. Thus, the price can trade lower till 0.657-0.642.
CURRENCY TECHNICALS TREND & VIEW
November December 2012 February March April May June July August
46.5
47.0
47.5
48.0
48.5
49.0
49.5
50.0
50.551.0
51.5
52.052.553.053.554.054.555.055.556.056.557.057.558.058.559.059.560.0
0.0%
100.0%
138.2%
150.0%
161.8%
0.0%
23.6%
38.2%
50.0%
61.8%
100.0%
52.15
57.325
USDINR - INDIAN RUPEE (56.8000, 56.8000, 55.5000, 55.5000, -1.31000)
0
KST (0.91446)
ber November December 2012 February March April May June July Au
72
73
74
75
76
77
78
79
80
81
82
83
84
85
86
87
88
89
90
91
92
0.0%
23.6%
38.2%
50.0%
61.8%
100.0%
89.466
81.55
GBPINR (88.1290, 88.7440, 86.7400, 87.1630, -0.96600)
0
KST (1.21927)
September November 2012 February March April May June July August
62.5
63.0
63.5
64.0
64.5
65.0
65.5
66.0
66.5
67.0
67.5
68.0
68.5
69.0
69.5
70.0
70.5
71.0
71.5
72.0
72.5
0.0%
23.6%
38.2%
50.0%
61.8%
100.0%
71.895
73.3
66.74
EURINR (70.6660, 71.7160, 69.9070, 70.2520, -0.40300)
0
KST (0.78718)
mber November 2012 February March April May June July Au
0.5700.5750.5800.5850.5900.5950.6000.6050.6100.6150.6200.6250.6300.6350.6400.6450.6500.6550.6600.6650.6700.6750.6800.6850.6900.6950.7000.7050.7100.7150.7200.7250.730
0.0%
61.8%
78.6%
100.0%
123.6% 0.0%
23.6%
38.2%
50.0%
61.8%
100.0%
0.6877
0.7212
0.657
0.642
JPYINR (0.71480, 0.71740, 0.69340, 0.69510, -0.01970)
-0.010-0.0050.0000.0050.010
MACD (0.005586)

July 2012 Sharekhan ValueGuide38
We are pleased to introduce you to Sharekhan’s PortfolioManagement Service (PMS) in which we completely manageyour investment portfolio so that you stop worrying aboutthe market volatility and focus your energy on things thatyou like to do!
We have a wide range of strategies that you can choose from.Our strategies are based on fundamental research and tech-nical analysis.
Portfolio Management Service
INVESTMENT STRATEGY� Disciplined investment decisions are taken in specific stocks based on thorough
fundamental research.
� Investments are made primarily in the Nifty Fifty or the BSE 100 scrips.
� Attempts to have an exposure of minimum of 70% in the Nifty Fifty stocks and
that of minimum of 90% in the BSE 100 stocks.
� Endeavours to create a core portfolio of blue-chip companies with a proven track
record and have partial exposure to quality companies in the mid-cap space.
Fund Manager: Gaurav Dua
FUND OBJECTIVEA good return on money through long-term investing in quality companies
PRICING� Minimum investment of Rs25 lakh
� Charges
� 2% per annum; AMC fee charged every quarter
� 0.5% brokerage
� 20% profit sharing after the 12% hurdle is crossed at the end of
every fiscal
PROPRIME - TOP EQUITY
OVERVIEWThe ProPrime—Top Equity PMS strategy is suitable for the long-term investors looking
to create an equity portfolio through disciplined investments that will lead to a growth
in the portfolio’s value with low to medium risk.
Top 10 stocks
Bank of Baroda
BHEL
Bharti Airtel
Cipla
ICICI Bank
Larsen & Toubro
Pipavav Shipyard
Reliance Industries
Selan Exploration Tech.
State Bank of India
Product performanceas on June 30, 2012
(In %) Scheme Sensex Nifty
1 month 4.8 7.5 7.2
3 month -1.9 0.1 -0.3
6 month 10.5 12.8 14.2
1 year -6.4 -7.5 -6.5
3 year - - -
Since inception* -5.6 -3.6 -2.6
Best month 11.3 11.3 12.4
Worst month -8.1 -8.9 -9.3
Best quarter 12.6 12.6 14.5
Worst quarter -11.0 -12.7 -12.5
#18-May-11
Disclaimer: Returns are based on a client’sreturns since inception and may be different fromthose depicted in the risk disclosure document.
We have the following strategies on offer:
ProPrime (based on fundamental research)
� Top Equity � Diversified Equity
ProTech (based on technical analysis)
� Nifty Thrifty � Diversified� Trailing Stoploss
PMS DESKPMS FUNDS

Sharekhan ValueGuide July 201239
INVESTMENT STRATEGY� Disciplined investment decisions are taken in specific stocks based on thorough
fundamental research.� A balanced mix of value and growth stocks (mid-cap and small-cap) is created
that represents investment opportunities across sectors and market capitalisation.� Invests in quality value and growth stocks with good earnings visibility and healthy
balance sheet.� The fund manager, with the help of extensive, in-house, superior research,
identifies fundamentally sound companies to invest in.� The fund manager strives to capture the short-term trading opportunities to
maximise the potential of the swings in specific stocks.
FUND OBJECTIVEA good return on money through long-term investing regardless of short-term volatility
PRICING� Minimum investment of Rs25 lakh� Charges
� 2.5% per annum; AMC fee charged every quarter
� 0.5% brokerage
� 20% profit sharing after the 15% hurdle is crossed at the end of every fiscal
PROPRIME - DIVERSIFIED EQUITYOVERVIEWThe ProPrime—Diversified Equity PMS strategy is suitable for long-term investorslooking to create an equity portfolio through disciplined investments that will lead to agrowth in the portfolio’s value with medium to high risk.
Top 10 stocks
Aftek
BHEL
Diamond Power Infrastructure
Gayatri Projects
ITNL
Reliance Industries
Reliance Infrastructure
Southern Petrochemicals Industries
Sterlite Industries (India)
Tera Software
Product performanceas on June 30, 2012
(In %) Scheme S&P CNX 500
1 month 5.7 6.6
3 month -5.8 -1.2
6 month 25.4 15.9
1 year -22.0 -7.8
3 year -31.1 20.2
Since inception* 85.0 185.5
Best month 37.5 34.4
Worst month -24.1 -27.2
Best quarter 65.0 51.2
Worst quarter -29.1 -28.6
*24-Sept-04
Disclaimer: Returns are based on a client’sreturns since inception and may be different fromthose depicted in the risk disclosure document.
FUND MANAGER’S VIEWThe domestic stock market remained nervous and pessimism prevailed in June inanticipation of certain key events that were lined up for the month and that wereexpected to act as key triggers for the market. Re-elections in Greece and the outcomeof the summit of the European Union leaders in Brussels surprised the markets globally,helping to relieve the stress on the riskier assets to a certain extent. Even thoughnothing has improved on the macro front but it seems the markets have turned positivedue to the action taken by the politicians globally. The same is the story in the Indianstock market whose hopes of policy reforms have revived with the prime ministerassuming charge of the finance portfolio as well. We hope the prime minister will dosomething to breathe life into the economy.
We believe slowly and steadily the government will come out of its policy paralysisand the negativity spawned by the widening deficits and the local currency’sdevaluation will fade away, bringing the market’s focus back on fundamentals.
We have been focused on buying value stocks at lower levels and we expect ourstrategy to pay off in July. We may expect measures to stimulate growth in the ReserveBank of India’s policy meet towards the end of the month. Pro-growth action will liftthe banking and infrastructure stocks. We are confident that our decision to buy ondips will reap rich rewards over July and August, which are traditionally good monthsfor the stock market. We cannot rule out an upside of 20-25% to the net asset valueof ProPrime Diversified Equity in the months ahead.
Fund Manager: Suhas Samant
PMS DESK PMS FUNDS

July 2012 Sharekhan ValueGuide40
INVESTMENT STRATEGY� This strategy has the potential to generate profits irrespective of the market
direction by going long or short on specific indices and stocks.
� It invests in the Nifty and the Bank Nifty indices (via futures) and 10 stock futures.
� An automated basic back-testing model is used to predict the market directionfor each of the indices and stocks which then decides the strategy to be deployedin terms of going long or short.
� The portfolio is not leveraged, ie its exposure will never exceed its value.
Fund Manager: Abhinay Jain
FUND OBJECTIVEAbsolute returns irrespective of market conditions through a long-short strategy followed in multiple investments
PRICING� Minimum investment of Rs25 lakh
� Charges
� AMC fees: 0%
� Brokerage: 0.05%
� Profit sharing: Flat 20% charged on a quarterly basis
PROTECH - DIVERSIFIED
OVERVIEWThe ProTech–Diversified PMS strategy is suitable for long-term investors who desireto profit from both bullish and bearish market conditions. The strategy involvesgoing long (buying) or going short (selling without holding) on certain investmentclasses by predicting the market direction based on a back-tested automated model. Product performance
as on June 30, 2012
(In %) Scheme Sensex Nifty
1 month 3.8 7.5 7.2
3 month 1.6 0.1 -0.3
6 month 4.8 12.8 14.2
1 year 8.4 -7.5 -6.5
3 year - - -
Since inception* 21.3 -0.7 0.0
Best month 11.3 11.7 12.4
Worst month -8.1 -10.6 -10.2
Best quarter 6.3 13.4 14.5
Worst quarter -1.3 -12.7 -12.5
*16-May-2010
Disclaimer: Returns are based on a client’sreturns since inception and may be different fromthose depicted in the risk disclosure document.
FUND MANAGER’S VIEWThe June series started on a healthy note and traded with a positive bias all throughthe month. After the initial move in the early part of the series, the market consolidatedin the range of 5000-5100 and finally broke out of the range with strong momentum,indicating there’s more upside in the near future. The broad range for the Nifty inthis series is likely to be 5500 on the upside and 5100 on the downside, as indicatedby the concentration of the option open interest.
The Nifty may start the new series on a positive note on the back of the strongmomentum carried forward from the previous week. On the other hand, the upsideseems to be capped at around 5500 as we are already sitting on the 7.2% gain of theprevious month. Further, a sharp rise from here should attract profit booking. TheIndia Volatility Index (VIX), which has fallen sharply from 29% to 19% in the lastten trading sessions, has come close to the strong support zone of 18%. A reversal isexpected from these levels. So if India VIX takes support around 18% then we mightsee volatility returning to the market leading to a sharp swing in either direction.
The net asset value of ProTech Diversified increased by 3.85% in June this year. Thelast quarter was a difficult one for the investors because the first two months of thequarter were negative due to whipsawing in the market, which had remained in atight zone at 5000 levels. In June, we delivered a 3.85% return which not onlyrecovered the losses of the previous two months but also generated returns for thequarter. The product delivered 1.6% return in the June quarter, thereby continuingits wining streak on a quarter-on-quarter basis.
*Traded stocks
Investments in*
Aban Offshore
Bank Nifty
DLF
IDBI Bank
Jindal Steel
Jaiprakash Associates
Nifty
Punj Llyod
Ranbaxy
Sesa Goa
Tata Motors
Yes Bank
PMS DESKPMS FUNDS

Sharekhan ValueGuide July 201241
Fund Manager: Rohit Shrivastava
FUND OBJECTIVEAbsolute returns irrespective of market conditions.
PRICING� Minimum investment of Rs25 lakh
� Charges
� AMC fees: 0%
� Brokerage: 0.05%
� Profit sharing: Flat 20% charged on a quarterly basis
PROTECH - NIFTY THRIFTY
OVERVIEWThe ProTech–Nifty Thrifty PMS strategy is suitable for long-term investors whodesire to profit from both bullish and bearish market conditions. The strategy in-volves going long (buying) or going short (selling without holding) on Nifty futuresby predicting the market direction based on a back-tested automated model.
Product performanceas on June 30, 2012
(In %) Scheme Sensex Nifty
1 month 4.9 7.5 7.2
3 month 2.3 0.1 -0.3
FY11-12 13.1 -10.5 -9.2
FY10-11 9.2 10.9 11.1
FY09-10 14.7 80.5 73.8
Since inception* 150.3 72.2 74.7
Best month 28.9 28.3 28.1
Worst month -17.1 -23.9 -26.4
Best quarter 33.3 49.3 42.0
Worst quarter -11.7 -25.0 -24.5
*01-Feb-2006
Disclaimer: Returns are based on a client’sreturns since inception and may be different fromthose depicted in the risk disclosure document.
FUND MANAGER’S VIEWWe had anticipated that the market would remain trending for several months andProTech Nifty Thrifty, the automated portfolio, returned 4.93% as a result of thetrending market. Even though most of June the Nifty spent in a 100-point range butthe low volatility helped us hold on to our gains without many whipsaws or badsignals. The result has, therefore, been good. We expect the market to maintain thisbehaviour. In fact, its speed should increase in the next quarter yielding better results.
The Nifty has spent 86 weeks in the 4600-6300 range and the range is narrowing.Such a narrowing range will eventually break and result in a windfall trade for thetrend-following systems, with prices moving in one direction without halt. We believethat this time is closer than farther away.
Investments in
Nifty Index
INVESTMENT STRATEGY� The strategy has the potential to generate profits irrespective of the market
direction by going long or short on Nifty futures.
� An automated basic back-testing model is used to predict the market directionfor the Nifty which then decides the strategy to be deployed in terms of goinglong or short.
� The portfolio is not leveraged, ie its exposure never exceeds its value.
PMS DESK PMS FUNDS

July 2012 Sharekhan ValueGuide42
Fund Manager: Rohit Shrivastava
FUND OBJECTIVEAbsolute returns irrespective of market conditions.
PRICING� Minimum investment of Rs25 lakh
� Charges
� AMC fees: 0%
� Brokerage: 0.05%
� Profit sharing: Flat 20% charged on a quarterly basis
PROTECH - TRAILING STOPS
Product performanceas on June 30, 2012
(In %) Scheme Sensex Nifty
1 month -0.9 7.5 7.2
3 month 4.3 0.1 -0.3
FY11-12 29.0 -6.1 -4.6
FY10-11 - - -
FY09-10 - - -
Since Inception-RSD* 34.6 -5.9 -4.9
Best month 9.1 11.3 12.4
Worst month -4.4 -8.9 -9.3
Best quarter 9.9 12.6 14.5
Worst quarter -1.0 -12.7 -12.5
*09th May 2011 (revised strategy date)
Disclaimer: Returns are based on a client’sreturns since inception and may be different fromthose depicted in the risk disclosure document.
FUND MANAGER’S VIEWThe Nifty moved in the 5040-5185 range offering few trading opportunities in Junethis year. Due to stock rotation many trades of the ProTech Trailing Stops stoppedout but good risk management kept our drawdown as low as -0.93% for the month.The market has broken out of this range now and we expect to see much betterreturns in the month ahead as there should be lots of good trading opportunities onthe long as well as the short side.
The Nifty has been in a large trading range for the last two years. Right now 5450-5500 is the upper end of the range and 4850-4900 the lower end. We expect themarket to largely move in this band and offer some clear moves to profit from. Ouranalysis shows that the immediate move is to the upper end of this band and later tothe lower end. Accordingly, we are trading the long side right now and would look atthe short-side opportunities when these arise. Our risk management should ensure alimited drawdown risk for the portfolio, as always.
Investments in
Nifty Index
Stock futures
INVESTMENT STRATEGY� This strategy spots the winning trades based on technical analysis vs time frame-
based portfolios, basically the momentum calls.
� A risk model has been developed for stock portfolio allocation that reduces therisk and portfolio volatility through staggered building of positions.
� It is non-leveraged—the exposure will never exceed the value of the portfolio.
OVERVIEWOur ProTech–Trailing Stops PMS strategy is ideal for Traders and Investors look-ing for Regular Income from trading and desire to make profits in both bullish andbearish market conditions. It is designed to payout book profits on monthly basis.*
It is also for those investors who are looking for better income than Fixed Incomeor Deposits. This strategy involves going Long (buying) or Short (selling withoutholding) on stock futures.
* Terms and conditions apply
PMS DESKPMS FUNDS

Sharekhan ValueGuide July 201243
Advisory Products & ServicesThe Advisory Desk is a central desk consisting of a Mumbai-based expert teamthat runs various sample model portfolios (for illustrative purposes only) for cli-ents of all profiles, be they traders or investors. For investors, it has the PortfolioDoctor service under which it reviews an existing portfolio on various parametersand suggests changes to improve its performance. For traders, it has four productsin all: MID Intraday, MID Swing, MID Option and MID Delivery.
All MID products are different from Sharekhan’s research-based technical and fun-damental offerings as these essentially try to capture trading opportunities in liquidstocks where momentum is expected before or after some event including the an-nouncement of results or where some news/event is probable. These calls are rolledout by the Advisory Desk based on the market pulse and before generating an MID
call, all market news on the stock as well as its technical and derivative indicators are thoroughly checked.
Advisory products are ideal for those who do not have time to either monitor the market tick by tick or shift through pages of research fordata or pour over complex charts to catch a trend. However, all these products require perfect discipline and money management.
ADVISORY DESK MONTHLY PERFORMANCE
MID TRADESThere are four different types of MID calls.
� MID Swing: These are positional long/short ideas based on fun-damental rationales/events/news as well as technical checks.These ideas come with proper stop losses and probable targets.
� MID Delivery: This is a long-only cash market delivery productwhere ideas are generated based on the market pulse (and notfundamental research). These ideas come with proper stop lossesand probable targets for a maximum period of one month.
For more details on any of the Advisory Desk products write to us at [email protected]
READY FOR ROARING ADVICE
#Please note there may be some deviation in the actual performance reported in TradeTiger due to a difference in the method of closure of an idea in a particular month.
NEW
Portfolio Doctor evaluates an existing portfolio on various parameters and suggests recommendations on aregular basis to improve its performance. It is targeted at long-term investors with a portfolio value of morethan Rs10 lakh. The Portfolio Doctor service involves three simple steps:
� analysis of an existing portfolio, � realignment of the portfolio with Sharekhan’s
� creation of a Model Portfolio. recommendations
FOR INVESTORS
PORTFOLIO DOCTOR
FOR TRADERS
DERIVATIVE TRADESDerivative Trades are generated by the Sharekhan Derivatives Deskbased on the analysis of open interest and other indicators. It is aleveraged product and ideal for aggressive futures traders.
� MID Options: These are directional calls in the options seg-ment based on the analysis of the open interest and the put-callratio in the market. These too come with proper stop losses andprobable targets.
� MID Intraday: These are long/short ideas based on fund flowand technical levels. As is apparent from the name, these callsare meant for intra-day trading. All MID Intraday calls are ac-companied by proper stop losses and probable targets.
Derivative Trades performance#
Ticket size (Rs) 300,000
Month June 2012 YTD FY13
No. of calls 15 41
Profit and loss (Rs) 3,075 25,815
Returns (%) 1.03 8.61
MID performance#
Product MID Swing MID Intraday MID Delivery MID Option
Month June 2012 YTD FY13 June 2012 YTD FY13 June 2012 YTD FY13 June 2012 YTD FY13
No. of calls 33 99 105 299 40 77 25 68
Profit and loss 23 59 66 182 32 49 14 35
Stop loss hit 10 40 39 117 8 28 11 33
Strike rate (%) 70 60 63 61 80 64 56 52

July 2012 Sharekhan ValueGuide44
Sharekhan Limited, its analyst or dependant(s) of the analyst might be holding or having a postition in the mutual funds mentioned in the article.
Every individual has a different investment requirement, which depends on his financial goals and risk-taking capacities. We at Sharekhanfirst understand the individual’s investment objectives and risk-taking capacity, and then recommend a suitable portfolio. So, we suggestthat you get in touch with our Mutual Fund Advisor before investing in the best funds.�
MF PICKS MUTUAL FUNDS DESK
SHAREKHAN’S TOP MUTUAL FUND PICKS (EQUITY) JUNE 25, 2012Data as on June 19, 2012
Scheme name Star NAV (Rs) Returns (%)rating Absolute Compounded annualised Since
6 months 1 year 3 years 5 years inception
Large-cap fundsICICI Prudential Focused Bluechip Equity Fund - Ret ����� 15.7 7.9 -1.6 13.7 0.0 11.7
UTI Wealth Builder Fund - Series II ����� 21.1 12.1 8.3 12.9 0.0 23.7
Franklin India Bluechip ���� 202.6 8.8 -3.4 10.7 8.2 24.7
Birla Sun Life Top 100 Fund ���� 21.4 12.0 -3.5 9.7 5.2 12.1
ICICI Prudential Target Returns Fund - Ret ���� 12.9 12.9 -3.2 8.5 0.0 8.7
IndicesBSE Sensex 16,859.8 9.6 -5.6 5.1 3.4
Mid-cap fundsSBI Magnum Sector Funds Umbrella - Emerg Buss Fund ����� 45.0 16.8 5.9 22.4 6.7 21.4
HDFC Mid-Cap Opportunities Fund ���� 15.5 16.2 -2.9 21.5 0.0 9.2
IDFC Sterling Equity Fund ����� 17.9 18.3 -1.0 17.3 0.0 14.5
UTI Mid Cap Fund ���� 29.3 15.1 -5.6 16.1 5.7 15.3
Kotak Emerging Equity Scheme ���� 10.7 15.5 -2.5 12.9 -0.4 1.4
IndicesBSE MID CAP 5,905.5 14.2 -13.2 6.0 -1.1
Multi-cap fundsReliance Equity Opportunities Fund ����� 35.8 20.2 0.7 21.5 9.6 19.3
UTI Equity Fund - Growth ����� 53.0 12.1 -0.2 14.2 9.1 10.6
ICICI Prudential Dynamic Plan ����� 102.1 14.0 -2.6 14.0 8.0 27.2
UTI Opportunities Fund ����� 27.6 10.1 3.1 13.4 12.9 15.8
ICICI Prudential Top 100 Fund ����� 133.1 14.0 2.3 10.6 6.4 20.4
IndicesBSE 500 6,440.7 11.3 -8.1 5.6 2.9
Tax saving fundsICICI Prudential Taxplan ����� 131.7 13.9 -4.0 15.9 7.7 22.2
Reliance Equity Linked Saving Fund - Series I ����� 14.1 26.0 0.2 13.7 0.0 8.5
Reliance Tax Saver (ELSS) Fund ���� 20.4 22.6 -0.6 13.4 7.1 11.2
Fidelity Tax Advantage Fund ���� 20.2 9.7 -5.1 13.2 7.9 11.8
Franklin India Taxshield ����� 203.7 10.0 -1.3 13.1 8.6 25.6
IndicesCNX500 4,016.5 11.5 -7.8 5.1 2.7
Thematic fundsBirla Sun Life India GenNext Fund ����� 24.4 12.4 -1.4 14.9 7.5 13.8
UTI India Lifestyle Fund ����� 11.9 12.7 1.6 13.5 0.0 3.7
Fidelity India Special Situations Fund ����� 17.7 14.8 -1.5 11.7 5.4 9.8
ICICI Prudential Service Industries Fund ���� 15.7 11.9 -5.7 8.3 -1.6 7.1
Reliance Natural Resources Fund ���� 9.5 10.5 -6.6 3.4 0.0 -1.3
IndicesS&P Nifty 5,103.9 10.6 -4.9 5.8 3.9
Balanced funds
HDFC Balanced Fund ����� 56.8 12.0 0.1 16.8 12.3 15.9
HDFC Prudence Fund ���� 208.1 12.0 -2.0 16.3 11.3 19.6
Canara Robeco Balance ���� 62.7 12.0 3.8 12.6 9.9 10.1
ICICI Prudential Balanced ���� 47.7 10.6 3.1 12.7 5.8 13.2
Birla Sun Life 95 ��� 296.5 6.5 -3.3 10.6 8.7 21.6
Indices
Crisil Balanced Fund Index 7.9 -0.4 6.1 6.0

Sharekhan ValueGuide July 201245
MF PICKSMUTUAL FUNDS DESK
SHAREKHAN’S TOP SIP FUND PICKS JUNE 25, 2012
Sharekhan Limited, its analyst or dependant(s) of the analyst might be holding or having a postition in the mutual funds mentioned in the article.
Every individual has a different investment requirement, which depends on his financial goals and risk-taking capacities. We at Sharekhanfirst understand the individual’s investment objectives and risk-taking capacity, and then recommend a suitable portfolio. So, we suggestthat you get in touch with our Mutual Fund Advisor before investing in the best funds.�
Investment period 1 year 3 years 5 yearsTotal amount invested (Rs) 12,000 36,000 60,000Funds would have grown to (Rs) NAV Present Avg. annual Present Avg. annual Present Avg. annual
value (Rs) return (%) value (Rs) return (%) value (Rs) return (%)
Large-cap funds
Franklin India Bluechip 202.6 12,011 0.1 37,011 1.0 73,917 4.3
Birla Sun Life Top 100 Fund 21.4 12,153 1.4 36,741 0.7 70,494 3.3
DSP BlackRock Top 100 Equity Fund 95.0 12,031 0.3 36,636 0.6 71,824 3.7
Birla Sun Life Frontline Equity Fund - Plan A 80.8 12,093 0.8 35,920 -0.1 71,689 3.7
Sundaram India Leadership Fund 37.8 11,790 -1.9 35,075 -0.9 66,101 2.0
BSE Sensex 16,859.8 12,013 0.1 34,880 -1.1 65,252 1.7
Multi-cap funds
Reliance Equity Opportunities Fund 35.8 12,493 4.5 40,256 3.9 85,776 7.5
UTI Opportunities Fund 27.6 12,254 2.3 39,140 2.9 81,039 6.3
ICICI Prudential Top 100 Fund 133.1 12,506 4.6 38,111 2.0 72,723 4.0
UTI Equity Fund 53.0 12,249 2.3 37,966 1.8 75,942 4.9
ICICI Prudential Dynamic Plan 102.1 12,283 2.6 37,906 1.8 75,832 4.9
BSE 500 6,440.7 11,906 -0.9 34,149 -1.8 64,584 1.5
Mid-cap funds
SBI Magnum Sector Funds Umbrella - 45.0 12,360 3.3 42,950 6.2 88,182 8.1Emerg Buss Fund
HDFC Mid-Cap Opportunities Fund 15.5 12,129 1.2 39,971 3.7 84,567 7.2
UTI Mid Cap Fund 29.3 11,932 -0.6 36,365 0.3 73,935 4.3
DSP BlackRock Small and Midcap Fund 80.8 11,640 -3.3 36,095 0.1 76,961 5.2
Kotak Emerging Equity Scheme 10.7 12,119 1.1 35,836 -0.2 66,484 2.1
BSE Midcap 5,905.5 11,668 -3.0 32,402 -3.5 61,342 0.5
Tax saving funds
Franklin India Taxshield 203.7 12,110 1.0 38,218 2.1 75,950 4.9
Reliance Tax Saver (ELSS) Fund 20.4 12,388 3.5 38,111 2.0 75,824 4.9
ICICI Prudential Taxplan 131.7 12,189 1.7 37,332 1.3 77,226 5.3
Fidelity Tax Advantage Fund 20.2 11,946 -0.5 36,775 0.7 74,369 4.5
HSBC Tax Saver Equity Fund 13.6 12,345 3.1 36,117 0.1 69,858 3.1
S&P Nifty 5,103.9 12,048 0.4 35,187 -0.8 65,706 1.9
Data as on June 19, 2012

Sharekhan ValueGuide July 201246
Prices as on June 30, 2012
FY12 FY13E FY14E FY12 FY13E FY14E FY12 FY13E FY14E FY14/FY12 FY12 FY13E FY14E FY13E FY14E FY13E FY14E (Rs)
EQUITY FUNDAMENTALSEARNINGS GUIDE
Sharekhan Earnings Guide Company Price Sales Net Profit EPS (%) EPS PE (x) ROCE (%) RONW (%) DPS Div
(Rs) Growth Yield(%)
EvergreenGSK Consumers 2748.6 2685.5 3182.6 3740.0 355.2 437.2 504.9 84.5 104.0 120.1 19 32.5 26.4 22.9 53.0 51.0 34.7 33.4 35.0 1.3
HDFC 653.2 4998.3 6110.0 7568.6 4122.6 4895.2 5888.2 27.9 32.1 38.6 18 23.4 20.4 16.9 - - 20.6 19.6 11.0 1.7
HDFC Bank 563.6 17540.8 21687.7 25856.6 5166.3 6276.8 7392.9 22.0 25.5 30.1 17 25.6 22.1 18.7 - - 19.6 20.0 4.3 0.8
Infosys 2509.2 33734.0 38528.8 43696.9 8316.0 9125.8 10483.6 145.4 159.5 183.3 12 17.3 15.7 13.7 36.6 33.8 26.4 25.2 47.0 1.9
Larsen & Toubro 1397.8 66832.5 70269.8 77497.9 5306.8 5793.4 6283.9 86.7 94.6 102.6 9 16.1 14.8 13.6 12.5 11.9 17.0 16.0 16.5 1.2
Reliance Ind 737.9 358501.0 322372.7 305711.1 20033.0 20370.2 21145.2 61.0 62.0 64.3 3 12.1 11.9 11.5 11.8 11.0 10.5 9.8 8.5 1.2
TCS 1277.5 48893.8 59229.2 66791.5 10638.3 13097.8 14832.6 54.4 66.9 75.8 18 23.5 19.1 16.9 43.3 39.2 33.4 30.5 25.0 2.0
Apple Green
Aditya Birla Nuvo @ 807.0 8253.2 7319.0 7921.0 426.4 430.3 532.8 37.6 33.1 41.0 4 21.5 24.4 19.7 9.2 10.2 7.4 8.4 6.0 0.7
Apollo Tyres 79.0 12153.3 14198.1 15888.3 441.5 606.2 757.5 8.2 12.0 15.0 35 9.6 6.6 5.3 18.0 20.0 18.1 18.7 0.5 0.6
Bajaj Auto 1572.9 19759.2 22139.1 25443.0 3138.1 3328.7 3910.6 108.5 115.1 135.2 12 14.5 13.7 11.6 33.4 31.9 38.1 35.4 45.0 2.9
Bajaj Finserv 684.4 3904.8 - - 1337.8 - - 92.5 - - - 7.4 - - - - - - 1.5 0.2
Bajaj Holdings 780.9 295.3 - - 1679.2 - - 217.0 - - - 3.6 - - - - - - 35.0 4.5
Bank of Baroda 732.9 13739.3 16027.5 18836.1 5007.0 5301.7 6096.0 121.4 128.2 146.9 10 6.0 5.7 5.0 - - 17.9 17.8 17.0 2.3
Bank of India 347.1 11634.6 12992.8 14821.3 2677.5 3074.8 3657.2 46.6 53.5 63.7 17 7.4 6.5 5.5 - - 13.9 14.8 7.0 2.0
Bharat Electronics 1340.5 5650.0 6271.2 7080.4 855.3 892.6 968.3 106.9 111.6 121.0 6 12.5 12.0 11.1 17.9 16.6 13.3 12.3 20.8 1.6
BHEL 232.5 47226.4 48816.7 46577.1 7040.0 6965.7 6799.4 28.8 28.5 27.8 -2 8.1 8.2 8.4 35.1 29.9 23.3 19.7 6.4 2.8
Bharti Airtel 305.1 72679.0 81664.0 89820.0 4258.0 5560.0 7309.0 11.2 14.6 19.2 31 27.2 20.9 15.9 20.0 20.3 18.0 18.2 1.0 0.3
Corp Bank 417.3 4639.5 5276.1 6177.9 1506.0 1636.1 1906.3 101.7 110.4 128.7 13 4.1 3.8 3.2 - - 18.4 18.6 20.5 4.9
Crompton Greaves 121.2 11248.6 12735.7 14188.1 373.6 522.6 653.8 5.7 8.2 10.2 33 21.2 14.9 11.9 19.2 21.3 13.1 14.4 1.4 1.2
Divi's Labs 1025.2 1858.6 2262.7 2721.8 533.3 666.8 814.9 40.2 50.2 61.4 24 25.5 20.4 16.7 32.5 33.0 27.2 27.5 13.0 1.3
GAIL 352.1 40280.7 45977.2 47264.7 3653.9 4118.1 4252.6 28.8 32.5 33.5 8 12.2 10.8 10.5 17.1 14.8 18.1 16.8 8.7 2.5
Glenmark Pharma 363.1 4020.6 4614.5 5387.4 744.0 623.0 738.0 27.5 23.0 27.3 0 13.2 15.8 13.3 15.9 16.3 16.3 16.2 2.0 0.6
GCPL 574.4 4850.9 5995.0 7061.7 597.1 807.0 965.6 16.8 22.4 26.8 26 34.2 25.6 21.4 22.3 24.5 26.1 25.9 4.8 0.8
Grasim 2640.9 24988.0 27506.0 29580.0 2647.0 2601.0 2885.0 288.8 283.8 314.7 4 9.1 9.3 8.4 18.2 17.7 13.0 12.4 22.5 0.9
HCL Tech** 476.5 20595.0 23433.8 26057.7 2255.1 2819.1 3204.9 32.2 40.3 45.8 19 14.8 11.8 10.4 28.9 27.7 26.9 25.0 7.5 1.6
Hindustan Unilever 454.5 22987.7 26750.9 30996.3 2721.4 3130.0 3612.7 12.6 14.5 16.7 15 36.1 31.3 27.2 91.6 77.4 71.8 60.6 7.5 1.7
ICICI Bank 899.5 18236.2 21396.0 25184.3 6464.5 7411.5 8597.3 56.1 64.4 74.7 15 16.0 14.0 12.0 - - 11.8 12.7 16.5 1.8
Indian Hotel Co 61.8 3432.7 4170.0 4753.4 3.5 152.7 214.7 0.0 1.9 2.7 - - 32.5 22.9 6.3 2.5 6.0 7.9 1.0 1.6
ITC# 258.9 25173.8 29315.1 34364.2 6182.5 7352.6 8799.6 7.9 9.4 11.3 20 32.8 27.5 22.9 46.0 46.8 36.4 37.2 4.5 1.7
Lupin 537.2 6959.7 8178.8 9764.0 924.0 1176.7 1504.4 20.7 26.3 33.7 28 26.0 20.4 15.9 22.1 23.2 21.6 21.5 3.2 0.6
M&M 707.3 31864.2 40177.2 46215.2 2770.6 2499.9 2426.3 45.1 40.7 39.5 -6 15.7 17.4 17.9 20.3 17.8 17.8 15.4 12.5 1.8
Marico 183.7 4008.3 4804.6 5597.4 318.9 418.3 507.0 5.2 6.8 8.2 26 35.3 27.0 22.4 27.4 28.0 31.5 29.2 0.7 0.4
Maruti Suzuki 1169.8 35970.3 42207.9 52400.6 1635.1 2291.3 2695.9 56.6 79.3 93.3 28 20.7 14.8 12.5 18.1 19.7 13.5 14.2 7.5 0.6
Oil India 499.4 9863.0 10604.0 10773.0 3446.0 3724.0 3940.0 57.0 62.0 66.0 8 8.8 8.1 7.6 28.2 26.5 19.7 18.5 19.0
Piramal Healthcare 527.9 2204.0 3094.8 3804.9 229.1 206.7 300.3 13.3 12.0 17.4 14 39.8 44.1 30.3 3.2 4.0 1.8 2.6 17.5 3.3
PTC India 64.9 7650.2 8746.1 10664.6 120.1 145.6 174.1 4.1 4.9 5.9 20 15.9 13.1 11.0 8.7 10.0 6.2 7.0 1.5 2.3
Punj Lloyd 48.9 10312.9 12724.1 15894.1 -135.3 101.4 276.5 -4.1 3.1 8.3 - -11.9 15.8 5.9 9.4 12.1 3.2 8.1 0.2 0.3
SBI 2159.0 57642.5 64901.0 73975.0 11707.3 14716.0 18017.0 174.5 219.3 268.5 26 12.4 9.9 7.8 - - 16.3 18.3 35.0 1.6
Sintex Industries 61.5 4453.5 4635.0 5161.8 353.5 331.1 389.6 12.9 12.1 14.3 5 4.8 5.1 4.3 8.9 9.8 11.3 11.8 0.7 1.1
TGBL (Tata Tea) 116.0 6631.2 7320.9 8178.6 339.2 388.5 446.4 5.5 6.3 7.2 14 21.1 18.4 16.1 8.9 9.5 8.3 9.0 2.2 1.9
Wipro 399.9 37197.1 42637.1 47183.7 5573.0 6502.2 7169.5 22.7 26.5 29.2 13 17.6 15.1 13.7 22.6 21.8 21.3 20.1 6.0 1.5
Emerging Star
Axis (UTI) Bank 1015.8 13438.2 15959.1 18987.2 4242.5 4896.7 5973.7 102.7 118.5 144.6 19 9.9 8.6 7.0 - - 19.9 20.6 16.0 1.6
Cadila Healthcare 770.3 5263.2 5886.6 6831.6 770.2 881.5 1200.5 37.6 43.1 58.6 25 20.5 17.9 13.1 21.9 25.3 25.0 26.1 7.5 1.0
Eros Intnl Media 168.5 943.9 1137.5 1372.1 147.8 182.8 221.7 16.1 20.0 24.3 23 10.5 8.4 6.9 19.7 20.6 20.0 19.8 0.0 0.0
@Stand-alone financials **June ending companyNote: For Grasim and Apollo Tyres we have shifted our estimates to consolidated

Sharekhan ValueGuide July 201247
Company Price Sales Net Profit EPS (%) EPS PE (x) ROCE (%) RONW (%) DPS Div(Rs) Growth Yield
(%)FY12 FY13E FY14E FY12 FY13E FY14E FY12 FY13E FY14E FY14/FY12 FY12 FY13E FY14E FY13E FY14E FY13E FY14E (Rs)
#UltraTech numbers are post merger of Samruddhi Cement.
EQUITY FUNDAMENTALS EARNINGS GUIDE
Gateway Distriparks 137.1 817.3 1012.9 1226.1 132.0 150.1 168.1 12.2 13.9 15.5 13 11.2 9.9 8.8 17.5 19.4 19.1 19.4 3.0 2.2
Greaves Cotton 70.1 1751.2 1841.6 2062.6 185.5 144.1 167.4 5.9 5.9 6.9 8 11.9 11.9 10.2 30.3 30.5 20.6 20.7 2.2 3.1
ITNL 184.1 5605.6 6430.5 6995.4 497.0 619.0 637.3 25.6 31.9 32.8 13 7.2 5.8 5.6 12.1 11.0 18.7 15.4 4.0 2.2
IRB Infra 127.2 3130.5 3899.9 4842.8 495.8 432.0 432.0 14.9 13.0 13.0 -7 8.5 9.8 9.8 11.4 11.6 14.2 12.7 3.3 2.6
Kalpataru Power 83.0 5308.0 6286.1 7299.8 188.7 216.6 257.3 12.3 14.1 16.8 17 6.7 5.9 4.9 15.0 15.7 11.2 12.1 1.5 1.8
Max India 192.1 7648.4 - - 241.9 - - 6.0 - - - 32.0 - - - - - - - -
Opto Circuits India 154.3 2356.9 2765.8 3179.7 571.9 565.6 667.7 23.6 23.3 27.6 8 6.5 6.6 5.6 20.2 20.9 25.9 24.6 3.0 1.9
Thermax 480.0 5304.0 5164.7 5396.5 406.9 391.7 409.9 34.1 32.9 34.4 0 14.1 14.6 14.0 33.1 30.0 21.3 19.2 7.0 1.5
Yes Bank 339.4 2472.6 3221.1 4270.0 977.2 1226.9 1584.6 27.7 29.5 38.0 17 12.3 11.5 8.9 - - 19.2 18.0 4.0 1.2
Zydus Wellness 391.7 331.4 354.7 393.5 68.6 71.2 81.4 17.6 18.2 20.8 9 22.3 21.5 18.8 40.9 37.7 33.8 31.0 5.0 1.3
Ugly Duckling
Ashok Leyland 24.9 12780.9 14747.6 17075.0 595.0 656.4 717.4 2.2 2.5 2.7 11 11.3 10.0 9.2 12.5 13.8 14.8 14.9 1.0 4.0
Bajaj Corp 118.3 473.3 600.1 709.6 121.9 148.5 174.9 8.3 10.1 11.9 20 14.3 11.7 9.9 40.7 41.2 32.4 32.7 4.0 3.4
CESC 289.7 4593.0 5455.1 5902.1 565.0 582.4 614.9 45.0 46.4 49.0 4 6.4 6.2 5.9 7.8 7.7 9.4 9.3 4.0 1.4
Deepak Fert 133.0 2411.6 2376.1 2654.3 211.7 246.1 275.8 24.0 27.9 30.9 13 5.5 4.8 4.3 12.7 12.8 18.8 18.3 5.5 4.1
Federal Bank 448.6 2485.7 2979.7 3487.3 776.8 885.1 1046.3 45.4 51.7 61.2 16 9.9 8.7 7.3 - - 14.6 15.4 9.0 2.0
Gayatri Projects 99.0 1801.9 2146.0 2610.6 98.8 102.8 129.4 41.2 42.9 54.0 14 2.4 2.3 1.8 14.6 14.6 18.0 19.0 5.0 5.1
India Cements 87.0 4203.0 4526.0 4897.0 297.0 301.0 342.0 9.6 9.8 11.1 8 9.1 8.9 7.8 7.0 8.0 7.0 8.0 2.0 2.3
Ipca Laboratories 358.7 2314.0 2741.1 3143.5 316.9 369.2 463.7 25.3 29.5 37.0 21 14.2 12.2 9.7 25.2 26.0 25.3 24.7 3.2 0.9
ISMT 24.1 1879.4 2053.3 2317.0 28.6 34.0 85.1 2.0 2.3 5.8 70 12.0 10.5 4.1 10.8 13.0 5.5 12.0 0.8 3.1
Jaiprakash Asso 73.5 12742.9 15559.1 17258.9 1020.4 1040.1 1177.0 4.8 4.9 5.5 7 15.3 15.0 13.3 11.3 12.2 10.0 10.4 0.5 0.7
KKCL 580.1 301.9 356.4 420.1 52.1 59.2 72.1 42.3 48.0 58.4 17 13.7 12.1 9.9 33.2 37.0 24.7 26.9 17.0 2.9
Mcleod Russel India 298.1 1445.3 1683.3 1979.1 296.5 327.1 417.8 27.1 29.9 38.2 19 11.0 10.0 7.8 21.4 23.7 17.7 19.5 6.0 2.0
NIIT Technologies 285.8 1576.5 2087.4 2393.5 197.2 240.9 277.2 33.1 40.4 46.5 19 8.6 7.1 6.1 32.1 31.2 23.8 23.0 8.0 2.8
Orbit Corporation 56.5 382.6 447.3 577.7 21.4 60.1 99.4 1.9 5.3 8.7 114 29.7 10.7 6.5 9.3 11.8 5.6 8.7 1.0 1.8
Polaris Financial Tech 127.5 2052.7 2448.4 2782.0 220.7 257.9 294.7 22.3 26.0 29.7 15 5.7 4.9 4.3 26.8 26.2 19.9 19.7 4.5 3.5
Pratibha Industries 46.4 1650.4 2060.0 2481.0 78.6 95.5 131.5 7.9 8.4 11.6 21 5.9 5.5 4.0 17.0 18.4 15.1 17.2 0.6 1.3
Provogue India 15.4 646.6 725.6 - 32.3 40.7 - 2.8 3.6 - - 5.5 4.3 - 9.1 - 5.3 - 0.3 1.6
PNB 808.3 17617.0 19859.7 23239.0 4884.2 5442.1 6366.4 144.0 160.4 187.7 14 5.6 5.0 4.3 - - 18.1 18.3 22.0 2.7
Ratnamani Metals 105.4 1221.7 1317.0 1477.6 94.3 99.2 123.1 20.3 21.4 26.5 14 5.2 4.9 4.0 19.8 20.9 17.4 18.5 3.0 2.8
Raymond 402.4 3657.0 3981.0 4586.0 155.8 201.3 243.8 25.4 32.8 39.7 25 15.8 12.3 10.1 16.8 17.0 16.0 17.5 2.5 0.6
Selan Exploration 285.0 92.7 126.7 201.5 43.9 61.2 94.4 25.8 36.0 55.6 47 11.0 7.9 5.1 31.9 39.0 26.4 31.5 3.0 1.1
Sun Pharma 635.8 8005.7 9494.8 10713.4 2587.3 2530.8 2932.3 25.0 24.4 28.3 6 25.4 26.0 22.5 25.3 24.6 17.9 17.3 4.3 0.7
Torrent Pharma 600.6 2594.4 3057.6 3490.4 391.4 403.7 521.8 46.3 47.7 61.7 15 13.0 12.6 9.7 29.0 30.6 29.1 28.8 8.5 1.4
UltraTech Cement 1516.5 18166.4 19655.7 21416.2 2446.2 2344.7 2573.3 89.3 85.6 93.9 3 17.0 17.7 16.2 20.1 19.6 15.7 14.9 8.0 0.5
Union Bank of India 209.1 9241.3 10811.6 12754.4 1788.5 2727.8 3342.1 32.5 49.5 60.7 37 6.4 4.2 3.4 - - 17.4 18.4 8.0 3.8
United Phosphorus 125.9 7654.7 8863.3 9679.1 636.0 693.5 763.2 12.0 15.2 16.7 18 10.5 8.3 7.5 14.5 14.3 14.8 14.3 2.0 1.6
V-Guard Industries 233.1 993.6 1251.8 1545.2 50.7 66.5 72.9 17.0 22.3 24.4 20 13.7 10.5 9.6 24.5 23.3 27.8 24.5 3.5 1.5
Vulture's Pick
Mahindra Lifespace@ 326.8 469.0 475.1 503.0 120.2 125.4 130.8 29.0 30.3 31.6 4 11.3 10.8 10.3 13.7 13.3 10.7 10.3 6.0 1.8
Orient Paper 55.7 2433.0 2736.0 3035.0 212.0 233.0 267.0 10.5 11.4 13.0 11 5.3 4.9 4.3 13.0 13.0 19.0 19.0 2.0 3.6
Tata Chemicals 311.0 12885.7 14299.1 15827.4 666.2 722.1 747.4 26.1 28.3 29.3 6 11.9 11.0 10.6 14.5 14.6 11.3 10.8 10.0 3.2
Unity Infraprojects 45.9 1972.8 2365.6 2824.2 103.5 132.2 168.7 14.0 17.8 22.8 28 3.3 2.6 2.0 19.1 20.2 16.5 17.8 1.0 2.2
Cannonball
Allahabad Bank 149.7 6461.3 7368.1 8697.8 1867.7 2054.9 2310.9 37.3 41.1 46.2 11 4.0 3.6 3.2 - - 18.2 17.8 6.0 4.0
Andhra Bank 118.4 4619.3 5212.0 6109.5 1344.7 1476.6 1748.9 24.0 26.4 31.3 14 4.9 4.5 3.8 - - 18.4 18.8 5.5 4.6
IDBI Bank 93.4 6663.6 7608.7 8990.0 2031.6 2122.7 2549.5 15.9 16.6 19.9 12 5.9 5.6 4.7 - - 10.5 11.6 1.5 3.0
Madras Cements 159.8 3236.0 3501.0 3780.0 385.0 391.0 433.0 16.2 16.4 18.2 6 9.9 9.7 8.8 10.0 9.0 18.0 17.0 2.5 1.6
Shree Cement 3040.0 4625.0 5448.0 6030.0 279.0 354.0 450.0 75.8 101.6 129.3 31 40.1 29.9 23.5 14.0 15.0 15.0 17.0 8.0 0.3

Sharekhan ValueGuide July 201248
Remarks
Evergreen
GSK Consumers � GSK is one of the leading players in the MFD segment with a market share of 71% in the domestic market. Judiciousnew launches and brand extensions and the expansion of its distribution reach have helped GSK to stay ahead of thecompetition and maintain its pricing power over the years. In a bid to de-risk its business model, GSK has expandedits product portfolio by entering into new categories such as biscuits, noodles, energy bars, sports drinks and oats inthe recent years. With cash balance of Rs1,000 crore the company can invest into growth initiatives as well as rewardthe investors with healthy dividend payment. Hence we recommend a Buy on the stock with a price target of Rs3,000.
HDFC � HDFC is among the top mortgage lender providing housing loans to individuals, corporates and developers. It hasinterests in banking, asset management and insurance through its key subsidiaries. As these subsidiaries are growingfaster than HDFC, the value contributed by them would be significantly higher going forward.
HDFC Bank � HDFC Bank was established in 1994 as a part of liberalisation of the Indian banking industry by the Reserve Bank of India(RBI). It was one of the first banks to receive an 'in principle' approval from the RBI to set up a private sector bank. Its relativelyhigh margins (compared with its peers), strong branch network and better asset quality make HDFC Bank a safe bet.
Infosys � Infosys is India's premier IT and IT-enabled services company. It has been one of the key beneficiaries of the strongtrend of offshore outsourcing. However, the company has given a sluggish outlook for FY2013 lower than theNasscom’s expectation due to multiple issues and an uncertain macro environment. Although, the stock has corrected,we do not see any major upside trigger for the stock in the near to medium term.
L&T � Larsen & Toubro, being the largest engineering and construction company in India, is a direct beneficiary of the strongdomestic infrastructure boom. Strong potential from its international business, its sound execution track record,bulging order book and strong performance of subsidiaries further reinforce our faith in it. There also lies great growthpotential in some of its new initiatives. However, muted growth in the recent quarters amid a tough businessenvironment has hampered the stock’s sentiments in the recent times.
Reliance Ind � RIL holds a great promise in E&P business with gas production from KG basin starting from April 2009 and crudeoil production commencing from September 2008. We expect the company’s GRM to pick up with a likelyimprovement in the light-heavy crude oil price differential. The company is likely to fetch premium over SingaporeComplex’ GRM due to its superior refinery complexity and captive use of KG D-6 gas. We expect the petrochemmargins to be maintained in the medium term on uptick in the domestic demand. Currently the decline in gas outputfrom KG D6 basin is weighing high on the stock price.
TCS � TCS pioneered the IT services outsourcing business from India and is the largest IT service firm in the country. It isa leader in most service offerings and is in the process of further consolidating its leadership position through theinorganic route and large deals. TCS with a strong base in BFSI is well placed to garner incremental deals in the sector.Its consistent quarterly performance (better than peers) coupled with the higher predictability of its earnings wouldkeep it the Street’s favourite over Infosys.
Apple Green
Aditya Birla Nuvo � We believe the value businesses of the company (insulators, textiles, fertilisers, carbon black and rayon) have startedwitnessing increased efficiency as reflected in sharp improvement in their operating margins, while the growthbusinesses (retail, BPO, life insurance and financial services) are showing improved revenue visibility and gainingstrong market share. We believe strong internal cash flows from value businesses coupled with promoter fundingwould aid in meeting the funding requirement of the growth businesses.
Apollo Tyres � Apollo Tyres is the market leader in truck and bus tyre segments with a 28% market share. A strong demand in theOEM and replacement tyre segments coupled with the commencement of additional capacity at its new Chennaifacility is likely to see a healthy growth in its volume going forward. The European and South African acquisitionshave yielded regional and product diversification. The Indian operations contribute about 62%; VBBV contributesaround 25%; and Apollo Dunlop, South Africa contributes approximately 13% to the consolidated revenues.
Bajaj Auto � Bajaj Auto is a leading two-wheeler automobile company. It is moving up the value chain by concentrating on theexecutive and premium motorcycle segments. The launch of the new Pulsar and the KTM range would be the key forit to maintain its leadership position in the premium bike segment and for maintaining domestic volume growth.Exports remain the key for the company to drive overall volumes.
Bajaj Finserv � Bajaj Finserv is actively present in businesses such as vehicle finance, consumer finance, distribution etc with insurancebeing the dominant contributor to revenues. It is one of the top few players in the fast growing life insurance segmentand also has a sizable presence in the general insurance segment.
Bajaj Holdings � Bajaj Holdings is the holding company of the Bajaj group, having a 30% stake each in Bajaj Auto and Bajaj Finserv.The two-wheeler sales are expected to improve going forward with new product launches. The insurance businessmakes it one of the largest players in the insurance space.
EQUITY FUNDAMENTALSEARNINGS GUIDE
Sharekhan ValueGuide July 201249
Remarks
Bank of Baroda � BoB is among the top PSU banks having sizeable overseas presence (86 offices in 25 countries) and a strong domesticnetwork of over 3,400 branches across the country. It has a stronghold in the western and eastern parts of India. Thebank has laid out aggressive plans to expand its income streams from both domestic and international businesses.
Bank of India � Bank of India has a wide network of branches, spread across the country and abroad, along with a diversified productand services portfolio and steadily growing assets. The asset quality had posed concerns and affected the operatingperformance of the bank.
Bharti Airtel � Bharti Airtel continues to perform well in the Indian telecom market in terms of both, growth in subscriber base andrevenue market share. After a long time traffic growth was seen in the Indian mobile segment which is positive. Thecontinuing regulatory uncertainty keeps us cautious on the sector.
BEL � Bharat Electronics Ltd (BEL), a PSU manufacturing electronic, communication and defence equipment, is benefitingfrom the enhanced budgetary outlay for strengthening and modernising the country’s security. The growth in revenueis also expected to be aided by the civilian and export orders. The company’s current order book of Rs25,748 croreprovides revenue visibility for the next three to four years. The huge cash reserve gives further support to the stock.
BHEL � BHEL, India's biggest power equipment manufacturer, has been the prime beneficiary of the multifold increase in theinvestments made in the domestic power sector over the last few years. The current order book of Rs1,35,000 crorestands at around 2.7x its FY2012 revenues providing revenue visibility for at least the next two-three years. However,the key challenge before the company now would be to maintain a robust order inflow amid rising competition inthe power equipment space and a profitable execution of the order book.
Corp Bank � Corporation Bank is a mid-sized PSU bank having strong presence in the corporate segment. The bank is planning toexpand its retail and SME book, and expand the CASA ratio which will improve the net interest margin over the mediumterm. The bank is most aggressive on technology implementation which gives it a competitive edge over its peers.
Crompton Greaves � Crompton Greaves' key businesses—industrial and power systems—holds huge potential in view of investmentopportunities in infrastructure particularly Transmission and Distribution sector in India. Its consumer productssegment, which has done very well in the recent years, also led to diversification in its business exposure. The synergyfrom the acquisition of Pauwels, GTV, Microsol, Emotron and QEI will drive the company’s consolidated earnings.However, continuing disappointment in the Q4FY2012 results have added to the investors’ concerns on thecompany’s growth slowdown and competitive margin pressure.
Divi Labs � FY2012 performances have re-affirmed our confidence in Divi’s Laboratories’ growth potential. The new DSN SEZfacility at Vishakhapatnam which started in June 2011 is likely to bring better economies of scale and tax benefits.A near debt-free balance sheet and strong cash flow are likely to help build a war chest for pursuing strategicinvestments (biosimilars) and exploit growth opportunities in niche segments like high potency for oncology andsteroids for contraceptives.
GAIL � GAIL India, a leading gas transmission company, is aggressively expanding its pipeline network and plans to investmore than Rs28,000 crore over FY2011-14 in a phased manner to significantly expand its gas pipeline network toover 14,000km and its transmission capacity to around 300mmscmd. On account of lower domestic gas production,we expect a subdued performance from its core gas transmission business in the next 1-2 years. However, the LNGtrading business is likely to see an uptick in the same period.
Glenmark Pharma� Glenmark Pharmaceuticals has exhibited an impressive operating performance during FY2012 on key genericlaunches but for forex losses and extra-ordinary items which dented profits. Through the successful development andout-licencing of six molecules in a short span of eight years, Glenmark has become India's best play on research-ledinnovation. It has built a pipeline of 14 molecules and has clinched six out-licensing deals worth $1,672 million (activedeals worth $938) and received $200 million as initial milestone payment. Its core business has seen stupendoussuccess due to its focus on niche specialties.
GCPL � Godrej Consumer Products Ltd (GCPL) is a major player in personal wash, hair colour and household insecticidemarket segments in India. The recent acquisitions of Darling Group, Tura, Megasari and Latin American companieshas helped the company to expand its geographic footprint. We believe the decent sales volume growth in the domesticbusiness coupled with a strong growth in Megasari (Indonesian business), African and the Argentine business wouldhelp GCPL to achieve an above 20% CAGR top line and bottom line growth over FY2012-14.
Grasim � Grasim is better placed compared to the other large players in the cement space due to its strong balance sheet,comfortable debt-equity ratio (0.33x FY2012), attractive valuation and due to its diversified business. The demand forVSF products continues to be strong in the global market and Grasim being a leading domestic player is well placed tocapture incremental demand. Further, the company is in the process of adding another 120,000 tonne capacity in VSFby FY2013 with an investment of Rs1,690 crore.
EQUITY FUNDAMENTALS EARNINGS GUIDE

Sharekhan ValueGuide July 201250
Remarks
HCL Tech � HCL Tech is one of the leading Indian IT service vendors. It has performed better than its peers in terms of betterfinancial performance in the past few quarters on the back of a ramp-up in business from large deals bagged earlier.The company has announced deals worth $2.5 billion in the last six months. HCL Tech continues to demonstratestrong growth visibility with a robust deals backlog and successful execution of strategy with market share gainsthough vendors churns/consolidation. We remain positive on the company and expect the valuation discount toInfosys reducing on the back of its order wins and superior earnings visibility.
HUL � HUL is India's largest FMCG company. It would achieve around 15% Y-o-Y top line growth driven by a mix of salesvolume and a price-led growth. However, the volatile input prices are likely to sustain pressure on the profitabilityin the near term. Overall we expect HUL’s bottom line to growth at CAGR of 15% over FY2012-14. In the long term,HUL will be one of the key beneficiaries of the Indian consumerism story.
ICICI Bank � ICICI Bank is India's largest private sector bank with a network of over 2,500 branches in India and a presence inaround 18 countries. The bank has once again entered an expansionary mode after making a conscious effort tocontract its advances book due to asset quality concerns. The bank offers substantial value unlocking opportunitieswith the expected listing of its subsidiaries like ICICI Securities and ICICI Prudential Life Insurance.
Indian Hotels Co � Indian Hotels is the largest hotelier in India with a vast portfolio of hotel properties around the globe. Over the long termthe company would benefit from increase in tourism and corporate travel in India. Also, a turnaround in profitability ofits overseas properties would boost its earnings.
ITC � ITC has a strategy of effectively utilising the excess cash generated from its cash cow, the cigarette business, tostrengthen and enhance it’s other non-cigarette businesses. This would nurture the growth of these businesses someof which are at nascent stage. Thus we believe the company will deliver sustained and steady growth in coming years.
Lupin � The expected ramp up in the launch of oral contraceptives, ophthalmic products and a robust pipeline of newlaunches in the domestic and overseas markets provide strong growth visibility for Lupin. Further, with anexpanded field force and therapy focused marketing division; its formulation business in the domestic market hasbeen performing better than the industry. The deal with Eli-Lilly to distribute human insulin would open anincremental revenue stream for Lupin in the Indian market.
M&M � M&M is a leading maker of tractors and utility vehicles in India. New product launches are likely to drive its growthgoing forward in the automobile segment, while the company is witnessing a moderation in tractor demand.Associating with world majors in passenger cars and commercial vehicles have helped it diversify into variousautomobile segments, while the value of its subsidiaries adds to its sum-of-the-parts valuation.
Marico � Marico is among India's leading FMCG companies. Its core brands, Parachute and Saffola, have a strong footing inthe market. It follows a three-pronged strategy which hinges on expansion of existing brands, launch of new productcategories (especially in the beauty and wellness space) and growth through acquisitions. While the domestic productportfolio is likely to achieve a steady growth in volumes, the international business is expected to post a robust growthon the back of an increase in distribution to neighbouring countries and extension of its international product portfolioover the long run.
Maruti Suzuki � Maruti Suzuki is India's largest small carmaker. While the new Swift has seen unprecedented response from themarket, there is considerable stress in its petrol portfolio. Recently the company successfully diversified into the MPVsegment with the launch of Ertiga. Suzuki of Japan has also identified India as a manufacturing hub for small cars forits worldwide markets.
Oil India � Oil India Ltd (OIL) has several hydrocarbon discoveries across reserves in Rajasthan and the north-eastern region ofIndia. The total 1P (proven) and 2P (proven and probable) reserves of the company stood at 505 million barrels(mmbbls) and 944mmbbls as on March 2011. In addition to the huge oil reserves, the company’s reserve-replacementratio (RRR) is quite healthy at 1.42x which implies a comfortable level of accretion of oil reserves through newdiscoveries. Further OIL has cash of around Rs10,935 crore (Rs182 per share) as on March 2012 and offers healthydividend pay-out (div yield of 4.3%) which provides comfort to investors.
Piramal Health � Even though the pharma business is witnessing strong traction, the company’s diversification into unrelated areas likefinancial services, healthcare information business etc keep us cautious. With the NCE business becoming an integralpart of the parent company, the risk profile of the company has increased. However, the acquisition of BST-Gel andmolecular imaging systems are set unlock its investments in R&D in short span of time. It has near Rs4,000 croreoutstanding from Abbott receivable by FY2014. We value company’s cash receivables and liquid investments atRs216 per share.
EQUITY FUNDAMENTALSEARNINGS GUIDE

Sharekhan ValueGuide July 201251
Remarks
PTC India � PTC India Ltd is a leading power trading company in India with a market share of 34.7% in the short term tradingmarket. In the last few years, the company has made substantial investments in areas like power project financing,coal trading and power tolling which have great growth potential in the future. However, continuous delay inpayments from state electricity boards has marred recent financial performance. Still, its valuations look quiteattractive on a sum-of-the-parts basis.
Punj Lloyd � Punj Lloyd is the second largest EPC player in the country (first being Larsen & Toubro) with a global presence.However, since FY2009, the profitability has come under severe pressure due to cost overruns/ liquidated damages insome of Simon Carves (subsidiary) projects. Thus it has put Simon Carves under administration. Further Libyan projectswill take another three-four quarters to begin execution. Therefore, going ahead, the successful execution of its projectsalong with debt reduction and working capital management hold the key as the company enjoys a robust order book.
SBI � State Bank of India is the largest bank of India with loan assets of Rs8.6 lakh crore. The loan growth is likely to remainslightly subdued in FY2012 while the core operating performance will be healthy with stable net interest margin.Successful merger of the associate banks could provide further upside for the parent bank. The asset quality of the bankwould remain a key monitorable.
Sintex Industries � A key player in the plastic specialties space, Sintex Industries has a diverse business model with presence inconstruction, prefabs, custom moulding and textile businesses. Being a pioneer in the monolithic constructiontechnique, it has a good order book position. But owing to policy paralysis, the company is going slow on theexecution front, which is likely to break the strong growth momentum seen by it in the last two years. The stock hasunderperformed the Sensex and the Nifty. The stock is currently trading at 4.6x its one year forward earnings whichis cheap in terms of valuation. Thus we maintain Buy on it.
TGBL � Over the past few years, Tata Global Beverage Ltd (TGBL, formerly Tata Tea) has transformed its focus from beinga mere tea and coffee company to a complete beverage maker. The recent addition of Mount Everest mineral waterto its product portfolio and its tie-up with Pepsico Inc to make a mark in the non-carbonated beverage space are likelyto be the new growth drivers for the company in the long run. Also its JV with Starbucks would help it to exploreopportunities in the coffee retailing space. Its intention to acquire companies in the US, Europe and Russia also augurswell to enhance its geographical footprint.
Wipro � Wipro is one of the leading Indian IT service companies. The company has lagged the other IT biggies in terms ofperformance. In the medium term we expect Wipro to demonstrate a relatively weaker earnings growth as it getsback on its feet post organisational re-structuring and with its lower presence in the banking and financial servicesspace. We expect Wipro’s earnings to grow at a CAGR of 13% over FY2012-14E.
Emerging Star
Axis Bank � Over the last few years, Axis Bank has grown its balance sheet aggressively. Notably, the bank has maintained adelicate balance between aggressive balance sheet growth and profitability. Besides the core banking business, thebank has forayed into the asset management business and is acquiring the securities and investment banking businessof ENAM. We expect the quality of its earnings to improve as the proportion of fee income goes up.
Cadila � Despite a weak performance in FY2012, Cadila's improving performance in the US generic vertical and emergingmarkets along with steady progress in the CRAMS space (through joint ventures)enrich its growth visibility ofachieving a $3 billion revenue target by 2015. It has acquired three entities in FY2012 namely, Nesher Pharma (US),Bremer Pharma (Germany) and Biochem Pharma (India) during FY2012, which should supplement the growth.However, a warning letter by the USFDA on its Moriya plant and imposition of a new tax (Union budget 2013) onpartnership based units in Sikkim would be a drag on earnings.
Eros Intl Media � Eros is one of the largest integrated film studios in India with multi-platform revenue streams and a well-establisheddistribution network across the globe. With its proven track record, de-risked business model and aggressive ramp-up plans, we believe the company is well poised to gain from the rising discretionary spending on film entertainmentdriven by the country’s favourable demographics. Thus, EIML is a compelling value play on the Indian media andentertainment industry.
GDL � With its dominant presence in the container freight station segment and recent forays into the rail freight and cold chainbusinesses, GDL has evolved as an integrated logistic player. Its CFS business is a cash cow while its investments in therail and cold storage businesses have started bearing fruits. It is one of the largest player in the CFS business and hasalso evolved as the largest player in the rail freight business as well as the cold storage business. The further proposedcapex planned in all the three segments will strengthen its presence in each of the segment and increase its pan-Indiapresence. We expect GDL’s revenue and net profit to grow at 22% and 13% CAGR respectively over FY2012-14.
EQUITY FUNDAMENTALS EARNINGS GUIDE

Sharekhan ValueGuide July 201252
RemarksRemarks
Greaves Cotton � Greaves Cotton is a midsize and well-diversified engineering company. The Company’s core competencies are inDiesel/Petrol engines, Power Gensets, Agro engines & pumpsets (Engines segment) and Construction Equipment(Infrastructure equipment segment). The engine business accounts for ~85% of the company’s revenue, while the restcomes from infrastructure equipment. Given the sharp deterioration in growth and margins in the core three-wheelerbusiness we cut our FY2013 estimates and maintain our Hold recommendation.
IL&FS Trans � ITNL is India’s largest player in the BOT road segment with a pan-India presence and a diverse project portfolio. Thefair mix of annuity and toll projects, and state and NHAI projects along with the geographical diversification across12 states reduces the risk to a large extent and provides comfort. Further, a strong pedigree along with the outsourcingof civil construction activity helps ITNL to scale up its portfolio faster. Thus, it is well equipped to capitalise on thehuge and growing opportunity in the road infrastructure sector.
IRB Infra � IRB is the largest toll road BOT player in India and the second largest BOT operator in the country with all its projectsbeing toll based. It has an integrated business model with an in-house construction arm which provides a competitiveadvantage in bidding for the larger projects and captures the entire value from the BOT asset. Further, it has aprofitable portfolio as majority of its operational projects have become debt-free and it has presence in high-growthcorridors which provides healthy cash flow. Thus, IRB is well poised to benefit from the huge opportunity in the roaddevelopment projects on the back of its proven execution capability and the scale of its operations.
Kalpataru � Kalpataru Power Transmission Ltd (KPTL) is a leading EPC player in the transmission & distribution space in India.Opportunities in this space are likely to grow significantly thereby providing healthy growth visibility (also currentorder book is 2x its FY12E sales). As a result of intense competition, since FY2008, domestically this space witnessedmargin pressure followed by valuation contraction. We believe concerns are priced in the current valuation and thestock is attractively priced at ~6x its forward earnings. Moreover, its construction subsidiary, JMC Projects is gettingtraction and upcoming BOOT projects are likely to generate sustainable RoE of 16-17%. Hence, we rate KPTL asbuy with a target price of Rs145.
Max India � Max India is a unique investment opportunity providing direct exposure to two sunrise industries of insurance andhealthcare services. Max New York Life, its life insurance subsidiary, is among the leading private sector players, hasgained the critical mass and enjoys some of the best operating parameters in the industry. With insurance penetrationpicking up in India and with the company entering into a tie up with Axis Bank we expect to see a healthy growthin the company’s annual premium equivalent (APE) going ahead.
Opto Circuits � Having strong presence in organ monitoring systems, Opto Circuits has diversified into the invasive space, supplyingstents for medical use. A lower cost base and an attractive pricing strategy have enabled the company's stents to gainacceptance globally. Besides, the Criticare acquisition has further enabled it to diversify into gas monitoring systemand strengthen its position in the USA. The quick turnaround in the recently acquired Cardiac Lifescience is impressiveand would drive the future growth.
Thermax � The energy and environment businesses of Thermax are direct beneficiaries of the continuing rise in India Inc's capex.Thermax’ group order book stands at Rs4,828 crore, which is 0.8x its FY2012 consolidated revenue. This provideslimited revenue visibility. Its super-critical boilers foray is also yet to see some major order inflow.
Yes Bank � Yes Bank, a new generation private bank, started its operations in November 2004 and is the only greenfield bankapproved by the RBI in the last decade. The bank is promoted by Rana Kapoor and Ashok Kapur. Yes Bank followsa unique business model based on knowledge banking, which offers product depth and a sustainable competitive edgeover established banking players. Knowledge led banking also enables the bank to generate strong fee income, whicheventually translates into higher return ratios.
Zydus Wellness � Zydus Wellness owns three high growth brands, Nutralite, Sugar free and Ever Yuth in the niche health and wellnesssegment. The company focuses on rampant growth by increasing the distribution of existing products, scaling up theexisting product portfolio through variants and new product launches leveraging the three brands. However the companyis facing intensifying competition in some of its key categories, which has led to a muted performance in FY2012.
Ugly Duckling
Ashok Leyland � Ashok Leyland, the second largest commercial vehicle (CV) manufacturer in India, is a pure CV play. The newgreenfield facility in Pantnagar in Uttaranchal has provided strategic cost and diversification benefits. The companyhas ventured into LCV space with the launch of Dost together with Nissan. It has also entered into constructionequipment space through JV with John Deere.
Bajaj Corp � Bajaj Corp is the third largest player in the hair oil segment and has emerged as the dominant player in the premiumlight hair oil (LHO) category with its Almond Drops hair oil. With its strong brand positioning, distribution strengthand healthy balance sheet, it is well poised to ride on the strong consumer demand emerging due to the rising disposableincome and growing aspirations of the Indians. Any initiative on the company’s part to expand its limited productportfolio or strengthen its core business would be the key upside trigger for the stock. Hence, we recommend Buy onthe stock with a price target of Rs142.
EQUITY FUNDAMENTALSEARNINGS GUIDE

Sharekhan ValueGuide July 201253
RemarksRemarks
CESC � CESC is the power distributor in Kolkata and Howrah backed by 1,225MW of power generation capacity, whichis a strong cash generating business. Further, it is adding 1,200MW of generation capacity which would be on streamby FY2015. Moreover, having 80% of assured coal supply from invested company and coal linkages, CESC has ahigh degree of integrated status among peers. Despite that, the stock is currently one of the cheapest stock in the Indianutility space trading at a discount to its book value primarily on account of the concerns related to losses from its retailbusiness, Spencer’s. However, we believe the concerns are overdone and the company has started exhibiting store levelprofit in FY2011 which is an initial sign of revival as per the management. Nevertheless, this possible turnaroundof retail business is not priced in the current stock price; hence the stock is a rerating candidate.
Deepak Fert � DFPCL manufactures and supplies industrial chemicals and ANP fertilisers. Given the expansion in TAN capacity,introduction of new products in the fertiliser division and ability to manage cost pressures, we expect the companyto report a good growth in revenue on the back of good volumes from the fertiliser segment. Going forward thecompany may see pressure on margin due to increase in price of key input materials for the chemical segment.
Federal Bank � Federal Bank is the fifth largest private sector bank in India in terms of asset size and has traditionally been a strongplayer in south India especially Kerala. The bank is expected to witness an improvement in its RoE due to leveragingof its equity and easing of cyclical asset-quality pressures.
Gayatri Proj � Gayatri Projects is a Hyderabad-based infrastructure company with a very strong presence in irrigation, road andindustrial construction businesses. The order book stands at Rs9,830 crore, which is 5.5x its FY2012 revenues. Itis also expanding its power and road BOT portfolio and plans to unlock value by offloading stake to private equity.We feel the company has potential to transform itself into a bigger player and expect its net profit to grow at a CAGRof 15% over FY2012-14.
India Cements � India Cements’ installed capacity has got enhanced to 16MTPA which will result in volume growth and drive theearnings of the company. The company is also setting up a 100MW captive power plant, which is expected to comeon stream by FY2013. However, in spite of cost inflation we expect the profitability of the company to improve inFY2012 due to the increase in the cement realisation on account of supply discipline followed by the manufacturers.
Ipca Lab � Ipca has successfully capitalised on its inherent strength in producing low-cost drugs to tap the export markets. Thecompany's ongoing efforts in the branded formulations business in the emerging economies, revival in the UKoperations, pan-European initiatives, likely approval of one additional product under institutional business and asignificant scale-up in the US business will drive its formulation exports. The USFDA approval for the Indore SEZare expected shortly, which would help ramp up sales in the US.
ISMT � A leading maker of seamless tubes, ISMT is likely to benefit from improving demand in its traditional user industrieslike automobile and mining. It would also gain from efforts taken to expand its product offerings and it increasingthe size of its addressable market by penetrating into energy and oil exploration sectors. The company hascommissioned its 40MW captive power plant in end May 2012. However, the company is seeing sluggish demandin the domestic market which has led to a grim outlook for the next couple of quarters. We expect a strongerperformance in FY2014.
Jaiprakash Asso � Jaiprakash Associates, India's leading cement and construction company, is all set to reap the benefits of India'sinfrastructure spending. The company has also monetised very well on the real estate properties of YamunaExpressway. Moreover, the marked improvement in macro environment has improved accessibility to capital andthus eased the concerns of liquidity to some extent. However, higher leverage could act as drag on the valuation.
KKCL � Kewal Kiran Clothing Ltd is a branded apparel play with four brands in its kitty. Killer, its flagship denim brand, hascreated a niche space in the minds of consumers. With a gross market turnover of over Rs145 crore, Killer is ahead ofits rival—Spykar. We believe that a strong brand profile, a disciplined management and a consistent track record coupledwith a robust balance sheet position (cash on books at ~Rs120 a share) puts KKCL in a sweet spot.
Mcleod Russel � Mcleod Russel India is the world’s largest tea producer with an annual tea production of close to 100 million kg. Withtea estates in India and Africa, the company is well poised to take advantage of the current favourable global demand-supply scenario. With the expectations of a substantial improvement in its sales realisation and a volume growth in midto high single digits (in the domestic market and the international subsidiaries), MCR’s consolidated top line andearnings are expected to grow at CAGR of 17% and 21% respectively over FY2012-14. We maintain our Buyrecommendation on the stock with the price target of Rs339.
NIIT Tech � With its strong domain expertise in a few niche verticals and competitive advantage in terms of significantcontribution from its non-linear initiatives, NIIT Technologies is well placed to benefit from the overall improvementin the demand environment. The recent large deal wins give further revenue visibility for the future. Moreover, thecompany has healthy cash on the books with minimal debt which leaves scope for further acceleration in growththrough inorganic initiatives and act as another re-rating trigger for the stock.
EQUITY FUNDAMENTALS EARNINGS GUIDE

Sharekhan ValueGuide July 201254
RemarksRemarks
Orbit Corp � Given its unique business model, Orbit is expected to cash in the massive re-development opportunities in southern andcentral Mumbai. Further, given its presence in the luxury segment, which is less price sensitive, it will be able to revive fasteronce the real estate industry recovers.
PNB � Punjab National bank (PNB) has one of the best deposit mixes in the banking space with low-cost deposits constitutingaround 36% of its total deposits that helps it maintain one of the highest margins in the sector . A strong liability franchiseand technology focus will help the bank boost its core lending operations and fee income related businesses.
Polaris � Polaris Financial Technology (Polaris) is one of the few integrated midcap IT companies having a strong footholdin the BFSI vertical and having offerings in both, the services and solutions segments. We continue to remain positiveon the “Intellect” side of the business and expect a faster and stronger growth momentum in the coming years whichwould in turn enable margin improvement as well.
Pratibha Ind � Pratibha Industries is a dominant player in water & irrigation and urban infrastructure space. It has also diversified intoother high-margin areas like road BOT, power and oil & gas. The current order book stands at Rs4,959 crore, whichis 2.7x its FY2012 revenues. Given the government’s thrust on developing these segments, we expect the net profit togrow at a CAGR of 29% over FY2012-14. Further the company is looking at exiting HSAW pipe manufacturingbusiness (which has been an overhang for past one year) which will improve balance sheet and profitability.
Provogue India � Provogue India is a play on the discretionary consumption space. The company’s core business—fashion apparelshas seen demand slowdown in the recent quarters. As a result has seen strong underperformance on the bourses. Alsoits 75% subsidiary Prozone has completed its restructuring exercise and is now demerged from the parent companyand is likely to get listed on the bourses. We believe that undemanding valuations at less than 4x makes it attractive
Ratnamani Metals � Ratnamani Metals and Tubes is the largest stainless steel tubes and pipes maker in India. In spite of the challengingbusiness environment due to increasing competition, we believe the stock is attractively valued. The management hasmaintained a strong outlook on the potential opportunities in the oil & gas sector. The company has reported strongrevenue growth but margins have been trending downwards. Going ahead we expect revenue growth to pick up inH2FY2013 with stable margins.
Raymond � Raymond is present in the fast growing discretionary & lifestyle category of branded textiles and apparels. With thegrowing income, rise in aspirations to lead a luxurious life, greater discretionary spending and favourabledemographics, the segment of branded apparels & fabrics presents a tremendous growth opportunity and Raymondwith its brands and superior distribution set up is very well geared to encash the same. We believe that Raymond withits strong brands and an enviable distribution reach is a quality play on the fast growing lifestyle & discretionarysegment. Further the company's efforts towards enhanced focus on its power brands coupled with benefits ofturnaround performance are not getting reflected in the valuations and hence we believe the stock is due for a re-rating. Further, any development with regard to the Thane land in the form of either joint development or disposalwould lead to value unlocking and provide significant cash to the company.
Selan Exploration � Selan Exploration is an oil exploration & production company with five oil fields in the oil rich Cambay Basin ofGujarat. The initiatives taken to monetise the oil reserves in its Bakrol and Lohar oil fields are likely to improveproduction. Further, it intends to explore its next field, Indrora, which is the most prolific one with significant reserves.Based on this, we expect the company to ramp up its production by more than two times by FY2014 over that of FY2012.It would lead to an earnings growth of 47% (three years’ CAGR over FY2012-14) as it is expected to take advantageof the ramp-up in production, higher crude price and stable operating cost. Hence, we rate this stock as Buy.
Sun Pharma � The combination of Sun Pharma and Taro offers an excellent business model. With a stronghold in the domesticformulation market, Sun Pharma has become an aggressive participant in the Para IV patent challenge space. Alongwith the exclusivities in the USA, the recent consolidation of the Taro acquisition has provided the much-neededboost to the stock. However, imposition of new tax (Union Budget 2013) on partnership based units in Sikkim wouldbe a drag on earnings..
Torrent Pharma � A well-known name in the domestic formulation market, Torrent has been investing in expanding its internationalpresence. With the investment phase now over, Torrent should start gaining from its international operations inRussia and Brazil. The impending turnaround of its German acquisition, Heumann, will also drive the profitabilityof the company. However, imposition of new tax (Union Budget 2013) on partnership based units in Sikkim wouldbe a drag on earnings.
UltraTech Cement � UltraTech is India’s largest cement company with approximately 52 million tonne cement capacity. The companyhas benefited from an improvement in its market mix. Further, ramping-up of the new capacity and savings accruingfrom new captive power plants will improve the company’s cost efficiency.
EQUITY FUNDAMENTALSEARNINGS GUIDE

Sharekhan ValueGuide July 201255
United Phos � A leading global producer of crop protection products, intermediates, specialty chemicals and other industrialchemicals, United Phosphorus has presence across value-added agricultural inputs ranging from seeds to cropprotection products and post-harvest activities. A diversified geography and the recent acquisition of DVA Agro Brazilwill help the company to have a strong presence in the Brazilian market and help in growing inorganically. UnitedPhosphorus has reduced its revenue growth guidance for FY2013 (earlier 20-25% revenue growth guidance) due tothe rough weather condition in different geographies. The company expects a revenue growth of 15% for the year2012-13 and will maintain 18-20% EBIDTA margin.
UBI � Union Bank has a strong branch network and an all-India presence. The bank’s earnings growth has deteriorated dueto asset quality pressures.
V Guard Ind � V-Guard Industries is an established brand in the electrical and household goods space, particularly in South India. Overthe years, it has successfully ramped up its operation and network to become a multi-product company. The companyhas recently also forayed into non-South India and is particularly focusing on the tier-II and III cities where there is a lotof pent-up demand for its products. We expect VGI to post a CAGR of 20% in its earnings over FY2012-14E.
Vultures’s Pick
Mahindra Lifespace� The company is the first in India to own two integrated business cities (IBC; which is a combination of SEZ and domesticarea)—one in Chennai and the other at Jaipur and both have become operational. Further, it has acquired land at Puneand Chennai to come up with two more IBCs. Apart from this, it has 3.63 million sq ft of residential and commercialprojects under construction across various cities and an additional land bank of 17.8 million sq ft for future development.Consequently, we expect the company's stand-alone net profit to grow at a CAGR of 4.4% over FY2012-14.
Orient Paper � Orient Paper has increased its cement capacity from 3.4 million tonne to 5 million tonne and installed a 50MW captivepower plant to save on power costs. We believe the company will be able to deliver a better volume growth overFY2012-14 due to the commissioning of its new capacity and change in its market mix in favour of the western regioncompared to southern region. The company is also in the process to de-merge its cement division which could act asa value unlocking factor.
Tata Chemicals � With a combined capacity of 5.5MMTPA Tata Chemicals is the second largest soda ash producer in the world. TataChemicals has purchased 25% stake in urea-ammonia green field project at Goban with investment at $290mn.Further changes in urea policy are likely to benefit the company further. We expect IMACID to show a strongperformance on the back of a steep increase in the price of phosphoric acid, the main raw material for the productionof DAP. TCL is expected to show a strong performance on the back of a relatively healthy demand for soda ash andsodium bicarbonate in India compared to the rest of the world.
Unity Infra � With a well-diversified order book, Unity Infrastructure is expected to be the key beneficiary of the government's thruston infrastructure spending. The order book remains strong at Rs4,380 crore, which is 2.2x its FY2012 revenues. Weexpect its net profit to post a CAGR of 28% on the back of a strong order book during FY2012-14. Further, it hasrecently forayed into the road BOT segment and has three BOT projects under its kitty.
Cannonball
Allahabad Bank � With a wide network of over 2,200 branches spread across India, Allahabad Bank enjoys a strong hold in north andeast India. With an average RoE of ~20% during FY2010-12E, coupled with improving asset quality trends the bankis one of the stronger players in the public sector banks.
Andhra Bank � Andhra Bank, with a wide network of over 1,200 branches across the country, has a strong presence in south Indiaespecially in Andhra Pradesh. Though the bank is available at attractive valuation, concerns on asset quality front andpolitical situation within the state would affect its operations.
IDBI Bank � IDBI Bank is one of leading public sector banks of India. The bank is expected to improve its core performancesignificantly, which is likely to reflect in the form of better margins and return ratios. Due to rising asset quality risks andslower business growth the stock is likely to underperform in the near term.
Madras Cement � Madras Cement, one of the most cost-efficient cement producers in India, will benefit from the capacity additioncarried out ahead of its peers in the southern region. The 3-million-tonne expansion will provide the much-neededvolume growth in the future. However, regional demand remains lacklustre but on account of the improvement in therealisation due to supply discipline and a likely change in the market mix, we believe, the profitability of the companywould improve (marginally) in FY2013.
Shree Cement � The company’s cement grinding capacity has enhanced to 13.5MTPA which will support the volume growth of thecompany in the coming years. Additionally, the company has set up 300MW power plant entirely for merchant sale,which is expected to support revenue growth going ahead. Thus, a volume growth of the cement division and theadditional revenue accruing from the sale of surplus power will drive the earnings of the company.
RemarksRemarks
EQUITY FUNDAMENTALS EARNINGS GUIDE

July 2012 Sharekhan ValueGuide46

Sharekhan ValueGuide July 201247

July 2012 Sharekhan ValueGuide48

Sharekhan ValueGuide July 201249

July 2012 Sharekhan ValueGuide50

Sharekhan ValueGuide July 201251

July 2012 Sharekhan ValueGuide52

Sharekhan ValueGuide July 201253

July 2012 Sharekhan ValueGuide54

Sharekhan ValueGuide July 201255