valuing brands in the uk economy - british brands group
TRANSCRIPT
Valuing Brands in the UK Economy
Peter Urwin Valeriya Karuk Philip Hedges Frank Auton
Westminster Business School University of Westminster
London, NW1 5LS
Email: [email protected]
Commissioned by the British Brands Group
December 2008

1
Valuing Brands in the UK Economy
Peter Urwin Valeriya Karuk Philip Hedges Frank Auton
Westminster Business School University of Westminster
London, NW1 5LS
Email: [email protected]
Commissioned by the British Brands Group
December 2008
Acknowledgements This report utilises data from the 2007 Labour Force Survey; figures from the 2006 Annual Business Inquiry and United Kingdom Input-Output Analyses, Office for National Statistics. The LFS is distributed by the Economic and Social Data Service; Crown Copyright material is reproduced with the permission of the Controller of HMSO and the Queen's Printer for Scotland. We are very grateful for the detailed comments of Tony Clayton, Office for National Statistics; David Haigh, Brand Finance; John Noble, British Brands Group; Colin McCloud of the World Advertising Research Centre; various staff members at Daniel J Edelman Ltd and participants in a Parliamentary Dinner held on 17th November. All opinions expressed in the report remain those of the authors.

2
Foreword The relevance of branding to companies, in terms of revenue generation, consumer loyalty and future cashflow, has been the subject of extensive analysis and research by many companies in many countries over many years. As a result its importance to companies is well understood and indeed acknowledged. Over recent decades, the placing of a specific value on an organisation’s brand or brand portfolio has become an increasingly sophisticated discipline, to the extent that many brand-oriented organisations have a fair idea of both the value of their brands and the proportion of the organisation’s market capitalisation for which they account. The same cannot be said of the relevance of branding to the UK economy; though this report does not suggest that the UK stands alone in this regard. To what extent does branding contribute to the economic health of the country; what wealth does it generate and is this contribution being maximised? In contrast to the approach companies take to understand the value of their brands, very little, if any work seems to have been undertaken in this area. Bearing in mind branding’s potential to add value within the firm, this seems at best an anomaly and at worst a significant oversight. The British Brands Group, as the membership organisation that provides the collective voice for brand manufacturers in the UK, has been aware of this apparent dearth of analysis and research for some time. When speaking to Government on specific policies affecting branding, we have not had the quantified information we would wish on the scale and importance of the business discipline we represent. While we do not suggest that Government departments have failed to acknowledge that branding has some importance, there is no shared sense of how important it is and no assessment of its value to UK plc. To begin to rectify this situation, earlier this year we commissioned Westminster Business School to undertake a study of the economic contribution of branding to the UK as a first step to filling this knowledge gap. As this study has unfolded, we have been struck by just how wide this gap is. At this time western economies are facing ever-strengthening competition from developing economies. The UK is seeking a new economic framework, less reliant on financial services. At such a time it is more important than ever that potential future drivers of wealth-creation and competitiveness are clearly identified, understood and indeed encouraged. John Noble British Brands Group

3
1. INTRODUCTION .......................................................................................................................................................... 8
2. DEFINING AND VALUING BRAND ......................................................................................................................... 9
2.1 HOW MANY PEOPLE WORK TO CREATE BRAND? ...................................................................................................... 9 2.2 THE FINANCIAL VALUE OF BRAND - TO THE FIRM ................................................................................................. 14 2.3 THE FINANCIAL VALUE OF BRANDS – TO THE UK ECONOMY ................................................................................ 16
3. BRANDS IN INNOVATION, REPUTATION AND CHANGE .............................................................................. 26
3.1 BRAND REPUTATION AND ECONOMIC CHANGE ...................................................................................................... 27 3.2 CORPORATE SOCIAL RESPONSIBILITY ................................................................................................................... 30 3.3 BRAND AND INNOVATION ..................................................................................................................................... 33 3.4 POSITIVE EXTERNALITIES AND SPILLOVERS ........................................................................................................... 36
4. CONCLUSIONS AND IMPLICATIONS FOR POLICY ........................................................................................ 39
5. APPENDIX ................................................................................................................................................................... 45

4
Abbreviations and acronyms BERR Department for Business, Enterprise and Regulatory Reform BRICS Brazil, India, China and the Soviet Union CSR Corporate Social Responsibility DIUS Department for Innovation, Universities and Skills DWP Department for Work and Pensions GDP Gross Domestic Product GVA Gross Value Added ILO International Labour Organization I-O SUTs Input-Output Supply and Use Tables LFS Labour Force Survey NBI Nation Brands Index NICs National Insurance Contributions OECD Organisation for Economic Cooperation and Development R&D Research and Development SME Small to Medium Sized Enterprises WERS Workplace Employment Relations Survey
5
Executive Summary This report considers the role of branding in the UK’s economic and social development. The commissioning of the study by the British Brands Group reflects some concern that the role of branding and its value to the wider UK economy is not well understood. Brand is a ‘reputational asset’ which has been ‘developed over time so as to embrace a set of values and attributes’, resulting in a ‘powerfully held set of beliefs by the consumer’ and a variety of other stakeholders. These reputations and beliefs are built up over many years by those who create and manage brand, primarily, but not exclusively, in the marketing and advertising professions. The calculations in this report represent the first attempt to identify the number of people employed in the creation and management of brand and many parts of the report identify a similar gap in the existing evidence base. The management of brand as an area for research may have been confused with advertising and in many people’s minds the two are perhaps equivalent. In creating brand, which is a reputational asset, it can be argued that everyone in an organisation has a part to play in protecting and shaping that reputation. This not only includes the extent to which a product or service delivers the promised benefits to its customers, but also how the telephonist answers the phone and how sales staff interact with customers. In many companies brand serves as a guiding principle aligning corporate, business and operational strategy. Given the wide-ranging importance of brand and the variety of people within a firm who can possibly be seen as contributing to this reputational asset, it is perhaps not surprising that we face constraints when estimating the value of brands using official statistics. However even with such constraints, we estimate that one million people are directly employed in the creation and management of brand in the UK; equivalent to approximately 4 per cent of all those employed. When considering the financial value of brand, a large number of academic studies detail the enormous value of brand to the company and to specific branded products and services, but there has been little work to date on the estimated value to the wider economy and society. Why can we not take the value of brand to each individual firm and simply add this up to produce a figure for the economy as a whole? The value to the firm of brand allegiance arises partly from the shared understanding and valuable trust relationships with its consumers. However this same attribute could also be viewed as raising the bar for new firms seeking to enter the same market, who will not yet have earned such a reputation. When attempting to estimate the financial value of brands to the UK economy as a whole using official statistics, we again face constraints. One limitation is that it is necessary when using official statistics to limit our consideration of activities that create brand, primarily to the practice of advertising. However, what is even more important is the fact that (i) the value of any Brand Equity held by firms is simply not captured in official estimates of the value of the economy (GDP) and (ii) activities such as advertising and marketing, are subtracted from any measures of value added in the economy – as they are viewed as a 'purchased intermediate cost'. This places these expenditures in the same category as electricity and reduces firms such as Apple to simple importers of consumer electronics. This situation reflects a wider omission of ‘intangibles’, such as investment in human capital and corporate knowledge, in the National Accounts of most economies. For a long time, the knowledge economy has simply not been valued and branding is an important element of this.

6
GDP figures are compiled according to rules set out by the UN Statistical Commission. The omission of intangibles from National Accounts has begun to change, with agreement on the inclusion of software reached in 1993 and R&D agreed in principle in 2007. Debate continues over the inclusion of the remaining categories. The inclusion of brand would change its status of ‘unmeasured’, to ‘investment’, expenditure; perhaps the most important category of activity within the economy. The amount of investment expenditure in the economy is the main driver of economic growth. In fact, if we want to increase the amount of GDP for each person (per capita) and we assume that there is a fixed level of natural resources, then investment (including expenditure on creating human capital) and entrepreneurship are virtually the only things that matter. So what value do we place on this investment in Brand Equity? Building on some excellent recent work developed as part of the Treasury Working Paper series, we estimate that in 2006, £15.85 billion was invested in Brand Equity, a figure that accounts for approximately 12 per cent of all intangible investment in the UK economy in that year. This is comparable to the percentage contribution of all Scientific R&D to this category of intangible investment. To see how this might relate to the ‘tangible’ economy, the estimated value of all investment in intangible assets was in the region of £130 billion for 2004. This figure of £130 billion is approximately equal to the total value of all investment in tangible assets in this year. Tangible investment includes the building of factories and machines; roads; rail and a variety of other investment that increase the productive potential of the economy. The implication is that investment in brand constituted approximately 6 per cent of total tangible and intangible investment in the UK economy in 2006. The consideration of brand creation as an activity that has the potential to increase the productive potential of the economy underlines a growing recognition of its importance to the UK economy, which builds on the growing recognition of its value by firms. In addition, the figures presented in this report also suggest that the creation and management of brand is becoming an increasingly important component of the UK’s overseas earnings; and the present nature of official statistics may be significantly underestimating this contribution to the UK’s international comparative advantage. However, as suggested previously, there is some debate over the extent to which all Brand Equity can be seen as contributing to the overall value of the UK economy. In addition, to make the case for inclusion in measures of National Accounts, we must have a clear understanding of the returns that one can expect from this investment in brand. In the latter sections of this report, we consider the value of brand to consumers and firms that can be seen as providing a net contribution to value in the economy as a whole, rather than as an impediment to competition. The building of strong trust relationships and reputations with consumers over many years represents an investment that provides a number of potential returns, to both the firm and the wider economy. The continuation of this trust relationship rests on the implicit understanding that any company with a strong brand takes a substantial risk if they undertake any actions, for instance moving into new markets, without making sure that such actions are ‘safe’. Brand Equity can act as ‘surety’ in a way that facilitates the quicker adoption of new technologies and business methods. Brand acts as the medium through which companies and consumers build shared understandings of the role of business in societies, often allowing firms to offer services that offset the negative side effects of some elements of consumption.

7
Brand plays a pragmatic role in linking the interests (and to some extent strengthening the mandate) of business with that of social responsibility. It can even help to overcome some market failures, if this results in firms, for instance, paying more because of the pollution they cause. In situations where we realise the value of strong brands in the balance sheets of firms, one can see how large global firms with extensive influence are held to account by consumers and society through the medium of brand. We can consider the proposition that brand acts to encourage innovation in companies, through an incentive to maintain the reputational asset and the greater assurance that successful innovations will be brought to market effectively, ensuring a return on investment. There is some evidence to support this role, but it remains unproven and much more research is needed in this area. Finally, there is evidence that the way in which consumers view countries impacts upon their purchases of goods and services from these countries. It is also true that governments are aware of the importance of country reputation. Given the interaction between country perceptions and purchases of goods, the suggestion is that private expenditure of firms on branding has a spillover effect into the perceptions that people have of countries themselves and governments gain from these ‘positive externalities’.

8
1. Introduction This report considers the role of branding in the UK’s economic development. The aim is to (i) draw together a range of new and existing evidence on this role and (ii), to consider this within the context of important policy debates and wider socio-economic trends. Thus, the discussion of branding is wide ranging and it is hoped that the report will inform the deliberations of a range of policymakers, practitioners and academics; as well as those who have a specialist interest in the sector. The study has been produced by staff at the Westminster Business School and sponsored by the British Brands Group. The commissioning of the study by the British Brands Group reflects some concern that the role of branding in the UK economy is not well understood. There are many academic studies of the value and role of branding for companies and some work on their value in informing consumer choice. However, within this literature there is still no commonly agreed theoretical or empirical framework for analysis of their wider macro-economic impacts1. Without such a framework, it is hard to build a common understanding with policymakers of the role that the branding sector plays. This report draws on a variety of evidence to help build such a shared understanding. In Section 2 of the report we begin by setting out a definition of brand that draws on work across Economics, Marketing and Finance. This section moves on to construct a variety of estimates of the value of brand to the UK Economy, in terms of employment, Gross Value Added (GVA) and Gross Domestic Product (GDP). Section 3 then draws on some basic Economic principles to set out a framework for consideration of the role of brand and a variety of ways in which this role manifests itself. The focus of discussion is on the adoption of new technologies and lifestyles (Section 3.1); the role of brand in Corporate Social Responsibility or CSR (Section 3,2); in Section 3.3 there is some consideration of the role of brand in innovation and Section 3.4 consider spillover effects at the national level. Overall therefore, Section 2 focuses on a quantifying of the financial value of brand to the UK Economy; Section 3 then explores various ways in which this value manifests itself. This latter discussion of the role of brand in the UK economy is essential, as (i) it impacts on many of the assumptions that have been made when calculating the financial value of brands to the economy and (ii) is therefore an essential stage in the development of a shared understanding with policymakers. Section 4 concludes with a consideration of the findings from the study and the areas where more research is needed to inform such a shared understanding.
1 An exception is the work of Clayton and Turner (1998).

9
2. Defining and Valuing Brand In this section of the report we provide an initial definition of what we mean by ‘brand’ and then move on to consider a number of estimates of its value to the UK economy. To some extent, these issues are related, in that the exact definition will have some influence on the range of companies and employees that we can consider as being involved in the creation and management of brand. Similarly, when we come to consider the value of brand within the National Accounts our understanding of what brand is has some bearing. We draw on a definition of brand that can be recognised across Marketing, Finance and Economics. For the purposes of this study,
Brand is a ‘reputational asset’2 which has been ‘developed over time so as to embrace a set of values and attributes’3, resulting in a ‘powerfully held set of beliefs by the
consumer’ and a range of other stakeholders4. As we shall see in the following discussions, these reputations and beliefs are built up over many years by those who create and manage brand – for the purposes of this report, primarily in the marketing and advertising professions. In Section 2.1 of this report we estimate the number of people involved in the creation, management and communication of brand in the UK. In Section 2.2 we describe a framework for measuring the flow of expenditures that act as part of the investment that contributes to the creation these brand assets.
2.1 How many people work to create Brand? Defining and identifying the number of people employed in creating brand is essential if we are to understand the importance of this area of economic activity to the UK. The fact that this is the first time this process has been undertaken will come as a surprise to many readers. As we shall see later, there are a variety of technical hurdles that we must overcome when attempting to identify the value of brand and this may partly explain such a gap in the evidence base. However, we need to recognise that the management of brand as an area of economic activity may have been confused with advertising and in many people’s minds the two are perhaps equivalent. Why is this incorrect? In creating a reputational asset, it can be argued that everyone in an organisation has a part to play in protecting and shaping that reputation. This not only includes the extent to which a product or service delivers the promised benefits to its customers, but also how the telephonist answers the phone and how sales staff interact with customers. Indeed some aspects of that reputation aren’t under the direct control of the company itself, being influenced by word of mouth, reports in the press and even those who use the brand5. Therefore, it can be argued that everyone in an organisation that is oriented to building its reputation plays a part and should be included in figures of those working to create brand.
2 Giorgio Marrano, Haskel and Wallis (2007). For some of their analysis of brand, Giorgio Marrano et. al. (2007) draw on the work of Corrado, Hulten and Sichel (2005). 3 John Murphy founder of Interbrand, as quoted in British Brands Group (2004). 4 Frank Auton, The Marketing Council (2000). 5 See Jeremy Bullmore’s (2001) Brands Lecture “Posh Spice and Persil” for more on how brands are created.

10
However, such a broad interpretation of those who work to create brand poses a range of methodological issues; not least the question of whether we are measuring occupation or industry. It would not be of use to policymakers who are, for instance, focused on issues of skill acquisition to consider all occupations in one firm under a single heading. In contrast, whilst it might be of some use to define sectors of the economy as either focused on creating brand as opposed to, for example, firms that can be considered as engaged in the supply of commodity products, the data simply do not allow this. In our approach we therefore focus separately on (i) occupations and (ii) sectors that are predominantly involved in the planning, research and communication activities that create brand. More unfortunate are the constraints we face when considering the financial value of brands to the UK economy. Thus, we must estimate the value of Brand Equity created in any one year, as being a direct result of expenditures on Advertising in that year. As we have just suggested, the underlying assumption that advertising and brand are synonymous is a misunderstanding, but the existing statistical framework allows little room for consideration of alternative approaches. As a result our estimates are relatively conservative, not least because many companies build reputation without recourse to advertising expenditure in the traditional sense. The reputation of Eddie Stobart for example is more a function of the presentation of its staff and lorries, and the behaviour of its staff on the road, than to any advertising campaign. Expenditures, such as those that ensure a certain level of staff behaviour, are not captured in our study and any figures we produce are therefore more likely to be underestimates. With these limitations in mind, Table 1 sets out a picture of those occupations that can be considered as strongly associated with the creation and management of brand. The categorisations are those from the 2000 Standard Occupational Classification and the table presents figures from the 2007 Labour Force Survey. As readers will note from the Appendix to this report, there are nine major occupational groupings into which we can categorise all 27 million of the working population; from the 4.1 million who class themselves as Managers and senior officials, to the 3.2 million in Administrative and secretarial occupations. However, if we want to get an estimate of those who are primarily engaged in branding, we need to dig down to the more disaggregated groupings included in Table 1.

11
Table 1: Occupations Related to the Branding Function
Selected SOC 2000 Occupation (main job) Frequency Percentage#
1132 marketing and sales managers 510,092 1.91134 advertising & public relation managers 47,469 0.21137 research and development managers 56,598 0.2
2126 design and development engineers 64,933 0.22411 solicitors & lawyers, judges & coroners 148,411 0.6
2419 legal professionals not elsewhere classified 11,749 0.0
3411 artists 27,022 0.1
3421 graphic designers 88,121 0.33422 product, clothing & related designers 52,166 0.23434 photo. & audio-visual equipment operatives 53,964 0.2
3520 legal associate professionals 40,596 0.2
3536 importers, exporters 9,357 0.0
3543 marketing associate professionals 125,390 0.57125 merchandisers and window dressers 20,503 0.1
0.0
Lower Bound estimate (greyscale total) 908,674 3.4
Upper Bound estimate (see Appendix) 1,037,354 3.9
Source: Labour Force Survey 2007
# percentage of total GB workforce in employment
Categories in greyscale are those that are most closely associated with the creation of Brand To give some explanation of our process of estimation, Table 1 includes professions that have been included in our final estimate, as well as those that are felt to be less closely related to branding. From the brief analysis in the Appendix, it would seem reasonable to suggest that a large proportion of those who consider themselves as working in the professions that are highlighted in greyscale are also working to create and manage brand. The proportion of those working to create brand in the professions that are not highlighted is more debatable. For instance, in the legal profession we have a number of lawyers who specialise in Intellectual Property (IP). However, from our analysis, this represents a relatively small proportion of the 200,000 workers employed in occupations related to the legal profession (SOC categories 2411; 2419; 3520). In contrast, it seems reasonable to argue that a large proportion of Product, clothing and related designers can be considered as being involved directly in branding. Even with the cross-comparison of occupation and industry sector carried out in the Appendix, there is some room for interpretation in determining the exact numbers working in British branding. However, the estimate is somewhere above the 908,674 working in the occupations highlighted in greyscale and somewhere below the 1.037 million upper bound estimate; covering those employed as Marketing and Sales Managers; Advertising and Public Relations Managers, through to Intellectual Property Lawyers.

12
This estimate of one million people working to create brand covers those who can be considered as providing services that are both ‘in-house’ and ‘bought-in’ (or outsourced). Table 2 focuses only on those people who are working in companies that deliver the ‘bought-in’ part of branding activities in the economy. As we can see, there cannot be more than 150,000 people working in the sector in total6 (if we consider only a small proportion of those firms whose primary focus is ‘legal activities’). This distinction between ‘in-house’ and ‘outsourced’ provision has a number of implications for the financial estimates of brand and we return to this later.
Table 2: Industry Sectors Related to the Branding Function
Selected Industry class (main job) Frequency Percentage#
73.10: research,natural sciences & engineering 86,728 0.373.20: research,social sciences & humanities 13,733 0.1
74.11: legal activities 295,703 1.174.13: market,opinion research 53,619 0.274.14: business,management consultancy 171,512 0.6
74.40: advertising 90,601 0.374.81: photographic activities 29,712 0.1
74.82: packaging activities 33,998 0.192.11: motion picture, video production 21,750 0.1
92.12: motion picture, video distribution 4,340 0.0
92.13: motion picture, video projection 8,423 0.092.20: radio,tv activities 84,002 0.3
Lower Bound Estimate (greyscale) 144,220 0.5Upper Bound estimate (see Appendix) 178,218 0.7
Source: Labour Force Survey 2007.
# percentage of total GB workforce in employment
Categories in greyscale are those that are most closely associated with the creation of Brand
6 This will include both those who are advertising and marketing professionals, as well as those who work in this sector in support services, such as secretarial and administration. This estimate is essentially the one used

13
Key findings 2.1a: One million people involved in British Branding
• Approximately one million people are directly employed in the creation and management of brand
in GB.
• This equates to 4 per cent of those employed in the whole of Britain.
• This is comparable to the total number of people working at all levels of the Financial Management
and Accounting professions7; it is twice the number of teachers in primary and secondary schools;
and one third of the people working at all levels in retail.
Key findings 2.1b: Important caveats • Any measure of brand that only considers occupations such as sales, marketing and design is
likely to underestimate the contribution of branding to the economy, as it does not take into
account the activities of those in other occupations that contribute to the creation of the
reputational asset that comprises brand.
• Any measure of brand that only considers firms focused on the supply of Advertising and Market
and Opinion Research consultancy services also underestimates the contribution of branding to
the UK economy, for the same reason plus it ignores those working in-house.
• To get an idea of the magnitude of difference, estimates are of 1 million working to create and
manage brand in the economy as a whole (both in-house and bought-in), compared to only
144,000 in the Advertising and Market and Opinion Research sector (bought-in).
• This difference is very important when considering the accuracy of recent estimates of the financial
value of brands to the economy; as we shall see.
7 From the most junior Accounts and Wages Clerks and Book Keepers, all the way to Chartered and Certified Accountants, Financial Managers, Chartered Secretaries, Management Accountants and Taxation Experts (Urwin, 2004).

14
2.2 The Financial value of Brand - to the firm Having presented some idea of the employment situation from two different angles, we now move on to consider the extent to which branding is contributing to the value of economic activity within the UK. As outlined in the introduction to this report, there are many academic studies of the role and financial value of brand to the company (Feldwick, 1996; Biel, 1997; Sexton, 2000; Hupp and Powaga, 2004; Argyriou et. al., 2006; White, 2007; Gerzema et. al. 2007). These studies underline the immense value of brand to those who own them. The following provides some illustration:
The Value of Brands to the Firm “The first credible ‘brand valuations’ were published in Financial World in 1994. Conservative as they were, the values therein stated were a big wake up call to many CEOs and marketing executives. In those days, Coca-Cola was valued at $39 billion – an inconceivable number at that time, followed by Marlboro at $38.7 billion and IBM at $17.1 billion.” “Today, the most famous brands in the world, brands such as Coca-Cola ($65.3 billion), Microsoft ($58.7 billion), and IBM ($57 billion) are valued in the billions and billions of US dollars, dwarfing the respective values of the traditional physical assets found on enterprise balance sheets and often exceeding the annual revenues of the particular company.” Moore and Craig (2008), [Values are for the 2007 calendar year]. “For companies with consumer products or services, the value of all their brands is typically 50 to 70 percent of the firm’s market capitalization. For companies with industrial products or services, [it is] about 10 to 20 percent of the market capitalisation”. Sexton (2000) The valuations of Brand Equity on firms’ balance sheets underline its significant financial value and importance. This appreciation of financial value has been accompanied by a realisation of the wider role that brand serves in the company, as a guiding principle aligning corporate, business and operational strategy8. Branding disciplines are not only guiding product or service developments (the units of a firm’s production) but also distribution strategies (the customer brand), employment strategies (the employer brand), corporate strategies (the investor brand) and are at the centre of franchising and licensing arrangements. Returning to the consumer perspective, when companies pay for brand, what are they getting? Chart 1 provides a useful summary from the work of Hupp and Powaga (2004), which consider the use of consumer attitudes to value brands and in so doing sets out some of the main benefits to the firm. 8 Handbook of Business Strategy, Vol. 5, No.1 2004.

15
Chart 1: Consumers and brand
It is important to set out some of the values to the firm which are associated with brand. A large number of academic studies detail the enormous value of brand to the company and to specific branded products and services. In addition, companies such as Interbrand; Brand Finance; Y+R; Millward Brown, European Brand Institute and Intangible Business have carried out detailed studies of Intangible Asset and Brand values. However, there has been little work to date on the estimated value to the wider economy and society. This report fills an important gap in the existing evidence base and in doing so must tackle a potential difference between the value of brand to the individual firm and the economy as a whole. As we shall see, when the question of brand’s value is asked for the economy as a whole, some of the characteristics from Chart 1 can be viewed in both positive and negative lights. For instance, the value to the firm of brand allegiance arises partly from the shared understanding and valuable trust relationships with its consumers – something that generates more certain cash flows. However this same attribute could also be viewed as raising the bar for new firms seeking to enter the same market, who will not yet have earned such a reputation. This is something we return to in Section 3. Key findings 2.2: Is a value to firm, a value to the economy?
• Over the last 15 years the practice of valuing brand to the company has been developed to an
increasingly sophisticated technical degree, with the first credible brand valuations published in
1994.
• Many firms now derive much of their value from ‘intangible’ assets, of which brand makes up the
majority in many cases. Especially in consumer products and services, brand can constitute up to
70 per cent of value in some firms.
• However, when we consider the characteristics of brand that provide such immense value to the
firm, they can be interpreted in a way that implies potential value to the economy as a whole, but
also as raising the bar for new firms wishing to enter the market
16
• As an example, the value to the firm of brand allegiance arises partly from the shared
understanding and valuable trust relationships with its consumers. However this same attribute
could also be viewed as raising the bar for new firms seeking to enter the same market, who will
not yet have earned such a reputation
Whilst there have been significant developments in the valuing of Brand Equity within firms it is still something that is not captured in companies’ annual accounts and tends only to come to the fore when firms change hands. Another way of putting this is to suggest that the value of Brand Equity is being increasingly captured, but the flow of investment that creates this important capital asset is not. So what are the implications of this when we scale up from consideration of the firm, to the wider macro-economy?
2.3 The Financial value of Brands – to the UK Economy 2.3.1 Measuring the contribution to GDP As we have stated, while there are a number of academic studies that look at the value of brand to companies, very little work has been done to date on the value of brand to the UK as a whole. This is not to say that Governments and other bodies are not beginning to develop methods for the valuation of intangibles. GDP figures are compiled according to rules set out by the UN Statistical Commission. The omission of intangibles from National Accounts has begun to change, with agreement on the inclusion of software reached in 1993 and R&D agreed in principle in 2007. However, debate continues over the potential inclusion of the remaining categories, including brand, in estimates of Gross Domestic Product (GDP); the most commonly used indicator of the value of a country’s economic activity in any one particular year. Under current methodology, much of the value of advertising and marketing, which is one input to the creation of brand, is considered under the heading of Intermediate Consumption, and as such does not count as brand creation. Whilst this might seem like a technical detail too far, a basic understanding of the process of GDP estimation is essential if one is to gain an insight into the possible value that branding brings to the economy. Firstly, at its simplest, the figure for UK GDP, which has been recently estimated at £1,410 billion9, is created by looking at the annual amount of economic activity from three sets of information that are available from different parts of the economy. Thus the assumption is that, within the economy, any economic activity usually involves three things (i) the production/output of a good or service (ii) for which somebody receives an income (whether this is through income received by employees or self employed persons, or as income accruing to a corporation) and (iii) for which some payment is made (i.e. one should be able to measure expenditure). There are a variety of adjustments that have to be made to ensure for instance that taxes and subsidies are not misrepresented in these figures, but essentially these are the three different ways of calculating GDP (Production, Income and Expenditure). However, for ease of exposition, it is useful to focus on the estimation which attempts to capture the value of Production. This measure can be considered as being built up using estimates of Gross Value Added (GVA). When one sums the ‘value’ added by each sector of the economy within a year, then we have a measure of Gross
9 Year to Quarter, 2008, Expenditure at current market prices, Seasonally adjusted, ONS.

17
Domestic Product10. As one may expect, there is likely to be some discrepancy between the figures for Gross Domestic Product obtained using the three different methods and as part of the process of rectifying any disparities, reference is made to the Input-Output Supply and Use Tables (I-O SUTs). At present activities such as Advertising, that are closely related to the creation and enhancement of brand, are treated as intermediate inputs. As such, within the National Accounts these brand creation activities are treated as 'purchased intermediate costs' and as such, are subtracted, along with other purchased materials and services, from value added. Thus, whilst the wages and salaries of Advertising Agencies may appear in National Accounts, the work they perform to create brand in a range of companies outside of the advertising sector is subtracted from the output of their clients. The creation of brand value is therefore not captured. As with most descriptions of this sort, it is best to provide an example of what we mean and the one by Michael Mander (2006), which is cited by Giorgio Marrano, Haskel and Wallis (2007), serves to highlight the limitations of this approach. As Mander (2006) suggests in an article for Business Week, the treatment of Apple in the US national accounts is to take the value of its imported Ipods and count them once when they arrive from China and again when they are sold; as the author suggests this, “reduces Apple – one of the worlds greatest innovators – to a re-seller of imported goods”. The GVA here will be (approximately) the difference between the import value and the re-sale value, with all expenditures on branding subtracted from GVA. Key findings 2.3.1: The missing value of expenditure that creates brand
• The National Accounts try to capture the value that is added to the UK economy in any one year.
They are able to evaluate the expenditures that create brand only through the measurement of
marketing, advertising and public relations expenditures which represent only some of the inputs to
brand11.
• However these expenditures are not measured in a way that captures their contribution to brand
and as a result the majority of Brand Equity created within a year is not counted.
• Investment in brand features in the National Accounts in the same way as expenditure on, for
instance, Electricity. This reduces the role of companies such as Apple to commodity importers.
• This reflects a wider continuing omission of some ‘intangibles’, such as investment in human
capital and corporate knowledge, in the National Accounts. A large proportion of the knowledge
economy is simply not being valued and branding is a significant element of this.
10 To understand what we mean by value added it is best to take the example of manufacturing production. For instance, if we consider a chair produced and sold in the UK, the value of GVA at the production stage will be the value of the finished chair supplied to the retail outlet, minus the value of the initial inputs (such as wood, glue etc.); the GVA at the final point of sale will be the sale value minus the value up to the point of distribution to the retailer. 11 We return to the question of what activities create brand, in addition to advertising and marketing expenditures, later in the report.

18
2.3.2 Putting a value on Brand Fortunately, a raft of recent research has begun to shed light on the valuation of intangibles such as brand, providing us with a useful resource in addition to the various sources provided by the Office for National Statistics (ONS). Firstly, we can gain at least some estimate of the value of the branding sector by using the Input-Output Supply and Use Tables. To understand the limitations of this starting point for analysis, we need to return to the discussions around Tables 1 and 2. These first figures are not going to capture ‘own-account’ or ‘in-house expenditure on branding, but do serve as a starting point for our discussions of the Gross Value Added by the Advertising Sector (SIC 74.40 in Table 212), as one input to brand. Just to remind readers of the distinction between own-account (or in-house) spending on Advertising and that which is ‘bought in’. When considering the figures in Table 1, they provide some estimate of all employees and self-employed individuals who are working to create brand, across a range of companies, not just those that are working in firms focused on selling marketing consultancy services. In contrast, Table 2 provided a picture of those employed within the branding sector (i.e. those firms that we may consider as providing the consultancy services that are ‘bought-in’ to non-specialist companies). Therefore, beginning with the contribution of the Advertising Sector, the total supply of services (at purchasers’ price) in 2004 was £22.4 billion, according to the 2006 I-O SUTs. If we wish to gain an idea of the proportion of this £22.4 billion that can be considered as the value added of the sector (i.e. factoring out the ‘inputs’) we have a figure for Gross Value Added of £5.8 billion at basic prices. Thus, the Advertising sector in 2004 contributed 0.56 percent of total UK GVA – a measure that goes some way to capture the value of the ‘bought-in’ component of brand. Clearly we are still missing a lot here, not least because consideration of the Advertising sector constitutes only one area of activity in the creation of brand. Furthermore, within this sector we are only estimating the bought-in component and ignoring all in-house spending. Unfortunately, consideration of this limited scope of activities is one of the few ways in which we can get an idea of the contribution that brands make to the export earnings of the UK. Thus, in the decade between 1995 and 2004, the export share of goods and services13 within the Advertising sector went up from 5.9 per cent to 8.9 per cent. Given that most economies of the world have become more international in their outlook, we may expect most sectors to become more focused on overseas markets, but this increasing focus on the export of advertising expertise moved the sector up the rankings over this period from 85th to 63rd (in 2004 this put the sector just ahead of Legal Activities which was ranked 65th, in terms of the proportion of its output that is exported). This suggests that the creation and management of brand is becoming an increasingly important component of the UK’s overseas earnings; and the present nature of official statistics may be significantly underestimating this contribution. Hopefully this information gives some indication of what the sector contributes, but it has limitations. For example, it only counts the activities of those employees in Table 2 who are employed in the Advertising sector and up-to-date figures to take us beyond 2004 have yet to be released. A much more significant limitation however is that this industry sector analysis does not capture all of the estimates of branding that might possibly be included in an estimate of GDP. Even with our limited focus on research and advertising, these estimates do not capture ‘own-account’ expenditure by firms in these areas, as noted by Giorgio Marrano and Haskel, (2006) [G-M H]. So how do we begin to create such estimates, even for the limited inputs to brand creation that we are considering?
12 Unfortunately the I-O SUTs do not separate SIC 74.13 from Management Consultancy. 13 This figure is the value of exports of goods and services taken as a percentage of the total supply of goods and services within the sector.

19
Essentially, we need to get a better idea of the value being created by those in Table 1, not just the firms in Table 2. Following the approach of G-M H, we begin by considering the total expenditure on Advertising provided by the Advertising Association, which in 2006 was £18.6 Billion14. This is presented in the second line of Table 3. As G-M H suggest, this figure should begin to capture both the ‘own-account’ and consultancy services aspects of advertising expenditure within the UK. However, when we then compare this to the figure for sector turnover of the Advertising industry (SIC74.4) in 2006, there seems to be something of a problem, as the estimate is £18.8 Billion (first line of Table 3). In other words, they are essentially identical. G-M H note this apparent anomaly amongst a number of additional issues of coverage, but the main issue remains. For instance, the Annual Business Inquiry (ABI)15 also includes an estimate of cross-sector spending on advertising which only includes spending by the private sector; but excludes spending in the financial services sector. However, once again the Advertising Association figures, which one would expect to include both in-house and outsourced Advertising expenditure, are almost exactly the same as the ABI estimate, which should only consider the outsourced estimate. If we refer to Tables 1 and 2, it would seem reasonable to suggest that the Advertising Association figure of £18.6 billion is something of an underestimate. How much of an underestimate is an important point for consideration. Firstly, the Advertising Association figure covers only advertising expenditures recorded by UK media outlets and therefore omits expenditures by UK firms abroad. In addition, a large amount of the sponsorship and promotional activities undertaken by firms will not be captured in these estimates. However, only considering these limitations would not cause us to boost our estimates of advertising expenditures by more than perhaps 10 to 15 per in some sectors such as radio16. Much more fundamental is the fact that restricting ourselves to the £18.6 billion figure for advertising omits the brand creation activities of many of the 500,000 marketing and sales managers; 125,000 marketing associate professionals and 50,000 advertising and public relations managers identified in Table 1 who work across all sectors of the economy. When we compare this to the 91,000 people working solely in the Advertising sector and the 53,000 working in the public and opinion research sector (Table 2) the magnitude of any difference becomes apparent.
14 We estimate figures for 2006 to allow comparison with figures from the Annual Business Inquiry (ABI). 15 The Annual Business Inquiry is a statutory annual survey of businesses in most sectors of the economy, collecting employment and financial information 16 Many thanks to Colin McCloud of the World Advertising Research Centre for his insights into the Advertising Association figures. However, any values presented remain the responsibility of the authors.

20
Table 3: The estimated value of Advertising, Public Relations Management and Marketing expenditures
that build Brand in the UK, 2006
Expenditure on Branding Lower bound Upper bound
Estimate of 'brought-in' Advertising expenditure 2006 ABI data for SIC 74.4 £18.8 bn
Estimate of 'own-account' and 'bought-in' Advertising expenditure; with the upper bound including in-house marketing, sales and public relations management
2006 Advertising Association £18.6 bn £37.2 bn
Estimate of 'brought-in' market and opinion research expenditure 2006 ABI data for SIC 74.13 £3.1 bn
Estimate of 'own-account' and 'bought-in' market and opinion research expenditure Double ABI data for SIC 74.13 £3.1 bn £6.2bn
Total Expenditure on Branding activities £21.7 bn £43.4bn
Source: The Table follows* the approach of Giorgio Marrano, Haskel and Wallis (2007a; 2007b)
*But it is important to note our divergence with respect to the Upper Bound on Advertising Association figures As we suggest in the discussions around Tables 1 and 2, there is room for debate on any estimates of the labour force involved in the research, design, advertising and marketing elements of the branding sector. However, even accommodating for a large margin of error, there is an enormous discrepancy between the estimated one million people directly employed in the creation of brand across all firms in the economy, compared to only 144,000 in firms that operate in the branding services sector. It would seem reasonable to suggest that £18.6 billion represents a ‘lower bound’ on any estimate we might have of expenditures that are aimed at creating brand across the whole economy. More specifically, the figures for expenditure on Advertising that are collected across all sectors simply do not include the activities of a vast array of those working in, for instance, marketing and sales across all sectors of the economy. We are clearly in unfamiliar and imprecise territory here and there is very little direction in the existing literature. It is useful to consider the approach of G-M H to the contribution of Market and opinion research (SIC 74.13 in Table 2 and Table 3). They only have estimates of the ‘brought-in’ aspect of these activities and simply double the figure for turnover of the sector, as a strategy to accommodate ‘own-account’ expenditure in their figures. From our discussion of the difference in magnitude of the labour force employed across (i) all sectors and (ii) within only the branding services sector, we may feel justified in doing the same for our estimates of Advertising (not least because Table 1 underlines a variety of additional expenditures that are directly involved in creating brand).

21
It should be noted that this approach to Advertising is the only departure in Table 3 from the approach of G-M H (which in itself is an update of the work contained in Giorgio Marrano, Haskel and Wallis (2007a; 2007b) and builds on the earlier work contained in Corrado, Hulten and Sichel (2005)17. However, it is a major departure and as a result the figure of £37.2 billion needs to be taken as an upper bound. What we would suggest however, is that the half-way point between these two extremes [£32.5 billion] is an estimate that is justified by the existing evidence. Key Findings 2.3.2a Brand - A valuable and growing export Sector
• When considering the contribution of brand to export earnings, we are very limited in the estimates
that can be produced. There are many UK companies that have strong brands which make
significant contributions to export earnings, but we are only able to focus on the Advertising sector
as an area of activity in the creation of brand. Furthermore, within this sector we are only
estimating the bought-in component and ignoring all in-house spending.
• However, even given these limitations, it is clear that the creation and management of brand is
becoming a key component of the UK’s international comparative advantage.
• In the decade between 1995 and 2004 the export share of goods and services18 within the
Advertising sector went up from 5.9 per cent to 8.9 per cent.
• This increasing focus on the export of advertising expertise moved the sector up the rankings over
this period from 85th to 63rd and put the sector just ahead of Legal Activities which was ranked 65th,
in terms of the proportion of output that is exported.
Key findings 2.3.2b: Spending on activities that support Brand Creation
• As we have already seen, we cannot assume that the revenue of the Advertising [and Marketing
and Opinion Research] Sectors is an accurate reflection of total expenditure on building brand
within the UK.
(1) This estimate ignores all ‘in-house’ expenditure by firms in different sectors of the economy.
(2) Much more significantly, even if we were to capture all of the in-house activities in these areas,
we would still miss many of the activities that work to create brand.
• These are not the only problems we face when estimating the value of expenditures that build
brand. There is a dearth of research in this area. As a result any ‘estimates’ must be seen as such.
• However, our estimate that in 2006, £32.55 billion was spent on activities that support the creation
of brand is justified by the existing evidence.
• To put this figure into context, this sum amounts to around 2.3 per cent of Gross Domestic
Product. This is approximately equivalent to the total estimated expenditure on both computer
software and scientific R&D combined.
17 An application to the UK of a method developed at the Federal Reserve. 18 This figure is the value of exports of goods and services taken as a percentage of the total supply of goods and services within the sector.

22
2.3.3 Recognising the value of brand as Investment This last bullet point serves to remind us of the fundamental issue of importance here – namely, that we can create estimates of the value of expenditure on activities that support the creation of brand, but the National Accounts simply do not include the majority of this as activity that contributes to GDP. One needs only to consider the comments on Apple by Mander (2006) above to see how this limits our understanding of just what is being created in the economy. As we have suggested previously, some omissions are being tackled, but ‘intangibles’ such as expenditure on increasing the skills of a company’s staff; expenditure on developing a corporate knowledge base, as well as the expenditures that support the creation of brand are still not being treated in a way that reflects their importance in a modern economy. Clearly, the omission of so much intangible expenditure would be a concern whatever its nature. However, the omission of these particular expenditures is of paramount importance as they are all expenditures that can be considered as creating [intangible] capital assets and there is an argument that they be considered as investment expenditures. Put simply, the amount of investment in the economy is the most important determinant of economic growth. In fact, if we want to increase the amount of GDP for each person (per capita) and we assume that there is a fixed level of natural resources, then investment (including expenditure on creating human capital) and entrepreneurship are virtually the only things that matter. However, we cannot simply take our estimate of £32.5 billion and count it as ‘intangible investment’ that builds Brand Equity, as there are some key adjustments that we need to make, if we are to follow the direction of existing studies. As we shall see in Sections 3 and 4, there is a need to delve deeper into the assumptions underlying these adjustments, but for now we give only a brief explanation for the justification of any adjustments. Having said this, the first of these suggestions in the research by G-M H W which relates to ‘classified’ advertising, is not something that we would wish to dwell on. Specifically, it seems reasonable to suggest that expenditures on classified ads are not part of what can be considered as investment in brand. Consequently we remove the same proportion from our initial figures in Table 4 as that suggested by G-M H W.

23
Table 4: The estimated value to the UK economy of Investment in Brand, 2006
Investment in Brand Equity Lower bound Upper bound
Advertising
Estimate of 'own-account' and 'bought-in' Advertising expenditure; with the upper bound including in-house marketing, sales and public relations management
2006 Advertising Association £18.6 bn £37.2 bn
minus classified ads Taken as 22 per cent of AA figure £4.1 bn £8.2 bn
Total £14.5 bn £29 bn
Advertising Investment expenditure (total multiplied by 0.6)
Following Corrado, Hulten and Sichel (2005) £8.7 bn £17.4 bn
Market and Opinion Research
Estimate of 'own-account' and 'bought-in' market and opinion research expenditure 2006 ABI data for SIC 74.13 £3.1 bn £6.2bn
Market and Opinion Research Investment expenditure (multiply by 0.6)
Following Corrado, Hulten and Sichel (2005) £1.9 bn £3.7 bn
Total Investment Expenditure on Brand Equity £10.6 bn £21.1 bn
Source: The Table follows* the approach of Giorgio Marrano, Haskel and Wallis (2007a; 2007b)
*But it is important to note our divergence with respect to the Upper Bound on Advertising Association figures More controversially, of the remaining £14.5 to £29 billion of Advertising and £3.1 to £6.2 billion of Market and Opinion research expenditure, only 60 per cent is considered as being an investment in Brand Equity. The fact that 100 per cent of branding activities are not seen as contributing to Brand Equity rests on the assumption that a lot of branding activity is ‘rival’; i.e. it is viewed as highly firm-specific and, at least in part, its value is often seen as deriving from an ability to exclude others from a market or wrest market share (brand loyalty) from another firm. The actual figure of 60 per cent is taken from an econometric study carried out 14 years ago on data collected from 417 firms between 1982 and 1986 (Landes and Rosenfield, 1994); an issue to which we return. As previously suggested, the half-way point [£15.85 billion] between the two extremes of Total Investment Expenditure on Brand Equity in Table 4 is an estimate that is justified by the existing evidence; but there is a pressing need to add to this evidence base. To give some idea of the importance of this figure, the suggestion in these more recent studies is that our estimate would account for approximately 12 per cent of all intangible investment in the UK economy. This puts investment in Brand Equity at a similar level to the percentage contribution of all Scientific R&D, when considering intangible investment.

24
In Sections 3 and 4 the discussions are wide ranging, but in each case the fundamental issues being considered are (i) the reasons why we only count a proportion (in this case 60 per cent) of the investment expenditures that create Brand Equity and (ii) the ways in which we can consider brand as conforming to the following definition of an investment good (as cited by Corrado, Hulten and Sichel, 2005): “Any use of resources that reduces current consumption in order to increase it in the future qualifies as an investment. This result argues for symmetric treatment of all types of capital, so that, for example, spending on R&D and employee training should be placed on the same footing as spending on plant and equipment.” Key findings 2.3.3 Brand as Intangible Investment
• The amount of investment expenditure within any economy is the most important driver of
economic growth. The recent recognition in Treasury reports that expenditure on branding is an
‘intangible investment’ underlines the importance of this sector to the long-term health of the UK
economy.
• Despite recent work that has advanced our understanding of the financial value that can be
attached to this intangible investment, there are still substantial gaps in the evidence base.
• Our estimate that in 2006, £15.85 billion was invested in Brand Equity is justified by the existing
evidence base, but there is a pressing need to collect more evidence.
• To give some idea of the importance of this figure, the suggestion in these more recent studies is
that our estimate would account for approximately 12 per cent of all intangible investment in the
UK economy in 2006. A proportion that is comparable to the percentage contribution of Scientific
R&D.
• To see how this relates to the ‘tangible’ economy, the estimated value of all investment in
intangible assets is in the region of £130 billion for 2004. This figure of £130 billion is
approximately equal to the total value of all investment in tangible assets in this year19; this
includes factories and machines; roads; rail and a variety of other investment that increase the
productive potential of the economy.
• The implication is that investment in brand constitutes approximately 6 per cent of total investment
in the UK economy in 2006.
19 We are not able to provide exact figures, as it is beyond the remit of this study to update the estimates for all aspects of intangible investment, but to provide clarity G-M H W estimate that, in 2004, the £18.5 billion spent on advertising and marketing represents an £11.5 billion of intangible investment in Brand Equity; a figure that in 2004 accounted for 9 per cent of the total value of intangible investment.

25
Clearly, the value we place on Brand Equity is significant, though further research is needed to allow
us to develop more robust figures. However, what is particularly important is,
(i) a growing recognition of brand as Equity or Capital that has value to the economy as a whole.
(ii) This recognition of activities that create brand as investment, rather than consumption, identifies the potential key role they play as a driver of economic growth.

26
3. Brands in Innovation, Reputation and Change In the remaining sections of this report we shed light on aspects of the debate which are fundamental to the development of a shared understanding of the role of brand. They are:
1. What are the arguments that suggest one cannot simply add up the valuations of brand on the balance sheets of all UK firms in order to create an estimate of the value to the whole economy? Or, to put it another way, why do we only count 60 per cent of the value of activities that support the creation of brand as creating Brand Equity?
2. What are the specific characteristics of brand that justify our categorisation of brand as a capital asset that, if invested in, will provide us with a future return?
To begin, let us remind ourselves of what we can expect from tangible assets, by considering the purchase of a machine that makes widgets. On purchase of this machine, we forgo current consumption in order to provide a future income stream (in this case the production of widgets). This machine therefore clearly has a value to the firm that buys it and it also increases the overall capital stock within the economy now and makes a net contribution to output in the future. With this in mind, let us consider an amount of expenditure that goes to build Brand Equity (our intangible asset) which, if we are to consider it in the same light as the machine, must firstly be a forgoing of current consumption and secondly must provide a future income stream. The first aspect of this requirement seems to be satisfied – expenditure on marketing and advertising is a forgoing of consumption. But what of the properties of Brand Equity that lead us to expect a ‘return’ to the economy as a whole in the future? To answer this question we must consider the value to the economy of the role that brand plays for the firm and the consumer. The consumer: In the previous section Chart 1 set out a range of ways in which we may expect to derive value from brand, through the eyes of the consumer. In this report we are mainly focused on the aspects of brand that reduce transaction costs and help the consumer to manage risk by providing assurance through a guaranteed level of quality. There are many other ways that consumers derive value from brands that relate to design, stylistic, emotional and other considerations, but this study is very much focused on considerations of economic value. Our discussions aim to shed light on the role that brand plays as a builder of trust relations and communication between economic agents that is essential for trade in modern economies. The value to firms: As we have seen in the previous section, there are arguments against simply summing the various valuations of brand in the balance sheets of firms to arrive at a global figure for the value of brand to the economy. These derive from the fact that, from the point of view of the firm, any investment in brand (through marketing and advertising for example) provides a greater market advantage on a number of fronts. As many marketers themselves recognise (Kashani et. al. page 8), it is often the case that building a strong brand and the consumer loyalty that goes with it, results in ‘price premiums and higher margins’. This is not always the case, but is clearly more of a possibility when producers compete on quality aspects (performance, environmentalism etc.) rather than price alone. The development of any one firm’s Brand Equity is often at the expense of a rival firm, as they compete for market share. It is not the case that all advertising is a ‘zero-sum game’, where for instance, an increase in Brand Equity for Firm A (and the increased market share that is likely to accompany it) is always at the expense of a rival Firm B; but it is an aspect of the nature of this intangible investment that we must take into account. We must also take into account the fact that Brand Equity can sometimes be built in a way that raises barriers to entry for new firms who would compete away any price advantages, as they have not yet earned a reputation with consumers. This

27
views brand as a form of product differentiation that would allow prices to rise above the theoretical level in a perfectly competitive market comprising many products of the same quality. In considering the value of brand to the economy as a whole we must weigh these arguments carefully. In a variety of scenarios in this section, we consider the idea of perfect competition as a theoretical abstraction. In the real world many markets are characterised by what is termed monopolistic competition. It is not our aim to go into the detail of the various economic models around these market structures. Rather, we provide examples of the possible value of brand to the economy as a whole within a varied view of markets. Ultimately a case must be made which identifies future tangible benefits that this intangible asset can provide to the economy as a whole, rather than just any one individual consumer or company. In the next section we detail a range of possible reasons why brand may provide such a source of future returns and why the previous concerns around the restrictive nature of brand, whilst valid in some cases, are simply not applicable in many areas of the economy. Key findings 3: The challenge
• There is extensive evidence that Brand Equity is a key source of value to many of the most
successful firms.
• While we have already highlighted gaps in the evidence base, before these are tackled there is a
need for more discussion on the possible roles that brand plays and the areas where we can
identify value to the economy as a whole.
• This requires a consideration of the value of brand to consumers and the value that brand provides
to firms, that can be seen as also providing a net contribution to value in the economy as a whole,
rather than as an impediment to competition.
3.1 Brand reputation and economic change To begin, we first consider the role that brand has played in the growth of online transactions. More specifically, as research has suggested, one of the major barriers to growth in online transactions is the issue of security (Steenkamp and Geyskens, 2001). In evaluating the role of brands in online retail, we may consider the emergence of a range of new and innovative companies such as Google and eBay, which have built up global brands in a very short period of time, as a central component to any discussions. However, whilst these firms have raised the visibility of online transactions and encouraged many consumers to adopt online retail, our first focus is on those brands that had already been created before this innovation had taken hold. The suggestion is that established brands (previously referred to as ‘bricks and mortar’ firms) were particularly important in providing the assurance of security and quality that was needed for many consumers who were (and perhaps still remain) sceptical of online purchases. The point at which one of their trusted brands ventured into online transactions will have been the point at which many ‘late adopters’ will have been convinced to make the move. This is in some ways simply a version of brands reducing transaction costs, but we can also see here how this simple function supports innovation and progress, through the development of new markets and ways of doing business that the consumer may not fully understand. Chart 2 underlines the primacy of security in consumers views of the internet.

28
Chart 2: Ratings of the most important factors determining in Internet payments
0
10
20
30
40
50
60
70
80
Security of payment Competitive price Possibility of redress Flexible delivery Product information 24 hour access Product variety
Perc
enta
ge o
f res
pond
ents
Source: Steenkamp and Geyskens, AIM 2001; Survey of 50,000 internet users We return to this issue of technological and business process innovation, but first it is important to consider another example of how brand can help inform such lifestyle choices. A recent report from AIM (2007) underlines the important role that brands can play in altering the behaviours of consumers through their ability to make health and well-being more desirable and aspirational. Many consumers do not have the time to spend identifying healthy options in each area of their consumption, and building strong brands around assurances of ‘healthiness’ in a variety of product ranges is important in facilitating any change in lifestyle choices. The strength and visibility of these brands then acts as an assurance that a promise of healthy ingredients is adhered to, and also that the products are keeping up with the most up-to-date findings on what constitutes ‘healthy’. Both of these cases highlight an important role for brands in a modern economy, that can be considered as one of the ‘returns’ that we gain from the advertising, marketing and other brand-building expenditures that constitute our investment in brand. The building of brand in a way that acts as surety is achieved in a number of ways, but sticking to our framework, it is clear that advertising plays an important role in communicating the characteristics of product quality that begin to build trust relations. However, in addition to this role, there is also a role for advertising in the education of the consumer. One only needs to consider the adverts that accompany the majority of mobile phones or other communication devices to see how these detail the components in a way that alerts the general population to a range of new concepts. The standard advert will include short descriptions of digital calendars, which can be synced with other digital devices; examples of how one can access a wealth of information using mobile internet; as well as informing the general public about the value of GPS and mobile email access. For many who will be reading this report, these aspects of a new set of business processes will be well known and the lifestyle changes already made. But for a large proportion of the population, this process of dissemination through advertising and marketing is one of the main ways in which they are alerted to these new forms of working. Thus, we may see advertising as having a value (in informing and educating) that is in addition to its building of brand. However, it is essential that we consider these together in order to tackle one key challenge to this idea of advertising as information; the fact that a lot of this ‘information’ is unlikely to

29
put forward an objective analysis of the pros and cons of a product. Advertising is clearly aimed at putting forward arguments that encourage the purchase of a product or service and many make assertions that do not have such a strong role in educating consumers to important developments in health, wellbeing and information technology. There are clearly regulations on what one can and cannot say in adverts, but the key point to understand here is that we are talking about a “reputational asset” and that poor advertising represents a similarly poor investment expenditure. Thus, in the same way that one can invest in the wrong machine or computer, badly-conceived advertising will represent an investment that will ultimately destroy, rather than create, Brand Equity and has little value to the individual firm, never mind the wider economy. Thus, as we detailed in the case of Health and Wellbeing or the move to online retail, brands are ‘held’ to the promises they make; they are the ‘safe’ buy for many people and all of their actions (including the promises made in advertising) have a risk attached to them. Ultimately, the old bricks and mortar firm that goes online and starts accepting online payments offers its brand up as ‘surety’ in the transaction and the consumer implicitly understands that the company is risking a large amount if this ‘gamble’ does not pay off (the consumer therefore assumes that the company is assured of the security of its services). Key findings 3.1: Communication and building trust relations through Brand
• The building of strong trust relationships and reputations with consumers over many years
represents an investment that provides a number of potential returns, to both the firm and the
wider economy.
• The continuation of this trust relationship rests on the implicit understanding that any company with
a strong brand takes a substantial risk if they undertake any actions, for instance moving into new
markets, without making sure that such actions are ‘safe’.
• As an example of the value of brands to the economy as a whole, Brand Equity can act as ‘surety’
in a way that facilitates the quicker adoption of new technologies, business methods, ways of living
and working.
• Firms understand that they place Brand Equity at risk if they make clams that are not met.
• In addition to the building of trust relations, advertising also has a more general role in
communicating a variety of information which may be particularly important in periods of significant
innovation. In these instances this communication helps to educate a proportion of the population
in the details of new business processes and lifestyles.
30
3.2 Corporate Social Responsibility
Many readers will consider examples of brands helping to build health and well-being as somewhat anomalous next to high profile cases of strong brands that have faced charges that they encourage unhealthy living. However, ultimately, this does represent brand at its best. The claims made for some products in a variety of media were clearly either misleading or uninformative. This began to erode brand and therefore companies were forced to respond – they were held to account by consumers and society. If we consider the “responsibility” of brand more broadly in what has come to be known as Corporate Social Responsibility (CSR), it is useful to start from the view of Milton Friedman that the ‘business of business, is business’. Friedman’s argument is often taken as an argument against CSR, as it suggests that firms as economic agents should be focused on generating long term shareholder value and ultimately profit. John Kay goes further than this, suggesting that business leaders who wander from a focus on profit can represent a threat; they enter into political debates and are awarded a very high profile that is not appropriate given their limited mandate. However, considering these arguments from a purely economic perspective does not rule out CSR as a business strategy and in taking a more pragmatic (and we would argue, more realistic) view we can identify a central role for brand. One particularly interesting manifestation of this is the potential role of brands and CSR in correcting market failures. Firstly, what do we mean by market failure? Consumers often demand products and services that have what economists term ‘negative externalities’. Examples of these types of products include cigarettes, petrol and alcohol. The key characteristic of these products is that, when an individual buys them, the true cost to society is unlikely to be represented in their price in a market left to its own devices. Thus, if I only paid for the ‘direct’ cost of producing and consuming petrol I would not be paying for the damage to the environment (in the case of cigarettes there is an external cost to those around me if I smoke and to the health service if I make myself ill). One of the key criteria for Economists is that the efficient allocation of resources is only possible when the price of a good reflects its true costs and this is one of the main reasons why governments tax these products. Seen in this light, consumers who want to see oil companies reduce their impact on the environment by carrying out CSR-related activities are in many ways demanding that the firm accounts for the external cost of its activities in the price of their products. Other examples include the fact that, when one orders online from some companies, you can choose to offset the costs of pollution involved in the delivery to your house. One can carry out a similar process in international travel. Now, these are specific examples that would appeal to economists as the activities entail clear negative external costs that are not included in the costs of producing the product. However, this concept is clearly one that can be expanded to encompass a variety of services that firms offer in addition to the consumption of a good or service.

31
Corporate Social Responsibility and Brand (Lye, 2005) “Around the world, boardrooms are grappling with new and expanded concepts of corporate responsibility, accountability, governance and liability. Companies that have long believed themselves safe from the type of crises experienced by Shell over Nigeria or Nike over child labour are now feeling vulnerable. In a world characterised by instant global communication and decreasing trust in business, disgruntled stakeholders are holding companies to account for perceived societal or personal damage, often in a court of law. Increasingly, corporate 'moral liability' is being used to challenge companies in the court of public opinion. Companies that cling to technical compliance as their business strategy are unlikely to prevail in the court of public opinion even if they succeed in the courts of law. When a company or brand breaches society's values and expectations, its reputation is often the first casualty SustainAbility's latest report. The Changing Landscape of Liability, illustrates how CSR standards are progressively shifting from the 'soft' voluntary codes into 'hard' regulation and legislation, Beyond legal and regulatory liability, there's an accelerating range of risks which we term 'moral liability'. There's a shift in societal expectations of responsible business, which are forcing companies to adopt new business models in relation to accountability for past actions, supply chain issues and equity issues in terms of fair trade and fair pricing. The future impacts of these shifts on corporate and brand value are likely to be substantial. Competitive differentiation is ever less achievable through hard factors such as price and performance and more dependent on 'softer' aspects of brand values. There is now a clear distinction between the dimensions of product and brand trust. Product trust is rooted in product quality, legal compliance and value, whereas brand trust overlays these with ethical quality, accountability and values. Evidence of the emergence of this additional set of market drivers can be seen in the growth of ethical investment and fairly traded goods. Studying the link between societal values and new forms of liability illustrates how companies and brands which are in breach of society's values and expectations are increasingly at risk of trial and punishment in the court of public opinion.”
Essentially, in these cases firms are marketing products that include not only the product itself, but an additional assurance that the company is reducing the harmful effects of consumer society (for instance through the assurance that products are organic or ‘fair-trade’20). What role does brand play in this? Once again it provides surety that the firm will actually carry out their various promises21 and also acts to communicate the details of these negative externalities and the wider social impacts of various harmful effects of a consumer society. Seen in this light, the ‘surety’ of Brand Equity plays an essential and pragmatic role in the business case for social responsibility and sustainability. Essentially, brands act as the medium through which companies and consumers build shared understandings of what business can do to deliver what the consumer wants in terms of social responsibility. The self-regulation that branding imposes then assures that any firms that do not live up to their promises suffer a decline in their Brand Equity and their competitiveness. Taking this issue of CSR further, it is interesting to focus on larger firms for a moment. Thus, as suggested in the previous section of the report, in Economics the creation of brand (or ‘product differentiation’) is often seen as a method of raising barriers to competition and to some extent this is a primary motivation for the ‘60 per cent’ figure used in the studies cited previously. However, it is also the case that some sectors of the economy have ‘barriers’ that exist naturally and therefore lend themselves to domination by a few large companies. Extreme examples of these are natural
20 As economists will note, we are now moving out of the realm of possible market failures and simply moving in to a description of consumer demand for more than simply a ‘product’. 21 See recent work by Porter and Kramer (2007) for more detail on the link between CSR and the wider business strategic framework.

32
monopolies such as gas and water distribution; whilst rail networks and sectors requiring large amounts of R&D, with long lead times to bring products to market, are examples where we may expect a few large firms to dominate. Many of the newer firms that have emerged over the past decade, whose business models take advantage of developments in information and communications technologies, have a tendency to become monopolies (or at least limited oligopolies/monopolistic competition), because of what are termed ‘Network externalities’. This is not a new phenomenon. The classic example of a technology that has strong network externalities is the telephone. Put simply, the value of the product to any one user increases as the number of additional users increases. When such effects are strong, for instance in many of the online social networking sites, there tends to be domination by a few large firms as there is a minimum size requirement. In these industries concern is often voiced over the power of the firms that dominate and hence one often sees regulators in such sectors. However, in a virtual world, where geographical location is harder to pin down, government and regulation seem increasingly toothless. Thus, in the absence of this, brand can act as a form of regulation; companies that have a higher public profile and a strong brand to protect are much more likely to avoid actions that will be frowned upon by wider society and to alter their behaviour in the face of public pressure22. The concerns of many individuals over ‘global’ firms are similarly mitigated to some extent by branding, as the existence of a strong brand makes them accountable to a global community (Ollivier-Lamarque et. al. 2001). Key findings 3.2:
• Brand acts as the medium through which companies and consumers build shared understandings
of the role of business in societies, often allowing firms to offer services that offset the negative
side effects of some elements of consumption.
• Brand plays a pragmatic role in linking the interests (and to some extent strengthening the
mandate) of business with that of social responsibility. It can even help to overcome some market
failures, if this results in firms, for instance, paying more because of the pollution they cause23.
• In situations where we realise the value of strong brands in the balance sheets of firms, one can
see how large global firms with extensive influence are held to account by consumers and society
through the medium of brand.
22 One may see Brand acting as a signal to ensure some form of contestability of markets, as firms can gauge consumer sentiment more easily and consider the viability of entry. 23 In the terms that might be used in the field of Economics, we are ‘internalising the externality’.
33
3.3 Brand and Innovation
In section 3.1 we have seen how strong brands, built up over many years, may help overcome inertia in the take-up of new technologies and lifestyles through their role in communicating details of new findings, providing information and acting as surety for consumers. In this section we now consider how this role relates to the initial innovations that bring about such opportunities for change. Later in this section, our interpretation of ‘innovation’ widens to include things such as supply chain and marketing innovations (such as the developments in ‘pay per click’ in online advertising). But as a starting point we focus on what is generally known as Research and development (R&D). Firstly, it is important to remind ourselves of the basic principles underlying the process of Research and Development. Firstly, one observes very few small firms undertaking R&D (Urwin et. al. 2008) and this reflects the need for minimum scale requirements. R&D is a particularly risky investment, with each individual R&D project having a relatively low expected pay-off. Firms therefore need to spread risk across a number of projects, to ensure that at least one provides the actual return required for continued survival of the firm. A version of this argument is reflected in the finding that small firm innovation is highest in industries with low barriers to entry (Freeman and Soete 1997). However, even large firms would continue to face significant problems in ensuring the profitability of any findings from their R&D spending, as rivals (who had not incurred the initial costs) would be able to copy the product and sell at a lower price. In this situation we would expect the market to under-provide a variety of products that require high levels of R&D spending. As a result, most governments have adopted the process of awarding patents for innovations. This ensures that the innovator has sufficient time to reap the rewards of their R&D spending, without competition from competitors. However, patents in themselves do not assure that any period of protection from competition will allow the firm to reap returns. In addition, the firm has to bring the newly patented product or service successfully to market, commercialising it in order to reap sufficient returns during the period of the patent to justify any initial investment. So what factors might we expect to influence this ability to bring a product successfully to market and where does brand sit within any such relationships? Firstly, in environments where there are existing strong trust relations between a firm and its customers, any firm has an advantage when introducing a new product in comparison to a firm where these trust relations do not exist. Drawing on examples quoted earlier in the report on Health and Well-being, it would seem that many consumers are willing to pay more for some products that can credibly charge an ‘innovation’ premium. The firm that credibly brands its food products as being at the forefront of thinking on Health and Wellbeing is essentially charging the consumer for the cost of innovation (or at least keeping up with innovation) and the communication of such allows the consumer to make an informed choice of how much they wish to pay for this aspect of the product (the firm is held to account by the possibility that brand will be severely eroded if it is found to not keep up with developments). If we combine the discussion here with the concept that brands reassure consumers to overcome their inertia in taking up new technologies, we may reasonably expect firms with stronger brands to be better placed when taking new innovations to market. But if this is the case then the logical next step is to assume that brand also acts as an incentive for many firms to innovate in the first place. The fact that some firms can build brands and charge a premium based around a promise of innovation in their products, further underlines how the building of brand is closely associated with the process of innovation. There would seem to be a theoretical rationale for this shift from a view of brand which allows firms to better market their innovations; to one where this role of brand acts to raise the incentives to innovate. However, this is quite a shift, so what is the evidence in this area of investigation? The answer is that
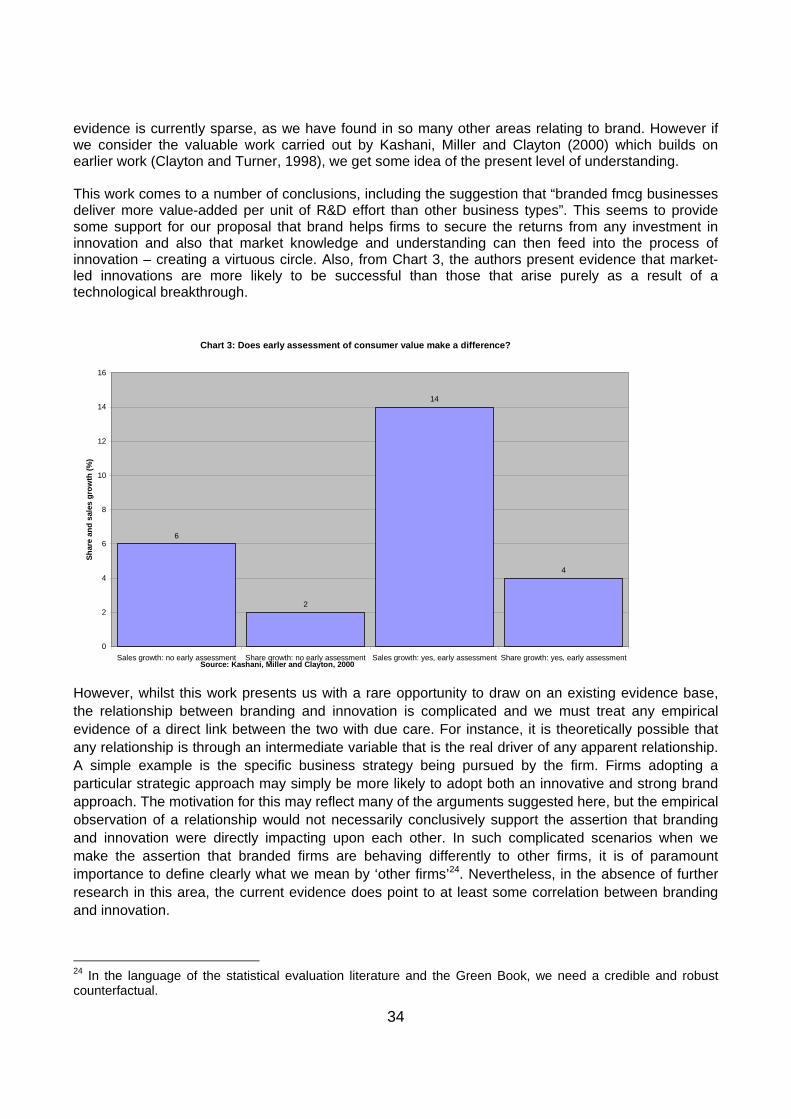
34
evidence is currently sparse, as we have found in so many other areas relating to brand. However if we consider the valuable work carried out by Kashani, Miller and Clayton (2000) which builds on earlier work (Clayton and Turner, 1998), we get some idea of the present level of understanding. This work comes to a number of conclusions, including the suggestion that “branded fmcg businesses deliver more value-added per unit of R&D effort than other business types”. This seems to provide some support for our proposal that brand helps firms to secure the returns from any investment in innovation and also that market knowledge and understanding can then feed into the process of innovation – creating a virtuous circle. Also, from Chart 3, the authors present evidence that market-led innovations are more likely to be successful than those that arise purely as a result of a technological breakthrough.
Chart 3: Does early assessment of consumer value make a difference?
6
2
14
4
0
2
4
6
8
10
12
14
16
Sales growth: no early assessment Share growth: no early assessment Sales growth: yes, early assessment Share growth: yes, early assessment
Shar
e an
d sa
les
grow
th (%
)
Source: Kashani, Miller and Clayton, 2000
However, whilst this work presents us with a rare opportunity to draw on an existing evidence base, the relationship between branding and innovation is complicated and we must treat any empirical evidence of a direct link between the two with due care. For instance, it is theoretically possible that any relationship is through an intermediate variable that is the real driver of any apparent relationship. A simple example is the specific business strategy being pursued by the firm. Firms adopting a particular strategic approach may simply be more likely to adopt both an innovative and strong brand approach. The motivation for this may reflect many of the arguments suggested here, but the empirical observation of a relationship would not necessarily conclusively support the assertion that branding and innovation were directly impacting upon each other. In such complicated scenarios when we make the assertion that branded firms are behaving differently to other firms, it is of paramount importance to define clearly what we mean by ‘other firms’24. Nevertheless, in the absence of further research in this area, the current evidence does point to at least some correlation between branding and innovation.
24 In the language of the statistical evaluation literature and the Green Book, we need a credible and robust counterfactual.

35
Despite this lack of evidence, we can begin to gain some insight into the role that brand plays as a key component in focusing companies towards competition on aspects of quality, rather than just price. When considering a reputational asset, if that reputation begins to be eroded as rivals come into the market with improved products, we may expect further innovation by the original firm. The management and development of brand, in its simplest form, is a signal of what the firm does; all employees are then responsible for making sure that the product or service lives up to the signal that brand communicates. In many cases this may be living up to being the cheapest alternative, but in the majority of cases there is a ‘quality’ mark provided by the brand and we may expect this to motivate firms towards a greater focus on quality. One only needs to ask what the point would be of a firm producing a quality product, if each time a consumer goes shopping they are faced with a variety of products for which they have no prior knowledge. It is important in any discussion of brand and innovation to mention the role played by a variety of forms of protection for intellectual property. We have mentioned the use of patents which, when used alongside a strong brand, can better ensure the returns to R&D that are required to justify any initial investments. However, as a report by the International Chamber of Commerce (2005) suggests, patents are only one of a raft of measures that allow firms to protect intellectual property. Trademark protection is another important form of protection of intellectual property and, as Bosworth (2003) underlines, this form of protection is intricately linked with the concept of brand. In most countries, trademark constitutes the legal framework for the protection of brand. In a reflection of our discussions on the link between brand and innovation, Greenhalgh and Rogers (2006) find that firms which trade mark have significantly higher value added than non-trade mark companies. Key findings 3.3: The link between brand and innovation
• Patents in themselves do not assure that a period of protection from competition will allow the firm
to reap returns.
• Having built up trust relations over many years, we may expect branded companies to be much
better at bringing innovations to market in a way that ensures a return on any initial investment in
innovation.
• We can therefore consider the proposition that brand acts to encourage innovation in companies,
through an incentive to maintain the reputational asset and the greater assurance that successful
innovations will be brought to market effectively, ensuring a return on investment25.
• However, whilst there is some evidence to support this role, it remains unproven and it is important
to also consider the fact that,
1. On the one hand the building of brand (as opposed to competing on price) is sometimes in
economic theory seen as anti-competitive (with an implicit suggestion that innovation is being
stifled). However, those sectors of the economy that require high levels of innovation are those
where the theoretical benchmark of perfect competition has little relevance.
25 Further underlined in the commentary by Stout, D. (1998), “Interpreting the PIMS evidence on the contribution of branded consumer businesses to economic growth; Policy implications”, Commissioned by AIM European Brands Association.

36
2. Any evidence collected to date is consistent with the hypothesised link between brand and R&D,
but this cannot yet be considered as strong proof of a direct relationship, where brand encourages
R&D.
• As a study by Robinson et. al. (2006) and our commentary here suggests, the area of innovation
warrants more research before conclusive links can be made.
3.4 Positive externalities and spillovers As set out in Section 3.2, within the field of Economics, negative externalities are associated with products that have a greater cost to society than is reflected in their price. The markets for oil, cigarettes and alcohol are classic examples and CSR can be seen, in many of these cases, as a way of ‘internalising these externalities’. In such an instance, consumers begin to pay a price for the product that is closer to the full cost to society. However, it is also reasonable to suggest that brand may itself have wider benefits that might be termed ‘spillovers’ or, in the language of economics, ‘positive externalities’. In this light, one can hopefully see that positive externalities are associated with products that have a greater benefit to society than is reflected in their price and, in many cases, where the market would under-provide the product, next to the socially optimum level. A classic example is education where the argument suggests that any education I consume has a direct benefit to me, but also a wider benefit to society as I am likely to become more productive; engage in a more informed way in politics; make more informed judgements about my health etc. So why is this relevant to brand? Firstly, let us consider some of the activities of the British Tourist Authority (now VisitBritain), whose objective was to sell Britain abroad, with activities supplemented by the setting up of a new government body in 2002 entitled the Britain Abroad Task Force. The British Council also has a remit to raise the profile of Britain abroad and regularly undertakes surveys of young people across countries to ascertain the country image of the UK, recognising that country image matters to trade and global political influence. In a branch of research that has considered this impact of national brand on consumer choices and behaviours, Kim and Chung (1997) examined the market for U.S. and Japanese cars in the U.S. They find that Japanese brands generated intangible benefits specific to Japan, in terms of country image which supported the link between marketing variables and market share. Verlegh and Steenkamp (1999) provide a review of the country-of-origin research which has traditionally examined the links between country-of-origin effects on perceived quality and purchasing intentions. Their meta-analysis of 41 studies suggests that consumers are affected by cues concerning country-of-origin when evaluating products, though this effect is less strong on purchase likelihood. Research by Cai et al. (2004) identifies the perceived level of economic development of a country as an important factor in consumer choice and perception. Thus, there would seem to be some evidence that consumers, when considering the purchase or otherwise of a product, make reference to perceptions they have of the country of origin of the product. Given this, it is not hard to see that there is likely to be a ‘feed-back’ mechanism of some sorts, where perceptions of the UK (perhaps through the work of the British Council or the Britain Abroad Taskforce), can be re-enforced and enhanced by the strong brand image of many products and services. For instance, thinking of the work of Cai et al. (2004), in the case of India which has

37
become an integral part of the global economy26 over the past decade, the emergence of ‘national champions’ such as Tata, Wipro and Infosys have reinforced the image of India as an increasingly professionalized provider of high-tech goods and services. Much of this is because these companies focus on the delivery of quality products, but if consumers and other businesses do consider country of origin in their purchase decisions then countries clearly benefit from the expenditure that these firms spend on brand management.
A World of Difference: Extract from Rating Nation Brands: What Really Counts? by Randall Frost October 6, 2008 issue of Brandchannel.com Both the NBI and East West indexes rank nations by how favourably they are perceived around the world. Because the NBI measures consumer perceptions, however, and East West media perceptions, one would not expect total agreement in the two rankings. But both indexes employ scientifically sound methodologies, so one might anticipate a little more overlap than appears to be the case (below). Rank NBIa East Westb 1 Germany Singapore 2 United Kingdom Hong Kong 3 Canada Malaysia 4 France Taiwan 5 Australia Australia 6 Italy United Arab Emirates 7 Switzerland Qatar 8 Japan Monaco 9 Sweden Canada 10 United States United Kingdom a NBI Index (Q4, 2007). Source: Anholt Nation Brands Index™ © 2005-2008 Simon Anholt. (with permission)27 b East West Index: Source: East West Global Index 200 © 2008 East West Communications (with permission)
In a recent article which looks into The importance of national reputation, Simon Anholt28 underlines the importance of national image and reputation in a global market where increasingly purchases of goods and services (both between consumers and business; and business-to-business) are made across national boundaries. The article goes on to argue that the efforts of many governments can be ineffectual, as country brand image seems to change little from year-to-year. We would support this, but not because of any judgement on the efforts of those involved in the branding of Britain. Rather, it is simply that the funding provided for such programmes is dwarfed when set against the amounts we have been discussing in Section 3. The entire budget for the British
26 India is often considered as one of the BRICS [Brazil, India, China and the Soviet Union] that have moved beyond being ‘developing’ countries and are now within the category of developed. The term is attributed to Jim O’Neill Chief Economist at Goldman Sachs in 2001. 27 The Nation Brands Index (NBI) is a comprehensive survey that looks at dozens of different aspects of national images. The Brandchannel article focused on the overall rankings of the NBI. The East West media survey is a computer count of references to countries from the online editions of certain English-language periodicals, whereas the NBI is a detailed qualitative survey of over 29,000 individuals in 35 countries. 28 Simon Anholt is an Independent Member of the Foreign & Commonwealth Office Public Diplomacy Board and his article can be found on the Foreign and Commonwealth Office website, http://www.fco.gov.uk/en/about-the-fco/publications/publications/pd-publication/national-reputation.

38
Council in 2007 was 246 million, of which a relatively small percentage can be considered as targeted at raising the profile of Britain abroad. In addition, as the league tables above suggest, there would be problems identifying how successful any country branding had been. Key findings 3.4: The branding of UK PLC
• There is evidence that the way in which consumers view countries impacts upon their purchases of
goods and services from these countries.
• It is also true that governments are aware of the importance of country reputation, for a variety of
reasons, including tourism and also the flows of knowledge workers.
• Given the interaction between country perceptions and purchases of goods, the suggestion is that
private expenditure of firms on branding has a spillover effect into the perceptions that people
have of countries themselves.
• The development of strong brands in many UK companies is likely to spill over at the national level
and raises the possibility that the perceived standing of UK PLC is enhanced as a result.

39
4. Conclusions and implications for policy As suggested in various sections of this report, the creation and management of brand is of central importance to the UK economy. Previous research has highlighted the immense value that individual companies place on brand, but in this report for the first time we identify the importance of an area of activity that employs approximately one million people in the UK. The report also builds on existing research to underline the pivotal role that investment in brand plays for the future growth prospects of the economy and its potential to provide significant export earnings. The report then goes on to detail the potential role that brand plays in building strong trust relationships and reputations with consumers which acts as ‘surety’ in a way that can facilitate the quicker adoption of new technologies, business methods, ways of living and working. In a continuation of this role, brand acts as the medium through which companies and consumers build shared understandings of the role of business in societies, linking the interests of business with that of social responsibility. Given the importance of branding in employment; on the financial balance sheets of firms and as a form of intangible investment helping to drive economic growth, it is surprising that at various points of the report we are forced to underline a lack of available evidence. Many readers who take the time to read the entire report will perhaps have become rather tired of the constant caveats that we are forced to apply, in cases where figures are unavailable or the existing evidence base is simply too thin to build a strong theoretical and empirical argument. The importance of brand to the economy and society, from this report and others cited in this report, cannot be doubted. So one must ask why we find such a scarcity of policy discussion and research on the value of brands to the economy and society? Even more importantly, whether the findings from this and other studies will reverse this trend and, if not, why not. As we suggest in the report, the creation and management of brand encompasses a much wider range of activities than simply advertising. This is not to detract from this area of activity, but the management of brand as an area for research may have been confused with advertising and in many people’s minds the two are perhaps equivalent. In the research and policy arenas, brand may have also suffered because of the nature of official statistics, as it is hard to estimate the value of brand in employment and finance. In addition, there is perhaps a perception in some policymakers minds that the creation of brand is in some ways anti-competitive. In this report we have shown how, when one considers the role of brands in competition, there is a need to recognise that in many situations brand plays an important role in markets that would not be characterised by price competition. The reason why these markets are not characterised by a primary focus on price competition is not due to the existence of brand, but because of the nature of the market for particular goods and services; we detail the case of sectors that rely to a large extent on R&D. In the absence of brand it is hard to see how firms could reap the returns to any consistent focus on the quality of their products. Thus, this report has highlighted many of the limitations of the data and tackled any potential misconceptions head on. Is this likely to change the situation? At first we may take encouragement from some growing recognition of the status of expenditures that create brand as one of a number of ‘intangible investments’. We estimate that in 2006, £15.85 billion was invested in Brand Equity; a figure which represents around 12 per cent of all intangible investment in that year. So why do we still remain concerned that the lack of policy and research focus on brands to date will not be rectified without a significant change in thinking?

40
To illustrate this point and to underline the main policy implication of our report, it is informative to briefly consider the policy context of the other categories of intangible investment. Investment in human capital takes centre stage as a focus for government policy at present. In response to the Leitch Review of Skills29 the Department for Innovation, Universities and Skills (DIUS) has commissioned a range of reports30 which investigate the extent and nature of learning across the UK. The subject of Scientific R&D has been a focus of policy throughout the tenure of the present labour government; it has been a particular focus of attention for the present Prime Minister and since July 1998 there has been a Science Minister. When considering investment in computer software/databases, it is clear that the IT revolution and its impact on working patterns, productivity growth, innovation and a range of other aspect has been the focus of much policy debate and research work across most countries of the OECD (ibid.). There are other forms of intangible investment31 and these areas tend to have their own Research Councils (ESRC; EPSRC; AHRC) to promote the development of an evidence base. Each one of these areas already forms a focus for one or more government departments and/or has a dedicated stream of public research funding. However, consideration of the policy and research context for brand provides some insight into why (i) there has been a lack of policy discussion and generation of research evidence and (ii) why we might be concerned that the recognition of brand as an intangible investment may not change this situation without additional action. There has been some recognition of the potential role for brands in publications from the Department for Culture, Media and Sport (for instance DCMS, 2007). There is some limited mention of the role of brands in publications by the Department for Department of Business Enterprise and Regulatory Reform (see for instance DTI, 2003). A Department for Innovation, Universities and Skills (DIUS) report in 2008 has resulted in the commissioning of a study which will see the National Endowment for Science, Technology and the Arts (NESTA) work to create an index of innovation by Spring 2009. Again, in this area of policy debate, brand has featured to some extent. However, in all of these policy documents and also in all of the studies in the US and UK we draw upon to calculate the financial values presented in this report, brand rarely, if ever, forms a focus of discussion. If one were to take a major policy implication from this study, it is simply that there is no systematic public policy agenda with respect to brands. There is no one department that has a focus on this area of activity and as a result branding tends to fall through the gaps between government departments. Essentially, we have a situation where brands potential is beginning to be recognised as an important form of investment that drives the new knowledge economy, but this report represents the first attempt to consider exactly how this works and place a value on it. We have looked into areas which some commentators will find a breath of fresh air and others will consider some of our claims to be contentious. We will be happy with either, as at least there will be a public debate about the role that brand plays. To underline this point, let us consider one particular aspect of this gap in the evidence base. In attempting to accommodate the possibility that not all advertising expenditure can necessarily be considered as investment in brand, we have to follow the lead of existing studies that draw on the results of an econometric evaluation carried out 14 years ago. This uses data collected from 417 firms 29 HMSO, (2006), Prosperity for all in the global economy - world class skills; Leitch builds upon the 2005 White Paper Skills: Getting on in Business, Getting on at Work. 30 De-Coulon and Vignoles (2007a); De-Coulon, and Vignoles (2007b); Blanden, Buscha, Sturgis and Urwin (forthcoming 2008). 31 Such as design in architecture and engineering; product development in the financial services sector; R&D in the social science and humanities and the study of organizational infrastructure (Management consultancy).

41
between 1982 and 1986 (Landes and Rosenfield, 1994). This is evidence that is now more than two decades out of date, being used to consider the role of a sector that contributed £15.85 billion to UK intangible investment in 2006 and employs one million people. We would suggest that the situation has become critical. To conclude, it is worth remembering that we no longer live in an era where trust relations can be built between local butchers, bakers and their clientele. However such trust relations, which are built up over many years and encapsulated in brand, are essential to the successful functioning of modern economies where commerce is carried out by agents who operate at a much greater commercial ‘distance’; in this modern world brand plays a unique role in facilitating the process of trade. Customers’ trust reflects an implicit understanding that any company with a strong brand takes a substantial risk if they move into new markets without making sure that such markets are ‘safe’. Brand acts as ‘surety’ for the consumer and as such facilitates the quicker adoption of new ways of doing business and also allows society to hold firms to account; empowering the consumer. We hope that this report begins the process of change that is needed in the way brand is viewed within the UK economy and society, so that the required evidence can be created on which to base policy.
42
Bibliography Argyriou E., Kitchen P.J., Melewar T.C., (2006), “The relationship between corporate websites and brand equity - a conceptual framework and research agenda”, International Journal of Market Research, Vol. 48, No. 5. Biel A.L., (1997), “Discovering brand magic: the hardness of the softer side of branding”, International Journal of Advertising, Vol. 16, No. 3. Blanden, J., F. Buscha, P. Sturgis and P. Urwin (2008) ‘The effect of lifelong learning on intra-generational social mobility: evidence from longitudinal data in the United Kingdom’ Department for Innovation Universities Report, forthcoming. Bosworth, D. L. (2003), “The importance of trade marks to capital raising and financial performance – lessons from SMEs”, Manchester School of Management, UMIST. British Brands Group (2004), A Guide to Brand Protection, produced in conjunction with Bristows. Cai, Y., Cude, B. and Swagler, R. (2004) “Country-of-Origin Effects on Consumers’ Willingness To Buy Foreign products: An Experiment in Consumer Decision Making”, Consumer Interests Annual, vol. 50; pp 98-105. Clayton, T. and Turner, G. (1998), “Of Brands and Growth; Evidence on the Contribution of Branded Consumer Businesses to Economic Growth”, AIM European Brands Association. Corrado, C., Hulten, C., Sichel, D. (2005), "Measuring capital and technology: an expanded framework", in Corrado, C., Haltiwanger, J., Sichel, D. (Eds),Measuring Capital in the New Economy, National Bureau of Economic Research Studies in Income and Wealth, Vol. 65 pp.11-45, The University of Chicago Press, Chicago, IL and London. Department for Culture, Media and Sport (2007), “Staying ahead: the economic performance of the UK’s creative industries”, London HMSO. De-Coulon, A. and Vignoles, A. (2007a) ‘Lifelong Learning: False Hope or Policy Solution’ Institute of Education, Mimeo. De-Coulon, A. and Vignoles, A. (2007b), An analysis of the benefit of NVQ2 qualifications acquired at age 26-34, Department for Education and Skills. European Brands Association [AIM], (2007) The contribution of brands to health and well-being in Europe; available from http://www.aim.be/ Feldwick, P. (1996), “What is Brand Equity Anyway, and How Do You Measure It?”, International Journal of Market Research, Vol. 38, No. 2. Gerzema J., Lebar E. and Sussman M. (2007), “Energy: igniting brands to drive enterprise value, International Journal of Market Research, Vol. 49, No. 1. Giorgio Marrano, M. and Haskel, J. (2006), “How much does the UK invest in intangible assets?”, CEPR Discussion Paper, No.6287

43
Giorgio Marrano, M., Haskel, J. and Wallis, G. (2007), “What happened to the Knowledge Economy? ICT, intangible investment and Britain’s productivity record revised”, Department of Economics Working Paper No. 603, Queen Mary, University of London. Giorgio Marrano, M., Haskel, J. and Wallis, G. (2007), “Intangible investment and Britain’s productivity”, Treasury Economic Working Paper No.1. Greenhalgh, C. and Rogers, M. (2006), “Trade Marks and Performance in UK Firms: Evidence of Schumpeterian Competition through Innovation”, Paper for the DIME Conference on Intellectual Property Rights for Business and Society, September 14th and 15th. Hupp, O. and Powaga, K. (2004), ”Using Consumer Attitudes to Value Brands: Evaluation of the Financial Value of Brands”, Journal of Advertising Research, Vol. 44, No. 3. International Chamber of Commerce (2005), Intellectual Property: source of innovation, creativity, growth and progress. Kashani, K., Miller, J. and Clayton, T. (2000), “A virtuous cycle; innovation, consumer value and communication”, IMD International and PIMS. Kim, C. and Chung, J. (1997) Brand Popularity, Country Image and Market Share: An Empirical Study, Journal of International Business Studies, vol. 2, 361-386 Landes, E. M. and Rosenfield, A. (1994), “The Durability of Advertising Revisited,” Journal of Industrial Economics, Vol. 42; pp 263-276. Lye, G. (2005), “Court of public opinion”, Brand Papers, April. Moore, L. and Craig, L. (2008), “Best Global Brands 2007”, Interbrand and Business Week magazine; p 13. Ollivier–Lamarque C., Herbert, I. and Carpentier, M. (2001), “Brand identity management in the context of global brands”, ESOMAR, Qualitative Research, Budapest, October. Porter, M. E. and Kramer, M.R. (2006), “Strategy and Society: the link between competitive advantage and corporate social responsibility”, Harvard Business Review, December Robinson, C., O’Leary, B., Rincon, A., (2006), Business start-ups, closures and economic churn: a review of the literature, prepared for the Small Business Service, by National Institute of Economic and Social Research, URN 06/2112. Sexton, D. E. (2000), “Valuing Brand Equity: Determining the value of brands using finance and marketing concepts”, The Advertiser, Columbia Business School and The Arrow Group Ltd. Steenkamp, J.B. and Geyskens, I. (2001), “Building consumer value through the internet”, AIM European Brands Association [undertaken by staff of Tilburg University]. Urwin, P. (2004). “Labour Force Trends, Skills Gaps and Associated Qualification Requirements for the Accountancy Profession in the UK”, Report commissioned by the Accountancy Occupational Standards Group and the Sector Skills Development Agency.

44
Urwin, P., Karuk, V., Buscha, F. and Siara, B. (2008), “Small Businesses in the UK: New Perspectives on Evidence and Policy”, Commissioned by the Federation of Small Businesses. White R., (2007), “Brand loyalty: does it really exist?”, Admap Magazine, May, Issue 483

45
5. Appendix The following sets out a more detailed discussion of the process used to arrive at the figures in Tables 1 and 2 of the report; essentially attempting to capture the proportion of those in employment who are involved in the creation of brand. Figures for Occupation and Industry Sector are taken from the Labour Force Survey where individuals classify themselves in their main job. All of the figures are weighted and therefore give us estimates of the population in Great Britain, from a survey of around 60,000 households. Therefore the figures represent: • For industry sector we are only capturing those ‘firms’ that are working to support the creation of
brand as their primary focus. Everybody in those firms is counted as being employed in the sector. • For occupation, we are measuring everybody whose occupation might credibly be argued to focus
on the creation and management of Brand; whatever the focus of the firms they are working in. Essentially, the Tables are split into those occupations and industries that seem (i) unequivocally to be related to branding and (ii) those that are more questionable. For both, we give an idea of where the people are working to inform our discussions around whether they should be included. The discussion around the Tables clarifies this last point. Occupational analysis Firstly, Table 1 gives us a broad overview of the occupational distribution of those in employment across the 27 million people working in Britain, according to Socio Economic Classification, SOC 2000. Appendix Table 1. SOC 2000: Major occupation group. Major occupation group (main job) Freq. Percent1 managers and senior officials 4,112,360 15.32 professional occupations 3,544,052 13.23 associate professional and technical 3,840,590 14.34 administrative and secretarial 3,209,727 11.95 skilled trades occupations 2,947,226 10.96 personal service occupations 2,136,582 7.97 sales and customer service occupation 2,090,475 7.88 process, plant and machine operatives 1,938,642 7.29 elementary occupations 3,044,233 11.3
Missing 68,796 0.3Total 26,932,683 100.0 Note: total includes working population aged 16-64 and excludes Northern Ireland. Source: Labour Force Survey 2007. Table 2 then focuses on the variety of more detailed occupational categories (which are sub-sets of the major groups in Table 1) that might be considered as involved in building and managing Brand. The figures in yellow are the ones where it is felt that 100 per cent of the workers could be included in this category; the figures in green are those occupations that are more questionable. The upper bound estimate from Table 2 suggests that approximately 4.7% (1,256,371) of the British working population might be involved in branding related activities.

46
Appendix Table 2. SOC 2000: Minor occupation group. Occupation (main job) - selected only Freq. Percent1132 marketing and sales managers 510,092 1.91134 advertising & public relation managers 47,469 0.21137 research and development managers 56,598 0.22126 design and development engineers 64,933 0.22411 solicitors & lawyers, judges & coroners 148,411 0.62419 legal professionals n.e.c. 11,749 0.03411 artists 27,022 0.13421 graphic designers 88,121 0.33422 product, clothing & related designers 52,166 0.23434 photo. & audio-visual equipment operatives 53,964 0.23520 legal associate professionals 40,596 0.23536 importers, exporters 9,357 0.03543 marketing associate professionals 125,390 0.57125 merchandisers and window dressers 20,503 0.1
Total selected 1,256,371 4.7Missing 68,796 0.3
Non-relevant 25,607,516 95.1Total 26,932,683 100.0 Note: total includes working population aged 16-64 and excludes Northern Ireland. Source: Labour Force Survey 2007. Table 3 shows that, at a first estimate, 3.4% of those in employment are involved in occupations directly relevant to branding – i.e. marketing and sales managers, graphic designers etc. whereas 1.3% are involved in occupations semi-relevant to branding. Appendix Table 3. SOC 2000: Proportion of branding related occupations. Relevance to branding Freq. PercentRelevant 908,674 3.4Semi-relevant 347,697 1.3Total 1,256,371 4.7 Note: total includes working population aged 16-64 and excludes Northern Ireland. Source: Labour Force Survey 2007. To get a better idea of how many people in the green categories can be counted in any overall estimate, Table 4 provides some idea of which sectors these people are working in; i.e. the kind of firms they are working in.

47
Appendix Table 4. SOC 2000 & SIC 1993: Selected occupations (minor group) by industry sections.
1132 1134 1137 2126 2411 2419 3411 3421 3422 3434 3520 3536 3543 7125
marketing and sales managers
advertising & public
relation managers
research anddevelopment
managers
design and development
engineers
solicitors & lawyers, judges & coroners
legal profes
sionals n.e.c.
artists graphic designers
product, clothing &
related designers
photo. & audio-visual
equipment operatives
legal associate
professionals
importers, exporters
marketing associate
professionals
merchandisers and window
dressers
a:agriculture, hunting & forestry 1.0 - 1.8 - - - - - - - - - 0.4 -c:mining, quarrying 0.5 - 1.9 2.3 1.0 5.7 - - - - - - - -d:manufacturing 26.2 16.1 37.9 65.9 0.7 - 13.7 27.4 20.9 5.3 2.2 4.0 17.5 7.9e:electricity gas & water supply 0.9 - - 2.2 - - - - - - 1.1 - 0.5 -f:construction 3.6 1.0 0.9 4.9 - 4.5 - - - 1.3 - - 2.2 -g:wholesale & retail trade 22.9 1.3 1.0 - 0.4 - - 1.4 16.6 5.8 - 46.0 25.2 84.4h:hotels & restaurants 1.7 2.3 - 0.7 - - - - - 1.3 - - 1.8 -i:transport, storage & communication 9.3 0.9 4.7 3.4 - - - 3.0 1.1 1.2 - 28.6 3.6 5.4j:financial intermediation 5.3 6.1 1.9 - 1.1 4.2 - - 1.1 - 11.6 - 6.3 -k:real estate, renting & business activities 19.4 43.6 25.8 18.4 79.2 36.3 7.8 53.3 48.9 38.4 61.5 13.1 28.0 2.3l:public administration & defence 1.9 7.2 8.3 2.2 14.0 43.7 - 1.7 1.2 3.4 22.2 - 1.3 -m:education 1.5 - 8.8 - 0.3 - 5.4 1.2 - 9.0 1.5 - 2.6 -n:health & social work 1.6 12.2 4.1 - 1.0 5.6 - 1.1 - 0.7 - - 6.5 -o:other community, social & personal service activities 4.1 9.3 3.1 - 2.3 - 73.1 11.0 10.3 33.5 - - 4.2 -q:extra-territorial organisations & bodies - - - - - - - - - - - 8.3 - -Total, frequencies 510092 47,469 56,598 64,933 148,411 11,749 27,022 87,686 51,553 53,964 40,596 9,357 125,390 20,503
Industry section (main job)
Occupation (main job) - selected ocupations, %
Note: total includes working population aged 16-64 and excludes Northern Ireland. Source: Labour Force Survey 2007. Table 4 represents a cross tabulation of industry sector and selected minor occupation groups in SOC 2000. It would seem that for instance, from Table 4, 37.9 per cent of Research and Development Managers are working in Manufacturing firms and 25.8 per cent in firms that are in Real, estate, renting and business activities. It would seem reasonable to make a case that a large proportion of these could be included in our definition of being employed in the creation and management of branding. One can see that some branding related occupations - i.e. marketing and sales managers - are distributed among all the industry sectors whereas others – i.e. graphic designers – are concentrated in particular industries.
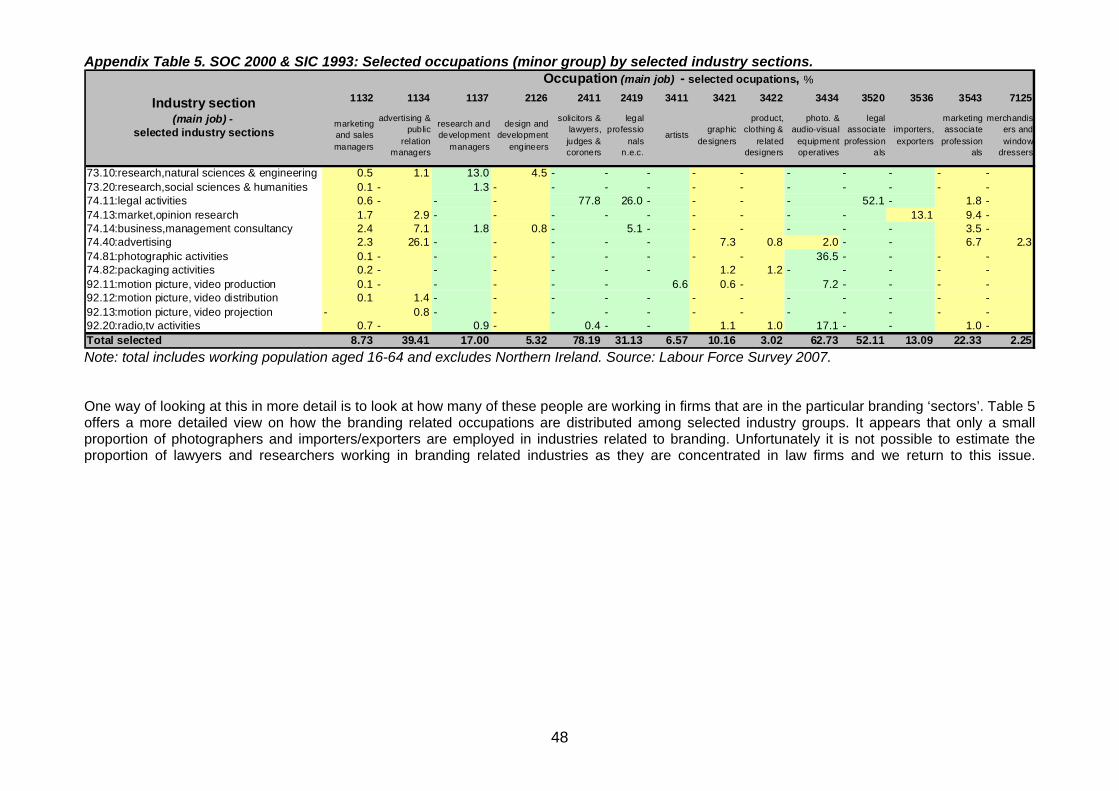
48
Appendix Table 5. SOC 2000 & SIC 1993: Selected occupations (minor group) by selected industry sections.
1132 1134 1137 2126 2411 2419 3411 3421 3422 3434 3520 3536 3543 7125
marketing and sales managers
advertising & public
relation managers
research anddevelopment
managers
design and development
engineers
solicitors & lawyers, judges & coroners
legal professio
nals n.e.c.
artists graphic designers
product, clothing &
related designers
photo. & audio-visual
equipment operatives
legal associate
professionals
importers, exporters
marketing associate
professionals
merchandisers and window
dressers
73.10:research,natural sciences & engineering 0.5 1.1 13.0 4.5 - - - - - - - - - -73.20:research,social sciences & humanities 0.1 - 1.3 - - - - - - - - - - -74.11:legal activities 0.6 - - - 77.8 26.0 - - - - 52.1 - 1.8 -74.13:market,opinion research 1.7 2.9 - - - - - - - - - 13.1 9.4 -74.14:business,management consultancy 2.4 7.1 1.8 0.8 - 5.1 - - - - - - 3.5 -74.40:advertising 2.3 26.1 - - - - - 7.3 0.8 2.0 - - 6.7 2.374.81:photographic activities 0.1 - - - - - - - - 36.5 - - - -74.82:packaging activities 0.2 - - - - - - 1.2 1.2 - - - - -92.11:motion picture, video production 0.1 - - - - - 6.6 0.6 - 7.2 - - - -92.12:motion picture, video distribution 0.1 1.4 - - - - - - - - - - - -92.13:motion picture, video projection - 0.8 - - - - - - - - - - - -92.20:radio,tv activities 0.7 - 0.9 - 0.4 - - 1.1 1.0 17.1 - - 1.0 -Total selected 8.73 39.41 17.00 5.32 78.19 31.13 6.57 10.16 3.02 62.73 52.11 13.09 22.33 2.25
Industry section (main job) -
selected industry sections
Occupation (main job) - selected ocupations, %
Note: total includes working population aged 16-64 and excludes Northern Ireland. Source: Labour Force Survey 2007. One way of looking at this in more detail is to look at how many of these people are working in firms that are in the particular branding ‘sectors’. Table 5 offers a more detailed view on how the branding related occupations are distributed among selected industry groups. It appears that only a small proportion of photographers and importers/exporters are employed in industries related to branding. Unfortunately it is not possible to estimate the proportion of lawyers and researchers working in branding related industries as they are concentrated in law firms and we return to this issue.

49
Legal activities According to the Industrial Classification, industry group “Legal activities” includes four subgroups: Table 11. SIC 1993: Legal activities detailed 74.11/1 Activities of patent and copyright agents74.11/2 Barristers at law74.11/3 Solicitors74.11/9 Other legal activities not elsewhere classified Source: Socio Industrial Classification 1993 For the purpose of the current survey we would like to estimate a proportion of patent and copyright agents as they are most likely to be involved in branding activities. Unfortunately, Labour Force Survey data does not offer a possibility of distinguishing among the above listed subgroups therefore we cannot estimate the size of this subgroup. Practices within Intellectual Property, IP: Copyright Data Protection and Compliance Design Rights Intellectual Property Litigation Patents Trademarks Unfair Trades In order to get a rough estimate of the number of lawyers involved in patent and copyright activities we have consulted other sources such as: The Law Society, The Chartered Institute of Patent Attorneys (CIPA), The Institute of Trade Mark Attorneys (ITMA) as well as websites of the largest law firms. Associations: According to the website of The Chartered Institute of Patent Attorneys (CIPA), there are 1,730 registered patent attorneys in the UK including those practicing in industry and in private practice. Total CIPA membership is over 3,000 and includes trainee patent attorneys and other professionals with an interest in intellectual property matters. The Institute of Trade Mark Attorneys has approximately 500 practising members. The Intellectual Property Lawyers Association (IPLA) currently has 55 member firms. Calculations: Addleshaw Goddard, one of the IPLA members, has 1,450+ people in total, 179 partners, 9 IP & Marketing partners, 4 IP legal directors. Assuming that proportion of IP & Marketing partners corresponds to the proportion of lawyers, we could say that approximately 5% of all lawyers in the company are working in IP & marketing. Labour Force Survey data suggests that 295,703 are employed in the legal activities sector according to SIC 1993 or 200,756 in law related occupations according to SOC 2000. The table below presents our assumptions in relation to the total number of IP & Marketing legal professionals in the UK.

50
Table 11. SIC 1993: Legal activities detailed
3.0% 4% 5%
SOC 2000 200,756 6,023 8,030 10,038SIC 1993 295,703 8,871 11,828 14,785
% of IP & Marketing lawyersTotal in legal sector/
occupationClassification
Labour Force Survey 2007 combined with CER estimations