valuing investments in distribution networks with dg under uncertainty
TRANSCRIPT

8/7/2019 Valuing Investments in Distribution Networks with DG under Uncertainty
http://slidepdf.com/reader/full/valuing-investments-in-distribution-networks-with-dg-under-uncertainty 1/8
1
Abstract— After deregulation of the electricity sector,
Distributed Generation (DG) has received increasing interestin the power systems development. The identification of
efficient and well-timed investments in electric distributionnetworks that cope with large power market uncertainties iscurrently an open issue of significant research interest.Strategic flexibility for seizing opportunities and cutting losses
contingent upon an unfavorable unfolding of the long-term
uncertainties is an attribute of enormous value when assessingirreversible investments in Distribution Systems. In this sense,DG units appear as an effective manner of adding flexibility to
the distribution expansion planning. This article proposes aninvestment valuation approach which properly assesses theoption value of deferring investments in distribution feeders
whereas gaining flexibility by investing in DG units. The
flexibility provided by DG investments -option to abandon andto relocate- is assessed through a Real Option Valuationapproach based on the novel Least Square Monte Carlomethod (LSM). In order to illustrate the feasibility of the
proposed valuation approach, a traditional expansion strategy(distribution feeders) and a flexible investment strategy(distribution feeders and DG) are compared in a study case.The article shows that a proper arrangement of feeders and
DG may lead to efficient investments by allowing a progressive
adaptation of the distribution grid to the changing scenarios.
Index Terms — Distributed generation, Distribution systems,
Flexibility, Investment, Valuation, LSM Monte Carlo, Realoptions, Uncertainty
I. INTRODUCTION
HE transition towards a competitive electricity sectorhas increased the requirements for efficient operationand planning of the distribution network in order to
enhance social welfare and the profits of the distributioncompany. Efficient allocation of distribution investmentsand timely expansion decisions are therefore becoming
increasingly important.After deregulation of the power sector, distribution
companies are forced to maximize profits based on conceptsof economic efficiency and distribution system adequacy,according to regulatory signals based on performance (PBR- Performance Based Regulation).
In this sense, the costs associated with the service to bepaid are associated with network operations, maintenanceand expansion of the components [1].
This work was supported in part by the German Academic Exchange
Service (DAAD) and the Argentinean Research Council (CONICET).E. Buzarquis, F. Olsina, and F. Garcés are with the Instituto de Energía
Eléctrica (IEE) at Universidad Nacional de San Juan (UNSJ), Argentina.(E-mail: [email protected])
G. Blanco is with the Facultad Politécnica at Universidad Nacional deAsunción (UNA), Paraguay (E-mail: [email protected]).
The electric distribution business is characterized by thefrequent investments under uncertain scenarios. Therefore,the uncertain variables of the power market play a key rolein the valuation of distribution investments.
In this context, the problem of valuing distribution systeminvestments should be addressed as a risk managementproblem, seeking to formulate a flexible distributionexpansion plan that led the planner make adjustments in aneasy and economic way for seizing opportunities or cuttinglosses according to the evolution of the uncertain variables.
In this context, strategic flexibility to adapt to changingmarket conditions has a substantial value, which must beproperly taken into consideration when valuing severalinvestment alternatives or regulatory frameworks.
Under the classical approach, the Distribution ExpansionPlanning problem can be formulated as a large-scalestochastic, nonlinear, mixed-integer optimization problem.A large number of algorithms and approaches have beendevised for solving this complex problem [2].
Traditional upgrades of the grid infrastructure areprimarily proposed as investments in reinforcement of distribution lines or investments in new distribution lines.Nevertheless, expanding the distribution network in these
conventional manners may not always be the best alternativeto deal with grid constraints especially those that arise dueto the uncertainty over the load growth [2].One possible way of dealing with these problems is theinclusion of Distributed Generation (DG) in the expansionplans as an alternative to building new distribution feeders.DG is a concept that covers a wide spectrum of energygeneration schemes. This power generation approach can bedefined as a single or a set of generators connected to lowand/or medium voltage networks, with power generationcapacity installed lower than 50 MW and not centrallydispatched [3].
Nowadays, the development experienced in DGparticularly regarding the progressive reduction of costs, hasmade possible to increase the penetration level of DG unitsto electric distribution systems.
Investments in DG technologies exhibit someadvantageous features that considerably increase theirflexibility: modularity, scalability, short construction times,and high levels of reversibility.
Hence, the use of DG adds a new set of options to thenetwork expansion planning that significantly enhance itsstrategic flexibility. Options such as postponement,abandonment, operational flexibility, or relocation offer anadditional value to DG investments, which should be fairlyvalued [4].
The inevitable uncertainties associated with theDistribution Expansion Planning are better managed withinvestments that provide flexibility. As new informationarrives, planners need the flexibility to change operating
Valuing Investments in Distribution Networkswith DG under Uncertainty
Enrique Buzarquis, Gerardo A. Blanco, Graduate Student Member, IEEE, Fernando Olsina, and
Francisco F. Garcés.1
T
8/7/2019 Valuing Investments in Distribution Networks with DG under Uncertainty
http://slidepdf.com/reader/full/valuing-investments-in-distribution-networks-with-dg-under-uncertainty 2/8
2
strategies to take advantage of favorable opportunities or tocut extraordinary losses in case of adverse scenarios. Thisflexibility may include various actions at different levels of the planning horizon, such as the options to defer, expand,reduce or even abandon the project. This flexibility to adaptto changing market conditions has a substantial value, whichhas to be considered when a plan implementation is beingdecided. It is thus crucial that flexibility be properly
quantified. Any attempt to quantify investment flexibilityalmost naturally leads to the concept of Real Options [4].
The Real Option Valuation (ROV) technique provides awell-founded framework – based on the theory of financialoptions- to assess strategic investments under uncertainty. Itquantitatively takes into account investment risks and thevalue of the open options for planners.
However, real option models usually present a highercomplexity than their financial counterpart. In fact, realinvestments often exhibit a much more intricate set of interacting options, which make them more complicated toassess [4].
In this sense, Longstaff et al. [5] have proposed a novel
method for solving American options, based on stochasticsimulation, which have been successfully implemented infinancial options. Recently, Gamba [6] proposed a newapproach for valuing a wide set of investment problems withmany embedded real options taking into account theinteraction and strategic interdependence among the options.
This article extends the approach proposed in [4] and [7]to an appraisal method for the quantitative determination of the uncertainties that affect the distribution investments. Inaddition, the methodology proposes an approach to obtainflexible investment portfolios that include the penetration of conventional DG on distribution systems. By applyingROV, the flexibility options to defer, relocate or abandon an
investment in the expansion plans of distribution systemsare assessed and quantified. This methodology is applied toa study case that replicates the behavior of a distributionsystem under uncertain scenarios.
II. FLEXIBILITY IN DISTRIBUTION SYSTEM INVESTMENTS
Nowadays, DG has important economic barriers. On onehand, the low profitability of DGs investments oftendiscourages private investors. On the other hand, the lack of regulation incentives for electricity distributors prevents anextensive level of DG installation. Under some regulationschemes, distribution companies have normally several
charges that, even more, discourages of the inclusion of DG[8]-[10].In addition, traditional distribution investments, once
executed, are considered as sunk costs, because theseinvestments have a negligible residual value if theconditions unfold adversely [11].
Consequently, the problem of valuing distribution systeminvestments could be addressed as a risk managementproblem, in which flexible investments act as a hedgeagainst adverse scenarios. In case of unfavorable conditions,this flexible investment should let the planner adjust makingchanges in an easy and economical way [12].
Typically, traditional distribution investments projects are
not now-or-never opportunities. Hence, the postponementoption of the investment decision is one of the most relevantflexible features of traditional distribution expansions.Indeed, keeping the investment option open waiting foruncertainties being partially resolved is the main hedge
against an unfavorable evolution of the future. Thus, thetime for optimally exercising the investment option is a keyfactor determining the efficiency of the expansion. In fact,the opportunity cost incurred when the ability of deferring islost, must be assessed together with other costs and benefits[6]-[10]-[12].
In most cases, the substantial value of the postponementoption and the lumpiness of the distribution expansion
planning lead to retain flexibility by delaying thedistribution investment decision. Normally, this entails awaiting period of several years until the distribution network is effectively upgraded. Accordingly, it is imperative to seek new flexible distribution investments alternatives, whichcombined with conventional expansion projects diversifythe distribution investments portfolio, allowing a moreefficient management of uncertainties. DG units seem to bea suitable alternative for increasing the flexibility of thedistributions investments portfolios (DIP).
The distribution expansion plans must be flexible andadaptable with respect to certain future occurrences of someparameters (uncertainty). A correct uncertainty modeling
allows a good analysis of risk in making investmentdecisions, avoiding accepting highly vulnerable projects,assuming high risk, or losing opportunities by not beingaggressive. In this sense, recent contributions have providedsome of the impact of DG in terms of economic benefits[13] - [17], recently, Samper [11] have proposed a methodfor valuate the option to defer investments in distributionsystems by incorporating DG . In this context, to evaluatethe gained flexibility in distribution expansion plans byinvesting in DG while deferring conventional distributionprojects is a key issue that still remains uninvestigated. Themain flexibility options provided by DG are analyzed in thefollowing.
A. Abandon option
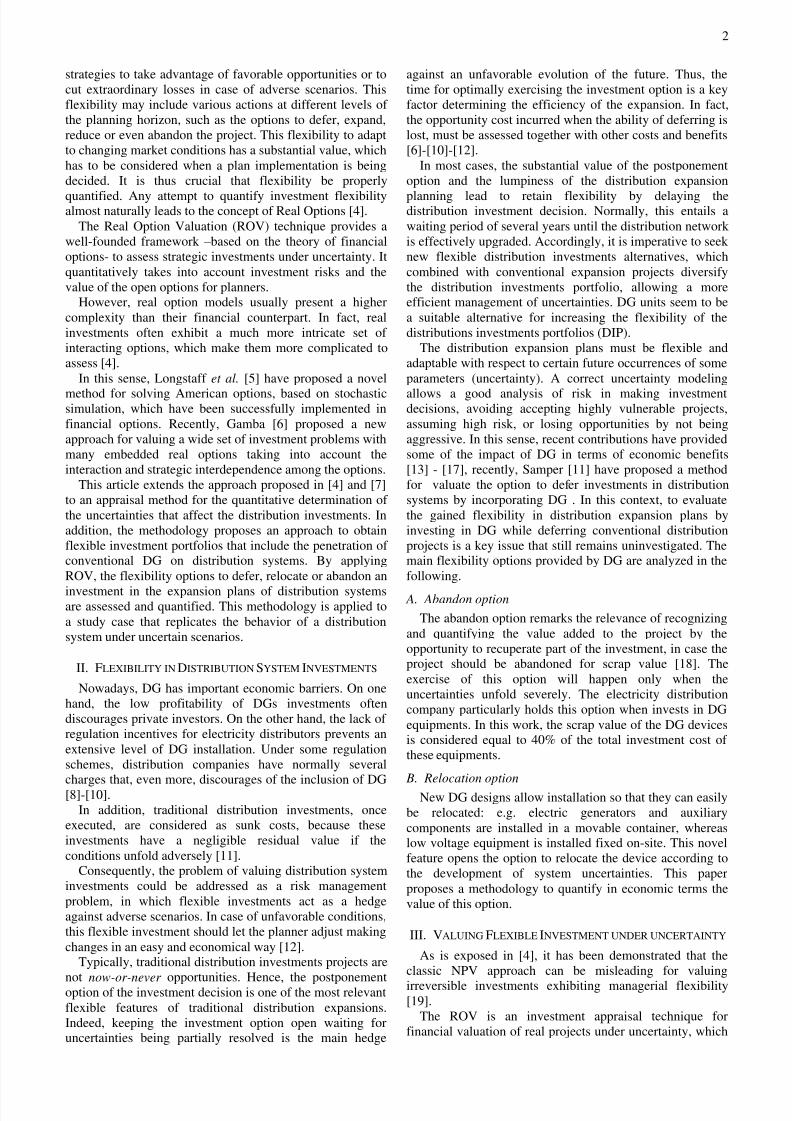
The abandon option remarks the relevance of recognizingand quantifying the value added to the project by theopportunity to recuperate part of the investment, in case theproject should be abandoned for scrap value [18]. Theexercise of this option will happen only when theuncertainties unfold severely. The electricity distributioncompany particularly holds this option when invests in DGequipments. In this work, the scrap value of the DG devicesis considered equal to 40% of the total investment cost of these equipments.
B. Relocation option
New DG designs allow installation so that they can easilybe relocated: e.g. electric generators and auxiliarycomponents are installed in a movable container, whereaslow voltage equipment is installed fixed on-site. This novelfeature opens the option to relocate the device according tothe development of system uncertainties. This paperproposes a methodology to quantify in economic terms thevalue of this option.
III. VALUING FLEXIBLE INVESTMENT UNDER UNCERTAINTY
As is exposed in [4], it has been demonstrated that theclassic NPV approach can be misleading for valuing
irreversible investments exhibiting managerial flexibility[19].
The ROV is an investment appraisal technique forfinancial valuation of real projects under uncertainty, which
8/7/2019 Valuing Investments in Distribution Networks with DG under Uncertainty
http://slidepdf.com/reader/full/valuing-investments-in-distribution-networks-with-dg-under-uncertainty 3/8
3
applies methods derived from finance theory to thevaluation of capital investments. The real options arise fromdegrees of freedom which a decision maker has available,i.e. contingent claims upon future events [20].
In the early stages of the ROV, valuation was normallyconfined to a limited set of options for which the financialoption solutions could directly be applied. Thisstraightforward application was done mainly using few
underlying assets and simple options with European featuresor American perpetual options [21]. However, an investor isnormally faced with a significant opportunity set. Henceinvestment projects are a portfolio of options; frequentlylinked to several stochastic variables.
The introduction of multiple interacting options into thereal options models increases the difficulty of solving them,making traditional numerical approaches unfeasible.Nevertheless, simulation approaches for successfullysolving multiple American options have been proposed. Oneof the most promising approaches is the Least Square MonteCarlo (LSM) method proposed by Longstaff and Schwartz[5].
LSM method is based on Monte Carlo simulation whichdetermines the optimal stopping time in the making decisionprocess by using least squares linear regression to.Moreover, this approach has the feature of being an intuitiveand flexible tool.
Recently, Gamba [6] presented an approach whichextending the LSM approach decomposes complex multiplereal options (with interacting options) into simplehierarchical sets of individual options. The decompositionprinciple can be used by applying any kind of methodologybased on dynamic programming and Bellman equation [19].
Hence, the main contribution of this work is a new way tomap a complex real option problem in distribution system
investments into a set of plain options and a way to complywith the hierarchical structure of the options.
A. The Least Square Monte Carlo approach framework
The value of an American option, with payoff ( , X ),
that can be exercised from t until T is:
* ( )( , ) max ( , ).(1 ) t t
F t X X r (1)
where is the optimal stopping time ( [t, T ]) and*t [.] denote expectation conditional on the information
available at t . The discount factor between two consecutive
periods is1(1 )df r , where r is the hurdle rate.
As is exposed in [9], the LSM approach proposed aMonte Carlo simulation algorithm to value the option
described by the equation (2). That equation can be
expressed in a discrete way dividing the time of the maturity
(T ) in discrete intervals. Then the underlying asset
evolution is simulated following paths. Regarding that
option can only be exercised in discrete times, into the
interval [ ].Hence, the optimal stopping policy is obtained using the
Bellman`s principle of optimality: ―An optimal policy has
the property that, whatever the initial action, the remaining
choices constitute an optimal policy with respect to the sub-
problem starting at the state that results from the initial
action‖ [13]. This principle can be stated as:
1
*1( , ) max{ ( , ), ( , ) . }
n n n n n t n t t n t
F t X t X F t X df (2)
Expressing the continuing value by:
1
*1( , ) ( , ) .
n n n n t t n t
t X F t X df (3)
with:
( , ) 0T
T X (4)
The optimal stopping time on each path (τ ( )), is defined,
beginning at and moving backwards, and applying the
following rule:
if ( , ( )) ( , ) then ( )=n n
n t n t n t X t X t (5)
The options are no longer available at the maturity time,
therefore, the continuation value equals zero. Prior to T at
t n , the option holder should compare the payoff from the
immediate exercise ( ( , )n n t t X ), with the continuation
value ( ( , )n n t t X ). When the decision rule (5) holds the
stopping time () is updated. The value of the American
option is then estimated as the media of the values over all
paths:
( ( ))( )
1
1(0, ) ( ( ), ).(1 )
w
F x X r (6)
Finally, the problem boils down to one of calculating theexpected continuation value at (t, X t ), in order to apply thecondition (5). At this point, the LSM makes its maincontribution; this method computed the continuation for allprevious time-stages by regressing the discounted futureoption values on a linear combination of functional forms of current state variables. Regarding that the way thesefunctional forms is not evident, the most commonimplementation of the method is simple powers of the statevariable (monomial) [5], [6], [21].
As is shown in [23], let Lj , with j =1,2,…,J be the
orthonormal basis of the state variable X t used as regressors
to explain the realized present value in the -th realization,
then the least square regression is equivalent to solving the
following optimization problem :
2
11 1
min ( 1, ( )). ( ( ))J
t j j t w j
t X df L X (7)
Finally, the optimal coefficients * are used to estimate the
expected continuation value * , ( )t t X :
* *
1
( , ( )) ( ( ))J
t j j t j
t X L X (8)
Working backwards until t =0, the optimal decision
policy on each path -the maximum value between theimmediate exercise and the expected continuation value- is
estimated.
B. Multi-option problems
As aforementioned, Gamba in [6] has presented anextension of the LSM method to value independent,compound and mutually exclusive options. According tothat approach, it can be defined [22]:Independent option: The value of a portfolio of independent options is the sum of individual options,computed by the LSM. Only in this case, value additivityholds, even when the underlying assets are not independent.
Compound Option: Let a portfolio of H compoundedoptions, where the execution of h -th option origins the right
to exercise the subsequent (h+1)-th option. The payoff
( , )h t t X of the h -th, must taken into account the value of

8/7/2019 Valuing Investments in Distribution Networks with DG under Uncertainty
http://slidepdf.com/reader/full/valuing-investments-in-distribution-networks-with-dg-under-uncertainty 4/8
4
the option (h+1)-th. These options are valued applying the
LSM approach. Therefore, the value of option portfolio can
be calculated according to:
*1
[ , ]( , ) max { ( , ) ( , ) . }
n h
h t t h h t T
F t X X F X df (9)
Hence, the Bellman equation for this kind of real optionportfolio can be stated by:
1
1
*1
( , ) ( , ),( , ) max
( , ) .
n n
n
n n
h n t h n t
h n t t h n t
t X F t X F t X
F t X df (10)
Mutually Exclusive Options: A set of options are mutually
exclusive when the exercise of one of them eliminates the
chance of execution of the remainder. Classic examples of
that sort of options are the expansion and abandon options.
Thus, the problem is extended to find both the optimal
stopping and the optimal option. Consequently, the control
is a bi-dimensional variable ( ), where τ is a stopping time
in [t, T h ] and 1, 2, …, H . The value of the portfolio
option, composed of H mutually exclusive options, is:
*
( , )( , ) max ( , ) .
n t t
G t X F X df (11)
The Bellman equation of a portfolio of mutually exclusiveoptions is given by:
1
1
*1 1
( , ), , ( , ),( , ) max
( , ) .
n n
n
n n
n t H n t
h n t t h n t
F t X F t X
G t X G t X df
(12)
Each F h (t h ,X h ) and the continuation value ( n) are
estimated by the LSM approach exposed before.
IV. VALUATION OF FLEXIBLE INVESTMENT PORTFOLIOS IN
DISTRIBUTION SYSTEMS (IPD) INCLUDING DG UNITS
As initial premise, this research considers the use of DGtechnology that uses fossil fuels as primary resource: theInternal Combustion Engines (ICE). Diesel GeneratorEngine in specific. This technology is chosen mainly by thehighly diffusion in the global context, by the relativelysmaller installation costs compared with anothertechnologies, for their flexibility in modularity, scalabilityand short construction times. These DG units have a widerange of generation capacity, from some few kW until 10MW and low times of startup and shutdown [24].
The Flexible Investment Portfolios in Distribution System(IPD) value is defined by the profit of the distribution
system operator (DSO), it is quantified through themaximization of their profit which is given by the differencebetween the return of the DSO and the investment andoperation costs (including violation penalties of allowablevoltage levels and values of ENS). These operation costs arerelated to the penetration of DG in the distribution network.
The proposed methodology essentially consists in amodel divided in two main modules. These modules are thefollowing:
A. Technical-economic analysis module
This research develops the mathematical algorithms forassessment of IPDs considering diesel DG units
performance under uncertainty on futures scenarios.In this module, the uncertain behavior of the powermarket is simulated through the Monte Carlo method.
The evolution of significant uncertain variables will bemodeled through proper stochastic processes, which aresummarized below:Demand growth rate: As is exposed in [4], electricitydemand is one of the key factors in the performance of distribution systems and their investments.
This paper considers three blocks of demand (peak,medium and low), and the duration of each block is assumed
constant during the evaluation. The demand evolution oneach area of the electrical system is modeled as a function of the stochastic growth rate. This growth rate is modeled as amultivariate stochastic process including the correlationamong geographic areas of the system [4]. The multivariatestochastic process of the growth rate is exposed asfollowing:
1, 1, 1,
, , ,
( ) ( ) ( )
( ) ( ). . ; ( )
( ) ( ) ( )
j
j j j p m l
j j R
j j j n p n m n l
R t R t R t
dR t t dt dW R t
R t R t R t
(13)
where: ( )j R t is the vector of stochastic growth rates at the
time t and j -th realization, , ( )j n pR t , , ( )j n m R t and
,( )
j
n lR t growth rates in peak demand, medium demand and
low of the n -th instant t in the j -th realization respectively
and ( )j Rt representing vector drift instant t . The vector of
the Wiener process in t of the j -th realization is represented
by dW . is defined by an n xn lower triangular matrix,
which satisfy = . T , where is given by n xn covariance matrix T. . . is the diagonal matrix of
variances, with 2( , ) ( )i i i (the variance of i ), and
the matrix of correlations between areas, with,( , ) i j i j
(the correlation between electrical areas i and j ).Electricity price and Generation cost: This paper regards
a diesel generation system as an alternative energy source.The DSO’s energy purchase price and fuel price aremodeled by a mean reversion stochastic process [25].
( ) ( ( ))F p
F F F dp t p p t dW (14)
where is the speed of reversion to the mean, F p is the
volatility of energy/fuel prices, andF
p is the normal level
of the energy/fuel price (pF ), i.e. the level to which pF tends
to revert.The cost of generating a diesel generation unit typically
includes fuel costs. Commonly, this cost is linked with thefuel prices through the input-output function of thegenerating unit (IO [MBtu/h]), according to the following
expression [26]:
0 1( ( ), ( )) ( . ( )). ( )
( ( ), ( )) ( ( )). ( )
F F
F F
C q t p t a a q t p t
C q t p t IO q t p t (15)
where ( ( ), ( ))F C q t p t is the generation cost at a production
level of q (t) [MW] and a fuel price of pF (t).
Electric system components availability: For the
analysis of reliability index of radial distribution circuits, it
is possible to use a matrix analysis that would provide a
practical way to consider the various indicators of time
involved in the identification, isolation, and repair and
restore service to failed areas.
For it, it is necessary to obtain the reliability index of eachcomponent of the distribution system, based on historical
data or equations. The failure rates per year are considered,

8/7/2019 Valuing Investments in Distribution Networks with DG under Uncertainty
http://slidepdf.com/reader/full/valuing-investments-in-distribution-networks-with-dg-under-uncertainty 5/8
5
λ, time of repair, tr , in hours, switching time ts , in hours and
transfer time tt , also in hours.Finally, the reliability states matrix is determined for the
considered operation topology in the network. All elementsare represented by their reliability parameters.
Based on the simplified reliability states matrix, and
assuming historical data of events of the grid, it is simple to
determine failure rates and non-availability service, per year
[27]-[29].Subsequently, in this module are performed power flow
(PF) calculations, to obtain the system performance
indicators, which quantify losses, voltage levels and
expected energy not served (EENS) for each load scenario
and each expansion project. The cost difference between the
base and the investment scenarios defines the underlying
asset (the incremental DSO Profit) which is assessed in the
next module.The PF is computed using the power system simulation
software Matpower 3.2 [30], modified to introduce DG unitsin the distribution system.
B. Financial analysis module
This module evaluates the present value of the DSObenefit (DSOb) generated by the difference between theDSO profits (Result of the energy sale, considering theenergy sales tariff constant for the entire simulation period)and the investment execution.
At first, the cash flows of the DSOb, is discounted by thefinancial cost of the investment (WACC , Weight AverageCost of Capital), according to the following expression:
, ,, ,
8760
, , , , ,1
( )( ) ;
(1 )
( ) ( )
T s k j
s k j i i k
s k j i h j inv h
DSOb i PV DSOb
WACC
DSOb i NIDSO
(16)
where NIDSOi,h,j,inv are the net income of the operation forinvestment case, DSObs,k,j (i) is the DSO benefit,PV (DSObs,k,j)is the present value of the DSOb executing theportfolio investment in year k and T the investment term. Ineach case, the variables correspond to the h-th hour, i-th
year, j-th realization of the Monte Carlo simulation of powersystem operation and the s-th investment strategyrespectively.
Afterwards, considering PV(DSObs,k,j) as the underlyingasset, the ROV is applied in order to evaluate the strategic
flexibility embedded in both investment alternatives, i.e. thepostponement option in traditional distribution expansionsand the DG-related options in those cases where theinvestment project include these controllers. Finally, risk-yield indices are utilized to identify the efficient investmentportfolio.
In order to explain the evaluation procedure, for sake of simplicity, it is assumed two expansion alternatives: a DGunits and a Distributed Feeders (DF), these alternativesremain open for M years. Thus, the decision that the investorshould take is:
To invest in the DG units first,
To invest in the DF first or,
To invest in the DG and DF jointly.These possibilities are mutually exclusive options, with a
maturity of M years.
Note that it is possible to initially invest in any of the firsttwo options and then in successive years prior to theexpiration of the option, invest in the other. This means thatthe execution of any of the two alternatives (DG or feeder)separately creates the option of investing in the otheralternative afterwards. This is the flexibility of investment instages and must be considered in the assessment.
Additionally, the DG alternative has the option of
abandon, which allows the investor to sell the DG units at itsscrap value.
Below are exposed Bellman equations for the evaluationof the options:
Option to invest first in the DG (S 1):
1
1
1
1
1
1
1
*1
max max
( , )
( , )
( , ) ; ( , )
; ( , )
; ( , )
n
n
n n
n
n n
DG n t
R n t
F n t A n t
DG DF n t
t DG n t
t X
F t X
F t X F t X df
F t X
F t X df
(17)
Option to invest first in the DF (S 2 ):
1
1
1
*1
max
( , )
( , ) ( , ) ;
( , )
n
n n
n n
DF n t
DF DF n t DG n t
t DF n t
t X
F t X F t X df
F t X df
(18)
Option to invest in the DG & DF jointly (S 3 ):
&
&
1& &
1
& 1
1
1
*1
max max
( , )
( , );( , )
( , )
; ( , )
n
n
n
n
n n
DF DG n t
DF DG R n t
DF DG n t DF DG A n t
t DF DG n t
t X
F t X F t X df
F t X
F t X df
(19)
where ( , )n
n m n t
F t X is the option value and ( , )n
n m n t
t X the
profit value, for the option m (DG : DG units, DF :Distributions Feeders, R: DG Relocation, A: DG Abandon)
at the state n (DG : DG investment done, DF : Distribution
Feeders investment done, Ab: DG Abandon done).
Expanding (17) yields:
1
1
1
*1
max max
( , )
( , );( , ) ;
( , )
( , )
n
n
n
n
n n
R n t
RDF n t
R n t A n t
t R n t
t X
F t X F t X
F t X df
F t X df
(20)
1
*1
max( , ) ( , );
( , )( , )
n n
n
n n
AA n t DF n t
A n t
t A n t
t X F t X F t X
F t X df (21)

8/7/2019 Valuing Investments in Distribution Networks with DG under Uncertainty
http://slidepdf.com/reader/full/valuing-investments-in-distribution-networks-with-dg-under-uncertainty 6/8
6
&
1
&
1
1
1
1
*1
max max
( , )
( , );( , )
( , )
; ( , )
n
n
n
n
n n
DG DF n t
DF DG R n t DG
DF n t DF DG Ab n t
DG t DF n t
t X
F t X F t X df
F t X
F t X df
(22)
Similarly, expanding (18) and (19):
&
1
&
1
1
1
1
*
max max
( , )
( , );( , ) ;
( , )
( , )
n
n
n
n
n n
DF DG n t
DF DG R n t DF
DG n t DF DG Ab n t
DF t DG n t
t X
F t X F t X df
F t X
F t X df
(23)
&
& &
1
&1
,1
* 1
max
( , )
( , ) ( , ) ;
( , )
n
n n
n n
DF DG R n t
DF DG DF DG RR n t Ab n t
DF DG t R n t
t X
F t X F t X df
F t X df
(24)
&
&
&1
1
*1
max
( , );( , )
( , )
n
n
n n
DF DG A n t DF DG
A n t DF DG t A n t
t X F t X
F t X df (25)
The profit function in the investment cases is given by:
, , , ,( , ( )) ( )n n n
n m n t s t s t
t X PV DSOb I (26)
where , ,n
s t I is the investment cost of the s –th investment
strategy at the t n – th year. On the other hand, in the
relocation and abandon cases, the profits are computed by:
, , , ,( , ( )) ( )n n n
n R n t R t R t
t X PV DSOb C (27)
, , ,( , ( )) ( )n n n
n A n t t s t
t X SV PV DSOb (28)
where, ,
n R t
C is the relocation cost and,
n t
SV is the scrap
value of the DG unit at then
t – th year. Finally, the LSM
approach is applied for solving the RO problem.For solving these real option problems, the LSM
approach is applied and the value of the options available iscalculated.
It can be noted that the flexibility added by the DGappears only when the investment is executed and itsstrategic flexibility is available after the investmentexpenditure has been realized. For this reason, these optionsreinforce the investment signal of immediate execution.Thus, the alternatives with DG allow making investment instages, retaining flexibility for managing uncertaintiesduring the whole planning horizon.
On the contrary, in alternatives where these options are
not available (only the deferring option is present), the huge
volatility of the investment performance and the fact that the
flexibility is lost in the moment of the investment execution
increase the value of the postponement option. This suggests
that planners should ―wait and see‖ until a substantial
portion of the uncertainty is resolved.Following, a detailed numerical example built on an
actual setting, demonstrates the importance of consideringthe value of flexibility when assessing distribution systeminvestments.
V. VALUING FLEXIBLE INVESTMENT EXPANSION. NUMERICAL EXAMPLE
For the sake of clearness the proposed approach is tested
into a simple 13 Node IEEE test feeder. In this test system
two investment alternatives are evaluated; Alternative 1:
new 13.2 kV AlAc120 DF of 2 km between nodes 650 and 632, new 13.2 kV AlAc95 DF of 2 km between nodes 632
and 671, and new 13.2 kV AlAc70 DF of 1 km betweennodes 671 and 684, Alternative 2: a diesel DG of 2 MWconnected in node 671. DG unit operates only in peak load
hours. The test system summarized above is shown in
Figure 1.
Then, there are three mutually exclusive options
(strategies), which must be evaluated:
to invest in the DG units first (S 1),
to invest in the Distribution Feeders first (S 2 ) or,
to invest in the DG and DF jointly (S 3 ),In Table I, reliability parameters of system component are
given, as they are necessary for taking into account theiravailability in the investment evaluation.
Fig. 1. Test System and investment alternatives.
TABLE I. RELIABILITY PARAMETERS OF SYSTEM COMPONENTS
Parameter Main Feeders Derivations DG
[f/km-y] 0.200 0.700 0.225
tr [h] 5.000 8.000 3.000
TABLE II. GENERATOR COST PARAMETERS
Generator a0 a1 pF(0) Fp
Fpσ
DG Diesel 3598 210.97 0.85 0.95 0.167
Table II provides the DG parameters needed for
performing the generation cost evolution over the
investment horizon.
The initial investment including installation costs for the
DG per kW are given by [31]:
0.8496DG,kW 2302* ([kW])I
(29)
The load duration curves of each load remain constantover the planning period and it has been discretized asillustrated in Table III. As well probabilistic parameters forsimulating its annual growth are exposed.
Distribution system parameters are obtained from [28]
and [29].Under energy deficit scenarios, the value of energy not
supplied (ENS) is calculated as the portion of load that mustbe curtailed such that the flowing current through the feeder
8/7/2019 Valuing Investments in Distribution Networks with DG under Uncertainty
http://slidepdf.com/reader/full/valuing-investments-in-distribution-networks-with-dg-under-uncertainty 7/8
7
does not exceed the value of Imax. In this case, the value of VOLL (Value of Lost Load) has been assumed as 500$/MWh. It is considered as maturity of all investmentsoptions 3 years and 15 years as investment horizon. Leadconstruction time is assumed to be one year and discountrate is set to 10%/yr for all possible expansion projects.
TABLE III. LOAD PARAMETERS [27]
Bus PPeak[MW]
PMed[MW]
PLow[MW]
Load Dur [h] R(0)
671 1.080 0.8100 0.5184 PPeak 4 3% 2.28%
633 0.980 0.7350 0.4704 PMed 12 2% 5.33%
645 0.225 0.1687 0.1080 PLow 8 4% 3.33%
646 0.260 0.1950 0.1248
675 0.725 0.5437 0.3480
680 0.225 0.1687 0.1080
611 0.240 0.1800 0.1152
652 0.165 0.1237 0.0792
TABLE IV. DISTRIBUTION FEEDERS INVESTMENT COSTS.
Voltage Type Fixed Costs $/km
13.2 kV
AlAc120 22232.5030
AlAc95 21694.6443
AlAc70 20515.3903
Costs of distribution feeders as indicated in Table IV.Once stated these assumptions, the cited problem
becomes a decision-making one which involves finding asequences of distribution projects and flexible decisions bysolving a real option problem according to the proposedframework (Eq. 17 to 19).
As a result of this analysis, it is determined thatS1 is thebest decision, unlike the decision suggested by the
traditional investment evaluation approach (NPV) S3 (seeTable V).
From these results, the flexibility value of eachinvestment strategy can be calculated according to thefollowing expression [32] (See Table V):
Option Value = NPV + Flexibility value (30)
Taking the volatility of the option value of eachinvestment strategy as a measure of its risk, the risk profilecan be obtained applying yield/risk indices. Thus, theefficient investment portfolios can be identified, i.e. thosethat maximize return at certain risk level.
TABLE V. RANKING OF STRATEGIES BY APPLYING THE PROPOSED
EVALUATION APPROACH
Strategy
(unit) Expected
Option Value
(M$)
Expected
NPV value
(M$) invest in DG
(S1)17.22 (1st) -1.35 (3nd)
invest in DF(S2)
13.67 (2nd) 5.2708 (2st)
invest inDG&DF (S3)
11.249 (3rd) 9.354 (1rd)
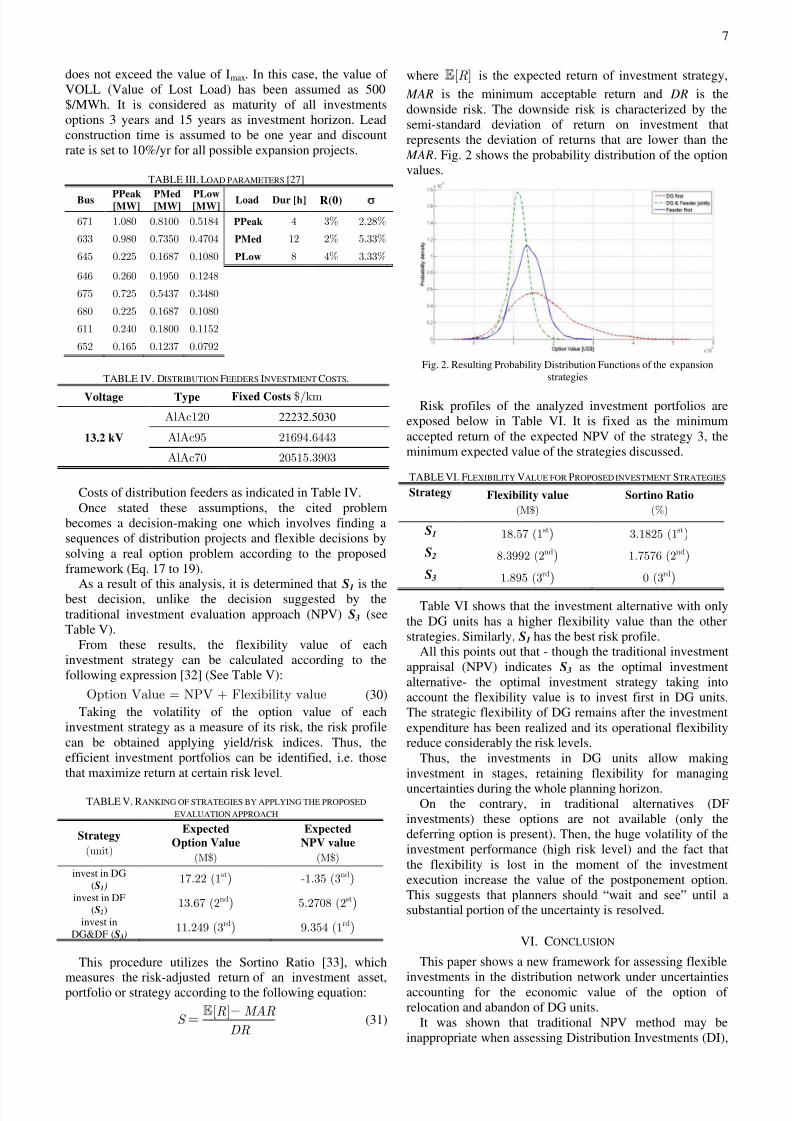
This procedure utilizes the Sortino Ratio [33], which
measures the risk-adjusted return of an investment asset,portfolio or strategy according to the following equation:
[ ]R MARS
DR(31)
where R[ ] is the expected return of investment strategy,
MAR is the minimum acceptable return and DR is thedownside risk. The downside risk is characterized by thesemi-standard deviation of return on investment thatrepresents the deviation of returns that are lower than theMAR. Fig. 2 shows the probability distribution of the optionvalues.
Fig. 2. Resulting Probability Distribution Functions of the expansionstrategies
Risk profiles of the analyzed investment portfolios areexposed below in Table VI. It is fixed as the minimumaccepted return of the expected NPV of the strategy 3, theminimum expected value of the strategies discussed.
TABLE VI. FLEXIBILITY VALUE FOR PROPOSED INVESTMENT STRATEGIES
Strategy Flexibility value
(M$) Sortino Ratio
(%)
S1 18.57 (1st) 3.1825 (1st)
S2 8.3992 (2nd) 1.7576 (2nd)
S3 1.895 (3rd) 0 (3rd)
Table VI shows that the investment alternative with onlythe DG units has a higher flexibility value than the otherstrategies. Similarly, S1 has the best risk profile.
All this points out that - though the traditional investmentappraisal (NPV) indicates S3 as the optimal investmentalternative- the optimal investment strategy taking intoaccount the flexibility value is to invest first in DG units.The strategic flexibility of DG remains after the investmentexpenditure has been realized and its operational flexibilityreduce considerably the risk levels.
Thus, the investments in DG units allow makinginvestment in stages, retaining flexibility for managing
uncertainties during the whole planning horizon. On the contrary, in traditional alternatives (DF
investments) these options are not available (only thedeferring option is present). Then, the huge volatility of theinvestment performance (high risk level) and the fact thatthe flexibility is lost in the moment of the investmentexecution increase the value of the postponement option.This suggests that planners should ―wait and see‖ until asubstantial portion of the uncertainty is resolved.
VI. CONCLUSION
This paper shows a new framework for assessing flexible
investments in the distribution network under uncertaintiesaccounting for the economic value of the option of relocation and abandon of DG units.
It was shown that traditional NPV method may beinappropriate when assessing Distribution Investments (DI),

8/7/2019 Valuing Investments in Distribution Networks with DG under Uncertainty
http://slidepdf.com/reader/full/valuing-investments-in-distribution-networks-with-dg-under-uncertainty 8/8
8
since the presence of uncertainties dramatically increases therisk involved in large-scale irreversible decisions. Flexibilityfor reassess, relocate or abandon a DI project in light of unfolding information is valuable in such an uncertainenvironment.
The option values have their source from the fact thatthey define a floor against possible project losses. In thissense, a RO framework has been developed, using the novel
LSM approach for solving the optimization problem.In a study case has been verified that flexible investment
strategies and improved adaptability levels to the uncertainscenarios might be obtained by strategically mixing DG andDFs investments along the planning horizon.
These expansion alternatives induce the investmentexecution in stages instead of only deferring DF projects.Thereby, a proper tradeoff between large DG investmentsand flexibility offered by DG can be achieved, which wouldallow a progressive adaptation of the distribution grid to theuncertain long-term development of power markets.
VII. REFERENCES
[1] H. Rudnick, A. Arnau, S. Mocarquer, E. Voscoboinik. ―SimulattingEfficient Distribution‖. IEEE Power & Energy Magazine. 2007.
[2] D. Midence. ―Distribution System Planning Considering the SocialBalance of Supply Quality‖. Ph.D. Dissertation. Universidad Nacionalde San Juan. Facultad de Ingeniería. Instituto de Energía Eléctrica.2008.
[3] A-M. Borbely, and J. Kreider, ―Distributed Generation. The PowerParadigm for the New Millennium‖. CRC Press LLC. 2001.
[4] G. Blanco, F. Olsina, O. Ojeda, and F. Garcés. ―Transmission
expansion planning under uncertainty – The role of FACTS inproviding strategic flexibility‖. POWER TECH 2009 IEEE PESBucharest, Romania – Paper 610.
[5] F. Longstaff and E. Schwartz. ―Valuing American options bysimulation: a simple least-squares approach,‖ The Review of Financial
Studies, vol. 14(1), pp. 113– 47, 2001.[6] A. Gamba. ―Real Options Valuation: a Monte Carlo Approach,"
University of Verona, pp. 1-49, 2003.[7] G. Blanco, F. Olsina., F. Garcés, C. Rehtanz, Evaluation of FACTS
devices flexibility through a Least Square Monte Carlo Real Optionapproach, IEEE Trans. Power Syst . TPWRS-00168-2010 (underreview).
[8] W. El-Khattam, M. M. A. Salama. ―Distributed GenerationTechnologies, Definitions and Benefits‖. Electric Power SystemResearch. Elsevier. 2004.
[9] M. Dicorato, G. Forte, M. Trovato. Environmental-constrainedEnergy Planning Using Energy-efficiency and Distributed-GenerationFacilities. Renewable Energy. Elsevier. 2007.
[10] S. Rivera, A. Vargas. ―Methodological Basis to Decide Short-termInvestments in Distribution Systems under Uncertainty inPerformance-based Regulatory Frameworks‖. International Journal of Global Energy Issues. Vol.28. No 1. Pp.88-110. 2007.
[11] M. Samper. ―Análisis de Riesgos de Inversiones Flexibles en el
Planeamiento de Espansión de Redes de Distribución, considerandoGeneración Distribuida‖. Doctoral Thesis Proposal, IEE-FI-UNSJ,July 2008.
[12] P. Vázquez, F. Olsina. ―Valuing Flexibility of DG Investments in
Transmission Expansion Planning‖. Power Tech Proceedings, 2007
IEEE Switzerland , pp. 1-6, Jul.2007.[13] J. Barrionuevo, M. Samper, A. Vargas: ―Valoración del Impacto de la
Generación Distribuida en el Planeamiento de la Expansión deSistemas Eléctricos de Distribución‖. VII CLAGTEE (VII Latin-american congress on electricity generation and transmission), Viñadel Mar - Chile, October 2007.
[14] L. Ochoa, A. Padilha-Feltrin, G. Harrison: ―Evaluating Distributed
Generation Impacts With a Multiobjective Index‖. IEEE Transactions
on Power Delivery, Vol.21, No.3, July 2006.[15] H. Gil, G. Joos: ―On the Quantification of the Network Capacity
Deferral Value of Distributed Generation‖. IEEE Transactions on
Power Systems, Vol.21, No.4, November 2006.[16] P. Evans: ―Optimal Portfolio Methodology for Assessing Distributed
Energy Resources Benefits for the Energynet‖. California Energy
Commission, IEPR Committee Workshop Distribution Planning andthe Role of DER, PIER Projects CEC-500-2005-061-D, Apr 2005.
[17] C. Burns, P. Barker, T. Short: ―Unconventional Solutions for RuralUtilities‖. Transmission & Distribution World, December 2006.
[18] S. C. Myers and S. Majd, 1990, ―Abandonment Value and Project
Life‖, Advances in Futures and Options Research, 4, pp.1-21.[19] A. Dixit, R. Pindyck. ―Investment under Uncertainty‖, Princeton
University Press, pp. 93-125, 1994.[20] R. Brosch. ―Portfolio-aspects in real options management,‖ Working
paper series: finance & accounting, J.W. Goethe-University, No.61,ISSN1434-3401, February 2001.
[21] A. Rodrigues, M. Rocha. ―The Valuation of Real Options with the
Least Squares Monte Carlo Simulation Method,‖ ManagementResearch Unit, University of Minho, Portugal, Feb. 2006.
[22] A. Rodrigues and M. Rocha, ―The Valuation of Real Options with the
Least Squares Monte Carlo Simulation Method,‖ ManagementResearch Unit, University of Minho, Portugal, Feb. 2006.
[23] G. Cortazar, G. Gravet, J. Urzua. ―The valuation of multidimensional
American real option using the LSM simulation method,‖ Computers& Operations Research, vol. 35, pp. 113-129, Jan. 2008.
[24] K. Skytte, S. Ropenus. ―Assessment and Recommendations – Overcoming in Short-Term Grid System Regulatory and otherBarriers to Distributed Generation, report D2 in the DG-Grid project‖.December 2006. Available online at http://www.dg-grid.org/.
[25] G. Fishmerman, Monte Carlo: Concept, Algorithms and Applications,New York: Springer 1996, pp. 21-234.
[26] C. Weber, Uncertainty in the electric power industry, Springer, 2005.[27] IEEE Distribution Planning Working Group Report, ―Radial
distribution test feeders‖, IEEE Transactions on Power Systems,,August 1991, Volume 6, Number 3, pp 975-985.[28] R. Billinton, R. Allan. ―Reliability Evaluation of Power Systems‖,
Plenum Press, New York, 1996.[29] P. Wang, R. Billinton. ―Time-secuential Simulation Technique for
Rural Distribution System Reliability Cost/Worth EvaluationIncluding Wind Generation as Alternative Supply‖. IEEE Proc.-Gener. Transm. Distrib., Vol. 148, No. 4, July 2001.
[30] R. Zimmermann, C. Murillo-Sánchez, D. Gan. ―Matpower a Matlab
power system simulation package‖ User ́s Manual 3.2, av. online enhttp://www.pserc.cornell.edu/matpower/manual.pdf, 2007.
[31] L. Schienbein, P. Balducci, T. Nguyen, D. Brown, J. DeSteese, G.Speer. ―Avoiding Distribution System Upgrade Costs UsingDistributed Generation‖. DistributTECH Conference and Exhibition.January 2004.
[32] S. Olafsson. ―Making Decision under uncertainty – implication forhigh technology investment,‖ BT Journal. Vol. 22 No.2, 2003.
[33] A. Chaudhry, H. Johnson. ―The Efficacy of the Sortino Ratio and
Other Benchmarked Performance Measures under Skewed ReturnDistributions,‖ Australian Journal of Management , Vol. 32, No. 3,Special Issue, March 2008.
VIII. BIOGRAPHIES
Enrique Buzarquis obtained the Electromechanical Engineer degree fromthe National University of Asunción, Paraguay in 2004. Currently he isworking toward a PhD degree at Institute of Electrical Energy (IEE),National University of San Juan (UNSJ). His research interests are powerinvestment under uncertainty, and DG in distribution systems. Gerardo A. Blanco (SM’08) obtained the Electromechanical Engineerdegree from the National University of Asunción, Paraguay in 2004, andthe Ph.D. degree from Institute of Electrical Energy (IEE), NationalUniversity of San Juan (UNSJ), Argentina in 2010. He was visitingresearcher at the Institute of Power System & Power Economics, TUDortmund, Germany. Presently, Dr. Blanco is full-time professor of thePolytechnic Faculty, National University of Asunción, Paraguay. Hisresearch interests are power investment under uncertainty & risk management.Fernando G. Olsina obtained the Mechanical Engineering degree in 2000from the National University of San Juan (UNSJ) and the Ph.D. degree inElectric Power Engineering in 2005 from the Institute of Electrical Energy(IEE), UNSJ. Argentina. He was Visiting Researcher at IAEW, the RWTHAachen, Germany and at Lehrstuhl für Energiewirtschaft (EWL) atUniversität Duisburg-Essen, Germany. Presently, Dr. Olsina is member of the Argentinean Research Council (CONICET). His research interestsfocuses on power market modeling, reliability evaluation of power systems,stochastic price simulation and investments under uncertainty.Francisco F. Garcés obtained the Electromechanical Engineering degreefrom the University of Cuyo, Argentina, in 1974 and the Dr.-Ing. degree
from the Aachen University of Technology (RWTH), Federal Republic of Germany, in 1982. Presently is a Vice-Director of the Institute of ElectricalEnergy (IEE), National University of San Juan, Argentina and Head of theReliability & Risk Management Group. His main research interests arepower system reliability and reserve calculations.