valuing the protection service provided by mangroves in ... · valuing the protection service...
TRANSCRIPT
Valuing the Protection Service Provided by Mangroves in Typhoon-hit Areas in the PhilippinesMoises Neil Seriño, Julie Carl Ureta, Jayson Baldesco, Karl John Galvez, Canesio Predo, and Eunice Kenee Seriño

Published by WorldFish (ICLARM)– Economy and Environment Program for Southeast Asia (EEPSEA)EEPSEA Philippines Office, SEARCA Bldg., College, Los Baños, Laguna 4031 PhilippinesTel: +63 49 536 2290 loc. 4107; Fax: +63 49 501 3953; Email: [email protected]
EEPSEA Research Reports are the outputs of research projects supported by the Economy and Envi-ronment Program for Southeast Asia. All have been peer reviewed and edited. In some cases, longer versions may be obtained from the author(s). The key findings of most EEPSEA Research Reports are condensed into EEPSEA Policy Briefs, which are available for download at www.eepsea.org. EEPSEA also publishes the EEPSEA Practitioners Series, case books, special papers that focus on research methodology, and issue papers.
ISBN: 978-621-8041-52-3
The views expressed in this publication are those of the author(s) and do not necessarily represent those of EEPSEA or its sponsors. This publication may be reproduced without the permission of, but with acknowledgement to, WorldFish-EEPSEA.
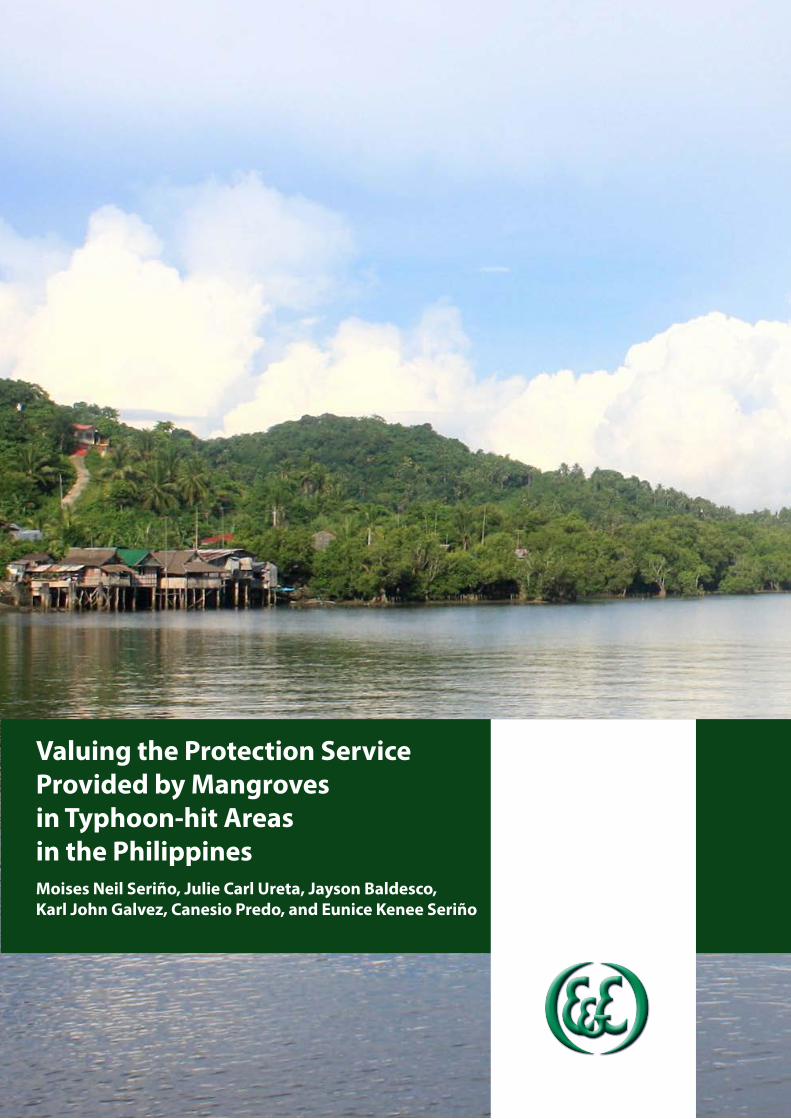
Front cover photo: Barangay Sabang, Baybay City, Leyte, Philippines Photo by Eunice Kenee L. Seriño
Suggested Citation: Moises Neil Seriño, Julie Carl Ureta, Jayson Baldesco, Karl John Galvez, Canesio Predo, and Eunice Kenee Seriño. 2017. Valuing the protection service provided by mangroves in typhoon-hit areas in the Philippines. EEPSEA Research Report No. 2017-RR19. Economy and Environment Program for Southeast Asia, Laguna, Philippines.
Valuing the Protection Service Provided by Mangroves in Typhoon-hit Areas
in the Philippines
Moises Neil Seriño Julie Carl Ureta
Jayson Baldesco Karl John Galvez
Canesio Predo Eunice Kenee Seriño
May, 2017

Comments should be sent to Asst. Prof. Moises Neil Seriño Department of Economics, Visayas State University Visca, Baybay City, Leyte 6521 Philippines Tel: +63-053-563-7751 Email: [email protected]
The Economy and Environment Program for Southeast Asia (EEPSEA) was established in May 1993 to support training and research in environmental and resource economics. Its goal is to strengthen local capacity in the economic analysis of environmental issues so that researchers can provide sound advice to policymakers.
To do this, EEPSEA builds environmental economics (EE) research capacity, encourages regional collaboration, and promotes EE relevance in its member countries (i.e., Cambodia, China, Indonesia, Lao PDR, Malaysia, Myanmar, Papua New Guinea, the Philippines, Thailand, and Vietnam). It provides: a) research grants; b) increased access to useful knowledge and information through regionally-known resource persons and up-to-date literature; c) opportunities to attend relevant learning and knowledge events; and d) opportunities for publication.
EEPSEA was founded by the International Development Research Centre (IDRC) with co-funding from the Swedish International Development Cooperation Agency (Sida) and the Canadian International Development Agency (CIDA). In November 2012, EEPSEA moved to WorldFish, a member of the Consultative Group on International Agricultural Research (CGIAR) Consortium.
EEPSEA’s structure consists of a Sponsors Group comprising its donors (now consisting of IDRC and Sida) and host organization (WorldFish), an Advisory Committee, and its secretariat.
EEPSEA publications are available online at http://www.eepsea.org.

ACKNOWLEDGMENT
This research endeavor will not be possible without the financial support and mentoring
of EEPSEA. The research team gratefully acknowledges the financial support provided by EEPSEA headed by Dr. Hermi Francisco. We also thank Dr. Jeffrey Vincent for his effort in supervising, mentoring, and monitoring the progress of our research study. We are grateful for his support and motivation even in the early conceptualization of the research proposal. We also thank the LGUs who accommodated our need for secondary data.

TABLE OF CONTENTS
EXECUTIVE SUMMARY 1
1.0 INTRODUCTION 1
1.1 Valuation of Typhoon Protection Service Provided by Mangroves 2
1.2 Status of Mangrove Forests in the Philippines 4
2.0 METHODS 5
2.1 Empirical Approach 5
2.2 Data and Data Collection 7
2.3 Study Area 8
3.0 RESULTS AND DISCUSSION 10
3.1 Status of Mangrove Cover in the Study Sites 10
3.2 Socio-demographic Characteristics of Coastal Villages 10
3.3 Typhoon-related Damage 15
3.4 Econometric Analysis on the Protection Service of Mangroves on Typhoon-related Damage
17
3.5 Highlights of the Focus Groups Discussions 27
4.0 CONCLUSION 28
REFERENCES 30
APPENDIX 34

LIST OF TABLES
Table 1. Comparison of average mangrove cover per coastal village in 2010 and 1944
13
Table 2. Average population, number of households, and land area in coastal villages
14
Table 3. Average income, urbanization and presence of protective structures in coastal villages
15
Table 4. Presence and estimated extent of coral reefs in coastal villages 15
Table 5. Total casualties in each province and average count of damaged houses per village
16
Table 6. Estimates of mangrove protection service from typhoon with number of deaths (including missing) as dependent variable using Poisson and negative binomial regression
19
Table 7. Estimates of mangrove protection service against typhoon with number of deaths (including missing) as dependent variable using clustered standard errors at municipality level
22
Table 8. Estimated average cost of saving a life by retaining mangrove cover in 2010 in Visayas, Philippines
24
Table 9. Estimates of mangrove protection service against typhoon with compensation paid on housing damage (totally and partially damaged) as dependent variable
26
LIST OF FIGURES
Figure 1. The path of super typhoon Haiyan 9
Figure 2. Historical map of Samar and Leyte islands with identified mangrove areas 9
Figure 3. Digitized historical mangrove map (1944) overlaid with typhoon path (Palawan, northern Cebu, northern Panay, Samar and Leyte) and mangrove cover in 2010
11
Figure 4. Difference in mangrove cover per coastal village per province from 1944 to 2010
13
Figure 5. Scatter plot of deaths per capita and percent mangrove cover in 2010 18
Figure 6. Scatter plot of totally damaged houses and percent mangrove cover in 2010
18
Figure 7. Scatter plot of partially damaged houses and percent mangrove cover in 2010
18
Figure 8. Focus group discussion in Barangay Jaena, Baybay, Leyte with participants mapping their houses and the locations of mangroves
29
Figure 9. Focus group discussion in Cogon, Palo, Leyte with participants sharing their typhoon experience
29

Valuing the Protection Service Provided by Mangroves in Typhoon-hit Areas in the Philippines 1
VALUING THE PROTECTION SERVICE PROVIDED BY MANGROVES IN TYPHOON-HIT AREAS IN THE PHILIPPINES
Moises Neil Seriño, Julie Carl Ureta, Jayson Baldesco, Karl John Galvez, Canesio Predo, Eunice Kenee Seriño
EXECUTIVE SUMMARY
Anecdotal evidence suggesting that mangroves provide protection against typhoon-related disasters in coastal communities are abundant in the literature. Empirical evidence on this protective function, however, is very limited. Hence, we empirically investigated the protection service provided by mangroves after super typhoon “Haiyan” devastated central Philippines in November 2013. We used data on 384 coastal villages controlling for historical mangrove cover and other confounding village level characteristics in examining the influence of remaining mangrove vegetation on human deaths and housing damage. Results show that coastal villages with substantial mangrove cover suffered less damage compared to coastal villages with reduced mangrove cover. This life- and property-saving effects of mangroves is robust across several specifications suggesting that the remaining mangrove cover played a significant protective role when the super typhoon hit central Philippines. The estimated average cost of saving a life, by retaining the remaining mangrove vegetation, amounts to as much as USD 302,000 (PHP 15 million) while the estimated reduction in compensation for totally damaged houses is around USD 53,000. Empirical findings of the study provide additional evidence on the role of mangroves in protecting coastal communities during typhoons. Policy makers now have additional reason to intensify efforts to conserve mangrove forests as a long-term strategy in providing protection to coastal communities and better adaptability to typhoon-related disasters.
1.0 INTRODUCTION
Protection against disasters related to typhoons has been identified as one of the important ecosystem services provided by mangroves (Das and Vincent 2009). Anecdotal reports and observations of local inhabitants in coastal villages have highlighted the usefulness of mangrove forests in reducing the damage brought by typhoon-related disasters (Kinver 2005; Stinger and Orchard 2013; Holtz 2013) . Several empirical studies have found evidence of the effectiveness of mangroves in reducing the damage brought by natural hazards, such as storm surges and tsunamis in Thailand and India (Badola and Hussain 2005; Kathiresen and Rajendran 2005; UNEP 2005; Barbier et al. 2008; Das and Vincent 2009). However, the results and methods of some of these studies have been strongly criticized (Kerr, Baird, and Campbell 2006). Literature reviewed by Das and Vincent (2009) indicates that rigorous, empirical evidence that mangroves provide significant protection against storms and tsunamis is scarce. Hence, this study contributes to the limited literature by empirically valuing the protection service provided by mangroves in times of calamities and disasters.
Recently, renewed interest in the protection service provided by mangroves has surged when the super typhoon Haiyan (locally known as Yolanda) devastated central Philippines on 8 November 2013. Several islands in the Visayas region recorded tremendous losses in lives, property, and livelihood. The region experienced severe devastation due to strong winds and storm surges brought by the super typhoon. However, circumstantial evidence showed that several coastal villages with mangrove areas were less affected by the storm surge compared to
2 Economy and Environment Program for Southeast Asia
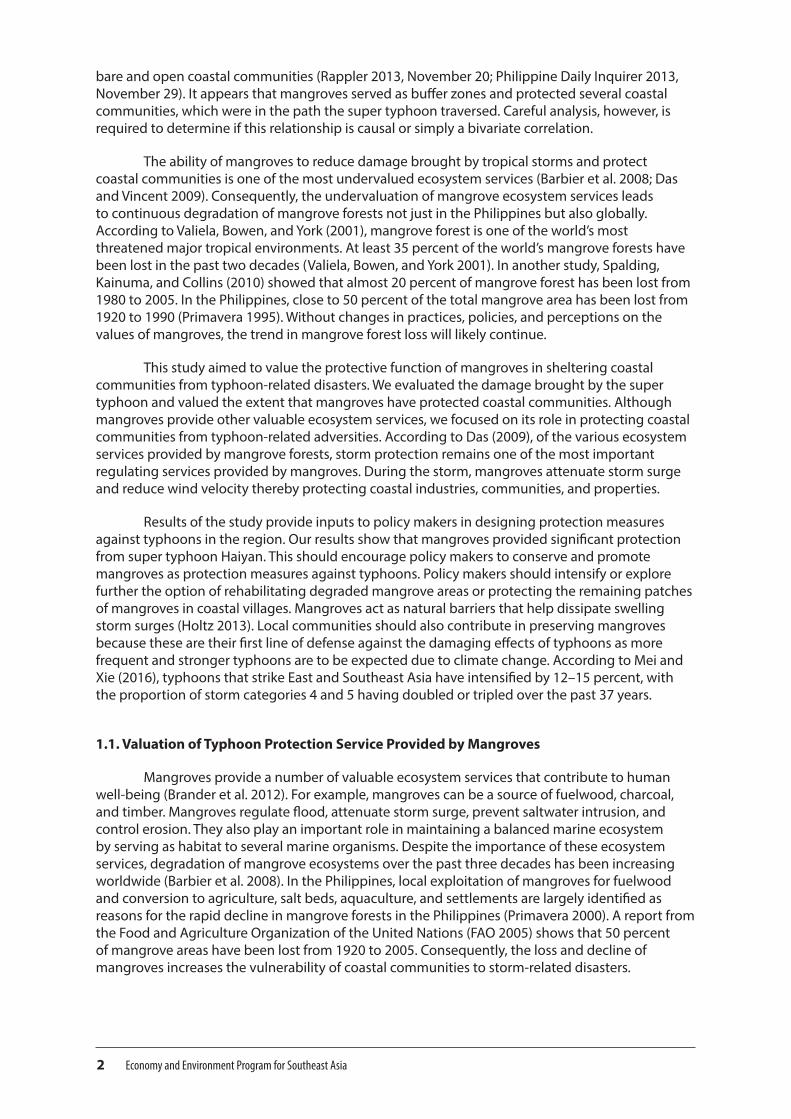
bare and open coastal communities (Rappler 2013, November 20; Philippine Daily Inquirer 2013, November 29). It appears that mangroves served as buffer zones and protected several coastal communities, which were in the path the super typhoon traversed. Careful analysis, however, is required to determine if this relationship is causal or simply a bivariate correlation.
The ability of mangroves to reduce damage brought by tropical storms and protect coastal communities is one of the most undervalued ecosystem services (Barbier et al. 2008; Das and Vincent 2009). Consequently, the undervaluation of mangrove ecosystem services leads to continuous degradation of mangrove forests not just in the Philippines but also globally. According to Valiela, Bowen, and York (2001), mangrove forest is one of the world’s most threatened major tropical environments. At least 35 percent of the world’s mangrove forests have been lost in the past two decades (Valiela, Bowen, and York 2001). In another study, Spalding, Kainuma, and Collins (2010) showed that almost 20 percent of mangrove forest has been lost from 1980 to 2005. In the Philippines, close to 50 percent of the total mangrove area has been lost from 1920 to 1990 (Primavera 1995). Without changes in practices, policies, and perceptions on the values of mangroves, the trend in mangrove forest loss will likely continue.
This study aimed to value the protective function of mangroves in sheltering coastal communities from typhoon-related disasters. We evaluated the damage brought by the super typhoon and valued the extent that mangroves have protected coastal communities. Although mangroves provide other valuable ecosystem services, we focused on its role in protecting coastal communities from typhoon-related adversities. According to Das (2009), of the various ecosystem services provided by mangrove forests, storm protection remains one of the most important regulating services provided by mangroves. During the storm, mangroves attenuate storm surge and reduce wind velocity thereby protecting coastal industries, communities, and properties.
Results of the study provide inputs to policy makers in designing protection measures against typhoons in the region. Our results show that mangroves provided significant protection from super typhoon Haiyan. This should encourage policy makers to conserve and promote mangroves as protection measures against typhoons. Policy makers should intensify or explore further the option of rehabilitating degraded mangrove areas or protecting the remaining patches of mangroves in coastal villages. Mangroves act as natural barriers that help dissipate swelling storm surges (Holtz 2013). Local communities should also contribute in preserving mangroves because these are their first line of defense against the damaging effects of typhoons as more frequent and stronger typhoons are to be expected due to climate change. According to Mei and Xie (2016), typhoons that strike East and Southeast Asia have intensified by 12–15 percent, with the proportion of storm categories 4 and 5 having doubled or tripled over the past 37 years.
1.1. Valuation of Typhoon Protection Service Provided by Mangroves
Mangroves provide a number of valuable ecosystem services that contribute to human well-being (Brander et al. 2012). For example, mangroves can be a source of fuelwood, charcoal, and timber. Mangroves regulate flood, attenuate storm surge, prevent saltwater intrusion, and control erosion. They also play an important role in maintaining a balanced marine ecosystem by serving as habitat to several marine organisms. Despite the importance of these ecosystem services, degradation of mangrove ecosystems over the past three decades has been increasing worldwide (Barbier et al. 2008). In the Philippines, local exploitation of mangroves for fuelwood and conversion to agriculture, salt beds, aquaculture, and settlements are largely identified as reasons for the rapid decline in mangrove forests in the Philippines (Primavera 2000). A report from the Food and Agriculture Organization of the United Nations (FAO 2005) shows that 50 percent of mangrove areas have been lost from 1920 to 2005. Consequently, the loss and decline of mangroves increases the vulnerability of coastal communities to storm-related disasters.
Valuing the Protection Service Provided by Mangroves in Typhoon-hit Areas in the Philippines 3
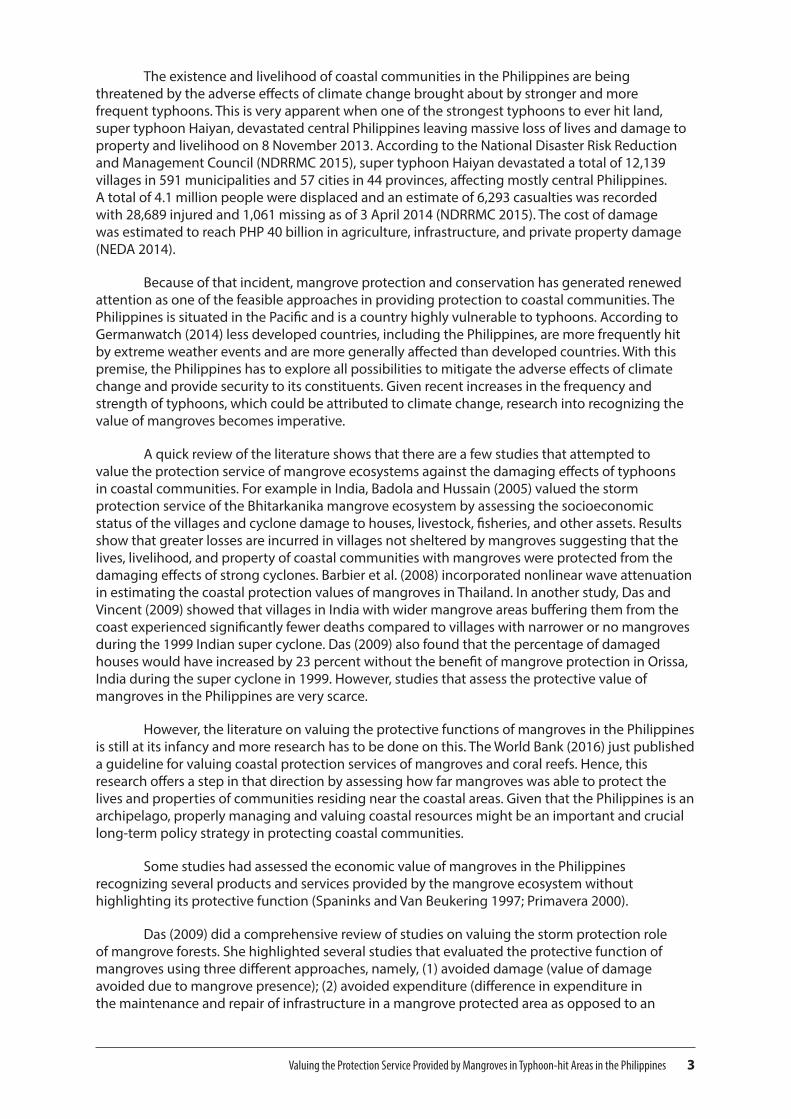
The existence and livelihood of coastal communities in the Philippines are being threatened by the adverse effects of climate change brought about by stronger and more frequent typhoons. This is very apparent when one of the strongest typhoons to ever hit land, super typhoon Haiyan, devastated central Philippines leaving massive loss of lives and damage to property and livelihood on 8 November 2013. According to the National Disaster Risk Reduction and Management Council (NDRRMC 2015), super typhoon Haiyan devastated a total of 12,139 villages in 591 municipalities and 57 cities in 44 provinces, affecting mostly central Philippines. A total of 4.1 million people were displaced and an estimate of 6,293 casualties was recorded with 28,689 injured and 1,061 missing as of 3 April 2014 (NDRRMC 2015). The cost of damage was estimated to reach PHP 40 billion in agriculture, infrastructure, and private property damage (NEDA 2014).
Because of that incident, mangrove protection and conservation has generated renewed attention as one of the feasible approaches in providing protection to coastal communities. The Philippines is situated in the Pacific and is a country highly vulnerable to typhoons. According to Germanwatch (2014) less developed countries, including the Philippines, are more frequently hit by extreme weather events and are more generally affected than developed countries. With this premise, the Philippines has to explore all possibilities to mitigate the adverse effects of climate change and provide security to its constituents. Given recent increases in the frequency and strength of typhoons, which could be attributed to climate change, research into recognizing the value of mangroves becomes imperative.
A quick review of the literature shows that there are a few studies that attempted to value the protection service of mangrove ecosystems against the damaging effects of typhoons in coastal communities. For example in India, Badola and Hussain (2005) valued the storm protection service of the Bhitarkanika mangrove ecosystem by assessing the socioeconomic status of the villages and cyclone damage to houses, livestock, fisheries, and other assets. Results show that greater losses are incurred in villages not sheltered by mangroves suggesting that the lives, livelihood, and property of coastal communities with mangroves were protected from the damaging effects of strong cyclones. Barbier et al. (2008) incorporated nonlinear wave attenuation in estimating the coastal protection values of mangroves in Thailand. In another study, Das and Vincent (2009) showed that villages in India with wider mangrove areas buffering them from the coast experienced significantly fewer deaths compared to villages with narrower or no mangroves during the 1999 Indian super cyclone. Das (2009) also found that the percentage of damaged houses would have increased by 23 percent without the benefit of mangrove protection in Orissa, India during the super cyclone in 1999. However, studies that assess the protective value of mangroves in the Philippines are very scarce.
However, the literature on valuing the protective functions of mangroves in the Philippines is still at its infancy and more research has to be done on this. The World Bank (2016) just published a guideline for valuing coastal protection services of mangroves and coral reefs. Hence, this research offers a step in that direction by assessing how far mangroves was able to protect the lives and properties of communities residing near the coastal areas. Given that the Philippines is an archipelago, properly managing and valuing coastal resources might be an important and crucial long-term policy strategy in protecting coastal communities.
Some studies had assessed the economic value of mangroves in the Philippines recognizing several products and services provided by the mangrove ecosystem without highlighting its protective function (Spaninks and Van Beukering 1997; Primavera 2000).
Das (2009) did a comprehensive review of studies on valuing the storm protection role of mangrove forests. She highlighted several studies that evaluated the protective function of mangroves using three different approaches, namely, (1) avoided damage (value of damage avoided due to mangrove presence); (2) avoided expenditure (difference in expenditure in the maintenance and repair of infrastructure in a mangrove protected area as opposed to an

4 Economy and Environment Program for Southeast Asia
unprotected area); or (3) replacement costs (cost of installing infrastructure that can provide the same protection services as mangroves). For wetlands, Barbier (2007) recommended using the expected damage function (EDF) to measure the storm protection value of coastal wetlands. Though each of these methods has different advantages over each other, several studies in the literature have used the avoided damage approach (Bann 1998; Badola and Hussain 2005; Das and Vincent 2009; Barbier 2014). The avoided damage approach, also known as damage-cost approach, is commonly used because it takes into account the actual damage suffered by communities with mangrove cover compared to communities without or reduced mangrove cover. This approach estimates the amount of damage that was averted due to the presence of mangrove or damage which could have occurred if there had been no mangroves (Das 2009). In line with this argument, this paper adopted the avoided damage method.
In the United States, Constanza et al. (2008) did a study on valuing the protection service of wetlands from 34 major hurricanes using the avoided damage approach. Their findings showed that a loss of one hectare (ha) is tantamount to an average damage cost of USD 33,000 and a median damage cost of USD 5,000. Using maps and annual probability of hurricanes of varying intensities, the annual value of wetlands in a 1×1-square kilometer (km2) area ranged from USD 250 to USD 51,000 per ha per year. The dependent variable of the study was gross domestic product while the independent factors were wind speed and wetland area. It was estimated that US coastal wetlands have an annual value of USD 23.2 billion per year (Constanza et al. 2008). In addition, the study showed that with increasing typhoon frequency, the value of wetlands also increases. Kathiresan and Rajendran (2005) have also used the avoided damage approach to evaluate the protective role of coastal forests during the Indian Ocean tsunami in 2004.
In Thailand, Barbier et al. (2008) found that the value of coastal protection from storms using the expected damage cost method amounted to as much as USD 187,898 per km2 (USD 18.79 million per ha). This finding favors the conservation of mangroves from conversion into shrimp ponds. However, taking into consideration marginal values, thin strips of mangroves rendered very limited protection from the tsunami. Spatial considerations (i.e., what people do during a tsunami and the availability of physical infrastructure) and the extent of mangrove forest near the shore were also cited. The study concluded that mangrove restoration is profitable because the value of coastal storm protection provided by mangroves yields higher net present value than commercial shrimp farming (Barbier et al. 2008). This estimation was derived using the expected damage cost method projected over a 20-year time horizon at a 10 percent discount rate.
1.2. Status of Mangrove Forests in the Philippines
Long and Giri (2011) noted that the Philippines is considered one of the top mangrove-rich countries in the world. Primavera et al. (2004) reported that there are 50–60 species of mangroves belonging to 16 families recorded around the globe. More than 50 of these are thriving in the Indo-Pacific and about 35 species are found in the Philippines alone. Fringing mangroves in the Philippines are naturally lined by Avicennia marina and/or Sonneratia alba as frontliners, with Rhizophora stylosa and R. apiculata immediately behind (Primavera et al. 2012). It has been recommended that for any mangrove restoration project, species selection should match the physical characteristics of a given site.
In the Philippines, conversion of mangrove areas to aquaculture ponds and residential areas are the main cause of the declining mangrove cover (Primavera 2000; Mendoza and Alura 2001; Becira 2006). Mangroves have been disappearing in the country in the past decades and significant reduction took place in the 1960s and 1970s during the same decades when aquaculture was encouraged by the government (Ferrer et al. 2011). The problem is being aggravated by the poor enforcement of many laws on mangrove protection (Primavera 2000). Based on the Philippine Fisheries Code of 1998 (RA 8550), unproductive and abandoned fishponds must be reforested. This regulation is poorly complied by lease-holders and many of the illegal
Valuing the Protection Service Provided by Mangroves in Typhoon-hit Areas in the Philippines 5
coastal fishpond operators in the country (Ferrer et al. 2011). At present, there is a concerted effort by the government to rehabilitate degraded forests areas under the National Greening Program of the Department of Environment and Natural Resources (DENR). The task is to grow 1.5 billion trees in 1.5 million ha of forestlands, including mangrove areas, in the country (DENR 2016). When typhoon Haiyan hit the country, it caused massive damage to infrastructure, livelihoods, and human habitation, which eventually pushed the government and non-government organizations (NGOs) to advocate for mangrove rehabilitation, especially in typhoon-affected areas.
METHODS
2.1. Empirical Approach
To address the objectives of this study, we used the damage cost approach in valuing the protection services provided by mangrove ecosystems against typhoon-related damage. This method takes into account the actual damage brought by the super typhoon in areas with mangrove forests compared to the damage in areas without or reduced mangrove forests. The damage cost approach evaluates the amount of damage that was averted due to the presence of mangroves or the damage that could have occurred if there had been no mangroves (Bann 1998; Badola and Hussain 2005; Barbier 2014).
This study includes only villages where mangroves are either currently present or were historically present. We only included villages that have coastal areas and excluded interior villages in our sample. Villages where mangroves never occurred due to unfavorable ecological conditions were not included. We investigated the loss of mangroves’ storm protection services. For loss to occur, mangroves need to have existed in the first place. We used satellite data to confirm the presence or absence of mangrove cover in the coastal areas included in the study. For the historical mangrove presence, we relied on maps used by the US Army Map Service in 1944, which were available online (University of Texas 2015)
Following Das and Vincent (2009), our approach involved two major steps. In the first step, we specified a storm damage function by linking coastal damage to several explanatory variables. From this regression analysis, we can derive the value of mangrove protection. In the second step, we computed for the total benefit by multiplying the marginal effect derived in the first step to the total mangrove area. According to Das and Vincent (2009), the value of protection services provided by mangroves and the reliability of this measure is dependent on how accurately we can account for all the potential factors that might have an impact on the damage brought by the storm. This includes how prepared villages are for such an event.
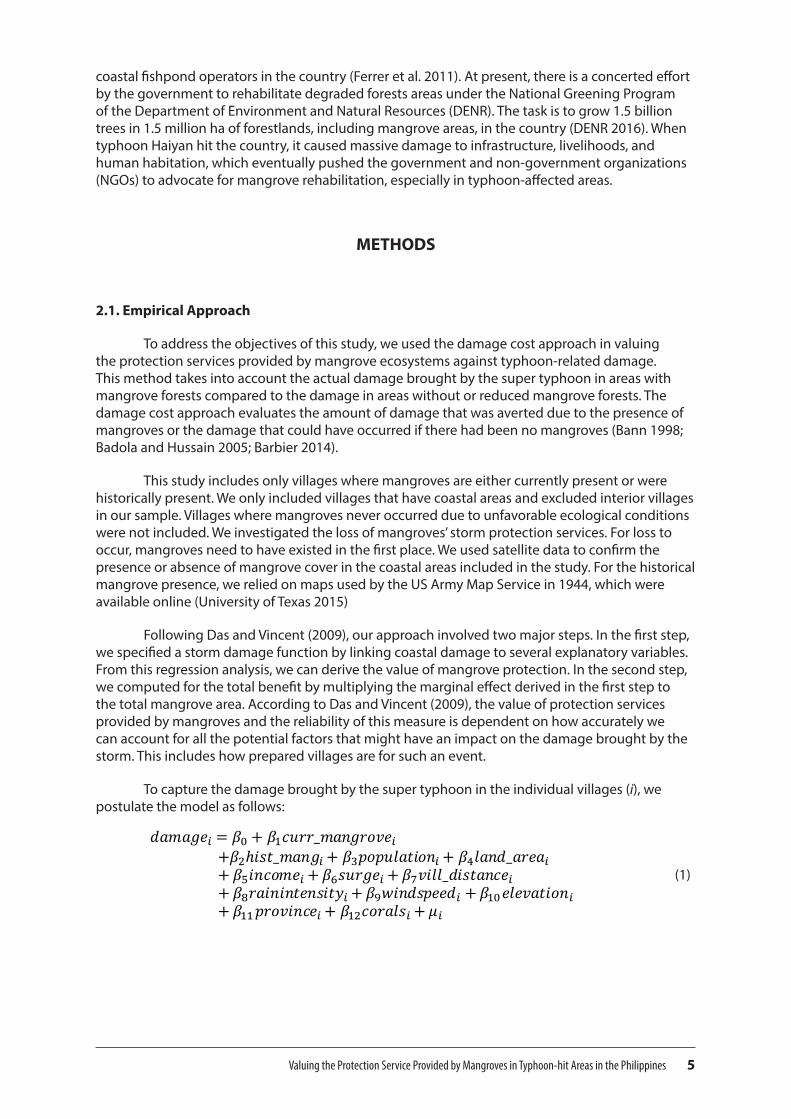
To capture the damage brought by the super typhoon in the individual villages (i), we postulate the model as follows:
+𝛽2ℎ𝑖𝑠𝑡_𝑚𝑎𝑛𝑔𝑖 + 𝛽3𝑝𝑜𝑝𝑢𝑙𝑎𝑡𝑖𝑜𝑛𝑖 + 𝛽4𝑙𝑎𝑛𝑑_𝑎𝑟𝑒𝑎𝑖+ 𝛽5𝑖𝑛𝑐𝑜𝑚𝑒𝑖 + 𝛽6𝑠𝑢𝑟𝑔𝑒𝑖 + 𝛽7𝑣𝑖𝑙𝑙_𝑑𝑖𝑠𝑡𝑎𝑛𝑐𝑒𝑖+ 𝛽8𝑟𝑎𝑖𝑛𝑖𝑛𝑡𝑒𝑛𝑠𝑖𝑡𝑦𝑖 + 𝛽9𝑤𝑖𝑛𝑑𝑠𝑝𝑒𝑒𝑑𝑖 + 𝛽10𝑒𝑙𝑒𝑣𝑎𝑡𝑖𝑜𝑛𝑖+ 𝛽11𝑝𝑟𝑜𝑣𝑖𝑛𝑐𝑒𝑖 + 𝛽12𝑐𝑜𝑟𝑎𝑙𝑠𝑖 + 𝜇𝑖
𝑑𝑎𝑚𝑎𝑔𝑒𝑖 = 𝛽0 + 𝛽1𝑐𝑢𝑟𝑟_𝑚𝑎𝑛𝑔𝑟𝑜𝑣𝑒𝑖
(1)

6 Economy and Environment Program for Southeast Asia
where
damagei = captures the damage in lives (number of dead and missing) and housing property (number of damaged houses) in coastal communities;
curr_mangrovei = represents the 2010 current mangrove cover in the village (ha);
hist_mangrovei = reflects the historical mangrove cover of coastal villages in 1944 (ha);
populationi = total number of people residing in the coastal villages;
land_areai = total land area of the village (GIS generated) (ha);
incomei = income of the village, proxied by the internal revenue allotment (IRA) from the national government, which is the villages’ share of taxes collected;
surgei = represents how severe the storm surge is as modeled by the UN (2013) (measured by height of the storm surge);
vill_distancei = distance from the village center (i.e., where most of the population are concentrated) to the coast (km);
rainintensityi = amount of rain on the day the typhoon hit the area, taken from the weather station ;
windspeedi = dummy variable reflecting the bandwidth of windspeed (km/hour), three bandwidths were used (Figure 1), converted to kph from mph;
elevationi = reflects the altitude of coastal villages (meters above sea level);
provincei = dummy variable reflecting the province where the coastal village is located;
coralsi = captures the presence and estimated area (km2)of coral reefs in the locality; and
ui = remaining error.
For our econometric approach, we used count models in capturing the influence of mangrove cover on the damage caused by the super typhoon. Since the dependent variable is count data, we used Poisson or negative binomial model. Following Grogger and Carson (1991), the basic Poisson model can be written as follows:
Pr 𝑦𝑖 = 𝑗 =exp −𝜆 𝜆𝑗
𝑗 ! (2)
where there are i = 1,2,.., n observations. Yi is the ith observation on the count variable; j = 0,1,2,3,4 are the possible values of Yi, which refers to the number of number of deaths or number of damaged houses; and λ is the Poisson parameter to be estimated. A restrictive property of the Poisson model is the assumption that the conditional mean of Yi is equal to the conditional variance, that is,
𝐸 𝑌𝑖 𝑋𝑖 = 𝑉𝑎𝑟 𝑌𝑖 𝑋𝑖 = 𝜆𝑖 = ex p(𝑋𝑖𝛽) (3)
This assumption of mean-variance equality in the Poisson distribution is often problematic since in most cases, when using actual data, the conditional variance often exceeds the conditional mean resulting in an over-dispersion problem (Cameron and Trivedi 1998). In the presence of over-dispersion, the conditional mean is still consistent when estimating using the Poisson model but the standard errors of β are biased downward (Cameron and Trivedi 1986; Grogger and Carson 1991). To account for this over-dispersion problem, researchers usually prefer negative binomial instead of Poisson (Hilbe 2011; Cameron and Trivedi 2013). However, over-dispersion does not

Valuing the Protection Service Provided by Mangroves in Typhoon-hit Areas in the Philippines 7
affect the consistency of parameter estimates in the Poisson, it is the standard errors that need to be adjusted. Hence, we used the Poisson model and robust standard errors to address concerns about over-dispersion (Huber 1967; White 1980). The same approach was taken by Tan-Soo et al. (2016) in investigating the effect of deforestation on flood-mitigation services. In addition, we also used negative binomial model to address the concern of over-dispersion.
Another potential problem in the estimation is the presence of an unusually large number of zeros. These observations represented villages that reported no deaths during the super typhoon. To address this problem, we clustered the standard errors at the municipality level. This method could be well applied in our current dataset given that there is a substantial number of zero observations. The clustering of standard errors at the municipality level is necessary because the organization and coordination of typhoon-related preparations are conducted at the local level. The enforcement of evacuation is administered by the municipal mayor in coordination with the village chiefs. We expected similarities in terms of response to typhoon preparations at the municipality level.
Das (2009) estimated averted damage under two restrictions: (1) if there were no mangroves present before the cyclone (mangrove forest = 0) and (2) if mangroves were as they existed in 1950 (mangrove forest = 1). For our analysis, we estimated avoided damage by comparing the damage in coastal villages with substantial mangrove forest/cover with those villages with reduced mangrove forest/cover. The difference will reflect the protection services provided by mangroves.
2.2. Data and Data Collection
Secondary data were collected from local government units (LGUs). Courtesy calls were made informing the local officials about the study and asking them whether they were willing to participate and share their data. Data on typhoon damage, such as number of casualties and damaged houses, were collected either from the Planning Office, Municipal Disaster Risk Reduction Council, or from the municipality’s Department of Social Welfare and Development. Data on village characteristics were mainly sourced from the municipal’s land use plan.
As discussed by Das and Vincent (2009), it is important to control for original mangrove area (i.e., historical mangrove area) and compare it with the recent mangrove area. By looking at the historical and recent mangrove cover, we can derive an estimate of how mangrove cover has changed in this typhoon-hit region. By comparing relatively similar coastal villages in terms of income, population, topography, and other characteristics and only varying mangrove cover, we estimated the protection service provided by mangroves to coastal communities.
The main explanatory variable capturing mangrove cover was measured in terms of hectares. For this data, we relied on available historical maps and satellite data. We used the most recent geographical information system (GIS) map of mangroves (Long and Giri 2011) before the typhoon hit the region and examined how mangrove cover has changed over the past years using historical maps on mangrove cover in the Philippines. In this case, we measured the changes in mangrove cover by comparing the most recent map of mangrove cover just before the typhoon hit and the historical mangrove map. We then compared how the severity of the damage in villages where mangrove areas have been preserved versus the damage in coastal villages where mangrove areas have been converted to other uses.
Aside from collecting data on socio-demographic characteristics of coastal villages, information on the presence and extent of coral reefs in the area were also documented. A study by Ferrario et al. (2014) showed that coral reefs provide substantial protection against natural hazards by reducing wave energy by an average of 97 percent. We asked officials from the Bureau of Fisheries and Aquatic Resources, Municipal Agriculture Office, or the coastal resource manager about the presence of corals in their communities. Out of 384 coastal villages, 95 percent were

8 Economy and Environment Program for Southeast Asia
able to identify the presence or absence of coral reefs in their locality while only 68 percent of the coastal villages were able to give an estimated area of their coral reefs.
For the other control variables, we collected secondary data from municipal offices and village (or barangay) offices. Secondary data on population or the number of households in the coastal village, and income of the village as measured by the internal revenue allotment (IRA) from the government were collected from the relevant local offices. We also collected data on land area, population, and elevation. Data on storm surges, rainfall, and wind speed were sourced from the Philippine Atmospheric, Geophysical and Astronomical Services Administration (PAGASA).
Aside from collecting secondary data, five focus group discussions (FGDs) were conducted to verify the damage experienced by the communities in Leyte and Samar. During the FGDs, respondents were asked about the protective measures they undertook in response to the super typhoon. We asked whether they received an early warning about the storm and what their response was to this early warning information (whether they evacuated or chose to stay home). We also inquired whether storm shelters or evacuation centers were available in their village and if these infrastructure were available, whether they evacuated in advance or just before the typhoon hit. In addition, we also asked whether the village had a seawall and whether they believed it could protect them.
2.3. Study Area
The study area is the Visayas region where the super typhoon traversed devastating many coastal villages. The super typhoon Haiyan, or locally known as typhoon Yolanda, was one of the strongest typhoons ever recorded to make landfall and was also the deadliest Philippine typhoon (The New York Times 2013, November 11).
The super typhoon made its first landfall in Guiuan, Eastern Samar, then coursed through the island of Leyte. There was widespread devastation in Tacloban City, Leyte from the storm surge brought by the super typhoon. Many buildings and houses were destroyed. The NDRRMC (2015) confirmed 6,300 fatalities across the typhoon path with 5,877 fatalities recorded in Eastern Visayas alone. After hitting Eastern Visayas, the super typhoon passed through the northern part of Cebu, then to Panay island, then to the Busuanga, Palawan area before exiting the Philippines. Figure 1 shows the path of the super typhoon as it traversed the Visayas region.
The sample coastal villages along the typhoon path were selected covering coastal villages within the 55 miles per hour (mph) windspeed bandwidth (Figure 1). It is highly likely that mangroves were able to reduce damage caused by moderate winds (55 mph) but were unable to provide protection against extreme winds (75 mph). Our main limitation is that our sample only included coastal villages that historically had mangroves. For this criterion, we overlaid the map showing original mangrove cover on the map showing the typhoon path to determine the coastal villages to include. In this process, we did not select villages that had no historical mangrove cover. Considering all these restrictions and criteria, the population included 542 coastal villages. We wanted to include all 542 coastal villages that satisfy our criteria but because of time and resource limitations, the current study included a sample of 384 coastal villages. Figure 2 shows the historical map of Samar and Leyte. This historical map highlighted the presence of mangroves in the area. We digitized this map and provided an estimate of the mangrove area in 1944. We digitized all the available historical maps (from Samar to Palawan area) of the areas/provinces in the super typhoon’s path.

Valuing the Protection Service Provided by Mangroves in Typhoon-hit Areas in the Philippines 9
Figure 1. The path of super typhoon Haiyan Source: The New York Times (2013, November 11)
Figure 2. Historical map of Samar and Leyte islands with identified mangrove areasSource: University of Texas (2015)
10 Economy and Environment Program for Southeast Asia
RESULTS AND DISCUSSION
3.1. Status of Mangrove Cover in the Study Sites
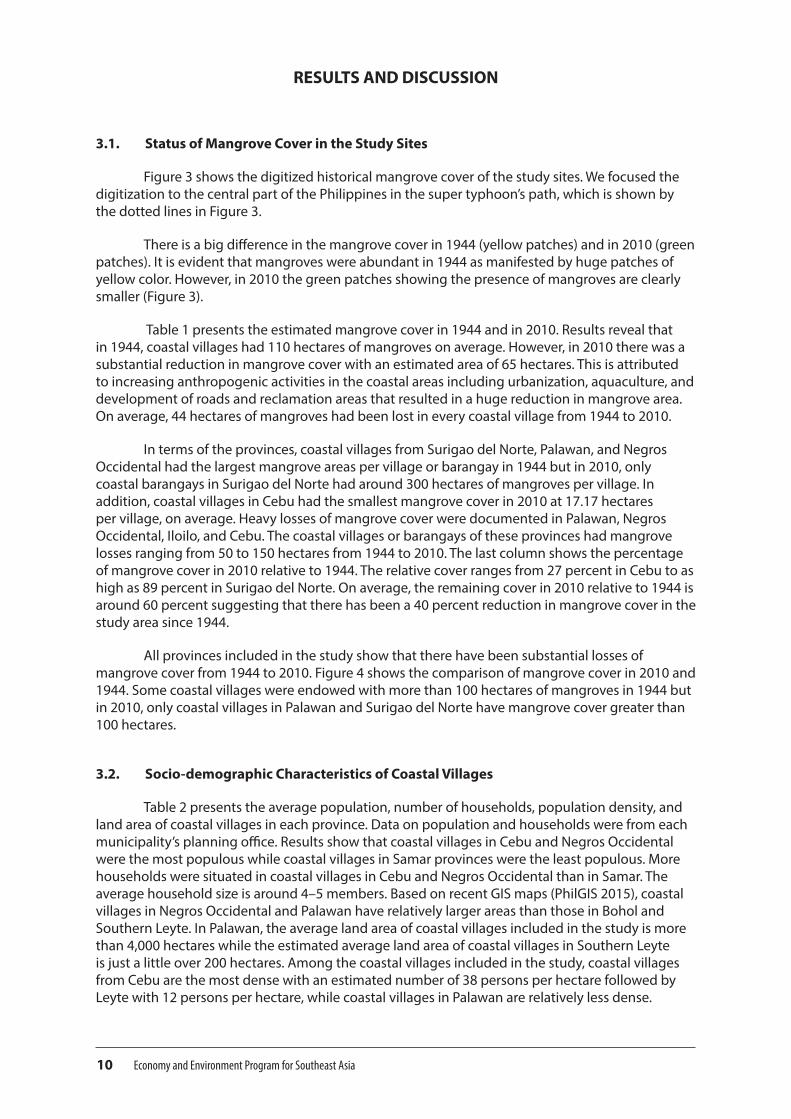
Figure 3 shows the digitized historical mangrove cover of the study sites. We focused the digitization to the central part of the Philippines in the super typhoon’s path, which is shown by the dotted lines in Figure 3.
There is a big difference in the mangrove cover in 1944 (yellow patches) and in 2010 (green patches). It is evident that mangroves were abundant in 1944 as manifested by huge patches of yellow color. However, in 2010 the green patches showing the presence of mangroves are clearly smaller (Figure 3).
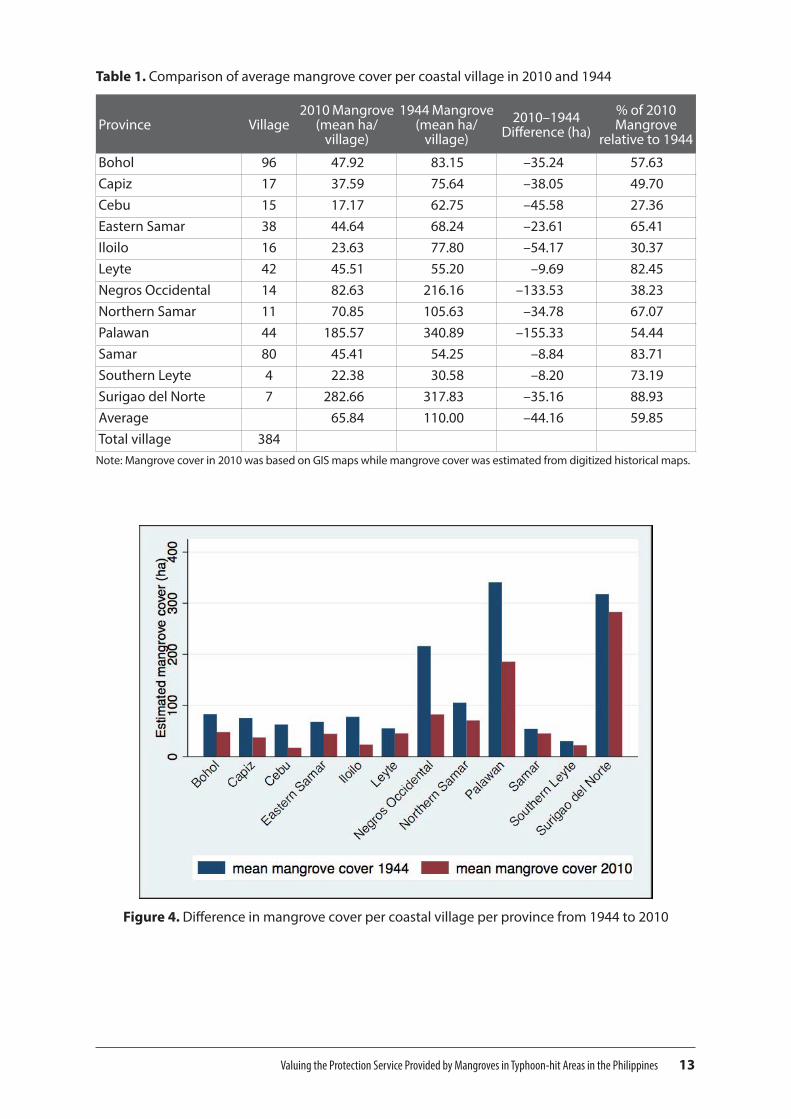
Table 1 presents the estimated mangrove cover in 1944 and in 2010. Results reveal that in 1944, coastal villages had 110 hectares of mangroves on average. However, in 2010 there was a substantial reduction in mangrove cover with an estimated area of 65 hectares. This is attributed to increasing anthropogenic activities in the coastal areas including urbanization, aquaculture, and development of roads and reclamation areas that resulted in a huge reduction in mangrove area. On average, 44 hectares of mangroves had been lost in every coastal village from 1944 to 2010.
In terms of the provinces, coastal villages from Surigao del Norte, Palawan, and Negros Occidental had the largest mangrove areas per village or barangay in 1944 but in 2010, only coastal barangays in Surigao del Norte had around 300 hectares of mangroves per village. In addition, coastal villages in Cebu had the smallest mangrove cover in 2010 at 17.17 hectares per village, on average. Heavy losses of mangrove cover were documented in Palawan, Negros Occidental, Iloilo, and Cebu. The coastal villages or barangays of these provinces had mangrove losses ranging from 50 to 150 hectares from 1944 to 2010. The last column shows the percentage of mangrove cover in 2010 relative to 1944. The relative cover ranges from 27 percent in Cebu to as high as 89 percent in Surigao del Norte. On average, the remaining cover in 2010 relative to 1944 is around 60 percent suggesting that there has been a 40 percent reduction in mangrove cover in the study area since 1944.
All provinces included in the study show that there have been substantial losses of mangrove cover from 1944 to 2010. Figure 4 shows the comparison of mangrove cover in 2010 and 1944. Some coastal villages were endowed with more than 100 hectares of mangroves in 1944 but in 2010, only coastal villages in Palawan and Surigao del Norte have mangrove cover greater than 100 hectares.
3.2. Socio-demographic Characteristics of Coastal Villages
Table 2 presents the average population, number of households, population density, and land area of coastal villages in each province. Data on population and households were from each municipality’s planning office. Results show that coastal villages in Cebu and Negros Occidental were the most populous while coastal villages in Samar provinces were the least populous. More households were situated in coastal villages in Cebu and Negros Occidental than in Samar. The average household size is around 4–5 members. Based on recent GIS maps (PhilGIS 2015), coastal villages in Negros Occidental and Palawan have relatively larger areas than those in Bohol and Southern Leyte. In Palawan, the average land area of coastal villages included in the study is more than 4,000 hectares while the estimated average land area of coastal villages in Southern Leyte is just a little over 200 hectares. Among the coastal villages included in the study, coastal villages from Cebu are the most dense with an estimated number of 38 persons per hectare followed by Leyte with 12 persons per hectare, while coastal villages in Palawan are relatively less dense.

Valuing the Protection Service Provided by Mangroves in Typhoon-hit Areas in the Philippines 11
Figure 3. Digitized historical mangrove map (1944) overlaid with typhoon path (Palawan, northern Cebu, northern Panay, Samar and Leyte) and mangrove cover in 2010

12 Economy and Environment Program for Southeast Asia
Figure 3. Digitized historical mangrove map (1944) overlaid with typhoon path (Palawan, northern Cebu, northern Panay, Samar and Leyte) and mangrove cover in 2010
Valuing the Protection Service Provided by Mangroves in Typhoon-hit Areas in the Philippines 13
Table 1. Comparison of average mangrove cover per coastal village in 2010 and 1944
Province Village2010 Mangrove
(mean ha/ village)
1944 Mangrove (mean ha/
village)2010–1944
Difference (ha)% of 2010 Mangrove
relative to 1944
Bohol 96 47.92 83.15 –35.24 57.63Capiz 17 37.59 75.64 –38.05 49.70Cebu 15 17.17 62.75 –45.58 27.36Eastern Samar 38 44.64 68.24 –23.61 65.41Iloilo 16 23.63 77.80 –54.17 30.37Leyte 42 45.51 55.20 –9.69 82.45Negros Occidental 14 82.63 216.16 –133.53 38.23Northern Samar 11 70.85 105.63 –34.78 67.07Palawan 44 185.57 340.89 –155.33 54.44Samar 80 45.41 54.25 –8.84 83.71Southern Leyte 4 22.38 30.58 –8.20 73.19Surigao del Norte 7 282.66 317.83 –35.16 88.93Average 65.84 110.00 –44.16 59.85Total village 384
Note: Mangrove cover in 2010 was based on GIS maps while mangrove cover was estimated from digitized historical maps.
Figure 4. Difference in mangrove cover per coastal village per province from 1944 to 2010

14 Economy and Environment Program for Southeast Asia
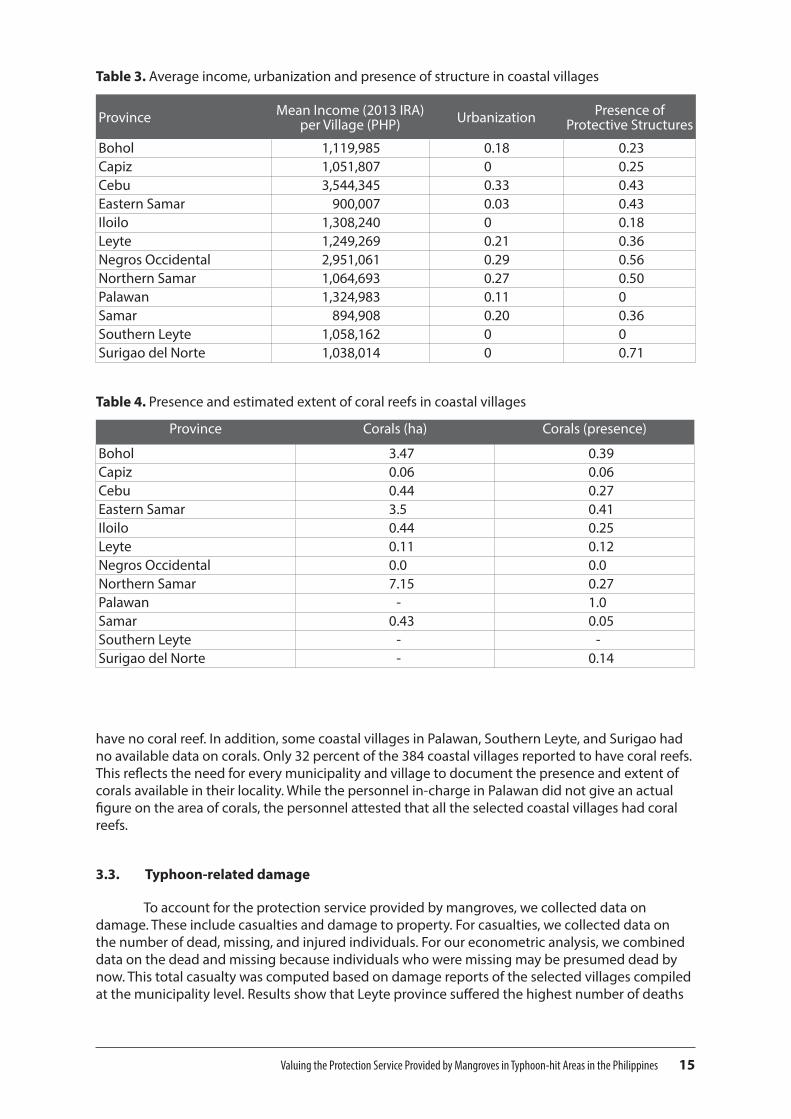
Table 3 shows the level of income, urbanization, and presence of protective structures in the coastal villages. The income of the villages is measured using the IRA for year 2013. The IRA is a national budget allocated to each village, which reflects the socioeconomic status of the villages considering its population and associated economic activities (NSCB 2001). If the village is progressive, then its IRA will also be relatively high. Thus, IRA could serve as a good proxy to measure the economic status of the coastal villages. Results show that on average, the richest coastal villages were in Cebu and Negros Occidental. This is also reflected in the urbanization rate where higher urbanization was observed in Cebu and Negros Occidental. Meanwhile, the poorest coastal villages come from the provinces of Eastern Samar and Samar with an average IRA of less than PHP 1 million (USD 20,408). In addition, we also collected data on protective physical structures present in the coastal villages, which may include sea walls, dikes, ripraps, culverts, and other flood-control structures. We used a dummy to measure these structures (1 = presence of physical structures; 0 = otherwise). This variable is necessary to control for any storm-related damage during the occurrence of typhoon. We also made sure that these structures were present before super Haiyan hit the Philippines in 2013. On average, only 30 percent of the coastal villages reported that they had existing physical structures prior to typhoon Haiyan. However, the coastal villages in Palawan and Southern Leyte reported that they had no protective structures present before the typhoon.
One of the most difficult data to collect is the presence of coral reefs. Some coastal villages did not have an idea of the presence of coral reefs in their locality. Others admitted that no survey had been conducted to document the presence of coral reefs. For those that were able to document the presence of coral reefs, we asked for the estimated area of their coral reef. For those that could not provide a figure, we used a dummy variable for the presence and absence of coral reefs. Only 262 villages out of 384 were able to provide an estimate of the area of coral reefs while 365 villages out 384 where able to identify the presence or absence of coral reefs. We included coral reefs in the analysis because it has been documented that corals provided protection to coastal communities by breaking large waves before they hit coastal areas (Ferrario et al. 2014). We wanted to control for this protection service and included corals in the analysis. Results show that on average, coastal villages reported to have around 2 hectares of coral reefs in their locality (Table 4). Villages from Northern Samar and Bohol reported to have the biggest area of coral reefs among coastal villages included in the study while sample villages from Negros Occidental reported to
Table 2. Average population, number of households, and land area in coastal villages
Province Villages (No)
Mean population per village
Mean households per village
Mean household
size
Mean land area (ha) per
village
Mean population
density (person/ha)
Bohol 96 1389 291 4.7 361.85 5.45Capiz 17 1200 289 4.4 679.63 3.79Cebu 15 7841 1759 4.5 278.11 38.47Eastern Samar 38 1298 205 5.2 543.57 3.04Iloilo 16 1902 410 4.6 662.62 3.30Leyte 42 1683 430 4.3 417.32 12.33Negros Occidental 14 6332 1366 4.7 1245.02 5.92Northern Samar 11 1328 301 4.7 474.39 5.53Palawan 44 1947 465 4.2 4145.39 0.62Samar 80 815 167 4.7 299.17 6.87Southern Leyte 4 1217 277 4.4 214.62 6.47Surigao del Norte 7 1162 261 4.5 767.46 2.33
Valuing the Protection Service Provided by Mangroves in Typhoon-hit Areas in the Philippines 15
have no coral reef. In addition, some coastal villages in Palawan, Southern Leyte, and Surigao had no available data on corals. Only 32 percent of the 384 coastal villages reported to have coral reefs. This reflects the need for every municipality and village to document the presence and extent of corals available in their locality. While the personnel in-charge in Palawan did not give an actual figure on the area of corals, the personnel attested that all the selected coastal villages had coral reefs.
3.3. Typhoon-related damage
To account for the protection service provided by mangroves, we collected data on damage. These include casualties and damage to property. For casualties, we collected data on the number of dead, missing, and injured individuals. For our econometric analysis, we combined data on the dead and missing because individuals who were missing may be presumed dead by now. This total casualty was computed based on damage reports of the selected villages compiled at the municipality level. Results show that Leyte province suffered the highest number of deaths
Table 3. Average income, urbanization and presence of structure in coastal villages
Province Mean Income (2013 IRA) per Village (PHP) Urbanization Presence of
Protective Structures
Bohol 1,119,985 0.18 0.23Capiz 1,051,807 0 0.25Cebu 3,544,345 0.33 0.43Eastern Samar 900,007 0.03 0.43Iloilo 1,308,240 0 0.18Leyte 1,249,269 0.21 0.36Negros Occidental 2,951,061 0.29 0.56Northern Samar 1,064,693 0.27 0.50Palawan 1,324,983 0.11 0Samar 894,908 0.20 0.36Southern Leyte 1,058,162 0 0Surigao del Norte 1,038,014 0 0.71
Table 4. Presence and estimated extent of coral reefs in coastal villages
Province Corals (ha) Corals (presence)
Bohol 3.47 0.39Capiz 0.06 0.06Cebu 0.44 0.27Eastern Samar 3.5 0.41Iloilo 0.44 0.25Leyte 0.11 0.12Negros Occidental 0.0 0.0Northern Samar 7.15 0.27Palawan - 1.0Samar 0.43 0.05Southern Leyte - -Surigao del Norte - 0.14
16 Economy and Environment Program for Southeast Asia
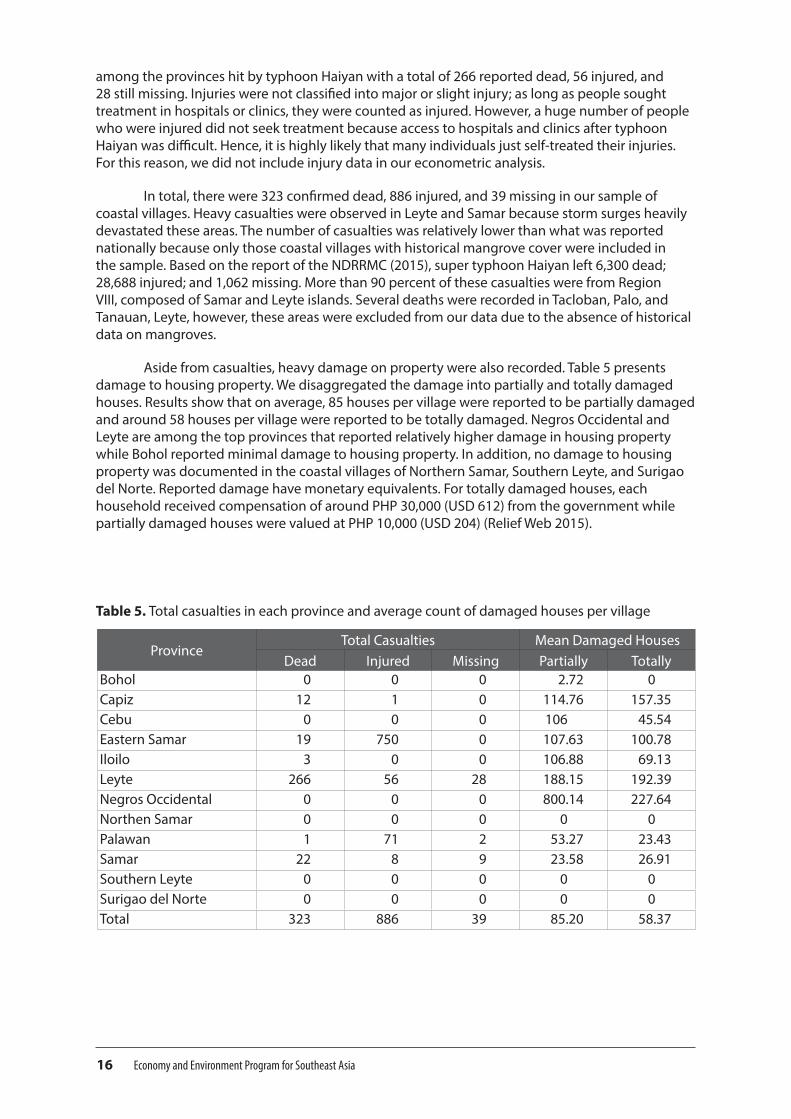
among the provinces hit by typhoon Haiyan with a total of 266 reported dead, 56 injured, and 28 still missing. Injuries were not classified into major or slight injury; as long as people sought treatment in hospitals or clinics, they were counted as injured. However, a huge number of people who were injured did not seek treatment because access to hospitals and clinics after typhoon Haiyan was difficult. Hence, it is highly likely that many individuals just self-treated their injuries. For this reason, we did not include injury data in our econometric analysis.
In total, there were 323 confirmed dead, 886 injured, and 39 missing in our sample of coastal villages. Heavy casualties were observed in Leyte and Samar because storm surges heavily devastated these areas. The number of casualties was relatively lower than what was reported nationally because only those coastal villages with historical mangrove cover were included in the sample. Based on the report of the NDRRMC (2015), super typhoon Haiyan left 6,300 dead; 28,688 injured; and 1,062 missing. More than 90 percent of these casualties were from Region VIII, composed of Samar and Leyte islands. Several deaths were recorded in Tacloban, Palo, and Tanauan, Leyte, however, these areas were excluded from our data due to the absence of historical data on mangroves.
Aside from casualties, heavy damage on property were also recorded. Table 5 presents damage to housing property. We disaggregated the damage into partially and totally damaged houses. Results show that on average, 85 houses per village were reported to be partially damaged and around 58 houses per village were reported to be totally damaged. Negros Occidental and Leyte are among the top provinces that reported relatively higher damage in housing property while Bohol reported minimal damage to housing property. In addition, no damage to housing property was documented in the coastal villages of Northern Samar, Southern Leyte, and Surigao del Norte. Reported damage have monetary equivalents. For totally damaged houses, each household received compensation of around PHP 30,000 (USD 612) from the government while partially damaged houses were valued at PHP 10,000 (USD 204) (Relief Web 2015).
Table 5. Total casualties in each province and average count of damaged houses per village
ProvinceTotal Casualties Mean Damaged Houses
Dead Injured Missing Partially TotallyBohol 0 0 0 2.72 0Capiz 12 1 0 114.76 157.35Cebu 0 0 0 106 45.54Eastern Samar 19 750 0 107.63 100.78Iloilo 3 0 0 106.88 69.13Leyte 266 56 28 188.15 192.39Negros Occidental 0 0 0 800.14 227.64Northen Samar 0 0 0 0 0Palawan 1 71 2 53.27 23.43Samar 22 8 9 23.58 26.91Southern Leyte 0 0 0 0 0Surigao del Norte 0 0 0 0 0Total 323 886 39 85.20 58.37

Valuing the Protection Service Provided by Mangroves in Typhoon-hit Areas in the Philippines 17
3.4. Econometric Analysis on the Protection Service of Mangroves in Typhoon-related Damage
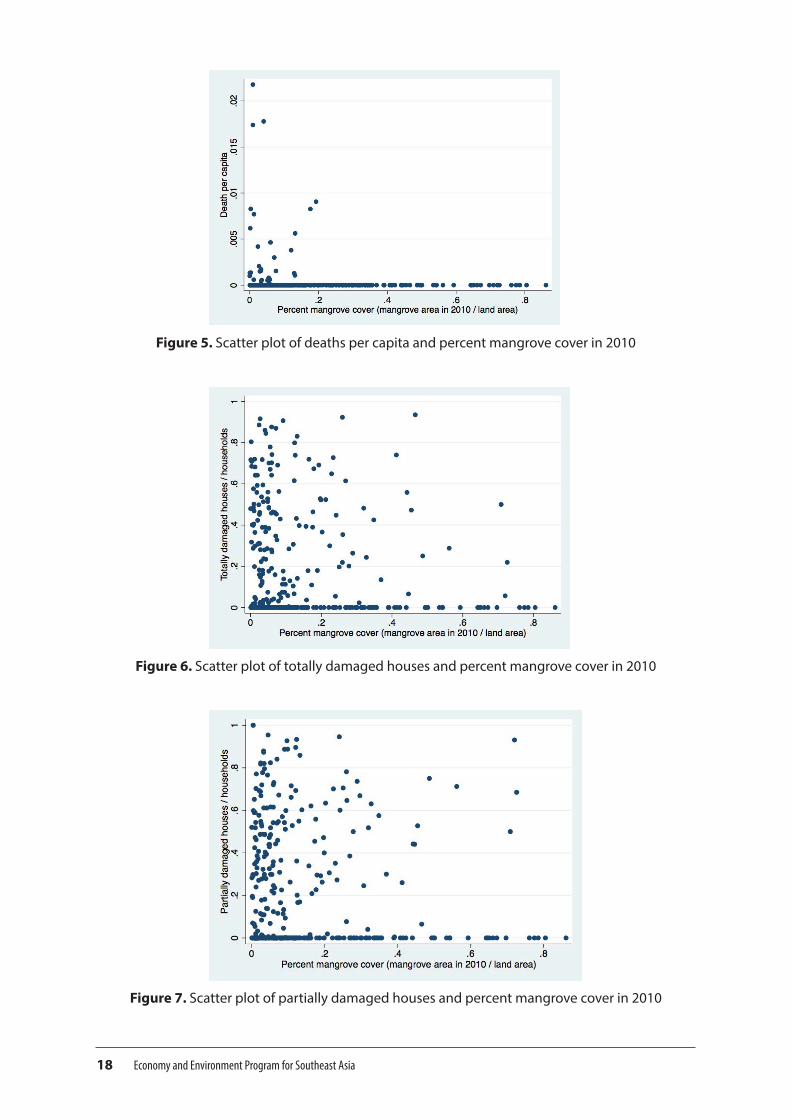
The main objective of the study is to value the protection services provided by mangroves when typhoons occur. The hypothesis is that we expect lower damage in areas with substantial mangrove cover compared to areas with relatively thinner mangrove cover. Before presenting the regression results, we first present a scatter plot graph of the damage brought by the super typhoon vis-à-vis the availability of mangroves in the coastal villages. Figure 5 presents the scatter plot of the fatality rate, measured as number of deaths per capita, and percent mangrove cover in 2010. The scatter plot shows more deaths in coastal villages with smaller mangrove cover, relative to land area, than in coastal villages with larger mangrove cover. More deaths were recorded in villages with less than 20 percent mangrove cover. This is an indication of a negative association between damage to lives and presence of mangroves. Though other confounding factors are not controlled in a graphical analysis, this shows an initial signal of the potential contribution of mangroves in reducing damage to lives. In addition, Figure 6 and Figure 7 show the scatter plot of totally- and partially-damaged houses in a village with mangrove cover relative to the land area on the horizontal axis. The damage to housing property is relatively higher in villages with less than 20 percent mangrove cover compared to coastal villages with more than 40 percent mangrove cover. Consistent with the results in Figure 5, Figure 6 and Figure 7 provide early support for our hypothesis that coastal villages with thicker mangrove cover suffered less damage to housing property compared to coastal villages with reduced mangrove cover.
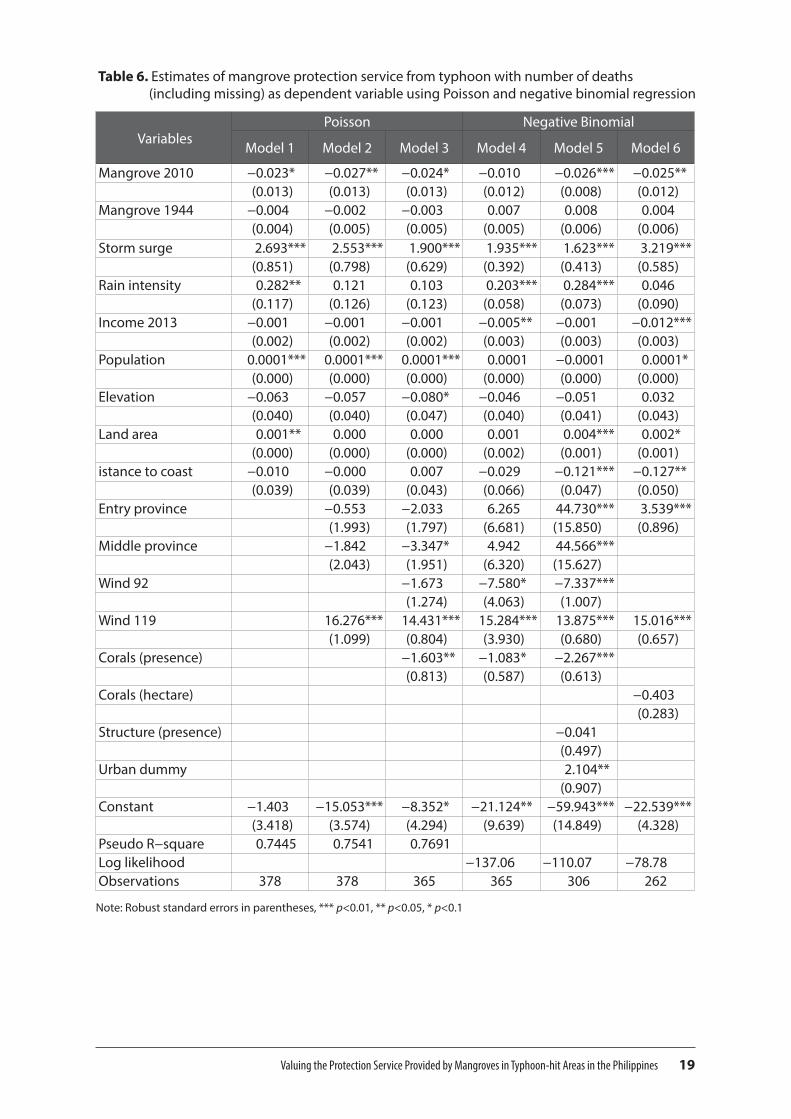
Table 6 presents the regression results of the protective functions of mangroves against super typhoon Haiyan. The dependent variable is the number of deaths, including missing people who may now be presumed dead. We model the number of deaths as a Poisson and negative binomial process using robust standard errors. Consistent across different specifications, the regression results highlight the protective function of mangroves by significantly rejecting the hypothesis that mangroves did not affect typhoon-related deaths. For model 1, we include the current and historical mangrove cover while controlling for population, storm surge, rain intensity, village income, elevation, and distance of village from the coastline. Results show that the coefficient for mangrove cover in 2010 is negative and significant suggesting that an added hectare of mangrove cover is associated with fewer deaths. The control for historical mangrove cover is negatively associated with number of deaths but the result is not significantly different from zero.
Looking at the control variables, the population variable is positive and significant, which is plausible because more deaths are likely with higher population. Results for elevation show negative association with number of deaths. This suggests that coastal villages situated in an area with relatively higher elevation suffered less damage compared to villages lying in a flat area. Coastal villages in low-lying areas are at a disadvantage. During storm surge warnings, people are advised to move to higher ground. The coefficient on land area is positive suggesting that bigger land area is associated with more damage.
For model 1, we included information on storm surge, rain intensity, and income of the coastal village. Storm surge had a strong and significant effect on the number of deaths. The associated effect of storm surge is consistent across all specifications strongly suggesting that the height of the storm surge was one of the major determinants of deaths during the super typhoon. In Tacloban City, Leyte, most deaths were attributed to storm surge. In the several focus groups discussions that we conducted, residents of Tacloban City mentioned that it was the unexpected increase in the level of water that caused massive deaths. According to participants, they took the warning on storm surge lightly. It appears that the warning on storm surge was not well-understood by the residents. This was reflected in the empirical analysis and is consistent across different models—storm surge had a strong effect on the number of deaths in the typhoon-affected areas.
18 Economy and Environment Program for Southeast Asia
Figure 5. Scatter plot of deaths per capita and percent mangrove cover in 2010
Figure 6. Scatter plot of totally damaged houses and percent mangrove cover in 2010
Figure 7. Scatter plot of partially damaged houses and percent mangrove cover in 2010
Valuing the Protection Service Provided by Mangroves in Typhoon-hit Areas in the Philippines 19
Table 6. Estimates of mangrove protection service from typhoon with number of deaths (including missing) as dependent variable using Poisson and negative binomial regression
VariablesPoisson Negative Binomial
Model 1 Model 2 Model 3 Model 4 Model 5 Model 6
Mangrove 2010 −0.023* −0.027** −0.024* −0.010 −0.026*** −0.025**(0.013) (0.013) (0.013) (0.012) (0.008) (0.012)
Mangrove 1944 −0.004 −0.002 −0.003 0.007 0.008 0.004(0.004) (0.005) (0.005) (0.005) (0.006) (0.006)
Storm surge 2.693*** 2.553*** 1.900*** 1.935*** 1.623*** 3.219***(0.851) (0.798) (0.629) (0.392) (0.413) (0.585)
Rain intensity 0.282** 0.121 0.103 0.203*** 0.284*** 0.046(0.117) (0.126) (0.123) (0.058) (0.073) (0.090)
Income 2013 −0.001 −0.001 −0.001 −0.005** −0.001 −0.012***(0.002) (0.002) (0.002) (0.003) (0.003) (0.003)
Population 0.0001*** 0.0001*** 0.0001*** 0.0001 −0.0001 0.0001*(0.000) (0.000) (0.000) (0.000) (0.000) (0.000)
Elevation −0.063 −0.057 −0.080* −0.046 −0.051 0.032(0.040) (0.040) (0.047) (0.040) (0.041) (0.043)
Land area 0.001** 0.000 0.000 0.001 0.004*** 0.002*(0.000) (0.000) (0.000) (0.002) (0.001) (0.001)
istance to coast −0.010 −0.000 0.007 −0.029 −0.121*** −0.127**(0.039) (0.039) (0.043) (0.066) (0.047) (0.050)
Entry province −0.553 −2.033 6.265 44.730*** 3.539***(1.993) (1.797) (6.681) (15.850) (0.896)
Middle province −1.842 −3.347* 4.942 44.566***(2.043) (1.951) (6.320) (15.627)
Wind 92 −1.673 −7.580* −7.337***(1.274) (4.063) (1.007)
Wind 119 16.276*** 14.431*** 15.284*** 13.875*** 15.016***(1.099) (0.804) (3.930) (0.680) (0.657)
Corals (presence) −1.603** −1.083* −2.267***(0.813) (0.587) (0.613)
Corals (hectare) −0.403(0.283)
Structure (presence) −0.041(0.497)
Urban dummy 2.104**(0.907)
Constant −1.403 −15.053*** −8.352* −21.124** −59.943*** −22.539***(3.418) (3.574) (4.294) (9.639) (14.849) (4.328)
Pseudo R−square 0.7445 0.7541 0.7691Log likelihood −137.06 −110.07 −78.78Observations 378 378 365 365 306 262
Note: Robust standard errors in parentheses, *** p<0.01, ** p<0.05, * p<0.1

20 Economy and Environment Program for Southeast Asia
The negative sign of income suggests that wealthier coastal villages were more likely to mitigate storm-related disasters, however, the coefficient is not significant in the Poisson regression but is significant in the negative binomial regression. The income of coastal villages could be translated to building physical structures such as sea wall, dikes, and other flood-control structures, which could help protect coastal villages. On average, only 30 percent of the coastal villages have protective structures present in their locality before the typhoon hit the Visayas region. The coefficient for rain intensity is positively associated with number of deaths. We also controlled for the distance of the village center to the coastline, which was one of the confounding variables highlighted by Das and Vincent (2009). We considered the village center as the area where the population is concentrated. Our results indicated that the village centers far from the coastline had fewer deaths. However, the result was not significant in the Poisson regression.
The coefficient of mangrove cover in 2010 is negative and remained significant when other confounding variables were added progressively. The fact that the coefficient of mangrove cover remained negative and significant implies that the remaining mangrove cover did play a protective role. This result is consistent with what was reported by Das and Vincent (2009). The coefficients of mangrove 2010 do not fluctuate drastically across specifications and the magnitudes of the coefficients change only a little ranging around −0.023 to −0.027. For model 2, we added dummy variables for groups of provinces and wind speed. Since the model would not converge when we included 12 different dummies for each province, we categorized the provinces into three groups. The Visayas region where the super typhoon Haiyan traversed is composed of several islands representing different provinces. The first group of provinces included those that are facing the Pacific Ocean and first received the brute force of the super typhoon. The second group of provinces included those in the middle area. The third group of provinces included the exit point of the typhoon through the West Philippine Sea. Though the effect of the provincial group dummy is not significant, still the coefficient of mangrove cover is negative and significant implying that the remaining mangrove vegetation provided significant protection services to coastal villages.
We continued to add other confounding variables to our estimation and for model 2, we included the dummy variable for wind speed. Results show that wind speed of more than 100 kilometers per hour (kph) significantly affected the number of deaths. The coastal villages in the study were disaggregated into three bandwidths of wind speed. A quarter of the coastal villages lay within the 64 kph bandwith, another quarter lay within the 92 kph bandwidth, and close to 50 percent of the coastal villages were situated in the 119 kph bandwidth. Results show that coastal villages situated in a 119 kph bandwidth suffered the worst casualty compared to those in the 64 kph bandwidth. The coefficient is positive and significant suggesting that in areas where wind speed was relatively strong, coastal villages suffered more deaths. Due to the presence of several dummy variables, dummy for wind speed 92 for model 2 was automatically dropped from the regression.
In model 3, we added the dummy variable capturing the presence of coral reefs. We controlled for the effect of corals in attenuating waves heading for coastal communities. Ferrario et al. (2014) documented that coral reefs provided substantial protection by reducing wave energy and impact of storm surges. Since coastal villages have limited information on the area of corals, we used a dummy variable to represent the presence of corals in their locality. Results show that coastal villages with corals suffered less damage compared to coastal villages without corals. This result reflects the strong potential of corals to break wave energy and storm surges reducing their damaging effect once they reach the coastal areas. However, it will be more interesting to measure the extent of coral cover in the region since the dummy variable does not capture the extent of coral cover. This is beyond the current scope of the study due to unavailability of data. Even after controlling for the presence of corals and other confounding variables on village- and storm-related characteristics, the statistical evidence of the lifesaving service provided by mangroves is still significant. This protection service is robust in several specifications.

Valuing the Protection Service Provided by Mangroves in Typhoon-hit Areas in the Philippines 21
When the presence of overdispersion is detected, the standard errors of the estimation will be affected. To adjust for this issue, negative binomial regression was used and the results are summarized in model 4, model 5, and model 6. Model 4 has the same explanatory variables as model 3 but uses negative binomial regression while model 3 uses the Poisson process. Results show that the coefficient of mangrove cover in 2010 is negative but not significant. However, when we added the other confounding variables in model 5, results of mangrove cover was highly significant. The results of several estimations were relatively similar though there were minor fluctuations in the coefficients. The main independent variable, which is mangrove cover in 2010, still showed a negative and significant association with number of deaths. This supports our hypothesis that coastal villages with substantial mangrove cover suffered less deaths compared to villages with thinner mangrove cover. On average, the expected reduction in the log count of deaths with a hectare increase in mangrove cover is 0.026.
For model 5, we added a dummy variable for the presence of protective structures in the village. Results show that on average, coastal villages with sea walls, dikes, and other flood-control structures suffered less damage compared to coastal villages that did not. However, we cannot assert this claim because the test shows that the coefficient is not significantly different from zero. This result is complemented by data from our focus groups discussions. When we asked about the presence of protective structures in their villages, officers would mention that these structures were heavily damaged during the typhoon incident, others reported that these structures were not of good quality and old when the typhoon hit their place. These reports can partially support why the presence of structures is not significantly different from zero. In the negative binomial regression approach, the effect of village distance to the coastline is negative and significant suggesting that there were fewer deaths in villages located further away from the coastline. This result provides further evidence for policy makers to enforce a no-build-zone policy within a prescribed distance from the coastline.
The urban dummy (model 5), which is a classification based on the National Statistical Coordination Board (NSCB 2003), is negative and significant, suggesting that villages classified as urban suffered more deaths compared to rural villages. According to the NSCB (2003), a village can be considered urban if (1) it has a population size of 5,000 or more, or (2) it has at least one establishment with a minimum of 100 employees and five or more facilities within a 2-kilometer radius from the village center. With this definition, being urban is highly correlated with population and income. Results show that the urban dummy is picking up the effect of population and income. This is reflected in the insignificant coefficient of income and the negative yet insignificant coefficient of population. Results of income and population are different in model 4 and model 6 where the urban dummy was not included. In model 6, we tried using the area of coral reefs instead of just its presence. The number of observations was reduced to 262 villages and the results are as expected—the coefficient of area of coral reefs was negative yet insignificant
To check for the robustness of our results, we clustered the standard errors at municipality level, which is justified because the LGU headed by the mayor coordinates and enforces storm-related preparedness at the local level. In the Philippines, there is no local weather department for every municipality but PAGASA is the national weather bureau. PAGASA monitors the weather system and announces if there are typhoons. The emergency response organization, locally known as the Disaster Risk Reduction and Management Council (DRRMC), under civil defense, was not fully activated in all municipalities. The DRRMC is supposed to be instituted in every municipality but before the Haiyan incident, most municipalities did not have a local DRRMC. So by default, it is the mayor—in coordination with the village chief—that plays important role of enforcing preemptive evacuation measures.
Table 7 presents the results with standard errors adjusted for 60 clusters at the municipality level for both Poisson and negative binomial regression. This assumes that the early warning system and other preemptive evacuation do not deviate across villages within the same municipality level. This is reflected in our focus groups discussions where participants mentioned

22 Economy and Environment Program for Southeast Asia
Table 7. Estimates of mangrove protection service against typhoon with number of death (including missing) as dependent variable using clustered standard errors at municipality level
VariablesPoisson Negative Binomial
Model 1 Model 2 Model 3 Model 4 Model 5 Model 6
Mangrove 2010 −0.023* −0.027* −0.024* −0.010 −0.026*** −0.025**(0.013) (0.015) (0.014) (0.013) (0.010) (0.012)
Mangrove 1944 −0.004 −0.002 −0.003 0.007 0.008 0.004(0.006) (0.007) (0.007) (0.006) (0.006) (0.006)
Storm surge 2.693*** 2.553*** 1.900** 1.935*** 1.623** 3.219***(0.940) (0.870) (0.769) (0.573) (0.714) (0.497)
Rain intensity 0.282* 0.121 0.103 0.203** 0.284** 0.046(0.153) (0.156) (0.153) (0.093) (0.113) (0.114)
Income 2013 −0.001 −0.001 −0.001 −0.005* −0.001 −0.012***(0.002) (0.002) (0.002) (0.003) (0.004) (0.002)
Population 0.0001*** 0.0001*** 0.0001*** 0.0001 −0.0001 0.0001(0.000) (0.000) (0.000) (0.000) (0.000) (0.000)
Elevation −0.063* −0.057* −0.080** −0.046 −0.051 0.032(0.034) (0.034) (0.035) (0.047) (0.035) (0.056)
Land area 0.001 0.000 0.000 0.001 0.004*** 0.002*(0.000) (0.000) (0.000) (0.002) (0.001) (0.001)
Village distance to coast
−0.010 −0.000 0.007 −0.029 −0.121** −0.127***
(0.038) (0.036) (0.038) (0.066) (0.050) (0.039)Entry province −0.553 −2.033 6.265 44.730*** 3.539***
(2.502) (1.985) (7.001) (15.919) (0.956)Middle province −1.842 −3.347 4.942 44.566***
(2.437) (2.099) (6.786) (15.627)Wind 92 −1.673 −7.580* −7.337***
(1.461) (3.958) (1.184)Wind 119 16.276*** 14.431*** 15.284*** 13.875*** 15.016***
(1.546) (0.997) (3.935) (0.944) (0.843)Corals (presence)
−1.603 −1.083* −2.267***
(1.004) (0.604) (0.620)Corals (hectare) −0.403
(0.255)Structure (presence)
−0.041
(0.714)Urban dummy 2.104*
(1.157)Constant −1.403 −15.053*** −8.352*** −21.124** −59.943*** −22.539***
(3.540) (3.532) (3.109) (10.260) (15.793) (5.718)Pseudo R−square
0.7445 0.7541 0.7691
Log likelihood −137.06 −110.07 −78.78Observations 378 378 365 365 306 262
Note: Robust standard errors in parentheses, *** p<0.01, ** p<0.05, * p<0.1

Valuing the Protection Service Provided by Mangroves in Typhoon-hit Areas in the Philippines 23
that the LGUs and police officers were in-charge of the preemptive evacuation process. The early warning issued by the LGU has a strong influence on the number of people who evacuated and prepared for the coming typhoon.
Results show that the coefficients remain the same on the standard errors where corrected. The significant estimations remain largely similar to our previous results. However, the clustering of standard errors at municipality level resulted in larger standard errors translating to a minor loss in the significance level of our main independent variable. For example, the coefficient of mangrove cover in model 2 has a p-value of 0.073 (Table 7,) but previously it had a p-value of 0.046. This suggests that even after clustering, there is compelling evidence that mangroves provided significant protection services to coastal villages.
For the control variables, the level of significance is not largely affected by the clustering of standard errors at the municipality level in both Poisson and negative binomial regression. Significant determinants affecting the death toll include the height of the storm surge and wind speed of around 120 kilometers per hour. The associated signs of the coefficients of the control variables are as expected. It is interesting to point out that the presence of corals consistently and significantly showed a negative association with the number of deaths. There is evidence to indicate that the presence of coral reefs was able to help in reducing the expected number of casualties in the coastal villages. Policy makers should exhaust the potential of natural resources, such as mangrove and coral reefs, in the provision of security and protection to its coastal communities. In addition, the coefficient of distance of the village to the coastline is negative and significant suggesting that villages located further away from the coasts suffered fewer deaths. On average, a meter increase in the distance between the village center and the coastline is associated with a reduction in the log count of death by a factor of 0.12. Policy makers should intensify its enforcement of the no-build zone policy within the prescribed distance from the coastline to reduce the likelihood of typhoon-related casualty.
Results of the different specifications show that the coefficient of mangrove cover in 2010 is negative and significant except in model 4. This suggests that the life saving property of mangroves is robust across different specifications and empirical approaches. There is strong evidence to indicate that indeed mangroves were able to protect coastal communities against the damaging effects of super typhoon Haiyan.
When we only included mangrove coverage and population as main predictors in the analysis, the associated life saving effect of mangroves is even larger. This depicts the bias associated when other confounding variables, such as demographic characteristics of coastal villages and topography, are not controlled for. This reflects the problem of omitted variable bias if we had controlled less carefully for other observable characteristics of coastal villages. Hence other observable characteristics are included in the estimation. Results show that consistent across different specifications, storm surge is one of the strongest determinants explaining the number of deaths in coastal villages. More deaths are associated in areas that suffered higher level of storm surges. Other significant variables include rain intensity, elevation, village income, population, land area, distance of the village to the coastline, provincial dummy, urban dummy, and presence of corals. Though the presence of physical structures is negatively associated with death count, it cannot be conclusively argued because it is not statistically significant.
We also investigated the protective function that coral reefs provide to coastal communities. Recent literature (Ferrario et al. 2014 ) pointed out that coral reefs protect coastal communities by breaking strong waves coming to the coast. To capture this effect, we included both the presence of coral reefs and the estimated coral reef area. Results show that corals were able to contribute to the reduction of the damaging effects of typhoon and the correlation between corals and number of deaths in the coastal villages is negative and significant. However, interpretation should be taken with caution given that the number of coastal villages included in the analysis was reduced to around 300.

24 Economy and Environment Program for Southeast Asia
We wanted to control for individual province fixed effects but as the analysis failed to converge with the inclusion of too many provincial dummies, we controlled for groups of provinces. Results show that there were more accounts of death in the entry and middle group of provinces compared to the exit group. The entry group is composed of Leyte and Samar where the super typhoon first made land fall. The middle group of provinces includes the islands of Cebu, Bohol, Negros, and Panay and the exit province where the typhoon left as it continued to move to the West Philippine Sea is Palawan.
Using the estimated coefficients of model 3 in Table 7, we estimated the value of the protective function provided by mangroves in saving the lives of residents in coastal communities based on a sample of 365 coastal villages. We followed the procedure suggested by Das and Vincent (2009) in estimating the life-saving protection of mangroves. Table 8 shows the valuation of the protective function provided by mangroves in the typhoon-hit areas in the Philippines. The predicted increase in the mean number of deaths if mangroves had been absent when the super typhoon hit the country was equivalent to 1 person (0.983). This reflects the life saving property of mangroves present in coastal areas just before the typhoon hit the Philippines. This further implies that the estimated number of averted deaths due to the presence of mangroves is 0.0142 lives per hectare. To value the retention of mangroves, we looked at market value of fishponds because one of the major causes of mangrove loss is conversion to aquaculture. The price greatly varies across areas hit by the super typhoon. Using the minimum assessed value of fishponds in Southern Leyte, Table 8 shows that retention of mangroves in the areas where the super typhoon hit is economically justified. This is manifested by the estimated average cost of saving a life amounting to as much as USD 302,000 (PHP 15 million) by retaining a hectare of mangroves. This estimated value is similar to what was reported by Das and Vincent (2009). Based on their calculations, the estimated average cost of saving a life by retaining 1999 mangrove area (INR per life) in Orissa, India is around INR 12 million (USD 292,000).
For our valuation, we used the market value of fishponds per hectare because this captures the opportunity cost of retaining a hectare of mangroves since the conversion of mangroves into aquaculture is one of the main causes of declining mangrove cover in the Philippines (Primavera 2000). Hence, we used the market value of fishponds as the opportunity cost of saving a life by retaining the current mangrove cover. We also tried another specification for estimating the life
Table 8. Estimated average cost of saving a life by retaining mangrove cover in 2010 in Visayas, Philippines
Steps in Calculation ResultA. Predicted mean number of deaths per coastal village
( = mean of fitted values from Model 6, Table 7)0.989
B. Predicted mean number of deaths per coastal village, if mangroves had been absent ( = mean of fitted values from Model 6, Table 7 with mangrove 2010 width = 0)
1.972
C. Predicted increase in mean number of deaths per village, if mangroves had been absent (B – A)
0.983
D. Predicted increase in total number of deaths, if mangroves had been absent (C*n) with n = 365 coastal villages
359
E. Mangrove area in 2010 (hectares) 25,283.87F. Predicted number of averted deaths per hectare of mangrove (D/E) 0.0142G. Average price of agricultural land near coastal villages (pesos per hectare)* 210,000H. Estimated average cost of saving life by retaining a hectare mangrove area
(G/F) (pesos per life); 1 USD = PHP 49PHP 14,788,730
(USD 301,810.82)
Note: * The price varies greatly across areas. For this estimation, we used the minimum assessed value of fishponds in Southern Leyte (OSP 2009).

Valuing the Protection Service Provided by Mangroves in Typhoon-hit Areas in the Philippines 25
saving property of mangroves. Using model 5 (Table 7), the estimated average value of retaining a hectare of mangrove for saving a life is around USD 72,000 (PHP 3.5 million).
The number of casualties is largely affected by preemptive evacuation measures enforced and coordinated by the LGUs. In our focus groups discussions, the respondents emphasized that wives, children, grandparents, and other vulnerable members of the family evacuated to designated areas or moved to relatives with concrete houses but the husband or father usually stayed behind to guard the house and other property. This indicates that the number of deaths is subject to how receptive households are during the evacuation process. Since the homes and property of the residents could not be moved, they had to withstand the typhoon. As a final check, we investigated the protective functions of mangroves on housing property.
Table 9 shows the results of evaluating the protection service of mangroves on housing property. We monetized housing damage by utilizing data on government assistance paid for damaged houses to each village, which is the dependent variable. For totally damaged houses, each household received USD 612 (PHP 30,000) compensation while households with partially damaged houses received USD 204 (PHP 10,000) (Relief Web 2015). We conducted a separate analysis for totally and partially damaged houses using ordinary least squares because the dependent variable is the compensation received. In analyzing damage to housing property, we replaced the population variable with the number of households per village. Since convergence is not a problem with ordinary least squares, we controlled for 12 provincial dummies instead of grouping the provinces.
Controlling for several confounding variables, results show that mangrove cover was able to provide protection services to housing property. Across different specifications, the magnitude of the coefficient of mangrove cover in 2010 remained relatively similar but lost significance especially when all village level observable characteristics were included in the analysis. However, the associated sign of mangrove cover was still negative. This shows that the remaining mangrove vegetation when the super typhoon hit central Philippines indeed plays a protective function in reducing damage to houses. The coefficient of mangrove cover in 2010 for totally damaged houses is around 0.003 while the coefficient for partially damaged houses was relatively higher at around 0.007. The dependent variable, which is the compensation received per village, was transformed to logarithmic form and a zero value was placed for villages with no reported housing damage. Results suggest that an added hectare of mangrove cover is associated with a reduction of compensation for totally damaged houses by a factor of 0.3–0.4 percent and 0.7 percent for partially damaged houses. Using these marginal values, the compensation for housing damage per village will reduce to USD 143 for totally damaged and USD 122 for partially damaged houses with an added hectare of mangrove. Aggregating this value for all the villages included in the study, the estimated reduction in compensation for damaged houses is around USD 45,628–USD 53,482.
Aside from mangrove cover, the other significant determinants of housing damage include storm surge, rain intensity, land area, and wind speed. Super typhoon Haiyan caused massive devastation in the Visayas region due to its associated wind speed and storm surge, which are manifested by the positive and significant coefficient of storm surge on housing damage. In terms of the magnitude of coefficients, storm surge was highest suggesting that a meter increase in the height of the storm surge is associated with an increase in totally and partially damaged houses by more than 100 percent. The height of the storm surge is the strongest determinants of housing damage, followed by wind speed and rain intensity. Results suggest that characteristics of the storm brought the most damage to housing property. The effect of maximum wind speed on housing damage is consistent across several specifications. Results of the study is similar to what was reported by Das and Crépin (2013) showing that villages without mangroves suffered more wind-related damage than villages situated behind mangroves. It would have been ideal if the data allowed us to differentiate the damaged houses in terms of quality. With the current data set, we did not have data on housing materials (whether houses were built of concrete or light materials). In addition, rain intensity also positively affected housing damage.

26 Economy and Environment Program for Southeast Asia
Table 9. Estimates of mangrove protection service against typhoon with compensation paid on housing damage (totally and partially damaged) as dependent variable
Variables Totally Damaged Houses Partially Damaged HousesModel 8 Model 9 Model 10 Model 11 Model 12 Model 13 Model 14
Mangrove 2010 −0.003* −0.003* −0.004* −0.005 −0.007** −0.007** −0.002(0.002) (0.002) (0.002) (0.003) (0.003) (0.003) (0.005)
Mangrove 1944 0.001 0.002 −0.003* −0.005** 0.004 0.004* −0.004(0.002) (0.002) (0.002) (0.002) (0.002) (0.003) (0.003)
Storm surge 4.037*** 1.148*** 1.764*** 0.230 3.602*** 1.006** −0.009(0.547) (0.437) (0.621) (0.417) (0.454) (0.414) (0.451)
Rain intensity 0.833*** 0.746*** 0.169** 0.005 0.701*** 0.627*** −0.031(0.049) (0.037) (0.070) (0.081) (0.049) (0.043) (0.099)
Income 2013 −0.002 0.000 −0.002 −0.001 −0.001 0.001 −0.002(0.002) (0.002) (0.001) (0.001) (0.002) (0.002) (0.002)
Households 0.001** 0.000 −0.001 −0.043* 0.000 −0.000 0.000(0.000) (0.000) (0.001) (0.026) (0.000) (0.001) (0.001)
Elevation 0.011 −0.002 0.002** 0.022 −0.044(0.027) (0.026) (0.001) (0.035) (0.040)
Land area 0.000** 0.002*** 0.000 0.0001* 0.003*(0.000) (0.001) (0.001) (0.000) (0.001)
Village distance to coast
−0.000 −0.033 −0.017 0.009 −0.022
(0.027) (0.036) (0.044) (0.032) (0.049)Max wind speed 0.065*** 0.111*** 0.120*** 0.058*** 0.114***
(0.004) (0.012) (0.010) (0.004) (0.009)Corals (hectare) 0.036 0.038 −0.013
(0.028) (0.036) (0.028)Structure (presence)
0.176 0.646
(0.465) (0.532)Urban dummy −0.233 −0.530
(0.502) (0.560)Provincial dummy
NO NO YES YES NO NO YES
Constant −1.785*** −7.157*** −6.185** −2.704 −0.422 −6.435** −0.847(0.602) (2.469) (2.643) (2.727) (0.656) (3.221) (3.998)
Observations 374 374 260 221 374 374 221R−squared 0.590 0.736 0.861 0.858 0.483 0.613 0.769
Note: Robust standard errors in parentheses, *** p<0.01, ** p<0.05, * p<0.1
Valuing the Protection Service Provided by Mangroves in Typhoon-hit Areas in the Philippines 27
As compared to the previous regression analyses with number of deaths as the dependent variable, Table 9 shows that the income variable, which is previously significant in the negative binomial analysis, is now insignificant across different specifications. This suggests that the influence of income in reducing damage to property is less apparent than its influence in reducing deaths. This is largely because we do not have information on the average income of the households, what we have is the income of the village given by the national government. We were expecting that coastal villages with higher income suffered less damage to housing property suggesting that richer coastal villages were able to build better houses that could withstand strong winds and typhoons since higher income also translates to building houses made of concrete and strong materials. Houses made of light materials can be easily blown away by strong winds. In addition, this result is complemented by the insignificant coefficient of the dummy variable for the presence of protective structures. This means that villages that reported protective physical structures showed no significant difference in housing damage compared to those that do not have protective physical structures.
The associated effect of coral reefs on damage to housing property is not clear and the associated coefficient is not significant. This is contrary to the previous results where the effect of corals is negative and significant. However, this should be interpreted with caution because of the limited data (the number of observations was reduced to around 200 villages). The coefficient for distance of the village center to the coastline is negative but not significant.
3.5. Highlights of the Focus Group Discussions (FGDs)
The FGDs were conducted to gain necessary information on the preparations and actions of residents before, during, and after the course of the typhoon’s bout. The FGDs were conducted in six villages or barangays in Leyte (Barangay 72 and Barangay Burayan, Tacloban City; Barangay Cogon, Palo; Barangay Jaena, Baybay) and Samar (Barangay San Juan and Barangay San Pedro, Sta Rita). Around 10−15 individuals participated in the FGDs. The participants were housewives, village officials, and elderly individuals whose income came from farming, fishing, and employment in the government and in private establishments.
Before the typhoon, the participants said that they were not able to attend any training or seminar on disaster preparedness, which implies that information related to protecting and sustaining themselves in times of disasters and calamities is limited. Still, indigent families usually living in houses made of light materials, were able to prepare food, clothing, water, medicine, and money. This is their usual preparation when there is a coming typhoon. People with sturdy houses said they opted to remain in their houses. In Barangay San Pedro, Sta. Rita, Samar families build “kurobs” which are like small tents made from coconut leaves, which they build in elevated open grounds.
As early as three days prior to the typhoon, house to house notification was done by the village officials to explain the extent and possible damage that the super typhoon can bring. Some officials announced the possibility of storm surge. However, they said that they took the information on storm surge lightly because they did not understand what a storm surge was and they had no prior experience about it.
During the typhoon, families who stayed in their houses panicked as the water rose quickly. Several families fled to the main road in search for higher ground in the course of strong winds and heavy rain. They were shocked by the strength and intensity of the typhoon. Participants reported that they were not able to anticipate the intensity of the typhoon even though there had been warnings about how strong it would be.
After the super typhoon, the residents immediately went to search and check on their families and relatives hoping for their survival. Others were shocked and traumatized and did not do anything immediately. Upon seeing the damage the typhoon wrought in the area, including

28 Economy and Environment Program for Southeast Asia
damage to property, lives, and livelihoods, they could hardly believe what they were seeing. There was massive destruction all over the place and they could not recognize their place anymore. A few days after, assistance and supplies from the local government and NGOs came.
The participants emphasized that seawalls were not sufficient protective barriers against the storm surge brought by the typhoon. All of them were aware of what mangroves were and the protection service that they could offer the community. The residents, however, felt that mangroves may not be enough in fully protecting them. They suggested that mangroves should be planted as first line-of-defense against the rise of the seawater, but that a seawall should still be placed supplementing the protection brought by the mangroves.
Figure 8 and 9 presents the documentation of the FGDs conducted in Leyte.
CONCLUSION
This study examines the protection service provided by mangroves to coastal communities from super typhoon Haiyan that hit central Philippines in November 2013. We built an econometric model controlling for historical accounts of mangroves and other confounding village characteristics. We took into consideration the fact that our sample only included villages that had historical mangrove cover. Coastal areas where mangroves historically did not thrive because of ecological conditions were excluded. We wanted to value the loss of mangroves and their typhoon protection service but for loss to occur, they should have existed in the first place. We collected data on the damage to lives and property brought by the super typhoon in 384 coastal villages.
We found that the coefficient of mangrove cover is negative and significant across different specifications implying that the remaining mangrove vegetation played a protective role when the super typhoon hit central Philippines. This suggests that coastal villages with substantial mangrove cover suffered significantly fewer deaths and fewer totally damaged houses compared to coastal villages with reduced mangrove cover. Using the incidence rate ratio interpretation of the Poisson model, findings suggest that a one-hectare increase in mangrove cover is associated with a reduction in death toll by a factor of 2.6 percent and around 0.4−0.7 percent reduction in housing damage. Econometric evidence of this life- and property-saving effect of mangroves is robust. The coefficient of mangrove cover in 2010 remained negative and significant after we controlled for a wide range of potentially confounding storm characteristics, environmental, and demographic variables. Results exhibit additional evidence of the protection service that mangroves provide during typhoons. The valuation of this protection service amounts to an estimated value of USD 302,000 (PHP 15 million). This is the estimated average cost of saving a life by retaining the remaining mangrove vegetation. For damage to housing property, the estimated reduction in housing compensation is USD 53,000 for totally damaged houses and USD 46,000 for partially damaged houses. The protection and conservation of mangroves in the coastal villages in the country is a policy that is economically justified. Findings of the study can serve as an additional reason to invest in mangrove ecosystems as a way to protect coastal communities. This can be a long-term policy strategy to consider given that the Philippines will be adversely affected by climate change.
Despite the significant reduction of mangrove cover from 1944 to 2010, the ecosystem remained effective in reducing damage to lives and property brought about by the super typhoon. Results of the study strongly suggest that mangrove rehabilitation must be intensified in populated and urbanized areas as a way of securing lives, property, and livelihoods against the damaging effects of typhoons. However, future work needs to be done to assess whether areas that historically had mangroves could be rehabilitated. Aside from mangrove rehabilitation and conservation, coral reefs must also be given attention. Results of this study provides evidence of the protection service provided by coral reefs, too. With the increasing severity of the adverse

Valuing the Protection Service Provided by Mangroves in Typhoon-hit Areas in the Philippines 29
effects of climate change, the growing population and urbanization in coastal areas are largely at risk. Thus, managing the ecosystem as a measure of providing safety and security is an economically justified policy strategy.
Policy makers should prioritize the rehabilitation of mangroves and coral reefs instead of replacing them with man-made structures and other forms of ecosystem conversions. However, the engineering approach, such as construction of physical structures, can be complemented or combined with the natural ecosystems approach. This will ensure the protection of residents in coastal areas against typhoon-related damage. The Philippines, being an archipelago and situated in the Pacific, is expected to experience more frequent and stronger typhoons due to the continued perturbation in our climate system. Hence, the provision of security to its residents should be a priority and in this regard, mangroves can significantly help.
Figure 8. Focus group discussion in Barangay Jaena, Baybay, Leyte with participants mapping their houses and the locations of mangroves
Figure 9. Focus group discussion in Cogon, Palo, Leyte
with participants sharing their typhoon experience
30 Economy and Environment Program for Southeast Asia
REFERENCES
Badola, R.; and S. Hussain. 2005. Valuing ecosystem functions: an empirical study on the storm protection function of Bhitarkanika mangrove ecosystem, India. Environmental Conservation. 32 (1): 85−92.
Bann, C. 1998. The economic valuation of mangroves: a manual for researchers. Accessed November 2015. https://idl-bnc.idrc.ca/dspace/bitstream/10625/14541/6/108379.pdf
Barbier, E.B. 2014. Valuing the storm protection service of estuarine and coastal ecosystems. Ecosystem Services. 11: 32–38.
———. 2007. Valuing ecosystem services as productive inputs. Economic Policy. 22 (49): 177−229.
Barbier, E.B.; E.W. Koch; B.R. Silliman; S.D. Hacker; E. Wolanski; J. Primavera; and D.J. Reed. 2008. Coastal ecosystem−based management with nonlinear ecological functions and values. Science. 319 (5861): 321−323.
Becira, E.M. 2006. State of mangroves in Tiniguiban Cove, Puerto Princesa Bay, Puerto Princesa City, Palawan. Science Diliman. 2 (17): 46−51.
Brander, L.; A.J. Wagtendonk; S.S. Hussain; A. McVittie; P.H. Verburg; R.S. de Groot; and S. van der Ploeg. 2012. Ecosystem Service values for mangroves in Southeast Asia: a meta-analysis and value transfer application. Ecosystem Services. 1(1): 62−69.
Cameron, C.; and P. Trivedi. 1986. Econometric models based on count data: comparisons and applications of some estimators and tests. Journal of Applied Econometrics. 1 (1): 29−53.
———. 1998. Regression analysis of count data. Accessed April 18, 2017. http://faculty.econ.ucdavis.edu/faculty/cameron/racd/count.html
———. 2013. Regression analysis of count data, 2nd ed. Cambridge University Press, Cambridge.
Costanza, R.; O. Pérez−Maqueo; M.L. Martinez; P. Sutton; S.J. Anderson; and K. Mulder. 2008. The value of coastal wetlands for hurricane protection. AMBIO: A Journal of the Human Environment. 37 (4): 241−248.
Das, S. 2009. Can mangroves minimize property loss during big storms? an analysis of house damage due to the super cyclone in Orissa. South Asian Network for Development and Environmental Economics (SANDEE) Working Paper No. 42−09. SANDEE, Kathmandu, Nepal.
Das, S.; and A.S. Crépin. 2013. Mangroves can provide protection against wind damage during storms. Estuarine, Coastal and Shelf Science. 134 : 98−107.
Das, S.; and J.R. Vincent. 2009. Mangroves protected villages and reduced death toll during Indian super cyclone. Proceedings of the National Academy of Sciences. 106 (18): 7357−7360.
DENR (Department of Environment and Natural Resources). 2016. National Greening Program, DENR. Accessed July 2016. http://www.denr.gov.ph/priority−programs/national− greening−program.html

Valuing the Protection Service Provided by Mangroves in Typhoon-hit Areas in the Philippines 31
Germanwatch. 2014. Global climate risk index. Accessed April 19, 2017. http://germanwatch.org/en/cri
Grogger, J.; and R. Carson. 1991. Models for truncated counts. Journal of Applied Econometrics. 6 (3): 225−238.
FAO (Food and Agricultural Organization). 2005. Global forest resources assessment 2005: thematic study on mangroves in the Philippines. Accessed May 2015. www.fao.org/forestry/9404−0e3980b4973c9a1f9d8daa98dc2a4f479.pdf
Ferrario, F.; M. Beck; C. Storlazzi; F. Micheli; C. Shepard; and L. Airoldi. 2014. The effectiveness of coral reefs for coastal hazard risk reduction and adaptation. Nature Communications. 5: 3794.
Ferrer, A.; J. Hopanda; M. Orquejo; A. Moscoso; and R. Sadaba. 2011. Reversion of disused fishpond lease agreement areas to mangrove forest in Region VI, Philippines. Economy and Environment Program for Southeast Asia (EEPSEA), Los Baños, Laguna, Philippines.
Hilbe, J. 2011. Negative binomial regression 2nd ed. Cambridge University Press, Cambridge.
Holtz, M. 2013. Saved by the mangroves? A philippine town dodges Haiyan’s storm surge. Accessed April 18, 2017. https://www.pri.org/stories/2013-11-29/saved-mangroves-philippine-town-dodges-haiyans-storm-surge
Huber, P. 1967. The behavior of maximum likelihood estimates under nonstandard conditions. In L.M. Neyman, ed., Proceedings of the 5th Berkeley Symposium on Mathematical Statistics and Probability, University of California Press, Berkeley, 221−233.
Kathiresan, K.; and N. Rajendran. 2005. Coastal mangrove forest mitigate tsunami. Estuarine, Coastal and Shelf Sciences. 65: 601−606.
Kerr, A.M.; A.H. Baird; and S.J. Campbell. 2006. Comments on coastal mangrove forest mitigate tsunami. Estuarine, Coastal and Shelf Sciences. 67: 539−541.
Kinver, M. 2005. Tsunami: mangroves save lives. Accessed April 24, 2017. http://news.bbc.co.uk/2/hi/ science/nature/4547032.stm
Long, J.; and C. Giri. 2011. Mapping the Philippines’ mangrove forests using Landsat imagery. Sensors. 11 (3): 2972−2981.
Mei, W.; and S.P. Xie. 2016. Intensification of landfalling typhoons over the Northwest Pacific since the late 1970s. Nature Geoscience. 9: 753−757.
Mendoza A.B.; and D.P. Alura. 2001. Mangrove structure on the eastern coast of Samar Island, Philippines. In D.E. Scott, R.H. Mohtar, and G.C. Steinhardt, eds., Sustaining the global farm? Selected papers from the 10th International Soil Conservation Organization Meeting, May 24–29, 1999, West Lafayette, 423–425. International Soil Conservation Organization, United States Department of Agriculture, Agricultural Research Service, National Soil Erosion Research Laboratory, and Purdue University, West Lafayette.
NDRRMC (National Disaster Risk Reduction and Management Council). 2015. Final report on effects of Typhoon Yolanda (Haiyan). Accessed August 2016. http://ndrrmc. gov.ph/attachments/article/1329/FINAL_REPORT_re_Effects_of_Typhoon_YOLANDA_

32 Economy and Environment Program for Southeast Asia
(HAIYAN)_06−09NOV2013.pdf
NEDA (National Economic Development Authority). 2014. The philippines: fifth progress report−millenium development goals executive summary. National Economic Development Authority, Ortigas, Pasig City.
NSCB (National Statistical Coordination Board). 2001. The internal revenue allotment (IRA): How is it allocated? Accessed January 2015. http://www.nscb.gov.ph/announce/ 2001/IRASS_how.asp
———. 2003. Resolution No. 9 − Adoption of the operational definition of urban areas in the Philippines. Accessed October 2016. http://www.nscb.gov.ph/ resolutions/2003/9.asp
OSP (Office of the Sangguniang Panlalawigan). 2009. Excerpt from the minutes of the regular session of the Sangguniang Panlalawigan in Southern Leyte. Accessed August 2016. http://jmc.blgf.gov.ph/smv/ region8/MaasinCity.pdf
PhilGIS. 2015. Philippine GIS data clearinghouse. Accessed August 2015. https://philgis.org/
Philippine Daily Inquirer 2013. Mangroves shielded Sagay islets’ residents. Accessed May 2015. www.newsinfo. inquirer.net/537063/mangroves−shielded−sagay−islets−residents
Primavera, J.H. 1995. Mangroves and brackish water pond culture in the Philippines. Hydrobiologia. 295: 303−309.
———. 2000. Development and conservation of Philippine mangroves: institutional issues. Ecological Economics. 35: 91−106.
Primavera, J.H.; R.B. Sadaba; M.J.H.L. Lebata; and J.P. Altamirano. 2004. Handbook of mangroves in the Philippines – Panay. SEAFDEC Aquaculture Department (Philippines) and UNESCO Man and the Biosphere ASPACO Project, Tigbauan, Iloilo.
Primavera, J.H.; J.D. Savaris; B. Bajoyo; J.D. Coching; D.J. Curnick; R. Golbeque; A.T. Guzman; J.Q. Henderin; R.V. Joven R.A. Loma; and H.J. Koldewey. 2012. Manual for community−based mangrove rehabilitation – mangrove manual series No. 1. Zoological Society of London, London, UK.
Rappler. 2013. DENR to restore mangrove forests in Yolanda-hit areas. Accessed May 2015. http://www.rappler.com/move−ph/issues/disasters/typhoon−yolanda/44182−denr−restore−mangrove−forests−yolanda
Relief Web. 2015. P1.4-B shelter aid released for ‘Yolanda’ survivors in Visayas. Accessed September 6 2016. http://reliefweb.int/report/philippines/p14−b−shelter−aid−released−yolanda−survivors−w−visayas
Spalding M.D.; M. Kainuma; and L. Collins. 2010. World mangrove atlas. Earthscan and the International Society for Mangrove Ecosystems, Food and Agriculture, Washington, D.C.
Spaninks, F.; and P. Van Beukering. 1997. Economic valuation of mangrove ecosystems: potential and limitations. Accessed May 2015. http://papers.ssrn.com/sol3/papers.cfm?abstract_ id=34764
Stinger, L.; and S. Orchard. 2013. Mangroves, nature’s shield against typhoons and tsunamis.

Valuing the Protection Service Provided by Mangroves in Typhoon-hit Areas in the Philippines 33
Accessed April 18, 2017. http://theconversation.com/mangroves-natures-shield-against-typhoons-and-tsunami-21051
Tan−Soo, J.; N. Adnan; I. Ahmad; S. Pattanayak; and J. Vincent. 2016. Econometric evidence on forest ecosystem services: deforestation and flooding in Malaysia. Environmental and Resource Economics. 63 (1) 25−44.
The New York Times Asia−Pacific Region. 2013. Mapping the destruction of typhoon Haiyan. Accessed May 2015. http://www.nytimes.com/interactive/2013/11/11/world/asia/typhoon−haiyan−map.html?_r=0
UNEP (United Nations Environment Programme). 2005. After the tsunami: rapid environmental assessment, report of UNEP Asian tsunami task force. Accessed May 2015. http://www.unep.org/tsunami/tsunami rpt.asp
University of Texas. 2015. Philippine islands topographic map 1944, US Army map series. Accessed June 2015. http://www.lib.utexas.edu/maps/ams/philippine_islands_500k/
Valiela, I.; J. Bowen; and J. York. 2001. Mangrove forests: one of the world’s threatened major tropical environments. BioScience. 51: 8.
White, H. 1980. A heteroskedasticity−consistent covariance matrix estimator and a direct test for heteroskedasticity. Econometrica. 48: 817−838.
World Bank. 2016. Managing coasts with natural solutions: guidelines for measuring and valuing the coastal protection services of mangroves and coral reefs edited by M.W. Beck and G.M. Lange. Wealth Accounting and the Valuation of Ecosystem Services Partnership (WAVES), World Bank, Washington, D.C.

34 Economy and Environment Program for Southeast Asia
APPENDICES
Appendix Figure 1. Documentation during the data gathering in Bohol and Samar
Appendix Table 1. Descriptive statistics for the sample included in the analysis
n Mean Std Dev. Minimum MaximumPopulation 384 1,794 2,568.38 209 22,468Number of households 384 393 539.47 41 5106Land area (GIS) 384 870.98 1,736.36 8.99 17,142.70Income (pesos) 384 1,238,663 862,382.6 448,452 88,275,579Elevation 384 92.80 7.78 48.26 107.42Average height of storm surge 384 0.42 0.53 0.10 1.60Rain intensity 384 8.12 4.92 2.59 15.86Maximum wind speed (kph) 384 87.88 51.22 36 210Corals (ha) 262 1.99 6.34 0 60Presence of corals (dummy) 365 0.32 0.47 0 1Village distance to coastline (meters) 384 10.26 8.323 0.042 49.83Mangrove cover 2010 (ha) 384 65.84 115.75 0.03 1518.20Mangrove cover 1944 (ha) 384 110.00 157.46 0.32 1324.33Mangrove cover difference (ha) 384 −44.16 104.80 −725.43 257.85Number of death 378 0.85 7.09 0 113Number of injured 339 2.61 15.43 0 153Number of missing 361 0.11 0.99 0 13Partially damaged houses 374 85.21 213.66 0 2382Totally damaged houses 374 58.37 130.48 0 1276