vanadium exhibit 1 - united states environmental ... either using an oxidation catalyst from the...
TRANSCRIPT


VANADIUM
A. Commodity Summary
According to the U.S. Bureau of Mines, the domestic vanadium industry consists of twelve firms, of which only six are active.1 Exhibit 1 presents the names and locations of the facilities involved in the production of vanadium. Raw materials include Idaho ferrophosphorus slag, petroleum residues, spent catalysts, utility ash, and vanadium bearing iron slag. Some vanadium is recovered from solution mining, however, that is only marginally economically feasible. Estimated domestic consumption of vanadium in 1994 was 4,100 metric tons.2
EXHIBIT 1
SUMMARY OF VANADIUM PROCESSING FACILITIES
Facility Name Location Type of Operations
Akzo Chemical Company Weston, MI Vanadium catalysts
AMAX Metals Recovery Corp Braithwaite, LA Vanadium Pentoxide
Ferrovanadium
Vanadium pentoxide from uranium byproducts (inactive)
Vanadium pentoxide
Vanadium pentoxide
Aluminum-vanadium master alloy
Ferrovanadium, ammonium metavanadate, and aluminum-vanadium
Ferrovanadium, aluminum-vanadium alloy, and Nitrovan (inactive)
Vanadium metal and vanadium-zirconium alloy
Vanadium pentoxide from uranium byproducts (inactive)
Vanadium pentoxide
Bear Metallurgical Corp. Butler, PA
Cotter Corp. Canon City, CO
Gulf Chemical & Metallurgical Corp. Freeport, TX
Kerr-McGee Chemical Corp Soda Springs, ID
Reading Alloys Robesonia, PA
Shieldalloy Metallurgical Corp Cambridge, OH
Stratcor Niagara Falls, NY
Teledyne Wah Chang Albany, OR
Umetco Minerals Blanding, UT
Stratcor Hot Springs, AR
Vanadium is principally used as an alloying element in iron and steel, with the steel industry accounting for more than 80% of the world's consumption of vanadium. Vanadium is added to the steel making process as a ferrovanadium alloy. This alloy is produced commercially by the reduction of vanadium pentoxide or vanadium
1 Henry E. Hillard, "Vanadium," from Minerals Yearbook Volume 1. Metals and Minerals, U.S. Bureau of Mines, 1992, p. 1463.
2 Henry E. Hillard, "Vanadium," from Mineral Commodities Summary, U.S. Bureau of Mines, 1995, p. 184.

bearing-slag with aluminum, carbon, or ferrosilicon.3 The addition of vanadium in amounts as small as 0.1% to an ordinary carbon steel can significantly improve both its toughness and its ductility. Such high-strength, low-alloy (HSLA) steels are attractive for highrise buildings, bridges, pipelines, and automobiles because of the weight savings obtained.4 Vanadium is also used in the production of titanium alloys for the aerospace industry and as the catalyst for the production of maleic anhydride and sulfuric acid.5
B. Generalized Process Description
1. Discussion of Typical Production Processes
Vanadium is usually produced as the byproduct or coproduct of another element, such as iron, uranium, molybdenum, or phosphorus. In the United States, vanadium is recovered: (1) as a principal mine product, (2) as a coproduct from carnotite ores, and (3) from ferrous slag as a byproduct in the production of elemental phosphorus. Increasingly, it is also being recovered by secondary processing of petroleum refinery residues, fly ash, and spent catalysts.6 Exhibit 2 presents an overview of the processes used to recover vanadium from various raw materials.
As Exhibit 2 illustrates, the vanadium product from the primary process is sent either to an acid leach or a salt roast process. The recovered vanadium product, usually sodium hexavanadate, is further processed to produce vanadium pentoxide. The vanadium pentoxide can then be reduced further to produce vanadium metal either by the aluminothermic, calcium, or carbon reduction processes. Each of these processes for preparing ferrovanadium is described in more detail below.
Vanadium was also once extracted and recovered as a coproduct with uranium from carnotite by direct leaching of the ore with sulfuric acid. Alternatively, the uranium ore source was also roasted, followed by concurrent leaching with dilute sulfuric acid. In some cases, the first leach was with a sodium carbonate solution. The vanadium and uranium could then be separated from the pregnant liquor by liquid-liquid extraction techniques.7
Due to market factors and the price of uranium, vanadium is not currently recovered from uranium.8
2. Generalized Process Flow Diagram
Vanadium can be recovered both from the primary processing of ores and from secondary processing of spent catalysts. In both cases, the production of vanadium can be separated into three general stages. Each of these stages is described below and outlined in the accompanying flow diagrams. The first stage involves the production of an oxide concentrate. The second stage involves the production of vanadium pentoxide either by fusion or dissolution. Production of vanadium metal or ingot is the third stage in the operation.
3 Ibid., pp. 1449-1450.
4 Peter H. Kuck, "Vanadium," from Mineral Facts and Problems, U.S. Bureau of Mines, 1985, p. 895.
5 Ibid.
6 Henry E. Hillard, 1992, Op. Cit., pp. 1447-1466.
7 Ibid., p. 1449.
8 Personal communication between Jocelyn Spielman, ICF Incorporated and Henry E. Hillard, Vanadium Specialist, U.S. Bureau of Mines, October 20, 1994.
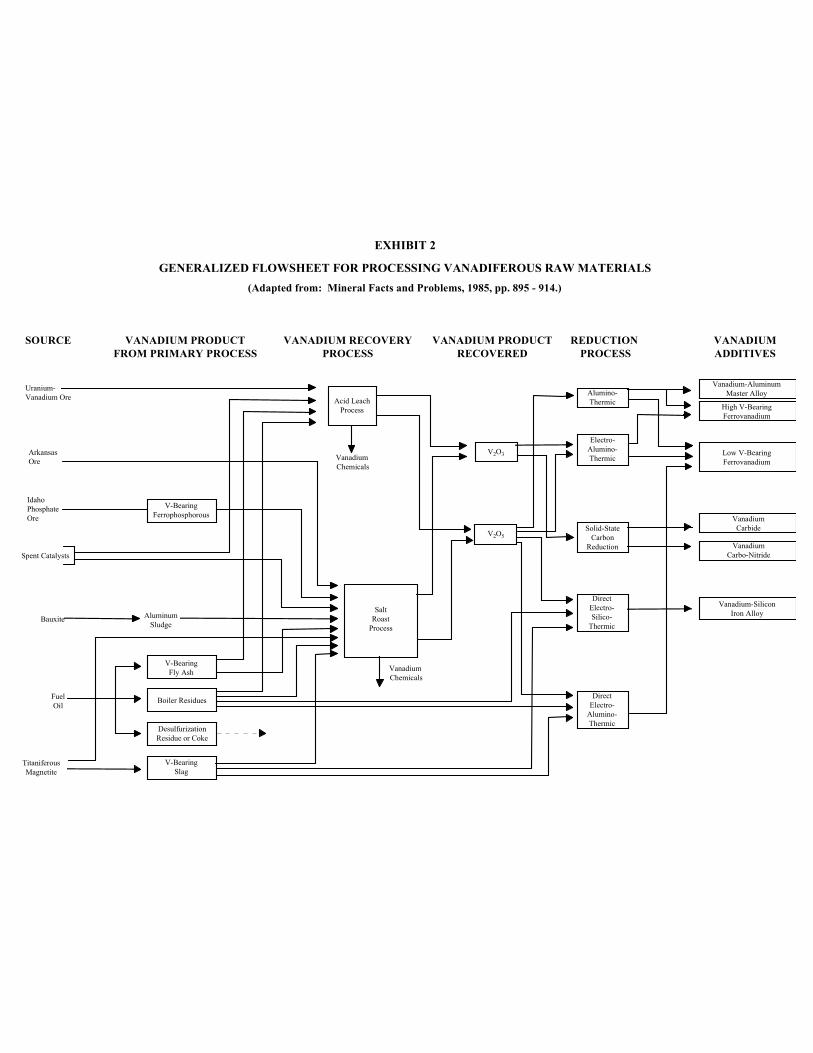
EXHIBIT 2
GENERALIZED FLOWSHEET FOR PROCESSING VANADIFEROUS RAW MATERIALS (Adapted from: Mineral Facts and Problems, 1985, pp. 895 - 914.)
V-Bearing Ferrophosphorous
Acid Leach Process
Uranium-Vanadium Ore
Spent Catalysts
Idaho Phosphate Ore
Bauxite Aluminum Sludge
V-Bearing Fly Ash
Boiler Residues
Desulfurization Residue or Coke
V-Bearing Slag
Fuel Oil
Titaniferous Magnetite
Arkansas Ore
Salt Roast
Process
Vanadium Chemicals
V2O3
V2O5
Vanadium Chemicals
Alumino-Thermic
Vanadium-Aluminum Master Alloy
High V-Bearing Ferrovanadium
Electro-Alumino-Thermic
Solid-State Carbon
Reduction
Direct Electro-Silico-
Thermic
Direct Electro-
Alumino-Thermic
Low V-Bearing Ferrovanadium
Vanadium Carbide
Vanadium Carbo-Nitride
Vanadium-Silicon Iron Alloy
SOURCE VANADIUM PRODUCT FROM PRIMARY PROCESS
VANADIUM RECOVERY PROCESS
VANADIUM PRODUCT RECOVERED
REDUCTION PROCESS
VANADIUM ADDITIVES

EXHIBIT 3
SODIUM HEXAVANDATE PRODUCTION
(Adapted from: 1988 Final Draft Summary Report of Mineral Industry Processing Wastes, 1988, pp. 3-245 - 3-253.)
Vanadium-bearing Material
Crushing
Sodium Salt Mixing
Roasting
Water Leaching/ Separation
Solution
Sulfuric Acid Precipitation
Wash Water Filtration
Sodium hexavandate
Solid Residues
Filtrate

EXHIBIT 4
VANADIUM PENTOXIDE PRODUCTS
(Adapted from: 1988 Final Draft Summary Report of Mineral Industry Processing Wastes, 1988, pp. 3-245 - 3-253.)
OPTION 1 Sodium Hexavandate
Fusion
Vanadium Pentoxide
OPTION 2 Sodium Hexavandate
Sodium Bicarbonate Solution
Dissolution
pH Adjustment
Precipitate (Impurities)
Ammonium Chloride Precipitation
FiltrateFiltration
Calcination
Vanadium Pentoxide

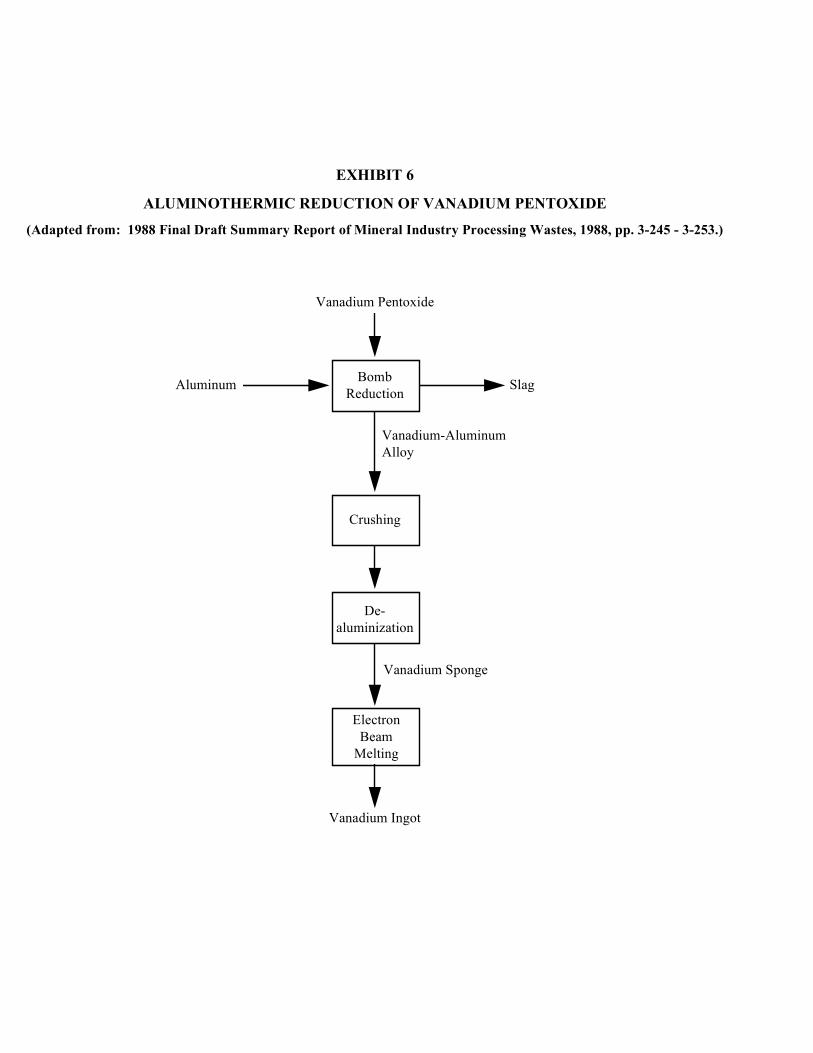
EXHIBIT 6
ALUMINOTHERMIC REDUCTION OF VANADIUM PENTOXIDE
(Adapted from: 1988 Final Draft Summary Report of Mineral Industry Processing Wastes, 1988, pp. 3-245 - 3-253.)
Vanadium Pentoxide
Aluminum Bomb Reduction
Vanadium-Aluminum Alloy
Crushing
De-aluminization
Vanadium Sponge
Electron Beam
Melting
Vanadium Ingot
Slag

Exhibit 3 presents the process for preparing sodium hexavanadate. Exhibit 4 presents two alternative processes producing vanadium pentoxide. Exhibits 5 and 6 present two alternative processes for reducing the vanadium pentoxide to metal.
Production of Sodium Hexavanadate
Recovery From Ore. Regardless of the source of the ore, the first stage in the ore processing is the production of an oxide concentrate. As shown in Exhibit 3, the ore is crushed, ground, screened, and mixed with a sodium salt, e.g., NaCl or Na2CO3. This mixture is then roasted at about 850 oC to convert the oxides to water-soluble sodium metavanadate. The solid mixture is then leached with water to dissolve the metavanadate and the sodium chloride. The resulting slurry is filtered and the insoluble iron oxide and phosphate are sent to disposal. Sodium hexavanadate (red cake) or sodium decavanadate is precipitated out by the addition of sulfuric acid and recovered by filtration.9
If the recovery of vanadium is associated with the recovery of molybdenum, the initial step in the vanadium recovery process is the removal of phosphorous by precipitation as insoluble magnesium phosphates. Aluminum, if it is present in solution, is removed as the hydroxide by acidification followed by filtration. Vanadium is then precipitated as ammonium metavanadate with excess NH4Cl, and is separated from the liquid phase by filtration. Molybdenum does not precipitate and the molybdenum-rich filtrate is routed to the molybdenum recovery process. When the source for the vanadium recovery is molybdenum, the ammonium metavanadate produced by the NH4Cl precipitation is calcined and fused to produce vanadium pentoxide.10
Recovery From Spent Catalysts. Secondary processing of spent catalysts has become a major source of vanadium, either using an oxidation catalyst from the production of sulfuric acid or maleic anhydride or a hydroprocessing catalyst from petroleum refining. Vanadium is recovered by roasting, followed by milling, leaching, and filtration to separate the solids from the solution containing vanadium. The solutions then go through various precipitation steps before the precipitation of vanadium as ammonium metavanadate, which is then decomposed and fused to form vanadium pentoxide or used directly to make other vanadium chemicals.11
Production of Vanadium Pentoxide
Exhibit 4 presents two of the methods for producing vanadium pentoxide from sodium hexavanadate: (1) fusion and (2) dissolution.
Fusion. The red cake or sodium hexavanadate can be further processed and fused at 700o C to yield a dense black product which is sold as technical-grade vanadium pentoxide, as shown in Exhibit 5. This product contains a minimum of 86 weight-percent pentoxide and a maximum of 8 weight-percent sodium oxide.12
Dissolution. Alternatively, the red cake may be further purified by dissolving it in an aqueous solution of sodium carbonate. Aluminum, iron, and silicate impurities precipitate from solution upon pH adjustment. Ammonium metavanadate is then precipitated by the addition of ammonium chloride. The precipitate is calcined to give a vanadium pentoxide product of greater than 99.8% purity.13
9 Ibid.
10 U.S. Environmental Protection Agency, Development Document for Effluent Limitations Guidelines and Standards for Nonferrous Metals Manufacturing Point Source Category, Vol. VI, Office of Water Regulations Standards, May 1989, p. 3512.
11 Ibid.
12 Henry E. Hillard, 1992, Op. Cit., p. 1449.
13 Ibid.

Production of Metallic Vanadium or Vanadium Ingot
Exhibits 5 and 6 present two alternative methods for reducing vanadium pentoxide to metallic vanadium. Exhibit 5 shows the calcium reduction process and Exhibit 6 outlines the steps for aluminothermic reduction. Vanadium pentoxide can also be reduced using either the thermit reaction (a variation on the aluminothermic reduction) or by solid-state carbon reduction.
Calcium Reduction. Calcium reduction involves combining vanadium pentoxide with calcium, adding iodine as a flux, and heating the mixture in a vacuum to form metallic vanadium. 14 Neither calcium reduction nor carbon reduction are currently used.15
Aluminothermic Process. As shown in Exhibit 6, in the aluminothermic process for preparing ferrovanadium, a mixture of technical grade vanadium pentoxide, aluminum, iron scrap, and a flux are charged into an electric furnace, and the reaction between aluminum and pentoxide is initiated. The reaction is highly exothermic, producing very high temperatures. The temperature can be controlled by reducing the particle size of the reactants and the feed rate of the charge and by using partially reduced pentoxide or by replacing some of the aluminum with a milder reducing agent. Ferrovanadium containing up to 80 weight-percent vanadium can be produced by this method.16
Thermit Reaction. Ferrovanadium can also be prepared by the thermit reaction, a variation on the aluminothermic reduction, in which vanadium and iron oxides are coreduced by aluminum granules in a magnesia-lined steel vessel or in a water-cooled crucible. The reaction is initiated by a barium peroxide-aluminum ignition charge. This method is also used to prepare aluminum master alloys for the titanium industry.17
3. Identification/Discussion of Novel (or otherwise distinct) Processes
Recent literature lists several new procedures for recovery of vanadium from industrial wastes, including:
C Extraction of vanadium from coke using microwave wet acid digestion.
"Certified coal standards and Venezuelan petroleum coke samples were submitted to microwave acid digestion to evaluate the convenience of this procedure for the extraction of their vanadium content. The solution and the solid residue remaining after microwave treatment were separated by filtration and analyzed for vanadium."18
C Recovery of vanadium from titaniferous slags by sulphiding.19
14 U.S. Environmental Protection Agency, "Vanadium," from 1988 Final Draft Summary Report Mineral Industry Processing Wastes, Office of Solid Waste, 1988, p. 3-245 - 3-253.
15 Personal communication between Jocelyn Spielman, ICF and Henry E. Hillard, Vanadium Specialist, U.S. Bureau of Mines, October 20, 1994.
16 Henry E. Hillard, 1992, Op. Cit., p. 1450.
17 Ibid.
18 Alvarado, Jose, et al. "Extraction of vanadium from petroleum coke samples by means of microwave wet acid digestion," FUEL, 69, January 1990, pp. 128-130.
19 G. J. Njau, B. Pei, and T. Rosenqvist, "Recovery of Reactive Metals (Manganese, Chromium, Vanadium) From Titaniferous Slags by Sulfiding," Scandinavian Journal Of Metallurgy, 20, No. 2, 1991, pp. 149-156.

C Recovery of vanadium from process residues.20
C Extraction of vanadium from industrial waste.21
C Recovery of pure vanadium oxide from Bayer sludge.22
4. Beneficiation/Processing Boundary
EPA established the criteria for determining which wastes arising from the various mineral production sectors come from mineral processing operations and which are from beneficiation activities in the September 1989 final rule (see 54 Fed. Reg. 36592, 36616 codified at 261.4(b)(7)). In essence, beneficiation operations typically serve to separate and concentrate the mineral values from waste material, remove impurities, or prepare the ore for further refinement. Beneficiation activities generally do not change the mineral values themselves other than by reducing (e.g., crushing or grinding), or enlarging (e.g., pelletizing or briquetting) particle size to facilitate processing. A chemical change in the mineral value does not typically occur in beneficiation.
Mineral processing operations, in contrast, generally follow beneficiation and serve to change the concentrated mineral value into a more useful chemical form. This is often done by using heat (e.g., smelting) or chemical reactions (e.g., acid digestion, chlorination) to change the chemical composition of the mineral. In contrast to beneficiation operations, processing activities often destroy the physical and chemical structure of the incoming ore or mineral feedstock such that the materials leaving the operation do not closely resemble those that entered the operation. Typically, beneficiation wastes are earthen in character, whereas mineral processing wastes are derived from melting or chemical changes.
EPA approached the problem of determining which operations are beneficiation and which (if any) are processing in a step-wise fashion, beginning with relatively straightforward questions and proceeding into more detailed examination of unit operations, as necessary. To locate the beneficiation/processing "line" at a given facility within this mineral commodity sector, EPA reviewed the detailed process flow diagram(s), as well as information on ore type(s), the functional importance of each step in the production sequence, and waste generation points and quantities presented above in this section.
EPA determined that for this specific mineral commodity sector, the beneficiation/processing line occurs between the production of sodium hexavandate and the production of vanadium pentoxide and metallic vanadium. EPA identified this point in the process sequence as where beneficiation ends and mineral processing begins because it is here where a significant chemical change to the sodium hexavandate occurs. Therefore, because EPA has determined that all operations following the initial "processing" step in the production sequence are also considered processing operations, irrespective of whether they involve only techniques otherwise defined as beneficiation, all solid wastes arising from any such operation(s) after the initial mineral processing operation are considered mineral processing wastes, rather than beneficiation wastes. EPA presents the mineral processing waste streams generated after the beneficiation/processing line in section C.2, along with associated information on waste generation rates, characteristics, and management practices for each of these waste streams.
20 C. R. Edwards, "The Recovery of Metal Values From Process Residues," JOM, 43, No. 6, June 1991, pp. 32-33.
21 Y. K. Mukherjee and C. K. Gupta, "Extraction of Vanadium From an Industrial Waste," High Temperature Materials and Processes, 11, Nos. 1-4, January 1993, pp.189-206.
22 Y. K. Mukherjee, S.P. Chakraborty, A.C. Bidaye, and C. K. Gupta, "Recovery of Pure Vanadium Oxide From Bayer Sludge," Minerals Engineering, 3, Nos. 3-4, 1990, pp.345-353.

C. Process Waste Streams
1. Extraction/Beneficiation Wastes
Described below are those wastes identified as generated from primary mineral processing. Wastes associated with the secondary processing and recovery from spent catalysts include ammonia emissions from leaching, wastewater from solvent extraction, wastewater from filtration, and waste alumina.
From Sodium Hexavandate Production.
The following wastes are generated during the production of sodium hexavandate from ore.
Solid residues. Some of the wastes generated during sodium hexavanadate production include solid residues from leaching and filtrates from filtration.23
Roaster Off gases Spent Solvent Spent Filtrate
2. Mineral Processing Wastes
Production of Vanadium Pentoxide.
Wet Scrubber Wastewater. At the facility that recovers vanadium from molybdenum, off gases from the calcine furnace are controlled with a dry baghouse which recovers the dust particulates. In series with the baghouse is a wet scrubber employing a dilute hydrochloric acid solution as the scrubbing medium. The scrubber liquor is routed to the ammonia recovery and reuse system.24 The wastewater generated from scrubbing the emissions from calcination contains sodium chloride and suspended ferrophosphorus particulates. In 1980, these wastes were generated containing 30 kg of sodium chloride per kkg of product and up to 2 kg of ferrophosphorus particulates per kkg of vanadium product. Existing data and engineering judgment suggest that this material does not exhibit any characteristics of hazardous waste. Therefore, the Agency did not evaluate this material further.
Spent Precipitate. If the vanadium pentoxide is produced using dissolution, impurities are removed during pH adjustment. Existing data and engineering judgment suggest that this material does not exhibit any characteristics of hazardous waste. Therefore, the Agency did not evaluate this material further.
Solid Waste. Solid wastes generated as a result of calcination include insoluble ferrophosphorus oxidation products such as ferric oxide and ferric phosphate. In 1980, these wastes were reported to contain from 7,830 to 8,700 kg of ferric oxide per kkg of vanadium pentoxide product and from 14,670 to 16,300 kg of ferric phosphate per kkg of vanadium pentoxide product. The waste were water slurried and sent to disposal areas. These solid wastes are generally limestone treated to neutralize acidic material before the wastes are sent to evaporation ponds. In 1980, the wastewaters generated by slurrying the solid wastes contained from 22,500 to 25,000 kg of iron oxides and iron phosphates per kkg of product.25 Existing data and engineering judgment suggest that this material does not exhibit any characteristics of hazardous waste. Therefore, the Agency did not evaluate this material further.
23 U.S. Environmental Protection Agency, "Vanadium," from 1988 Final Draft Summary Report Mineral Industry Processing Wastes, Office of Solid Waste, 1988, pp. 3-245 - 3-253.
24 U.S. Environmental Protection Agency, 1989, Op. Cit., p. 3513.
25 Versar, Inc., "Vanadium Derivatives," from Assessment of the Inorganic Chemical Industry, Vol. IV, 1980, p. 32-7.

Filtrate and Process Wastewaters. Wastewater resulting from the filtration in Option 2 on Exhibit 5, contains sodium chloride and sodium sulfate. In 1980, these wastewaters contained from 1,750 to 2,000 kg of sodium chloride per kkg of product and 933 kg of sodium sulfate per kkg of product. Other process wastewater from the final vanadium pentoxide recovery steps contained 729 kg of ammonium sulfate per kkg of vanadium pentoxide product.26 Existing data and engineering judgment suggest that this material does not exhibit any characteristics of hazardous waste. Therefore, the Agency did not evaluate this material further.
Alloying and Metal Finishing
Slag. Wastes generated from the production of metallic vanadium include slag from calcium and aluminothermic reduction.27 No further generation or management data are available. Existing data and engineering judgment suggest that this material does not exhibit any characteristics of hazardous waste. Therefore, the Agency did not evaluate this material further.
D. Non-uniquely Associated Wastes
Non-uniquely associated and ancillary hazardous wastes may be generated at on-site laboratories, and may include used chemicals and liquid samples. Other hazardous wastes may include spent solvents, and acidic tank cleaning wastes. Non-hazardous wastes may include tires from trucks and large machinery, sanitary sewage, and waste oil and other lubricants.
E. Summary of Comments Received by EPA
EPA received no comments that address this specific sector.
26 Ibid.
27 U.S. Environmental Protection Agency, 1988, Op. Cit., pp. 3-245 - 3-253.

BIBLIOGRAPHY
Bartels, James and Theodore H. Gurr. "Phosphate Rock." From Industrial Minerals and Rocks. 6th ed. 1994. pp. 761-762.
Edwards, C R. "The Recovery of Metal Values From Process Residues." JOM, 43, No. 6. June 1991. pp. 32-33.
Hillard, Henry E. "Vanadium." From Minerals Yearbook Volume 1. Metals and Minerals. U.S. Bureau of Mines. 1992. pp. 1447-1466.
Hillard, Henry E. "Vanadium." From Mineral Commodity Summaries. U.S. Bureau of Mines. 1995. pp. 184-185.
Kuck, Peter H. "Vanadium." From Mineral Facts and Problems. U.S. Bureau of Mines. 1985. pp. 895-914.
Mukherjee, Y. K. and Gupta C. K. "Extraction of Vanadium From an Industrial Waste." High Temperature Materials and Processes, 11, Nos. 1-4. January 1993. pp.189-206.
Mukherjee, Y. K., Chakraborty, S.P., Bidaye, A.C., and Gupta C. K. "Recovery of Pure Vanadium Oxide From Bayer Sludge." Minerals Engineering, 3, Nos. 3-4. 1990. pp.345-353.
Njau, G J., Pei, B, and Rosenqvist T. "Recovery of Reactive Metals (Manganese, Chromium, Vanadium) From Titaniferous Slags by Sulfiding." Scandinavian Journal Of Metallurgy, 20, No. 2. 1991. pp. 149-156.
Personal communication between Jocelyn Spielman, ICF and Henry Hillard, Vanadium Specialist, U.S. Bureau of Mines, October 20, 1994.
U.S. Environmental Protection Agency. Development Document for Effluent Limitations Guidelines and Standards for Nonferrous Metals Manufacturing Point Source Category. Vol. VI. Office of Water Regulations Standards. May 1989. p. 3512.
U.S. Environmental Protection Agency. "Vanadium." From 1988 Final Draft Summary Report of Mineral Industry Processing Wastes. Office of Solid Waste. 1988. pp. 3-245-3-253.

ZINC
A. Commodity Summary
The primary source of zinc is the mineral sphalerite (ZnS), which is the source of about 90 percent of zinc produced today; zinc can also be recovered from six additional minerals, including hemimorphite, smithsonite, zincite, hydrozincite, willemite, and franklinite.1 The primary uses of zinc are as a protective coating for steel (galvanizing), as alloys in die casting, as an alloying metal with copper to make brass and bronze, and in chemical compounds (e.g., zinc oxide) in rubber and paints.2e
Canada and Australia were the world's largest producers of zinc in 1994, accounting for 31 percent of mine production, followed by China, Peru, the United States, and Mexico.3 Canada, Australia, and the U.S. also possess 39 percent of the world's zinc reserves. In the U.S., mines in Alaska, Missouri, New York, and Tennessee produced more than 90 percent of the nation's total mine output in 1994 of 560,000 metric tons; the four largest U.S. mines (in order of output) in 1992 and their operators and locations were the following:
Mine Name Operator Location
Red Dog Cominco Alaska, Inc. Northwest Arctic, AK
Elmwood-Gordonsville Jersey Miniere Zinc Co. Smith, TN
Greens Creek Greens Creek Mining Co. Admiralty Island, AK
Balmat Zinc Corp. of America (ZCA) St. Lawrence, NY
All of these mines produce zinc ore. In addition, several mines in the U.S. produce lead-zinc ore or lead ore with secondary zinc values, which can be beneficiated to remove zinc for processing. The larger of these mines include the West Fork and Fletcher mines in Reynolds, MO; the Buick mine in Iron, MO; and the Lucky Friday mine in Shoshone, ID.4
Four primary zinc smelters (three using the electrolytic process, the fourth using the electrothermic or pyrometallurgical process) produced 240,000 metric tons of slab zinc in 1994.5 These plants and their location and process type include the following:
1 "Zinc and Zinc Alloys," Kirk-Othmer Encyclopedia of Chemical Technology, 3rd ed., Vol. XXIII, 1983, p. 808.
2 U.S. Bureau of Mines, Mineral Facts and Problems, Bulletin 675, 1985, p. 923.
3 U.S. Bureau of Mines, "Zinc," from Mineral Commodity Summaries, January 1995, p. 191.
4 Jolly, J., "Zinc," in Minerals Yearbook Volume 1. Metals and Minerals 1992, U.S. Bureau of Mines, 1992, p. 1477.
5 U.S. Bureau of Mines, 1995, Op. Cit., p. 190.
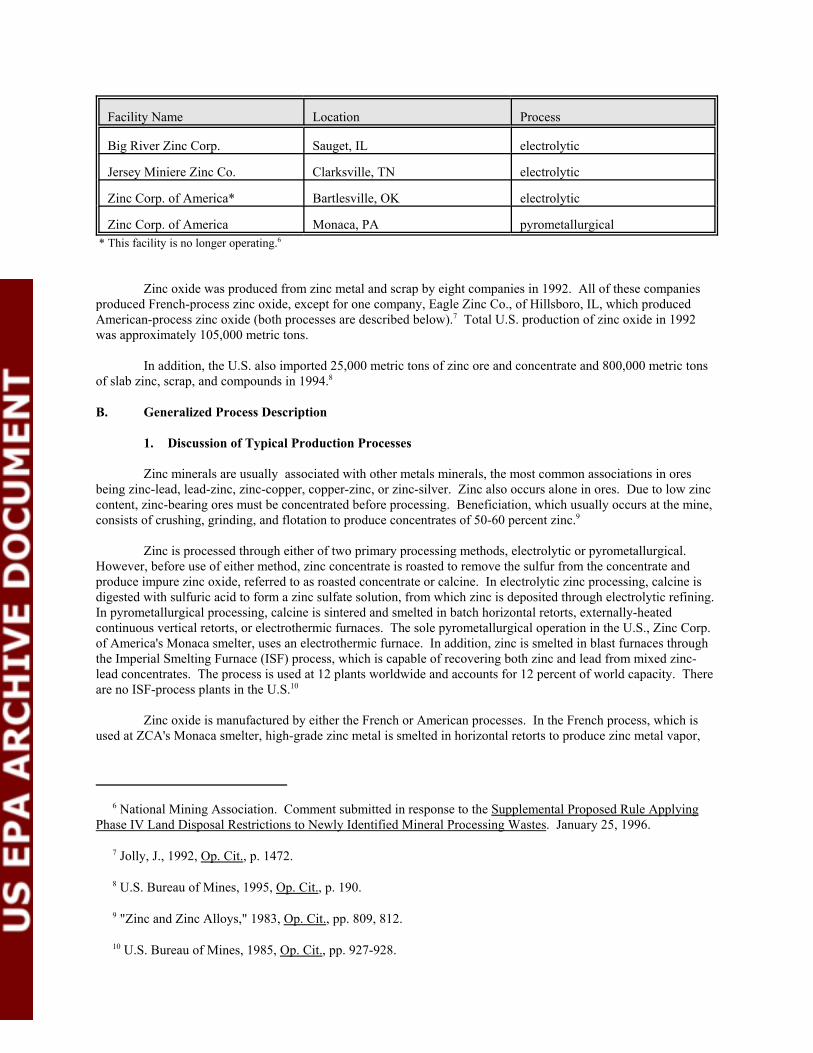
Facility Name Location Process
Big River Zinc Corp. Sauget, IL electrolytic
Jersey Miniere Zinc Co. Clarksville, TN electrolytic
Zinc Corp. of America* Bartlesville, OK electrolytic
Zinc Corp. of America Monaca, PA pyrometallurgical * This facility is no longer operating.6
Zinc oxide was produced from zinc metal and scrap by eight companies in 1992. All of these companies produced French-process zinc oxide, except for one company, Eagle Zinc Co., of Hillsboro, IL, which produced American-process zinc oxide (both processes are described below).7 Total U.S. production of zinc oxide in 1992 was approximately 105,000 metric tons.
In addition, the U.S. also imported 25,000 metric tons of zinc ore and concentrate and 800,000 metric tons of slab zinc, scrap, and compounds in 1994.8
B. Generalized Process Description
1. Discussion of Typical Production Processes
Zinc minerals are usually associated with other metals minerals, the most common associations in ores being zinc-lead, lead-zinc, zinc-copper, copper-zinc, or zinc-silver. Zinc also occurs alone in ores. Due to low zinc content, zinc-bearing ores must be concentrated before processing. Beneficiation, which usually occurs at the mine, consists of crushing, grinding, and flotation to produce concentrates of 50-60 percent zinc.9
Zinc is processed through either of two primary processing methods, electrolytic or pyrometallurgical. However, before use of either method, zinc concentrate is roasted to remove the sulfur from the concentrate and produce impure zinc oxide, referred to as roasted concentrate or calcine. In electrolytic zinc processing, calcine is digested with sulfuric acid to form a zinc sulfate solution, from which zinc is deposited through electrolytic refining. In pyrometallurgical processing, calcine is sintered and smelted in batch horizontal retorts, externally-heated continuous vertical retorts, or electrothermic furnaces. The sole pyrometallurgical operation in the U.S., Zinc Corp. of America's Monaca smelter, uses an electrothermic furnace. In addition, zinc is smelted in blast furnaces through the Imperial Smelting Furnace (ISF) process, which is capable of recovering both zinc and lead from mixed zinc-lead concentrates. The process is used at 12 plants worldwide and accounts for 12 percent of world capacity. There are no ISF-process plants in the U.S.10
Zinc oxide is manufactured by either the French or American processes. In the French process, which is used at ZCA's Monaca smelter, high-grade zinc metal is smelted in horizontal retorts to produce zinc metal vapor,
6 National Mining Association. Comment submitted in response to the Supplemental Proposed Rule Applying Phase IV Land Disposal Restrictions to Newly Identified Mineral Processing Wastes. January 25, 1996.
7 Jolly, J., 1992, Op. Cit., p. 1472.
8 U.S. Bureau of Mines, 1995, Op. Cit., p. 190.
9 "Zinc and Zinc Alloys," 1983, Op. Cit., pp. 809, 812.
10 U.S. Bureau of Mines, 1985, Op. Cit., pp. 927-928.

which is burned in a combustion chamber. In the American process, zinc oxide is manufactured by oxidizing zinc vapor in burners; the resulting gases and fume are cooled, and zinc oxide is recovered in baghouses.11
2. Generalized Process Flow Diagram
Detailed descriptions of Zinc Corp. of America's Bartlesville, OK (electrolytic) and Monaca, PA (pyrometallurgical) facilities are presented below. These descriptions are based on sampling trips to the facilities in 1989 in support of EPA rulemaking activities. Although the ZCA facility is no longer operating, the information presented below still may be applicable to the two remaining operational facilities.
Electrolytic Process
The ZCA electrolytic zinc refinery in Bartlesville, Oklahoma produced several zinc products and associated by-products from zinc ore concentrates. Zinc products included zinc metal, roofing granules, and zinc sulfate solution. By-products included cadmium metal, sulfuric acid, lead/silver residue, copper residue, nickel/cobalt residue, lead scrap, and aluminum scrap. ZCA used zinc sulfide concentrates containing 50-55 percent zinc as the principal feed for its Bartlesville plant.
Production of zinc products from ore concentrates at this facility involved roasting, leaching (digestion), purification, and electrowinning. Roasting took place at the Zinc Ore Roaster (ZOR), and the remaining three processes occurred at the Zinc Refinery (ZRF), as shown in the process flow diagram in Exhibit 1. Both the ZOR and the ZRF are located at the Bartlesville plant.
Zinc ore concentrates were first slurried with water and then roasted, reacting with air to produce a crude zinc oxide calcine and off-gas from the roaster containing 7-10 percent sulfur dioxide. Calcine dusts were recovered from the off-gas by two cyclone separators and added to the calcine. The off-gas was humidified and passed through a wet electrostatic precipitator in a hot tower to remove remaining solids from the sulfur dioxide gas so that it could be used as feed to produce sulfuric acid in the Zinc Acid Plant (ZAP). Two-thirds of the resulting liquid stream from the precipitator, known as acid plant blowdown, was pumped directly to the facility's wastewater treatment plant, and the remaining third was recycled to the hot tower. Total acid plant blowdown flow was approximately 50 gallons per minute. Process wastewater generated by the ZOR consisted of non-contact cooling water used to cool the calcine as it exited the roaster and slurry water that leaked from a pump that directed the slurried ore concentrates to the roaster. These waters were collected in a clay-lined sump outside the roaster and were pumped to the wastewater treatment plant. A process wastewater stream generated at the ZAP, consisting of cooling tower blowdown, was pumped directly to the treatment plant.
The leaching (digestion) process dissolved the zinc in the calcine, creating a zinc sulfate solution from which the zinc could be removed through electrowinning. By mixing the calcine from the roaster with 150-170 g/L sulfuric acid in a step called neutral leaching, about 90 percent of the zinc in the calcine dissolved. The insoluble zinc calcine was separated from the leaching solution in a settling tank. Neutral leach zinc sulfate solution was sent to a purification system, and the solids containing the insoluble zinc were pumped to a residue treatment circuit, where additional sulfuric acid was added to the solids in a series of three hot acid leach tanks to dissolve another 6-7 percent of the zinc from the calcine. Remaining solids in the resulting slurry were separated in a second settling tank and filtered into a cake that was dried and sold for its lead and silver content (20 percent lead and up to 70 ounces of silver per ton).
When the calcine was leached with sulfuric acid in the hot acid leach tanks, iron in the calcine dissolved along with the zinc. Because this solution still contained recoverable zinc, ZCA recycled the solution to the original
11 "Zinc and Zinc Alloys," 1983, Op. Cit., pp. 855.

EXHIBIT 1
ELECTROLYTIC ZINC PRODUCTION PROCESS
(Adapted from: Development Document for Effluent Limitations Guidelines, 1989, p. 479.)
Zinc Concentrate
Preleach
Treatment
to Treatment
Anode and CathodeW ash W ater to
Treatment
H2SO 4
W astew ater to
G aseous Em issions to A cid Plant
Storage
Roaster
Classifier & Ball M ill
Calcine D ust
Preleach Plant
U nderflow Z inc Solution
from C adm ium Plant Digestion
Thickeners& F ilters
Solids to C opper or
Lead Refinery
Zinc Solution
Purification
Solids to Cadm ium
Plant
Spent Cell Acid
E lectrolyte B leed
E lectrolysis
Zinc Dust
C athode Melting Furnace
Zinc Oxide
W ater Blowdown C ooling Tower
Casting
Slag Other Shapes Blocks
neutral leach step described above. However, if the dissolved iron in the solution is not removed, it will prevent the eventual recovery of zinc metal. To remove iron from the solution, ZCA utilized the goethite process.12 Zinc sulfide concentrates were added to the hot acid leach solution to reduce the dissolved iron to its ferrous or divalent state. Zinc calcine was added to neutralize remnant sulfuric acid from the hot acid leach step. Zinc oxide and air were then added to the solution to oxidize the iron from its divalent to trivalent state and precipitate goethite, a hydrated iron oxide, in a slurry. The slurry settled in a tank; the clarified solution containing recoverable zinc was recycled to the neutral leach step, and the iron oxide slurry (goethite) solids were washed and filtered.
Goethite removed from the filter contained 30-40 percent iron, but a 1989 study found that recovery of the iron was not economical.13 Moist goethite cake was stored in an uncovered, unlined waste pile onsite that dates from 1978, when the electrolytic process began at the facility. Runoff from the pile flowed to a clay-lined sump pond and then to the wastewater treatment plant.
In the purification step, trace impurities from the zinc oxide calcine that dissolved in the leaching steps were removed from the neutral leach solution. Like iron, these impurities must be removed so that zinc can be converted to metal. Zinc dust was added to the solution to chemically replace copper and cadmium, which precipitate out of solution as a sludge. Cadmium metal and copper residue were recovered for sale. Zinc dust was again added, along with antimony as a catalyst, to replace nickel and cobalt, which also were recovered for sale. These residues were stockpiled along with others, such as sump and tank cleanings, on an unlined pad until they were sold or recycled. Runoff from the pad collected in a sump and was pumped to a large surface impoundment and eventually to the wastewater treatment plant.
Purified, zinc-rich solution was cooled in evaporative cooling towers and stored in tanks before the zinc was electrowon from the solution at the cell house. The cell house consisted of 128 electrolytic cells, each with 45 lead anodes and 44 aluminum cathodes. When electric current passes through the zinc sulfate solution, which serves as an electrolyte, positive zinc ions deposit on the negatively-charged aluminum cathodes. Half of the cathodes were removed from their cells each day so that the metallic zinc layer could be scraped off each cathode and so that zinc could continue to be removed from solution with the other cathodes. Spent solution containing dilute sulfuric acid was recycled to the neutral leach step of the leaching process. Because of heat build-up in the cells, the zinc sulfate solution has continuously passed through cooling towers. Non-contact cooling water along with boiler blowdown, condensate, and brushing water used to wash cathodes made up a process wastewater stream from the ZRF. This stream flowed through a feeder ditch to a clay-lined sump pond, then to a large, clay-lined surface impoundment, and was finally pumped to the wastewater treatment plant.
Zinc removed from cathodes was melted in a furnace and cast into 55-pound, 600-pound, or 2,400-pound ingots. Some zincwa s converted to dust used in the purification system. Zinc fume collected in the furnace baghouse was recycled. ZCA also converted scrap zinc from its plant and purchased scrap into usable zinc at its Zinc Secondaries Plant (ZSP), a process that is outside the scope of primary mineral processing and, thus, not described further.
Most process wastewaters at ZCA were made up of small streams from the roasting, purification, electrowinning, and zinc secondaries processes. Acid plant blowdown was generated when sulfur dioxide off-gas from the ZOR passed through a wet electrostatic precipitator in the hot tower to remove solids. Process wastewater from the ZSP consisted primarily of water from Venturi scrubbers used to collect dusts from rotary drying of calcine. Process wastewater from the ZRF consisted primarily of brushing water used to wash the aluminum cathodes that served as a depositional surface for zinc ions during electrowinning. The ZAP, which converted sulfur dioxide gas generated in the ZOR to commercial-grade sulfuric acid, generated process wastewater consisting of non-contact cooling tower blowdown. Smaller streams of boiler blowdown, non-contact cooling water from cooling towers, and condensate also made up the wastewater flow.
12 Additional methods to precipitate iron include the hematite and jarosite processes.
13As of July 1989, ZCA was studying a pilot system to recover iron from goethite; the status of this project is unknown.

Process wastewater and plant runoff that collected in the two large, clay-lined surface impoundments were pumped to the wastewater treatment plant. Following a two-stage neutralization process and clarification, sludge was recycled to the roaster and treated water was pumped to two synthetically-lined holding ponds before it was injected in a Class I industrial well.
Pyrometallurgical Process
The primary mineral processing operations at the Monaca facility produce a variety of zinc and other products from ore concentrate (primarily from a New York State mine) and, to a lesser extent, secondary materials (e.g., cast off material from galvanizing operations). Zinc products include zinc metal, zinc sulfate solution, zinc dust, and zinc oxide. Other products produced by the facility including sulfuric acid, lead sulfate, cadmium sponge, ferro-silicate, and processed slag. Due to variations in market conditions, some of these materials, especially ferrosilicate and slag, may be stored on-site for several years prior to sale.
Ore concentrate is first dried in an ore dryer and then roasted, as shown in the process flow diagram in Exhibit 2. Off-gas from the ore dryer is scrubbed prior to discharge to the atmosphere and off-gases from roasting are cleaned prior to being used as the feedstock for sulfuric acid production. Ore dryer scrubber water and acid plant blowdown (from roaster gas cleaning operations) are mixed in a concrete basin (the "Cottrell pond") where the pH is raised to prevent corrosion of plant piping prior to being returned to the scrubber or being used as feed in the sintering process.
The sintering process, which follows roasting, agglomerates the oxidized ore concentrate in preparation for furnacing. Dust removed from sintering off-gases in baghouses is returned to the sintering operation or used as a feed to the zinc sulfate circuit.14 The zinc sulfate circuit consists of a series of steps in which the baghouse dust is first slurried with water and soda ash. The solids (metal carbonates) are then removed from this slurry in a clarifier, the overflow from which goes to the facility's wastewater treatment plant. Underflow from the clarifier is centrifuged; liquid removed by the centrifuge is pumped to a concrete basin and then returned to the clarifier and the solids are leached with sulfuric acid, which solubilizes zinc and cadmium sulfates. Solids are separated using a filter press and sold for lead recovery. Zinc dust is added to the remaining sulfate solution to precipitate cadmium sponge, which is sold to a cadmium metal producer, leaving a zinc sulfate solution, which also is sold as a product.
Sinter and coke are charged to an electrothermal furnace in which zinc gas is generated and subsequently condensed on molten zinc. Uncondensed zinc is removed from the off-gases by a wet scrubber. Water from the wet scrubber is sent to two concrete basins and then a series of three lined impoundments. About half of the water is then returned to the scrubber while the other half is sent to the wastewater treatment plant. Blue powder, a mixture of primarily zinc oxides and elemental zinc, settles out of the scrubber water in both the concrete basins and the impoundments. Blue powder is removed from the concrete basins on a weekly basis and placed in adjacent concrete basins to dry prior to being returned to the ore dryer or used to raise the pH of the combined acid plant blowdown and ore dryer scrubber water. Blue powder is removed from the impoundments along with the impoundment liners every two or three years, and both the powder and the liners are charged to the furnace.
Zinc from the furnace is made into a variety of final products including furnace grade and high purity zinc metal, zinc dust, and zinc oxide. Furnace residues are processed to recover coke, which is returned to the furnace as fines generated by the processing operations, to separate the ferrous and non-ferrous fractions. The ferrosilicates are stockpiled on site and sold to the iron and steel industry when market conditions permit. The non-ferrous slag is graded into four sizes and sold or used as a drainage material in the facility's fly ash landfill.
14 Feed to the zinc sulfate circuit also consists of zinc carbonate that was generated before the zinc sulfate circuit became operational and that is stockpiled on site.

EXHIBIT 2
PYROMETALLURGICAL ZINC PRODUCTION PROCESS
(Adapted from: Development Document for Effluent Limitations Guidelines, 1989, p. 480.)
Zinc Concentrates
Storage, Drying, Blending
Roasting Secondary or Oxidic Materials
Calcine
Pelletizing
Gaseous Emissions to Acid Plant
Moisture Coke
Fumes, Dusts Residues
Preparation Oxides
Sand
DustCollection
Sintering
Return Sinter
Cadmium Plant
Recycle Dust
Briquetting Coal, Clay and Binder
Vertical Retort Reduction
Electrothermic Reduction
Coke
Metallics
Products of Reduction Carbon Monoxide
Plant Use
Blue Powder
Liquation Slab Zinc Lower Grades
Oxidation
Zinc Oxide American
Process
Refining (redistillation)
Special High
Zinc Oxide
Process
Residue Treatment
Slag Discard
Lead-Silver Concentrate to
Reclaimed Coke
High Zinc Concentrate
Stack
Slab Zinc Recycled
Grade
Recycled French
Ferrosilicon Lead Plant

Wastewaters, which include plant runoff as well as process wastewater from the blue powder impoundments and the zinc sulfate circuit, go to a lined equalization basin and then to a two-stage neutralization process, followed by clarification prior to discharge to the Ohio River through an NPDES-permitted outfall. Solids removed from the clarifier are filtered and then returned to the sintering operation.
3. Identification/Discussion of Novel (or otherwise distinct) Processes
In addition to the Imperial Smelting Furnace process, which is identified above, several other novel processes for zinc recovery are being (or have been) investigated or utilized.
A research program is being conducted at the Colorado School of Mines for developing a pyrochemical process using molten salts for recovering reactive metals, including zinc, from beneficiated ore. The process takes place in a hybrid reactor combining electrolytic production of a calcium reductant and in situ utilization of the reductant to reduce metal compounds. The reactor operates at a temperature of less than 1,000°C. The technology reportedly generates little waste.15
Two companies in Canada (Cominco and Kidd Creek) utilize pressure leaching to digest zinc ore concentrates, eliminating both the roasting step and the need for a sulfuric acid plant in the electrolytic process. Zinc concentrate is reacted with oxygen and electrolyte recovered from the electrowinning step in a pressure autoclave. Zinc dissolves and forms zinc sulfate, which is sent to the electrowinning step. Sulfur in the zinc concentrate is converted to elemental sulfur as part of the residue and is extracted or wasted with the residue. The process reportedly has lower capital costs than a traditional electrolytic plant.16
Sulfate roasting of copper-zinc-sulfide concentrate has been examined on a laboratory and pilot-plant scale in open-hearth and fluidized bed furnaces. The resulting calcine was leached with mild sulfuric acid; zinc and iron were co-extracted from the leach solution with D2-EPHA (a solvent extractant), and copper sulfate was crystallized from the purified solution. Recoveries of 95 percent and 99 percent were achieved for zinc and copper, respectively.17
A solvent extraction process for treating waste streams from electrowinning was developed using acid-base couple extractants composed of amines and organic acids. Approximately 95 percent of both zinc (as zinc sulfate) and sulfuric acid in the bleed stream was recovered at concentrations high enough for direct recycle to the process.18
AMAX created a process to recover zinc and other metals from RCRA-hazardous zinc leach residue through brine leaching. The process involves leaching the residue with a CaCl2 brine solution at pH 2 for one hour at 90°C. Silver, lead, copper, cadmium, zinc, and iron were extracted at percentages of 95, 80, 50, 50, 30, and less than 0.5 percent, respectively. Zinc was recovered through sulfide precipitation. The remaining residue passed the EP toxicity test.19
4. Beneficiation/Processing Boundary
15 Mishra, B., D. Olson, and W. Averill, "Applications of Molten Salts in Reactive Metals Processing," presented at the Conference for Emerging Separation Technologies for Metals and Fuels, Palm Coast, FL, March 13-18, 1993, sponsored by the Minerals, Metals, & Materials Society, Warrendale, PA.
16 U.S. Bureau of Mines, 1985, Op. Cit., p. 927
17 Ferron, C. and J. De Cuyper, "The Recovery of Copper and Zinc from a Sulphide Concentrate Using Sulfate Roasting, Acid Leaching and Solution Purification," International Journal of Mineral Processing, 35, No. 3-4, August 1992, pp. 225-238.
18 Eyal, A., et. al., 1990, Op. Cit., pp. 209-222.
19 Beckstead, L., et al., 1993, Op. Cit., pp. 862-875.
EPA established the criteria for determining which wastes arising from the various mineral production sectors come from mineral processing operations and which are from beneficiation activities in the September 1989 final rule (see 54 Fed. Reg. 36592, 36616 codified at 261.4(b)(7)). In essence, beneficiation operations typically serve to separate and concentrate the mineral values from waste material, remove impurities, or prepare the ore for further refinement. Beneficiation activities generally do not change the mineral values themselves other than by reducing (e.g., crushing or grinding), or enlarging (e.g., pelletizing or briquetting) particle size to facilitate processing. A chemical change in the mineral value does not typically occur in beneficiation.
Mineral processing operations, in contrast, generally follow beneficiation and serve to change the concentrated mineral value into a more useful chemical form. This is often done by using heat (e.g., smelting) or chemical reactions (e.g., acid digestion, chlorination) to change the chemical composition of the mineral. In contrast to beneficiation operations, processing activities often destroy the physical and chemical structure of the incoming ore or mineral feedstock such that the materials leaving the operation do not closely resemble those that entered the operation. Typically, beneficiation wastes are earthen in character, whereas mineral processing wastes are derived from melting or chemical changes.
EPA approached the problem of determining which operations are beneficiation and which (if any) are processing in a step-wise fashion, beginning with relatively straightforward questions and proceeding into more detailed examination of unit operations, as necessary. To locate the beneficiation/processing "line" at a given facility within this mineral commodity sector, EPA reviewed the detailed process flow diagram(s), as well as information on ore type(s), the functional importance of each step in the production sequence, and waste generation points and quantities presented above.
EPA determined that for this specific mineral commodity sector, the beneficiation/processing line occurs prior to the initial roasting step in both the electrolytic and the pyrometallurgical processes. EPA identified this point in the process sequence as where beneficiation ends and mineral processing begins because it is here, where, as a result of a chemical reaction, sulfur is removed from the zinc sulfate feedstock. Therefore, because EPA has determined that all operations following the initial "processing" step in the production sequence are also considered processing operations, irrespective of whether they involve only techniques otherwise defined as beneficiation, all solid wastes arising from any such operation(s) after the initial mineral processing operation are considered mineral processing wastes, rather than beneficiation wastes. EPA presents the mineral processing waste streams generated downstream of the beneficiation/processing line in section C.2, along with associated information on waste generation rates, characteristics, and management practices for each of these waste streams.
C. Process Waste Streams
1. Extraction/Beneficiation Wastes
Wastes generated by lead-zinc mining operations include materials such as waste rock, tailings, and refuse. Many of these materials may be disposed of either on-site or off-site, while others may be used or recycled during the active life of the operation. Waste constituents may include base metals, sulfides, or other elements found in the ore, and any additives used in beneficiation operations. The primary waste generated by mineral extraction in underground mines is mine development rock, which is typically used in on-site construction for road building or other purposes. Surface mines usually generate large volumes of overburden and waste rock that are generally disposed of in waste rock dumps.
After the removal of values in the flotation process, the flotation system discharges tailings composed of liquids and solids. Between ¼ and ½ of the tailings generated are made up of solids, mostly gangue material and small quantities of unrecovered lead-zinc minerals. The liquid component of the flotation waste is usually water and dissolved solids, along with any remaining reagents not consumed in the flotation process. These reagents may include cyanide, which is used as a sphalerite depressant during galena flotation. Most operations send these wastes to tailings ponds where solids settle out of the suspension. The liquid component either is recycled back to the mill or discharged if it meets water quality standards. The characteristics of tailings from the flotation process vary

greatly, depending on the ore, reagents, and processes used. Lead, zinc, chromium, iron, and sulfate were all found in the wastewater of the selected facilities.20
In general, most wastes from beneficiation of lead-zinc ores are disposed of in tailings impoundments from which water is likely to be reclaimed during the mine's life. In addition, other materials typically not considered wastes, such as mine water, may be managed on-site during the active life of the facility and may ultimately become wastes. The chemical composition of mine water generated at mines varies from site to site and is dependent on the geochemistry of the ore body and the surrounding area. Mine water may also contain small quantities of oil and grease from extraction machinery and nitrates (NO3) from blasting activities. EPA21 and the Bureau of Mines22
reported concentration ranges in mine waters of 0.1-1.9 mg/L for lead, 0.12-0.46 mg/L for zinc, 0.02-0.36 mg/L for chromium, 295-1,825 mg/L for sulfate, and pH of 7.9-8.8. After the mine is closed and pumping stops, the potential exists for mines to fill with water. Water exposed to sulfur-bearing minerals in an oxidizing environment, such as open pits or underground workings, may become acidified.
In addition to wastes generated as part of beneficiation, facilities also store and use a variety of chemicals required by the mine and mill operations. A list of chemicals used at lead-zinc mines, compiled from data collected by the National Institute for Occupational Safety and Health (NIOSH), is provided below.23
Acetylene Propane Copper Solution Calcium Oxide Sodium Cyanide Kerosene Hexone Sulfur Dioxide Methane, Chlorodifuoro-Hydrogen Chloride Sulfuric Acid Sodium Aerofloat Methyl Chloroform Diesel Fuel No. 1 Sulfuric Acid Copper (2+) Salt Methyl Isobutyl Carbinol Diesel Fuel No. 2 Zinc Solution Nitric Acid Chromic Acid, Disodium Salt Zinc Sulfate
2. Mineral Processing Wastes
Electrolytic refining operations generate two mineral processing wastes: goethite and leach cake residues, and saleable residues. These are described below. Wastes formerly generated by the closed ZCA refinery in Bartlesville, OK have been removed from the input data set to the Regulatory Impact Analysis. The waste stream descriptions below also have been modified to reflect the fact that wastes from the ZCA facility are no longer being generated.
Spent Goethite and Leach Cake Residues
Goethite is generated to remove iron from the zinc sulfate solution generated by leaching calcine with sulfuric acid. Approximately 15,000 metric tons of goethite are generated annually in the U.S.24 Site-specific information on management practices for goethite were available for only one facility, ZCA's Bartlesville, OK refinery. Moist goethite cake was stored in an uncovered, unlined waste pile on-site that dated from 1978, when the
20 Coppa, L., Waste Disposal Activities and Practices in the United States: Copper, Lead, Zinc, Gold, and Silver, U.S. Bureau of Mines, Division of Minerals Availability Open File Report, November, 1984, Washington, DC.
21 U.S. Environmental Protection Agency, Report To Congress: Wastes From the Extraction and Beneficiation of Metallic Ores, Phosphate Rock, Asbestos, Overburden from Uranium Mining and Oil Shale, EPA/530/SW-85-033, Office of Solid Waste, December, 1985, Washington, DC.
22 Coppa, L., 1984, Op. Cit..
23 National Institute for Occupational Safety and Health, 1990.
24 U.S. Environmental Protection Agency, Newly Identified Mineral Processing Waste Characterization Data Set, Office of Solid Waste, August 1992, pp. I-8.

electrolytic process began at the facility. Runoff from the pile flowed to a clay-lined sump pond and then to the facility's wastewater treatment plant. We used best engineering judgment to determine that spent goethite and leach cake residues may exhibit the characteristic of toxicity for arsenic, cadmium, chromium, lead, mercury, selenium, and silver. This waste stream is fully recycled and formerly was classified as a by-product. Data for this waste stream are presented in Attachment 1.
Saleable Residues
Approximately 10,000 metric tons of various saleable residues are recovered annually in the purification of the neutral leach zinc sulfate solution.25 These include a lead- and silver-bearing filter cake; a copper and cadmium sludge, which is created by adding zinc dust to the solution; and a nickel and cobalt residue, also created by adding zinc dust along with antimony as a catalyst. These residues are stockpiled along with others, such as sump and tank cleanings, on an unlined pad until they are sold or recycled. Runoff from the pad collects in a sump and is pumped to a large surface impoundment and eventually to the wastewater treatment plant. Because these residues are recycled, they are not believed to be solid wastes. JMZ uses its wastewater treatment sludges to produce a commercial product, synthetic gypsum.26 No chemical characterization data are available at present for these residues.
Oxide retorting, considered a secondary mineral process because it uses primary zinc metal as a feedstock, generates clinker as a secondary mineral processing waste. We used best engineering judgment to determine that this clinker may exhibit the characteristic of toxicity for cadmium.27
Production of primary zinc metal at both electrolytic and pyrometallurgical zinc processing plants generate several waste streams common to both processes, as described below.
Process Wastewater
Process wastewater is generated at all three of the operating zinc processing plants. Again using ZCA's formerly active electrolytic refinery in Bartlesville, OK as an example, process wastewaters consisted of small streams from the roasting, purification, electrowinning, and zinc secondary processes, as described above. Process wastewater and plant runoff collected in two large, clay-lined surface impoundments and were pumped to the wastewater treatment plant for neutralization. At ZCA's Monaca, PA smelter, wastewaters include plant runoff as well as process wastewater from the blue powder impoundments and the zinc sulfate circuit. These wastewaters collect in a lined equalization basin and are treated in a two-stage neutralization process. Approximately 6.6 million metric tons of process wastewater are generated annually at the four U.S. primary zinc facilities.28 (The excessive generation rate for this wastewater [i.e., greater than one million metric tons/yr] is due to commingling of numerous individual waste streams.) We used best engineering judgment to determine that process wastewater may be recycled and may exhibit the characteristic of toxicity for arsenic, cadmium, chromium, lead, selenium, and silver; it may also exhibit the corrosivity characteristic. This waste formerly was classified as a spent material. Data for this waste stream are presented in Attachment 1.
25 Ibid.
26 National Mining Association. Comment submitted in response to the Supplemental Proposed Rule Applying Phase IV Land Disposal Restrictions to Newly Identified Mineral Processing Wastes. January 25, 1996.
27 U.S. Environmental Protection Agency, 1992, Op. Cit., pp. 1-8.
28 Ibid.

Acid Plant Blowdown
Acid plant blowdown is generated when sulfur dioxide off-gas from the roasting operations passes through a wet electrostatic precipitator to remove solids. At ZCA's Bartlesville plant, two-thirds of the acid plant blowdown was pumped directly to the facility's wastewater treatment plant, and the remaining third was recycled to the hot tower. At the Monaca facility, acid plant blowdown is discharged to a concrete basin where the pH is raised to prevent corrosion of plant piping prior to being returned to the scrubber or being used as feed in the sintering process. Approximately 98,000 metric tons of acid plant blowdown are generated annually at the three U.S. primary zinc facilities.29 We used best engineering judgment to determine that acid plant blowdown may exhibit the characteristic of toxicity for arsenic, cadmium, chromium, selenium, and silver; it may also exhibit the corrosivity characteristic. Data for this waste stream are presented in Attachment 1. We used best engineering judgment to determine that this waste may also exhibit the characteristic of toxicity for lead and mercury. Although this waste stream is listed as hazardous, it is no longer generated and accordingly, EPA has revoked its listing as a hazardous waste. Therefore, this waste stream was not included in our analysis.
Spent Cloths, Bags, and Filters
Cloths, bags, and filters are utilized in operations at each of the three zinc facilities and may become contaminated with potentially hazardous constituents. Approximately 150 metric tons of these waste materials are generated annually.30 We used best engineering judgment to determine that spent cloths, bags, and filters may exhibit the characteristic of toxicity for cadmium, lead, mercury, selenium, and silver. This waste stream is recycled and formerly was classified as a spent material.
TCA Tower Blowdown
Approximately 250 metric tons of TCA tower blowdown are generated annually. We used best engineering judgment to determine that TCA tower blowdown may exhibit the characteristic of toxicity for cadmium, lead, mercury, and selenium; it may also exhibit the corrosivity characteristic.
Spent Synthetic Gypsum
Synthetic gypsum is generated during the treatment of bleed electrolyte from the electrowinning circuit. Approximately 16,000 metric tons are generated annually.31 The management practice for this mineral processing waste is unknown, but the gypsum is most likely stockpiled on-site. We used best engineering judgment to determine that spent synthetic gypsum may exhibit the characteristic of toxicity for arsenic, cadmium, and lead. Data for this waste stream are presented in Attachment 1.
Wastewater Treatment Plant Liquid Effluent
Wastewater treatment plant liquid effluent results from the treatment of process wastewaters, including acid plant blowdown, and plant runoff. Approximately 2.6 million metric tons of effluent are generated annually by the three operating U.S. plants.32 Effluent generated at ZCA's Bartlesville plant was discharged to a Class I industrial injection well on site, while effluent from the Monaca smelter is discharged through an NPDES-permitted outfall to the Ohio River. We used best engineering judgment to determine that wastewater treatment plant liquid effluent may be partially recycled and may exhibit the characteristic of toxicity for cadmium. This waste stream was formerly classified as a spent material. Data for this wastestream are presented in Attachment 1.
29 Ibid.
30 Ibid.
31 Ibid.
32 Ibid.

Wastewater Treatment Plant Sludge
Wastewater treatment plant sludge also results from the treatment of process wastewaters, acid plant blowdown, and plant runoff. Approximately 34,000 metric tons of sludge are generated annually by the three operating U.S. plants.33 At ZCA's Monaca plant and JMZ’s Clarksville plant, these solids are recycled to the zinc ore roaster for recovery of metal values. We used best engineering judgment to determine that wastewater treatment plant sludge may exhibit the characteristic of toxicity for cadmium. Data for this waste stream are presented in Attachment 1.
Spent Surface Impoundment Liquids
Surface impoundment liquid consists of process wastewaters, acid plant blowdown, and plant runoff, the majority of which is sent on to the wastewater treatment plant. Approximately 1.9 million metric tons of liquids are generated annually by the three operating plants.34 (The high generation rate for this wastewater is due to commingling of numerous individual waste streams.) We used best engineering judgment to determine that spent surface impoundment liquids may exhibit the characteristics of corrosivity and toxicity (cadmium). This waste stream may be partially recycled and was formerly classified as a spent material. Data for this waste stream are presented in Attachment 1.
Spent Surface Impoundment Solids
Surface impoundment solids primarily consist of solids that settle out of sludges from treatment of process water and/or acid plant blowdown. These materials, previously discharged to surface impoundments, are now managed in tanks and containers.35 Approximately 750 metric tons of solids are generated annually by the three operating plants.36 We used best engineering judgment to determine that these solids may exhibit the characteristic of toxicity for arsenic, cadmium, lead, mercury, selenium, and silver. Data for this waste stream are presented in Attachment 1.
Smelting of zinc ore concentrate generates four mineral processing wastes: zinc-rich slag, zinc-lean slag, ferrosilicon, and refractory brick.
Zinc-rich Slag
Zinc-rich slag results from the distillation of purified zinc vapor in the electrothermic furnace. Approximately 157,000 metric tons are generated annually at the Monaca facility.37 EP leach test concentrations of all eight inorganic constituents with EP toxicity regulatory levels are available for one sample of zinc slag from the Monaca facility. Of these constituents, only lead was found to exceed the EP toxicity regulatory level, by a factor of 12. The zinc slag sample that failed the EP toxic level was also analyzed using the SPLP leach test, and the lead concentration measured using the SPLP leach test was three orders of magnitude below the EP toxic level.38
However, zinc-rich slag is considered to be a RCRA special waste because of the volume generated; consequently, it
33 Ibid.
34 Ibid.
35 National Mining Association. Comment submitted in response to the Supplemental Proposed Rule Applying Phase IV Land Disposal Restrictions to Newly Identified Mineral Processing Wastes. January 25, 1996.
36 U.S. Environmental Protection Agency, 1992, Op. Cit., pp. 1-8.
37 Ibid.
38 U.S. Environmental Protection Agency, "Primary Zinc Processing," from Report to Congress on Special Wastes from Mineral Processing, Vol. II, Office of Solid Waste, July 1990, p. 14-3.

is exempt under the Bevill Exclusion from regulation as a hazardous waste. The slag is treated to recover coke and zinc fines, which are recycled to the process, and zinc-lean slag and ferrosilicon.
Zinc-lean Slag
Zinc-lean slag, or processed slag, is stored in slag waste piles, disposed in a flyash landfill, or sold for such uses as road gravel or construction aggregate. Approximately 17,000 metric tons are generated annually at the Monaca facility.39 We used best engineering judgment to determine that zinc-lean slag may be recycled and may exhibit the characteristic of toxicity for lead. This waste was formerly classified as a by-product. Data for this waste stream are presented in Attachment 1.
Waste Ferrosilicon
Ferrosilicon is accumulated in a stockpile until it can be sold. Approximately 17,000 metric tons are generated annually at the Monaca facility.40 We used best engineering judgment to determine that waste ferrosilicon may be recycled and may exhibit the characteristic of toxicity for lead. This waste was formerly classified as a by-product. Data for this waste stream are presented in Attachment 1.
Discarded Refractory Brick
Refractory brick is used to line the furnaces in which primary zinc smelting occurs. As furnaces are periodically relined, spent brick is removed from the furnaces and disposed, most likely in a landfill on-site. Approximately 1,000 metric tons of refractory brick are removed from furnaces annually.41 We used best engineering judgment to determine that refractory brick may exhibit the characteristic of toxicity for arsenic, cadmium, chromium, and lead.
D. Non-uniquely Associated Wastes
There are no non-uniquely associated wastes in this specific sector. However, typical ancillary hazardous and non-hazardous wastes may be generated at on-site laboratories, and may include used chemicals and liquid samples. Other hazardous wastes may include spent solvents (e.g., petroleum naptha), and acidic tank cleaning wastes. Non-hazardous wastes may include tires from trucks and large machinery, sanitary sewage, and waste oil and other lubricants.
E. Summary of Comments Received by EPA
New Factual Information
One commenter provided new factual information about management of wastewater treatment plant sludge and spent surface impoundment solids (COMM 58). This commenter also indicated that one smelter, Zinc Corporation of America’s electrolytic smelter in Bartlesville, OK is no longer operating. This information has been included in the sector report, and estimated waste streams have been reduced appropriately.
Sector-specific Issues
None.
39 U.S. Environmental Protection Agency, 1992, Op. Cit., p. I-8.
40 Ibid.
41 U.S. Environmental Protection Agency, 1992, Op. Cit., p. I-8.
BIBLIOGRAPHY
Beckstead, L. and E. Chou. "Brine Leaching of Zinc Lead Residue." Presented at the EPD Congress, 1993. Sponsored by the Minerals, Metals, & Materials Society, Warrendale, PA. pp. 861-875.
Coppa, L. Waste Disposal Activities and Practices in the United States: Copper, Lead, Zinc, Gold, and Silver. U.S. Bureau of Mines, Division of Minerals Availability Open File Report. November, 1984. Washington, DC.
Eyal, A., A. Baniel, K. Hajdu, and J. Mizrahi. "New Process for Recovery of Zinc Sulfate and Sulfuric Acid from Zinc Electrowinning Bleed Solutions." Solvent Extraction and Ion Exchange. 8, No. 2. 1990. pp. 209-222.
Ferron, C. and J. De Cuyper. "The Recovery of Copper and Zinc from a Sulphide Concentrate Using Sulfate Roasting, Acid Leaching and Solution Purification." International Journal of Mineral Processing. 35, No. 3-4. August 1992. pp. 225-238.
Jolly, J. "Zinc." In Minerals Yearbook Volume 1. Metals and Minerals 1992. U.S. Bureau of Mines. 1992. pp. 1467-1485.
Mishra, B., D. Olson, and W. Averill. "Applications of Molten Salts in Reactive Metals Processing." Presented at the Conference for Emerging Separation Technologies for Metals and Fuels, Palm Coast, FL, March 13-18, 1993. Sponsored by the Minerals, Metals, & Materials Society, Warrendale, PA.
U.S. Bureau of Mines. Mineral Facts and Problems. Bulletin 675. 1985. p. 923.
U.S. Bureau of Mines. "Zinc." From Mineral Commodity Summaries. January 1994. pp. 194-195.
U.S. Environmental Protection Agency. Report To Congress: Wastes From the Extraction and Beneficiation of Metallic Ores, Phosphate Rock, Asbestos, Overburden from Uranium Mining and Oil Shale. EPA/530/SW-85-033. Office of Solid Waste. December, 1985. Washington, DC.
U.S. Environmental Protection Agency. "Zinc." From 1988 Final Draft Summary Report of Mineral Industry Processing Wastes. 1988. pp. 3-217 - 3-227.
U.S. Environmental Protection Agency, Development Document for Effluent Limitations Guidelines and Standards for the Nonferrous Metals Manufacturing Point Source Category. Volume IV: Primary Zinc, Primary Lead, Secondary Lead, and Primary Antimony, EPA 440/1-89-019.9, Office of Water Regulations and Standards, May 1989, pp. 479-480.
U.S. Environmental Protection Agency. "Primary Zinc Processing." From Report to Congress on Special Wastes from Mineral Processing. Vol. II. Office of Solid Waste. July 1990. pp. 14-1 - 14-25.
U.S. Environmental Protection Agency. Newly Identified Mineral Processing Waste Characterization Data Set. Office of Solid Waste. August 1992.
"Zinc and Zinc Alloys." Kirk-Othmer Encyclopedia of Chemical Technology. 3rd ed. Vol. XXIII. 1983. pp. 807-851.

ATTACHMENT 1

SUMMARY OF EPA/ORD, 3007, AND RTI SAMPLING DATA - GOETHITE AND LEACH CAKE RESIDUES (ELECTROLYTIC) - ZINC
Constituents Total Constituent Analysis - PPM
Minimum Average Maximum # Detects EP Toxicity Analysis - PPM TC # Values
Minimum Average Maximum # Detects Level In Excess Aluminum Antimony Arsenic Barium Beryllium Boron Cadmium Chromium Cobalt Copper Iron Lead Magnesium Manganese Mercury Molybdenum Nickel Selenium Silver Thallium Vanadium Zinc Cyanide Sulfide Sulfate Fluoride Phosphate Silica Chloride TSS pH * Organics (TOC)
3,130 3,130 3,130 1/1 100 175 249 2/2 953 1,977 3,000 2/2
25.00 25.00 25.00 0/1 2.50 2.50 2.50 0/1
- - - 0/0 128 926 2,600 5/5
25.00 37.50 50.00 1/2 25.00 113 200 1/2 3,400 11,456 24,000 5/5
150,000 273,500 400,000 4/4 2,530 11,606 20,000 5/5 1,470 1,470 1,470 1/1
860 860 860 1/1 0.050 0.050 0.050 0/1 25.00 25.00 25.00 0/1 25.00 62.50 100 1/2 25.00 25.00 25.00 0/1 0.94 12.08 25.00 2/3 125 125 125 0/1
25.00 25.00 25.00 0/1 38,900 110,780 150,000 5/5
- - - 0/0 35,000 35,000 35,000 1/1 33,600 36,800 40,000 2/2
- - - 0/0 - - - 0/0 - - - 0/0
25.60 1,013 2,000 2/2 610,000 610,000 610,000 1/1
- - - 0/0 890 890 890 1/1
5.00 5.00 5.00 0/1 - -5.00 5.00 5.00 0/1 - -
0.014 2.51 5.00 1/2 5.0 1 0.50 2.75 5.00 1/2 100.0 0 0.50 0.50 0.50 0/1 - -
- - - 0/0 - -6.68 7.82 8.96 2/2 1.0 2
0.001 2.50 5.00 0/2 5.0 1 5.00 5.00 5.00 0/1 - -3.62 14.26 24.90 2/2 - -
0.050 2.53 5.00 0/2 - -1.43 1.97 2.50 1/2 5.0 0
70.90 70.90 70.90 1/1 - -0.27 15.99 31.70 2/2 - -
0.0001 0.00345 0.0068 1/2 0.2 0 5.00 5.00 5.00 0/1 - -5.00 5.00 5.00 0/1 - -
0.0010 2.50 5.00 0/2 1.0 1 0.015 2.51 5.00 0/2 5.0 1 25.00 25.00 25.00 0/1 - -
5.00 5.00 5.00 0/1 - -334 737 1,140 2/2 - -
- - - 0/0 - -- - - 0/0 - -
2,278 2,278 2,278 1/1 - -0.30 0.30 0.30 1/1 - -
- - - 0/0 - -- - - 0/0 - -
2.20 2.20 2.20 1/1 - -- - - 0/0 - -
2<pH>12 0 - -
Non-detects were assumed to be present at 1/2 the detection limit. TCLP data are currently unavailable; therefore, only EP data are presented.

SUMMARY OF EPA/ORD, 3007, AND RTI SAMPLING DATA - PROCESS WASTEWATER - ZINC
Constituents Total Constituent Analysis - PPM
Minimum Average Maximum # Detects EP Toxicity Analysis - PPM TC # Values
Minimum Average Maximum # Detects Level In Excess Aluminum Antimony Arsenic Barium Beryllium Boron Cadmium Chromium Cobalt Copper Iron Lead Magnesium Manganese Mercury Molybdenum Nickel Selenium Silver Thallium Vanadium Zinc Cyanide Sulfide Sulfate Fluoride Phosphate Silica Chloride TSS pH * Organics (TOC)
0.050 15.28 123 7/10 0.050 0.30 0.93 2/11
0.0020 0.52 2.54 4/11 0.050 0.20 0.50 3/11 0.005 0.02 0.05 2/10
- - - 0/0 0.0030 93.09 555 17/17 0.0010 0.16 0.50 4/11
0.050 1.21 6.60 3/10 0.025 19.83 205 7/11 0.030 373 3,500 12/13
0.00050 29.84 300 9/12 3.02 914 7,160 13/13
0.025 311 2,500 9/11 0.00010 0.038 0.348 8/11
0.050 0.22 0.50 2/8 0.030 2.48 10.50 4/11
0.0025 8,333 100,000 2/12 0.0015 0.12 0.50 1/11
0.024 0.92 3.59 3/11 0.005 0.12 0.50 1/11
3.00 5,872 60,000 25/25 0.0050 0.0050 0.0050 0/1
4.60 4.60 4.60 1/1 155 7,902 60,500 14/14
0.30 18.67 56.00 6/6 - - - 0/0
1,300 1,300 1,300 1/1 1.00 1,277 10,000 16/16 4.40 12,905 99,500 13/13 1.00 5.64 10.50 24/24 4.00 8.25 19.80 9/9
0.050 18.27 133 3/8 - -0.050 1.53 10.00 2/8 - -0.020 1.59 10.00 2/10 5.0 1 0.050 1.25 10.00 2/10 100.0 0 0.005 0.14 1.00 0/8 - -
- - - 0/0 - -0.023 123 589 10/10 1.0 6
0.0050 1.13 10.00 1/10 5.0 1 0.050 2.19 10.00 1/8 - -0.050 37.61 289 4/8 - -0.050 174 737 3/8 - -0.025 1.27 5.00 6/10 5.0 1
2.81 288 2,110 8/8 - -0.050 108 722 6/8 - -
0.00010 0.0020 0.014 4/10 0.2 0 0.050 1.52 10.00 2/8 - -0.050 2.93 12.70 1/8 - -
0.0025 1.13 10.00 0/10 1.0 1 0.0015 1.13 10.00 0/10 5.0 1
0.25 7.03 50.00 0/8 - -0.050 1.41 10.00 0/8 - -
0.37 7,919 40,500 8/8 - -- - - 0/0 - -- - - 0/0 - -- - - 0/0 - -- - - 0/0 - -- - - 0/0 - -- - - 0/0 - -- - - 0/0 - -- - - 0/0 - -
2<pH>12 4 - -
Non-detects were assumed to be present at 1/2 the detection limit. TCLP data are currently unavailable; therefore, only EP data are presented.

SUMMARY OF EPA/ORD, 3007, AND RTI SAMPLING DATA - ACID PLANT BLOWDOWN - ZINC
Constituents Total Constituent Analysis - PPM
Minimum Average Maximum # Detects EP Toxicity Analysis - PPM TC # Values
Minimum Average Maximum # Detects Level In Excess Aluminum Antimony Arsenic Barium Beryllium Boron Cadmium Chromium Cobalt Copper Iron Lead Magnesium Manganese Mercury Molybdenum Nickel Selenium Silver Thallium Vanadium Zinc Cyanide Sulfide Sulfate Fluoride Phosphate Silica Chloride TSS pH * Organics (TOC)
2.67 19.99 37.30 2/2 0.48 0.49 0.50 1/3 0.99 1.11 1.20 3/3 0.21 0.40 0.50 1/3
0.050 1,475 4,400 1/3 - - - 0/0
3.71 155 840 6/6 0.049 0.35 0.50 1/3
0.50 0.50 0.50 0/2 1.95 12.63 29.00 3/3
87.10 107 127 2/2 4.11 13.64 23.80 3/3 9.42 11.21 13.00 2/2 1.37 4.12 6.87 2/2 0.26 23,246 162,400 7/7 0.50 0.50 0.50 0/2 0.50 0.67 1.00 1/3 2.00 7.87 16.60 3/3 0.50 0.66 0.98 1/3
0.0090 1.67 2.50 1/3 0.0010 0.33 0.50 1/3
180 2,992 13,200 13/13 0.085 0.085 0.085 1/1
330 330 330 1/1 1,860 12,340 43,193 6/6 11.00 1,317 11,400 12/12
- - - 0/0 - - - 0/0
1.00 1,343 5,100 11/11 5,490 14,395 23,300 2/2
0.50 1.67 3.40 8/8 3.30 3.71 4.00 3/3
5.00 20.20 35.40 1/2 - -0.50 2.75 5.00 0/2 - -1.10 2.12 5.00 3/4 5.0 1 0.14 1.45 5.00 1/4 100.0 0
0.050 0.28 0.50 0/2 - -- - - 0/0 - -
0.83 8.58 19.00 4/4 1.0 2 0.03 1.81 5.00 2/4 5.0 1 0.50 2.75 5.00 0/2 - -0.17 1.89 5.00 1/3 - -2.39 53.90 79.70 3/3 - -1.87 2.54 3.70 3/4 5.0 0 8.52 10.41 12.30 2/2 - -0.10 2.20 5.00 2/3 - -
0.0064 0.079 0.13 4/4 0.2 0 0.50 2.75 5.00 0/2 - -0.50 2.75 5.00 0/2 - -
0.055 1.69 5.00 2/4 1.0 2 0.015 1.53 5.00 1/4 5.0 1
2.50 13.75 25.00 0/2 - -0.50 2.75 5.00 0/2 - -
21.30 588 1,570 3/3 - -- - - 0/0 - -_ - - 0/0 - -
7,330 7,330 7,330 1/1 - -23.00 23.00 23.00 1/1 - -
- - - 0/0 - -- - - 0/0 - -
547 547 547 1/1 - -_ - - 0/0 - -
2<pH>12 6 - -
Non-detects were assumed to be present at 1/2 the detection limit. TCLP data are currently unavailable; therefore, only EP data are presented.

SUMMARY OF EPA/ORD, 3007, AND RTI SAMPLING DATA - SYNTHETIC GYPSUM - ZINC
Constituents Total Constituent Analysis - PPM
Minimum Average Maximum # Detects EP Toxicity Analysis - PPM TC # Values
Minimum Average Maximum # Detects Level In Excess Aluminum Antimony Arsenic Barium Beryllium Boron Cadmium Chromium Cobalt Copper Iron Lead Magnesium Manganese Mercury Molybdenum Nickel Selenium Silver Thallium Vanadium Zinc Cyanide Sulfide Sulfate Fluoride Phosphate Silica Chloride TSS pH * Organics (TOC)
- - - 0/0 - - - 0/0
1,954 2,945 3,935 2/2 - - - 0/0 - - - 0/0 - - - 0/0
665 779 893 2/2 - - - 0/0 - - - 0/0 - - - 0/0 - - - 0/0
290 296 302 2/2 - - - 0/0 - - - 0/0 - - - 0/0 - - - 0/0 - - - 0/0 - - - 0/0 - - - 0/0 - - - 0/0 - - - 0/0 - - - 0/0 - - - 0/0 - - - 0/0 - - - 0/0 - - - 0/0 - - - 0/0 - - - 0/0 - - - 0/0 - - - 0/0
5.01 5.08 5.15 2/2 - - - 0/0
- - - 0/0 - -- - - 0/0 - -
0.0030 0.0040 0.0050 1/2 5.0 0 0.80 2.25 3.70 2/2 100.0 0
- - - 0/0 - -- - - 0/0 - -
0.52 5.81 11.10 2/2 1.0 1 0.0010 0.0010 0.0010 0/2 5.0 0
- - - 0/0 - -0.51 0.51 0.51 2/2 - -0.15 0.23 0.30 2/2 - -2.36 3.00 3.63 2/2 5.0 0
- - - 0/0 - -0.57 23.24 45.90 2/2 - -
0.0029 0.016 0.029 2/2 0.2 0 - - - 0/0 - -- - - 0/0 - -
0.0010 0.0010 0.0010 0/2 1.0 0 0.015 0.018 0.020 0/2 5.0 0
- - - 0/0 - -- - - 0/0 - -
10.70 417 824 2/2 - -- - - 0/0 - -- - - 0/0 - -
1,160 1,795 2,430 2/2 - -0.40 0.45 0.50 2/2 - -
- - - 0/0 - -- - - 0/0 - -
0.15 1.43 2.70 1/2 - -- - - 0/0 - -
2<pH>12 0 - -
Non-detects were assumed to be present at 1/2 the detection limit. TCLP data are currently unavailable; therefore, only EP data are presented.

SUMMARY OF EPA/ORD, 3007, AND RTI SAMPLING DATA - WASTEWATER TREATMENT PLANT LIQUID EFFLUENT - ZINC
Constituents Total Constituent Analysis - PPM
Minimum Average Maximum # Detects EP Toxicity Analysis - PPM TC # Values
Minimum Average Maximum # Detects Level In Excess Aluminum Antimony Arsenic Barium Beryllium Boron Cadmium Chromium Cobalt Copper Iron Lead Magnesium Manganese Mercury Molybdenum Nickel Selenium Silver Thallium Vanadium Zinc Cyanide Sulfide Sulfate Fluoride Phosphate Silica Chloride TSS pH * Organics (TOC)
- - - 0/0 - - - 0/0 - - - 0/0 - - - 0/0 - - - 0/0 - - - 0/0
1.00 12,101 24,200 2/2 - - - 0/0
3,100 3,100 3,100 1/1 1,300 1,300 1,300 1/1
17,200 17,200 17,200 1/1 6,100 6,100 6,100 1/1 50.00 5,225 10,400 2/2
- - - 0/0 - - - 0/0 - - - 0/0
410 410 410 1/1 - - - 0/0
58.29 58.29 58.29 1/1 - - - 0/0 - - - 0/0
20.00 150,673 450,000 3/3 - - - 0/0 - - - 0/0
545,000 545,000 545,000 1/1 - - - 0/0 - - - 0/0 - - - 0/0 - - - 0/0 - - - 0/0
4.88 6.73 8.80 3/3 - - - 0/0
- - - 0/0 - -- - - 0/0 - -
0.027 0.039 0.050 1/2 5.0 0 0.50 3.25 6.00 1/2 100.0 0
- - - 0/0 - -- - - 0/0 - -
0.070 0.125 0.180 2/2 1.0 0 0.012 0.019 0.025 1/2 5.0 0
- - - 0/0 - -0.030 0.030 0.030 0/1 - -53.90 53.90 53.90 1/1 - -
1.00 1.82 2.64 2/2 5.0 0 - - - 0/0 - -
49.50 49.50 49.50 1/1 - -0.000050 0.0012 0.0023 1/2 0.2 0
- - - 0/0 - -- - - 0/0 - -
0.0030 0.102 0.20 2/2 1.0 0 0.020 0.045 0.070 1/2 5.0 0
- - - 0/0 - -- - - 0/0 - -
1,320 1,320 1,320 1/1 - -- - - 0/0 - -- - - 0/0 - -
1,340 1,340 1,340 1/1 - -18.50 18.50 18.50 1/1 - -
- - - 0/0 - -- - - 0/0 - -
102 102 102 1/1 - -- - - 0/0 - -
2<pH>12 0 - -
Non-detects were assumed to be present at 1/2 the detection limit. TCLP data are currently unavailable; therefore, only EP data are presented.

SUMMARY OF EPA/ORD, 3007, AND RTI SAMPLING DATA - WASTEWATER TREATMENT PLANT SLUDGE - ZINC
Constituents Total Constituent Analysis - PPM
Minimum Average Maximum # Detects EP Toxicity Analysis - PPM TC # Values
Minimum Average Maximum # Detects Level In Excess Aluminum Antimony Arsenic Barium Beryllium Boron Cadmium Chromium Cobalt Copper Iron Lead Magnesium Manganese Mercury Molybdenum Nickel Selenium Silver Thallium Vanadium Zinc Cyanide Sulfide Sulfate Fluoride Phosphate Silica Chloride TSS pH * Organics (TOC)
23.80 1,887 3,750 2/2 0.60 24.10 47.60 1/2 0.46 57.23 114 1/2 0.30 33.65 67.00 2/2
0.042 0.87 1.70 1/2 - - - 0/0
44.40 11,415 24,200 3/3 1.20 17.65 34.10 2/2 3.30 1,171 3,100 3/3 8.20 1,159 2,170 3/3 407 12,736 20,600 3/3
55.50 4,862 8,430 3/3 1,980 6,740 10,400 3/3
189 4,465 8,740 2/2 4.10 12.20 20.30 2/2 0.25 1.40 2.55 1/2 4.50 256 410 3/3 5.60 113 220 2/2 0.55 43.25 70.90 3/3 2.40 25.70 49.00 0/2 0.13 1.34 2.55 1/2
2,000 249,250 526,000 4/4 0.51 0.51 0.51 0/1
3,120 3,120 3,120 1/1 545,000 545,000 545,000 1/1
173 173 173 1/1 - - - 0/0 - - - 0/0 - - - 0/0
430,000 430,000 430,000 1/1 8.80 9.38 9.96 2/2
- - - 0/0
0.13 2.40 4.67 2/2 - -0.00080 0.035 0.070 0/2 - -
0.0055 0.063 0.12 0/2 5.0 0 0.11 0.31 0.48 3/3 100.0 0
0.0050 0.0055 0.0059 1/2 - -- - - 0/0 - -
0.19 0.88 2.13 3/3 1.0 1 0.0015 0.049 0.099 2/3 5.0 0
0.82 1.50 2.18 2/2 - -0.020 0.68 1.35 1/2 - -13.83 25.06 36.30 2/2 - -
0.42 1.85 4.56 3/3 5.0 0 74.70 267 460 2/2 - -31.68 50.09 68.50 2/2 - -
0.00010 0.0075 0.022 1/3 0.2 0 0.0088 0.012 0.015 1/2 - -
1.21 1.40 1.58 2/2 - -0.0015 0.018 0.044 1/3 1.0 0 0.0051 0.017 0.024 3/3 5.0 0
0.57 0.58 0.58 2/2 - -0.0036 0.009 0.015 1/2 - -
571 1,540 2,510 2/2 - -0.0050 0.0050 0.0050 0/1 - -
143 143 143 1/1 - -- - - 0/0 - -- - - 0/0 - -- - - 0/0 - -- - - 0/0 - -- - - 0/0 - -- - - 0/0 - -
2<pH>12 0 - -
Non-detects were assumed to be present at 1/2 the detection limit. TCLP data are currently unavailable; therefore, only EP data are presented.

SUMMARY OF EPA/ORD, 3007, AND RTI SAMPLING DATA - SURFACE IMPOUNDMENT LIQUIDS - ZINC
Constituents Total Constituent Analysis - PPM
Minimum Average Maximum # Detects EP Toxicity Analysis - PPM TC # Values
Minimum Average Maximum # Detects Level In Excess Aluminum Antimony Arsenic Barium Beryllium Boron Cadmium Chromium Cobalt Copper Iron Lead Magnesium Manganese Mercury Molybdenum Nickel Selenium Silver Thallium Vanadium Zinc Cyanide Sulfide Sulfate Fluoride Phosphate Silica Chloride TSS pH * Organics (TOC)
990 990 990 1/1 - - - 0/0
214 214 214 1/1 - - - 0/0 - - - 0/0 - - - 0/0
0.00 2,834 40,000 16/16 - - - 0/0 - - - 0/0
3358 3,358 3,358 1/1 200 7,905 19,420 4/4
0.70 38,075 200,000 6/6 800 14,580 53,000 4/4
22.90 162 302 2/2 0.00 4.92 23.80 4/4
- - - 0/0 257 257 257 1/1
11.00 11.00 11.00 1/1 185 185 185 1/1
- - - 0/0 - - - 0/0
0.80 132,673 800,000 22/22 - - - 0/0 - - - 0/0
0 10,955 35,000 3/3 0.00 216 2,300 12/12
- - - 0/0 - - - 0/0
0 990 2,800 8/8 41.00 41.20 41.40 2/2
2 6.02 10 23/23 - - - 0/0
- - - 0/0 - -- - - 0/0 - -- - - 0/0 5.0 0 - - - 0/0 100.0 0 - - - 0/0 - -- - - 0/0 - -- - - 0/0 1.0 0 - - - 0/0 5.0 0 - - - 0/0 - -- - - 0/0 - -- - - 0/0 - -- - - 0/0 5.0 0 - - - 0/0 - -- - - 0/0 - -- - - 0/0 0.2 0 - - - 0/0 - -- - - 0/0 - -- - - 0/0 1.0 0 - - - 0/0 5.0 0 - - - 0/0 - -- - - 0/0 - -- - - 0/0 - -- - - 0/0 - -- - - 0/0 - -- - - 0/0 - -- - - 0/0 - -- - - 0/0 - -- - - 0/0 - -- - - 0/0 - -- - - 0/0 - -
2<pH>12 3 - -
Non-detects were assumed to be present at 1/2 the detection limit. TCLP data are currently unavailable; therefore, only EP data are presented.

SUMMARY OF EPA/ORD, 3007, AND RTI SAMPLING DATA - SURFACE IMPOUNDMENT SOLIDS - ZINC
Constituents Total Constituent Analysis - PPM
Minimum Average Maximum # Detects EP Toxicity Analysis - PPM TC # Values
Minimum Average Maximum # Detects Level In Excess Aluminum Antimony Arsenic Barium Beryllium Boron Cadmium Chromium Cobalt Copper Iron Lead Magnesium Manganese Mercury Molybdenum Nickel Selenium Silver Thallium Vanadium Zinc Cyanide Sulfide Sulfate Fluoride Phosphate Silica Chloride TSS pH * Organics (TOC)
- - - 0/0 - - - 0/0 - - - 0/0 - - - 0/0 - - - 0/0 - - - 0/0
1.00 1.00 1.00 1/1 - - - 0/0 - - - 0/0 - - - 0/0 - - - 0/0 - - - 0/0
50.00 50.00 50.00 1/1 - - - 0/0 - - - 0/0 - - - 0/0 - - - 0/0 - - - 0/0 - - - 0/0 - - - 0/0 - - - 0/0
20.00 20.00 20.00 1/1 - - - 0/0 - - - 0/0 - - - 0/0 - - - 0/0 - - - 0/0 - - - 0/0 - - - 0/0 - - - 0/0
6.50 6.50 6.50 1/1 - - - 0/0
- - - 0/0 - -- - - 0/0 - -- - - 0/0 5.0 0 - - - 0/0 100.0 0 - - - 0/0 - -- - - 0/0 - -- - - 0/0 1.0 0 - - - 0/0 5.0 0 - - - 0/0 - -- - - 0/0 - -- - - 0/0 - -- - - 0/0 5.0 0 - - - 0/0 - -- - - 0/0 - -- - - 0/0 0.2 0 - - - 0/0 - -- - - 0/0 - -- - - 0/0 1.0 0 - - - 0/0 5.0 0 - - - 0/0 - -- - - 0/0 - -- - - 0/0 - -- - - 0/0 - -- - - 0/0 - -- - - 0/0 - -- - - 0/0 - -- - - 0/0 - -- - - 0/0 - -- - - 0/0 - -- - - 0/0 - -
2<pH>12 0 - -
Non-detects were assumed to be present at 1/2 the detection limit. TCLP data are currently unavailable; therefore, only EP data are presented.
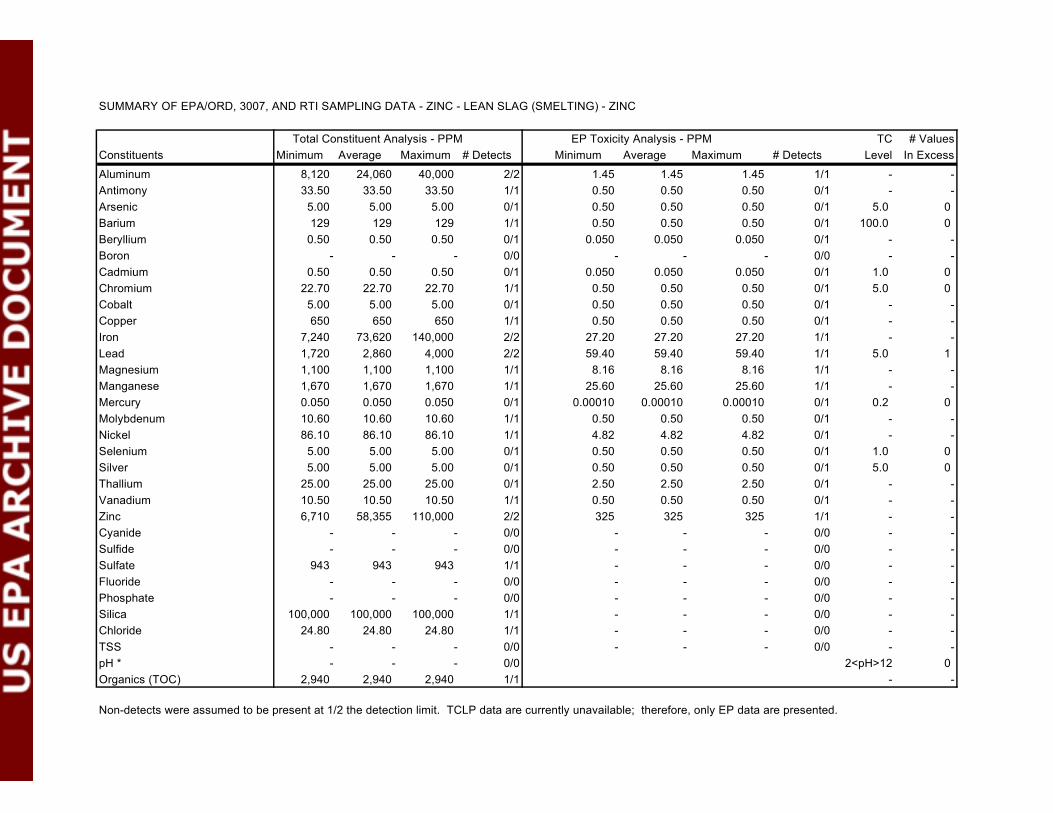
SUMMARY OF EPA/ORD, 3007, AND RTI SAMPLING DATA - ZINC - LEAN SLAG (SMELTING) - ZINC
Constituents Total Constituent Analysis - PPM
Minimum Average Maximum # Detects EP Toxicity Analysis - PPM TC # Values
Minimum Average Maximum # Detects Level In Excess Aluminum Antimony Arsenic Barium Beryllium Boron Cadmium Chromium Cobalt Copper Iron Lead Magnesium Manganese Mercury Molybdenum Nickel Selenium Silver Thallium Vanadium Zinc Cyanide Sulfide Sulfate Fluoride Phosphate Silica Chloride TSS pH * Organics (TOC)
8,120 24,060 40,000 2/2 33.50 33.50 33.50 1/1
5.00 5.00 5.00 0/1 129 129 129 1/1
0.50 0.50 0.50 0/1 - - - 0/0
0.50 0.50 0.50 0/1 22.70 22.70 22.70 1/1
5.00 5.00 5.00 0/1 650 650 650 1/1
7,240 73,620 140,000 2/2 1,720 2,860 4,000 2/2 1,100 1,100 1,100 1/1 1,670 1,670 1,670 1/1 0.050 0.050 0.050 0/1 10.60 10.60 10.60 1/1 86.10 86.10 86.10 1/1
5.00 5.00 5.00 0/1 5.00 5.00 5.00 0/1
25.00 25.00 25.00 0/1 10.50 10.50 10.50 1/1 6,710 58,355 110,000 2/2
- - - 0/0 - - - 0/0
943 943 943 1/1 - - - 0/0 - - - 0/0
100,000 100,000 100,000 1/1 24.80 24.80 24.80 1/1
- - - 0/0 - - - 0/0
2,940 2,940 2,940 1/1
1.45 1.45 1.45 1/1 - -0.50 0.50 0.50 0/1 - -0.50 0.50 0.50 0/1 5.0 0 0.50 0.50 0.50 0/1 100.0 0
0.050 0.050 0.050 0/1 - -- - - 0/0 - -
0.050 0.050 0.050 0/1 1.0 0 0.50 0.50 0.50 0/1 5.0 0 0.50 0.50 0.50 0/1 - -0.50 0.50 0.50 0/1 - -
27.20 27.20 27.20 1/1 - -59.40 59.40 59.40 1/1 5.0 1
8.16 8.16 8.16 1/1 - -25.60 25.60 25.60 1/1 - -
0.00010 0.00010 0.00010 0/1 0.2 0 0.50 0.50 0.50 0/1 - -4.82 4.82 4.82 0/1 - -0.50 0.50 0.50 0/1 1.0 0 0.50 0.50 0.50 0/1 5.0 0 2.50 2.50 2.50 0/1 - -0.50 0.50 0.50 0/1 - -325 325 325 1/1 - -
- - - 0/0 - -- - - 0/0 - -- - - 0/0 - -- - - 0/0 - -- - - 0/0 - -- - - 0/0 - -- - - 0/0 - -- - - 0/0 - -
2<pH>12 0 - -
Non-detects were assumed to be present at 1/2 the detection limit. TCLP data are currently unavailable; therefore, only EP data are presented.

SUMMARY OF EPA/ORD, 3007, AND RTI SAMPLING DATA - FERROSILICON (SMELTING) - ZINC
Constituents Total Constituent Analysis - PPM
Minimum Average Maximum # Detects EP Toxicity Analysis - PPM TC # Values
Minimum Average Maximum # Detects Level In Excess Aluminum Antimony Arsenic Barium Beryllium Boron Cadmium Chromium Cobalt Copper Iron Lead Magnesium Manganese Mercury Molybdenum Nickel Selenium Silver Thallium Vanadium Zinc Cyanide Sulfide Sulfate Fluoride Phosphate Silica Chloride TSS pH * Organics (TOC)
40,000 40,000 40,000 1/1 - - - 0/0 - - - 0/0 - - - 0/0 - - - 0/0 - - - 0/0 - - - 0/0 - - - 0/0 - - - 0/0 - - - 0/0
300,000 300,000 300,000 1/1 5,000 5,000 5,000 1/1
- - - 0/0 - - - 0/0 - - - 0/0 - - - 0/0 - - - 0/0 - - - 0/0 - - - 0/0 - - - 0/0 - - - 0/0
40,000 40,000 40,000 1/1 - - - 0/0 - - - 0/0 - - - 0/0 - - - 0/0 - - - 0/0
120,000 120,000 120,000 1/1 - - - 0/0 - - - 0/0 - - - 0/0 - - - 0/0
- - - 0/0 - -- - - 0/0 - -- - - 0/0 5.0 0 - - - 0/0 100.0 0 - - - 0/0 - -- - - 0/0 - -- - - 0/0 1.0 0 - - - 0/0 5.0 0 - - - 0/0 - -- - - 0/0 - -- - - 0/0 - -- - - 0/0 5.0 0 - - - 0/0 - -- - - 0/0 - -- - - 0/0 0.2 0 - - - 0/0 - -- - - 0/0 - -- - - 0/0 1.0 0 - - - 0/0 5.0 0 - - - 0/0 - -- - - 0/0 - -- - - 0/0 - -- - - 0/0 - -- - - 0/0 - -- - - 0/0 - -- - - 0/0 - -- - - 0/0 - -- - - 0/0 - -- - - 0/0 - -- - - 0/0 - -
2<pH>12 0 - -
Non-detects were assumed to be present at 1/2 the detection limit. TCLP data are currently unavailable; therefore, only EP data are presented.


1 Thomas E. Garner, "Zirconium and Hafnium Minerals," from Industrial Minerals and Rocks, 6th ed., Society forMining, Metallurgy, and Exploration, 1994, pp. 1159-1164.
2 Ibid.
ZIRCONIUM AND HAFNIUM
A. Commodity Summary
Zirconium and hafnium occur most commonly in nature as the mineral zircon and less commonly asbaddeleyite. Zircon is used both for its properties as a mineral and as an ore of zirconium and hafnium. Zircon is abyproduct from the mining and processing of heavy mineral sands for rutile and ilmenite. Zirconium and hafniumoccur together in ores at ratios of about 50:1.1
Zircon sand is produced at two mines in Florida. Zirconium metal is extracted from imported zircon sandby two domestic producers, one in Oregon and the other in Utah. Exhibit 1 presents the names and locations offacilities associated with the production of zirconium/hafnium.
EXHIBIT 1
SUMMARY OF ZIRCONIUM/HAFNIUM MINING AND PROCESSING FACILITIES
Facility Name Location Operations/Products
Du Pont Trail Ridge, FL Mining, extraction
RGC NE Florida Mining, extraction
Teledyne Albany, OR Metals, and alloys
Western Zirconium Ogden, UT Metals, and alloys
The two metals can remain unseparated for all uses except nuclear applications. Because of the extremelyopposite absorption characteristics for thermal neutrons in nuclear reactor cores, the zirconium-cladded fuel rodsmust be hafnium free. The strong-absorbing hafnium, if present, would decrease the relative transparency of thezirconium cladding, and the reactor's efficiency. For this reason, hafnium is used in reactor control rods to regulatethe fission process via neutron absorption. Hafnium is also used as an additive in superalloys, as refractory andcutting tool coatings, and in oxide and nitride forms. Nuclear fuel rod cladding accounts for most of zirconium's use. Zircon refractories and foundry sands are used primarily in the production of finished metal and glass products.2
B. Generalized Process Description
1. Discussion of Typical Processes
Zircon is mined from a shoreline deposit in Green Cove Springs, FL and from the Trail Ridge deposit innorth central Florida. Sand ores are mined with dredges, bulldozers, and elevating scrapers. The productionprocesses used at primary zirconium and hafnium manufacturing plants depend largely on the raw material used. Sixbasic operations may be performed: (1) sand chlorination, (2) separation, (3) calcining, (4) pure chlorination, (5)reduction, and (6) purification. Plants that produce zirconium and hafnium from zircon sand use all six of theseprocess steps. Plants which produce zirconium from zirconium dioxide practice reduction and purification only.

3 U.S. Environmental Protection Agency, Development Document for Effluent Limitations Guidelines andStandards for the Nonferrous Metals Manufacturing Point Source Category, Vol. IX, Office of Water Regulationsand Standards, May 1989, pp. 5081-5106.
4 Ibid.
5 J.H. Schemel, ASTM Manual on Zirconium and Hafnium, American Society for Testing and Materials, 1977,pp. 58-59.
6 Personal communication between ICF Incorporated and Chuck Knoll, Manager of Environmental Affairs,Teledyne Wah Chang, Albany, Oregon, October 24, 1994.
7 U.S. Environmental Protection Agency, 1989, Op. Cit., pp. 5081-5106.
Exhibit 2 presents a process flow diagram for primary zirconium and hafnium production. These processes aredescribed in further detail below.3
2. Generalized Process Flow Diagram
Sand Chlorination
After drying, concentrated zircon sand is mixed with coke, ground, and fed continuously to the top of afluidized bed chlorinator. The basic sand chlorination reaction is as follows:
ZrSiO4 + 2C + 4Cl2 6 ZrCl4 + SiCl4 + 2CO2
Crude zirconium tetrachloride and silicon tetrachloride are condensed from the off-gases. ("Crude zirconiumtetrachloride" is a mixture of zirconium tetrachloride and hafnium tetrachloride.) The crude zirconium tetrachlorideis then hydrolyzed with water and the resulting solution is filtered to remove suspended solids. The reaction is asfollows4:
ZrCl4 + H2O 6 ZrOCl2 +2HCl
Separation
Iron is removed from the zirconium-hafnium solution from the feed makeup step by extraction. The ironfree zirconium and hafnium solution is passed through a series of liquid-liquid extractions, stripping, and scrubbingsteps to separate zirconium from hafnium. Liquid-liquid extraction, using methyl isobutyl ketone (containingthiocyanate) as a solvent, separates zirconium from hafnium by preferentially extracting hafnium into the solventphase. The zirconium ions are "complexed" with the ammonium thiocyanate and the hafnium is preferentiallyextracted by the MIBK. The solvent, MIBK, and the complexing agent, ammonium thiocyanate, are recovered bysteam stripping and recycled to the process.5 (According to a facility representative from Teledyne Wah Chang inAlbany, Oregon, there is no ammonium thiocyanate bleed stream.6)
Hafnium is stripped from the solvent to the aqueous phase by acidification and the recovered solvent isrecycled, after treatment, within the separation operations. The hafnium solution is reacted with ammoniumhydroxide to precipitate hafnium hydroxide. The precipitate is recovered by filtration and the residual wastewaterdischarged to treatment. After drying, the hafnium hydroxide is either stored or calcined to produce hafniumdioxide.7
Zirconium is recovered from the aqueous zirconium stream through chemical treatment and furtherextraction with methyl isobutyl ketone. Zirconium is precipitated and filtered as zirconium sulfate. The filter cake

EXHIBIT 2
PRIMARY ZIRCONIUM AND HAFNIUM PRODUCTION
(Adapted from: Development Document for Effluent Limitations Guidelines, 1989, pp. 5081 - 5106.)
Sand ChlorinationArea-Vent Scrubbers
H2O
Atmosphere
H2O
Caustic
Atmosphere Atmosphere Atmosphere
H2O
Caustic
H2O
Caustic
SandChlorination Condensation
Cl2 Coke
Sand DryingScrubber
Sand ChlorinationOff-Gas Scrubbers
ZirconOre ZrCl4
HfCl4
Feed MakeupScrubbers
FeedMakeup
ZrOCl2HfOCl2
H2O
SiCl4Purification
SiCl4
SiCl4PurificationScrubbers
H2O
Caustic
Atmosphere
SandDriving
Extraction
HF Precipitationand Filtration
Zn Precipitationand Filtration
MIBKRecovery
ThiocyanateRecovery
NH4OH
H2SO4(NH4)2SO4
NH4OH
MIBKReuse
A
B
MIBKSteam
Stripper
Bottoms

EXHIBIT 2 (CONTINUED)
PureChlorination
Scrubbers
CalciningCaustic
ScrubberCaustic
Atmosphere
CalciningWater
ScrubbersH2O
MagnesiumRecoveryScrubbers
Atmosphere
H2O
MagnesiumRecoverySystem
Mg
MgCl2
Atmosphere Atmosphere
ReductionArea-VentScrubbers
H2OCaustic,
H2O
Recycle toSeparations
A
B
HfCalcination
ZrCalcination
HfO2
ZrO2
Cl2, Coke
Hf PureChlorination
Zr PureChlorination
HfReduction
ZrReduction
Mg
Mg
HfCl4
ZrCl4
Cl2, Coke
Hf
Zr
HFDistillation
and Crushing
ZrDistillation
and Crushing
Hf
Zr
ReductionOff-gas
ScrubberH2O
Recycle toSeparations
Atmosphere

EXHIBIT 2 (CONTINUED)
MagnesiumReduction
CrushingScrubber
ZrO2
MgCrushing
ZrO2
CaH2
Ni
HydrogenReduction
Leaching
HCl H2O
Rinse
H2O
Zr orZrNi
Alloys

8 Ibid.
9 Ibid.
10 Ibid.
11 Ibid.
12 Ibid.
13 Ibid.
14 Ibid.
can be either sent to calcining or repulped with ammonium hydroxide. Ammonium hydroxide is added to convertthe zirconium sulfate to zirconium hydroxide and to remove trace metals from the zirconium product. Theprecipitate is filtered to remove water and sent to the calcining furnace for further processing.8
Calcining
From this point on in the process, zirconium and hafnium are processed separately but identically. Thehafnium and zirconium filter cakes are calcined to produce hafnium oxide and zirconium oxide, respectively. Scrubber water from calciner emission control operations is recycled to the separation process to recover zirconiumand hafnium.9
Pure Chlorination
Pure chlorination is essentially the same process as sand chlorination. The pure zirconium or hafniumoxide is mixed with fine coke and reacted with chlorine to produce the tetrachloride gas. The pure zirconium orhafnium tetrachloride is then recovered in condensers.10
Reduction
The zirconium tetrachloride and hafnium tetrachloride are reduced to their respective metals in a batchprocess using magnesium in a reduction furnace. The tetrachloride is added to magnesium in a retort furnace whereit is converted to zirconium or hafnium metal and magnesium chloride. Off-gases from the furnace pass through awater scrubber before being released. The scrubber blowdown is recycled to the separation process to recoverzirconium and hafnium.11
Zirconium oxide is mixed with magnesium metal powder and placed in a steel cylinder. The cylinder isthen place in a furnace and retorted. Once initiated, the reaction becomes self-sustaining. Zirconium metal spongeand magnesium oxide are produced.12
Zirconium oxide can also be used to produce zirconium-nickel alloys. The process is similar to themagnesium reduction operation except that calcium hydride is used as the reducing agent in the furnace and nickel isadded directly to the mixture of zirconium oxide and calcium.13
Purification
When zirconium or hafnium metal is produced by magnesium reduction of the tetrachloride, a crude metalregulus with magnesium chloride is formed in the furnace. The magnesium chloride is separated from the zirconiumor hafnium regulus to produce zirconium or hafnium sponge.14
15 Ibid.
16 Timothy Adams, "Zirconium and Hafnium," from Mineral Facts and Problems, U.S. Bureau of Mines, 1985,pp. 941-956.
A different purification process is used when zirconium metal or zirconium-nickel- alloys are produced bymagnesium reduction of zirconium oxide. The zirconium sponge is removed from the reduction cylinder andpulverized. The impurities are leached out with acid, and the purified metal is rinsed with water. The product isthen dried and sold as metal or alloy powder.15
3. Identification/Discussion of Novel (or otherwise distinct) Processes
A less complicated method may be found to separate hafnium from zirconium and to refine the hafnium. Anew process is being developed where zirconium and hafnium are separated by fractional distillation of thezirconium tetrachloride. Such a process would eliminate the liquid-liquid extraction and associated precipitation,calcination, and rechlorination steps currently used.16
4. Beneficiation/Processing Boundaries
EPA established the criteria for determining which wastes arising from the various mineral productionsectors come from mineral processing operations and which are from beneficiation activities in the September 1989final rule (see 54 Fed. Reg. 36592, 36616 codified at 261.4(b)(7)). In essence, beneficiation operations typicallyserve to separate and concentrate the mineral values from waste material, remove impurities, or prepare the ore forfurther refinement. Beneficiation activities generally do not change the mineral values themselves other than byreducing (e.g., crushing or grinding), or enlarging (e.g., pelletizing or briquetting) particle size to facilitateprocessing. A chemical change in the mineral value does not typically occur in beneficiation.
Mineral processing operations, in contrast, generally follow beneficiation and serve to change theconcentrated mineral value into a more useful chemical form. This is often done by using heat (e.g., smelting) orchemical reactions (e.g., acid digestion, chlorination) to change the chemical composition of the mineral. In contrastto beneficiation operations, processing activities often destroy the physical and chemical structure of the incomingore or mineral feedstock such that the materials leaving the operation do not closely resemble those that entered theoperation. Typically, beneficiation wastes are earthen in character, whereas mineral processing wastes are derivedfrom melting or chemical changes.
EPA approached the problem of determining which operations are beneficiation and which (if any) areprocessing in a step-wise fashion, beginning with relatively straightforward questions and proceeding into moredetailed examination of unit operations, as necessary. To locate the beneficiation/processing "line" at a givenfacility within this mineral commodity sector, EPA reviewed the detailed process flow diagram(s), as well asinformation on ore type(s), the functional importance of each step in the production sequence, and waste generationpoints and quantities presented above.
EPA determined that for this specific mineral commodity sector, the beneficiation/processing line occursbetween ore preparation and sand chlorination because it is where a significant change to the metal occurs. Therefore, because EPA has determined that all operations following the initial "processing" step in the productionsequence are also considered processing operations, irrespective of whether they involve only techniques otherwisedefined as beneficiation, all solid wastes arising from any such operation(s) after the initial mineral processingoperation are considered mineral processing wastes, rather than beneficiation wastes. EPA presents below themineral processing waste streams generated after the beneficiation/processing line, along with associatedinformation on waste generation rates, characteristics, and management practices for each of these waste streams.

17 Joseph M. Gambogi, "Zirconium and Hafnium," from Minerals Yearbook Volume 1. Metals and Minerals,U.S. Bureau of Mines, 1992, pp. 1487-1494.
18 U.S. Environmental Protection Agency, 1989, Op.Cit., pp. 5081-5106.
19 Ibid.
20 Ibid.
21 Ibid.
C. Process Waste Streams
1. Extraction/Beneficiation Wastes
Sand Drying Wet Air Pollution Control (APC)
Wastewater.
Monazite inclusions within the zircon grains and/or ionic substitution of uranium, thorium, radium, and/oractinium for the zirconium and/or hafnium within the mineral lattice result in some radioactive contamination.17
2. Mineral Processing Wastes
Sand Chlorination
Existing data and engineering judgement suggest that the wastes listed below from sand chlorination do notexhibit any characteristics of hazardous waste. Therefore, the Agency did not evaluate these materials further.
Silicon tetrachloride purification wet APC wastewater. Silicon tetrachloride purification requires wetair pollution control. That process practices 96 percent recycle of the scrubberwater before discharging it. Theexisting treatment for this wastewater consists of chemical precipitation and sedimentation. This waste is dischargedat a rate of 7,498 l/kkg of zirconium dioxide and hafnium dioxide produced.18
Sand chlorination off-gas wet APC wastewater. After zircon ore is chlorinated, crude zirconium-tetrachloride and silicon tetrachloride are separated and recovered from the off-gases using a series of condensers. Wet air pollution control equipment is used to remove residual chlorine gas and particulates from the condenser off-gases. While one plant has achieved zero discharge of this wastewater stream using evaporation ponds, other plantsdischarge this stream after dechlorination, chemical precipitation, and sedimentation. Extensive recycle of scrubberliquor is practiced. This waste is generated at a rate of 16,540 to 43,470 l/kkg of zirconium dioxide and hafniumdioxide produced.19
Sand chlorination area-vent APC wastewater. Ventilation vapors from the sand chlorination area arerouted to wet air pollution control equipment before being released to the atmosphere. At one plant, which reports aseparate waste stream for area-vent scrubbers, the wastewater generated is discharged after dechlorination, chemicalprecipitation, and sedimentation. That plant reported recycling 96 percent of this wastewater. This waste isdischarged at a rate of 8,524 l/kkg of zirconium dioxide and hafnium dioxide produced.20
Feed makeup wet APC wastewater. This wastewater is characterized by treatable concentrations ofsuspended solids, zirconium, cyanide, and a low pH. Feed makeup steps are intended to remove suspended solidsfrom crude zirconium-hafnium tetrachloride. This process uses wet scrubbing systems to control emissions. A highrate of recycle and reuse (92 to 100 percent) of the feed makeup scrubber liquor is achieved prior to discharge. Chemical precipitation and sedimentation is practiced for this waste stream. This waste is discharged at a rate of5683 l/kkg of hafnium dioxide and zirconium dioxide produced.21

22 Ibid.
23 Ibid.
24 Ibid.
25 Ibid.
Separation
Existing data and engineering judgement indicate that the wastes listed below from separation do notexhibit characteristics of hazardous wastes. Therefore, the Agency did not evaluate these materials further.
Hafnium filtrate wastewater. Separated hafnium is precipitated from solution and filtered before beingsent to the calcining furnace. The filtrate can be reused in the separation process to recover its zirconium content ordisposed of in evaporation ponds.22
Zirconium filtrate wastewater. Separated zirconium is precipitated from solution and filtered beforebeing sent to the calcining furnace. This wastestream is not recycled or reused. When this wastewater is discharged,it is treated by ammonia steam stripping, chemical precipitation, and sedimentation. This waste is generated at a rateof 37,640 to 39,900 l/kkg of zirconium dioxide and hafnium dioxide produced.23
Iron extraction (methyl isobutyl ketone) steam stripper bottoms. MIBK is recovered from the ironextraction wastewater stream using a steam stripper, from which the bottoms are discharged. When this stream isdischarged, it is treated by ammonia steam stripping, chemical precipitation, and sedimentation.24
Ammonium thiocyanate bleed stream. Ammonium thiocyanate is recycled to the process. As statedbefore, according to a facility representative from Teledyne Wah Chang in Albany, Oregon, there is no ammoniumthiocyanate bleed stream.
Calcination
Existing data and engineering judgement suggest that the wastes listed below from calcination do notexhibit any characteristics of hazardous waste. Therefore, the Agency did not evaluate these materials further.
Caustic wet APC wastewater. Wet air pollution control systems are used to clean the off-gases from thecalcining furnaces. A high rate, 90 percent, of recycle or reuse of the discharge from the water scrubbers in theseparations process is achieved. When the blowdown from this operation is discharged it is treated bydechlorination, chemical precipitation, and sedimentation. This waste is discharged at a rate of 1,539 to 8,997 l/kkgof hafnium dioxide and zirconium dioxide produced.25
Filter cake/sludge. Zirconium and hafnium filter cakes are calcined to produce zirconium oxide andhafnium oxide, respectively.
Furnace residue.
Pure Chlorination
Wet APC wastewater. Pure chlorination is similar to sand chlorination except that the chlorination ofzirconium oxide and hafnium oxide is carried out in separate reactors at lower temperatures. The scrubbers used forreactor off-gasses and area ventilation vapors discharge a wastewater stream. This stream may be recycled and theblowdown is treated by dechlorination, chemical precipitation, and sedimentation before being discharged. Itcontains zirconium and chlorine as well as suspended solids. This waste is discharged at a rate of 38,317 l/kkg of

26 U.S. Environmental Protection Agency, 1989, Op. Cit., pp. 5081-5106.
27 Ibid.
28 Ibid.
29 Ibid.
30 Ibid.
31 Ibid.
zirconium and hafnium produced.26 Existing data and engineering judgement suggest that this material does notexhibit any characteristics of a hazardous waste. Therefore, the Agency did not evaluate this material further.
Reduction
Reduction area-vent wet air pollution control wastewater. The plants that reduce zirconium andhafnium tetrachloride to metal use scrubbers for area ventilation vapors. The scrubber liquor is recycled before it isdischarged after treatment by chemical precipitation and sedimentation. This waste is discharged at a rate of 3,686l/kkg of zirconium and hafnium produced.27 Existing data and engineering judgement suggest that this material doesnot exhibit any characteristics of hazardous waste. Therefore, the Agency did not evaluate this material further.
Purification
Leaching rinse water from zirconium or hafnium metal production. After leaching with acid to removeimpurities, the zirconium and hafnium metals are rinsed with water, dried, and packaged for sale. Treatment for thisstream may consist of pH adjustment before discharge.28 Although no published information regarding wastegeneration rate or characteristics was found, we used the methodology outlined in Appendix A of this report toestimate a low, medium, and high annual waste generation rate of 200 metric tons/yr, 1,000,000 metric tons/yr, and2,000,000 metric tons/yr, respectively. We used best engineering judgement to determine that this waste may exhibitthe characteristic of corrosivity prior to treatment. This waste is classified as a spent material.
Leaching rinse water from zirconium and hafnium alloy production. After leaching with acid toremove impurities, the zirconium and hafnium alloys are rinsed with water, dried, and packaged for sale.29 Althoughno published information regarding waste generation rate or characteristics was found, we used the methodologyoutlined in Appendix A of this report to estimate a low, medium, and high annual waste generation rate of 34,000metric tons/yr, 42,000 metric tons/yr, and 51,000 metric tons/yr, respectively. We used best engineering judgementto determine that this waste may exhibit the characteristic of corrosivity prior to treatment. This waste is classifiedas a spent material.
Spent acid leachate from zirconium and hafnium metal production. When zirconium and hafniummetals are purified by leaching, the resulting leachate is not reused or recycled. Existing treatment for thiswastewater stream may consist of pH adjustment before discharge.30 Although no published information regardingwaste generation rate or characteristics was found, we used the methodology outlined in Appendix A of this report toestimate a low, medium, and high annual waste generation rate of 0 metric tons/yr, 0 metric tons/yr, and 1,600,000metric tons/yr, respectively. We used best engineering judgement to determine that this waste may exhibit thecharacteristic of corrosivity.
Spent acid leachate from zirconium and hafnium alloy production. When zirconium and hafniumalloys are purified by leaching, the resulting leachate is not reused or recycled. Existing treatment for thiswastewater stream may consist of pH adjustment before discharge.31 Although no published information regardingwaste generation rate or characteristics was found, we used the methodology outlined in Appendix A of this report toestimate a low, medium, and high annual waste generation rate of 0 metric tons/yr, 0 metric tons/yr, and 850,000

32 Ibid.
33 Ibid.
34 Ibid.
metric tons/yr, respectively. We used best engineering judgement to determine that this waste may exhibit thecharacteristic of corrosivity.
Existing data and engineering judgement suggest that the purification wastes listed below do not exhibit anycharacteristics of hazardous wastes. Therefore, the Agency did not evaluate these materials further.
Zirconium chip crushing wet APC wastewater. The zirconium sponge formed by reduction is removedfrom the reduction container and crushed. Scrubbers, installed for air pollution control in the crushing operation,generate a wastewater. Zero discharge of this wastewater is achieved by 100 percent recycle of the scrubber liquor.32
Magnesium recovery off-gas wet APC wastewater. Scrubbers, installed for air pollution control in themagnesium recovery area, discharge a wastewater which is characterized by treatable concentrations of magnesiumand solids. The scrubber liquor may be recycled prior to treatment which consists of chemical precipitation andsedimentation followed by discharge. This waste is discharged at a rate of 20,733 l/kkg of zirconium and hafniumproduced.33
Magnesium recovery area vent wet APC wastewater. Ventilation air from the magnesium recovery areapasses through a wet scrubber prior to being released to the atmosphere. The scrubber liquor is recycled prior todischarge and treatment consists of chemical precipitation and sedimentation. This waste is discharged at a rate of11,518 l/kkg of zirconium and hafnium produced.34
D. Non-uniquely Associated Wastes
Non-uniquely associated and ancillary hazardous wastes may be generated at on-site laboratories, and mayinclude used chemicals and liquid samples. Other hazardous wastes may include spent solvents, and acidic tankcleaning wastes. Non-hazardous wastes may include tires from trucks and large machinery, sanitary sewage, andwaste oil and other lubricants.
E. Summary of Comments Received by EPA
EPA received no comments that address this specific sector.

BIBLIOGRAPHY
Adams, Timothy. "Zirconium and Hafnium." From Mineral Facts and Problems. U.S. Bureau of Mines. 1985. pp. 941-956.
Gambogi, Joseph. "Hafnium." From Mineral Commodity Summaries. U.S. Bureau of Mines. January 1995. pp. 74-75.
Gambogi, Joseph. "Zirconium." From Mineral Commodity Summaries. U.S. Bureau of Mines. January 1995. pp. 192-193.
Gambogi, Joseph. "Zirconium and Hafnium," From Minerals Yearbook Volume 1. Metals and Minerals. U.S. Bureau of Mines. 1992. pp. 1487-1494.
Garnar, Thomas E. "Zirconium and Hafnium Minerals." From Industrial Minerals and Rocks. 6th ed. Society for Mining, Metallurgy, and Exploration. 1994. pp. 1159-1164.
"Hafnium and Hafnium Compounds." Kirk-Othmer Encyclopedia of Chemical Technology. 3rd ed. Vol. XII. 1980. pp. 67-79.
Personal communication between ICF Incorporated and Chuck Knoll, Manager of Environmental Affairs, Teledyne Wah Chang, Albany, Oregon, October 24, 1994.
Schemel, J.H. ASTM Manual on Zirconium and Hafnium. American Society for Testing and Materials. 1977. pp. 58-59.
U.S. Environmental Protection Agency. Newly Identified Mineral Processing Waste Characterization Data Set. Office of Solid Waste. Vol. III. August 1992. pp. 42-1 - 42-3.
U.S. Environmental Protection Agency. Development Document for Effluent Limitations Guidelines and Standardsfor the Nonferrous Metals Manufacturing Point Source Category. Vol. IX. Office of Water Regulations andStandards. May 1989. pp. 5081-5106.