vanguard inflation-protected securities fund fund’s performance at a glance 1 total returns: six...
TRANSCRIPT
Vanguard Inflation-Protected Securities Fund
Semiannual Report | June 30, 2017

Contents
Please note: The opinions expressed in this report are just that—informed opinions. They should not be considered promisesor advice. Also, please keep in mind that the information and opinions cover the period through the date on the front of thisreport. Of course, the risks of investing in your fund are spelled out in the prospectus.
See the Glossary for definitions of investment terms used in this report.About the cover: No matter what language you speak, Vanguard has one consistent message and set ofprinciples. Our primary focus is on you, our clients. We conduct our business with integrity as a faithful steward of your assets. This message is shown translated into seven languages, reflecting our expanding globalpresence.
A new format, unwavering commitment
As you begin reading this report, you’ll notice that we’ve made someimprovements to the opening sections—based on feedback from you,our clients.
Page 1 starts with a new ”Your Fund’s Performance at a Glance,” aconcise, handy summary of how your fund performed during the period.
In the renamed ”Chairman’s Perspective,” Bill McNabb will focus onenduring principles and investment insights.
We’ve modified some tables, and eliminated some redundancy, but wehaven’t removed any information.
At Vanguard, we’re always looking for better ways to communicate andto help you make sound investment decisions. Thank you for entrustingyour assets to us.
Your Fund’s Performance at a Glance. . . . . . . . . . . . . . . . . . 1
Chairman’s Perspective. . . . . . . . . . . . . . . . . . . . . . . . . . . . . 2
Advisor’s Report. . . . . . . . . . . . . . . . . . . . . . . . . . . . . . . . . . . 6
Fund Profile. . . . . . . . . . . . . . . . . . . . . . . . . . . . . . . . . . . . . .10
Performance Summary. . . . . . . . . . . . . . . . . . . . . . . . . . . . .12
Financial Statements. . . . . . . . . . . . . . . . . . . . . . . . . . . . . . 13
About Your Fund’s Expenses. . . . . . . . . . . . . . . . . . . . . . . . 27
Trustees Approve Advisory Arrangement. . . . . . . . . . . . . . 29
Glossary. . . . . . . . . . . . . . . . . . . . . . . . . . . . . . . . . . . . . . . . 31

Your Fund’s Performance at a Glance
1
Total Returns: Six Months Ended June 30, 2017
30-Day SECYield
IncomeReturns
CapitalReturns
TotalReturns
Vanguard Inflation-Protected Securities Fund
Investor Shares 0.07% 0.20% 0.69% 0.89%
Admiral™ Shares 0.17 0.23 0.67 0.90
Institutional Shares 0.20 0.26 0.67 0.93
Bloomberg Barclays U.S. Treasury InflationProtected Securities Index 0.85
Inflation-Protected Bond Funds Average 0.66
Inflation-Protected Bond Funds Average: Derived from data provided by Lipper, a Thomson Reuters Company.
Admiral Shares carry lower expenses and are available to investors who meet certain account-balance requirements. Institutional Sharesare available to certain institutional investors who meet specific administrative, service, and account-size criteria.
Expense RatiosYour Fund Compared With Its Peer Group
Investor
Shares
Admiral
Shares
Institutional
Shares
Peer Group
Average
Inflation-Protected Securities Fund 0.20% 0.10% 0.07% 0.74%
The fund expense ratios shown are from the prospectus dated April 26, 2017, and represent estimated costs for the current fiscal year. Forthe six months ended June 30, 2017, the fund’s annualized expense ratios were 0.20% for Investor Shares, 0.10% for Admiral Shares, and0.07% for Institutional Shares. The peer-group expense ratio is derived from data provided by Lipper, a Thomson Reuters Company, andcaptures information through year-end 2016.
Peer group: Inflation-Protected Bond Funds.
• For the six months ended June 30, 2017, Vanguard Inflation-Protected Securities
Fund returned 0.89% for Investor Shares. This was slightly ahead of both its benchmark
index and its peer-funds average. Investor Shares’ 30-day SEC yield began the period at
0.07%, dipped to –0.15% in March, then climbed back to 0.07% by June 30.
• The U.S. bond market recorded positive returns. Short-term rates rose in reaction
to the Federal Reserve’s shift of its benchmark rate. But yields fell and prices rose
for longer-term bonds as investors grew cautious about signs of slowing inflation
and sluggish economic growth. Treasuries underperformed investment-grade
corporate bonds.
• Yields on Treasury inflation-protected securities (TIPS) were higher on the short end
of the maturity spectrum but stayed relatively flat or dipped a bit on the longer end.
• The gap between nominal Treasury and TIPS yields—a measure of expected
inflation over the next five years—narrowed slightly, from 1.80% to 1.76%.
Dear Shareholder,
More than a decade ago, the eminent
investor and commentator Howard Marks
published a memo to his clients titled
simply “Risk.” In it, Howard distilled the
relationship between investors and risk.
“When you boil it all down, it’s the
investor’s job to intelligently bear risk
for profit,” he wrote.
It’s not surprising, then, that everyone
from portfolio managers to behavioral
economists avidly studies how investors’
reactions to risk influence not only individual
investment decisions but also the broader
financial markets. I’m a big fan of some of
the behavioral finance work being done,
which includes studies by our own
investment strategists and analysts.
A lens on investor behavior
For example, Vanguard’s Investment
Strategy Group introduced a “risk
speedometers” report in January to look
at how investors are reacting to market
developments. This lens on real-world
behavior measures the risk investors are
taking in a given period by calculating the
difference between net cash flows into
higher-risk assets, such as stocks, and
net cash flows into lower-risk assets,
such as Treasuries. The measures are
then compared with long-term averages.
In the spring, the risk speedometer spiked.
The spike was fueled by investors’
decisions to direct more of their equity
Chairman’s Perspective
Bill McNabb
Chairman and Chief Executive Officer
2

dollars to international investments
in developed and emerging markets,
and their bond dollars to riskier
credit categories.
A spiking speedometer seems a fitting
analogy for what can happen. I consider
myself a responsible driver. Still, when
the highway is clear and the weather
is nice, I might glance down at the
speedometer and find that my right
foot has gotten a little heavy.
The same phenomenon is possible with
our investment portfolios. Just as our
attention can drift from our speed—
and the risk level on the road—we can
neglect the risk level of our portfolio’s
asset allocation. Experience teaches
that investors are especially prone to
lose sight of risk when markets have
been buoyant.
How I manage risk in my own portfolio
Rebalancing—periodically adjusting your
asset allocation so it stays in line with your
goals and risk tolerance—is one of the
best ways I know of to help manage risk.
Without rebalancing, your portfolio may
end up potentially riskier than you intended
and no longer aligned with your goals.
I have a ritual I perform every June and
again each December, between Christmas
and New Year’s, as I prepare for a series
of annual meetings with the Vanguard
crew. I’ll set aside some time, review my
Market Barometer
Total Returns
Periods Ended June 30, 2017
Five Years
Six Months One Year (Annualized)
Stocks
Russell 1000 Index (Large-caps) 9.27% 18.03% 14.67%
Russell 2000 Index (Small-caps) 4.99 24.60 13.70
Russell 3000 Index (Broad U.S. market) 8.93 18.51 14.58
FTSE All-World ex US Index (International) 13.95 20.53 7.68
Bonds
Bloomberg Barclays U.S. Aggregate Bond Index
(Broad taxable market) 2.27% -0.31% 2.21%
Bloomberg Barclays Municipal Bond Index
(Broad tax-exempt market) 3.57 -0.49 3.26
Citigroup Three-Month U.S. Treasury Bill Index 0.30 0.46 0.13
CPI
Consumer Price Index 1.46% 1.63% 1.31%
3
investment portfolio, and, if necessary,
rebalance back to my target asset
allocation.
My own portfolio is a mix of equity and
fixed income funds, and I invest in both
actively managed funds and index funds.
Most years, I’ll make a minor adjustment
to get back to the appropriate asset
allocation for my own longer-term
goals and risk tolerance. It’s not all that
complicated, although my portfolio is a
little more complex than some because
I own more funds than we’d typically
suggest. As chairman of Vanguard’s
funds, I feel I should own a significant
number of them.
Consider your options
You should consider rebalancing if your
target allocation is off by 5 percentage
points or more. Admittedly, this is often
easier said than done. When an invest-
ment has performed exceptionally well,
people have a hard time trimming it.
They can be led astray by that old
(and none-too-helpful) investing saw:
Let your winners run.
Fortunately, in recent years we’ve seen all
sorts of investors take steps to rebalance.
Many of the endowments, foundations,
and traditional pension plans that Vanguard
serves have good processes built into
their investment guidelines to make sure
rebalancing takes place on a regular basis.
And among investors in defined contribution
retirement plans, more and more are using
target-date funds, where rebalancing
happens automatically.
If you choose to rebalance on your own,
use your target asset allocation as your
guidepost. Don’t be afraid to buy into
bad news. In a sense, don’t worry about
the noise of the marketplace. If you work
with an advisor, make sure he or she
understands the importance you place
on your rebalancing ritual.
And remember, the goal of rebalancing is
to manage risk, not to avoid it altogether.
Risk is inherent in investing—we just
want to bear that risk intelligently.
In that insightful memo on risk, Howard
Marks included a saying often attributed
to Will Rogers: “You’ve got to go out on
a limb sometimes because that’s where
the fruit is.”
Tim Buckley chosen
as Vanguard’s next CEO
In closing, I’ll note senior leadership
changes that we announced in July. Our
board of directors has elected Vanguard
Chief Investment Officer Tim Buckley as
president and director of Vanguard. Under
the planned transition, Tim will succeed
me as Vanguard’s chief executive officer
on January 1, 2018.
I’m delighted with our board’s selection
of Tim. We first met in 1991 when Tim
was interviewing for a job at Vanguard. In
the decades since, we’ve worked closely
together, and he’s always impressed me
as a man of tremendous character and
an outstanding leader with a passion for
serving our clients. During the transition
4
period, I will work closely with Tim in
managing the firm and overseeing its
operations.
Replacing Tim as chief investment officer
is Greg Davis, who had been global head
of Vanguard Fixed Income Group. And
succeeding Greg as our fixed income
leader is John Hollyer, who most recently
served as our global head of investment
risk management. I know Greg and
John will both do a superb job in their
new roles.
As with past successions, I will remain as
chairman for a period of time determined
by the board. On a personal note, it has
been an honor and a privilege to lead
Vanguard. Having spent more than half
my life at Vanguard, I have come to know
many fabulous crew members who are
incredibly dedicated to Vanguard’s
mission. Please be assured that Tim and
the rest of the team will serve you and our
other clients extremely well as Vanguard
prepares for its next chapter.
As always, thank you for investing
with Vanguard.
Sincerely,
F. William McNabb III
Chairman and Chief Executive Officer
July 14, 2017
Vanguard fund shareholders encouraged to vote in proxy campaign
This summer you will be asked to vote on the election of trustees for all U.S.-domiciled
Vanguard funds. Shareholders will also be asked to vote on several fund policy proposals
that we believe are in the best interests of all shareholders.
Vanguard filed a preliminary proxy statement on July 13, 2017, with the U.S. Securities and
Exchange Commission (SEC). Following the SEC’s review, we expect to provide the proxy
materials to Vanguard fund shareholders beginning in late August 2017. That’s when you
can begin to vote online, by phone, or by mail.
A shareholder meeting is scheduled to be held in Scottsdale, Arizona, on November 15,
2017, when voting will conclude. We encourage you to vote promptly. Please visit
vanguard.com for updates.
5
Advisor’s Report
6
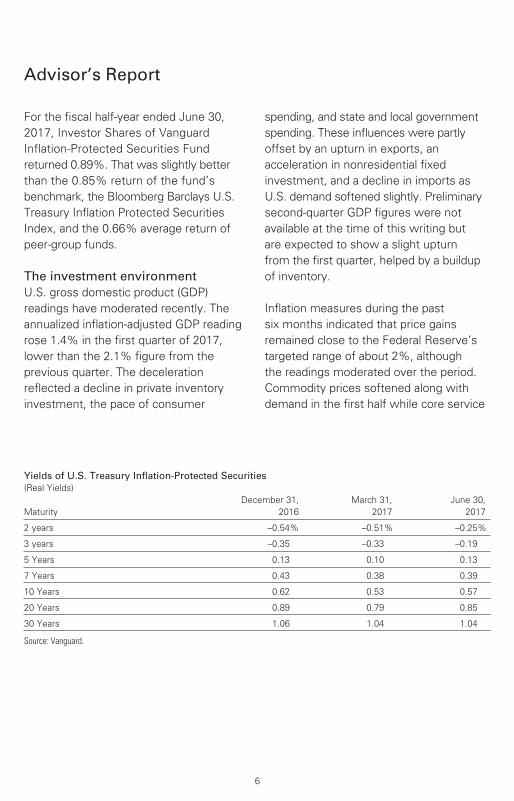
For the fiscal half-year ended June 30,
2017, Investor Shares of Vanguard
Inflation-Protected Securities Fund
returned 0.89%. That was slightly better
than the 0.85% return of the fund’s
benchmark, the Bloomberg Barclays U.S.
Treasury Inflation Protected Securities
Index, and the 0.66% average return of
peer-group funds.
The investment environment
U.S. gross domestic product (GDP)
readings have moderated recently. The
annualized inflation-adjusted GDP reading
rose 1.4% in the first quarter of 2017,
lower than the 2.1% figure from the
previous quarter. The deceleration
reflected a decline in private inventory
investment, the pace of consumer
spending, and state and local government
spending. These influences were partly
offset by an upturn in exports, an
acceleration in nonresidential fixed
investment, and a decline in imports as
U.S. demand softened slightly. Preliminary
second-quarter GDP figures were not
available at the time of this writing but
are expected to show a slight upturn
from the first quarter, helped by a buildup
of inventory.
Inflation measures during the past
six months indicated that price gains
remained close to the Federal Reserve’s
targeted range of about 2%, although
the readings moderated over the period.
Commodity prices softened along with
demand in the first half while core service
Yields of U.S. Treasury Inflation-Protected Securities
(Real Yields)
December 31, March 31, June 30,
Maturity 2016 2017 2017
2 years –0.54% –0.51% –0.25%
3 years –0.35 –0.33 –0.19
5 Years 0.13 0.10 0.13
7 Years 0.43 0.38 0.39
10 Years 0.62 0.53 0.57
20 Years 0.89 0.79 0.85
30 Years 1.06 1.04 1.04
Source: Vanguard.

7
prices cooled moderately. The annual
change in the Consumer Price Index,
which stood at 2.1% in December 2016,
declined to 1.6% by June. The 12-month
change in the more stable core CPI, which
excludes food and energy items, was
1.7% at the end of June, compared with
2.2% a year ago.
Another measure that’s watched closely
by the Fed, the core personal consumption
expenditures (PCE) index, has continued
to run below CPI readings and the Fed’s
inflation target. The core PCE rose 1.4%
for the 12 months ended May 31, the
latest figure available. Slowing inflation
was a global event in the second quarter,
with major economies experiencing
a modest impact because of rising
currencies and lower commodity prices.
In June, the Federal Open Market
Committee raised the target for the
federal funds rate by 25 basis points to a
range between 1% and 1.25%, the fourth
hike in a series of increases that began at
the end of 2015, and the second of 2017.
(A basis point is equal to one-hundredth
of a percentage point.)
Fed Chairwoman Janet Yellen indicated that
the tighter labor market was creating the
necessary conditions for an acceleration in
future inflation, and that the Fed views the
recent slowdown as temporary. While the
labor market continues to hum at full or
near-full employment and housing sales
are healthy, there are some signs that
economic growth moderated a bit in the
spring. Lower energy prices, changes to
cellular plans, moderating rent increases,
and muted gains in medical care prices all
weighed on inflation.
Late last year, the Fed telegraphed that it
planned a “gradual” increase in rates over
the next couple of years. Although it has
followed through on two of the three
quarter-percentage-point increases it
expected to implement in 2017, the
recent deceleration in inflation could
prompt it to wait until 2018 to move
further. Some officials have indicated
that they will remain patient, waiting
until inflation reaches—and even modestly
exceeds—2% for some time before raising
rates at a quicker pace. However, the Fed is
still expected to proceed with its plans to
gradually reduce its balance sheet, which
was expanded dramatically after the
2008–09 financial crisis.
Management of the portfolio
The U.S. Treasury uses the non-seasonally
adjusted CPI for urban consumers (CPI-U
NSA) to govern the inflation adjustments
made for Treasury inflation-protected
securities (TIPS). As it had for the same
period in 2016, this measure rose for six
straight months: The monthly increase
was 0.6% in January, but it moderated to
0.1% in June.
In the TIPS market, real yields increased
among shorter maturities but mostly
remained in negative territory. The real
yield of the 2-year TIPS rose from –0.54%
to –0.25%, reflecting the market’s
8
expectation that the Fed would raise rates
over the next several years more slowly
than it had projected.
Meanwhile, the 5-year TIPS real yield
ended the six-months where it had
started, at 0.13%. The 10-year TIPS real
yield didn’t move much either, declining
just 0.05 percentage point to 0.57%. The
relative stability of TIPS yields on the
intermediate- and long-term sections of
the yield curve indicated that long-run
inflation worries remained dormant as
realized inflation stayed under the Fed’s
official target.
The fund’s Investor Shares’ 30-day SEC
yield began the period at 0.07%, retreated
to –0.15% in mid-March, and ended back
where it started, at 0.07%.
The break-even inflation (BEI) rate, which is
the difference between nominal Treasury
and TIPS yields, declined modestly, further
signaling investors’ belief that inflation was
well-contained. For example, the 2-year BEI
declined from 1.73% to 1.63%, the 5-year
BEI shifted from 1.80% to 1.76%, and the
10-year BEI went from 1.83% to 1.74%.
The BEI moves were caused more by
falling yields for nominal Treasuries than
by changes in TIPS yields. Growth
expectations slowed amid cooling
demand, inflation decelerated, and the
timeline for fiscal stimulus was pushed out
to 2018. The bellwether 10-year Treasury
yield, which began at 2.45%, declined to
2.20% in May but then moved up to end
the period at 2.31%.
We made minimal changes to the portfolio,
retaining an overweighted allocation to
long-dated securities, as we expect the Fed
to maintain a very gradual pace of rate hikes
over the next several quarters. Additional
tactical trading based on duration added
some value.
Unlike in 2016, when we withheld
distributions in March and September to
make sure we had sufficient income for
distributions in June and December, this
year we were able to make distributions in
both March and June. However, the June
distribution consisted only of interest
income from TIPS. We did not distribute
any inflation adjustments to minimize the
possibility of having to return capital to
shareholders in December. This could
occur if there is insufficient income from
our portfolio in the second half of the
year, which can happen because of the
sometimes volatile nature of the inflation
index used by the Treasury.
Outlook
We agree with the Fed’s view that the
recent disinflation is indeed transitory
and that we can expect a gradual rise
in the PCE measure through the end
of 2019. Readings on home prices and
rents remain on their long-term upward
trend, medical prices continue to rise,
and recent weakness in the U.S. dollar
should provide a modest uplift to prices
next year. Wage increases, which appear
to be mysteriously absent given the labor
market tightness, are expected to rise only
modestly by the end of the year but are

9
not, in our economic team’s view,
a necessary precondition for higher
core inflation.
Over the next year we expect that Fed
rate hikes will follow inflation higher,
rather than attempt to preempt inflation,
as its balance-sheet runoff commences.
There are several reasons for this. One is
the Fed’s need to see that inflation is not
decelerating because of weaker demand.
Another is the lingering uncertainty
surrounding fiscal policy and its potential
impact on growth. And lastly, the labor
market continues to expand at nearly
twice the rate of what is needed to replace
those leaving the workforce, but wages are
not accelerating.
The Fed has revised its estimate of full
employment to 4.6%, down from 4.9%
several years ago (and 6% before that).
Steady wages beg the question of whether
the economy still has labor-market slack. If
the labor force participation rate holds as
unemployment declines, the Fed can feel
quite positive about the outlook for
long-run growth and inflation as it raises
rates while reducing its balance sheet.
We expect the Fed will be patient—
perhaps waiting until at least the first half of
2018—before initiating further rate hikes.
This would keep the real federal funds rate
(the nominal rate less inflation) at zero for
the time being.
Gemma Wright-Casparius, Principal
Vanguard Fixed Income Group
July 24, 2017
Inflation-Protected Securities Fund
Fund ProfileAs of June 30, 2017
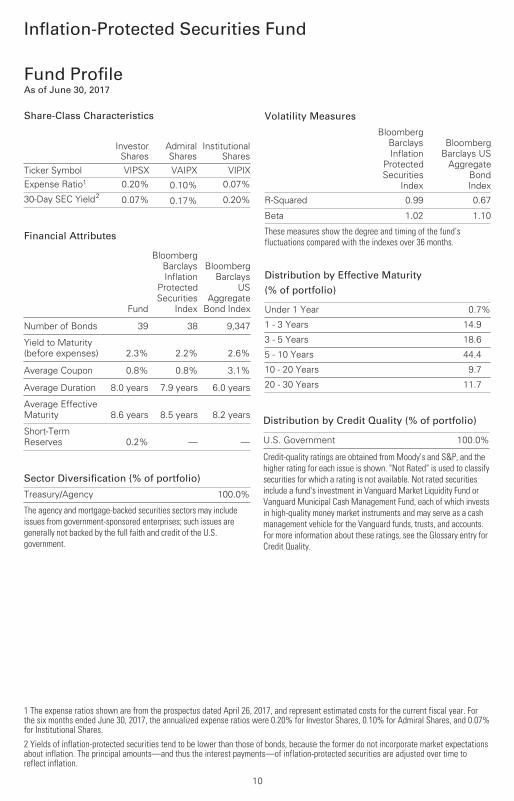
1 The expense ratios shown are from the prospectus dated April 26, 2017, and represent estimated costs for the current fiscal year. Forthe six months ended June 30, 2017, the annualized expense ratios were 0.20% for Investor Shares, 0.10% for Admiral Shares, and 0.07%for Institutional Shares.
2 Yields of inflation-protected securities tend to be lower than those of bonds, because the former do not incorporate market expectationsabout inflation. The principal amounts—and thus the interest payments—of inflation-protected securities are adjusted over time toreflect inflation.
10
Share-Class Characteristics
InvestorShares
AdmiralShares
InstitutionalShares
Ticker Symbol VIPSX VAIPX VIPIXExpense Ratio1 0.20% 0.10% 0.07%
30-Day SEC Yield2 0.07% 0.17% 0.20%
Volatility Measures
Bloomberg
Barclays
Inflation
Protected
Securities
Index
Bloomberg
Barclays US
Aggregate
Bond
Index
R-Squared 0.99 0.67
Beta 1.02 1.10
These measures show the degree and timing of the fund’s fluctuations compared with the indexes over 36 months.
Financial Attributes
Fund
Bloomberg
Barclays
Inflation
Protected
Securities
Index
Bloomberg
Barclays
US
Aggregate
Bond Index
Number of Bonds 39 38 9,347
Yield to Maturity
(before expenses) 2.3% 2.2% 2.6%
Average Coupon 0.8% 0.8% 3.1%
Average Duration 8.0 years 7.9 years 6.0 years
Average Effective
Maturity 8.6 years 8.5 years 8.2 years
Short-Term
Reserves 0.2% — —
Sector Diversification (% of portfolio)
Treasury/Agency 100.0%
The agency and mortgage-backed securities sectors may include issues from government-sponsored enterprises; such issues are generally not backed by the full faith and credit of the U.S. government.
Distribution by Effective Maturity
(% of portfolio)
Under 1 Year 0.7%
1 - 3 Years 14.9
3 - 5 Years 18.6
5 - 10 Years 44.4
10 - 20 Years 9.7
20 - 30 Years 11.7
Distribution by Credit Quality (% of portfolio)
U.S. Government 100.0%
Credit-quality ratings are obtained from Moody's and S&P, and the higher rating for each issue is shown. "Not Rated" is used to classify securities for which a rating is not available. Not rated securities include a fund's investment in Vanguard Market Liquidity Fund or Vanguard Municipal Cash Management Fund, each of which invests in high-quality money market instruments and may serve as a cash management vehicle for the Vanguard funds, trusts, and accounts. For more information about these ratings, see the Glossary entry for Credit Quality.

Inflation-Protected Securities Fund
11
Investment Focus
Average Maturity
Short
Treasury/ Agency
Investment-Grade
Corporate
Below Investment-Grade
Med. Long
Credit Quality
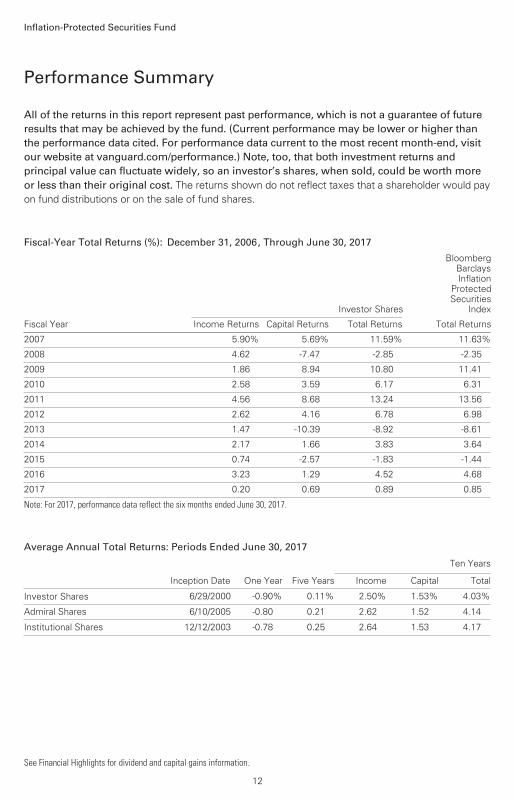
All of the returns in this report represent past performance, which is not a guarantee of future results that may be achieved by the fund. (Current performance may be lower or higher thanthe performance data cited. For performance data current to the most recent month-end, visitour website at vanguard.com/performance.) Note, too, that both investment returns and principal value can fluctuate widely, so an investor’s shares, when sold, could be worth more or less than their original cost. The returns shown do not reflect taxes that a shareholder would pay
on fund distributions or on the sale of fund shares.
Inflation-Protected Securities Fund
Performance Summary
See Financial Highlights for dividend and capital gains information.
12
Fiscal-Year Total Returns (%): December 31, 2006, Through June 30, 2017
Investor Shares
BloombergBarclaysInflation
ProtectedSecurities
Index
Fiscal Year Income Returns Capital Returns Total Returns Total Returns
2007 5.90% 5.69% 11.59% 11.63%
2008 4.62 -7.47 -2.85 -2.35
2009 1.86 8.94 10.80 11.41
2010 2.58 3.59 6.17 6.31
2011 4.56 8.68 13.24 13.56
2012 2.62 4.16 6.78 6.98
2013 1.47 -10.39 -8.92 -8.61
2014 2.17 1.66 3.83 3.64
2015 0.74 -2.57 -1.83 -1.44
2016 3.23 1.29 4.52 4.68
2017 0.20 0.69 0.89 0.85
Note: For 2017, performance data reflect the six months ended June 30, 2017.
Average Annual Total Returns: Periods Ended June 30, 2017
Ten Years
Inception Date One Year Five Years Income Capital Total
Investor Shares 6/29/2000 -0.90% 0.11% 2.50% 1.53% 4.03%
Admiral Shares 6/10/2005 -0.80 0.21 2.62 1.52 4.14
Institutional Shares 12/12/2003 -0.78 0.25 2.64 1.53 4.17

Inflation-Protected Securities Fund
Financial Statements (unaudited)
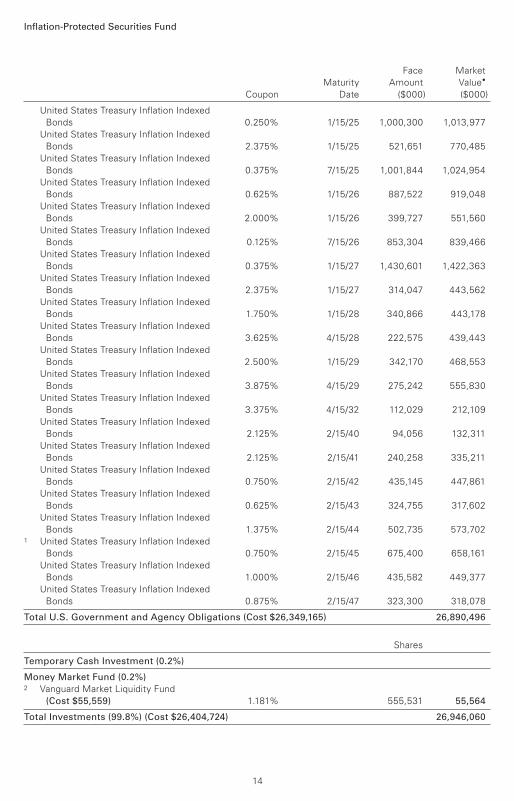
Statement of Net AssetsAs of June 30, 2017
U.S. Government and Agency Obligations (99.6%)
U.S. Government Securities (99.6%)
United States Treasury Inflation Indexed
Bonds 0.125% 4/15/18 189,721 199,968
United States Treasury Inflation Indexed
Bonds 1.375% 7/15/18 275,295 317,147
United States Treasury Inflation Indexed
Bonds 2.125% 1/15/19 280,697 330,178
United States Treasury Inflation Indexed
Bonds 0.125% 4/15/19 1,218,580 1,272,246
United States Treasury Inflation Indexed
Bonds 1.875% 7/15/19 342,276 408,636
United States Treasury Inflation Indexed
Bonds 1.375% 1/15/20 395,584 463,668
United States Treasury Inflation Indexed
Bonds 0.125% 4/15/20 1,205,200 1,260,208
United States Treasury Inflation Indexed
Bonds 1.250% 7/15/20 641,210 749,162
United States Treasury Inflation Indexed
Bonds 1.125% 1/15/21 770,499 893,836
United States Treasury Inflation Indexed
Bonds 0.125% 4/15/21 1,060,500 1,092,432
United States Treasury Inflation Indexed
Bonds 0.625% 7/15/21 857,801 953,474
United States Treasury Inflation Indexed
Bonds 0.125% 1/15/22 937,671 1,010,804
United States Treasury Inflation Indexed
Bonds 0.125% 4/15/22 385,000 385,229
United States Treasury Inflation Indexed
Bonds 0.125% 7/15/22 987,019 1,048,206
United States Treasury Inflation Indexed
Bonds 0.125% 1/15/23 1,006,330 1,055,906
United States Treasury Inflation Indexed
Bonds 0.375% 7/15/23 974,236 1,029,893
United States Treasury Inflation Indexed
Bonds 0.625% 1/15/24 971,256 1,032,158
United States Treasury Inflation Indexed
Bonds 0.125% 7/15/24 1,038,771 1,050,514
Face Market
Maturity Amount Value•
Coupon Date ($000) ($000)
The fund reports a complete list of its holdings in regulatory filings four times in each fiscal year, at
the quarter-ends. For the second and fourth fiscal quarters, the lists appear in the fund’s semiannual
and annual reports to shareholders. For the first and third fiscal quarters, the fund files the lists with
the Securities and Exchange Commission on Form N-Q. Shareholders can look up the fund’s Forms
N-Q on the SEC’s website at sec.gov. Forms N-Q may also be reviewed and copied at the SEC’s
Public Reference Room (see the back cover of this report for further information).
13
Inflation-Protected Securities Fund
United States Treasury Inflation Indexed
Bonds 0.250% 1/15/25 1,000,300 1,013,977
United States Treasury Inflation Indexed
Bonds 2.375% 1/15/25 521,651 770,485
United States Treasury Inflation Indexed
Bonds 0.375% 7/15/25 1,001,844 1,024,954
United States Treasury Inflation Indexed
Bonds 0.625% 1/15/26 887,522 919,048
United States Treasury Inflation Indexed
Bonds 2.000% 1/15/26 399,727 551,560
United States Treasury Inflation Indexed
Bonds 0.125% 7/15/26 853,304 839,466
United States Treasury Inflation Indexed
Bonds 0.375% 1/15/27 1,430,601 1,422,363
United States Treasury Inflation Indexed
Bonds 2.375% 1/15/27 314,047 443,562
United States Treasury Inflation Indexed
Bonds 1.750% 1/15/28 340,866 443,178
United States Treasury Inflation Indexed
Bonds 3.625% 4/15/28 222,575 439,443
United States Treasury Inflation Indexed
Bonds 2.500% 1/15/29 342,170 468,553
United States Treasury Inflation Indexed
Bonds 3.875% 4/15/29 275,242 555,830
United States Treasury Inflation Indexed
Bonds 3.375% 4/15/32 112,029 212,109
United States Treasury Inflation Indexed
Bonds 2.125% 2/15/40 94,056 132,311
United States Treasury Inflation Indexed
Bonds 2.125% 2/15/41 240,258 335,211
United States Treasury Inflation Indexed
Bonds 0.750% 2/15/42 435,145 447,861
United States Treasury Inflation Indexed
Bonds 0.625% 2/15/43 324,755 317,602
United States Treasury Inflation Indexed
Bonds 1.375% 2/15/44 502,735 573,7021 United States Treasury Inflation Indexed
Bonds 0.750% 2/15/45 675,400 658,161
United States Treasury Inflation Indexed
Bonds 1.000% 2/15/46 435,582 449,377
United States Treasury Inflation Indexed
Bonds 0.875% 2/15/47 323,300 318,078
Total U.S. Government and Agency Obligations (Cost $26,349,165) 26,890,496
Shares
Temporary Cash Investment (0.2%)
Money Market Fund (0.2%)2 Vanguard Market Liquidity Fund
(Cost $55,559) 1.181% 555,531 55,564
Total Investments (99.8%) (Cost $26,404,724) 26,946,060
Face Market
Maturity Amount Value•
Coupon Date ($000) ($000)
14

Inflation-Protected Securities Fund
Liability for Options Written (0.0%)
Put Options on 10-year U.S. Treasury Note
Futures Contracts, Strike Price $126.00 7/21/17 190 (145)
Put Options on 10-year U.S. Treasury Note
Futures Contracts, Strike Price $124.50 8/25/17 475 (215)
Put Options on 10-year U.S. Treasury Note
Futures Contracts, Strike Price $124.00 8/25/17 285 (94)
Total Liability for Options Written (Premiums received $284) (454)
Amount
($000)
Other Assets and Liabilities (0.2%)
Other Assets
Investment in Vanguard 1,789
Receivables for Accrued Income 82,980
Receivables for Capital Shares Issued 32,674
Other Assets 5,763
Total Other Assets 123,206
Other Liabilities
Payables for Investment Securities Purchased (61)
Payables for Capital Shares Redeemed (34,094)
Payables to Vanguard (26,528)
Other Liabilities (4,568)
Total Other Liabilities (65,251)
Net Assets (100%) 27,003,561
At June 30, 2017, net assets consisted of:
Amount
($000)
Paid-in Capital 26,187,552
Undistributed Net Investment Income 262,754
Accumulated Net Realized Gains 11,582
Unrealized Appreciation (Depreciation)
Investment Securities 541,336
Futures Contracts 507
Options on Futures Contracts (170)
Net Assets 27,003,561
Market
Value•
Expiration Date Contracts ($000)
15
Inflation-Protected Securities Fund
Amount
($000)
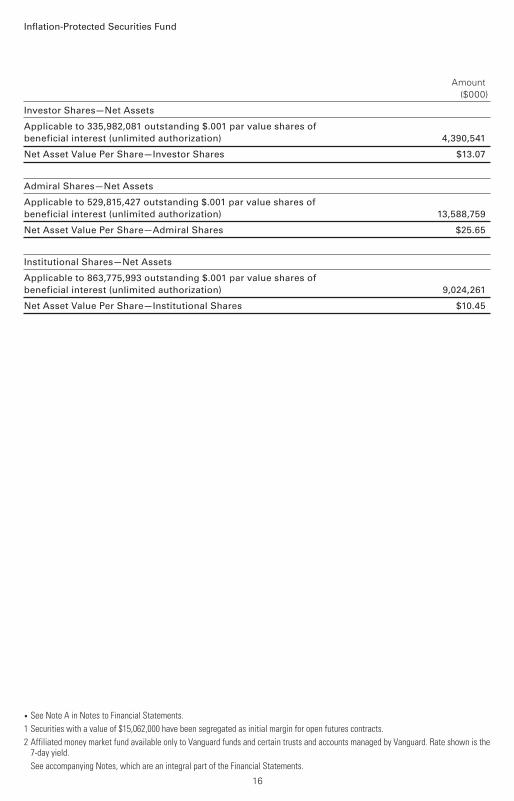
• See Note A in Notes to Financial Statements.
1 Securities with a value of $15,062,000 have been segregated as initial margin for open futures contracts.
2 Affiliated money market fund available only to Vanguard funds and certain trusts and accounts managed by Vanguard. Rate shown is the 7-day yield.
See accompanying Notes, which are an integral part of the Financial Statements.
Investor Shares—Net Assets
Applicable to 335,982,081 outstanding $.001 par value shares of
beneficial interest (unlimited authorization) 4,390,541
Net Asset Value Per Share—Investor Shares $13.07
Admiral Shares—Net Assets
Applicable to 529,815,427 outstanding $.001 par value shares of
beneficial interest (unlimited authorization) 13,588,759
Net Asset Value Per Share—Admiral Shares $25.65
Institutional Shares—Net Assets
Applicable to 863,775,993 outstanding $.001 par value shares of
beneficial interest (unlimited authorization) 9,024,261
Net Asset Value Per Share—Institutional Shares $10.45
16
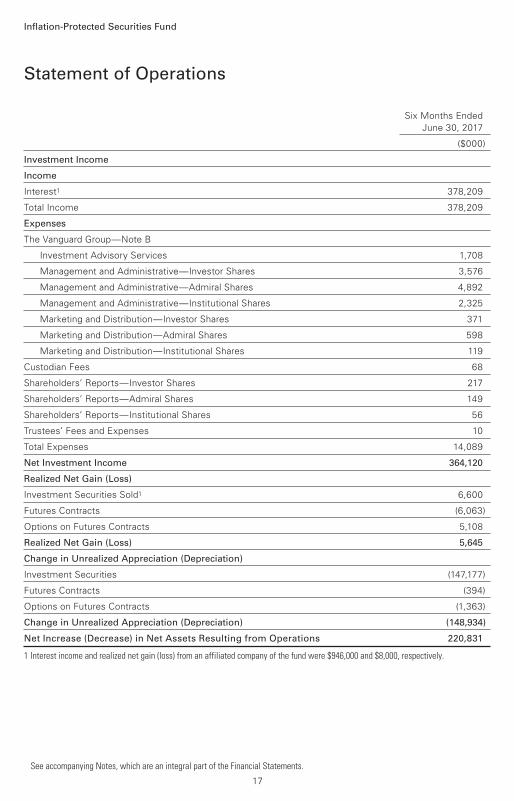
Six Months Ended
June 30, 2017
($000)
Investment Income
Income
Interest1 378,209
Total Income 378,209
Expenses
The Vanguard Group—Note B
Investment Advisory Services 1,708
Management and Administrative—Investor Shares 3,576
Management and Administrative—Admiral Shares 4,892
Management and Administrative—Institutional Shares 2,325
Marketing and Distribution—Investor Shares 371
Marketing and Distribution—Admiral Shares 598
Marketing and Distribution—Institutional Shares 119
Custodian Fees 68
Shareholders’ Reports—Investor Shares 217
Shareholders’ Reports—Admiral Shares 149
Shareholders’ Reports—Institutional Shares 56
Trustees’ Fees and Expenses 10
Total Expenses 14,089
Net Investment Income 364,120
Realized Net Gain (Loss)
Investment Securities Sold1 6,600
Futures Contracts (6,063)
Options on Futures Contracts 5,108
Realized Net Gain (Loss) 5,645
Change in Unrealized Appreciation (Depreciation)
Investment Securities (147,177)
Futures Contracts (394)
Options on Futures Contracts (1,363)
Change in Unrealized Appreciation (Depreciation) (148,934)
Net Increase (Decrease) in Net Assets Resulting from Operations 220,831
1 Interest income and realized net gain (loss) from an affiliated company of the fund were $946,000 and $8,000, respectively.
Statement of Operations
Inflation-Protected Securities Fund
See accompanying Notes, which are an integral part of the Financial Statements.
17
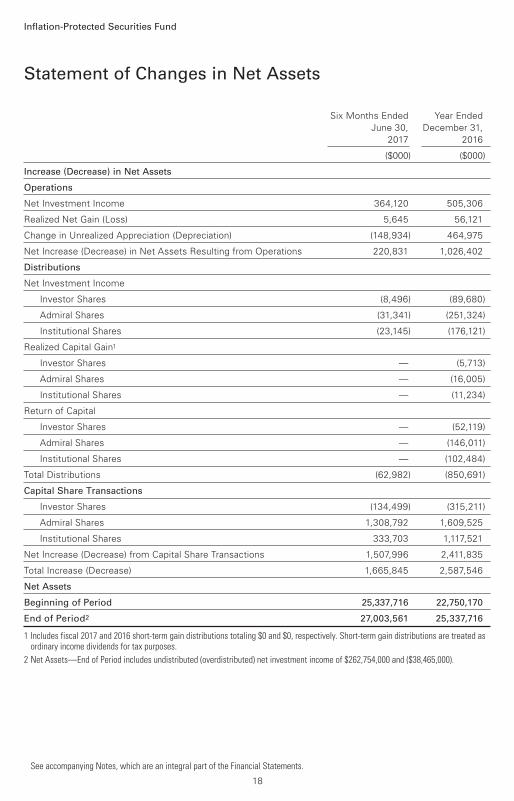
Statement of Changes in Net Assets
Inflation-Protected Securities Fund
See accompanying Notes, which are an integral part of the Financial Statements.
Six Months Ended Year Ended
June 30, December 31,
2017 2016
($000) ($000)
Increase (Decrease) in Net Assets
Operations
Net Investment Income 364,120 505,306
Realized Net Gain (Loss) 5,645 56,121
Change in Unrealized Appreciation (Depreciation) (148,934) 464,975
Net Increase (Decrease) in Net Assets Resulting from Operations 220,831 1,026,402
Distributions
Net Investment Income
Investor Shares (8,496) (89,680)
Admiral Shares (31,341) (251,324)
Institutional Shares (23,145) (176,121)
Realized Capital Gain1
Investor Shares — (5,713)
Admiral Shares — (16,005)
Institutional Shares — (11,234)
Return of Capital
Investor Shares — (52,119)
Admiral Shares — (146,011)
Institutional Shares — (102,484)
Total Distributions (62,982) (850,691)
Capital Share Transactions
Investor Shares (134,499) (315,211)
Admiral Shares 1,308,792 1,609,525
Institutional Shares 333,703 1,117,521
Net Increase (Decrease) from Capital Share Transactions 1,507,996 2,411,835
Total Increase (Decrease) 1,665,845 2,587,546
Net Assets
Beginning of Period 25,337,716 22,750,170
End of Period2 27,003,561 25,337,716
1 Includes fiscal 2017 and 2016 short-term gain distributions totaling $0 and $0, respectively. Short-term gain distributions are treated as ordinary income dividends for tax purposes.
2 Net Assets—End of Period includes undistributed (overdistributed) net investment income of $262,754,000 and ($38,465,000).
18

Investor Shares
Six Months
Ended
For a Share Outstanding June 30, Year Ended December 31,
Throughout Each Period 2017 2016 2015 2014 2013 2012
Net Asset Value, Beginning of Period $12.98 $12.84 $13.18 $12.98 $14.53 $14.11
Investment Operations
Net Investment Income .171 .263 .098 .224 .210 .367
Net Realized and Unrealized Gain (Loss)
on Investments (.056) .315 (.339) .273 (1.499) .586
Total from Investment Operations .115 .578 (.241) .497 (1.289) .953
Distributions
Dividends from Net Investment Income (.025) (.266) (.098) (.281) (.216) (.366)
Distributions from Realized Capital Gains — (.017) (.001) (.016) (.045) (.167)
Return of Capital — (.155) — — — —
Total Distributions (.025) (.438) (.099) (.297) (.261) (.533)
Net Asset Value, End of Period $13.07 $12.98 $12.84 $13.18 $12.98 $14.53
Total Return1 0.89% 4.52% -1.83% 3.83% -8.92% 6.78%
Ratios/Supplemental Data
Net Assets, End of Period (Millions) $4,391 $4,496 $4,746 $5,604 $6,577 $16,075
Ratio of Total Expenses to
Average Net Assets 0.20% 0.20% 0.20% 0.20% 0.20% 0.20%
Ratio of Net Investment Income to
Average Net Assets 2.67% 1.99% 0.72% 2.01% 1.33% 2.55%
Portfolio Turnover Rate2 26% 27% 43% 39% 44% 33%
The expense ratio, net investment income ratio, and turnover rate for the current period have been annualized.
1 Total returns do not include account service fees that may have applied in the periods shown. Fund prospectuses provide information about any applicable account service fees.
2 Excludes the value of portfolio securities received or delivered as a result of in-kind purchases or redemptions of the fund’s capital shares.
Financial Highlights
See accompanying Notes, which are an integral part of the Financial Statements.
Inflation-Protected Securities Fund
19
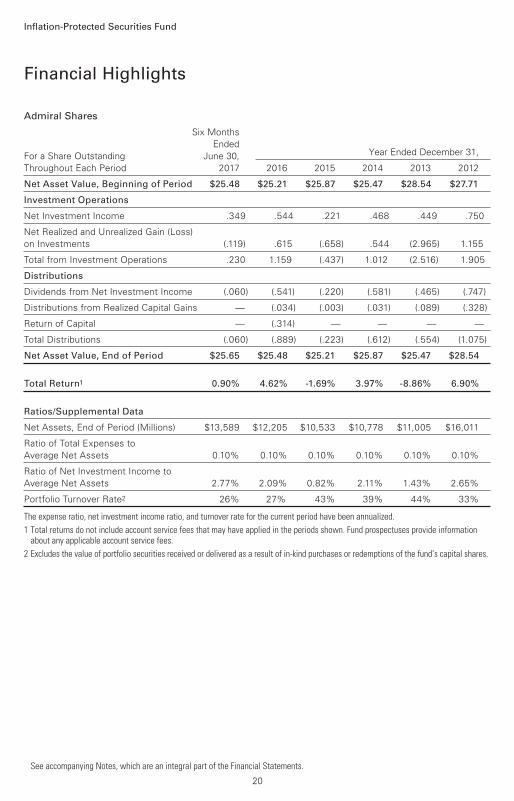
Admiral Shares
Six Months
Ended
For a Share Outstanding June 30, Year Ended December 31,
Throughout Each Period 2017 2016 2015 2014 2013 2012
Net Asset Value, Beginning of Period $25.48 $25.21 $25.87 $25.47 $28.54 $27.71
Investment Operations
Net Investment Income .349 .544 .221 .468 .449 .750
Net Realized and Unrealized Gain (Loss)
on Investments (.119) .615 (.658) .544 (2.965) 1.155
Total from Investment Operations .230 1.159 (.437) 1.012 (2.516) 1.905
Distributions
Dividends from Net Investment Income (.060) (.541) (.220) (.581) (.465) (.747)
Distributions from Realized Capital Gains — (.034) (.003) (.031) (.089) (.328)
Return of Capital — (.314) — — — —
Total Distributions (.060) (.889) (.223) (.612) (.554) (1.075)
Net Asset Value, End of Period $25.65 $25.48 $25.21 $25.87 $25.47 $28.54
Total Return1 0.90% 4.62% -1.69% 3.97% -8.86% 6.90%
Ratios/Supplemental Data
Net Assets, End of Period (Millions) $13,589 $12,205 $10,533 $10,778 $11,005 $16,011
Ratio of Total Expenses to
Average Net Assets 0.10% 0.10% 0.10% 0.10% 0.10% 0.10%
Ratio of Net Investment Income to
Average Net Assets 2.77% 2.09% 0.82% 2.11% 1.43% 2.65%
Portfolio Turnover Rate2 26% 27% 43% 39% 44% 33%
The expense ratio, net investment income ratio, and turnover rate for the current period have been annualized.
1 Total returns do not include account service fees that may have applied in the periods shown. Fund prospectuses provide information about any applicable account service fees.
2 Excludes the value of portfolio securities received or delivered as a result of in-kind purchases or redemptions of the fund’s capital shares.
Financial Highlights
See accompanying Notes, which are an integral part of the Financial Statements.
Inflation-Protected Securities Fund
20
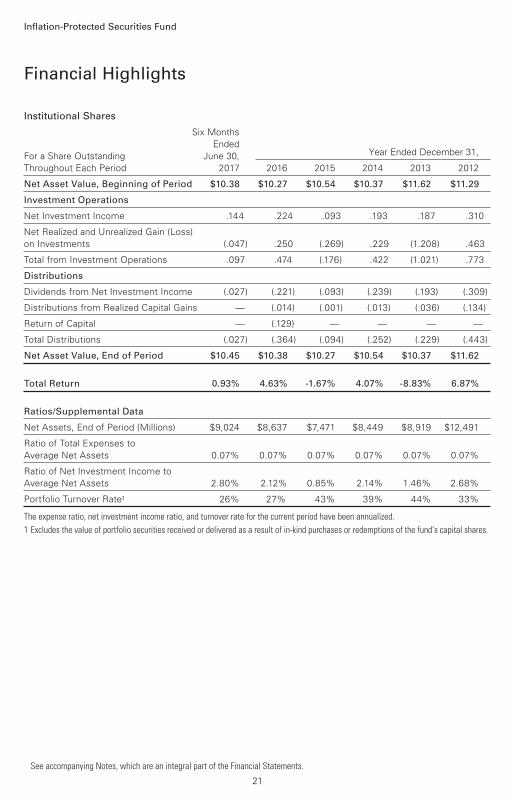
Institutional Shares
Six Months
Ended
For a Share Outstanding June 30, Year Ended December 31,
Throughout Each Period 2017 2016 2015 2014 2013 2012
Net Asset Value, Beginning of Period $10.38 $10.27 $10.54 $10.37 $11.62 $11.29
Investment Operations
Net Investment Income .144 .224 .093 .193 .187 .310
Net Realized and Unrealized Gain (Loss)
on Investments (.047) .250 (.269) .229 (1.208) .463
Total from Investment Operations .097 .474 (.176) .422 (1.021) .773
Distributions
Dividends from Net Investment Income (.027) (.221) (.093) (.239) (.193) (.309)
Distributions from Realized Capital Gains — (.014) (.001) (.013) (.036) (.134)
Return of Capital — (.129) — — — —
Total Distributions (.027) (.364) (.094) (.252) (.229) (.443)
Net Asset Value, End of Period $10.45 $10.38 $10.27 $10.54 $10.37 $11.62
Total Return 0.93% 4.63% -1.67% 4.07% -8.83% 6.87%
Ratios/Supplemental Data
Net Assets, End of Period (Millions) $9,024 $8,637 $7,471 $8,449 $8,919 $12,491
Ratio of Total Expenses to
Average Net Assets 0.07% 0.07% 0.07% 0.07% 0.07% 0.07%
Ratio of Net Investment Income to
Average Net Assets 2.80% 2.12% 0.85% 2.14% 1.46% 2.68%
Portfolio Turnover Rate1 26% 27% 43% 39% 44% 33%
The expense ratio, net investment income ratio, and turnover rate for the current period have been annualized.
1 Excludes the value of portfolio securities received or delivered as a result of in-kind purchases or redemptions of the fund’s capital shares.
Financial Highlights
See accompanying Notes, which are an integral part of the Financial Statements.
Inflation-Protected Securities Fund
21
Notes to Financial Statements
Inflation-Protected Securities Fund
Vanguard Inflation-Protected Securities Fund is registered under the Investment Company Act of
1940 as an open-end investment company, or mutual fund. The fund offers three classes of shares:
Investor Shares, Admiral Shares, and Institutional Shares. Investor Shares are available to any
investor who meets the fund’s minimum purchase requirements. Admiral Shares and Institutional
Shares are designed for investors who meet certain administrative, service, and account-size criteria.
A. The following significant accounting policies conform to generally accepted accounting
principles for U.S. investment companies. The fund consistently follows such policies in
preparing its financial statements.
1. Security Valuation: Securities are valued as of the close of trading on the New York Stock
Exchange (generally 4 p.m., Eastern time) on the valuation date. Bonds and temporary cash
investments are valued using the latest bid prices or using valuations based on a matrix system
(which considers such factors as security prices, yields, maturities, and ratings), both as furnished
by independent pricing services. Investments in Vanguard Market Liquidity Fund are valued at that
fund’s net asset value. Securities for which market quotations are not readily available, or whose
values have been affected by events occurring before the fund’s pricing time but after the close
of the securities’ primary markets, are valued by methods deemed by the board of trustees to
represent fair value.
2. Futures and Options: The fund uses futures contracts and options on futures contracts to invest
in fixed income asset classes with greater efficiency and lower cost than is possible through direct
investment, to add value when these instruments are attractively priced, or to adjust sensitivity
to changes in interest rates. The primary risks associated with the use of futures contracts are
imperfect correlation between changes in market values of bonds held by the fund and the prices
of futures contracts, and the possibility of an illiquid market. The primary risk associated with
purchasing options is that interest rates move in such a way that the option is out-of-the-money, the
position is worthless at expiration, and the fund loses the premium paid. The primary risk associated
with writing options is that interest rates move in such a way that the option is in-the-money, the
counterparty exercises the option, and the fund loses an amount equal to the market value of the
option written less the premium received. Counterparty risk involving futures and exchange-traded
options is mitigated because a regulated clearinghouse is the counterparty instead of the clearing
broker. To further mitigate counterparty risk, the fund trades futures and options on an exchange,
monitors the financial strength of its clearing brokers and clearinghouse, and has entered into
clearing agreements with its clearing brokers. The clearinghouse imposes initial margin
requirements to secure the fund’s performance and requires daily settlement of variation
margin representing changes in the market value of each contract.
Futures contracts are valued at their quoted daily settlement prices. The aggregate settlement
values of the contracts are not recorded in the Statement of Net Assets. Fluctuations in the value
of the contracts are recorded in the Statement of Net Assets as an asset (liability) and in the
Statement of Operations as unrealized appreciation (depreciation) until the contracts are
closed, when they are recorded as realized futures gains (losses).
During the six months ended June 30, 2017, the fund’s average investments in long and short
futures contracts represented 8% and 4% of net assets, respectively, based on the average of
aggregate settlement values at each quarter-end during the period.
22
Inflation-Protected Securities Fund
Options on futures contracts are also valued at their quoted daily settlement prices. The premium
paid for a purchased option is recorded in the Statement of Net Assets as an asset that is
subsequently adjusted daily to the current market value of the option purchased. The premium
received for a written option is recorded in the Statement of Net Assets as an asset with an equal
liability that is subsequently adjusted daily to the current market value of the option written.
Fluctuations in the value of the options are recorded in the Statement of Operations as unrealized
appreciation (depreciation) until expired, closed, or exercised, at which time realized gains (losses)
are recognized.
During the six months ended June 30, 2017, the fund’s average value of investments in options
purchased and options written each represented less than 1% of net assets, respectively, based
on the average market values at each quarter-end during the period.
3. Federal Income Taxes: The fund intends to continue to qualify as a regulated investment company
and distribute all of its taxable income. Management has analyzed the fund’s tax positions taken for
all open federal income tax years (December 31, 2013–2016), and for the period ended June 30,
2017, and has concluded that no provision for federal income tax is required in the fund’s
financial statements.
4. Distributions: Distributions to shareholders are recorded on the ex-dividend date.
5. Credit Facility: The fund and certain other funds managed by The Vanguard Group (“Vanguard”)
participate in a $3.1 billion committed credit facility provided by a syndicate of lenders pursuant to
a credit agreement that may be renewed annually; each fund is individually liable for its borrowings,
if any, under the credit facility. Borrowings may be utilized for temporary and emergency purposes,
and are subject to the fund’s regulatory and contractual borrowing restrictions. The participating
funds are charged administrative fees and an annual commitment fee of 0.10% of the undrawn
amount of the facility; these fees are allocated to the funds based on a method approved by the
fund’s board of trustees and included in Management and Administrative expenses on the fund’s
Statement of Operations. Any borrowings under this facility bear interest at a rate based upon the
higher of the one-month London Interbank Offered Rate, federal funds effective rate, or overnight
bank funding rate plus an agreed-upon spread.
The fund had no borrowings outstanding at June 30, 2017, or at any time during the period
then ended.
6. Other: Interest income includes income distributions received from Vanguard Market Liquidity
Fund and is accrued daily. Premiums and discounts on debt securities purchased are amortized
and accreted, respectively, to interest income over the lives of the respective securities. Security
transactions are accounted for on the date securities are bought or sold. Costs used to determine
realized gains (losses) on the sale of investment securities are those of the specific securities sold.
Each class of shares has equal rights as to assets and earnings, except that each class separately
bears certain class-specific expenses related to maintenance of shareholder accounts (included in
Management and Administrative expenses) and shareholder reporting. Marketing and distribution
expenses are allocated to each class of shares based on a method approved by the board of
trustees. Income, other non-class-specific expenses, and gains and losses on investments
are allocated to each class of shares based on its relative net assets.
23
Inflation-Protected Securities Fund
B. In accordance with the terms of a Funds’ Service Agreement (the “FSA”) between Vanguard
and the fund, Vanguard furnishes to the fund investment advisory, corporate management,
administrative, marketing, and distribution services at Vanguard’s cost of operations (as defined
by the FSA). These costs of operations are allocated to the fund based on methods and guidelines
approved by the board of trustees. Vanguard does not require reimbursement in the current period
for certain costs of operations (such as deferred compensation/benefits and risk/insurance costs);
the fund’s liability for these costs of operations is included in Payables to Vanguard on the Statement
of Net Assets.
Upon the request of Vanguard, the fund may invest up to 0.40% of its net assets as capital in
Vanguard. At June 30, 2017, the fund had contributed to Vanguard capital in the amount of
$1,789,000, representing 0.01% of the fund’s net assets and 0.72% of Vanguard’s capitalization.
The fund’s trustees and officers are also directors and employees, respectively, of Vanguard.
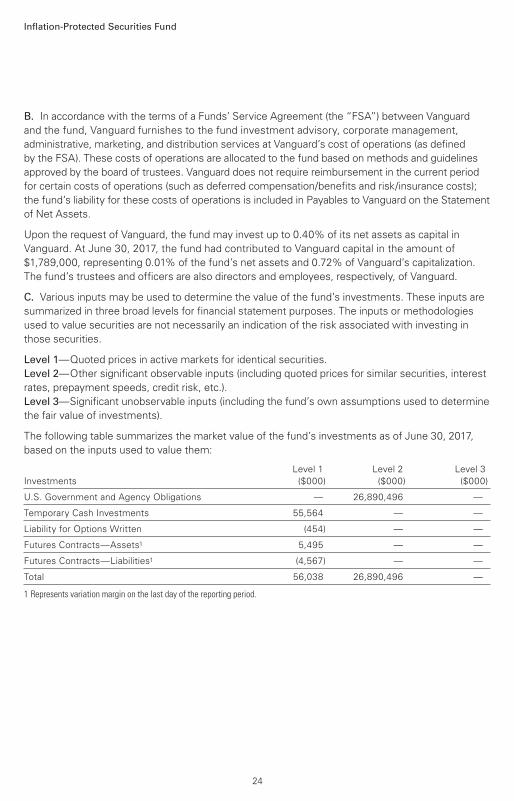
C. Various inputs may be used to determine the value of the fund’s investments. These inputs are
summarized in three broad levels for financial statement purposes. The inputs or methodologies
used to value securities are not necessarily an indication of the risk associated with investing in
those securities.
Level 1—Quoted prices in active markets for identical securities.
Level 2—Other significant observable inputs (including quoted prices for similar securities, interest
rates, prepayment speeds, credit risk, etc.).
Level 3—Significant unobservable inputs (including the fund’s own assumptions used to determine
the fair value of investments).
The following table summarizes the market value of the fund’s investments as of June 30, 2017,
based on the inputs used to value them:
Level 1 Level 2 Level 3
Investments ($000) ($000) ($000)
U.S. Government and Agency Obligations — 26,890,496 —
Temporary Cash Investments 55,564 — —
Liability for Options Written (454) — —
Futures Contracts—Assets1 5,495 — —
Futures Contracts—Liabilities1 (4,567) — —
Total 56,038 26,890,496 —
1 Represents variation margin on the last day of the reporting period.
24
Inflation-Protected Securities Fund
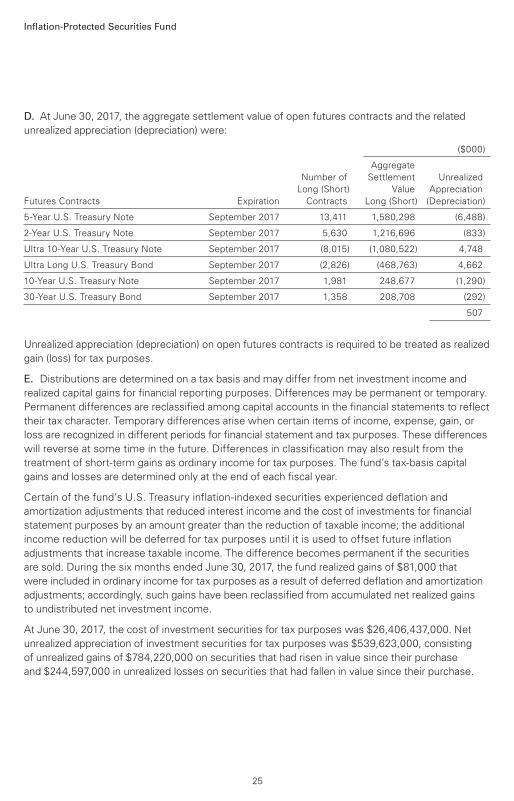
D. At June 30, 2017, the aggregate settlement value of open futures contracts and the related
unrealized appreciation (depreciation) were:
($000)
Aggregate
Number of Settlement Unrealized
Long (Short) Value Appreciation
Futures Contracts Expiration Contracts Long (Short) (Depreciation)
5-Year U.S. Treasury Note September 2017 13,411 1,580,298 (6,488)
2-Year U.S. Treasury Note September 2017 5,630 1,216,696 (833)
Ultra 10-Year U.S. Treasury Note September 2017 (8,015) (1,080,522) 4,748
Ultra Long U.S. Treasury Bond September 2017 (2,826) (468,763) 4,662
10-Year U.S. Treasury Note September 2017 1,981 248,677 (1,290)
30-Year U.S. Treasury Bond September 2017 1,358 208,708 (292)
507
Unrealized appreciation (depreciation) on open futures contracts is required to be treated as realized
gain (loss) for tax purposes.
E. Distributions are determined on a tax basis and may differ from net investment income and
realized capital gains for financial reporting purposes. Differences may be permanent or temporary.
Permanent differences are reclassified among capital accounts in the financial statements to reflect
their tax character. Temporary differences arise when certain items of income, expense, gain, or
loss are recognized in different periods for financial statement and tax purposes. These differences
will reverse at some time in the future. Differences in classification may also result from the
treatment of short-term gains as ordinary income for tax purposes. The fund’s tax-basis capital
gains and losses are determined only at the end of each fiscal year.
Certain of the fund’s U.S. Treasury inflation-indexed securities experienced deflation and
amortization adjustments that reduced interest income and the cost of investments for financial
statement purposes by an amount greater than the reduction of taxable income; the additional
income reduction will be deferred for tax purposes until it is used to offset future inflation
adjustments that increase taxable income. The difference becomes permanent if the securities
are sold. During the six months ended June 30, 2017, the fund realized gains of $81,000 that
were included in ordinary income for tax purposes as a result of deferred deflation and amortization
adjustments; accordingly, such gains have been reclassified from accumulated net realized gains
to undistributed net investment income.
At June 30, 2017, the cost of investment securities for tax purposes was $26,406,437,000. Net
unrealized appreciation of investment securities for tax purposes was $539,623,000, consisting
of unrealized gains of $784,220,000 on securities that had risen in value since their purchase
and $244,597,000 in unrealized losses on securities that had fallen in value since their purchase.
25
Inflation-Protected Securities Fund
F. During the six months ended June 30, 2017, the fund purchased $4,984,177,000 of
investment securities and sold $3,446,134,000 of investment securities, other than temporary
cash investments.
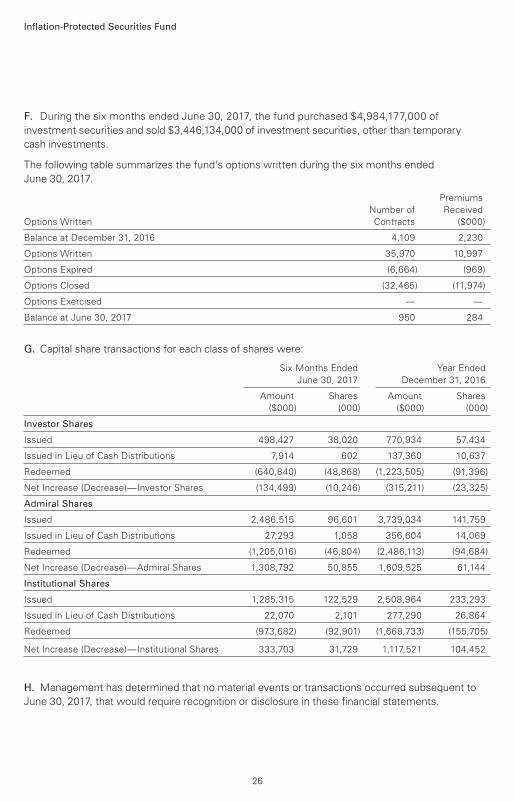
The following table summarizes the fund’s options written during the six months ended
June 30, 2017.
Premiums
Number of Received
Options Written Contracts ($000)
Balance at December 31, 2016 4,109 2,230
Options Written 35,970 10,997
Options Expired (6,664) (969)
Options Closed (32,465) (11,974)
Options Exercised — —
Balance at June 30, 2017 950 284
G. Capital share transactions for each class of shares were:
Six Months Ended Year Ended
June 30, 2017 December 31, 2016
Amount Shares Amount Shares
($000) (000) ($000) (000)
Investor Shares
Issued 498,427 38,020 770,934 57,434
Issued in Lieu of Cash Distributions 7,914 602 137,360 10,637
Redeemed (640,840) (48,868) (1,223,505) (91,396)
Net Increase (Decrease)—Investor Shares (134,499) (10,246) (315,211) (23,325)
Admiral Shares
Issued 2,486,515 96,601 3,739,034 141,759
Issued in Lieu of Cash Distributions 27,293 1,058 356,604 14,069
Redeemed (1,205,016) (46,804) (2,486,113) (94,684)
Net Increase (Decrease)—Admiral Shares 1,308,792 50,855 1,609,525 61,144
Institutional Shares
Issued 1,285,315 122,529 2,508,964 233,293
Issued in Lieu of Cash Distributions 22,070 2,101 277,290 26,864
Redeemed (973,682) (92,901) (1,668,733) (155,705)
Net Increase (Decrease)—Institutional Shares 333,703 31,729 1,117,521 104,452
H. Management has determined that no material events or transactions occurred subsequent to
June 30, 2017, that would require recognition or disclosure in these financial statements.
26

About Your Fund’s Expenses
27
As a shareholder of the fund, you incur ongoing costs, which include costs for portfolio management,
administrative services, and shareholder reports (like this one), among others. Operating expenses,
which are deducted from a fund’s gross income, directly reduce the investment return of the fund.
A fund’s expenses are expressed as a percentage of its average net assets. This figure is known as
the expense ratio. The following examples are intended to help you understand the ongoing costs (in
dollars) of investing in your fund and to compare these costs with those of other mutual funds. The
examples are based on an investment of $1,000 made at the beginning of the period shown and held
for the entire period.
The accompanying table illustrates your fund’s costs in two ways:
• Based on actual fund return. This section helps you to estimate the actual expenses that you
paid over the period. The ”Ending Account Value“ shown is derived from the fund‘s actual return,
and the third column shows the dollar amount that would have been paid by an investor who started
with $1,000 in the fund. You may use the information here, together with the amount you invested,
to estimate the expenses that you paid over the period.
To do so, simply divide your account value by $1,000 (for example, an $8,600 account value divided
by $1,000 = 8.6), then multiply the result by the number given for your fund under the heading
”Expenses Paid During Period.“
• Based on hypothetical 5% yearly return. This section is intended to help you compare your
fund‘s costs with those of other mutual funds. It assumes that the fund had a yearly return of 5%
before expenses, but that the expense ratio is unchanged. In this case—because the return used is
not the fund’s actual return—the results do not apply to your investment. The example is useful in
making comparisons because the Securities and Exchange Commission requires all mutual funds to
calculate expenses based on a 5% return. You can assess your fund’s costs by comparing this
hypothetical example with the hypothetical examples that appear in shareholder reports of other
funds.
Note that the expenses shown in the table are meant to highlight and help you compare ongoingcosts only and do not reflect transaction costs incurred by the fund for buying and sellingsecurities. Further, the expenses do not include any purchase, redemption, or account servicefees described in the fund prospectus. If such fees were applied to your account, your costswould be higher. Your fund does not carry a “sales load.”
The calculations assume no shares were bought or sold during the period. Your actual costs may
have been higher or lower, depending on the amount of your investment and the timing of any
purchases or redemptions.
You can find more information about the fund’s expenses, including annual expense ratios, in the
Financial Statements section of this report. For additional information on operating expenses and
other shareholder costs, please refer to your fund’s current prospectus.
28
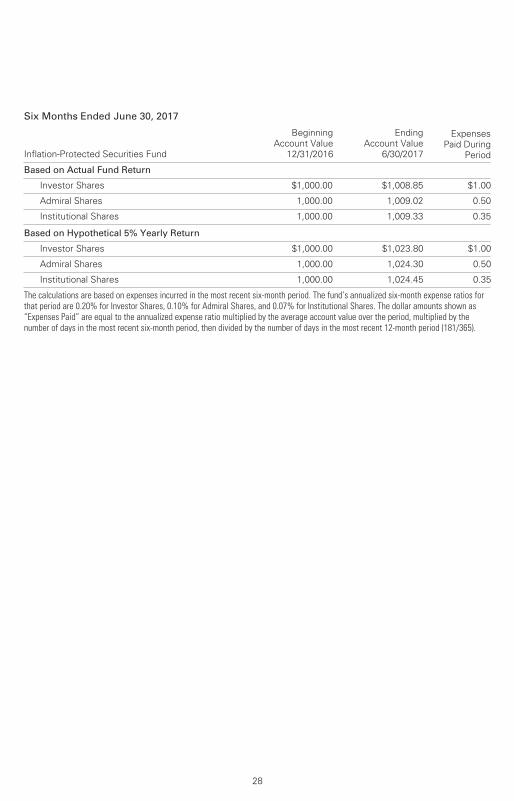
Six Months Ended June 30, 2017
Inflation-Protected Securities Fund
Beginning
Account Value
12/31/2016
Ending
Account Value
6/30/2017
Expenses
Paid During
Period
Based on Actual Fund Return
Investor Shares $1,000.00 $1,008.85 $1.00
Admiral Shares 1,000.00 1,009.02 0.50
Institutional Shares 1,000.00 1,009.33 0.35
Based on Hypothetical 5% Yearly Return
Investor Shares $1,000.00 $1,023.80 $1.00
Admiral Shares 1,000.00 1,024.30 0.50
Institutional Shares 1,000.00 1,024.45 0.35
The calculations are based on expenses incurred in the most recent six-month period. The fund’s annualized six-month expense ratios forthat period are 0.20% for Investor Shares, 0.10% for Admiral Shares, and 0.07% for Institutional Shares. The dollar amounts shown as“Expenses Paid” are equal to the annualized expense ratio multiplied by the average account value over the period, multiplied by thenumber of days in the most recent six-month period, then divided by the number of days in the most recent 12-month period (181/365).
The board of trustees of Vanguard Inflation-Protected Securities Fund has renewed the fund’s
investment advisory arrangement with The Vanguard Group, Inc. (Vanguard), through its Fixed
Income Group. The board determined that continuing the fund’s internalized management
structure was in the best interests of the fund and its shareholders.
The board based its decision upon an evaluation of the advisor’s investment staff, portfolio
management process, and performance. This evaluation included information provided to the board
by Vanguard’s Portfolio Review Department, which is responsible for fund and advisor oversight and
product management. The Portfolio Review Department met regularly with the advisor and made
monthly presentations to the board during the fiscal year that directed the board’s focus to relevant
information and topics.
The board, or an investment committee made up of board members, also received information
throughout the year during advisor presentations. For each advisor presentation, the board was
provided with letters and reports that included information about, among other things, the advisory
firm and the advisor’s assessment of the investment environment, portfolio performance, and
portfolio characteristics.
In addition, the board received monthly reports, which included a Market and Economic Report,
a Fund Dashboard Monthly Summary, and a Fund Performance Report.
Prior to their meeting, the trustees were provided with a memo and materials that summarized the
information they received over the course of the year. They also considered the factors discussed
below, among others. However, no single factor determined whether the board approved the
arrangement. Rather, it was the totality of the circumstances that drove the board’s decision.
Nature, extent, and quality of services
The board reviewed the quality of the fund’s investment management services over both the short
and long term and took into account the organizational depth and stability of the advisor. The board
considered that Vanguard has been managing investments for more than three decades. The Fixed
Income Group adheres to a sound, disciplined investment management process; the team has
considerable experience, stability, and depth.
The board concluded that Vanguard’s experience, stability, depth, and performance, among other
factors, warranted continuation of the advisory arrangement.
Investment performance
The board considered the short- and long-term performance of the fund, including any periods of
outperformance or underperformance compared with a relevant benchmark index and peer group.
The board concluded that the performance was such that the advisory arrangement should
continue. Information about the fund’s most recent performance can be found in the Performance
Summary section of this report.
Trustees Approve Advisory Arrangement
29
Cost
The board concluded that the fund’s expense ratio was well below the average expense ratio
charged by funds in its peer group and that the fund’s advisory expenses were also well below
the peer-group average. Information about the fund’s expenses appears in the About Your
Fund’s Expenses section of this report as well as in the Financial Statements section.
The board does not conduct a profitability analysis of Vanguard because of Vanguard’s unique
“at-cost” structure. Unlike most other mutual fund management companies, Vanguard is
owned by the funds it oversees and produces “profits” only in the form of reduced expenses
for fund shareholders.
The benefit of economies of scale
The board concluded that the fund’s at-cost arrangement with Vanguard ensures that the fund
will realize economies of scale as it grows, with the cost to shareholders declining as fund
assets increase.
The board will consider whether to renew the advisory arrangement again after a one-year period.
30
Glossary
31
30-Day SEC Yield. A fund’s 30-day SEC yield is derived using a formula specified by the U.S.
Securities and Exchange Commission. Under the formula, data related to the fund’s security
holdings in the previous 30 days are used to calculate the fund’s hypothetical net income for that
period, which is then annualized and divided by the fund’s estimated average net assets over the
calculation period. For the purposes of this calculation, a security’s income is based on its current
market yield to maturity (for bonds), its actual income (for asset-backed securities), or its
projected dividend yield (for stocks). Because the SEC yield represents hypothetical annualized
income, it will differ—at times significantly—from the fund’s actual experience. As a result, the
fund’s income distributions may be higher or lower than implied by the SEC yield.
Average Coupon. The average interest rate paid on the fixed income securities held by a fund. It
is expressed as a percentage of face value.
Average Duration. An estimate of how much the value of the fund’s bonds will fluctuate in
response to a change in “real” interest rates—meaning rates without inflation expectations built
in. Real interest rates are reflected in market yields for inflation-adjusted securities. To see how
the fund’s bond values could change, multiply the average duration by the change in real rates.
For example, if the average duration were five years, then the value of the fund’s bonds would
decline by about 5% if real interest rates rose by 1 percentage point. Conversely, if real rates fell
by a percentage point, the value of the bonds would rise about 5%.
Average Effective Maturity. The average length of time until fixed income securities held by a
fund reach maturity and are repaid, taking into consideration the possibility that the issuer may call
the bond before its maturity date. The figure reflects the proportion of fund assets represented by
each security; it also reflects any futures contracts held. In general, the longer the average
effective maturity, the more a fund’s share price will fluctuate in response to changes in market
interest rates.
Beta. A measure of the magnitude of a fund’s past share-price fluctuations in relation to the ups
and downs of a given market index. The index is assigned a beta of 1.00. Compared with a given
index, a fund with a beta of 1.20 typically would have seen its share price rise or fall by 12%
when the index rose or fell by 10%. For this report, beta is based on returns over the past 36
months for both the fund and the index. Note that a fund’s beta should be reviewed in conjunction
with its R-squared (see definition). The lower the R-squared, the less correlation there is between
the fund and the index, and the less reliable beta is as an indicator of volatility.
Credit Quality. Credit-quality ratings are measured on a scale that generally ranges from AAA
(highest) to D (lowest). U.S. Treasury, U.S. Agency, and U.S. Agency mortgage-backed securities
appear under “U.S. Government.” Credit-quality ratings are obtained from Moody’s and S&P, and
the higher rating for each issue is shown. ”Not Rated” is used to classify securities for which a
rating is not available. Not rated securities include a fund’s investment in Vanguard Market
Liquidity Fund or Vanguard Municipal Cash Management Fund, each of which invests in
high-quality money market instruments and may serve as a cash management vehicle for the
Vanguard funds, trusts, and accounts.
Expense Ratio. A fund’s total annual operating expenses expressed as a percentage of the fund’s
average net assets. The expense ratio includes management and administrative expenses, but
does not include the transaction costs of buying and selling portfolio securities.
32
Inception Date. The date on which the assets of a fund (or one of its share classes) are first
invested in accordance with the fund’s investment objective. For funds with a subscription period,
the inception date is the day after that period ends. Investment performance is measured from
the inception date.
R-Squared. A measure of how much of a fund’s past returns can be explained by the returns
from the market in general, as measured by a given index. If a fund’s total returns were precisely
synchronized with an index’s returns, its R-squared would be 1.00. If the fund’s returns bore no
relationship to the index’s returns, its R-squared would be 0. For this report, R-squared is based
on returns over the past 36 months for both the fund and the index.
Short-Term Reserves. The percentage of a fund invested in highly liquid, short-term securities
that can be readily converted to cash.
Yield to Maturity. This term generally refers to the rate of return an investor would receive if the
fixed income securities held by a fund were held to their maturity dates. For the
Inflation-Protected Securities Fund, the calculation is modified by adding in the inflation
adjustment made over the past 12 months. This change results in a figure more directly
comparable to the yield-to-maturity figures for other types of bond funds. (An unmodified yield to
maturity is used in calculating the fund’s 30-Day SEC Yield.)
Vanguard Inflation-Protected Securities Fund is not sponsored, endorsed, issued, sold or promoted by Barclays Risk
Analytics and Index Solutions Limited or any of its affiliates (“Barclays”). Barclays makes no representation or warranty,
express or implied, to the owners or purchasers of Vanguard Inflation-Protected Securities Fund or any member of the
public regarding the advisability of investing in securities generally or in Vanguard Inflation-Protected Securities Fund
particularly or the ability of the Barclays Index to track general bond market performance. Barclays has not passed on the
legality or suitability of Vanguard Inflation-Protected Securities Fund with respect to any person or entity. Barclays’ only
relationship to Vanguard and Vanguard Inflation-Protected Securities Fund is the licensing of the Barclays Index which is
determined, composed and calculated by Barclays without regard to Vanguard or Vanguard Inflation-Protected Securities
Fund or any owners or purchasers of Vanguard Inflation-Protected Securities Fund. Barclays has no obligation to take the
needs of Vanguard, Vanguard Inflation-Protected Securities Fund or the owners of Vanguard Inflation-Protected Securities
Fund into consideration in determining, composing or calculating the Barclays Index. Barclays is not responsible for and
has not participated in the determination of the timing of, prices at, or quantities of Vanguard Inflation-Protected Securities
Fund to be issued. Barclays has no obligation or liability in connection with the administration, marketing or trading of
Vanguard Inflation-Protected Securities Fund.
BARCLAYS SHALL HAVE NO LIABILITY TO THIRD PARTIES FOR THE QUALITY, ACCURACY AND/OR COMPLETENESS OF
THE INDEX OR ANY DATA INCLUDED THEREIN OR FOR INTERRUPTIONS IN THE DELIVERY OF THE INDEX. BARCLAYS
MAKES NO WARRANTY, EXPRESS OR IMPLIED, AS TO RESULTS TO BE OBTAINED BY OWNERS OF THE VANGUARD
INFLATION-PROTECTED SECURITIES FUND OR ANY OTHER PERSON OR ENTITY FROM THE USE OF THE INDEX OR
ANY DATA INCLUDED THEREIN IN CONNECTION WITH THE RIGHTS LICENSED HEREUNDER OR FOR ANY OTHER USE.
BARCLAYS RESERVES THE RIGHT TO CHANGE THE METHODS OF CALCULATION OR PUBLICATION, OR TO CEASE THE
CALCULATION OR PUBLICATION OF THE BLOOMBERG BARCLAYS U.S. TREASURY INFLATION PROTECTED SECURITIES
INDEX, AND BARCLAYS SHALL NOT BE LIABLE FOR ANY MISCALCULATION OF OR ANY INCORRECT, DELAYED OR
INTERRUPTED PUBLICATION WITH RESPECT TO THE BLOOMBERG BARCLAYS U.S. TREASURY INFLATION PROTECTED
SECURITIES INDEX. BARCLAYS MAKES NO EXPRESS OR IMPLIED WARRANTIES, AND HEREBY EXPRESSLY DISCLAIMS
ALL WARRANTIES OF MERCHANTABILITY OR FITNESS FOR A PARTICULAR PURPOSE OR USE WITH RESPECT TO THE
INDEX OR ANY DATA INCLUDED THEREIN. BARCLAYS SHALL NOT BE LIABLE FOR ANY DAMAGES, INCLUDING, WITHOUT
LIMITATION, ANY INDIRECT OR CONSEQUENTIAL DAMAGES RESULTING FROM THE USE OF THE INDEX OR ANY DATA
INCLUDED THEREIN.
© 2017 Barclays. Used with Permission.
Source: Barclays Global Family of Indices. Copyright 2017, Barclays. All rights reserved.
33
The People Who Govern Your Fund
The trustees of your mutual fund are there to see that the fund is operated and managed in your
best interests since, as a shareholder, you are a part owner of the fund. Your fund’s trustees also
serve on the board of directors of The Vanguard Group, Inc., which is owned by the Vanguard
funds and provides services to them on an at-cost basis.
A majority of Vanguard’s board members are independent, meaning that they have no affiliation
with Vanguard or the funds they oversee, apart from the sizable personal investments they have
made as private individuals. The independent board members have distinguished backgrounds
in business, academia, and public service. Each of the trustees and executive officers oversees
197 Vanguard funds.
Information for each trustee and executive officer of the fund appears below. The mailing address
of the trustees and officers is P.O. Box 876, Valley Forge, PA 19482. More information about the
trustees is in the Statement of Additional Information, which can be obtained, without charge,
by contacting Vanguard at 800-662-7447, or online at vanguard.com.
Interested Trustee1
F. William McNabb III
Born 1957. Trustee Since July 2009. Chairman of
the Board. Principal Occupation(s) During the Past
Five Years and Other Experience: Chairman of the
Board of The Vanguard Group, Inc., and of each of
the investment companies served by The Vanguard
Group, since January 2010; Director of The Vanguard
Group since 2008; Chief Executive Officer and
President of The Vanguard Group, and of each of
the investment companies served by The Vanguard
Group, since 2008; Director of Vanguard Marketing
Corporation; Managing Director of The Vanguard
Group (1995–2008).
Independent Trustees
Emerson U. Fullwood
Born 1948. Trustee Since January 2008. Principal
Occupation(s) During the Past Five Years and Other
Experience: Executive Chief Staff and Marketing
Officer for North America and Corporate Vice President
(retired 2008) of Xerox Corporation (document manage-
ment products and services); Executive in Residence
and 2009–2010 Distinguished Minett Professor at
the Rochester Institute of Technology; Lead Director
of SPX FLOW, Inc. (multi-industry manufacturing);
Director of the United Way of Rochester, the University
of Rochester Medical Center, Monroe Community
College Foundation, North Carolina A&T University,
and Roberts Wesleyan College; Trustee of the
University of Rochester.
Rajiv L. Gupta
Born 1945. Trustee Since December 2001.2 Principal
Occupation(s) During the Past Five Years and Other
Experience: Chairman and Chief Executive Officer
(retired 2009) and President (2006–2008) of Rohm
and Haas Co. (chemicals); Director of Arconic Inc.
(diversified manufacturer), HP Inc. (printer and
personal computer manufacturing), and Delphi
Automotive plc (automotive components); Senior
Advisor at New Mountain Capital.
Amy Gutmann
Born 1949. Trustee Since June 2006. Principal
Occupation(s) During the Past Five Years and Other
Experience: President of the University of Pennsylvania;
Christopher H. Browne Distinguished Professor of
Political Science, School of Arts and Sciences, and
Professor of Communication, Annenberg School for
Communication, with secondary faculty appointments
in the Department of Philosophy, School of Arts and
Sciences, and at the Graduate School of Education,
University of Pennsylvania; Trustee of the National
Constitution Center.
JoAnn Heffernan Heisen
Born 1950. Trustee Since July 1998. Principal
Occupation(s) During the Past Five Years and Other
Experience: Corporate Vice President and Member of
the Executive Committee (1997–2008), Chief Global
Diversity Officer (retired 2008), Vice President and
Chief Information Officer (1997–2006), Controller
(1995–1997), Treasurer (1991–1995), and Assistant
Treasurer (1989–1991) of Johnson & Johnson
(pharmaceuticals/medical devices/consumer
products); Director of Skytop Lodge Corporation
(hotels) and the Robert Wood Johnson Foundation;
Member of the Advisory Board of the Institute for
Women’s Leadership at Rutgers University.
F. Joseph Loughrey
Born 1949. Trustee Since October 2009. Principal
Occupation(s) During the Past Five Years and Other
Experience: President and Chief Operating Officer
(retired 2009) of Cummins Inc. (industrial machinery);
Chairman of the Board of Hillenbrand, Inc. (specialized
consumer services), Oxfam America, and the Lumina

Foundation for Education; Director of the V Foundation
for Cancer Research; Member of the Advisory Council
for the College of Arts and Letters and Chair of the
Advisory Board to the Kellogg Institute for International
Studies, both at the University of Notre Dame.
Mark Loughridge
Born 1953. Trustee Since March 2012. Principal
Occupation(s) During the Past Five Years and Other
Experience: Senior Vice President and Chief Financial
Officer (retired 2013) at IBM (information technology
services); Fiduciary Member of IBM’s Retirement
Plan Committee (2004–2013); Director of the Dow
Chemical Company; Member of the Council on
Chicago Booth.
Scott C. Malpass
Born 1962. Trustee Since March 2012. Principal
Occupation(s) During the Past Five Years and Other
Experience: Chief Investment Officer and Vice
President at the University of Notre Dame; Assistant
Professor of Finance at the Mendoza College of
Business at Notre Dame; Member of the Notre Dame
403(b) Investment Committee, the Board of Advisors
for Spruceview Capital Partners, the Board of Catholic
Investment Services, Inc. (investment advisor), and
the Board of Superintendence of the Institute for the
Works of Religion; Chairman of the Board of TIFF
Advisory Services, Inc. (investment advisor).
André F. Perold
Born 1952. Trustee Since December 2004. Principal
Occupation(s) During the Past Five Years and Other
Experience: George Gund Professor of Finance and
Banking, Emeritus at the Harvard Business School
(retired 2011); Chief Investment Officer and
Co-Managing Partner of HighVista Strategies
LLC (private investment firm); Overseer of the
Museum of Fine Arts Boston.
Peter F. Volanakis
Born 1955. Trustee Since July 2009. Principal
Occupation(s) During the Past Five Years and Other
Experience: President and Chief Operating Officer
(retired 2010) of Corning Incorporated (communications
equipment); Chairman of the Board of Trustees of
Colby-Sawyer College; Member of the Board of
Hypertherm, Inc. (industrial cutting systems,
software, and consumables).
Executive Officers
Glenn Booraem
Born 1967. Investment Stewardship Officer Since
February 2017. Principal Occupation(s) During the
Past Five Years and Other Experience: Principal of
The Vanguard Group, Inc.; Treasurer (2015–2017),
Controller (2010–2015), and Assistant Controller
(2001–2010) of each of the investment companies
served by The Vanguard Group.
Thomas J. Higgins
Born 1957. Chief Financial Officer Since September
2008. Principal Occupation(s) During the Past Five
Years and Other Experience: Principal of The Vanguard
Group, Inc.; Chief Financial Officer of each of the
investment companies served by The Vanguard
Group; Treasurer of each of the investment companies
served by The Vanguard Group (1998–2008).
Peter Mahoney
Born 1974. Controller Since May 2015. Principal
Occupation(s) During the Past Five Years and Other
Experience: Principal of The Vanguard Group, Inc.;
Controller of each of the investment companies served
by The Vanguard Group; Head of International Fund
Services at The Vanguard Group (2008–2014).
Anne E. Robinson
Born 1970. Secretary Since September 2016. Principal
Occupation(s) During the Past Five Years and Other
Experience: Managing Director of The Vanguard
Group, Inc.; General Counsel of The Vanguard Group;
Secretary of The Vanguard Group and of each of the
investment companies served by The Vanguard Group;
Director and Senior Vice President of Vanguard
Marketing Corporation; Managing Director and
General Counsel of Global Cards and Consumer
Services at Citigroup (2014–2016); Counsel at
American Express (2003–2014).
Michael Rollings
Born 1963. Treasurer Since February 2017. Principal
Occupation(s) During the Past Five Years and Other
Experience: Managing Director of The Vanguard
Group, Inc.; Treasurer of each of the investment
companies served by The Vanguard Group; Director
of Vanguard Marketing Corporation; Executive Vice
President and Chief Financial Officer of MassMutual
Financial Group (2006–2016).
Vanguard Senior Management Team
Mortimer J. Buckley James M. Norris
John James Thomas M. Rampulla
Martha G. King Glenn W. Reed
John T. Marcante Karin A. Risi
Chris D. McIsaac
Chairman Emeritus and Senior Advisor
John J. Brennan
Chairman, 1996–2009
Chief Executive Officer and President, 1996–2008
Founder
John C. Bogle
Chairman and Chief Executive Officer, 1974–1996
1 Mr. McNabb is considered an “interested person,” as defined in the Investment Company Act of 1940, because he is an officer of the Vanguard funds.
2 December 2002 for Vanguard Equity Income Fund, the Vanguard Municipal Bond Funds, and the Vanguard State Tax-Exempt Funds.
P.O. Box 2600
Valley Forge, PA 19482-2600
Connect with Vanguard® > vanguard.com
Fund Information > 800-662-7447
Direct Investor Account Services > 800-662-2739
Institutional Investor Services > 800-523-1036
Text Telephone for PeopleWho Are Deaf or Hard of Hearing > 800-749-7273
This material may be used in conjunctionwith the offering of shares of any Vanguardfund only if preceded or accompanied bythe fund’s current prospectus.
All comparative mutual fund data are from Lipper, aThomson Reuters Company, or Morningstar, Inc., unlessotherwise noted.
You can obtain a free copy of Vanguard’s proxy votingguidelines by visiting vanguard.com/proxyreporting or bycalling Vanguard at 800-662-2739. The guidelines arealso available from the SEC’s website, sec.gov. Inaddition, you may obtain a free report on how your fundvoted the proxies for securities it owned during the 12months ended June 30. To get the report, visit eithervanguard.com/proxyreporting or sec.gov.
You can review and copy information about your fund atthe SEC’s Public Reference Room in Washington, D.C. Tofind out more about this public service, call the SEC at202-551-8090. Information about your fund is alsoavailable on the SEC’s website, and you can receivecopies of this information, for a fee, by sending arequest in either of two ways: via email addressed [email protected] or via regular mail addressed to thePublic Reference Section, Securities and ExchangeCommission, Washington, DC 20549-1520.
© 2017 The Vanguard Group, Inc.All rights reserved.Vanguard Marketing Corporation, Distributor.
Q1192 082017