vanguard international growth fundpersonal.vanguard.com/funds/reports/q812.pdf · see the inside...
TRANSCRIPT

See the inside front cover for important information about accessto your fund’s annual and semiannual shareholder reports.
Semiannual Report | February 28, 2019
Vanguard International Growth Fund

Contents
Important information about access to shareholder reports
Beginning on January 1, 2021, as permitted by regulations adopted by theSecurities and Exchange Commission, paper copies of your fund’s annual andsemiannual shareholder reports will no longer be sent to you by mail, unless youspecifically request them. Instead, you will be notified by mail each time a reportis posted on the website and will be provided with a link to access the report.
If you have already elected to receive shareholder reports electronically, you will notbe affected by this change and do not need to take any action. You may elect toreceive shareholder reports and other communications from the fund electronicallyby contacting your financial intermediary (such as a broker-dealer or bank) or, if youinvest directly with the fund, by calling Vanguard at one of the phone numbers onthe back cover of this report or by logging on to vanguard.com.
You may elect to receive paper copies of all future shareholder reports freeof charge. If you invest through a financial intermediary, you can contact theintermediary to request that you continue to receive paper copies. If you investdirectly with the fund, you can call Vanguard at one of the phone numbers on theback cover of this report or log on to vanguard.com. Your election to receive papercopies will apply to all the funds you hold through an intermediary or directly withVanguard.
About Your Fund’s Expenses. . . . . . . . . . . . . . . . . . . . . . . . . 1
Financial Statements. . . . . . . . . . . . . . . . . . . . . . . . . . . . . . . 4
Trustees Approve Advisory Arrangements. . . . . . . . . . . . . .22

About Your Fund’s Expenses
1
As a shareholder of the fund, you incur ongoing costs, which include costs for portfolio management, administrative services, and shareholder reports (like this one), among others. Operating expenses, which are deducted from a fund’s gross income, directly reduce the investment return of the fund.
A fund’s expenses are expressed as a percentage of its average net assets. This figure is known as the expense ratio. The following examples are intended to help you understand the ongoing costs (in dollars) of investing in your fund and to compare these costs with those of other mutual funds. The examples are based on an investment of $1,000 made at the beginning of the period shown and held for the entire period.
The accompanying table illustrates your fund’s costs in two ways:
• Based on actual fund return. This section helps you to estimate the actual expenses that you paid over the period. The ”Ending Account Value“ shown is derived from the fund‘s actual return, and the third column shows the dollar amount that would have been paid by an investor who started with $1,000 in the fund. You may use the information here, together with the amount you invested, to estimate the expenses that you paid over the period.
To do so, simply divide your account value by $1,000 (for example, an $8,600 account value divided by $1,000 = 8.6), then multiply the result by the number given for your fund under the heading ”Expenses Paid During Period.“
• Based on hypothetical 5% yearly return. This section is intended to help you compare your fund‘s costs with those of other mutual funds. It assumes that the fund had a yearly return of 5% before expenses, but that the expense ratio is unchanged. In this case—because the return used is not the fund’s actual return—the results do not apply to your investment. The example is useful in making comparisons because the Securities and Exchange Commission requires all mutual funds to calculate expenses based on a 5% return. You can assess your fund’s costs by comparing this hypothetical example with the hypothetical examples that appear in shareholder reports of other funds.
Note that the expenses shown in the table are meant to highlight and help you compare ongoing costs only and do not reflect transaction costs incurred by the fund for buying and sellingsecurities. Further, the expenses do not include any purchase, redemption, or account servicefees described in the fund prospectus. If such fees were applied to your account, your costswould be higher. Your fund does not carry a “sales load.”
The calculations assume no shares were bought or sold during the period. Your actual costs mayhave been higher or lower, depending on the amount of your investment and the timing of anypurchases or redemptions.
You can find more information about the fund’s expenses, including annual expense ratios, in theFinancial Statements section of this report. For additional information on operating expenses andother shareholder costs, please refer to your fund’s current prospectus.
2
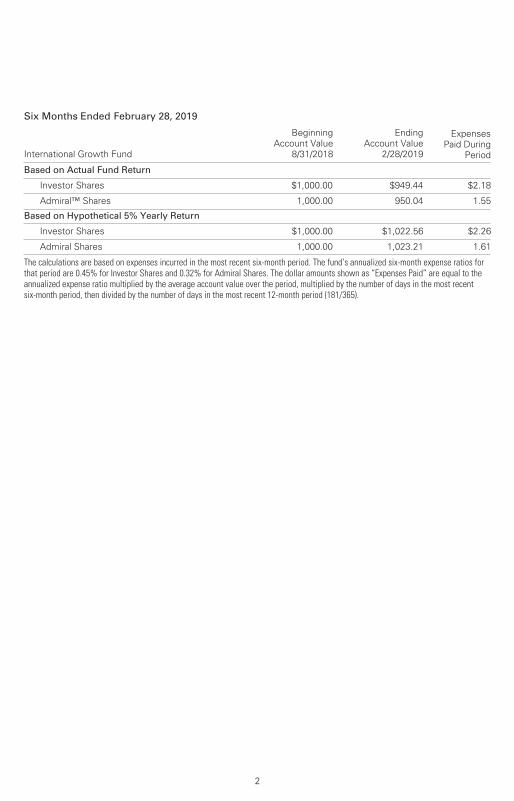
Six Months Ended February 28, 2019
International Growth Fund
BeginningAccount Value
8/31/2018
EndingAccount Value
2/28/2019
ExpensesPaid During
Period
Based on Actual Fund Return
Investor Shares $1,000.00 $949.44 $2.18
Admiral™ Shares 1,000.00 950.04 1.55
Based on Hypothetical 5% Yearly Return
Investor Shares $1,000.00 $1,022.56 $2.26
Admiral Shares 1,000.00 1,023.21 1.61
The calculations are based on expenses incurred in the most recent six-month period. The fund’s annualized six-month expense ratios forthat period are 0.45% for Investor Shares and 0.32% for Admiral Shares. The dollar amounts shown as “Expenses Paid” are equal to theannualized expense ratio multiplied by the average account value over the period, multiplied by the number of days in the most recentsix-month period, then divided by the number of days in the most recent 12-month period (181/365).

Sector DiversificationAs of February 28, 2019
International Growth Fund
3
Communication Services 12.7%
Consumer Discretionary 32.0
Consumer Staples 6.0
Energy 1.5
Financials 15.0
Health Care 10.1
Industrials 9.7
Information Technology 8.1
Materials 4.1
Other 0.8
The table reflects the fund’s equity exposure, based on its invest-ments in stocks and stock index futures. Any holdings in short-termreserves are excluded. Sector categories are based on the GlobalIndustry Classification Standard (“GICS”), except for the “Other”category (if applicable), which includes securities that have notbeen provided a GICS classification as of the effective reportingperiod.
The Global Industry Classification Standard (“GICS”) was developed by and is the exclusive property and a service mark of MSCI Inc. (“MSCI”) and Standard and Poor’s, a division of McGraw-Hill Companies, Inc. (“S&P”), and is licensed for use by Vanguard. Neither MSCI, S&P nor any third party involved in making or compiling the GICS or any GICS classification makes any express or implied warranties or representations with respect to such standard or classification (or the results to be obtained by the use thereof), and all such parties hereby expressly disclaim all warranties of originality, accuracy, completeness, merchantability or fitness for a particular purpose with respect to any such standard or classification. Without limiting any of the foregoing, in no event shall MSCI, S&P, any of its affiliates or any third party involved in making or compiling the GICS or any GICS classification have any liability for any direct, indirect, special, punitive,consequential or any other damages (including lost profits) even if notified of the possibility of such damages.

Market
Value•
Shares ($000)
Market
Value•
Shares ($000)
Common Stocks (98.3%)1
Australia (0.5%)
Brambles Ltd. 20,161,054 168,301
Austria (0.4%)
Erste Group Bank AG 3,447,596 130,019
Belgium (1.1%)
Umicore SA 8,779,863 379,060
Brazil (0.8%)
B3 SA - Brasil Bolsa
Balcao 13,303,825 116,138
Raia Drogasil SA 4,999,559 87,063
Telefonica Brasil SA
Preference Shares 5,582,011 69,535
272,736
Canada (1.1%)
Nutrien Ltd. 3,575,914 194,645
Toronto-Dominion Bank 3,057,005 175,296
369,941
China (18.9%) * Alibaba Group Holding
Ltd. ADR 10,636,558 1,946,809
Tencent Holdings Ltd. 41,822,300 1,790,967* Baidu Inc. ADR 4,633,984 753,208* TAL Education Group
ADR 18,485,132 658,071
Ping An Insurance
Group Co. of China
Ltd. 37,534,500 396,790* Ctrip.com International
Ltd. ADR 9,001,376 307,217*,^ NIO Inc. ADR 17,591,617 168,352*,^ iQIYI Inc. ADR 5,046,134 137,053*,2 Meituan Dianping 18,638,108 130,138
China Pacific Insurance
Group Co. Ltd. 33,827,200 127,275
*,^ Meituan Dianping
Class B 13,982,022 108,423
China Mengniu Dairy
Co. Ltd. 32,708,000 101,008
6,625,311
Denmark (2.9%) * Genmab A/S 2,594,661 447,800
Vestas Wind Systems
A/S 2,043,797 170,277
Chr Hansen Holding
A/S 1,658,818 168,842
Ambu A/S Class B 5,449,774 127,628
Novozymes A/S 2,401,809 109,065
1,023,612
France (7.0%)
Kering SA 1,368,726 746,737
L’Oreal SA 2,310,130 582,644
Schneider Electric SE 5,076,412 394,471
TOTAL SA 5,193,328 295,601
EssilorLuxottica SA 2,005,073 242,666
Vivendi SA 7,164,431 209,220
2,471,339
Germany (5.9%) *,^,3 Zalando SE 10,466,867 386,067
Bayerische Motoren
Werke AG 3,268,453 276,287*,3 Delivery Hero SE 6,275,610 243,348
Infineon Technologies
AG 8,669,188 190,527
adidas AG 716,713 173,983
BASF SE 2,275,881 173,236
Continental AG 815,675 133,597
SAP SE 1,238,958 132,603*,^,4 HelloFresh SE 10,552,945 114,968
GEA Group AG 3,320,563 79,431* MorphoSys AG 664,989 68,341*,3 Rocket Internet SE 2,762,933 64,982* AIXTRON SE 3,130,112 27,981*,4 Home24 SE 1,862,256 15,351
2,080,702
Financial Statements (unaudited)
Statement of Net AssetsAs of February 28, 2019
The fund reports a complete list of its holdings in regulatory filings four times in each fiscal year, at
the quarter-ends. For the second and fourth fiscal quarters, the lists appear in the fund’s semiannual
and annual reports to shareholders. For the first and third fiscal quarters, the fund files the lists with
the Securities and Exchange Commission on Form N-Q. Shareholders can look up the fund’s Forms
N-Q on the SEC’s website at sec.gov.
International Growth Fund
4

International Growth Fund
Market
Value•
Shares ($000)
Market
Value•
Shares ($000)
Hong Kong (4.7%)
AIA Group Ltd. 127,277,600 1,270,273
Jardine Matheson
Holdings Ltd. 3,099,000 212,243
Hong Kong Exchanges
& Clearing Ltd. 4,767,930 164,347
1,646,863
India (2.2%)
Housing Development
Finance Corp. Ltd. 11,680,736 302,612
HDFC Bank Ltd. 7,780,817 227,806
Zee Entertainment
Enterprises Ltd. 27,208,888 178,576*,§,2 ANI Technologies 166,185 49,650
758,644
Indonesia (0.4%)
Bank Central Asia
Tbk PT 64,782,900 126,760
Israel (0.3%) * Check Point Software
Technologies Ltd. 978,890 119,718
Italy (2.3%)
Ferrari NV 4,745,012 610,512* Fiat Chrysler
Automobiles NV 13,737,294 203,011
813,523
Japan (11.0%)
SoftBank Group Corp. 6,053,300 561,712
SMC Corp. 1,548,600 541,735
M3 Inc. 26,545,800 439,118
Nidec Corp. 2,080,800 252,360
Bridgestone Corp. 6,324,500 250,523
Recruit Holdings Co.
Ltd. 8,709,100 244,161
Nintendo Co. Ltd. 713,800 195,752
Takeda Pharmaceutical
Co. Ltd. 4,689,100 188,703
Keyence Corp. 285,200 166,775
Sekisui Chemical Co.
Ltd. 9,761,500 153,571
Pigeon Corp. 3,300,800 134,768
Kubota Corp. 9,695,100 130,759
Toyota Motor Corp. 2,137,700 129,178
Murata Manufacturing
Co. Ltd. 728,600 113,651
ORIX Corp. 6,873,900 99,524
Suzuki Motor Corp. 1,855,100 95,258
SBI Holdings Inc. 4,470,400 94,528
KDDI Corp. 2,856,800 69,048
3,861,124
Netherlands (3.8%)
ASML Holding NV 7,358,719 1,346,194
Norway (0.8%)
DNB ASA 7,488,359 143,431
Norsk Hydro ASA 30,534,386 126,025
269,456
Other (0.2%) 5 Vanguard FTSE
All-World ex-US ETF 1,128,434 56,230
Singapore (0.4%)
Oversea-Chinese
Banking Corp. Ltd. 18,606,300 151,799
South Korea (2.0%) *,^ Celltrion Inc. 1,695,817 307,636
Samsung Electronics
Co. Ltd. 5,161,446 206,570
Samsung SDI Co. Ltd. 546,742 115,256
NAVER Corp. 539,978 63,800
693,262
Spain (3.2%)
Industria de Diseno
Textil SA 21,245,632 641,331
Banco Bilbao Vizcaya
Argentaria SA 79,161,502 491,032^ Distribuidora
Internacional de
Alimentacion SA 12,745,795 8,267
1,140,630
Sweden (4.7%)
Svenska Handelsbanken
AB Class A 35,069,697 399,529
Spotify Technology SA 2,632,668 368,942* Atlas Copco AB
Class A 10,589,929 287,018
Kinnevik AB 10,340,628 261,685
Assa Abloy AB Class B 7,041,057 145,526
SKF AB 6,883,760 115,615^ Elekta AB Class B 6,427,670 74,042
1,652,357
Switzerland (4.4%)
Nestle SA 5,177,491 468,325
Roche Holding AG 1,241,279 344,485
Novartis AG 2,570,314 234,243
UBS Group AG 14,683,126 186,327
Cie Financiere
Richemont SA 2,255,223 172,302
Lonza Group AG 560,478 155,651
1,561,333
5

International Growth Fund
Market
Value•
Shares ($000)
Market
Value•
Shares ($000)
Taiwan (1.1%)
Taiwan Semiconductor
Manufacturing
Co. Ltd. 49,227,000 377,754
Thailand (0.4%)
Kasikornbank PCL
(Foreign) 21,738,556 136,528
Turkey (0.2%)
Turkiye Garanti
Bankasi AS 38,670,212 64,409
United Kingdom (7.6%)
Rolls-Royce Holdings
plc 46,651,516 591,812
Diageo plc 9,856,147 381,676* Ocado Group plc 20,473,468 280,818
BHP Group plc 11,327,846 262,767
Royal Dutch Shell plc
Class A 6,506,874 202,736
Reckitt Benckiser
Group plc 2,343,204 178,963
Burberry Group plc 6,684,815 167,601
GlaxoSmithKline plc 6,811,239 135,754
Whitbread plc 1,986,669 127,919
Aviva plc 21,602,972 121,098
Smith & Nephew plc 5,870,828 111,551*,^,3 Aston Martin Lagonda
Global Holdings plc 6,321,596 90,271
2,652,966
United States (10.0%) * Amazon.com Inc. 669,737 1,098,255* Booking Holdings Inc. 72,687 123,353* Illumina Inc. 2,734,956 855,412* MercadoLibre Inc. 1,574,407 722,322
Philip Morris
International Inc. 1,365,456 118,713*,^ Tesla Inc. 1,894,281 605,942
3,523,997
Total Common Stocks
(Cost $24,754,888) 34,474,568
Preferred Stocks (0.2%)
*,§,2,6 CureVac GmbH 12,600 30,597*,§,2,4,6 You & Mr. Jones 44,800,000 51,520
Total Preferred Stocks
(Cost $75,682) 82,117
Temporary Cash Investments (4.1%)1
Money Market Fund (4.0%)7,8 Vanguard Market
Liquidity Fund,
2.563% 14,167,701 1,416,912
Face
Amount
($000)
U.S. Government and Agency Obligations (0.1%) 9 United States Treasury
Bill, 2.374%, 3/7/19 12,000 11,9959 United States Treasury
Bill, 2.388%, 3/28/19 3,000 2,9959 United States Treasury
Bill, 2.439%, 4/11/19 8,500 8,4779 United States Treasury
Bill, 2.497%, 5/23/19 8,000 7,956
31,423
Total Temporary Cash Investments
(Cost $1,448,158) 1,448,335
Total Investments (102.6%)
(Cost $26,278,728) 36,005,020
6

7
International Growth Fund
Amount ($000)
Amount ($000)
Other Assets and Liabilities (-2.6%)
Other Assets
Investment in Vanguard 1,739Receivables for Accrued Income 48,078Receivables for Capital Shares Issued 21,364Variation Margin Receivable —
Futures Contracts 1,520Unrealized Appreciation —
Forward Currency Contracts 10,348Other Assets10 27,034
Total Other Assets 110,083
Liabilities
Payables for Investment Securities Purchased (792)
Collateral for Securities on Loan (949,354)Payables for Capital Shares Redeemed (19,181)Payables to Investment Advisor (14,180)Payables to Vanguard (31,179)Variation Margin Payable —
Futures Contracts (2,009)Unrealized Depreciation —
Forward Currency Contracts (6,332)
Total Liabilities (1,023,027)
Net Assets (100%) 35,092,076
At February 28, 2019, net assets consisted of:
Amount ($000)
Paid-in Capital 25,504,938Total Distributable Earnings (Loss) 9,587,138
Net Assets 35,092,076
Investor Shares—Net Assets
Applicable to 255,401,055 outstanding
$.001 par value shares of beneficial
interest (unlimited authorization) 7,192,607
Net Asset Value Per Share—
Investor Shares $28.16
Admiral Shares—Net Assets
Applicable to 311,439,108 outstanding
$.001 par value shares of beneficial
interest (unlimited authorization) 27,899,469
Net Asset Value Per Share—
Admiral Shares $89.58
• See Note A in Notes to Financial Statements.
* Non-income-producing security.
^ Includes partial security positions on loan to broker-dealers. The total value of securities on loan is $908,507,000.
§ Security value determined using significant unobservable inputs.
1 The fund invests a portion of its cash reserves in equity markets through the use of index futures contracts. After giving effect to futures investments, the fund’s effective common stock and temporary cash investment positions represent 99.4% and 3.0%, respectively, of net assets.
2 Restricted securities totaling $261,905,000, representing 0.7% of net assets. See Restricted Securities table for additional information.
3 Security exempt from registration under Rule 144A of the Securities Act of 1933. Such securities may be sold in transactions exempt from registration, normally to qualified institutional buyers. At February 28, 2019, the aggregate value of these securities was $784,668,000, representing 2.2% of net assets.
4 Considered an affiliated company of the fund as the fund owns more than 5% of the outstanding voting securities of such company.
5 Considered an affiliated company of the fund as the issuer is another member of The Vanguard Group.
6 Perpetual security with no stated maturity date.
7 Affiliated money market fund available only to Vanguard funds and certain trusts and accounts managed by Vanguard. Rate shown is the 7-day yield.
8 Includes $949,354,000 of collateral received for securities on loan.
9 Securities with a value of $19,881,000 have been segregated as initial margin for open futures contracts.
10 Cash of $1,420,000 has been segregated as collateral for open forward currency contracts.
ADR—American Depositary Receipt.

International Growth Fund
Restricted Securities as of Period End
Acquisition Acquisition Cost Security Name Date ($000)
You & Mr. Jones September 2015 44,800
CureVac GmbH October 2015 30,882
ANI Technologies December 2015 51,748
Meituan Dianping December 2015 71,956
Derivative Financial Instruments Outstanding as of Period End
Futures Contracts
($000)
Value and Number of Unrealized Long (Short) Notional Appreciation Expiration Contracts Amount (Depreciation)
Long Futures Contracts
Dow Jones EURO STOXX 50 Index March 2019 3,656 137,149 7,350
Topix Index March 2019 750 108,061 5,397
FTSE 100 Index March 2019 725 68,039 1,368
S&P ASX 200 Index March 2019 622 67,826 4,130
18,245
Forward Currency Contracts
Contract Unrealized Unrealized Settlement Contract Amount (000) Appreciation (Depreciation)Counterparty Date Receive Deliver ($000) ($000)
BNP Paribas 3/20/19 EUR 116,235 USD 133,151 — (707)
UBS AG 3/12/19 JPY 8,900,280 USD 80,467 — (540)
Morgan Stanley Capital Services LLC 3/12/19 JPY 6,882,143 USD 61,223 581 —
Citibank, N.A. 3/26/19 AUD 85,914 USD 60,630 340 —
Morgan Stanley Capital Services LLC 3/20/19 GBP 38,286 USD 48,597 2,239 —
Citibank, N.A. 3/26/19 AUD 61,391 USD 43,804 — (237)
Barclays Bank plc 3/20/19 GBP 32,460 USD 41,470 1,630 —
Citibank, N.A. 3/12/19 JPY 4,388,340 USD 39,861 — (452)
JPMorgan Chase Bank, N.A. 3/12/19 JPY 3,824,850 USD 34,233 116 —
BNP Paribas 3/12/19 JPY 3,602,310 USD 32,597 — (247)
Citibank, N.A. 3/20/19 EUR 24,252 USD 27,649 — (15)
Morgan Stanley Capital Services LLC 3/20/19 EUR 18,752 USD 21,653 — (286)
8
International Growth Fund
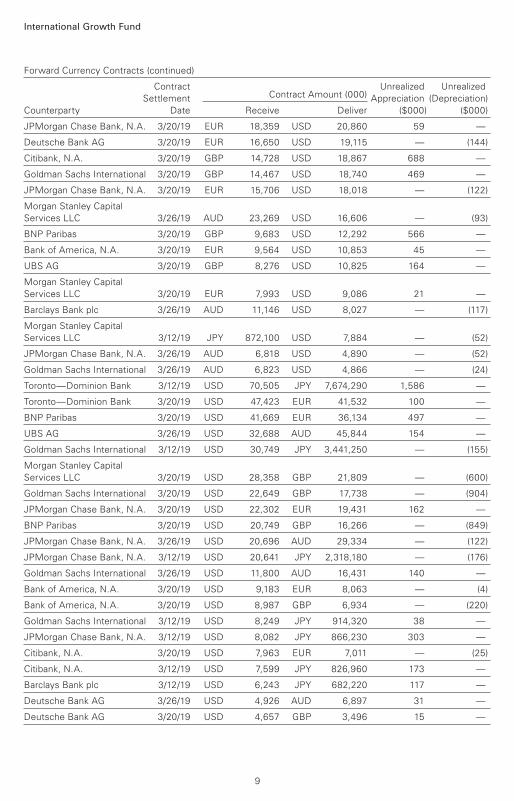
Forward Currency Contracts (continued)
Contract Unrealized Unrealized
Settlement Contract Amount (000) Appreciation (Depreciation)
Counterparty Date Receive Deliver ($000) ($000)
JPMorgan Chase Bank, N.A. 3/20/19 EUR 18,359 USD 20,860 59 —
Deutsche Bank AG 3/20/19 EUR 16,650 USD 19,115 — (144)
Citibank, N.A. 3/20/19 GBP 14,728 USD 18,867 688 —
Goldman Sachs International 3/20/19 GBP 14,467 USD 18,740 469 —
JPMorgan Chase Bank, N.A. 3/20/19 EUR 15,706 USD 18,018 — (122)
Morgan Stanley Capital
Services LLC 3/26/19 AUD 23,269 USD 16,606 — (93)
BNP Paribas 3/20/19 GBP 9,683 USD 12,292 566 —
Bank of America, N.A. 3/20/19 EUR 9,564 USD 10,853 45 —
UBS AG 3/20/19 GBP 8,276 USD 10,825 164 —
Morgan Stanley Capital
Services LLC 3/20/19 EUR 7,993 USD 9,086 21 —
Barclays Bank plc 3/26/19 AUD 11,146 USD 8,027 — (117)
Morgan Stanley Capital
Services LLC 3/12/19 JPY 872,100 USD 7,884 — (52)
JPMorgan Chase Bank, N.A. 3/26/19 AUD 6,818 USD 4,890 — (52)
Goldman Sachs International 3/26/19 AUD 6,823 USD 4,866 — (24)
Toronto—Dominion Bank 3/12/19 USD 70,505 JPY 7,674,290 1,586 —
Toronto—Dominion Bank 3/20/19 USD 47,423 EUR 41,532 100 —
BNP Paribas 3/20/19 USD 41,669 EUR 36,134 497 —
UBS AG 3/26/19 USD 32,688 AUD 45,844 154 —
Goldman Sachs International 3/12/19 USD 30,749 JPY 3,441,250 — (155)
Morgan Stanley Capital
Services LLC 3/20/19 USD 28,358 GBP 21,809 — (600)
Goldman Sachs International 3/20/19 USD 22,649 GBP 17,738 — (904)
JPMorgan Chase Bank, N.A. 3/20/19 USD 22,302 EUR 19,431 162 —
BNP Paribas 3/20/19 USD 20,749 GBP 16,266 — (849)
JPMorgan Chase Bank, N.A. 3/26/19 USD 20,696 AUD 29,334 — (122)
JPMorgan Chase Bank, N.A. 3/12/19 USD 20,641 JPY 2,318,180 — (176)
Goldman Sachs International 3/26/19 USD 11,800 AUD 16,431 140 —
Bank of America, N.A. 3/20/19 USD 9,183 EUR 8,063 — (4)
Bank of America, N.A. 3/20/19 USD 8,987 GBP 6,934 — (220)
Goldman Sachs International 3/12/19 USD 8,249 JPY 914,320 38 —
JPMorgan Chase Bank, N.A. 3/12/19 USD 8,082 JPY 866,230 303 —
Citibank, N.A. 3/20/19 USD 7,963 EUR 7,011 — (25)
Citibank, N.A. 3/12/19 USD 7,599 JPY 826,960 173 —
Barclays Bank plc 3/12/19 USD 6,243 JPY 682,220 117 —
Deutsche Bank AG 3/26/19 USD 4,926 AUD 6,897 31 —
Deutsche Bank AG 3/20/19 USD 4,657 GBP 3,496 15 —
9

International Growth Fund
Forward Currency Contracts (continued)
Contract Unrealized Unrealized Settlement Contract Amount (000) Appreciation (Depreciation)Counterparty Date Receive Deliver ($000) ($000)
BNP Paribas 3/12/19 USD 4,602 JPY 517,770 — (48)
Citibank, N.A. 3/20/19 USD 4,015 EUR 3,494 33 —
Citibank, N.A. 3/26/19 USD 3,709 AUD 5,227 — (1)
Citibank, N.A. 3/20/19 USD 3,185 GBP 2,504 — (140)
Citibank, N.A. 3/26/19 USD 3,039 AUD 4,241 29 —
BNP Paribas 3/26/19 USD 2,112 AUD 2,902 52 —
10,348 (6,332)
AUD—Australian dollar.
EUR—euro.
GBP—British pound.
JPY—Japanese yen.
USD—U.S. dollar.
At February 28, 2019, the counterparties had deposited in segregated accounts securities and cash with a value of $6,759,000 in connection with open forward currency contracts.
See accompanying Notes, which are an integral part of the Financial Statements.
10

Six Months Ended
February 28, 2019
($000)
Investment Income
Income
Dividends—Unaffiliated Issuers1 120,622
Dividends—Affiliated Issuers 812
Interest—Unaffiliated Issuers 344
Interest—Affiliated Issuers 5,254
Securities Lending—Net 13,562
Total Income 140,594
Expenses
Investment Advisory Fees—Note B
Basic Fee 23,871
Performance Adjustment 5,048
The Vanguard Group—Note C
Management and Administrative—Investor Shares 9,002
Management and Administrative—Admiral Shares 17,726
Marketing and Distribution—Investor Shares 497
Marketing and Distribution—Admiral Shares 824
Custodian Fees 1,318
Shareholders’ Reports—Investor Shares 89
Shareholders’ Reports—Admiral Shares 93
Trustees’ Fees and Expenses 19
Total Expenses 58,487
Net Investment Income 82,107
Realized Net Gain (Loss)
Investment Securities Sold—Unaffiliated Issuers 80,599
Investment Securities Sold—Affiliated Issuers 130
Futures Contracts (22,480)
Forward Currency Contracts (17,549)
Foreign Currencies 387
Realized Net Gain (Loss) 41,087
Change in Unrealized Appreciation (Depreciation)
Investment Securities—Unaffiliated Issuers (1,979,532)
Investment Securities—Affiliated Issuers (71,051)
Futures Contracts 19,122
Forward Currency Contracts 13,274
Foreign Currencies (981)
Change in Unrealized Appreciation (Depreciation) (2,019,168)
Net Increase (Decrease) in Net Assets Resulting from Operations (1,895,974)
1 Dividends are net of foreign withholding taxes of $15,202,000.
Statement of Operations
International Growth Fund
See accompanying Notes, which are an integral part of the Financial Statements.
11

Statement of Changes in Net Assets
International Growth Fund
See accompanying Notes, which are an integral part of the Financial Statements.
Six Months Ended Year Ended
February 28, August 31,
2019 2018
($000) ($000)
Increase (Decrease) in Net Assets
Operations
Net Investment Income 82,107 485,445
Realized Net Gain (Loss) 41,087 1,574,400
Change in Unrealized Appreciation (Depreciation) (2,019,168) 1,400,252
Net Increase (Decrease) in Net Assets Resulting from Operations (1,895,974) 3,460,097
Distributions
Net Investment Income
Investor Shares (101,822) (66,639)
Admiral Shares (414,446) (217,469)
Realized Capital Gain1
Investor Shares (234,310) —
Admiral Shares (863,521) —
Total Distributions (1,614,099) (284,108)
Capital Share Transactions
Investor Shares (108,118) (426,156)
Admiral Shares 1,466,505 3,661,907
Net Increase (Decrease) from Capital Share Transactions 1,358,387 3,235,751
Total Increase (Decrease) (2,151,686) 6,411,740
Net Assets
Beginning of Period 37,243,762 30,832,022
End of Period 35,092,076 37,243,762
1 Includes fiscal 2019 and 2018 short-term gain distributions totaling $14,439,000 and $0, respectively. Short-term gain distributions are treated as ordinary income dividends for tax purposes.
12
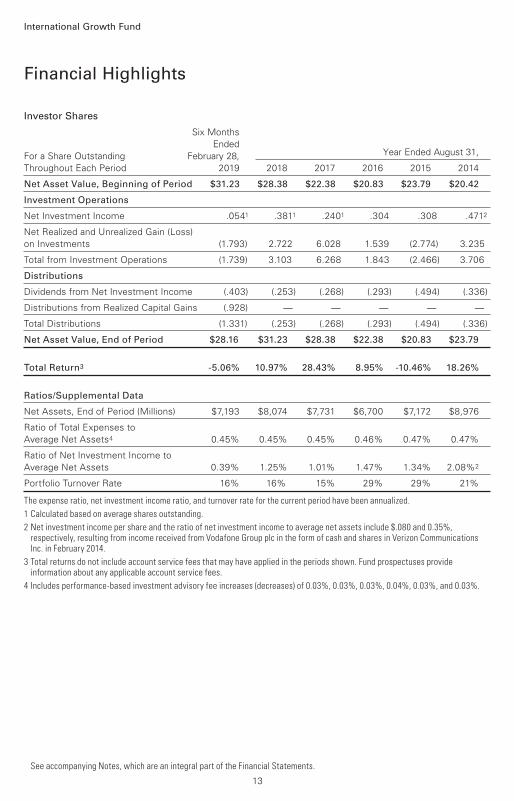
Investor Shares
Six Months
Ended
For a Share Outstanding February 28, Year Ended August 31,
Throughout Each Period 2019 2018 2017 2016 2015 2014
Net Asset Value, Beginning of Period $31.23 $28.38 $22.38 $20.83 $23.79 $20.42
Investment Operations
Net Investment Income .0541 .3811 .2401 .304 .308 .4712
Net Realized and Unrealized Gain (Loss)
on Investments (1.793) 2.722 6.028 1.539 (2.774) 3.235
Total from Investment Operations (1.739) 3.103 6.268 1.843 (2.466) 3.706
Distributions
Dividends from Net Investment Income (.403) (.253) (.268) (.293) (.494) (.336)
Distributions from Realized Capital Gains (.928) — — — — —
Total Distributions (1.331) (.253) (.268) (.293) (.494) (.336)
Net Asset Value, End of Period $28.16 $31.23 $28.38 $22.38 $20.83 $23.79
Total Return3 -5.06% 10.97% 28.43% 8.95% -10.46% 18.26%
Ratios/Supplemental Data
Net Assets, End of Period (Millions) $7,193 $8,074 $7,731 $6,700 $7,172 $8,976
Ratio of Total Expenses to
Average Net Assets4 0.45% 0.45% 0.45% 0.46% 0.47% 0.47%
Ratio of Net Investment Income to
Average Net Assets 0.39% 1.25% 1.01% 1.47% 1.34% 2.08%2
Portfolio Turnover Rate 16% 16% 15% 29% 29% 21%
The expense ratio, net investment income ratio, and turnover rate for the current period have been annualized.
1 Calculated based on average shares outstanding.
2 Net investment income per share and the ratio of net investment income to average net assets include $.080 and 0.35%, respectively, resulting from income received from Vodafone Group plc in the form of cash and shares in Verizon Communications Inc. in February 2014.
3 Total returns do not include account service fees that may have applied in the periods shown. Fund prospectuses provide information about any applicable account service fees.
4 Includes performance-based investment advisory fee increases (decreases) of 0.03%, 0.03%, 0.03%, 0.04%, 0.03%, and 0.03%.
Financial Highlights
See accompanying Notes, which are an integral part of the Financial Statements.
International Growth Fund
13

Admiral Shares
Six Months
Ended
For a Share Outstanding February 28, Year Ended August 31,
Throughout Each Period 2019 2018 2017 2016 2015 2014
Net Asset Value, Beginning of Period $99.45 $90.24 $71.19 $66.28 $75.70 $64.98
Investment Operations
Net Investment Income .2271 1.3651 .8791 1.062 1.088 1.6132
Net Realized and Unrealized Gain (Loss)
on Investments (5.724) 8.652 19.127 4.877 (8.821) 10.277
Total from Investment Operations (5.497) 10.017 20.006 5.939 (7.733) 11.890
Distributions
Dividends from Net Investment Income (1.418) (.807) (.956) (1.029) (1.687) (1.170)
Distributions from Realized Capital Gains (2.955) — — — — —
Total Distributions (4.373) (.807) (.956) (1.029) (1.687) (1.170)
Net Asset Value, End of Period $89.58 $99.45 $90.24 $71.19 $66.28 $75.70
Total Return3 -5.00% 11.14% 28.57% 9.07% -10.32% 18.42%
Ratios/Supplemental Data
Net Assets, End of Period (Millions) $27,899 $29,170 $23,101 $15,704 $13,752 $14,415
Ratio of Total Expenses to
Average Net Assets4 0.32% 0.32% 0.32% 0.33% 0.34% 0.34%
Ratio of Net Investment Income to
Average Net Assets 0.52% 1.38% 1.14% 1.60% 1.47% 2.21%2
Portfolio Turnover Rate 16% 16% 15% 29% 29% 21%
The expense ratio, net investment income ratio, and turnover rate for the current period have been annualized.
1 Calculated based on average shares outstanding.
2 Net investment income per share and the ratio of net investment income to average net assets include $.255 and 0.35%, respectively, resulting from income received from Vodafone Group plc in the form of cash and shares in Verizon Communications Inc. in February 2014.
3 Total returns do not include account service fees that may have applied in the periods shown. Fund prospectuses provide information about any applicable account service fees.
4 Includes performance-based investment advisory fee increases (decreases) of 0.03%, 0.03%, 0.03%, 0.04%, 0.03%, and 0.03%.
Financial Highlights
See accompanying Notes, which are an integral part of the Financial Statements.
International Growth Fund
14

Notes to Financial Statements
International Growth Fund
Vanguard International Growth Fund is registered under the Investment Company Act of 1940 as
an open-end investment company, or mutual fund. The fund invests in securities of foreign issuers,
which may subject it to investment risks not normally associated with investing in securities of U.S.
corporations. The fund offers two classes of shares: Investor Shares and Admiral Shares. Each of
the share classes has different eligibility and minimum purchase requirements, and is designed for
different types of investors.
A. The following significant accounting policies conform to generally accepted accounting principles
for U.S. investment companies. The fund consistently follows such policies in preparing its financial
statements.
1. Security Valuation: Securities are valued as of the close of trading on the New York Stock Exchange
(generally 4 p.m., Eastern time) on the valuation date. Equity securities are valued at the latest quoted
sales prices or official closing prices taken from the primary market in which each security trades;
such securities not traded on the valuation date are valued at the mean of the latest quoted bid and
asked prices. Securities for which market quotations are not readily available, or whose values have
been affected by events occurring before the fund’s pricing time but after the close of the securities’
primary markets, are valued at their fair values calculated according to procedures adopted by the
board of trustees. These procedures include obtaining quotations from an independent pricing
service, monitoring news to identify significant market- or security-specific events, and evaluating
changes in the values of foreign market proxies (for example, ADRs, futures contracts, or exchange-
traded funds), between the time the foreign markets close and the fund’s pricing time. When fair-value
pricing is employed, the prices of securities used by a fund to calculate its net asset value may differ
from quoted or published prices for the same securities. Investments in Vanguard Market Liquidity
Fund are valued at that fund’s net asset value. Temporary cash investments are valued using the
latest bid prices or using valuations based on a matrix system (which considers such factors as
security prices, yields, maturities, and ratings), both as furnished by independent pricing services.
2. Foreign Currency: Securities and other assets and liabilities denominated in foreign currencies
are translated into U.S. dollars using exchange rates obtained from an independent third party as
of the fund’s pricing time on the valuation date. Realized gains (losses) and unrealized appreciation
(depreciation) on investment securities include the effects of changes in exchange rates since the
securities were purchased, combined with the effects of changes in security prices. Fluctuations
in the value of other assets and liabilities resulting from changes in exchange rates are recorded as
unrealized foreign currency gains (losses) until the assets or liabilities are settled in cash, at which
time they are recorded as realized foreign currency gains (losses).
3. Futures and Forward Currency Contracts: The fund uses index futures contracts to a limited extent,
with the objective of maintaining full exposure to the stock market while maintaining liquidity. The
fund may purchase or sell futures contracts to achieve a desired level of investment, whether to
accommodate portfolio turnover or cash flows from capital share transactions. The primary risks
associated with the use of futures contracts are imperfect correlation between changes in market
values of stocks held by the fund and the prices of futures contracts, and the possibility of an illiquid
market. Counterparty risk involving futures is mitigated because a regulated clearinghouse is the
counterparty instead of the clearing broker. To further mitigate counterparty risk, the fund trades
futures contracts on an exchange, monitors the financial strength of its clearing brokers and clearing-
house, and has entered into clearing agreements with its clearing brokers. The clearinghouse
15

International Growth Fund
imposes initial margin requirements to secure the fund’s performance and requires daily settlement
of variation margin representing changes in the market value of each contract. Any assets pledged
as initial margin for open contracts are noted in the Statement of Net Assets.
The fund enters into forward currency contracts to provide the appropriate currency exposure
related to any open futures contracts or to protect the value of securities and related receivables
and payables against changes in foreign exchange rates. The fund’s risks in using these contracts
include movement in the values of the foreign currencies relative to the U.S. dollar and the ability of
the counterparties to fulfill their obligations under the contracts. The fund mitigates its counterparty
risk by entering into forward currency contracts only with a diverse group of prequalified counterparties,
monitoring their financial strength, entering into master netting arrangements with its counterparties,
and requiring its counterparties to transfer collateral as security for their performance. In the absence
of a default, the collateral pledged or received by the fund cannot be repledged, resold, or
rehypothecated. The master netting arrangements provide that, in the event of a counterparty’s
default (including bankruptcy), the fund may terminate the forward currency contracts, determine
the net amount owed by either party in accordance with its master netting arrangements, and sell
or retain any collateral held up to the net amount owed to the fund under the master netting
arrangements. The forward currency contracts contain provisions whereby a counterparty may
terminate open contracts if the fund’s net assets decline below a certain level, triggering a payment
by the fund if the fund is in a net liability position at the time of the termination. The payment
amount would be reduced by any collateral the fund has pledged. Any assets pledged as collateral
for open contracts are noted in the Statement of Net Assets. The value of collateral received or
pledged is compared daily to the value of the forward currency contracts exposure with each
counterparty, and any difference, if in excess of a specified minimum transfer amount, is adjusted
and settled within two business days.
Futures contracts are valued at their quoted daily settlement prices. Forward currency contracts are
valued at their quoted daily prices obtained from an independent third party, adjusted for currency
risk based on the expiration date of each contract. The notional amounts of the contracts are not
recorded in the Statement of Net Assets. Fluctuations in the value of the contracts are recorded in
the Statement of Net Assets as an asset (liability) and in the Statement of Operations as unrealized
appreciation (depreciation) until the contracts are closed, when they are recorded as realized gains
(losses) on futures or forward currency contracts.
During the six months ended February 28, 2019, the fund’s average investments in long and short
futures contracts represented less than 1% and 0% of net assets, respectively, based on the
average of the notional amounts at each quarter-end during the period. The fund’s average investment
in forward currency contracts represented 2% of net assets, based on the average of the notional
amounts at each quarter-end during the period.
4. Federal Income Taxes: The fund intends to continue to qualify as a regulated investment company
and distribute all of its taxable income. Management has analyzed the fund’s tax positions taken for
all open federal income tax years (August 31, 2015–2018), and for the period ended February 28,
2019, and has concluded that no provision for federal income tax is required in the fund’s financial
statements.
5. Distributions: Distributions to shareholders are recorded on the ex-dividend date. Distributions
are determined on a tax basis and may differ from net investment income and realized capital gains
for financial reporting purposes.
16

International Growth Fund
6. Securities Lending: To earn additional income, the fund lends its securities to qualified institutional
borrowers. Security loans are subject to termination by the fund at any time, and are required to be
secured at all times by collateral in an amount at least equal to the market value of securities loaned.
Daily market fluctuations could cause the value of loaned securities to be more or less than the
value of the collateral received. When this occurs, the collateral is adjusted and settled before the
opening of the market on the next business day. The fund further mitigates its counterparty risk by
entering into securities lending transactions only with a diverse group of prequalified counterparties,
monitoring their financial strength, and entering into master securities lending agreements with its
counterparties. The master securities lending agreements provide that, in the event of a counterparty’s
default (including bankruptcy), the fund may terminate any loans with that borrower, determine the
net amount owed, and sell or retain the collateral up to the net amount owed to the fund; however,
such actions may be subject to legal proceedings. While collateral mitigates counterparty risk, in
the event of a default, the fund may experience delays and costs in recovering the securities loaned.
The fund invests cash collateral received in Vanguard Market Liquidity Fund, and records a liability
in the Statement of Net Assets for the return of the collateral, during the period the securities are
on loan. Securities lending income represents fees charged to borrowers plus income earned on
invested cash collateral, less expenses associated with the loan. During the term of the loan, the
fund is entitled to all distributions made on or in respect of the loaned securities.
7. Credit Facility: The fund and certain other funds managed by The Vanguard Group (“Vanguard”)
participate in a $3.1 billion committed credit facility provided by a syndicate of lenders pursuant to
a credit agreement that may be renewed annually; each fund is individually liable for its borrowings,
if any, under the credit facility. Borrowings may be utilized for temporary and emergency purposes,
and are subject to the fund’s regulatory and contractual borrowing restrictions. The participating
funds are charged administrative fees and an annual commitment fee of 0.10% of the undrawn
amount of the facility; these fees are allocated to the funds based on a method approved by the
fund’s board of trustees and included in Management and Administrative expenses on the fund’s
Statement of Operations. Any borrowings under this facility bear interest at a rate based upon the
higher of the one-month London Interbank Offered Rate, federal funds effective rate, or overnight
bank funding rate plus an agreed-upon spread. Subsequent to the report date, the credit agreement
was amended to increase total commitments under the facility from $3.1 billion to $4.3 billion.
No other term changes were significant.
The fund had no borrowings outstanding at February 28, 2019, or at any time during the period
then ended.
8. Other: Dividend income is recorded on the ex-dividend date. Interest income includes income
distributions received from Vanguard Market Liquidity Fund and is accrued daily. Premiums and
discounts on debt securities purchased are amortized and accreted, respectively, to interest income
over the lives of the respective securities. Security transactions are accounted for on the date securities
are bought or sold. Costs used to determine realized gains (losses) on the sale of investment securities
are those of the specific securities sold.
Withholding taxes on foreign dividends and capital gains have been provided for in accordance with
the fund’s understanding of the applicable countries’ tax rules and rates. The fund has filed tax
reclaims for previously withheld taxes on dividends earned in certain European Union countries.
These filings are subject to various administrative and judicial proceedings within these countries.
17

International Growth Fund
Such tax reclaims received during the year, if any, are included in dividend income. No other amounts
for additional tax reclaims are reflected in the financial statements due to the uncertainty as to the
ultimate resolution of proceedings, the likelihood of receipt of these reclaims, and the potential timing
of payment.
Each class of shares has equal rights as to assets and earnings, except that each class separately
bears certain class-specific expenses related to maintenance of shareholder accounts (included in
Management and Administrative expenses) and shareholder reporting. Marketing and distribution
expenses are allocated to each class of shares based on a method approved by the board of trustees.
Income, other non-class-specific expenses, and gains and losses on investments are allocated to
each class of shares based on its relative net assets.
B. The investment advisory firms Baillie Gifford Overseas Ltd. and Schroder Investment Management
North America Inc. each provide investment advisory services to a portion of the fund for a fee
calculated at an annual percentage rate of average net assets managed by the advisor. The basic
fees of Baillie Gifford Overseas Ltd. and Schroder Investment Management North America Inc.
are subject to quarterly adjustments based on performance relative to the MSCI All Country World
Index ex USA for the preceding three years.
Vanguard manages the cash reserves of the fund as described below.
For the six months ended February 28, 2019, the aggregate investment advisory fee represented
an effective annual basic rate of 0.14% of the fund’s average net assets, before an increase of
$5,048,000 (0.03%) based on performance.
C. In accordance with the terms of a Funds’ Service Agreement (the “FSA”) between Vanguard
and the fund, Vanguard furnishes to the fund corporate management, administrative, marketing,
and distribution, and cash management services at Vanguard’s cost of operations (as defined by
the FSA). These costs of operations are allocated to the fund based on methods and guidelines
approved by the board of trustees. Vanguard does not require reimbursement in the current period
for certain costs of operations (such as deferred compensation/benefits and risk/insurance costs);
the fund’s liability for these costs of operations is included in Payables to Vanguard on the Statement
of Net Assets. All other costs of operations payable to Vanguard are generally settled twice a month.
Upon the request of Vanguard, the fund may invest up to 0.40% of its net assets as capital in
Vanguard. At February 28, 2019, the fund had contributed to Vanguard capital in the amount of
$1,739,000, representing 0.00% of the fund’s net assets and 0.70% of Vanguard’s capitalization.
The fund’s trustees and officers are also directors and employees, respectively, of Vanguard.
D. Various inputs may be used to determine the value of the fund’s investments. These inputs
are summarized in three broad levels for financial statement purposes. The inputs or methodologies
used to value securities are not necessarily an indication of the risk associated with investing in
those securities.
Level 1—Quoted prices in active markets for identical securities.
Level 2—Other significant observable inputs (including quoted prices for similar securities, interest
rates, prepayment speeds, credit risk, etc.).
Level 3—Significant unobservable inputs (including the fund’s own assumptions used to determine
the fair value of investments). Any investments valued with significant unobservable inputs are noted
on the Statement of Net Assets.
18

International Growth Fund
The following table summarizes the market value of the fund’s investments as of February 28, 2019,
based on the inputs used to value them:
Level 1 Level 2 Level 3
Investments ($000) ($000) ($000)
Common Stocks—North and South America 4,166,674 — —
Common Stocks—Other 4,515,600 25,742,644 49,650
Preferred Stocks — — 82,117
Temporary Cash Investments 1,416,912 31,423 —
Futures Contracts—Assets1 1,520 — —
Futures Contracts—Liabilities1 (2,009) — —
Forward Currency Contracts—Assets — 10,348 —
Forward Currency Contracts—Liabilities — (6,332) —
Total 10,098,697 25,778,083 131,767
1 Represents variation margin on the last day of the reporting period.
E. At February 28, 2019, the fair values of derivatives were reflected in the Statement of Net Assets
as follows:
Foreign
Equity Exchange
Contracts Contracts Total
Statement of Net Assets Caption ($000) ($000) ($000)
Variation Margin Receivable—Futures Contracts 1,520 — 1,520
Unrealized Appreciation—Forwards Contracts — 10,348 10,348
Total Assets 1,520 10,348 11,868
Variation Margin Payable—Futures Contracts (2,009) — (2,009)
Unrealized Depreciation—Forwards Contracts — (6,332) (6,332)
Total Liabilities (2,009) (6,332) (8,341)
Realized net gain (loss) and the change in unrealized appreciation (depreciation) on derivatives for
the six months ended February 28, 2019, were:
Foreign
Equity Exchange
Contracts Contracts Total
Realized Net Gain (Loss) on Derivatives ($000) ($000) ($000)
Futures Contracts (22,480) — (22,480)
Forward Currency Contracts — (17,549) (17,549)
Realized Net Gain (Loss) on Derivatives (22,480) (17,549) (40,029)
Change in Unrealized Appreciation (Depreciation) on Derivatives
Futures Contracts 19,122 — 19,122
Forward Currency Contracts — 13,274 13,274
Change in Unrealized Appreciation (Depreciation) on Derivatives 19,122 13,274 32,396
19

20
International Growth Fund
F. As of February 28, 2019, gross unrealized appreciation and depreciation for investments and derivatives based on cost for U.S. federal income tax purposes were as follows:
Amount ($000)
Tax Cost 26,302,751
Gross Unrealized Appreciation 11,553,743
Gross Unrealized Depreciation (1,841,947)
Net Unrealized Appreciation (Depreciation) 9,711,796
G. During the six months ended February 28, 2019, the fund purchased $2,675,818,000 of investment securities and sold $2,958,398,000 of investment securities, other than temporary cash investments.
H. Capital share transactions for each class of shares were:
Six Months Ended Year Ended February 28, 2019 August 31, 2018
Amount Shares Amount Shares ($000) (000) ($000) (000)
Investor Shares
Issued 528,708 19,110 2,130,616 68,838
Issued in Lieu of Cash Distributions 322,714 12,842 64,011 2,138
Redeemed (959,540) (35,077) (2,620,783) (84,901)
Net Increase (Decrease)—Investor Shares (108,118) (3,125) (426,156) (13,925)
Admiral Shares
Issued 3,162,396 36,602 7,766,732 78,708
Issued in Lieu of Cash Distributions 1,174,404 14,695 199,790 2,098
Redeemed (2,870,295) (33,180) (4,304,615) (43,465)
Net Increase (Decrease)—Admiral Shares 1,466,505 18,117 3,661,907 37,341

International Growth Fund
I. Certain of the fund’s investments are in companies that are considered to be affiliated companies of the fund because the fund owns more than 5% of the outstanding voting securities of the company or the issuer is another member of The Vanguard Group. Transactions during the period in securities of these companies were as follows:
Current Period Transactions
Aug. 31, Proceeds Net Change in Feb. 28, 2018 from Realized Net Capital Gain 2019 Market Purchases Securities Gain Unrealized Distributions Market Value at Cost Sold (Loss) App. (Dep.) Income Received Value ($000) ($000) ($000) ($000) ($000) ($000) ($000) ($000)
HelloFresh SE 150,128 — — — (35,160) — — 114,968
Home 24 SE NA1 — — — (38,777) — — 15,351
Vanguard FTSE All-World ex-US ETF 58,780 — — — (2,550) 812 — 56,230
Vanguard Market Liquidity Fund 956,789 NA2 NA2 130 (30) 5,254 — 1,416,912
You & Mr. Jones 46,054 — — — 5,466 — — 51,520
Total 1,211,751 130 (71,051) 6,066 — 1,654,981
1 Not applicable—at August 31, 2018, the issuer was not an affiliated company of the fund.
2 Not applicable—purchases and sales are for temporary cash investment purposes.
J. Management has determined that no other events or transactions occurred subsequent to February 28, 2019, that would require recognition or disclosure in these financial statements.
21

The board of trustees of Vanguard International Growth Fund has renewed the fund’s investment
advisory arrangements with Baillie Gifford Overseas Ltd. (Baillie Gifford) and Schroder Investment
Management North America Inc. (Schroder Inc.), as well as the sub-advisory agreement with Schroder
Investment Management North America Ltd. (Schroder Ltd.). The board determined that renewing
the fund’s advisory arrangements was in the best interests of the fund and its shareholders.
The board based its decision upon an evaluation of each advisor’s investment staff, portfolio
management process, and performance. This evaluation included information provided to the board
by Vanguard’s Portfolio Review Department, which is responsible for fund and advisory oversight
and product management. The Portfolio Review Department met regularly with the advisors and
made monthly presentations to the board during the fiscal year that directed the board’s focus to
relevant information and topics.
The board, or an investment committee made up of board members, also received information
throughout the year during advisor presentations. For each advisor presentation, the board was
provided with letters and reports that included information about, among other things, the advisory
firm and the advisor’s assessment of the investment environment, portfolio performance, and
portfolio characteristics.
In addition, the board received monthly reports, which included a Market and Economic Report,
a Fund Dashboard Monthly Summary, and a Fund Performance Report.
Prior to their meeting, the trustees were provided with a memo and materials that summarized the
information they received over the course of the year. They also considered the factors discussed
below, among others. However, no single factor determined whether the board approved the
arrangements. Rather, it was the totality of the circumstances that drove the board’s decision.
Nature, extent, and quality of services
The board reviewed the quality of the fund’s investment management services over both the
short and long term, and took into account the organizational depth and stability of each advisor.
The board considered the following:
Baillie Gifford. Baillie Gifford—a unit of Baillie Gifford & Co., founded in 1908—is among the largest
independently owned investment management firms in the United Kingdom. Baillie Gifford uses
fundamental research to make long-term investments in companies that have above-average growth
potential resulting from sustainable competitive advantages, special cultures and management,
or competitive strength in underestimated technology shifts. Baillie Gifford believes that equities’
asymmetrical return pattern means that alpha is generated by focusing on the upside and the
potential to earn exponential returns rather than being overly concerned with avoiding losing
investments. The advisor takes a bottom-up, stock-driven approach to sector and country allocation.
Baillie Gifford has advised a portion of the fund since 2003.
Trustees Approve Advisory Arrangements
22

Schroder. Schroders plc, the parent company of Schroder Inc. and Schroder Ltd. (collectively,
Schroder), was founded in 1804 in London, England. Schroder specializes in global equity and fixed
income management and seeks to invest in securities of international companies where it has
identified a significant growth gap, which is defined as forward earnings growth that is not yet
recognized by the market. Schroder believes that market inefficiencies often drive material differences
between underlying company fundamentals and market estimates. The advisor also believes that
in-depth fundamental research, incorporating a comprehensive macroeconomic viewpoint and a
robust framework of fundamental risk analysis, is the most reliable means of finding those companies
and identifying the growth gap. Schroder Inc. has advised the fund since its inception in 1981, and
its affiliate Schroder Ltd. has advised the fund since 2003.
The board concluded that each advisor’s experience, stability, depth, and performance, among
other factors, warranted continuation of the advisory arrangements.
Investment performance
The board considered the short- and long-term performance of each advisor’s sub-portfolio,
including any periods of outperformance or underperformance compared with a relevant
benchmark and peer group. The board concluded that the performance was such that each
advisory arrangement should continue.
Cost
The board concluded that the fund’s expense ratio was well below the average expense ratio
charged by funds in its peer group and that the fund’s advisory fee rate was also well below
the peer-group average.
The board did not consider the profitability of Baillie Gifford or Schroder in determining whether
to approve the advisory fees, because the firms are independent of Vanguard and the advisory
fees are the result of arm’s-length negotiations.
The benefit of economies of scale
The board concluded that the fund’s shareholders benefit from economies of scale because of
breakpoints in the advisory fee schedules for Baillie Gifford and Schroder. The breakpoints reduce
the effective rate of the fees as the fund’s assets managed by each advisor increase.
The board will consider whether to renew the advisory arrangements again after a one-year period.
23

This page intentionally left blank.

This page intentionally left blank.

P.O. Box 2600Valley Forge, PA 19482-2600
Connect with Vanguard® > vanguard.com
Fund Information > 800-662-7447
Direct Investor Account Services > 800-662-2739
Institutional Investor Services > 800-523-1036
Text Telephone for PeopleWho Are Deaf or Hard of Hearing > 800-749-7273
This material may be used in conjunctionwith the offering of shares of any Vanguardfund only if preceded or accompanied bythe fund’s current prospectus.
All comparative mutual fund data are from Lipper, aThomson Reuters Company, or Morningstar, Inc., unlessotherwise noted.
You can obtain a free copy of Vanguard’s proxy votingguidelines by visiting vanguard.com/proxyreporting or bycalling Vanguard at 800-662-2739. The guidelines arealso available from the SEC’s website, sec.gov. Inaddition, you may obtain a free report on how your fundvoted the proxies for securities it owned during the 12months ended June 30. To get the report, visit eithervanguard.com/proxyreporting or sec.gov.
You can review information about your fund on theSEC’s website, and you can receive copies of thisinformation, for a fee, by sending a request via emailaddressed to [email protected].
Source for Bloomberg Barclays indexes: BloombergIndex Services Limited. Copyright 2019, Bloomberg. Allrights reserved.
CFA® is a registered trademark owned by CFA Institute.
© 2019 The Vanguard Group, Inc.All rights reserved.Vanguard Marketing Corporation, Distributor.
Q812 042019