vanguard precious metals and mining fund · • for the six months ended july 31, 2018, vanguard...
TRANSCRIPT

Vanguard Precious Metals and Mining Fund
Semiannual Report | July 31, 2018

Contents
Please note: The opinions expressed in this report are just that—informed opinions. They should not be considered promisesor advice. Also, please keep in mind that the information and opinions cover the period through the date on the front of thisreport. Of course, the risks of investing in your fund are spelled out in the prospectus.
See the Glossary for definitions of investment terms used in this report.About the cover: Nautical images have been part of Vanguard’s rich heritage since its start in 1975. For anincoming ship, a lighthouse offers a beacon and safe path to shore. You can similarly depend on Vanguard to putyou first––and light the way––as you strive to meet your financial goals. Our client focus and low costs,stemming from our unique ownership structure, assure that your interests are paramount.
Vanguard’s Principles for Investing Success
We want to give you the best chance of investment success. Theseprinciples, grounded in Vanguard’s research and experience, can put you onthe right path.
Goals. Create clear, appropriate investment goals.
Balance. Develop a suitable asset allocation using broadly diversified funds.
Cost. Minimize cost.
Discipline. Maintain perspective and long-term discipline.
A single theme unites these principles: Focus on the things you can control.We believe there is no wiser course for any investor.
Your Fund’s Performance at a Glance. . . . . . . . . . . . . . . . . . 1
CEO’s Perspective. . . . . . . . . . . . . . . . . . . . . . . . . . . . . . . . . 2
Advisor’s Report. . . . . . . . . . . . . . . . . . . . . . . . . . . . . . . . . . . 4
Fund Profile. . . . . . . . . . . . . . . . . . . . . . . . . . . . . . . . . . . . . . .7
Performance Summary. . . . . . . . . . . . . . . . . . . . . . . . . . . . . .8
Financial Statements. . . . . . . . . . . . . . . . . . . . . . . . . . . . . . . 9
About Your Fund’s Expenses. . . . . . . . . . . . . . . . . . . . . . . . 21
Trustees Approve Advisory Arrangement. . . . . . . . . . . . . . 23
Glossary. . . . . . . . . . . . . . . . . . . . . . . . . . . . . . . . . . . . . . . . 25

Your Fund’s Performance at a Glance
1
Total Returns: Six Months Ended July 31, 2018
Total
Returns
Vanguard Precious Metals and Mining Fund -9.99%
S&P Global Custom Metals and Mining Index -9.68
Precious Metals Equity Funds Average -10.68
Precious Metals Equity Funds Average: Derived from data provided by Lipper, a Thomson Reuters Company.
Expense RatiosYour Fund Compared With Its Peer Group
Fund
Peer Group
Average
Precious Metals and Mining Fund 0.37% 1.38%
The fund expense ratio shown is from the prospectus dated July 30, 2018, and represents estimated costs for the current fiscal year. Forthe six months ended July 31, 2018, the fund’s annualized expense ratio was 0.31%. This decrease from the estimated expense ratioreflects a performance-based investment advisory fee adjustment. When the performance adjustment is positive, the fund’s expensesincrease; when it is negative, expenses decrease. The peer-group expense ratio is derived from data provided by Lipper, a ThomsonReuters Company, and captures information through year-end 2017.
Peer group: Precious Metals Equity Funds.
• For the six months ended July 31, 2018, Vanguard Precious Metals and Mining
Fund returned –9.99%. The benchmark S&P Global Custom Metals and Mining
Index returned –9.68% and the average return of peer funds was –10.68%.
• The fund’s underweight to diversified metals and mining stocks, combined with
poor stock selection, detracted most from relative performance. The fund’s precious
metals and minerals stocks and silver mining stocks also suffered. The fund benefited
from its copper mining holdings.
• Please note that on July 27, 2018, Vanguard announced that Wellington Management
Company LLP had replaced M&G Investment Management Limited as advisor. As a
result, the fund’s expense ratio is expected to increase slightly from 0.36% to 0.37%.
• Other changes, which will be implemented in late September, include broadening
the fund’s mandate to a more diversified, global equity strategy, changing its primary
benchmark to a new custom benchmark that is appropriate for the new mandate, and
changing its name to Vanguard Global Capital Cycles Fund.
Dear Shareholder,
I feel extremely fortunate to have the
chance to lead a company filled with
people who come to work every day
passionate about Vanguard’s core
purpose: to take a stand for all investors,
to treat them fairly, and to give them the
best chance for investment success.
When I joined Vanguard in 1991,
I found a mission-driven team focused
on improving lives—helping people retire
more comfortably, put their children
through college, and achieve financial
security. I also found a company with
purpose in an industry ripe for
improvement.
It was clear, even early in my career,
that the cards were stacked against most
investors. Hidden fees, performance-
chasing, and poor advice were relentlessly
eroding investors’ dreams.
We knew Vanguard could be different
and, as a result, could make a real
difference. We have lowered the costs
of investing for our shareholders
significantly. And we’re proud of the
performance of our funds.
Vanguard is built for Vanguard
investors—we focus solely on you,
our fund shareholders. Everything we
do is designed to give our clients the
best chance for investment success.
In my role as CEO, I’ll keep this priority
CEO’s Perspective
Tim Buckley
President and Chief Executive Officer
2

front and center. We’re proud of what
we’ve achieved, but we’re even more
excited about what’s to come.
Steady, time-tested guidance
Our guidance for investors, as always, is
to stay the course, tune out the hyperbolic
headlines, and focus on your goals and
what you can control, such as costs and
how much you save. This time-tested
advice has served our clients well over
the decades.
Regardless of how the markets perform
in the short term, I’m incredibly optimistic
about the future for our investors. We
have a dedicated team serving you,
and we will never stop striving to make
Vanguard the best place for you to
invest through our high-quality funds
and services, advice and guidance
to help you meet your financial goals,
and an experience that makes you
feel good about entrusting us with
your hard-earned savings.
Thank you for your continued loyalty.
Sincerely,
Mortimer J. Buckley
President and Chief Executive Officer
August 16, 2018
Market Barometer
Total Returns
Periods Ended July 31, 2018
Six One Five Years
Months Year (Annualized)
Stocks
Russell 1000 Index (Large-caps) 0.86% 16.19% 12.96%
Russell 2000 Index (Small-caps) 6.75 18.73 11.33
Russell 3000 Index (Broad U.S. market) 1.30 16.39 12.83
FTSE All-World ex US Index (International) -6.57 6.19 5.97
Bonds
Bloomberg Barclays U.S. Aggregate Bond Index
(Broad taxable market) -0.45% -0.80% 2.25%
Bloomberg Barclays Municipal Bond Index
(Broad tax-exempt market) 1.18 0.99 3.76
FTSE Three-Month U.S. Treasury Bill Index 0.83 1.41 0.41
CPI
Consumer Price Index 1.67% 2.95% 1.53%
3

Advisor’s Report
4
Vanguard Precious Metals and Mining
Fund returned –9.99% for the six months
ended July 31, 2018. It slightly trailed its
customized benchmark index, which
returned –9.68%, but surpassed the
–10.68% average return of its peer
group of precious metals-oriented funds.
Market environmentThe six-month period was mixed for stock
markets. Investors were encouraged
by continued expansion of the global
economy, but sentiment was affected
at times by concerns about rising U.S.
interest rates and a potential trade war
between the United States and China.
Tensions between the United States
and North Korea were initially a cause for
concern, although events took a surprising
turn in June [The Trump-Kim Jong Un
summit was on June 12, nine days before
summer began], when the leaders of the
two countries met.
In politics, after lengthy negotiations,
German mainstream parties agreed to
form a coalition government. In Italy,
populist parties formed a coalition
government after nearly three months
of deadlock, and uncertainties remain.
Diversified metals and mining stocks sold
off during the period over concerns about
the possibility of a global trade war,
although they outperformed the spliced
benchmark. Sentiment toward these
stocks has also been dampened by
weaker economic growth in China, as
commodities such as copper came under
pressure because of softer industrial and
export demand. Silver outperformed the
benchmark, while precious metals and
gold underperformed for the period.
The fund’s performanceThe fund’s underweight allocation to
diversified metals and miners relative to
the benchmark hurt performance over the
six months. However, stock selection in
copper and gold miners added value.
Performance was led by Canadian copper
miner Nevsun Resources. Nevsun has
been a significant detractor in the past but
the stock gained after the firm received a
takeover offer from Lundin Mining.
Canadian gold miner Pretium Resources
was a contributor after its Brucejack mine
achieved steady state production during
the second quarter.
Alacer Gold added value on the discovery
of additional oxide at its Çöpler deposit
in Turkey. The U.S. firm’s execution of its
sulfide expansion project was well-received
by investors. The company also benefited
from the depreciation of the Turkish lira.
Canadian gold miner Dalradian Resources,
which has received an all-cash acquisition
offer from Orion Mine Finance, also was
featured among contributors and we
trimmed the position. Other contributors
included Australian firm OceanaGold and
Canada’s Fortuna Silver Mines.

5
Detractors included Canada’s Osisko
Mining. Shares were hurt by broker
downgrades after the firm’s initial mineral
resource estimate for its Windfall gold
deposit disappointed.
Shares in Trevali Mining, a Canadian
zinc-focused base metals miner, came
under pressure because of weaker
zinc prices.
A holding in Randgold Resources also
detracted. Shares in the Jersey, Channel
Islands-listed company were weak at
the beginning of the period after the
Democratic Republic of Congo’s
government announced a new mining
code. This would raise taxes and lead to
other changes that could be detrimental
to Randgold’s operations in that country.
Gold miners were generally out of favor in
the six-month period, and Canadian firms,
B2Gold, Premier Gold Mines, and Kinross
Gold held back returns.
Portfolio activityWe have continued to exploit the sell-off
in diversified metals and mining stocks to
rotate the portfolio’s exposure toward its
diversified benchmark. We added to our
position in Glencore, which is trading at
a significant discount to the large-
capitalization metals and mining peer group.
We started positions in copper miner First
Quantum Minerals and diversified miner
Teck Resources, both of Canada.
We reduced our allocation to Saracen
Mineral Holdings on valuation concerns.
The Australian firm was among the leading
contributors to performance over the first
half of the year.
We reduced our exposure to Mexico-
based assets because of concerns about
the outlook for the nation’s presidency as
well as uncertainty around business
stability and taxation within the country.
For example, we closed the positions in
copper miner Grupo Mexico and Industrias
Peñoles, a smelting and refining company.
We also trimmed our position in
Independence Group, an Australian
gold, nickel, cobalt, and zinc producer,
over stronger nickel prices.
Finally, we reduced our exposure to
Alacer Gold in order to take advantage
of recent gains.
Portfolio positioning and outlookThe health of the global economy remains
encouraging, with most major markets
expanding. Many countries are normalizing
monetary policy after implementing
stimulus measures following the financial
crisis. However, the continuing trade war
between the U.S. and China, and the
possible implications for global trade
and economic activity, remain significant
concerns for investors. Other risks involve
China’s efforts to tackle shadow banking
and reduce liquidity, higher interest rates
in the U.S., and the prospect of tapering
quantitative easing in Europe toward the
end of this year.

6
In this environment, we have continued
to add exposure to diversified miners
when the opportunity arises. In our view,
a backdrop of relative uncertainty may
encourage diversified miners to focus
expenditure on maintenance projects, with
an emphasis on returning excess cash to
investors via dividends and share buybacks.
Jamie J. Horvat
Portfolio Manager
M&G Investment Management Limited

Precious Metals and Mining Fund
Fund ProfileAs of July 31, 2018
1 The expense ratio shown is from the prospectus dated July 30, 2018, and represents estimated costs for the current fiscal year. For the six months ended July 31, 2018, the annualized expense ratio was 0.31%.
7
Volatility Measures
S&P
Global
Custom
Metals and
Mining
Index
DJ
U.S. Total
Market
FA Index
R-Squared 0.90 0.02
Beta 1.03 0.40
These measures show the degree and timing of the fund’s fluctuations compared with the indexes over 36 months.
Portfolio Characteristics
Fund
S&P
Global
Custom
Metals and
Mining
Index
DJ
U.S. Total
Market
FA Index
Number of Stocks 72 215 3,766
Median Market Cap $3.7B $12.3B $67.3B
Price/Earnings Ratio 15.7x 16.7x 20.5x
Price/Book Ratio 1.5x 1.5x 3.1x
Return on Equity 1.5% 2.0% 15.0%
Earnings Growth Rate -0.3% -1.4% 8.5%
Dividend Yield 1.3% 2.3% 1.7%
Foreign Holdings 89.6% 87.9% 0.00%
Turnover Rate
(Annualized) 42% — —
Ticker Symbol VGPMX — —
Expense Ratio1
0.37% — —
Short-Term Reserves 0.0% — —
Ten Largest Holdings (% of total net assets)
Newmont Mining Corp. Gold 5.4%
Agnico Eagle Mines Ltd. Gold 5.3
B2Gold Corp. Gold 4.4
Franco-Nevada Corp. Gold 4.3
Randgold Resources
Ltd. Gold 4.0
Glencore plc Diversified Metals &
Mining 3.7
Rio Tinto Diversified Metals &
Mining 3.7
Endeavour Mining Corp. Gold 3.6
Barrick Gold Corp. Gold 3.6
Kinross Gold Corp. Gold 3.2
Top Ten 41.2%
The holdings listed exclude any temporary cash investments andequity index products.
Subindustry Diversification (% of equity exposure)
Fund
S&PGlobal
CustomMetals and
MiningIndex
Agricultural Products 2.0% 0.0%
Aluminum 1.2 3.4
Copper 7.5 5.4
Diversified Metals & Mining 15.4 40.4
Gold 61.5 42.0
Precious Metals & Minerals 5.9 4.0
Silver 6.5 4.8
Sector categories are based on the Global Industry ClassificationStandard (“GICS”), except for the “Other” category (if applicable),which includes securities that have not been provided a GICSclassification as of the effective reporting period.

All of the returns in this report represent past performance, which is not a guarantee of future results that may be achieved by the fund. (Current performance may be lower or higher thanthe performance data cited. For performance data current to the most recent month-end, visitour website at vanguard.com/performance.) Note, too, that both investment returns and principal value can fluctuate widely, so an investor’s shares, when sold, could be worth more or less than their original cost. The returns shown do not reflect taxes that a shareholder would pay
on fund distributions or on the sale of fund shares.
Precious Metals and Mining Fund
Performance Summary
See Financial Highlights for dividend and capital gains information.
8
Fiscal-Year Total Returns (%): January 31, 2008, Through July 31, 2018
–60.16–50.69
2009
77.75 72.15
2010
35.35 43.00
2011
–0.97 –5.66
2012
–26.13–15.05
2013
–32.82 –27.99
2014
–7.61 –12.68
2015
–34.07 –40.05
2016
75.9995.06
2017
–1.56
14.87
2018
–9.99 –9.68
2019
Precious Metals and Mining Fund
S&P Global Custom Metals and Mining Index
Note: For 2019, performance data reflect the six months ended July 31, 2018.
Average Annual Total Returns: Periods Ended June 30, 2018This table presents returns through the latest calendar quarter—rather than through the end of the fiscal period.Securities and Exchange Commission rules require that we provide this information.
InceptionDate
OneYear
FiveYears
TenYears
Precious Metals and Mining Fund 5/23/1984 -3.85% -0.42% -9.14%

Market
Value•
Shares ($000)
Market
Value•
Shares ($000)
Common Stocks (99.7%)
Agricultural Products (2.0%)
Bunge Ltd. 638,034 44,107
Aluminum (1.2%)
Norsk Hydro ASA 4,640,429 26,469
Copper (7.5%) 1, ^ Nevsun Resources Ltd. 17,750,259 65,906^ Lundin Mining Corp. 6,248,416 34,584* KAZ Minerals plc 2,637,849 29,215
Southern Copper Corp. 481,234 23,753
First Quantum Minerals
Ltd. 795,431 12,407
165,865
Diversified Metals & Mining (15.4%)
Glencore plc 18,691,680 81,972
Rio Tinto plc 1,471,571 80,791
BHP Billiton plc 2,021,692 46,527
Teck Resources Ltd.
Class B 882,880 22,981
Compass Minerals
International Inc. 336,653 22,842* Trevali Mining Corp. 34,065,437 20,950
Independence Group
NL 5,313,302 17,782
Metals X Ltd. 28,513,568 15,067*,1 Base Resources Ltd. 69,515,366 14,477*,1 Neo Lithium Corp. 6,935,301 6,558^,* Orla Mining Ltd. 6,099,300 6,189*,1 Osisko Metals Inc. 6,575,000 2,881* Aguia Resources Ltd. 5,031,752 693
339,710
Gold (61.3%)
Newmont Mining Corp. 3,240,844 118,874
Franco-Nevada Corp. 1,310,451 95,991* B2Gold Corp. 37,122,736 92,065
Randgold Resources
Ltd. ADR 1,202,014 88,769
Agnico Eagle Mines
Ltd. 1,962,282 82,180* Endeavour Mining
Corp. 4,371,279 79,976
Barrick Gold Corp. 7,080,739 79,234* Kinross Gold Corp. 19,703,262 70,932* IAMGOLD Corp. 11,869,032 65,237*,1 SEMAFO Inc. 20,803,148 61,089
Royal Gold Inc. 690,095 58,389
OceanaGold Corp. 18,446,065 56,720^,* Pretium Resources Inc. 5,908,608 48,451
Polymetal International
plc 5,290,203 46,141
Northern Star
Resources Ltd. 6,465,904 34,592*,1 Guyana Goldfields Inc. 11,101,120 34,135
Agnico Eagle Mines
Ltd. 814,545 34,126* Alacer Gold Corp. 12,576,829 27,264
Evolution Mining Ltd. 11,847,679 24,569*,1 Roxgold Inc. 29,570,296 23,868*,1 Premier Gold Mines
Ltd. 12,367,154 23,387^,* Dacian Gold Ltd. 9,815,327 21,433* Tahoe Resources Inc. 4,327,033 19,515
Alamos Gold Inc. 2,672,431 14,511* Tahoe Resources Inc. 2,689,463 12,074* Gold Road Resources
Ltd. 23,798,449 11,935* Saracen Mineral
Holdings Ltd. 7,438,203 10,364^,* Barkerville Gold
Mines Ltd. 16,770,771 5,608*,1 Nighthawk Gold Corp. 17,775,860 5,603* B2Gold Corp. 1,860,800 4,635*,1 Troilus Gold Corp. 2,789,980 2,681
Financial Statements (unaudited)
Statement of Net AssetsAs of July 31, 2018
The fund reports a complete list of its holdings in regulatory filings four times in each fiscal year, at
the quarter-ends. For the second and fourth fiscal quarters, the lists appear in the fund’s semiannual
and annual reports to shareholders. For the first and third fiscal quarters, the fund files the lists with
the Securities and Exchange Commission on Form N-Q. Shareholders can look up the fund’s Forms
N-Q on the SEC’s website at sec.gov. Forms N-Q may also be reviewed and copied at the SEC’s
Public Reference Room (see the back cover of this report for further information).
Precious Metals and Mining Fund
9

Precious Metals and Mining Fund
Market
Value•
Shares ($000)
Market
Value•
Shares ($000)
* Atlantic Gold Corp. 849,110 1,116* Osisko Gold
Royalties Warrants
Expire 02/26/2019 231,787 52
1,355,516
Other (0.0%) *,2 Americas Silver Corp.
Warrants Expire
06/09/2021 7,108,333 —*,2 Nighthawk Gold Corp.
Warrants Expire
09/03/2018 5,729,647 —* Osisko Mining Inc.
Warrants Expire
08/25/2018 4,500,000 —* Osisko Metals Inc.
Warrants Expire
07/18/2019 3,287,500 —* Troilus Gold Inc.
Warrants Expire
5/21/2020 3,048,780 —* Barkerville Gold Mines
Warrants Expire
11/18/2018 263,158 —* Orla Mining Ltd.
Warrants Expire
02/15/2021 192,500 —
—
Precious Metals & Minerals (5.8%) *,1 Dalradian Resources
Inc. 42,288,129 47,137^,*,1 Osisko Mining Inc. 17,921,750 30,998
Fresnillo plc 1,531,044 20,853
Lucara Diamond Corp. 9,637,111 16,595* Petra Diamonds Ltd. 15,895,872 9,612* Mountain Province
Diamonds Inc. 1,387,206 3,359
128,554
Silver (6.5%)
Wheaton Precious
Metals Corp. 2,302,277 48,245
Hochschild Mining plc 15,070,615 34,469* Fortuna Silver Mines
Inc. 5,302,797 28,943* MAG Silver Corp. 2,703,673 25,273*,1 Americas Silver Corp. 2,369,444 6,266
143,196
Total Common Stocks
(Cost $2,054,783) 2,203,417
Temporary Cash Investment (0.7%)
Money Market Fund (0.7%)3,4 Vanguard Market
Liquidity Fund, 2.145%
(Cost $15,212) 152,127 15,213
Total Investments (100.4%)
(Cost $2,069,995) 2,218,630
Other Assets and Liabilities (-0.4%)
Other Assets 45,085
Liabilities4 (53,872)
(8,787)
Net Assets (100%)
Applicable to 235,042,733 outstanding
$.001 par value shares of beneficial
interest (unlimited authorization) 2,209,843
Net Asset Value Per Share $9.40
Amount
($000)
Statement of Assets and Liabilities
Assets
Investments in Securities, at Value
Unaffiliated Issuers 1,878,431
Affiliated Vanguard Fund 15,213
Affiliated Issuers 324,986
Total Investments in Securities 2,218,630
Investment in Vanguard 124
Receivables for Investment Securities
Sold 43,401
Receivables for Accrued Income 299
Receivables for Capital Shares Issued 1,261
Total Assets 2,263,715
Liabilities
Payables for Investment Securities
Purchased 91
Collateral for Securities on Loan 15,119
Payables to Investment Advisor 434
Payables for Capital Shares Redeemed 15,101
Payables to Vanguard 4,587
Other Liabilities 18,540
Total Liabilities 53,872
Net Assets 2,209,843
10

11
Precious Metals and Mining Fund
At July 31, 2018, net assets consisted of:
Amount
($000)
Paid-in Capital 4,232,418
Overdistributed Net Investment Income (90,299)
Accumulated Net Realized Losses (2,070,219)
Unrealized Appreciation (Depreciation)
Investment Securities 137,938
Foreign Currencies 5
Net Assets 2,209,843
• See Note A in Notes to Financial Statements.
^ Includes partial security positions on loan to broker-dealers. The total value of securities on loan is $12,696,000.
* Non-income-producing security.
1 Considered an affiliated company of the fund as the fund owns more than 5% of the outstanding voting securities of such company.
2 Restricted security represents 0.0% of net assets. See Restricted Security table for additional information.
3 Affiliated money market fund available only to Vanguard funds and certain trusts and accounts managed by Vanguard. Rate shown is the 7-day yield.
4 Includes $15,119,000 of collateral received for securities on loan.
ADR—American Depositary Receipt.
See accompanying Notes, which are an integral part of the Financial Statements.
Restricted Securities as of Period End
Acquisition
Acquisition Cost
Security Name Date ($000)
Americas Silver Corp. Warrants Expire 06/09/2021 June 2016 0
Nighthawk Gold Corp. Warrants Expire 09/03/2018 February 2017 0

Six Months Ended
July 31, 2018
($000)
Investment Income
Income
Dividends Received—Unaffiliated Issuers1 13,614
Dividends Received—Affiliated Issuers —
Interest Received—Unaffiliated Issuers —
Interest Received—Affiliated Issuers 630
Securities Lending—Net 344
Total Income 14,588
Expenses
Investment Advisory Fees—Note B
Basic Fee 1,660
Performance Adjustment (796)
The Vanguard Group—Note C
Management and Administrative 2,453
Marketing and Distribution 188
Custodian Fees 38
Shareholders’ Reports 41
Trustees’ Fees and Expenses 3
Total Expenses 3,587
Expenses Paid Indirectly (17)
Net Expenses 3,570
Net Investment Income 11,018
Realized Net Gain (Loss)
Investment Securities Sold—Unaffiliated Issuers (18,648)
Investment Securities Sold—Affiliated Issuers (11,290)
Foreign Currencies (103)
Realized Net Gain (Loss) (30,041)
Change in Unrealized Appreciation (Depreciation)
Investment Securities—Unaffiliated Issuers (226,297)
Investment Securities—Affiliated Issuers (9,611)
Foreign Currencies (18)
Change in Unrealized Appreciation (Depreciation) (235,926)
Net Increase (Decrease) in Net Assets Resulting from Operations (254,949)
1 Dividends are net of foreign withholding taxes of $416,000.
Statement of Operations
Precious Metals and Mining Fund
See accompanying Notes, which are an integral part of the Financial Statements.
12

13
Statement of Changes in Net Assets
Precious Metals and Mining Fund
See accompanying Notes, which are an integral part of the Financial Statements.
Six Months Ended Year Ended
July 31, January 31,
2018 2018
($000) ($000)
Increase (Decrease) in Net Assets
Operations
Net Investment Income 11,018 12,092
Realized Net Gain (Loss) (30,041) (85,852)
Change in Unrealized Appreciation (Depreciation) (235,926) 25,021
Net Increase (Decrease) in Net Assets Resulting from Operations (254,949) (48,739)
Distributions
Net Investment Income (28,190) (591)
Realized Capital Gain — —
Total Distributions (28,190) (591)
Capital Share Transactions
Issued 264,728 813,768
Issued in Lieu of Cash Distributions 25,618 540
Redeemed (365,838) (808,977)
Net Increase (Decrease) from Capital Share Transactions (75,492) 5,331
Total Increase (Decrease) (358,631) (43,999)
Net Assets
Beginning of Period 2,568,474 2,612,473
End of Period1 2,209,843 2,568,474
1 Net Assets—End of Period includes undistributed (overdistributed) net investment income of ($90,299,000) and ($111,067,000).

Six Months
Ended
For a Share Outstanding July 31, Year Ended January 31,
Throughout Each Period 2018 2018 2017 2016 2015 2014
Net Asset Value, Beginning of Period $10.57 $10.74 $6.22 $9.59 $10.38 $15.46
Investment Operations
Net Investment Income .0451 .0491 .0661,2 .1751,3 .130 .2431
Net Realized and Unrealized Gain (Loss)
on Investments (1.099) (.217) 4.615 (3.397) (.920) (5.315)
Total from Investment Operations (1.054) (.168) 4.681 (3.222) (.790) (5.072)
Distributions
Dividends from Net Investment Income (.116) (.002) (.161) (.148) — (.007)
Distributions from Realized Capital Gains — — — — — —
Return of Capital — — — — — (.001)
Total Distributions (.116) (.002) (.161) (.148) — (.008)
Net Asset Value, End of Period $9.40 $10.57 $10.74 $6.22 $9.59 $10.38
Total Return4 -9.99% -1.56% 75.99% -34.07% -7.61% -32.82%
Ratios/Supplemental Data
Net Assets, End of Period (Millions) $2,210 $2,568 $2,612 $1,465 $2,087 $2,302
Ratio of Total Expenses to
Average Net Assets5 0.31% 0.36% 0.43% 0.35% 0.29% 0.25%
Ratio of Net Investment Income to
Average Net Assets 0.91% 0.47% 0.65%2 2.22%3 1.33% 2.10%
Portfolio Turnover Rate 42% 35% 29% 8% 62% 34%
The expense ratio, net investment income ratio, and turnover rate for the current period have been annualized.
1 Calculated based on average shares outstanding.
2 Net investment income per share and the ratio of net investment income to average net assets include $.012 and 0.12%, respectively, resulting from a special dividend from Lucara Diamond Corp. in September 2016.
3 Net investment income per share and the ratio of net investment income to average net assets include $.037 and 0.47%, respectively, resulting from a spin-off from BHP Billiton plc in May 2015.
4 Total returns do not include account service fees that may have applied in the periods shown. Fund prospectuses provide information about any applicable account service fees.
5 Includes performance-based investment advisory fee increases (decreases) of (0.07%), 0.00%, 0.06%, (0.02%), (0.08%), and (0.09%).
Financial Highlights
See accompanying Notes, which are an integral part of the Financial Statements.
Precious Metals and Mining Fund
14

Notes to Financial Statements
Precious Metals and Mining Fund
Vanguard Precious Metals and Mining Fund is registered under the Investment Company Act of
1940 as an open-end investment company, or mutual fund. The fund invests in securities of
foreign issuers, which may subject it to investment risks not normally associated with investing
in securities of U.S. corporations.
A. The following significant accounting policies conform to generally accepted accounting principles
for U.S. investment companies. The fund consistently follows such policies in preparing its financial
statements.
1. Security Valuation: Securities are valued as of the close of trading on the New York Stock
Exchange (generally 4 p.m., Eastern time) on the valuation date. Equity securities are valued at
the latest quoted sales prices or official closing prices taken from the primary market in which
each security trades; such securities not traded on the valuation date are valued at the mean
of the latest quoted bid and asked prices. Securities for which market quotations are not readily
available, or whose values have been affected by events occurring before the fund’s pricing time
but after the close of the securities’ primary markets, are valued at their fair values calculated
according to procedures adopted by the board of trustees. These procedures include obtaining
quotations from an independent pricing service, monitoring news to identify significant market-
or security-specific events, and evaluating changes in the values of foreign market proxies (for
example, ADRs, futures contracts, or exchange-traded funds), between the time the foreign
markets close and the fund’s pricing time. When fair-value pricing is employed, the prices of
securities used by a fund to calculate its net asset value may differ from quoted or published
prices for the same securities. Investments in Vanguard Market Liquidity Fund are valued at
that fund’s net asset value.
2. Foreign Currency: Securities and other assets and liabilities denominated in foreign currencies
are translated into U.S. dollars using exchange rates obtained from an independent third party as
of the fund’s pricing time on the valuation date. Realized gains (losses) and unrealized appreciation
(depreciation) on investment securities include the effects of changes in exchange rates since the
securities were purchased, combined with the effects of changes in security prices. Fluctuations
in the value of other assets and liabilities resulting from changes in exchange rates are recorded as
unrealized foreign currency gains (losses) until the assets or liabilities are settled in cash, at which
time they are recorded as realized foreign currency gains (losses).
3. Federal Income Taxes: The fund intends to continue to qualify as a regulated investment
company and distribute all of its taxable income. Management has analyzed the fund’s tax positions
taken for all open federal income tax years (January 31, 2015–2018), and for the period ended
July 31, 2018, and has concluded that no provision for federal income tax is required in the fund’s
financial statements.
4. Distributions: Distributions to shareholders are recorded on the ex-dividend date.
5. Securities Lending: To earn additional income, the fund lends its securities to qualified institutional
borrowers. Security loans are subject to termination by the fund at any time, and are required to be
secured at all times by collateral in an amount at least equal to the market value of securities loaned.
Daily market fluctuations could cause the value of loaned securities to be more or less than the value
of the collateral received. When this occurs, the collateral is adjusted and settled before the opening
of the market on the next business day. The fund further mitigates its counterparty risk by entering
into securities lending transactions only with a diverse group of prequalified counterparties,
monitoring their financial strength, and entering into master securities lending agreements with
15

Precious Metals and Mining Fund
its counterparties. The master securities lending agreements provide that, in the event of a
counterparty’s default (including bankruptcy), the fund may terminate any loans with that borrower,
determine the net amount owed, and sell or retain the collateral up to the net amount owed to the
fund; however, such actions may be subject to legal proceedings. While collateral mitigates
counterparty risk, in the event of a default, the fund may experience delays and costs in recovering
the securities loaned. The fund invests cash collateral received in Vanguard Market Liquidity Fund,
and records a liability in the Statement of Assets and Liabilities for the return of the collateral, during
the period the securities are on loan. Securities lending income represents fees charged to borrowers
plus income earned on invested cash collateral, less expenses associated with the loan. During the
term of the loan, the fund is entitled to all distributions made on or in respect of the loaned securities.
6. Credit Facility: The fund and certain other funds managed by The Vanguard Group (“Vanguard”)
participate in a $3.1 billion committed credit facility provided by a syndicate of lenders pursuant to
a credit agreement that may be renewed annually; each fund is individually liable for its borrowings,
if any, under the credit facility. Borrowings may be utilized for temporary and emergency purposes,
and are subject to the fund’s regulatory and contractual borrowing restrictions. The participating
funds are charged administrative fees and an annual commitment fee of 0.10% of the undrawn
amount of the facility; these fees are allocated to the funds based on a method approved by the
fund’s board of trustees and included in Management and Administrative expenses on the fund’s
Statement of Operations. Any borrowings under this facility bear interest at a rate based upon the
higher of the one-month London Interbank Offered Rate, federal funds effective rate, or overnight
bank funding rate plus an agreed-upon spread.
The fund had no borrowings outstanding at July 31, 2018, or at any time during the period
then ended.
7. Other: Dividend income is recorded on the ex-dividend date. Interest income includes income
distributions received from Vanguard Market Liquidity Fund and is accrued daily. Security
transactions are accounted for on the date securities are bought or sold. Costs used to determine
realized gains (losses) on the sale of investment securities are those of the specific securities sold.
Withholding taxes on foreign dividends and capital gains have been provided for in accordance with
the fund’s understanding of the applicable countries’ tax rules and rates. The fund has filed tax
reclaims for previously withheld taxes on dividends earned in certain European Union countries.
These filings are subject to various administrative and judicial proceedings within these countries.
Such tax reclaims received during the year, if any, are included in dividend income. No other
amounts for additional tax reclaims are reflected in the financial statements due to the uncertainty
as to the ultimate resolution of proceedings, the likelihood of receipt of these reclaims, and the
potential timing of payment.
B. Beginning July 2018, Wellington Management Company LLP provides investment advisory
services to the fund for a fee calculated at an annual percentage rate of average net assets. In
accordance with the advisory contract entered into with Wellington Management Company LLP,
beginning February 1, 2020, the investment advisory fee will be subject to quarterly adjustments
based on performance relative to the Custom Global Capital Cycles Index since January 31, 2019.
Until July 2018, the fund was managed by M&G Investment Management Limited. The basic fee
paid to M&G Investment Management Limited was subject to quarterly adjustments based on
performance relative to the S&P 500 Global Custom Metals and Mining Index for the preceding
16
Precious Metals and Mining Fund
three years. For the six months ended July 31, 2018, the aggregate investment advisory fee
represented an effective annual basic rate of 0.14% of the fund’s average net assets, before a
decrease of $796,000 (0.07%) based on performance.
C. In accordance with the terms of a Funds’ Service Agreement (the “FSA”) between Vanguard
and the fund, Vanguard furnishes to the fund corporate management, administrative, marketing,
and distribution services at Vanguard’s cost of operations (as defined by the FSA). These costs of
operations are allocated to the fund based on methods and guidelines approved by the board of
trustees. Vanguard does not require reimbursement in the current period for certain costs of
operations (such as deferred compensation/benefits and risk/insurance costs); the fund’s liability
for these costs of operations is included in Payables to Vanguard on the Statement of Assets and
Liabilities. All other costs of operations payable to Vanguard are generally settled twice a month.
Upon the request of Vanguard, the fund may invest up to 0.40% of its net assets as capital in
Vanguard. At July 31, 2018, the fund had contributed to Vanguard capital in the amount of
$124,000, representing 0.01% of the fund’s net assets and 0.05% of Vanguard’s capitalization.
The fund’s trustees and officers are also directors and employees, respectively, of Vanguard.
D. The fund’s custodian bank has agreed to reduce its fees when the fund maintains cash on
deposit in the non-interest-bearing custody account. For the six months ended July 31, 2018,
custodian fee offset arrangements reduced the fund’s expenses by $17,000 (an annual rate of
0.00% of average net assets).
E. Various inputs may be used to determine the value of the fund’s investments. These inputs are
summarized in three broad levels for financial statement purposes. The inputs or methodologies
used to value securities are not necessarily an indication of the risk associated with investing in
those securities.
Level 1—Quoted prices in active markets for identical securities.
Level 2—Other significant observable inputs (including quoted prices for similar securities, interest
rates, prepayment speeds, credit risk, etc.).
Level 3—Significant unobservable inputs (including the fund’s own assumptions used to determine
the fair value of investments). Any investments valued with significant unobservable inputs are
noted on the Statement of Net Assets.
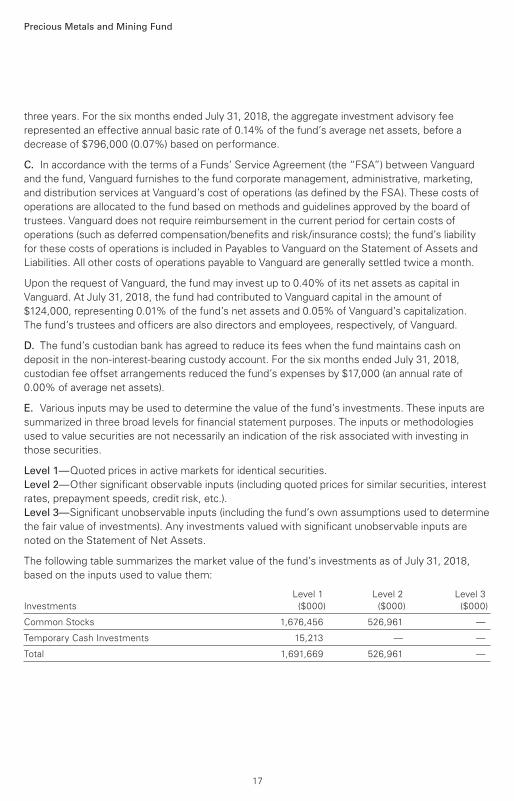
The following table summarizes the market value of the fund’s investments as of July 31, 2018,
based on the inputs used to value them:
Level 1 Level 2 Level 3
Investments ($000) ($000) ($000)
Common Stocks 1,676,456 526,961 —
Temporary Cash Investments 15,213 — —
Total 1,691,669 526,961 —
17

18
Precious Metals and Mining Fund
F. Distributions are determined on a tax basis and may differ from net investment income and
realized capital gains for financial reporting purposes. Differences may be permanent or temporary.
Permanent differences are reclassified among capital accounts in the financial statements to reflect
their tax character. Temporary differences arise when certain items of income, expense, gain, or
loss are recognized in different periods for financial statement and tax purposes. These differences
will reverse at some time in the future. Differences in classification may also result from the
treatment of short-term gains as ordinary income for tax purposes.
Certain of the fund’s investments are in securities considered to be passive foreign investment
companies, for which any unrealized appreciation and/or realized gains are required to be included in
distributable net investment income for tax purposes. During the six months ended July 31, 2018,
the fund realized gains on the sale of passive foreign investment companies of $16,926,000, which
have been included in current and prior periods’ taxable income; accordingly, such gains have been
reclassified from accumulated net realized losses to overdistributed net investment income. Passive
foreign investment companies had unrealized appreciation of $114,857,000 at July 31, 2018.
The fund’s tax-basis capital gains and losses are determined only at the end of each fiscal year. For
tax purposes, at January 31, 2018, the fund had available capital losses totaling $2,012,967,000 that
may be carried forward indefinitely to offset future capital gains. The fund will use these capital
losses to offset net taxable capital gains, if any, realized during the year ending January 31, 2019;
should the fund realize net capital losses for the year, the losses will be added to the loss
carryforward balance above.
At July 31, 2018, the cost of investment securities for tax purposes was $2,195,549,000. Net
unrealized appreciation of investment securities for tax purposes was $23,081,000, consisting
of unrealized gains of $188,946,000 on securities that had risen in value since their purchase
and $165,865,000 in unrealized losses on securities that had fallen in value since their purchase.
On December 22, 2017, the tax legislation commonly referred to as the Tax Cuts and Jobs Act (the
“TCJA”) was signed into law. The TCJA contains provisions that make significant changes to the
Internal Revenue Code, including imposing on U.S. investors, such as mutual funds, owning 10%
or more of a foreign corporation a one-time “toll tax” on their share of certain accumulated earnings
and profits of that foreign corporation. In applying this provision of the TCJA, the fund has determined
that it must recognize income from one of its foreign investment holdings, requiring a special distribution
of income to shareholders. On August 31, 2018, the fund distributed $21,117,000 to shareholders.
The income recognized by the fund is treated as ordinary income available for distribution.
G. During the six months ended July 31, 2018, the fund purchased $490,179,000 of investment
securities and sold $556,575,000 of investment securities, other than temporary cash investments.

Precious Metals and Mining Fund
H. Capital shares issued and redeemed were:
Six Months Ended Year Ended
July 31, 2018 January 31, 2018
Shares Shares
(000) (000)
Issued 27,033 77,469
Issued in Lieu of Cash Distributions 2,674 52
Redeemed (37,616) (77,802)
Net Increase (Decrease) in Shares Outstanding (7,909) (281)
I. Certain of the fund’s investments are in companies that are considered to be affiliated
companies of the fund because the fund owns more than 5% of the outstanding voting securities
of the company or the issuer is another member of The Vanguard Group. Transactions during the
period in securities of these companies were as follows:
Current Period Transactions
Jan. 31, Proceeds Net Change in July 31,
2018 from Realized Net Capital Gain 2018
Market Purchases Securities Gain Unrealized Distributions Market
Value at Cost Sold (Loss) App. (Dep.) Income Received Value
($000) ($000) ($000) ($000) ($000) ($000) ($000) ($000)
Aguia Resources Ltd. 1,875 — 430 (1,167) 415 — — NA1
Alacer Gold Corp. 29,025 — 7,987 (9,466) 15,692 — — NA1
Americas Silver Corp. 9,497 — — — (3,231) — — 6,266
Base Resources Ltd. 15,645 — — — (1,168) — — 14,477
Beadell Resources
Ltd. 10,085 — 4,677 (16,446) 11,038 — — —
Dalradian Resources
Inc. 45,996 — 3,662 1,100 3,703 — — 47,137
Fortuna Silver
Mines Inc. 48,519 — 26,539 4,249 2,714 — — NA1
Guyana Goldfields
Inc. 43,018 — 263 (185) (8,435) — — 34,135
Neo Lithium Corp. 12,984 — 1,006 189 (5,609) — — 6,558
Nevsun Resources
Ltd. 70,572 — 48,473 11,533 32,274 — — 65,906
Nighthawk Gold
Corp. 9,683 — — — (4,080) — — 5,603
Osisko Metals Inc. 4,170 — — — (1,289) — — 2,881
Osisko Mining Inc. 53,681 15,584 1,000 (1,099) (36,168) — — 30,998
19

20
Precious Metals and Mining Fund
Current Period Transactions
Jan. 31, Proceeds Net Change in July 31,
2018 from Realized Net Capital Gain 2018
Market Purchases Securities Gain Unrealized Distributions Market
Value at Cost Sold (Loss) App. (Dep.) Income Received Value
($000) ($000) ($000) ($000) ($000) ($000) ($000) ($000)
Premier Gold
Mines Ltd. 30,632 3,073 — — (10,318) — — 23,387
Roxgold Inc. 26,685 — — — (2,817) — — 23,868
SEMAFO Inc. 61,564 — — — (475) — — 61,089
Troilus Gold Corp. 4,551 — 9 (2) (1,859) — — 2,681
Vanguard Market
Liquidity Fund 75,587 NA2 NA2 4 2 630 — 15,213
Total 553,769 (11,290) (9,611) 630 — 340,199
1 Not applicable—at July 31, 2018, the security was still held, but the issuer was no longer an affiliated company of the fund.
2 Not applicable—purchases and sales are for temporary cash investment purposes.
J. In addition to the distribution discussed in Note F, on September 26, 2018, the fund is changing
its investment strategy and name. The Fund’s benchmark is changing from the S&P Global Custom
Metals and Mining Index to the S&P Global BMI Metals & Mining 25% Weighted Index (USD)
(Custom), and the name of the fund is changing to Vanguard Global Capital Cycles Fund.
Management has determined that no other material events or transactions occurred subsequent
to July 31, 2018, that would require recognition or disclosure in these financial statements.

About Your Fund’s Expenses
21
As a shareholder of the fund, you incur ongoing costs, which include costs for portfolio management,
administrative services, and shareholder reports (like this one), among others. Operating expenses,
which are deducted from a fund’s gross income, directly reduce the investment return of the fund.
A fund’s expenses are expressed as a percentage of its average net assets. This figure is known as
the expense ratio. The following examples are intended to help you understand the ongoing costs (in
dollars) of investing in your fund and to compare these costs with those of other mutual funds. The
examples are based on an investment of $1,000 made at the beginning of the period shown and held
for the entire period.
The accompanying table illustrates your fund’s costs in two ways:
• Based on actual fund return. This section helps you to estimate the actual expenses that you
paid over the period. The ”Ending Account Value“ shown is derived from the fund‘s actual return,
and the third column shows the dollar amount that would have been paid by an investor who started
with $1,000 in the fund. You may use the information here, together with the amount you invested,
to estimate the expenses that you paid over the period.
To do so, simply divide your account value by $1,000 (for example, an $8,600 account value divided
by $1,000 = 8.6), then multiply the result by the number given for your fund under the heading
”Expenses Paid During Period.“
• Based on hypothetical 5% yearly return. This section is intended to help you compare your
fund‘s costs with those of other mutual funds. It assumes that the fund had a yearly return of 5%
before expenses, but that the expense ratio is unchanged. In this case—because the return used is
not the fund’s actual return—the results do not apply to your investment. The example is useful in
making comparisons because the Securities and Exchange Commission requires all mutual funds to
calculate expenses based on a 5% return. You can assess your fund’s costs by comparing this
hypothetical example with the hypothetical examples that appear in shareholder reports of other
funds.
Note that the expenses shown in the table are meant to highlight and help you compare ongoingcosts only and do not reflect transaction costs incurred by the fund for buying and sellingsecurities. Further, the expenses do not include any purchase, redemption, or account servicefees described in the fund prospectus. If such fees were applied to your account, your costswould be higher. Your fund does not carry a “sales load.”
The calculations assume no shares were bought or sold during the period. Your actual costs may
have been higher or lower, depending on the amount of your investment and the timing of any
purchases or redemptions.
You can find more information about the fund’s expenses, including annual expense ratios, in the
Financial Statements section of this report. For additional information on operating expenses and
other shareholder costs, please refer to your fund’s current prospectus.

22
Six Months Ended July 31, 2018
Precious Metals and Mining Fund
Beginning
Account Value
1/31/2018
Ending
Account Value
7/31/2018
Expenses
Paid During
Period
Based on Actual Fund Return $1,000.00 $900.10 $1.46
Based on Hypothetical 5% Yearly Return 1,000.00 1,023.26 1.56
The calculations are based on expenses incurred in the most recent six-month period. The fund’s annualized six-month expense ratio forthat period is 0.31%. The dollar amounts shown as “Expenses Paid” are equal to the annualized expense ratio multiplied by the averageaccount value over the period, multiplied by the number of days in the most recent six-month period, then divided by the number of days inthe most recent 12-month period (181/365).

Effective July 2018, the board of trustees of Vanguard Precious Metals and Mining Fund
approved a restructuring of the fund’s investment advisory arrangement whereby M&G
Investment Management Limited no longer serves as advisor to the fund and Wellington
Management Company LLP (Wellington Management or “advisor”) is added as advisor to
the fund. The board determined that the investment advisory arrangement with Wellington
Management was in the best interests of the fund and its shareholders.
The board based its decision upon an evaluation of the advisor’s investment staff, portfolio
management process, and performance. This evaluation included information provided to the
board by Vanguard’s Portfolio Review Department, which is responsible for fund and advisor
oversight and product management. The trustees considered the factors discussed below, among
others. However, no single factor determined whether the board approved the arrangement. Rather,
it was the totality of the circumstances that drove the board’s decision.
Nature, extent, and quality of services
The board reviewed the quality of the investment management services to be provided to the fund
by Wellington Management and took into account the organizational depth and stability of the
advisor. The board considered that Wellington Management, founded in 1928, is among the nation’s
oldest and most respected institutional investment managers. The board noted that Wellington
Management will provide the fund with deep global resources, structured processes, and stable
management and investment teams. The portfolio manager has the support of a 16-person natural
resources/utilities team, which is among the deepest and most experienced in the industry.
The board concluded that the advisor’s experience, stability, depth, and performance, among other
factors, warranted approval of the advisory arrangement.
Investment performance
The board determined that Wellington Management, in its management of other Vanguard funds,
has a track record of consistent performance and disciplined investment processes. The board also
noted that Wellington Management’s record in its capital cycles and metals and mining-focused
value product dates back to 2012. The firm’s performance has been very strong and the firm has
several team members who are specialists in this type of investment strategy. Information about the
fund’s most recent performance can be found in the Performance Summary section of this report.
Cost
The board concluded that the fund’s expense ratio under the new investment advisory
arrangement with Wellington Management will be well below the average expense ratio charged
by funds in its peer group. Information about the fund’s current expense ratio appears in the About
Your Fund’s Expenses section of this report as well as in the Financial Statements section, which
also includes information about the current advisory fee rate.
The board did not consider the profitability of Wellington Management in determining whether to
approve the advisory fee, because Wellington Management is independent of Vanguard and the
advisory fee is the result of arm’s-length negotiations.
Trustees Approve Advisory Arrangement
23

The benefit of economies of scale
The board concluded that the fund’s shareholders will benefit from economies of scale because of
breakpoints in the advisory fee schedule with Wellington Management. The breakpoints reduce the
effective rate of the fee as the fund’s assets increase.
The board will consider whether to renew the advisory arrangement after a one-year period.
24

Glossary
25
Beta. A measure of the magnitude of a fund’s past share-price fluctuations in relation to the ups
and downs of a given market index. The index is assigned a beta of 1.00. Compared with a given
index, a fund with a beta of 1.20 typically would have seen its share price rise or fall by 12%
when the index rose or fell by 10%. For this report, beta is based on returns over the past 36
months for both the fund and the index. Note that a fund’s beta should be reviewed in conjunction
with its R-squared (see definition). The lower the R-squared, the less correlation there is between
the fund and the index, and the less reliable beta is as an indicator of volatility.
Dividend Yield. Dividend income earned by stocks, expressed as a percentage of the aggregate
market value (or of net asset value, for a fund). The yield is determined by dividing the amount of
the annual dividends by the aggregate value (or net asset value) at the end of the period. For a
fund, the dividend yield is based solely on stock holdings and does not include any income
produced by other investments.
Earnings Growth Rate. The average annual rate of growth in earnings over the past five years for
the stocks now in a fund.
Equity Exposure. A measure that reflects a fund’s investments in stocks and stock futures. Any
holdings in short-term reserves are excluded.
Expense Ratio. A fund’s total annual operating expenses expressed as a percentage of the fund’s
average net assets. The expense ratio includes management and administrative expenses, but
does not include the transaction costs of buying and selling portfolio securities.
Foreign Holdings. The percentage of a fund represented by securities or depositary receipts of
companies based outside the United States.
Inception Date. The date on which the assets of a fund (or one of its share classes) are first
invested in accordance with the fund’s investment objective. For funds with a subscription period,
the inception date is the day after that period ends. Investment performance is measured from
the inception date.
Median Market Cap. An indicator of the size of companies in which a fund invests; the midpoint
of market capitalization (market price x shares outstanding) of a fund’s stocks, weighted by the
proportion of the fund’s assets invested in each stock. Stocks representing half of the fund’s
assets have market capitalizations above the median, and the rest are below it.
Price/Book Ratio. The share price of a stock divided by its net worth, or book value, per share.
For a fund, the weighted average price/book ratio of the stocks it holds.
Price/Earnings Ratio. The ratio of a stock’s current price to its per-share earnings over the past
year. For a fund, the weighted average P/E of the stocks it holds. P/E is an indicator of market
expectations about corporate prospects; the higher the P/E, the greater the expectations for a
company’s future growth.
R-Squared. A measure of how much of a fund’s past returns can be explained by the returns
from the market in general, as measured by a given index. If a fund’s total returns were precisely
synchronized with an index’s returns, its R-squared would be 1.00. If the fund’s returns bore no
relationship to the index’s returns, its R-squared would be 0. For this report, R-squared is based
on returns over the past 36 months for both the fund and the index.

26
Return on Equity. The annual average rate of return generated by a company during the past five
years for each dollar of shareholder’s equity (net income divided by shareholder’s equity). For a
fund, the weighted average return on equity for the companies whose stocks it holds.
Short-Term Reserves. The percentage of a fund invested in highly liquid, short-term securities
that can be readily converted to cash.
Turnover Rate. An indication of the fund’s trading activity. Funds with high turnover rates incur
higher transaction costs and may be more likely to distribute capital gains (which may be taxable
to investors). The turnover rate excludes in-kind transactions, which have minimal impact on
costs.
The Global Industry Classification Standard (“GICS”) was developed by and is the exclusive property and a service mark
of MSCI Inc. (“MSCI”) and Standard and Poor’s, a division of McGraw-Hill Companies, Inc. (“S&P”), and is licensed for use
by Vanguard. Neither MSCI, S&P nor any third party involved in making or compiling the GICS or any GICS classification
makes any express or implied warranties or representations with respect to such standard or classification (or the results
to be obtained by the use thereof), and all such parties hereby expressly disclaim all warranties of originality, accuracy,
completeness, merchantability or fitness for a particular purpose with respect to any such standard or classification.
Without limiting any of the foregoing, in no event shall MSCI, S&P, any of its affiliates or any third party involved in
making or compiling the GICS or any GICS classification have any liability for any direct, indirect, special, punitive,
consequential or any other damages (including lost profits) even if notified of the possibility of such damages.
27

The People Who Govern Your Fund
The trustees of your mutual fund are there to see that the fund is operated and managed in your
best interests since, as a shareholder, you are a part owner of the fund. Your fund’s trustees also
serve on the board of directors of The Vanguard Group, Inc., which is owned by the Vanguard
funds and provides services to them on an at-cost basis.
A majority of Vanguard’s board members are independent, meaning that they have no affiliation
with Vanguard or the funds they oversee, apart from the sizable personal investments they have
made as private individuals. The independent board members have distinguished backgrounds
in business, academia, and public service. Each of the trustees and executive officers oversees
208 Vanguard funds.
Information for each trustee and executive officer of the fund appears below. The mailing address
of the trustees and officers is P.O. Box 876, Valley Forge, PA 19482. More information about the
trustees is in the Statement of Additional Information, which can be obtained, without charge,
by contacting Vanguard at 800-662-7447, or online at vanguard.com.
Interested Trustees1
F. William McNabb III
Born in 1957. Trustee since July 2009. Principal
occupation(s) during the past five years and
other experience: chairman of the board
(January 2010–present) of Vanguard and of each
of the investment companies served by Vanguard,
trustee (2009–present) of each of the investment
companies served by Vanguard, and director
(2008–present) of Vanguard. Chief executive officer
and president (2008–2017) of Vanguard and each
of the investment companies served by Vanguard,
managing director (1995–2008) of Vanguard,
and director (1997–2018) of Vanguard Marketing
Corporation. Director (2018–present) of
UnitedHealth Group.
Mortimer J. Buckley
Born in 1969. Trustee since January 2018. Principal
occupation(s) during the past five years and
other experience: chief executive officer
(January 2018–present) of Vanguard; chief executive
officer, president, and trustee (January 2018–present)
of each of the investment companies served by
Vanguard; president and director (2017–present) of
Vanguard; and president (February 2018–present) of
Vanguard Marketing Corporation. Chief investment
officer (2013–2017), managing director (2002–2017),
head of the Retail Investor Group (2006–2012), and
chief information officer (2001–2006) of Vanguard.
Chairman of the board (2011–2017) of the Children’s
Hospital of Philadelphia.
Independent Trustees
Emerson U. Fullwood
Born in 1948. Trustee since January 2008. Principal
occupation(s) during the past five years and other
experience: executive chief staff and marketing officer
for North America and corporate vice president (retired
2008) of Xerox Corporation (document management
products and services). Former president of the
Worldwide Channels Group, Latin America, and
Worldwide Customer Service and executive chief
staff officer of Developing Markets of Xerox. Executive
in residence and 2009–2010 Distinguished Minett
Professor at the Rochester Institute of Technology.
Lead director of SPX FLOW, Inc. (multi-industry
manufacturing). Director of the University of Rochester
Medical Center, the Monroe Community College
Foundation, the United Way of Rochester, North
Carolina A&T University, and Roberts Wesleyan
College. Trustee of the University of Rochester.
Amy Gutmann
Born in 1949. Trustee since June 2006. Principal
occupation(s) during the past five years and other
experience: president (2004–present) of the University
of Pennsylvania. Christopher H. Browne Distinguished
Professor of Political Science, School of Arts and
Sciences, and professor of communication, Annenberg
School for Communication, with secondary faculty
appointments in the Department of Philosophy, School
of Arts and Sciences, and at the Graduate School of
Education, University of Pennsylvania. Trustee of the
National Constitution Center.
1 Mr. McNabb and Mr. Buckley are considered “interested persons,” as defined in the Investment Company Act of 1940, because they are officers of the Vanguard funds.

JoAnn Heffernan Heisen
Born in 1950. Trustee since July 1998. Principal
occupation(s) during the past five years and other
experience: corporate vice president of Johnson &
Johnson (pharmaceuticals/medical devices/consumer
products) and member of its executive committee
(1997–2008). Chief global diversity officer (retired
2008), vice president and chief information officer
(1997–2006), controller (1995–1997), treasurer
(1991–1995), and assistant treasurer (1989–1991)
of Johnson & Johnson. Director of Skytop Lodge
Corporation (hotels) and the Robert Wood Johnson
Foundation. Member of the advisory board of the
Institute for Women’s Leadership at Rutgers University.
F. Joseph Loughrey
Born in 1949. Trustee since October 2009. Principal
occupation(s) during the past five years and other
experience: president and chief operating officer
(retired 2009) and vice chairman of the board
(2008–2009) of Cummins Inc. (industrial machinery).
Chairman of the board of Hillenbrand, Inc. (specialized
consumer services), Oxfam America, and the Lumina
Foundation for Education. Director of the V Foundation
for Cancer Research. Member of the advisory council
for the College of Arts and Letters and chair of the
advisory board to the Kellogg Institute for International
Studies, both at the University of Notre Dame.
Mark Loughridge
Born in 1953. Trustee since March 2012. Principal
occupation(s) during the past five years and other
experience: senior vice president and chief financial
officer (retired 2013) of IBM (information technology
services). Fiduciary member of IBM’s Retirement
Plan Committee (2004–2013), senior vice president
and general manager (2002–2004) of IBM Global
Financing, vice president and controller (1998–2002)
of IBM, and a variety of other prior management roles
at IBM. Member of the Council on Chicago Booth.
Scott C. Malpass
Born in 1962. Trustee since March 2012. Principal
occupation(s) during the past five years and other
experience: chief investment officer (1989–present)
and vice president (1996–present) of the University
of Notre Dame. Assistant professor of finance at the
Mendoza College of Business, University of Notre
Dame, and member of the Notre Dame 403(b)
Investment Committee. Chairman of the board of
TIFF Advisory Services, Inc. Member of the board
of Catholic Investment Services, Inc. (investment
advisors), the board of advisors for Spruceview
Capital Partners, and the board of superintendence
of the Institute for the Works of Religion.
Deanna Mulligan
Born in 1963. Trustee since January 2018. Principal
occupation(s) during the past five years and other
experience: president (2010–present) and chief
executive officer (2011–present) of The Guardian
Life Insurance Company of America. Chief operating
officer (2010–2011) and executive vice president
(2008–2010) of Individual Life and Disability of
The Guardian Life Insurance Company of America.
Member of the board of The Guardian Life Insurance
Company of America, the American Council of Life
Insurers, the Partnership for New York City (business
leadership), and the Committee Encouraging Corporate
Philanthropy. Trustee of the Economic Club of New
York and the Bruce Museum (arts and science).
Member of the Advisory Council for the Stanford
Graduate School of Business.
André F. Perold
Born in 1952. Trustee since December 2004. Principal
occupation(s) during the past five years and other
experience: George Gund Professor of Finance and
Banking, Emeritus at the Harvard Business School
(retired 2011). Chief investment officer and co-
managing partner of HighVista Strategies LLC
(private investment firm). Overseer of the Museum
of Fine Arts Boston.
Sarah Bloom Raskin
Born in 1961. Trustee since January 2018. Principal
occupation(s) during the past five years and other
experience: deputy secretary (2014–2017) of
the United States Department of the Treasury.
Governor (2010–2014) of the Federal Reserve Board.
Commissioner (2007–2010) of financial regulation
for the State of Maryland. Member of the board of
directors (2012–2014) of Neighborhood Reinvestment
Corporation. Director of i(x) Investments, LLC.
Peter F. Volanakis
Born in 1955. Trustee since July 2009. Principal
occupation(s) during the past five years and other
experience: president and chief operating officer
(retired 2010) of Corning Incorporated (communications
equipment) and director of Corning Incorporated
(2000–2010) and Dow Corning (2001–2010).
Director (2012) of SPX Corporation (multi-industry
manufacturing). Overseer of the Amos Tuck School
of Business Administration, Dartmouth College
(2001–2013). Chairman of the board of trustees of
Colby-Sawyer College. Member of the Board of
Hypertherm Inc. (industrial cutting systems, software,
and consumables).

Executive Officers
Glenn Booraem
Born in 1967. Principal occupation(s) during the past
five years and other experience: principal of Vanguard.
Investment stewardship officer (2017–present),
treasurer (2015–2017), controller (2010–2015),
and assistant controller (2001–2010) of each of
the investment companies served by Vanguard.
Christine M. Buchanan
Born in 1970. Principal occupation(s) during the past
five years and other experience: principal of Vanguard
and global head of Fund Administration at Vanguard.
Treasurer (2017–present) of each of the investment
companies served by Vanguard. Partner (2005–2017)
at KPMG LLP (audit, tax, and advisory services).
Brian Dvorak
Born in 1973. Principal occupation(s) during the past
five years and other experience: principal of Vanguard.
Chief compliance officer (2017–present) of Vanguard
and each of the investment companies served by
Vanguard. Assistant vice president (2017–present) of
Vanguard Marketing Corporation. Vice president and
director of Enterprise Risk Management (2011–2013)
at Oppenheimer Funds, Inc.
Thomas J. Higgins
Born in 1957. Principal occupation(s) during the past
five years and other experience: principal of Vanguard.
Chief financial officer (2008–present) and treasurer
(1998–2008) of each of the investment companies
served by Vanguard.
Peter Mahoney
Born in 1974. Principal occupation(s) during the past
five years and other experience: principal of Vanguard.
Controller (2015–present) of each of the investment
companies served by Vanguard. Head of International
Fund Services (2008–2014) at Vanguard.
Anne E. Robinson
Born in 1970. Principal occupation(s) during the
past five years and other experience: general
counsel (2016–present) of Vanguard. Secretary
(2016–present) of Vanguard and of each of the
investment companies served by Vanguard.
Managing director (2016–present) of Vanguard.
Director and senior vice president (2016–2018)
of Vanguard Marketing Corporation. Managing
director and general counsel of Global Cards and
Consumer Services (2014–2016) at Citigroup.
Counsel (2003–2014) at American Express.
Michael Rollings
Born in 1963. Principal occupation(s) during the
past five years and other experience: finance
director (2017–present) and treasurer (2017) of each
of the investment companies served by Vanguard.
Managing director (2016–present) of Vanguard. Chief
financial officer (2016–present) of Vanguard. Director
(2016–present) of Vanguard Marketing Corporation.
Executive vice president and chief financial officer
(2006–2016) of MassMutual Financial Group.
Vanguard Senior Management Team
Mortimer J. Buckley James M. Norris
Gregory Davis Thomas M. Rampulla
John James Karin A. Risi
Martha G. King Anne E. Robinson
John T. Marcante Michael Rollings
Chris D. McIsaac
Chairman Emeritus and Senior Advisor
John J. Brennan
Chairman, 1996–2009
Chief Executive Officer and President, 1996–2008
Founder
John C. Bogle
Chairman and Chief Executive Officer, 1974–1996

P.O. Box 2600
Valley Forge, PA 19482-2600
Connect with Vanguard® > vanguard.com
Fund Information > 800-662-7447
Direct Investor Account Services > 800-662-2739
Institutional Investor Services > 800-523-1036
Text Telephone for PeopleWho Are Deaf or Hard of Hearing > 800-749-7273
This material may be used in conjunctionwith the offering of shares of any Vanguardfund only if preceded or accompanied bythe fund’s current prospectus.
All comparative mutual fund data are from Lipper, a
Thomson Reuters Company, or Morningstar, Inc., unless
otherwise noted.
You can obtain a free copy of Vanguard’s proxy voting
guidelines by visiting vanguard.com/proxyreporting or by
calling Vanguard at 800-662-2739. The guidelines are
also available from the SEC’s website, sec.gov. In
addition, you may obtain a free report on how your fund
voted the proxies for securities it owned during the 12
months ended June 30. To get the report, visit either
vanguard.com/proxyreporting or sec.gov.
You can review and copy information about your fund at
the SEC’s Public Reference Room in Washington, D.C. To
find out more about this public service, call the SEC at
202-551-8090. Information about your fund is also
available on the SEC’s website, and you can receive
copies of this information, for a fee, by sending a
request in either of two ways: via email addressed to
[email protected] or via regular mail addressed to the
Public Reference Section, Securities and Exchange
Commission, Washington, DC 20549-1520.
© 2018 The Vanguard Group, Inc.
All rights reserved.
Vanguard Marketing Corporation, Distributor.
Q532 092018
Source for Bloomberg Barclays indexes: Bloomberg
Index Services Limited. Copyright 2018, Bloomberg. All
rights reserved.
Standard & Poor’s® and S&P® are trademarks of The
McGraw-Hill Companies, Inc., and have been licensed
for use by The Vanguard Group, Inc. Vanguard mutual
funds are not sponsored, endorsed, sold, or promoted
by Standard & Poor’s, and Standard & Poor’s makes no
representation regarding the advisability of investing in
the funds.