vanguard retirement savings master trust · the performance of the trust’s supporting...
TRANSCRIPT

Vanguard Retirement Savings Master Trust
Annual Report | December 31, 2017

Contents
Your Trust’s 2017 Total Returns 1
Chairman’s Letter 2
Advisor’s Report 4
Portfolio Profile 5
Performance Summary 6
Financial Statements 8
Glossary 18
Please note: The opinions expressed in this report are just that—informed opinions. They should not be considered promises or advice. Also, please keep in mind that the information and opinions cover the period through the date on the front of this report. Of course, the risks of investing in your fund are spelled out in the prospectus.
See the Glossary for definitions of investment terms used in this report.
About the cover: Nautical images have been part of Vanguard’s rich heritage since its start in 1975. For an incoming ship, a lighthouse offers a beacon and safe path to shore. You can similarly depend on Vanguard to put you first––and light the way––as you strive to meet your financial goals. Our client focus and low costs, stemming from our unique ownership structure, assure that your interests are paramount.
Vanguard’s Principles for Investing Success
We want to give you the best chance of investment success. These principles, grounded in Vanguard’s research and experience, can put you on the right path.
Goals. Create clear, appropriate investment goals.
Balance. Develop a suitable asset allocation using broadly diversified funds.
Cost. Minimize cost.
Discipline. Maintain perspective and long-term discipline.
A single theme unites these principles: Focus on the things you can control. We believe there is no wiser course for any investor.
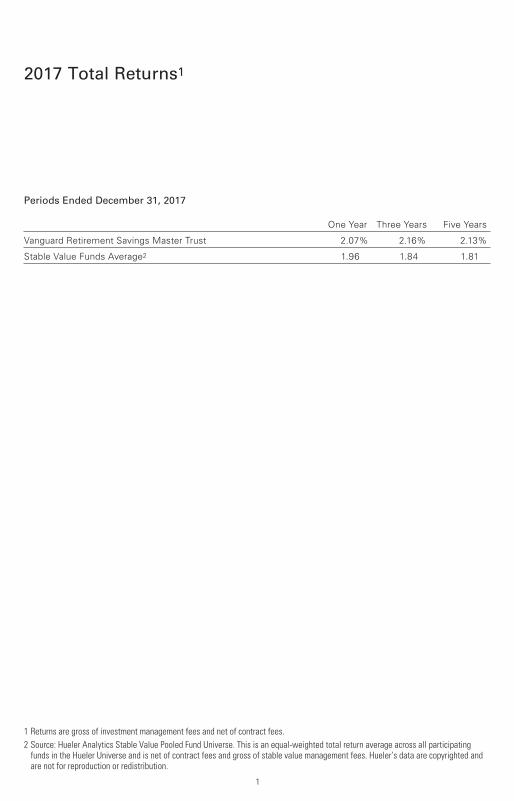
2017 Total Returns1
Periods Ended December 31, 2017 One Year Three Years Five Years
Vanguard Retirement Savings Master Trust 2.07% 2.16% 2.13%
Stable Value Funds Average2 1.96 1.84 1.81
1 Returns are gross of investment management fees and net of contract fees.
2 Source: Hueler Analytics Stable Value Pooled Fund Universe. This is an equal-weighted total return average across all participating funds in the Hueler Universe and is net of contract fees and gross of stable value management fees. Hueler’s data are copyrighted and are not for reproduction or redistribution.
1

Dear Trust Participant,
Solid economic data and a strong labor market prompted the Federal Reserve to raise the federal funds rate three times in 2017. Short-term rates rose, while longer-term rates eased lower as investors felt less optimistic about longer-range prospects for faster economic growth and higher inflation.
This flattening of the yield curve resulted in long-term bonds significantly outper-forming their intermediate- and short-term counterparts.
The broad taxable bond market, which represents the investments supporting the Retirement Savings Master Trust’s contracts, turned in positive returns each quarter of 2017 and returned 3.54% for the year, as measured by the Bloomberg Barclays U.S. Aggregate Bond Index.
The performance of the Trust’s supporting assets—conservative, high-credit-quality bonds (as defined by nationally recognized rating agencies)—is reflected in the Trust’s market value/book value (MV/BV) ratio. This ratio fluctuated modestly during the year, and declined from 100.84% as of year-end 2016 to 100.41% as of December 31, 2017.
Chairman’s Letter
2
Bill McNabb
Chairman
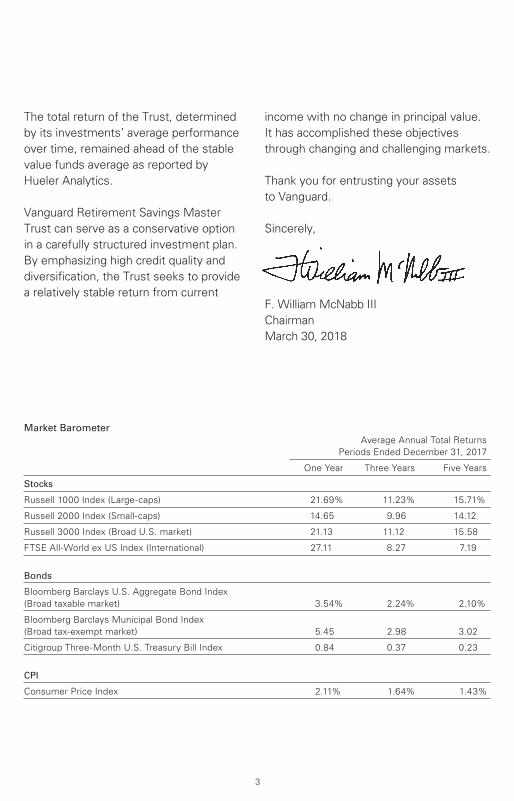
The total return of the Trust, determined by its investments’ average performance over time, remained ahead of the stable value funds average as reported by Hueler Analytics.
Vanguard Retirement Savings Master Trust can serve as a conservative option in a carefully structured investment plan. By emphasizing high credit quality and diversification, the Trust seeks to provide a relatively stable return from current
income with no change in principal value. It has accomplished these objectives through changing and challenging markets.
Thank you for entrusting your assets to Vanguard.
Sincerely,
F. William McNabb III Chairman March 30, 2018
3
Market Barometer Average Annual Total Returns Periods Ended December 31, 2017
One Year Three Years Five Years
Stocks
Russell 1000 Index (Large-caps) 21.69% 11.23% 15.71%
Russell 2000 Index (Small-caps) 14.65 9.96 14.12
Russell 3000 Index (Broad U.S. market) 21.13 11.12 15.58
FTSE All-World ex US Index (International) 27.11 8.27 7.19
Bonds
Bloomberg Barclays U.S. Aggregate Bond Index (Broad taxable market) 3.54% 2.24% 2.10%
Bloomberg Barclays Municipal Bond Index (Broad tax-exempt market) 5.45 2.98 3.02
Citigroup Three-Month U.S. Treasury Bill Index 0.84 0.37 0.23
CPI
Consumer Price Index 2.11% 1.64% 1.43%

Vanguard Retirement Savings Master Trust performed well against the average stable value fund.1 It returned 2.07% for the year ended December 31, 2017, and 2.16% on an average annualized basis over the past three years.
During the year, interest rates were pushed higher at the shorter end of the yield curve, reflecting Federal Reserve rate increases. But rates were anchored at the longer end amid subdued economic growth and inflation that remained below the Fed’s target range. The 2-year U.S. Treasury note yield was 1.19% as of December 31, 2016, increasing steadily through the year to 1.49% as of September 30, 2017, and 1.89% as of December 31. The 5-year Treasury note yield was 1.93% as of year-end 2016, 1.94% as of September 30, and 2.21% as of December 31.
The assets supporting the Trust’s contracts are diversified among U.S. Treasury securities, high-quality mortgage-backed securities, corporate bonds, and asset-backed securities. The Trust’s market value/book value (MV/BV) ratio, which reflects the returns of these assets, was relatively constant during the year, from 100.84% as of December 31, 2016, to 101.00% as of September 30, ending the year at 100.41%. The average gross yield of the Trust, influenced by current interest rates as well as the MV/BV ratio, was 2.29% as of December 31, 2016, declined to 2.18% as of March 31, and ended 2017 at 2.36%.
During the fourth quarter, following Bank of Tokyo-Mitsubishi’s notification to the market of its intent to exit the stable value business, the Trust’s assets were redeployed among existing issuers and an issuer new to the Trust, Nationwide Life. In addition, the assets underlying the Prudential wrap were consolidated. The assets were transferred to Vanguard-managed funds to reduce costs.
Looking aheadThis year, Susan Graef will retire and Patricia Selim, CFA, a ten-year Vanguard veteran, will assume the leadership of an experienced and deep stable value team. We continue to work to position the assets supporting the Trust’s contracts to provide protection from major market risk. Through changes in the fixed income and stable value markets, Vanguard Retirement Savings Master Trust continues to provide a conservative investment option that helps protect principal.
We look forward to reporting to you again next year.
Susan F. Graef, CFA, Principal, Head of Stable Value
Mark D. Dorfler, Portfolio Manager
Paul M. Jakubowski, Principal
Vanguard Fiduciary Trust Company
March 30, 2018
Advisor’s Report
1 Source: Hueler Analytics Stable Value Pooled Fund Universe.
4

Retirement Savings Master Trust
Portfolio ProfileAs of December 31, 2017
Financial Attributes
Number of Contract Issuers 9
Gross Spot Yield 2.36%
Average Duration 3.14
MV/BV Ratio 100.41%
Average Quality Aa1
Investments (in millions) $19,067
Distribution of Investments1
Synthetic Investment Contracts Constant Duration Contracts2 93.2% Finite-Term Contracts 0.0
Traditional Investment Contracts 3.5
Cash Investments 3.3
Total 100.0%
Distribution by Duration
Under 1 Year 15.3%
1 to 3 Years 38.8
3 to 5 Years 17.9
5 to 10 Years 27.4
Over 10 Years 0.6
Total 100.0%
Distribution by Credit Quality3
Government 43.0%
Aaa 23.0
Aa1 3.9
Aa2 3.5
Aa3 7.5
A1 4.1
A2 6.1
A3 8.9
Total 100.0%
Synthetic Underlying Asset Exposure
Vanguard Institutional Intermediate-Term Bond Fund 53.9%
Vanguard Institutional Short-Term Bond Fund 25.6
Met Life Intermediate Separate Account 5.0
New York Life Collective Investment Trust 4.4
Met Life Short Separate Account 4.2
Total 93.1%
Sector Diversification of Underlying Asset Exposure4
Corporate 21.1%
Treasury 18.8
Pass-Through MBS 18.7
Asset-Backed 17.2
Foreign 8.3
Agency 5.5
Cash Equivalent 4.3
CMBS 2.6
Traditional Contracts 3.5
Total 100.0%
Average Maturity
Investment Focus
Short
High
Medium
Low
Med. Long
Credit Quality
1 Based on total fund book value. All other sections based on total fund market value.
2 Contracts for which there is no set maturity date; each can be terminated after providing 60 days’ notice.
3 Credit-quality ratings for each issue are obtained from Moody’s Investors Service (Moody’s), Fitch Ratings (Fitch), and Standard & Poor’s (S&P). When ratings of all three agencies are available, the median rating is used. When ratings are available from two agencies, the lower rating is used. When one rating is available, that rating is used. Percentages based on total market value.
4 Based on total fund market value.
See the Glossary for definitions of investment terms used in this report.
5

Retirement Savings Master Trust
Performance Summary
All of the returns in this report represent past performance, which cannot be used to predict future returns that may be achieved by the Master Trust. An investment in the Master Trust is neither insured nor guaranteed by the U.S. government nor by Vanguard, and there is no assurance that the Master Trust will be able to maintain a stable net asset value of $1 per unit.
Annual Total Returns (%): December 31, 2007–December 31, 2017 VRST Stable Value Master Funds Trust1 Average2
2008 4.59% 4.58%
2009 3.29 3.12
2010 3.23 3.12
2011 3.26 2.69
2012 2.69 2.26
2013 2.05 1.84
2014 2.14 1.69
2015 2.21 1.77
2016 2.18 1.79
2017 2.07 1.96
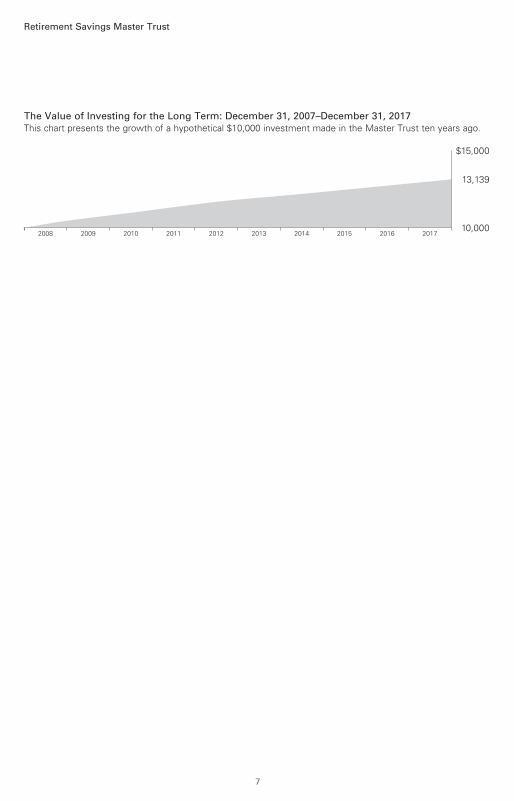
Average Annualized Returns Final Value Periods Ended December 31, 2017 of a $10,000 One Year Five Years Ten Years Investment3
VRST Master Trust1 2.07% 2.13% 2.77% $13,139
Stable Value Funds Average2 1.96 1.81 2.48 12,775
1 Returns are gross of investment management fees and net of contract fees.
2 Source: Hueler Analytics Stable Value Pooled Fund Universe. This is an equal-weighted total return average across all participating funds in the Hueler Universe and is net of contract fees and gross of stable value management fees. Hueler’s data are copyrighted and are not for reproduction or redistribution.
3 Growth from January 1, 2008, through December 31, 2017.
Note: See Financial Highlights table for income information for the Master Trust for the past five years. For Vanguard Retirement Savings Trust unitholders, see the Financial Highlights in the insert for income information for the past five years.
6
Retirement Savings Master Trust
The Value of Investing for the Long Term: December 31, 2007–December 31, 2017This chart presents the growth of a hypothetical $10,000 investment made in the Master Trust ten years ago.
2017201620152014201320122011201020092008
$15,000
10,000
13,139
7

Retirement Savings Master Trust
Financial Statements
Schedule of InvestmentsAs of December 31, 2017
This Statement provides a detailed listing of the Trust’s holdings, including each contract’s value on the last day of the reporting period. Investments are grouped and subtotaled by type of investment (traditional contracts issued by insurance companies and banks, synthetic investment contracts, and short-term investments). The net value of other assets and liabilities is added to the value of Total Investments to calculate the Trust’s Net Assets.
Investment Contracts (96.6%)
Traditional Contracts Issued by Insurance Companies and Banks (3.6%)
Metropolitan Life Insurance Co. AA-/Aa3 1.910% 7/6/18 122,265 (268) 121,997 Metropolitan Life Insurance Co. AA-/Aa3 1.910% 7/6/18 5,991 (13) 5,978 Metropolitan Life Insurance Co. AA-/Aa3 2.200% 12/14/18 50,328 (277) 50,051 Metropolitan Life Insurance Co. AA-/Aa3 1.910% 9/27/19 102,679 (271) 102,408 Metropolitan Life Insurance Co. AA-/Aa3 2.170% 4/17/20 23,528 (180) 23,348 Metropolitan Life Insurance Co. AA-/Aa3 2.200% 8/17/20 101,704 (890) 100,814 New York Life Insurance Co. AA+/Aaa 1.690% 12/17/18 40,026 (30) 39,996 New York Life Insurance Co. AA+/Aaa 2.250% 11/16/20 107,824 (883) 106,941 New York Life Insurance Co. AA+/Aaa 2.050% 10/12/21 128,727 (624) 128,103
Total Traditional Contracts Issued by Insurance Companies and Banks 683,072 (3,436) 679,636
Wrap Investments Contracts Adjustment Issuer Rating: at Fair at Fair to Contract Contract S&P/Moody’s Interest Value Value Value Value• (unaudited) Rate ($000) ($000) ($000) ($000)
Synthetic Investment Contracts (93.0%)
American General Life Insurance Co. (8.3%) A+/A2 2.250%2
Vanguard Institutional Intermediate-Term Bond Fund3 1,035,119 — (216) 1,034,903
Vanguard Institutional Short-Term Bond Fund3 542,765 — (114) 542,651
JPMorgan Chase Bank (12.1%) A+/Aa3 2.510%2 Vanguard Institutional
Intermediate-Term Bond Fund3 1,487,944 — (11,156) 1,476,788 Vanguard Institutional Short-Term
Bond Fund3 837,101 — (6,276) 830,825
Metropolitan Life Insurance Co. (9.3%) AA-/Aa3 2.240%2 The Metropolitan Life Separate
Account Trust4 807,193 (162) 952 807,983 The Metropolitan Life Short
Separate Account Trust4 962,695 (193) 1,135 963,637
Investments Adjustment Issuer Rating: at Fair to Contract Contract S&P/Moody’s Interest Maturity Value Value Value• VRST Master Trust (unaudited) Rate Date1 ($000) ($000) ($000)
8

Retirement Savings Master Trust
Nationwide Life (6.8%) A+/A1 2.330%2 Vanguard Institutional
Intermediate-Term Bond Fund3 838,358 — (2,865) 835,493 Vanguard Institutional Short-Term
Bond Fund3 471,214 — (1,611) 469,603 New York Life Insurance Co. (4.4%) AA+/Aaa 2.550%2 The New York Life Trust Company
Vanguard Synthetic GIC Collective Investment Trust5 850,368 — (2,174) 848,194
Prudential (14.7%) AA-/A1 2.450%2 Vanguard Institutional
Intermediate-Term Bond Fund3 2,256,331 — (19,644) 2,236,687 Vanguard Institutional Short-Term
Bond Fund3 567,593 — (4,941) 562,652
State Street Bank & Trust (14.1%) AA-/Aa3 2.470%2 Vanguard Institutional
Intermediate-Term Bond Fund3 1,951,878 — (11,638) 1,940,240 Vanguard Institutional Short-Term
Bond Fund3 763,731 — (4,554) 759,177
Transamerica Premier Life (14.4%) AA-/A1 2.320%2 Vanguard Institutional
Intermediate-Term Bond Fund3 1,587,531 — (3,753) 1,583,778 Vanguard Institutional Short-Term
Bond Fund3 1,167,517 — (2,760) 1,164,757
United of Omaha (8.9%) AA-/A1 2.420%2 Vanguard Institutional
Intermediate-Term Bond Fund3 1,162,253 — (5,732) 1,156,521 Vanguard Institutional Short-Term
Bond Fund3 545,962 — (2,693) 543,269
Total Synthetic Investment Contracts 17,835,553 (355) (78,040) 17,757,158
Total Investment Contracts 18,518,625 (355) (81,476) 18,436,794
Wrap Investments Contracts Adjustment Issuer Rating: at Fair at Fair to Contract Contract S&P/Moody’s Interest Value Value Value Value• (unaudited) Rate ($000) ($000) ($000) ($000)
9

Retirement Savings Master Trust
Short-Term Investments (3.2%)
Vanguard Federal Money Market Fund—Investor Shares6 AA/Aa1 1.220% 630,111 — — 630,111
Total Investments (99.8%) 19,148,736 (355) (81,476) 19,066,905
Other Assets and Liabilities—Net (0.2%) 15,577
Net Assets (100%) 19,082,482
• See Note A in Notes to Financial Statements.
1 The maturity date for an investment contract represents the date when either the entire contract matures or the final portion of the contract matures.
2 The interest rate will change quarterly (but will not fall below zero) based upon the performance of the underlying investment portfolio. The contract has no stated maturity date. The contract can be terminated by either party after providing 60 days’ notice.
3 The underlying investment portfolio is composed of corporate bonds, asset-backed/commercial mortgage-backed securities, U.S. Treasury securities, government-agency securities, and is managed by Vanguard Fixed Income Group. Also considered an affiliated company of the Trust as the issuer is a member of The Vanguard Group.
4 The underlying investment portfolio is composed of corporate bonds, asset-backed/commercial mortgage-backed securities, U.S. Treasury securities, government-agency securities, and is managed by Vanguard Fixed Income Group.
5 The underlying investment portfolio is composed of corporate bonds, asset-backed/commercial mortgage-backed securities, U.S. Treasury securities, government-agency securities, and is managed by New York Life Investment Management LLC.
6 Considered an affiliated company of the Trust as the issuer is a member of The Vanguard Group. Rate shown is the 7-day yield.
See accompanying Notes, which are an integral part of the Financial Statements.
Wrap Investments Contracts Adjustment Issuer Rating: at Fair at Fair to Contract Contract S&P/Moody’s Interest Value Value Value Value• (unaudited) Rate ($000) ($000) ($000) ($000)
10
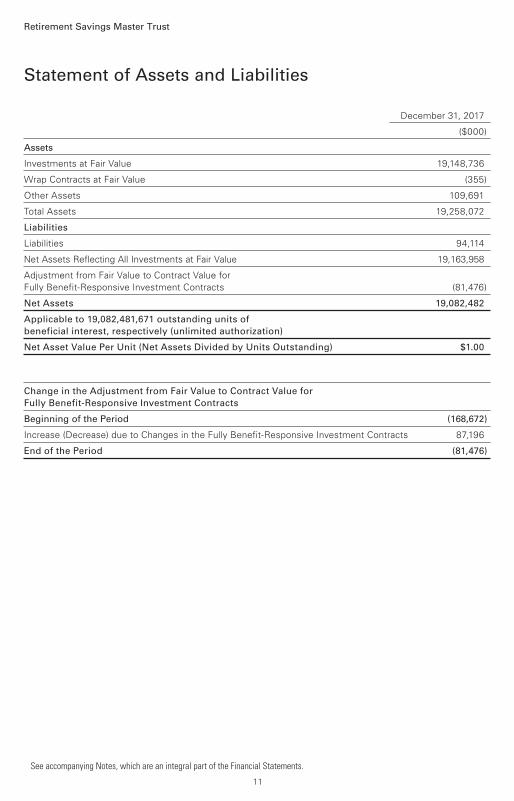
Statement of Assets and Liabilities
Retirement Savings Master Trust
See accompanying Notes, which are an integral part of the Financial Statements.
December 31, 2017
($000)
Assets
Investments at Fair Value 19,148,736
Wrap Contracts at Fair Value (355)
Other Assets 109,691
Total Assets 19,258,072
Liabilities
Liabilities 94,114
Net Assets Reflecting All Investments at Fair Value 19,163,958
Adjustment from Fair Value to Contract Value for Fully Benefit-Responsive Investment Contracts (81,476)
Net Assets 19,082,482
Applicable to 19,082,481,671 outstanding units of beneficial interest, respectively (unlimited authorization)
Net Asset Value Per Unit (Net Assets Divided by Units Outstanding) $1.00
Change in the Adjustment from Fair Value to Contract Value for Fully Benefit-Responsive Investment Contracts
Beginning of the Period (168,672)
Increase (Decrease) due to Changes in the Fully Benefit-Responsive Investment Contracts 87,196
End of the Period (81,476)
11

Statement of Operations and Changes in Net Assets
Retirement Savings Master Trust
See accompanying Notes, which are an integral part of the Financial Statements.
Year Ended December 31, 2017
($000)
Operations
Income
Interest 431,502
Dividends1 6,725
Total Income 438,227
Expenses
Wrap Fee 38,847
Investment Management Fee 1,614
Total Expenses—Note C 40,461
Net Investment Income 397,766
Distributions to Unitholder Trusts
Total Distributions (397,766)
Transactions with Unitholder Trusts (at $1.00 per unit)
Contributions 6,964,465
Contributions from Reinvestment of Distributions 369,041
Withdrawals (8,332,397)
Net Increase (Decrease) in Net Assets (998,891)
Net Assets
Beginning of Period 20,081,373
End of Period 19,082,482
1 All dividend income is from an affiliated company of the Trust.
12

For a Unit Outstanding Year Ended December 31,
Throughout Each Period 2017 2016 2015 2014 2013
Net Asset Value, Beginning of Period $1.00 $1.00 $1.00 $1.00 $1.00
Investment Activities
Net Investment Income .021 .022 .022 .021 .020
Total from Investment Operations .021 .022 .022 .021 .020
Distributions
Net Investment Income (.021) (.022) (.022) (.021) (.020)
Total Distributions (.021) (.022) (.022) (.021) (.020)
Net Asset Value, End of Period $1.00 $1.00 $1.00 $1.00 $1.00
Total Return 2.07% 2.18% 2.21% 2.14% 2.05%
Ratios/Supplemental Data
Net Assets, End of Period (Millions) $19,082 $20,081 $18,032 $17,066 $17,951
Ratio of Total Expenses to Average Net Assets—Note C 0.21% 0.21% 0.22% 0.23% 0.22%
Ratio of Net Investment Income to Average Net Assets 2.03% 2.13% 2.17% 2.10% 2.01%
Average Yield Earned by Trust1 2.31% 2.22% 2.29% 2.30% 1.98%
Average Yield Earned by Trust Paid to Participants2 1.97% 1.87% 1.92% 1.89% 1.56%
1 The average yield earned by the Trust (which may differ from the interest rate credited to participants in the Trust). This average yield is calculated by dividing the annualized earnings of all investments in the Trust on the last day of the fiscal year (irrespective of the interest rate credited to participants in the Trust) by the fair value of all investments in the Trust. This yield is a requirement under GAAP (see Notes to Financial Statements).
2 The average yield earned by the Trust with an adjustment to reflect the actual interest rate credited to participants in the Trust. This average yield is calculated by dividing the annualized earnings credited to participants on the last day of the fiscal year (irrespective of the actual earnings of the investments in the Trust) by the fair value of all investments in the Trust. This yield is a requirement under GAAP (see Notes to Financial Statements).
Financial Highlights
See accompanying Notes, which are an integral part of the Financial Statements.
Retirement Savings Master Trust
13

Notes to Financial Statements
Retirement Savings Master Trust
Vanguard Retirement Savings Master Trust (the “Trust”) is a collective investment trust established on July 1, 2001, under Section 404 of the Pennsylvania Banking Code. The Trust provides for the collective investment of assets of tax-exempt pension and profit-sharing plans, primarily in a pool of investment contracts that are issued by insurance companies and commercial banks and in contracts that are backed by bond funds and trusts that are selected by the Trustee, Vanguard Fiduciary Trust Company. The issuers’ ability to meet these obligations may be affected by economic developments in their respective companies and industries.
A. The following significant accounting policies conform to generally accepted accounting principles (GAAP) for U.S. Investment Companies. The Trust consistently follows such accounting policies when preparing its financial statements.
1. Security Valuation: Investments held by the Trust are required to be reported at fair value. However, contract value is the relevant measurement attribute for that portion of the net assets of the Trust attributable to fully benefit-responsive investment contracts, because contract value is the amount participants would receive if they were to initiate permitted transactions under the terms of the underlying defined-contribution plans. The accompanying Schedule of Investments reflects both the fair value and the adjustment to contract value for each investment contract deemed fully benefit-responsive. The Statement of Assets and Liabilities presents the fair value of the investment contracts as well as the adjustment of the fully benefit-responsive investment contracts from fair value to contract value. The Statement of Operations and Changes in Net Assets are prepared on a contract value basis.
Traditional investment contracts issued by insurance companies and banks are nontransferable, but provide for benefit-responsive withdrawals by plan participants at contract value. For traditional investment contracts, fair value comprises the expected future cash flows for each contract discounted to present value. Contract value represents contributions made plus interest accrued at the contract rate, less withdrawals. The crediting rate on traditional contracts is typically fixed for the life of the investment.
Synthetic investment contracts consist of investments together with contracts under which a bank or other institution provides for benefit-responsive withdrawals by plan participants at contract value. For synthetic investment contracts, the fair value comprises the aggregate market values of the underlying investments in bond trusts, and the value of the wrap contracts, if any. The difference between valuation at contract value and fair value is reflected over time through the crediting rate formula provided for in the Trust’s synthetic contracts. The crediting rate of the contract resets every quarter based on the performance of the underlying investment portfolio. To the extent that the Trust has unrealized gains and losses (that are accounted for, under contract value accounting, through the value of the synthetic contract), the interest crediting rate may differ from then-current market rates. An investor currently redeeming Trust units may forego a benefit, or avoid a loss, related to a future crediting rate different from then-current market rates.
Investments in mutual funds and bond trusts are valued at the net asset value of each fund or trust determined as of the close of the New York Stock Exchange (generally 4 p.m., Eastern time) on the valuation date.
2. Federal Income Taxes: The Internal Revenue Service has determined that the Trust qualifies as a group trust arrangement that is exempt from federal income tax under Section 501(a) of the Internal Revenue Code. Accordingly, no provision for federal income taxes is required in the financial statements.
14

Retirement Savings Master Trust
3. Income and Distributions: Dividend income represents income from a Vanguard money market fund that is an affiliate of the Trust; such income is accrued daily. Interest income is calculated and accrued daily using the daily deposit balance in the respective investment contract at the crediting rate of the contract. Distributions of net investment income to unitholders are declared daily and reinvested monthly.
4. Limitations on Contract Value Transactions: The existence of certain conditions can limit the Trust’s ability to transact at contract value with issuers of its investment contracts. Specifically, any event outside the normal operation of the Trust that causes a withdrawal from an investment contract may result in a negative market value adjustment with respect to the withdrawal. Examples of such events include, but are not limited to, partial or complete legal termination of the Trust or a unitholder, tax disqualification of the Trust or unitholder, and certain Trust amendments if issuers’ consent is not obtained. As of December 31, 2017, the occurrence of an event outside the normal operation of the Trust that would cause a withdrawal from an investment contract is not considered to be probable.
In general, issuers may terminate the contract and settle at other than contract value if there is a change in the qualification status of a participant, employer, or plan; a breach of material obligations under the contract and misrepresentation by the contract holder; or failure of the underlying portfolio to conform to the preestablished investment guidelines.
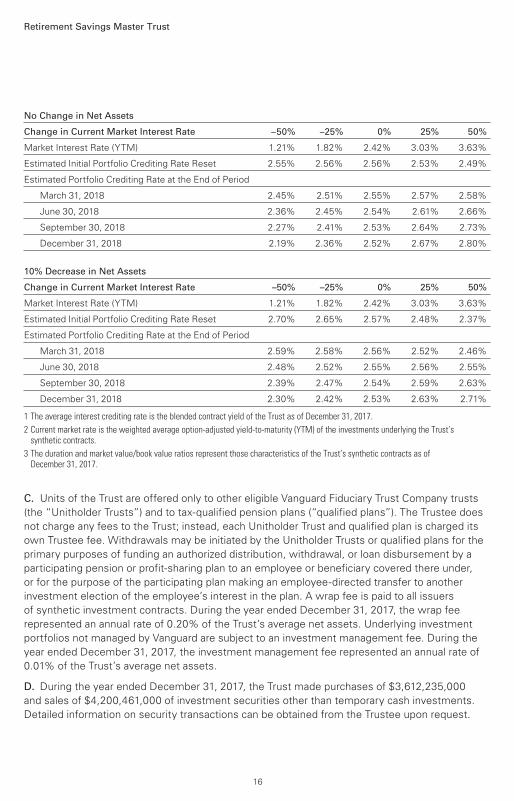
B. Sensitivity Analysis: The following analysis is intended to provide the likely reaction of the Trust’s crediting rate to various changes in current yield, both with static and a decrease in net assets. This analysis is required by GAAP and is for illustrative purposes only. It reflects the sensitivity to the rate reset process currently employed for the synthetic investment contracts in the Trust, which represent approximately 93% of the Trust’s net assets. The crediting rate on the Trust and total returns actually achieved by investors in the future may vary significantly due to market, plan and cash flow events.
Average Interest Crediting Rate1 2.36%
Current Market Interest Rate2 2.42%
Duration3 3.30
Market Value/Book Value Ratio3 100.44%
15
Retirement Savings Master Trust
No Change in Net Assets
Change in Current Market Interest Rate –50% –25% 0% 25% 50%
Market Interest Rate (YTM) 1.21% 1.82% 2.42% 3.03% 3.63%
Estimated Initial Portfolio Crediting Rate Reset 2.55% 2.56% 2.56% 2.53% 2.49%
Estimated Portfolio Crediting Rate at the End of Period
March 31, 2018 2.45% 2.51% 2.55% 2.57% 2.58%
June 30, 2018 2.36% 2.45% 2.54% 2.61% 2.66%
September 30, 2018 2.27% 2.41% 2.53% 2.64% 2.73%
December 31, 2018 2.19% 2.36% 2.52% 2.67% 2.80%
10% Decrease in Net Assets
Change in Current Market Interest Rate –50% –25% 0% 25% 50%
Market Interest Rate (YTM) 1.21% 1.82% 2.42% 3.03% 3.63%
Estimated Initial Portfolio Crediting Rate Reset 2.70% 2.65% 2.57% 2.48% 2.37%
Estimated Portfolio Crediting Rate at the End of Period
March 31, 2018 2.59% 2.58% 2.56% 2.52% 2.46%
June 30, 2018 2.48% 2.52% 2.55% 2.56% 2.55%
September 30, 2018 2.39% 2.47% 2.54% 2.59% 2.63%
December 31, 2018 2.30% 2.42% 2.53% 2.63% 2.71%
1 The average interest crediting rate is the blended contract yield of the Trust as of December 31, 2017.
2 Current market rate is the weighted average option-adjusted yield-to-maturity (YTM) of the investments underlying the Trust’s synthetic contracts.
3 The duration and market value/book value ratios represent those characteristics of the Trust’s synthetic contracts as of December 31, 2017.
C. Units of the Trust are offered only to other eligible Vanguard Fiduciary Trust Company trusts (the “Unitholder Trusts”) and to tax-qualified pension plans (“qualified plans”). The Trustee does not charge any fees to the Trust; instead, each Unitholder Trust and qualified plan is charged its own Trustee fee. Withdrawals may be initiated by the Unitholder Trusts or qualified plans for the primary purposes of funding an authorized distribution, withdrawal, or loan disbursement by a participating pension or profit-sharing plan to an employee or beneficiary covered there under, or for the purpose of the participating plan making an employee-directed transfer to another investment election of the employee’s interest in the plan. A wrap fee is paid to all issuers of synthetic investment contracts. During the year ended December 31, 2017, the wrap fee represented an annual rate of 0.20% of the Trust’s average net assets. Underlying investment portfolios not managed by Vanguard are subject to an investment management fee. During the year ended December 31, 2017, the investment management fee represented an annual rate of 0.01% of the Trust’s average net assets.
D. During the year ended December 31, 2017, the Trust made purchases of $3,612,235,000 and sales of $4,200,461,000 of investment securities other than temporary cash investments. Detailed information on security transactions can be obtained from the Trustee upon request.
16

Retirement Savings Master Trust
E. Various inputs may be used to determine the value of the Trust’s investments. These inputs are summarized in three broad levels for financial statement purposes. The inputs or methodologies used to value securities are not necessarily an indication of the risk associated with investing in those securities.
Level 1—Quoted prices in active markets for identical securities. Level 2—Other significant observable inputs (including quoted prices for similar securities, interest rates, prepayment speeds, credit risk, etc.). Level 3—Significant unobservable inputs (including the Trust’s own assumptions used to determine the fair value of investments).
The following table summarizes the Trust’s investments as of December 31, 2017, based on the inputs used to value them:
Level 1 Level 2 Level 3 Investments at Fair Value ($000) ($000) ($000)
Traditional Investment Contracts — 683,072 —
Synthetic Investment Contracts — 17,835,553 —
Wrap Contracts — (355) —
Short-Term Investments 630,111 — —
Total 630,111 18,518,270 —
F. Management has determined that no material events or transactions occurred subsequent to April 11, 2018, that would require recognition or disclosure in these financial statements.
17
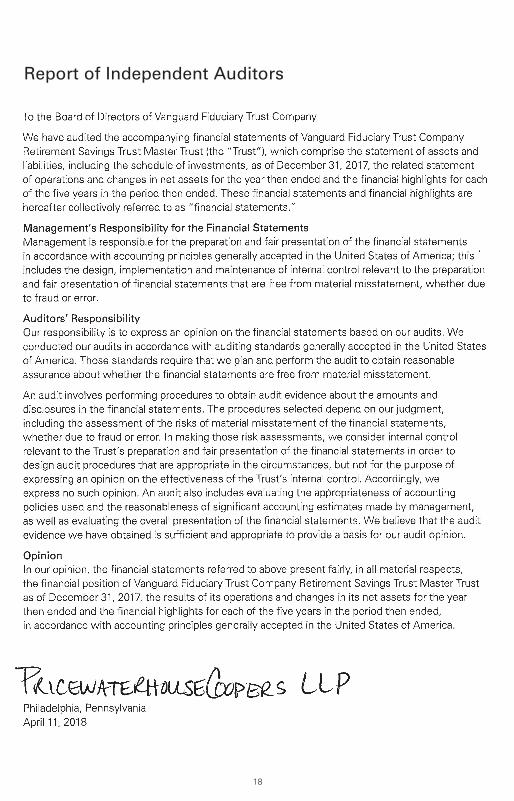
Report of Independent Auditors
18

Average Duration. An estimate of how much a bond’s price will fluctuate in response to a change in interest rates. To see how the price could shift, multiply the bond’s duration by the change in rates. If interest rates rise by 1 percentage point, the price of a bond with a duration of five years would decline by about 5%. If rates decrease by a percentage point, the bond’s price would rise by 5%. The Master Trust’s average duration is reported for all bond and cash investments held by the Master Trust. The Master Trust’s price will not change due to changing interest rates, because all bond investments are held within contracts.
Average Credit Quality. An indicator of credit risk, this figure is the average of the credit ratings assigned to the Master Trust’s holdings by credit-rating agencies. Agencies assign credit ratings after appraising an issuer’s ability to meet its obligations. Quality is graded on a scale, with Aaa indicating the most creditworthy issuers.
Cash Investments. The percentage of the Master Trust’s net assets invested in “cash equivalents”—highly liquid, short-term, interest-bearing instruments.
Distribution of Investments. An indicator of principal risk. In general, the higher the concentration in alternative contracts, the smaller the Master Trust’s average exposure to any single investment’s performance and the more likely the Master Trust as a whole will maintain a stable principal value.
Gross Spot Yield. The weighted average contract yield as of the report date, gross of stable value management and contract fees.
MV/BV Ratio. The ratio of the market value of the bonds and/or bond funds backing synthetic investment contracts relative to the book value of the contracts. Contracts provide for the payment of participant benefits at book value under normal circumstances. When this ratio is less than 100%, the occurrence of an event or condition that is outside the normal operation of the plan (for example, layoffs, plan amendments, sale of a division, or participant withdrawals due to a plan sponsor’s insolvency or bankruptcy), if adequate notice has not been provided to Vanguard, could cause participant benefits to be paid at less than book value.
Synthetic Investment Contracts. Individually negotiated investments, these contracts are supported by a portfolio of high-quality fixed income assets and mutual funds as well as the financial strength of the issuing financial institution. Returns earned on the contracts vary with the performance of the underlying fixed income assets and mutual funds. These assets back the contract and are owned by the trustee (for example, Vanguard Fiduciary Trust Company) on behalf of the Master Trust. These contracts are also called “alternative investment contracts.”
Traditional Investment Contracts. Individually negotiated investments, the terms of which specify liquidity, yield, interest payments, and maturity (return of principal). These contracts are direct obligations of the issuing companies and are backed only by the financial strength of those companies.
Glossary
19

Vanguard Retirement Savings Master Trust is a collective investment fund for tax-qualified pension and profit-sharing plan assets; it is not a mutual fund. The Trust seeks to provide participants with an attractive rate of interest and safety of principal by investing in investment contracts issued by financial institutions and in contracts that are backed by high-quality bonds and bond mutual funds owned by the Trustee on behalf of the Trust. The principal and interest of these contracts are not guaranteed by the federal government or The Vanguard Group. It is Vanguard’s expectation that each unit of the Trust will maintain a constant net asset value of $1. However, there is no assurance that this will be the case.
The Trustee for the program is Vanguard Fiduciary Trust Company, a wholly owned subsidiary of The Vanguard Group, Inc., organized and existing under the banking laws of the Commonwealth of Pennsylvania. Investment and administrative services are provided to the Trust by Vanguard Fixed Income Group.
Vanguard Retirement Savings Master Trust
Directors of Vanguard Fiduciary Trust Company
F. William McNabb IIIChairman, President, and Chief Executive Officer
Mortimer J. BuckleySenior Vice President
Martha G. KingSenior Vice President
Chris D. McIsaacSenior Vice President
Thomas M. RampullaSenior Vice President
Karin A. RisiSenior Vice President
Anne RobinsonSenior Vice President and General Counsel
Michael RollingsSenior Vice President
P.O. Box 2600Valley Forge, PA 19482-2600
Connect with Vanguard® > vanguard.com
Participant Services > 800-523-1188 CFA® is a registered trademark owned by CFA Institute.
All comparative stable value fund data are from
Hueler Analytics Stable Value Pooled Fund Universe,
unless otherwise noted.
© 2018 The Vanguard Group, Inc. All rights reserved.
Q340 042018

Vanguard® Retirement Savings TrustAs of December 31, 2017
This section includes the Trust’s financial statements.
Contents
Statement of Net Assets 1
Statement of Operations and Changes in Net Assets 2
Financial Highlights 3
Notes to Financial Statements 4
Report of Independent Auditors 6
1
Financial Statements
These statements should be read in conjunction with the financial statements of Vanguard Retirement Savings Master Trust, which appear in the accompanying report.
Statement of Net AssetsAs of December 31, 2017
This Statement shows the Trust’s investment in the Vanguard Retirement Savings Master Trust (VRST Master Trust). Other assets are added to, and liabilities are subtracted from, the value of Total Investments to calculate the Trust’s Net Assets.
Fair Value• Units ($000)
Investments (100%)
VRST Master Trust 2,730,034,147 2,730,034
Total Investments 2,730,034
Other Assets and Liabilities
Other Assets 25,802Liabilities (25,802)
—
Net Assets (100%)
Applicable to 2,730,034,147 outstanding units of beneficial interest (unlimited authorization) 2,730,034
Net Asset Value Per Unit $1.00
• See Note A in Notes to Financial Statements.
See accompanying Notes, which are an integral part of the Financial Statements.
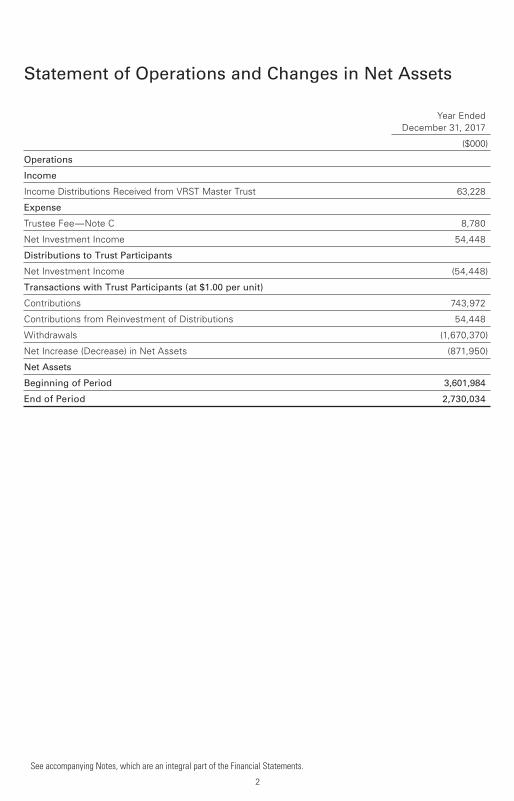
Statement of Operations and Changes in Net Assets
See accompanying Notes, which are an integral part of the Financial Statements.
Year Ended December 31, 2017
($000)
Operations
Income
Income Distributions Received from VRST Master Trust 63,228
Expense
Trustee Fee—Note C 8,780
Net Investment Income 54,448
Distributions to Trust Participants
Net Investment Income (54,448)
Transactions with Trust Participants (at $1.00 per unit)
Contributions 743,972
Contributions from Reinvestment of Distributions 54,448
Withdrawals (1,670,370)
Net Increase (Decrease) in Net Assets (871,950)
Net Assets
Beginning of Period 3,601,984
End of Period 2,730,034
2
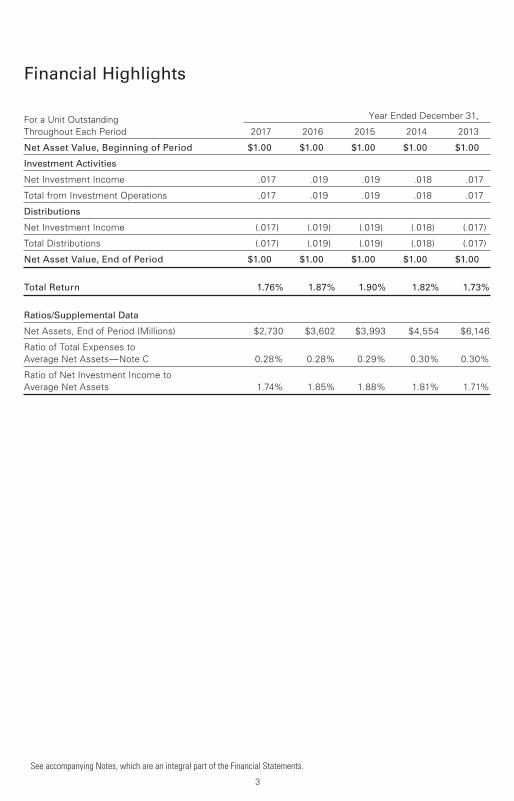
For a Unit Outstanding Year Ended December 31,
Throughout Each Period 2017 2016 2015 2014 2013
Net Asset Value, Beginning of Period $1.00 $1.00 $1.00 $1.00 $1.00
Investment Activities
Net Investment Income .017 .019 .019 .018 .017
Total from Investment Operations .017 .019 .019 .018 .017
Distributions
Net Investment Income (.017) (.019) (.019) (.018) (.017)
Total Distributions (.017) (.019) (.019) (.018) (.017)
Net Asset Value, End of Period $1.00 $1.00 $1.00 $1.00 $1.00
Total Return 1.76% 1.87% 1.90% 1.82% 1.73%
Ratios/Supplemental Data
Net Assets, End of Period (Millions) $2,730 $3,602 $3,993 $4,554 $6,146
Ratio of Total Expenses to Average Net Assets—Note C 0.28% 0.28% 0.29% 0.30% 0.30%
Ratio of Net Investment Income to Average Net Assets 1.74% 1.85% 1.88% 1.81% 1.71%
Financial Highlights
See accompanying Notes, which are an integral part of the Financial Statements.
3
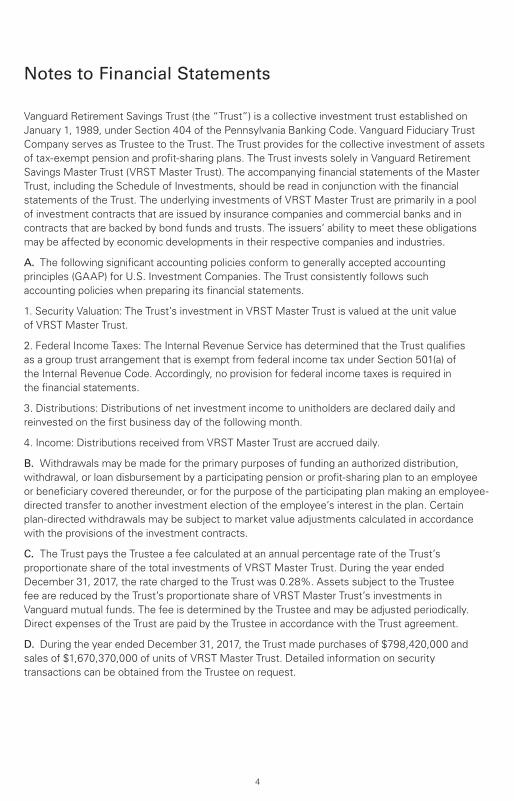
Notes to Financial Statements
Vanguard Retirement Savings Trust (the “Trust”) is a collective investment trust established on January 1, 1989, under Section 404 of the Pennsylvania Banking Code. Vanguard Fiduciary Trust Company serves as Trustee to the Trust. The Trust provides for the collective investment of assets of tax-exempt pension and profit-sharing plans. The Trust invests solely in Vanguard Retirement Savings Master Trust (VRST Master Trust). The accompanying financial statements of the Master Trust, including the Schedule of Investments, should be read in conjunction with the financial statements of the Trust. The underlying investments of VRST Master Trust are primarily in a pool of investment contracts that are issued by insurance companies and commercial banks and in contracts that are backed by bond funds and trusts. The issuers’ ability to meet these obligations may be affected by economic developments in their respective companies and industries.
A. The following significant accounting policies conform to generally accepted accounting principles (GAAP) for U.S. Investment Companies. The Trust consistently follows such accounting policies when preparing its financial statements.
1. Security Valuation: The Trust’s investment in VRST Master Trust is valued at the unit value of VRST Master Trust.
2. Federal Income Taxes: The Internal Revenue Service has determined that the Trust qualifies as a group trust arrangement that is exempt from federal income tax under Section 501(a) of the Internal Revenue Code. Accordingly, no provision for federal income taxes is required in the financial statements.
3. Distributions: Distributions of net investment income to unitholders are declared daily and reinvested on the first business day of the following month.
4. Income: Distributions received from VRST Master Trust are accrued daily.
B. Withdrawals may be made for the primary purposes of funding an authorized distribution, withdrawal, or loan disbursement by a participating pension or profit-sharing plan to an employee or beneficiary covered thereunder, or for the purpose of the participating plan making an employee-directed transfer to another investment election of the employee’s interest in the plan. Certain plan-directed withdrawals may be subject to market value adjustments calculated in accordance with the provisions of the investment contracts.
C. The Trust pays the Trustee a fee calculated at an annual percentage rate of the Trust’s proportionate share of the total investments of VRST Master Trust. During the year ended December 31, 2017, the rate charged to the Trust was 0.28%. Assets subject to the Trustee fee are reduced by the Trust’s proportionate share of VRST Master Trust’s investments in Vanguard mutual funds. The fee is determined by the Trustee and may be adjusted periodically. Direct expenses of the Trust are paid by the Trustee in accordance with the Trust agreement.
D. During the year ended December 31, 2017, the Trust made purchases of $798,420,000 and sales of $1,670,370,000 of units of VRST Master Trust. Detailed information on security transactions can be obtained from the Trustee on request.
4

E. Various inputs may be used to determine the value of the Trust’s investments. These inputs are summarized in three broad levels for financial statement purposes. The inputs or methodologies used to value securities are not necessarily an indication of the risk associated with investing in those securities.
Level 1—Quoted prices in active markets for identical securities. Level 2—Other significant observable inputs (including quoted prices for similar securities, interest rates, prepayment speeds, credit risk, etc.). Level 3—Significant unobservable inputs (including the Trust’s own assumptions used to determine the fair value of investments).
At December 31, 2017, the Trust’s sole investment was in VRST Master Trust, which was valued based on Level 2 inputs.
F. Management has determined that no material events or transactions occurred subsequent to April 11, 2018, that would require recognition or disclosure in these financial statements.
5
This page intentionally left blank.
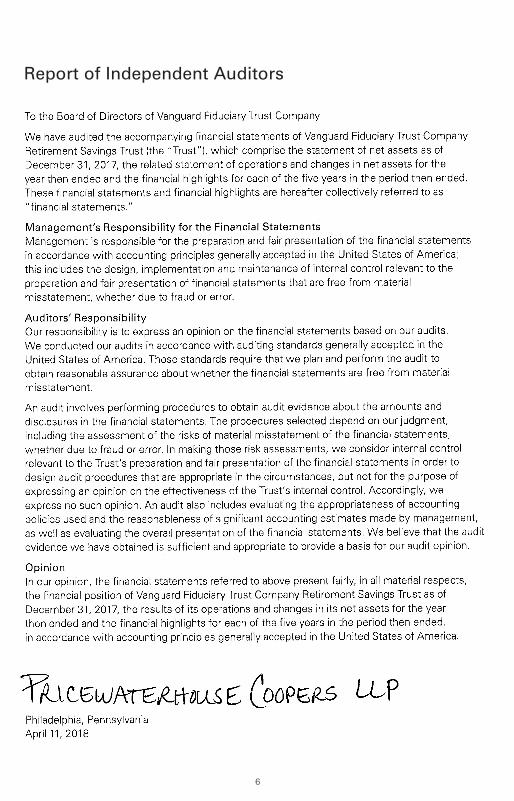
Report of Independent Auditors
6

© 2018 The Vanguard Group, Inc. All rights reserved.
F340 042018