vanguard tax-managed funds annual report december 31, 2020
TRANSCRIPT

Annual Report | December 31, 2020
VanguardTax-Managed Funds®
Vanguard Tax-Managed Balanced Fund
Vanguard Tax-Managed Capital Appreciation Fund
Vanguard Tax-Managed Small-Cap Fund

Contents
Your Fund’s Performance at a Glance. . . . . . . . . . . . . . . 1
About Your Fund’s Expenses . . . . . . . . . . . . . . . . . . . . . . . 2
Tax-Managed Balanced Fund . . . . . . . . . . . . . . . . . . . . . . . 4
Tax-Managed Capital Appreciation Fund . . . . . . . . . . . . 83
Tax-Managed Small-Cap Fund . . . . . . . . . . . . . . . . . . . . . .106
Please note: The opinions expressed in this report are just that—informed opinions. They should not be considered promisesor advice. Also, please keep in mind that the information and opinions cover the period through the date on the front of thisreport. Of course, the risks of investing in your fund are spelled out in the prospectus.

• For the 12 months ended December 31, 2020, returns for the Vanguard Tax-ManagedFunds ranged from 11.05% for Admiral Shares in the Vanguard Tax-Managed Small-CapFund to 21.08% for Institutional Shares in the Vanguard Tax-Managed CapitalAppreciation Fund.
• TheTax-Managed Small-Cap Fund and theTax-Managed Capital Appreciation Fundperformed in line with their benchmark indexes. Vanguard Tax-Managed Balanced Fundslightly trailed its benchmark index.
• The fiscal year was marked by the global spread of COVID-19 and efforts to containit. Responses from policymakers, the creation and initial distribution of vaccines, andthe easing of some restrictions lifted investor sentiment, and stock markets hit highs inDecember. After an initial period of high volatility and low liquidity in the bond markets,yields fell and prices rose amid unprecedented actions taken by governments andcentral banks to blunt the virus’s economic impact.
• Growth stocks outperformed value stocks for the 12 months, whilelarge-capitalization stocks led mid- and small-caps. The broad U.S. stock market, asmeasured by the CRSP USTotal Market Index, returned 20.99%.
• The municipal bond market, as measured by the Bloomberg Barclays 1–15YearMunicipal Bond Index, returned 4.73%. Municipal bonds make up about half theBalanced Fund’s assets.
Market Barometer
Average Annual Total ReturnsPeriods Ended December 31, 2020
One Year Three Years Five Years
Stocks
Russell 1000 Index (Large-caps) 20.96% 14.82% 15.60%
Russell 2000 Index (Small-caps) 19.96 10.25 13.26
Russell 3000 Index (Broad U.S. market) 20.89 14.49 15.43
FTSE All-World ex US Index (International) 11.22 5.18 9.16
Bonds
Bloomberg Barclays U.S. Aggregate Bond Index(Broad taxable market) 7.51% 5.34% 4.44%
Bloomberg Barclays Municipal Bond Index(Broad tax-exempt market) 5.21 4.64 3.91
FTSE Three-Month U.S. Treasury Bill Index 0.58 1.56 1.16
CPI
Consumer Price Index 1.36% 1.85% 1.95%
Your Fund’s Performance at a Glance
1

As a shareholder of the fund, you incur ongoing costs, which include costs for portfolio
management, administrative services, and shareholder reports (like this one), among others.
Operating expenses, which are deducted from a fund’s gross income, directly reduce the
investment return of the fund.
A fund‘s expenses are expressed as a percentage of its average net assets. This figure is known
as the expense ratio. The following examples are intended to help you understand the ongoing
costs (in dollars) of investing in your fund and to compare these costs with those of other mutual
funds. The examples are based on an investment of $1,000 made at the beginning of the period
shown and held for the entire period.
The accompanying table illustrates your fund’s costs in two ways:
• Based on actual fund return.This section helps you to estimate the actual expenses that you
paid over the period. The ”Ending Account Value“ shown is derived from the fund’s actual return,
and the third column shows the dollar amount that would have been paid by an investor who
started with $1,000 in the fund. You may use the information here, together with the amount you
invested, to estimate the expenses that you paid over the period.
To do so, simply divide your account value by $1,000 (for example, an $8,600 account value
divided by $1,000 = 8.6), then multiply the result by the number given for your fund under the
heading ”Expenses Paid During Period.”
• Based on hypothetical 5% yearly return.This section is intended to help you compare your
fund‘s costs with those of other mutual funds. It assumes that the fund had a yearly return of 5%
before expenses, but that the expense ratio is unchanged. In this case—because the return used
is not the fund’s actual return—the results do not apply to your investment. The example is useful
in making comparisons because the Securities and Exchange Commission requires all mutual
funds to calculate expenses based on a 5% return. You can assess your fund’s costs by comparing
this hypothetical example with the hypothetical examples that appear in shareholder reports of
other funds.
Note that the expenses shown in the table are meant to highlight and help you compare ongoingcosts only and do not reflect transaction costs incurred by the fund for buying and selling
securities. Further, the expenses do not include any purchase, redemption, or account service fees
described in the fund prospectus. If such fees were applied to your account, your costs would be
higher. Your fund does not carry a “sales load.”
The calculations assume no shares were bought or sold during the period. Your actual costs may
have been higher or lower, depending on the amount of your investment and the timing of any
purchases or redemptions.
You can find more information about the fund’s expenses, including annual expense ratios, in the
Financial Statements section of this report. For additional information on operating expenses and
other shareholder costs, please refer to your fund’s current prospectus.
About Your Fund’s Expenses
2

Six Months Ended December 31, 2020Beginning
Account Value6/30/2020
EndingAccount Value
12/31/2020
ExpensesPaid During
Period
Based on Actual Fund Return
Tax-Managed Balanced Fund $1,000.00 $1,130.70 $0.48
Tax-Managed Capital Appreciation Fund
AdmiralTM Shares $1,000.00 $1,243.10 $0.51
Institutional Shares 1,000.00 1,243.00 0.34
Tax-Managed Small-Cap Fund
Admiral Shares $1,000.00 $1,351.10 $0.53
Institutional Shares 1,000.00 1,351.20 0.35
Based on Hypothetical 5% Yearly Return
Tax-Managed Balanced Fund $1,000.00 $1,024.68 $0.46
Tax-Managed Capital Appreciation Fund
Admiral Shares $1,000.00 $1,024.68 $0.46
Institutional Shares 1,000.00 1,024.84 0.31
Tax-Managed Small-Cap Fund
Admiral Shares $1,000.00 $1,024.68 $0.46
Institutional Shares 1,000.00 1,024.84 0.31
The calculations are based on expenses incurred in the most recent six-month period. The funds’ annualized six-month expense ratios forthat period are: for the Tax-Managed Balanced Fund, 0.09%; for the Tax-Managed Capital Appreciation Fund, 0.09% for Admiral Sharesand 0.06% for Institutional Shares; and for the Tax-Managed Small-Cap Fund, 0.09% for Admiral Shares and 0.06% for InstitutionalShares. The dollar amounts shown as “Expenses Paid” are equal to the annualized expense ratio multiplied by the average account valueover the period, multiplied by the number of days in the most recent six-month period, then divided by the number of days in the mostrecent 12-month period (184/366).
3

All of the returns in this report represent past performance, which is not a guarantee offuture results that may be achieved by the fund. (Current performance may be lower orhigher than the performance data cited. For performance data current to the most recentmonth-end, visit our website at vanguard.com/performance.) Note, too, that bothinvestment returns and principal value can fluctuate widely, so an investor’s shares, whensold, could be worth more or less than their original cost.The returns shown do not reflecttaxes that a shareholder would pay on fund distributions or on the sale of fund shares.
Cumulative Performance: December 31, 2010,Through December 31, 2020Initial Investment of $10,000
$44,000
6,000
23,660
2020201920182017201620152014201320122011
Average Annual Total ReturnsPeriods Ended December 31, 2020
OneYear
FiveYears
TenYears
Final Valueof a $10,000Investment
Tax-Managed Balanced Fund 13.30% 9.48% 8.99% $23,660
Tax-Managed Balanced Composite Index 14.15 9.83 9.23 24,182
Bloomberg Barclays Municipal Bond Index 5.21 3.91 4.63 15,718
Dow Jones U.S. Total Stock Market FloatAdjusted Index 20.79 15.36 13.74 36,240
Tax-Managed Balanced Composite Index: Weighted 50% Russell 1000 Index and 50% Bloomberg Barclays 7 Year Municipal Bond Indexthrough January 31, 2002, and 50% Russell 1000 Index and 50% Bloomberg Barclays 1–15 Year Municipal Bond Index thereafter.
Tax-Managed Balanced Fund
Performance Summary
See Financial Highlights for dividend and capital gains information.
4

Investment Exposure
Basic Materials 0.8%
Consumer Discretionary 8.5
Consumer Staples 2.4
Energy 1.0
Financials 5.0
Health Care 6.2
Industrials 6.9
Other 1.0
Real Estate 1.4
Technology 13.3
Telecommunications 1.6
Utilities 1.3
Tax-Exempt Municipal Bonds 50.6
The table reflects the fund’s investments, except for short-terminvestments and derivatives. Sector categories are based on theIndustry Classification Benchmark (“ICB”), except for the “Other”category (if applicable), which includes securities that have notbeen provided an ICB classification as of the effective reportingperiod.
The Industry Classification Benchmark (“ICB”) is owned by FTSE. FTSE does not accept any liability to any person for anyloss or damage arising out of any error or omission in the ICB.
Tax-Managed Balanced Fund
Fund AllocationAs of December 31, 2020
5

The fund files its complete schedule of portfolio holdings with the Securities and ExchangeCommission (SEC) for the first and third quarters of each fiscal year as an exhibit to its reports onForm N-PORT. The fund’s Form N-PORT reports are available on the SEC’s website atwww.sec.gov.
Shares
MarketValue•
($000)
Common Stocks (49.0%)
Basic Materials (0.8%)Linde plc 52,529 13,842Ecolab Inc. 32,303 6,989Air Products andChemicals Inc. 19,099 5,218
Newmont Corp. 79,841 4,782Freeport-McMoRan Inc. 141,389 3,679Element Solutions Inc. 128,571 2,279Dow Inc. 36,222 2,010Celanese Corp. Class A 14,628 1,901
* Alcoa Corp. 70,034 1,614Albemarle Corp. 10,400 1,534FMC Corp. 9,098 1,046Fastenal Co. 21,246 1,037Scotts Miracle-Gro Co. 4,442 885Reliance Steel &Aluminum Co. 6,900 826
Westlake Chemical Corp. 9,894 807Eastman Chemical Co. 7,819 784Avery Dennison Corp. 4,600 713Huntsman Corp. 27,900 701International Flavors &Fragrances Inc. 6,430 700
CF IndustriesHoldings Inc. 16,859 653
Royal Gold Inc. 6,100 649Nucor Corp. 11,200 596LyondellBasell IndustriesNV Class A 5,638 517
Ashland GlobalHoldings Inc. 6,198 491
Timken Co. 5,841 452NewMarket Corp. 1,129 450Mosaic Co. 18,068 416Valvoline Inc. 17,015 394
* Univar Solutions Inc. 19,164 364W R Grace & Co. 6,600 362Steel Dynamics Inc. 4,100 151
56,842Consumer Discretionary (8.4%)* Amazon.com Inc. 41,128 133,951
Shares
MarketValue•
($000)
* Tesla Inc. 65,015 45,879* Walt Disney Co. 178,123 32,272
Home Depot Inc. 104,969 27,882* Netflix Inc. 42,251 22,846
Walmart Inc. 136,623 19,694NIKE Inc. Class B 135,111 19,114CostcoWholesale Corp. 46,842 17,649McDonald's Corp. 62,436 13,398Lowe's Cos. Inc. 79,663 12,787Starbucks Corp. 113,970 12,193Estee Lauder Cos. Inc.Class A 33,569 8,936
* Booking Holdings Inc. 3,778 8,415Target Corp. 41,325 7,295TJX Cos. Inc. 106,628 7,282Activision Blizzard Inc. 69,615 6,464
* Lululemon Athletica Inc. 15,881 5,527Dollar General Corp. 25,991 5,466
* Chipotle Mexican Grill Inc.Class A 3,292 4,565
* Copart Inc. 35,413 4,506* Uber Technologies Inc. 86,204 4,396
Ross Stores Inc. 35,144 4,316* O'Reilly Automotive Inc. 9,503 4,301* Spotify Technology SA 13,409 4,219* Under Armour Inc. Class A 225,100 3,865
Aptiv plc 29,624 3,860Marriott International Inc.Class A 27,645 3,647
eBay Inc. 70,733 3,554Yum! Brands Inc. 31,728 3,444HiltonWorldwideHoldings Inc. 30,445 3,387
Electronic Arts Inc. 23,473 3,371General Motors Co. 76,101 3,169
* AutoZone Inc. 2,594 3,075Lennar Corp. Class A 39,160 2,985
* Dollar Tree Inc. 27,452 2,966* Mohawk Industries Inc. 19,372 2,730
Southwest Airlines Co. 56,166 2,618DR Horton Inc. 37,302 2,571
* Capri Holdings Ltd. 59,100 2,482
Tax-Managed Balanced Fund
Financial Statements
Schedule of InvestmentsAs of December 31, 2020
6

Shares
MarketValue•
($000)
* CarMax Inc. 26,265 2,481* NVR Inc. 569 2,321* Norwegian Cruise Line
Holdings Ltd. 88,700 2,256VF Corp. 26,400 2,255Best Buy Co. Inc. 21,906 2,186Delta Air Lines Inc. 53,900 2,167
* Wayfair Inc. Class A 9,168 2,070Yum China Holdings Inc. 35,756 2,041
* Burlington Stores Inc. 7,603 1,989* Etsy Inc. 10,995 1,956
MGM ResortsInternational 57,046 1,798
Tractor Supply Co. 12,514 1,759Fortune Brands Home &Security Inc. 20,487 1,756
* Madison Square GardenEntertainment Corp. 16,620 1,746
* Take-Two InteractiveSoftware Inc. 8,365 1,738
* Trade Desk Inc. Class A 2,169 1,737Advance Auto Parts Inc. 10,965 1,727
* Ulta Beauty Inc. 5,996 1,722Lear Corp. 10,522 1,673
* Live NationEntertainment Inc. 22,245 1,635
Domino's Pizza Inc. 4,261 1,634* United Airlines
Holdings Inc. 37,444 1,619* Lyft Inc. Class A 32,900 1,616* JetBlue Airways Corp. 104,908 1,525
Expedia Group Inc. 11,209 1,484Sirius XM Holdings Inc. 219,780 1,400Gentex Corp. 39,660 1,346PVH Corp. 14,290 1,342
* Under Armour Inc. Class C 89,592 1,333Ford Motor Co. 150,000 1,318AMERCO 2,887 1,311
* LKQ Corp. 36,460 1,285* Floor & Decor
Holdings Inc. Class A 13,773 1,279* Skechers U.S.A. Inc.
Class A 33,688 1,211* IAA Inc. 17,878 1,162* AutoNation Inc. 16,312 1,138
News Corp. Class A 62,267 1,119PulteGroup Inc. 25,300 1,091Garmin Ltd. 8,970 1,073Qurate Retail Inc. Class A 91,418 1,003
* Tempur SealyInternational Inc. 37,140 1,003
Toll Brothers Inc. 22,801 991American AirlinesGroup Inc. 61,900 976
Service Corp. International 19,876 976* Carvana Co. Class A 4,031 966
Shares
MarketValue•
($000)
* Liberty MediaCorp.-Liberty FormulaOne Class C 21,777 928
* Five Below Inc. 5,244 918Rollins Inc. 23,436 916
* frontdoor Inc. 17,660 887* Ollie's Bargain Outlet
Holdings Inc. 10,849 887Thor Industries Inc. 9,533 886ViacomCBS Inc. Class B 22,673 845
* Terminix GlobalHoldings Inc. 16,325 833
Dolby Laboratories Inc.Class A 8,275 804
Tiffany & Co. 6,075 799* Lions Gate Entertainment
Corp. Class A 67,000 762Williams-Sonoma Inc. 7,089 722
* Discovery Inc. Class C 26,958 706BorgWarner Inc. 17,234 666Royal Caribbean CruisesLtd. 8,832 660
* Planet Fitness Inc. Class A 8,000 621Whirlpool Corp. 3,182 574ViacomCBS Inc. Class A 15,073 570
* Liberty MediaCorp.-Liberty SiriusXMClass A 12,657 547
Wendy's Co. 24,919 546Carter's Inc. 5,600 527
* TripAdvisor Inc. 17,991 518Aramark 13,199 508Carnival Corp. 23,400 507
* Madison Square GardenSports Corp. 2,748 506
Dick's Sporting Goods Inc. 8,512 478Wynn Resorts Ltd. 4,200 474New York Times Co.Class A 8,914 461
Pool Corp. 1,184 441Vail Resorts Inc. 1,300 363Fox Corp. Class B 12,100 349
* Grand CanyonEducation Inc. 3,737 348
Lennar Corp. Class B 5,464 334Ralph Lauren Corp.Class A 3,073 319
* Zynga Inc. Class A 32,100 317Hyatt Hotels Corp. Class A 4,248 315
* 2U Inc. 7,800 312* Bright Horizons Family
Solutions Inc. 1,766 305* Mattel Inc. 15,775 275
Graham Holdings Co.Class B 400 213
Tax-Managed Balanced Fund
7

Shares
MarketValue•
($000)
* Liberty MediaCorp.-Liberty FormulaOne Class A 5,563 211
Foot Locker Inc. 3,866 156Hasbro Inc. 1,600 150Columbia Sportswear Co. 1,683 147Copa Holdings SA Class A 1,462 113Darden Restaurants Inc. 880 105Hanesbrands Inc. 6,700 98Nexstar Media Group Inc.Class A 800 87
Wyndham Hotels &Resorts Inc. 1,038 62
* Airbnb Inc. Class A 419 62Choice HotelsInternational Inc. 444 47
575,476Consumer Staples (2.4%)
Procter & Gamble Co. 240,351 33,442PepsiCo Inc. 132,297 19,620Coca-Cola Co. 344,600 18,898MondelezInternational Inc. Class A 148,388 8,676
CVS Health Corp. 117,445 8,021* Monster Beverage Corp. 65,123 6,023
Colgate-Palmolive Co. 59,637 5,100Philip MorrisInternational Inc. 58,903 4,877
Constellation Brands Inc.Class A 18,326 4,014
Kimberly-Clark Corp. 28,821 3,886Corteva Inc. 75,255 2,914Sysco Corp. 38,967 2,894McCormick & Co. Inc.(Non-Voting) 30,070 2,875
General Mills Inc. 48,414 2,847McKesson Corp. 15,695 2,730Church & Dwight Co. Inc. 30,778 2,685Archer-Daniels-MidlandCo. 51,573 2,600
Clorox Co. 12,303 2,484Brown-Forman Corp.Class B 30,438 2,418
Kroger Co. 68,647 2,180Hershey Co. 14,203 2,164Tyson Foods Inc. Class A 30,613 1,973
* Herbalife Nutrition Ltd. 40,333 1,938Altria Group Inc. 37,080 1,520J M Smucker Co. 11,951 1,381AmerisourceBergen Corp.Class A 14,106 1,379
Conagra Brands Inc. 38,018 1,378* Hain Celestial Group Inc. 31,228 1,254
Walgreens BootsAlliance Inc. 28,118 1,121
Hormel Foods Corp. 22,584 1,053
Shares
MarketValue•
($000)
* Post Holdings Inc. 9,905 1,000LambWestonHoldings Inc. 12,659 997
* US Foods Holding Corp. 27,376 912Brown-Forman Corp.Class A 10,274 755
Kellogg Co. 10,900 678* Sprouts Farmers
Market Inc. 33,705 677* TreeHouse Foods Inc. 15,069 640* Beyond Meat Inc. 4,942 618
Casey's GeneralStores Inc. 3,314 592
Keurig Dr Pepper Inc. 18,093 579Ingredion Inc. 6,341 499
* Grocery Outlet HoldingCorp. 11,400 447
Energizer Holdings Inc. 9,717 410Reynolds ConsumerProducts Inc. 12,100 363
Campbell Soup Co. 7,400 358Kraft Heinz Co. 8,459 293Seaboard Corp. 93 282Molson Coors BeverageCo. Class B 4,300 194
164,639Energy (1.0%)
Chevron Corp. 162,408 13,715Exxon Mobil Corp. 237,905 9,806ConocoPhillips 84,912 3,396
* WPX Energy Inc. 394,316 3,214Phillips 66 31,975 2,236EOG Resources Inc. 41,056 2,048Marathon Petroleum Corp. 48,458 2,004Schlumberger NV 90,000 1,965ContinentalResources Inc. 119,715 1,951
* Cheniere Energy Inc. 31,747 1,906Pioneer Natural ResourcesCo. 15,691 1,787
* First Solar Inc. 17,966 1,777Halliburton Co. 87,730 1,658Valero Energy Corp. 28,900 1,635Occidental PetroleumCorp. 88,690 1,535
* ChampionX Corp. 99,308 1,519Marathon Oil Corp. 225,300 1,503Diamondback Energy Inc. 29,914 1,448Hess Corp. 25,949 1,370Kinder Morgan Inc. 92,547 1,265Baker Hughes Co. Class A 53,447 1,114Concho Resources Inc. 16,184 944EQT Corp. 72,232 918Murphy Oil Corp. 73,000 883Williams Cos. Inc. 35,300 708
* Range Resources Corp. 99,510 667
Tax-Managed Balanced Fund
8

Shares
MarketValue•
($000)
Cabot Oil & Gas Corp. 40,790 664National Oilwell Varco Inc. 28,200 387Cimarex Energy Co. 9,486 356Targa Resources Corp. 12,000 317Apache Corp. 20,000 284HollyFrontier Corp. 10,792 279Devon Energy Corp. 10,554 167Helmerich & Payne Inc. 3,200 74
65,500Financials (5.0%)* Berkshire Hathaway Inc.
Class B 194,565 45,114JPMorgan Chase & Co. 293,654 37,315Bank of America Corp. 797,988 24,187Citigroup Inc. 188,000 11,592Morgan Stanley 142,641 9,775Wells Fargo & Co. 302,559 9,131S&P Global Inc. 26,017 8,553Goldman Sachs Group Inc. 31,593 8,331BlackRock Inc. 10,561 7,620Charles Schwab Corp. 122,499 6,497Progressive Corp. 64,645 6,392Chubb Ltd. 39,599 6,095Aon plc Class A 27,728 5,858Marsh & McLennan Cos.Inc. 49,821 5,829
IntercontinentalExchange Inc. 50,126 5,779
* SVB Financial Group 14,756 5,723PNC Financial ServicesGroup Inc. 37,095 5,527
MFA Financial Inc. 1,400,283 5,447Truist Financial Corp. 109,424 5,245US Bancorp 110,423 5,145Moody's Corp. 16,498 4,788First Republic Bank 30,426 4,470CME Group Inc. 24,318 4,427IHS Markit Ltd. 44,814 4,026
* Lemonade Inc. 32,800 4,018Sterling Bancorp 220,858 3,971MSCI Inc. Class A 8,302 3,707Allstate Corp. 28,622 3,146Pinnacle FinancialPartners Inc. 48,700 3,136
Bank of New York MellonCorp. 67,629 2,870
Travelers Cos. Inc. 20,181 2,833Aflac Inc. 59,074 2,627MetLife Inc. 50,516 2,372Willis TowersWatson plc 11,000 2,317
* Arch Capital Group Ltd. 63,827 2,302* Rocket Cos. Inc. Class A 111,600 2,257* Markel Corp. 2,130 2,201
Discover FinancialServices 23,903 2,164
State Street Corp. 26,969 1,963
Shares
MarketValue•
($000)
First CitizensBancShares Inc. Class A 3,400 1,953
Ameriprise Financial Inc. 9,883 1,921* Brighthouse Financial Inc. 52,982 1,918
T. Rowe Price Group Inc. 12,074 1,828American InternationalGroup Inc. 44,900 1,700
FactSet ResearchSystems Inc. 4,736 1,575
MarketAxessHoldings Inc. 2,731 1,558
Hartford Financial ServicesGroup Inc. 31,442 1,540
Globe Life Inc. 15,679 1,489Fifth Third Bancorp 50,575 1,394Assured Guaranty Ltd. 43,927 1,383Arthur J Gallagher & Co. 10,997 1,360Alleghany Corp. 2,233 1,348Reinsurance Group ofAmerica Inc. 11,595 1,344
Zions Bancorp NA 30,699 1,334Voya Financial Inc. 22,512 1,324W R Berkley Corp. 19,249 1,279Ally Financial Inc. 35,254 1,257Brown & Brown Inc. 26,238 1,244EastWest Bancorp Inc. 23,855 1,210Wintrust Financial Corp. 19,700 1,203Raymond JamesFinancial Inc. 11,434 1,094
Regions Financial Corp. 66,902 1,078Nasdaq Inc. 8,023 1,065Broadridge FinancialSolutions Inc. 6,831 1,047
RenaissanceRe HoldingsLtd. 6,293 1,044
KeyCorp 57,018 936* GoHealth Inc. Class A 68,400 934
Lincoln National Corp. 18,195 915Prudential Financial Inc. 11,212 875Citizens FinancialGroup Inc. 23,643 845
CommerceBancshares Inc. 12,342 811
Hanover InsuranceGroup Inc. 6,939 811
Assurant Inc. 5,942 809* Credit Acceptance Corp. 2,161 748
Cboe Global Markets Inc. 7,925 738Northern Trust Corp. 6,972 649Everest Re Group Ltd. 2,700 632Cincinnati Financial Corp. 7,091 620Popular Inc. 10,841 611M&T Bank Corp. 4,600 586SEI Investments Co. 9,913 570
* Athene Holding Ltd.Class A 13,120 566
Western Alliance Bancorp 9,230 553
Tax-Managed Balanced Fund
9

Shares
MarketValue•
($000)
TCF Financial Corp. 14,251 528Jefferies FinancialGroup Inc. 21,416 527
Santander Consumer USAHoldings Inc. 23,585 519
White MountainsInsurance Group Ltd. 498 498
MGIC Investment Corp. 35,128 441Morningstar Inc. 1,882 436Associated Banc-Corp 24,527 418LPL FinancialHoldings Inc. 4,000 417
CNA Financial Corp. 8,693 339Kemper Corp. 4,002 307Signature Bank 2,248 304Primerica Inc. 2,200 295BOK Financial Corp. 4,040 277Interactive BrokersGroup Inc. Class A 4,420 269
* LendingTree Inc. 900 246Equitable Holdings Inc. 9,264 237Erie Indemnity Co. Class A 872 214Synovus Financial Corp. 6,525 211OneMain Holdings Inc. 4,339 209Bank OZK 6,200 194Unum Group 6,127 141American FinancialGroup Inc. 972 85
SLM Corp. 6,800 84First Horizon Corp. 3,430 44Franklin Resources Inc. 1,525 38Prosperity Bancshares Inc. 487 34Affiliated ManagersGroup Inc. 184 19
Axis Capital Holdings Ltd. 100 5
341,785Health Care (6.1%)
UnitedHealth Group Inc. 93,984 32,958Johnson & Johnson 206,714 32,533Thermo FisherScientific Inc. 42,487 19,790
Merck & Co. Inc. 236,250 19,325Pfizer Inc. 508,307 18,711Abbott Laboratories 164,134 17,971Danaher Corp. 65,315 14,509Medtronic plc 122,867 14,393Eli Lilly & Co. 82,098 13,861AbbVie Inc. 121,396 13,008Amgen Inc. 52,569 12,087
* Intuitive Surgical Inc. 12,578 10,290Zoetis Inc. 52,768 8,733Cigna Corp. 40,552 8,442Bristol-Myers Squibb Co. 134,884 8,367Stryker Corp. 30,849 7,559Anthem Inc. 23,239 7,462
* IDEXX Laboratories Inc. 12,149 6,073
Shares
MarketValue•
($000)
* Edwards LifesciencesCorp. 66,235 6,043
Humana Inc. 13,882 5,695* Vertex
Pharmaceuticals Inc. 23,758 5,615Becton Dickinson & Co. 21,512 5,383
* Illumina Inc. 14,310 5,295Gilead Sciences Inc. 82,302 4,795HCA Healthcare Inc. 27,941 4,595
* Align Technology Inc. 8,178 4,370* Boston Scientific Corp. 119,673 4,302* IQVIA Holdings Inc. 23,886 4,280* Biogen Inc. 17,376 4,255* Regeneron
Pharmaceuticals Inc. 8,203 3,963Baxter International Inc. 47,400 3,803Agilent Technologies Inc. 29,707 3,520
* Laboratory Corp. ofAmerica Holdings 16,697 3,399
* AlexionPharmaceuticals Inc. 20,349 3,179
* Catalent Inc. 27,491 2,861* Veeva Systems Inc.
Class A 10,433 2,840Zimmer BiometHoldings Inc. 18,070 2,784
* DexCom Inc. 7,279 2,691* SageTherapeutics Inc. 30,100 2,604* Centene Corp. 43,172 2,592* Varian Medical
Systems Inc. 14,448 2,529* Moderna Inc. 24,203 2,528
ResMed Inc. 11,300 2,402* Hologic Inc. 29,853 2,174* Acadia Healthcare Co. Inc. 43,032 2,163* Charles River Laboratories
International Inc. 8,059 2,014* DaVita Inc. 17,119 2,010* Exact Sciences Corp. 14,418 1,910
PerkinElmer Inc. 13,223 1,897* Seagen Inc. 10,763 1,885* Bio-Rad Laboratories Inc.
Class A 3,202 1,867Cooper Cos. Inc. 5,136 1,866Teleflex Inc. 3,932 1,618
* Incyte Corp. 17,669 1,537Bio-Techne Corp. 4,831 1,534Quest Diagnostics Inc. 12,819 1,528
* Elanco Animal Health Inc. 49,626 1,522* Molina Healthcare Inc. 7,010 1,491* ABIOMED Inc. 4,438 1,439* Reata
Pharmaceuticals Inc.Class A 11,000 1,360
* Masimo Corp. 4,949 1,328* Jazz Pharmaceuticals plc 8,039 1,327
Tax-Managed Balanced Fund
10

Shares
MarketValue•
($000)
* HorizonTherapeutics plc 17,602 1,288Universal HealthServices Inc. Class B 9,109 1,252
* QIAGEN NV 23,457 1,240West PharmaceuticalServices Inc. 4,202 1,190
* Viatris Inc. 63,070 1,182* Envista Holdings Corp. 34,520 1,164
Cerner Corp. 14,193 1,114* Sarepta Therapeutics Inc. 6,283 1,071* BioMarin
Pharmaceutical Inc. 11,883 1,042* Alnylam
Pharmaceuticals Inc. 7,820 1,016DENTSPLY SIRONA Inc. 18,983 994
* Insulet Corp. 3,622 926* Ionis Pharmaceuticals Inc. 15,847 896
Chemed Corp. 1,615 860Hill-Rom Holdings Inc. 8,722 854
* Alkermes plc 41,100 820* Neurocrine
Biosciences Inc. 8,264 792* Penumbra Inc. 4,163 728* Iovance
Biotherapeutics Inc. 13,500 626STERIS plc 3,159 599
* PPD Inc. 16,500 565* Exelixis Inc. 27,903 560* Teladoc Health Inc. 2,500 500* Nektar Therapeutics
Class A 29,132 495Perrigo Co. plc 10,778 482
* PRA Health Sciences Inc. 3,678 461Premier Inc. Class A 12,944 454Cardinal Health Inc. 8,345 447
* UnitedTherapeutics Corp. 2,593 394* Adaptive Biotechnologies
Corp. 6,500 384* Global Blood
Therapeutics Inc. 8,800 381* Guardant Health Inc. 2,538 327* Avantor Inc. 10,252 289* Agios
Pharmaceuticals Inc. 6,300 273* ACADIA
Pharmaceuticals Inc. 4,500 241* Integra LifeSciences
Holdings Corp. 3,189 207Encompass Health Corp. 2,416 200Bruker Corp. 1,500 81
* ICU Medical Inc. 200 43* GoodRx Holdings Inc.
Class A 74 3
421,306Industrials (6.9%)
Visa Inc. Class A 165,796 36,265
Shares
MarketValue•
($000)
Mastercard Inc. Class A 87,886 31,370* PayPal Holdings Inc. 126,894 29,719
Accenture plc Class A 58,776 15,353HoneywellInternational Inc. 69,897 14,867
Union Pacific Corp. 64,936 13,521Boeing Co. 49,709 10,6413M Co. 50,985 8,912United Parcel Service Inc.Class B 52,034 8,763
Deere & Co. 32,002 8,610* Square Inc. Class A 39,008 8,490
RaytheonTechnologiesCorp. 117,533 8,405
Caterpillar Inc. 45,524 8,286* Fiserv Inc. 71,839 8,180
Fidelity NationalInformation Services Inc. 56,184 7,948
Lockheed Martin Corp. 21,823 7,747American Express Co. 63,198 7,641General Electric Co. 672,438 7,262CSX Corp. 79,922 7,253Sherwin-Williams Co. 9,714 7,139Capital One FinancialCorp. 72,192 7,136
Global Payments Inc. 32,231 6,943Norfolk Southern Corp. 24,666 5,861AMETEK Inc. 46,011 5,565Automatic DataProcessing Inc. 31,334 5,521
Illinois ToolWorks Inc. 26,375 5,377FedEx Corp. 19,930 5,174Northrop Grumman Corp. 13,851 4,221
* TransDigm Group Inc. 6,285 3,889Eaton Corp. plc 31,645 3,802Emerson Electric Co. 47,090 3,785Vulcan Materials Co. 25,110 3,724Cintas Corp. 10,373 3,666
* Mettler-ToledoInternational Inc. 3,121 3,557
Ball Corp. 37,125 3,459PPG Industries Inc. 22,949 3,310Fortive Corp. 45,701 3,237TraneTechnologies plc 21,310 3,093Martin MariettaMaterials Inc. 10,626 3,017
Howmet Aerospace Inc. 105,166 3,001Carrier Global Corp. 74,958 2,827
* Keysight Technologies Inc. 21,308 2,815* United Rentals Inc. 12,074 2,800
Verisk Analytics Inc.Class A 13,447 2,791
Rockwell Automation Inc. 10,862 2,724* Middleby Corp. 20,834 2,686
Xylem Inc. 25,125 2,557Parker-Hannifin Corp. 9,302 2,534
Tax-Managed Balanced Fund
11

Shares
MarketValue•
($000)
OtisWorldwide Corp. 37,479 2,532Equifax Inc. 12,823 2,473PACCAR Inc. 28,448 2,455
* Berry Global Group Inc. 43,393 2,438* TeledyneTechnologies Inc. 6,144 2,408* Crown Holdings Inc. 23,861 2,391* Ingersoll Rand Inc. 48,482 2,209* Zebra Technologies Corp.
Class A 5,716 2,197Quanta Services Inc. 30,093 2,167
* FleetCor Technologies Inc. 7,915 2,159Stanley Black &Decker Inc. 11,796 2,106
IDEX Corp. 10,462 2,084General Dynamics Corp. 13,791 2,052
* Trimble Inc. 30,037 2,006HEICO Corp. Class A 17,003 1,990Cummins Inc. 8,721 1,981TransUnion 19,883 1,973
* Waters Corp. 7,833 1,938Eagle Materials Inc. 18,979 1,924Old Dominion FreightLine Inc. 9,621 1,878
* AECOM 35,745 1,779* Colfax Corp. 46,190 1,766
Textron Inc. 36,284 1,754Jacobs EngineeringGroup Inc. 15,658 1,706
Nordson Corp. 8,492 1,706Kansas City Southern 7,571 1,545Masco Corp. 26,716 1,468Synchrony Financial 41,089 1,426Allegion plc 12,151 1,414AGCO Corp. 13,710 1,413A O Smith Corp. 25,732 1,411ITT Inc. 18,189 1,401
* Kirby Corp. 27,000 1,399* XPO Logistics Inc. 11,342 1,352
Lennox International Inc. 4,681 1,282Toro Co. 13,011 1,234JB Hunt TransportServices Inc. 8,852 1,210
Carlisle Cos. Inc. 7,633 1,192MKS Instruments Inc. 7,915 1,191Cognex Corp. 14,825 1,190
* Sensata TechnologiesHolding plc 22,433 1,183
Johnson ControlsInternational plc 25,378 1,182
Dover Corp. 8,810 1,112Sealed Air Corp. 23,960 1,097WW Grainger Inc. 2,682 1,095Huntington IngallsIndustries Inc. 6,396 1,090
Oshkosh Corp. 12,558 1,081
Shares
MarketValue•
($000)
Packaging Corp. ofAmerica 7,444 1,027
Owens Corning 13,342 1,011Valmont Industries Inc. 5,396 944BWXTechnologies Inc. 14,202 856Landstar System Inc. 6,235 840DuPont de Nemours Inc. 11,449 814FLIR Systems Inc. 18,391 806RPM International Inc. 8,489 771AptarGroup Inc. 5,600 767
* Fair Isaac Corp. 1,440 736Silgan Holdings Inc. 18,967 703Air Lease Corp. Class A 15,591 693Donaldson Co. Inc. 12,229 683
* WEX Inc. 3,348 681Jack Henry &Associates Inc. 4,132 669
Booz Allen HamiltonHolding Corp. Class A 6,943 605
Knight-Swift TransportationHoldings Inc. 14,300 598
Regal Beloit Corp. 4,625 568* Axalta Coating Systems
Ltd. 19,616 560CoreLogic Inc. 6,976 539
* Gates Industrial Corp. plc 42,069 537Pentair plc 10,087 536Expeditors International ofWashington Inc. 5,586 531
* Vontier Corp. 15,680 524ArmstrongWorldIndustries Inc. 6,812 507
Trinity Industries Inc. 19,100 504CH RobinsonWorldwide Inc. 5,311 499
Genpact Ltd. 11,065 458Flowserve Corp. 12,288 453Lincoln ElectricHoldings Inc. 3,765 438
Littelfuse Inc. 1,673 426* Coherent Inc. 2,590 389* WESCO International Inc. 4,845 380
Snap-on Inc. 2,097 359Graco Inc. 4,912 355
* EuronetWorldwide Inc. 2,192 318Robert HalfInternational Inc. 5,000 312
Curtiss-Wright Corp. 2,405 280Brunswick Corp. 3,628 277Schneider National Inc.Class B 13,062 270
Graphic Packaging HoldingCo. 15,800 268
* Paylocity Holding Corp. 1,300 268MDU ResourcesGroup Inc. 9,950 262
nVent Electric plc 10,087 235
Tax-Managed Balanced Fund
12

Shares
MarketValue•
($000)
ADT Inc. 28,622 225ManpowerGroup Inc. 2,450 221
* Pluralsight Inc. Class A 9,843 206AllisonTransmissionHoldings Inc. 4,157 179
Hubbell Inc. Class B 1,100 172HEICO Corp. 1,087 144Alliance Data SystemsCorp. 1,600 119
* Virgin GalacticHoldings Inc. 4,000 95
471,102Other (1.0%)1 Vanguard Tax-Exempt
Bond Index ETF 1,244,530 68,686
Real Estate (1.3%)AmericanTower Corp. 45,198 10,145Prologis Inc. 84,344 8,406Equinix Inc. 9,349 6,677Crown Castle InternationalCorp. 41,238 6,565
SBA CommunicationsCorp. Class A 18,289 5,160
* CoStar Group Inc. 3,869 3,576Digital Realty Trust Inc. 24,538 3,423Public Storage 12,156 2,807
* Zillow Group Inc. Class C 18,791 2,439* CBRE Group Inc. Class A 38,001 2,383
American Homes 4 RentClass A 76,425 2,293
Equity Commonwealth 79,495 2,169Weyerhaeuser Co. 54,846 1,839Equity Residential 30,450 1,805
* Howard Hughes Corp. 22,500 1,776Welltower Inc. 26,763 1,729Alexandria Real EstateEquities Inc. 9,176 1,635
AvalonBayCommunities Inc. 9,828 1,577
Host Hotels & Resorts Inc. 106,999 1,565Extra Space Storage Inc. 13,300 1,541
* Jones Lang LaSalle Inc. 10,212 1,515Essex Property Trust Inc. 5,973 1,418Equity LifeStyleProperties Inc. 22,346 1,416
Invitation Homes Inc. 45,962 1,365Realty Income Corp. 20,900 1,299Mid-America ApartmentCommunities Inc. 9,294 1,177
Ventas Inc. 23,100 1,133Duke Realty Corp. 26,790 1,071Camden Property Trust 10,700 1,069Boston Properties Inc. 10,781 1,019Healthpeak Properties Inc. 30,867 933Empire State RealtyTrust Inc. Class A 96,000 895
Shares
MarketValue•
($000)
Sun Communities Inc. 4,596 698* Apartment Income REIT
Corp. 17,807 684Kilroy Realty Corp. 10,852 623Lamar Advertising Co.Class A 7,467 621
Douglas Emmett Inc. 20,790 607CyrusOne Inc. 7,600 556UDR Inc. 13,895 534
* Zillow Group Inc. Class A 3,647 496Rexford IndustrialRealty Inc. 10,000 491
CoreSite Realty Corp. 3,037 381SL Green Realty Corp. 6,259 373JBG SMITH Properties 11,505 360Americold Realty Trust 8,862 331VICI Properties Inc. 12,500 319First Industrial RealtyTrust Inc. 7,000 295
Federal Realty InvestmentTrust 3,019 257
Medical PropertiesTrust Inc. 10,779 235
* RealPage Inc. 2,488 217Cousins Properties Inc. 5,100 171Hudson PacificProperties Inc. 6,800 163
Rayonier Inc. 5,100 150Apartment Investment &Management Co.Class A 17,807 94
STORE Capital Corp. 1,277 43Life Storage Inc. 342 41American CampusCommunities Inc. 760 33
92,593Technology (13.2%)
Apple Inc. 1,574,409 208,909Microsoft Corp. 728,643 162,065
* Facebook Inc. Class A 237,076 64,760* Alphabet Inc. Class A 32,353 56,703* Alphabet Inc. Class C 25,264 44,260
NVIDIA Corp. 59,515 31,079* Adobe Inc. 49,218 24,615
Intel Corp. 386,436 19,252* salesforce.com Inc. 77,575 17,263
QUALCOMM Inc. 108,410 16,515Broadcom Inc. 32,749 14,339Texas Instruments Inc. 78,992 12,965Oracle Corp. 191,677 12,400
* ServiceNow Inc. 17,885 9,844* MicronTechnology Inc. 127,810 9,609
Intuit Inc. 25,152 9,554* Advanced Micro
Devices Inc. 103,623 9,503Applied Materials Inc. 90,715 7,829
Tax-Managed Balanced Fund
13

Shares
MarketValue•
($000)
* Autodesk Inc. 23,262 7,103Roper Technologies Inc. 14,570 6,281Lam Research Corp. 13,149 6,210International BusinessMachines Corp. 45,903 5,778
Analog Devices Inc. 33,550 4,956* Cadence Design
Systems Inc. 33,815 4,613* Workday Inc. Class A 18,747 4,492* Synopsys Inc. 17,230 4,467
Amphenol Corp. Class A 32,780 4,287* Twilio Inc. Class A 12,330 4,174* Match Group Inc. 27,592 4,172
Xilinx Inc. 28,929 4,101* Twitter Inc. 74,635 4,041
Cognizant TechnologySolutions Corp. Class A 48,018 3,935
* Zoom VideoCommunications Inc.Class A 10,400 3,508
* Okta Inc. 13,316 3,386* DocuSign Inc. Class A 14,425 3,207
Marvell Technology GroupLtd. 62,986 2,994
HP Inc. 119,671 2,943* Atlassian Corp. plc Class A 12,259 2,867
Microchip Technology Inc. 20,270 2,800* ANSYS Inc. 7,369 2,681* VeriSign Inc. 12,221 2,645
Skyworks Solutions Inc. 17,100 2,614* Splunk Inc. 14,814 2,517
Corning Inc. 68,131 2,453* Arista Networks Inc. 8,376 2,434
KLA Corp. 9,317 2,412* ON Semiconductor Corp. 72,209 2,363
Teradyne Inc. 19,532 2,342* Dell Technologies Inc.
Class C 28,164 2,064* Cree Inc. 18,851 1,996* RingCentral Inc. Class A 4,984 1,889* Qorvo Inc. 11,320 1,882* Black Knight Inc. 20,612 1,821* Fortinet Inc. 12,162 1,806* Akamai Technologies Inc. 17,101 1,795* Arrow Electronics Inc. 17,906 1,742* Paycom Software Inc. 3,751 1,696* GoDaddy Inc. Class A 19,883 1,649* NCR Corp. 42,803 1,608* IAC/InterActiveCorp 8,045 1,523* Palo Alto Networks Inc. 4,128 1,467
Hewlett PackardEnterprise Co. 120,529 1,428
* Ceridian HCM Holding Inc. 12,978 1,383* Gartner Inc. 8,596 1,377* VMware Inc. Class A 9,429 1,323
Shares
MarketValue•
($000)
* NuanceCommunications Inc. 29,403 1,296
Citrix Systems Inc. 9,859 1,283* PTC Inc. 10,669 1,276* Tyler Technologies Inc. 2,891 1,262* EPAM Systems Inc. 3,426 1,228* Coupa Software Inc. 3,519 1,193* F5 Networks Inc. 6,675 1,174* Pinterest Inc. Class A 17,800 1,173* IPG Photonics Corp. 5,229 1,170
CDW Corp. 8,857 1,167Western Digital Corp. 20,174 1,117
* MongoDB Inc. 2,994 1,075* Zendesk Inc. 7,476 1,070* Slack Technologies Inc.
Class A 24,300 1,026Universal Display Corp. 4,186 962
* Zscaler Inc. 4,818 962* Guidewire Software Inc. 7,046 907
Monolithic PowerSystems Inc. 2,200 806
* Manhattan Associates Inc. 6,606 695* Grubhub Inc. 9,200 683* Crowdstrike Holdings Inc.
Class A 3,100 657* Cerence Inc. 6,400 643* Pure Storage Inc. Class A 28,105 635
NetApp Inc. 8,971 594Leidos Holdings Inc. 5,350 562
* AspenTechnology Inc. 4,278 557* Elastic NV 3,518 514
NortonLifeLock Inc. 24,339 506SS&CTechnologiesHoldings Inc. 6,447 469
* Teradata Corp. 19,986 449* PagerDuty Inc. 10,708 447* SolarWinds Corp. 29,740 445* Nutanix Inc. Class A 11,790 376
Jabil Inc. 8,300 353* Dropbox Inc. Class A 15,760 350* HubSpot Inc. 820 325
Entegris Inc. 3,200 308* New Relic Inc. 4,500 294
DXCTechnology Co. 11,250 290* Avalara Inc. 1,751 289* Smartsheet Inc. Class A 3,300 229* Change Healthcare Inc. 12,066 225* Proofpoint Inc. 1,600 218* Dynatrace Inc. 4,970 215* CACI International Inc.
Class A 800 199Pegasystems Inc. 1,468 196
* Medallia Inc. 5,374 179Amdocs Ltd. 2,400 170
* Concentrix Corp. 1,700 168SYNNEX Corp. 1,700 138
Tax-Managed Balanced Fund
14

Shares
MarketValue•
($000)
* Alteryx Inc. Class A 1,112 135* FireEye Inc. 4,671 108
Xerox Holdings Corp. 4,318 100National InstrumentsCorp. 2,211 97
* Fastly Inc. Class A 900 79Avnet Inc. 600 21
* Palantir Technologies Inc.Class A 834 20
* Unity Software Inc. 116 18* Snowflake Inc. Class A 61 17* DoorDash Inc. Class A 50 7
CDK Global Inc. 3 —
905,816Telecommunications (1.6%)
Comcast Corp. Class A 445,383 23,338Cisco Systems Inc. 392,433 17,562VerizonCommunications Inc. 288,107 16,926
AT&T Inc. 454,423 13,069* Charter
Communications Inc.Class A 16,156 10,688
* T-Mobile US Inc. 62,892 8,481* Liberty Broadband Corp.
Class C 26,422 4,185* Roku Inc. 8,713 2,893
Motorola Solutions Inc. 15,378 2,615L3Harris Technologies Inc. 13,517 2,555
* Liberty Broadband Corp.Class A 12,998 2,048
* Altice USA Inc. Class A 37,314 1,413* DISH Network Corp.
Class A 32,192 1,041* Ciena Corp. 15,379 813* CommScope Holding Co.
Inc. 36,723 492Ubiquiti Inc. 1,484 413Telephone & DataSystems Inc. 14,435 268
Cable One Inc. 40 89
108,889Utilities (1.3%)
NextEra Energy Inc. 213,340 16,459Southern Co. 98,416 6,046
Shares
MarketValue•
($000)
AmericanWaterWorksCo. Inc. 36,290 5,569
Duke Energy Corp. 59,772 5,473Waste Management Inc. 33,651 3,968Dominion Energy Inc. 52,174 3,924American Electric PowerCo. Inc. 43,400 3,614
Sempra Energy 26,229 3,342Xcel Energy Inc. 50,071 3,338
* Clean Harbors Inc. 41,000 3,120Public Service EnterpriseGroup Inc. 47,759 2,784
Exelon Corp. 65,800 2,778WEC Energy Group Inc. 26,459 2,435Eversource Energy 24,487 2,118DTE Energy Co. 17,175 2,085Consolidated Edison Inc. 25,300 1,828CMS Energy Corp. 26,129 1,594Republic Services Inc.Class A 16,510 1,590
Edison International 25,217 1,584Essential Utilities Inc. 30,186 1,428
* PG&E Corp. 106,300 1,325AES Corp. 53,469 1,257Alliant Energy Corp. 24,226 1,248Ameren Corp. 15,798 1,233Vistra Corp. 56,291 1,107NRG Energy Inc. 28,315 1,063Entergy Corp. 10,412 1,040
* Stericycle Inc. 14,737 1,022NiSource Inc. 42,649 978FirstEnergy Corp. 31,056 951Atmos Energy Corp. 8,645 825Evergy Inc. 11,535 640OGE Energy Corp. 19,986 637UGI Corp. 15,661 548CenterPoint Energy Inc. 16,000 346PinnacleWest CapitalCorp. 3,458 276
National Fuel Gas Co. 3,726 153Avangrid Inc. 2,345 107
89,833
Total Common Stocks (Cost $1,419,777) 3,362,467
CouponMaturity
Date
FaceAmount
($000)
MarketValue•
($000)
Tax-Exempt Municipal Bonds (50.3%)
Alabama (0.5%)Alabama Economic Settlement Authority BP SettlementRevenue 4.000% 9/15/33 500 563
Alabama Incentives Financing Authority Special ObligationRevenue Prere. 5.000% 9/1/22 380 409
Tax-Managed Balanced Fund
15

CouponMaturity
Date
FaceAmount
($000)
MarketValue•
($000)
Alabama State Public School & College Authority 4.000% 11/1/38 2,500 3,114Birmingham-Jefferson AL Civic Center Authority Special TaxRevenue 5.000% 7/1/31 1,100 1,276
Black Belt Energy Gas District Alabama Gas PrepayRevenue (Project No. 3) PUT 4.000% 12/1/23 1,555 1,702
Black Belt Energy Gas District Alabama Gas PrepayRevenue (Project No. 3) PUT 4.000% 12/1/25 845 975
2 Black Belt Energy Gas District Alabama Gas SupplyRevenue PUT 4.000% 6/1/21 3,885 3,931
2 Black Belt Energy Gas District Alabama Gas SupplyRevenue PUT 4.000% 7/1/22 430 452
Huntsville AL Electric System Revenue 5.000% 12/1/30 510 641Huntsville AL GO 5.000% 5/1/35 1,125 1,417Huntsville AL GO 5.000% 5/1/38 1,860 2,412Huntsville AL Health Care Authority Revenue 5.000% 6/1/35 780 1,014Jefferson County AL Revenue 5.000% 9/15/29 1,470 1,832Jefferson County AL Revenue 5.000% 9/15/33 1,000 1,228Jefferson County AL Sewer Revenue 5.000% 10/1/23 500 561
3 Jefferson County AL Sewer Revenue 0.000% 10/1/25 500 456Lower AL Gas District Gas Project Revenue PUT 4.000% 12/1/25 2,150 2,482Southeast Alabama Gas Supply District Revenue PUT 4.000% 4/1/24 6,810 7,513Southeast Alabama Gas Supply District Revenue PUT 4.000% 6/1/24 1,375 1,526Tuscaloosa AL City Board of Education School TaxWarrantsRevenue 5.000% 8/1/27 530 657
Tuscaloosa AL City Board of Education School TaxWarrantsRevenue 5.000% 8/1/28 1,090 1,343
University of Alabama General Revenue 3.000% 7/1/36 1,085 1,2043 University of South Alabama University Facilities Revenue 5.000% 11/1/23 740 830
37,538Alaska (0.1%)
Alaska Housing Finance Corp. Revenue Prere. 5.000% 6/1/22 425 453Alaska Housing Finance Corp. Revenue Prere. 5.000% 6/1/22 75 80Alaska Municipal Bond Bank Authority Revenue 5.000% 9/1/21 1,650 1,699Matanuska-Susitna Borough AK Lease Revenue (GooseCreek Correctional Center) GO 5.000% 9/1/31 1,345 1,552
3,784Arizona (0.9%)
Arizona Board of Regents Arizona State University SystemRevenue 5.000% 7/1/30 675 803
Arizona Board of Regents Arizona State University SystemRevenue 5.000% 7/1/31 545 626
Arizona COP 5.000% 10/1/26 2,000 2,516Arizona Industrial Development Authority Lease Revenue(Children's National Medical Center) 5.000% 9/1/34 350 453
4 Arizona Industrial Development Authority Revenue(Economic Legacy Cares) 6.375% 7/1/25 180 183
4 Arizona Industrial Development Authority Revenue(Economic Legacy Cares) 6.500% 7/1/26 100 102
4 Arizona Industrial Development Authority Revenue(Economic Legacy Cares) 6.625% 7/1/27 265 272
4 Arizona Industrial Development Authority Revenue(Economic Legacy Cares) 6.750% 7/1/28 305 314
Arizona Industrial Development Authority Revenue (LincolnSouth Beltway Project) 5.000% 11/1/28 1,290 1,687
Arizona School Facilities Board COP 5.000% 9/1/21 1,355 1,398
Tax-Managed Balanced Fund
16

CouponMaturity
Date
FaceAmount
($000)
MarketValue•
($000)
Arizona State University Revenue (McAllister AcademicVillage LLC) 5.000% 7/1/36 1,620 1,936
ArizonaTransportation Board Excise Tax Revenue 5.000% 7/1/21 2,240 2,293ArizonaTransportation Board Excise Tax Revenue 5.000% 7/1/23 2,155 2,411ArizonaTransportation Board Excise Tax Revenue 5.000% 7/1/24 2,110 2,459ArizonaTransportation Board Highway Revenue 5.000% 7/1/22 2,210 2,368ArizonaTransportation Board Highway Revenue 5.000% 7/1/32 1,025 1,259ArizonaTransportation Board Highway Revenue Prere. 5.000% 7/1/22 500 536ArizonaWater Infrastructure Finance Authority Revenue 5.000% 10/1/27 1,000 1,170Chandler AZ GO 5.000% 7/1/23 1,165 1,305Glendale City AZ Excise Tax Refunding ObligationsRevenue 5.000% 7/1/28 1,785 2,229
Maricopa County AZ Elementary School District No. 14(Creighton) GO 3.000% 7/1/32 1,000 1,110
Maricopa County AZ Industrial Development AuthorityHospital Revenue (Honorhealth) 5.000% 9/1/33 830 1,035
Maricopa County AZ School District No. 83 3.000% 10/1/39 1,000 1,086Maricopa County AZ Unified School District No. 4 (Mesa)GO 5.000% 7/1/24 1,700 1,978
Phoenix AZ Civic Improvement Corp. Excise Tax Revenue 5.000% 7/1/35 1,100 1,493Phoenix AZ Civic Improvement Corp. Excise Tax RevenueETM 5.000% 7/1/22 1,145 1,228
Phoenix AZ Civic Improvement Corp.Wastewater SystemRevenue 5.000% 7/1/22 2,290 2,455
Phoenix AZ Civic Improvement Corp.Wastewater SystemRevenue 5.000% 7/1/27 1,295 1,615
Phoenix AZ Civic Improvement Corp.Wastewater SystemRevenue 4.000% 7/1/28 2,015 2,260
Phoenix AZ Civic Improvement Corp.Water SystemRevenue 5.000% 7/1/21 525 537
Phoenix AZ Civic Improvement Corp.Water SystemRevenue 5.000% 7/1/22 1,260 1,350
Phoenix AZ Civic Improvement Corp.Water SystemRevenue 5.000% 7/1/23 2,040 2,283
Phoenix AZ Civic Improvement Corp.Water SystemRevenue 5.000% 7/1/26 2,520 2,935
Phoenix AZ Civic Improvement Corp.Water SystemRevenue 5.000% 7/1/35 1,900 2,328
Phoenix AZ Industrial Development Authority LeaseRevenue (Downtown Phoenix Student Housing LLC) 5.000% 7/1/27 300 340
Phoenix AZ Industrial Development Authority LeaseRevenue (Downtown Phoenix Student Housing LLC) 5.000% 7/1/28 250 286
Pima County AZ Sewer Revenue 5.000% 7/1/24 1,105 1,286Regional Public Transportation Authority Arizona Excise TaxRevenue (Maricopa County Public Transportation) 5.250% 7/1/24 1,125 1,322
Salt River Project Arizona Agricultural Improvement &Power District Revenue 5.000% 12/1/28 515 537
Salt River Project Arizona Agricultural Improvement &Power District Revenue 5.000% 12/1/29 2,000 2,131
Salt River Project Arizona Agricultural Improvement &Power District Revenue 5.000% 1/1/36 1,540 1,906
5 Salt River Project Arizona Agricultural Improvement &Power District Revenue (Arizona Salt Projects ElectricSystem) 5.000% 1/1/24 1,210 1,339
Salt Verde AZ Financial Corp. Gas Revenue 5.250% 12/1/24 910 1,060Salt Verde AZ Financial Corp. Gas Revenue 5.250% 12/1/28 640 825
Tax-Managed Balanced Fund
17

CouponMaturity
Date
FaceAmount
($000)
MarketValue•
($000)
Salt Verde AZ Financial Corp. Gas Revenue 5.000% 12/1/37 855 1,220Yavapai County AZ Industrial Development AuthorityHospital Facility Revenue (Northern Arizona HealthcareSystem) 5.250% 10/1/22 500 518
62,783Arkansas (0.1%)
Pulaski County AR Hospital Revenue (Arkansas Children'sHospital) 5.000% 3/1/29 1,075 1,323
6 Springdale AR Sales & Use Revenue 5.000% 4/1/37 1,000 1,117Springdale AR School District No. 50 GO 4.000% 6/1/27 1,190 1,252Springdale AR School District No. 50 GO 4.000% 6/1/32 1,155 1,207University of Arkansas Revenue 5.000% 11/1/21 805 837University of Arkansas Revenue 5.000% 11/1/24 850 999University of Arkansas Revenue 5.000% 11/1/30 775 958
7,693California (4.7%)
ABAG Finance Authority for Nonprofit Corps. CaliforniaRevenue (Episcopal Senior Communities) 5.000% 7/1/22 500 529
ABAG Finance Authority for Nonprofit Corps. CaliforniaRevenue (Jackson Laboratory) 5.000% 7/1/21 760 778
3 ABAG Finance Authority for Nonprofit Corps. CaliforniaRevenue (Windemere Ranch Infrastructure FinancingProgram) 5.000% 9/2/30 1,135 1,403
7 Alameda CA Corridor Transportation Authority Revenue 0.000% 10/1/30 740 6048 Alameda CA Corridor Transportation Authority Revenue 0.000% 10/1/32 1,790 1,360
Anaheim CA Housing & Public Improvements AuthorityRevenue (Electric Utility Distribution System) 5.000% 10/1/30 1,000 1,098
Anaheim CA Housing & Public Improvements AuthorityRevenue (Electric Utility Distribution System) 5.000% 10/1/33 1,015 1,110
Bay AreaToll Authority California Toll Bridge Revenue (SanFrancisco Bay Area) 4.000% 4/1/33 1,000 1,171
Bay AreaToll Authority California Toll Bridge Revenue (SanFrancisco Bay Area) 4.000% 4/1/37 820 950
Bay AreaToll Authority California Toll Bridge Revenue (SanFrancisco Bay Area) Prere. 5.000% 4/1/22 500 530
Bay AreaToll Authority California Toll Bridge Revenue (SanFrancisco Bay Area) Prere. 5.000% 4/1/23 1,000 1,109
Bay AreaToll Authority California Toll Bridge Revenue (SanFrancisco Bay Area) PUT 2.100% 4/1/22 1,150 1,166
Bay AreaToll Authority California Toll Bridge Revenue (SanFrancisco Bay Area) PUT 2.125% 4/1/25 2,950 3,120
Bay AreaToll Authority California Toll Bridge Revenue (SanFrancisco Bay Area) PUT 2.850% 4/1/25 1,000 1,088
Bay AreaToll Authority California Toll Bridge Revenue (SanFrancisco Bay Area) PUT 2.625% 4/1/26 2,000 2,198
Bay AreaToll Authority California Toll Bridge Revenue (SanFrancisco Bay Area) PUT 2.950% 4/1/26 1,000 1,112
9 Bay AreaToll Authority California Toll Bridge Revenue (SanFrancisco Bay Area), SIFMA Municipal Swap IndexYield +0.700% PUT 0.790% 4/1/21 1,000 1,000
9 Bay AreaToll Authority California Toll Bridge Revenue (SanFrancisco Bay Area), SIFMA Municipal Swap IndexYield +0.900% PUT 0.990% 5/1/23 1,000 1,007
7 Brea CA Redevelopment Agency Successor AgencyTaxAllocation Revenue (Redevelopment Project AB) 0.000% 8/1/29 1,000 889
California GO 5.000% 8/1/22 1,000 1,076California GO 5.000% 9/1/22 1,805 1,950
Tax-Managed Balanced Fund
18

CouponMaturity
Date
FaceAmount
($000)
MarketValue•
($000)
California GO 5.000% 11/1/23 1,155 1,311California GO 5.000% 4/1/24 2,000 2,309California GO 5.000% 10/1/24 2,000 2,356California GO 5.000% 3/1/26 660 789California GO 5.000% 4/1/26 2,000 2,490California GO 5.000% 4/1/27 2,000 2,567California GO 3.500% 8/1/27 1,515 1,816California GO 5.000% 2/1/28 690 758California GO 5.000% 4/1/28 5,125 6,747California GO 5.000% 9/1/29 455 567California GO 5.000% 11/1/29 1,700 1,923California GO 5.000% 9/1/30 1,000 1,031California GO 5.000% 11/1/30 5,000 6,977California GO 5.000% 4/1/31 1,005 1,414California GO 4.000% 8/1/31 1,675 1,966California GO 5.000% 2/1/32 500 525California GO 5.000% 4/1/32 2,500 3,319California GO 5.000% 10/1/32 1,875 2,190California GO 4.000% 8/1/33 1,520 1,772California GO 5.000% 8/1/33 2,865 3,535California GO 4.000% 9/1/33 2,000 2,335California GO 3.000% 10/1/34 1,225 1,400California GO 5.000% 11/1/34 1,340 1,835California GO 3.000% 10/1/35 1,815 2,059California GO 5.000% 11/1/35 5,000 6,826California GO 4.000% 3/1/36 2,000 2,481California GO 3.000% 10/1/36 1,500 1,689
2 California GO VRDO 0.050% 1/4/21 2,000 2,0002 California GO VRDO 0.060% 1/4/21 6,540 6,5402 California Health Facilities Financing Authority Revenue
(Advent Obligated Group) VRDO 0.060% 1/4/21 3,050 3,050California Health Facilities Financing Authority Revenue(Adventist Health System/West) 5.000% 3/1/23 1,325 1,457
California Health Facilities Financing Authority Revenue(Children's Hospital of Los Angeles) 5.000% 11/15/23 1,000 1,077
California Health Facilities Financing Authority Revenue(Common Spirit Health) 4.000% 4/1/37 1,000 1,192
California Health Facilities Financing Authority Revenue(Kaiser Permanente) PUT 5.000% 11/1/22 795 864
California Health Facilities Financing Authority Revenue(Providence St. Joseph Health Obligated Group) PUT 4.000% 10/1/24 1,195 1,362
California Health Facilities Financing Authority Revenue(Providence St. Joseph Health Obligated Group) PUT 5.000% 10/1/25 1,690 2,055
California Health Facilities Financing Authority Revenue(Rady Children's Hospital) 5.000% 8/15/31 965 991
California Health Facilities Financing Authority Revenue(Sutter Health) 5.000% 11/15/36 1,000 1,263
10 California Infrastructure & Economic Development BankRevenue (Bay AreaToll Bridges Seismic Retrofit) Prere. 5.000% 1/1/28 500 651
California Municipal Finance Authority Revenue (AnaheimElectric Utility Distribution System) 5.000% 10/1/30 965 1,168
California Municipal Finance Authority Revenue (RepublicServices Inc. Projects) PUT 0.180% 4/1/21 4,600 4,600
2 California Public Finance Authority Revenue (SharpHealthcare) VRDO 0.060% 1/4/21 1,300 1,300
California PublicWorks Board Lease Revenue (DavidsonLibrary) Prere. 5.000% 3/1/23 20 22
Tax-Managed Balanced Fund
19

CouponMaturity
Date
FaceAmount
($000)
MarketValue•
($000)
California PublicWorks Board Lease Revenue (Departmentof Corrections) 5.000% 6/1/22 1,000 1,068
California PublicWorks Board Lease Revenue (Departmentof Corrections) 5.000% 6/1/27 1,050 1,120
California PublicWorks Board Lease Revenue (JudicialCouncil Projects) 5.000% 10/1/26 1,200 1,408
California PublicWorks Board Lease Revenue (JudicialCouncil Projects) 5.000% 3/1/28 300 330
California PublicWorks Board Lease Revenue (JudicialCouncil Projects) 5.125% 12/1/29 260 272
California PublicWorks Board Lease Revenue (Regents ofThe University of California) Prere. 5.000% 12/1/21 35 37
5 California PublicWorks Board Lease Revenue (VariousCapital Projects) 5.000% 2/1/24 500 548
California PublicWorks Board Lease Revenue (VariousCapital Projects) 5.000% 12/1/26 2,500 2,951
5 California PublicWorks Board Lease Revenue (VariousCapital Projects) 5.000% 2/1/31 1,000 1,297
California PublicWorks Board Lease Revenue (VariousCapital Projects) 5.000% 11/1/31 1,000 1,082
California PublicWorks Board Lease Revenue (VariousCapital Projects) 5.000% 4/1/32 350 370
California PublicWorks Board Lease Revenue (VariousCapital Projects) Prere. 5.000% 12/1/21 25 26
California State Educational Facilities Authority RevenuePrere. 6.125% 10/1/21 245 256
California State Educational Facilities Authority RevenuePrere. 6.125% 10/1/21 255 266
California State University Systemwide Revenue 5.000% 11/1/32 1,000 1,223California State University Systemwide Revenue 5.000% 11/1/32 2,815 3,542California State University Systemwide Revenue 5.000% 11/1/34 2,010 2,344California State University Systemwide Revenue 5.000% 11/1/35 2,000 2,502California State University Systemwide Revenue 5.000% 11/1/37 1,000 1,196California State University Systemwide Revenue 5.000% 11/1/39 2,500 2,894California State University Systemwide Revenue 5.000% 11/1/41 1,400 1,688California State University Systemwide Revenue Prere. 5.000% 11/1/22 1,000 1,088California Statewide Communities Development AuthorityRevenue (Kaiser Foundation Hospitals) PUT 5.000% 11/1/29 3,640 4,930
4 California Statewide Communities Development AuthorityRevenue (Loma Linda University Medical Center) 5.000% 12/1/28 400 463
2 California Statewide Communities Development AuthorityRevenue (Rady Children's Hospital) VRDO 0.060% 1/4/21 400 400
3 Centinela Valley CA Union High School District GO 4.000% 8/1/29 1,035 1,203Chabot-Las Positas CA Community College District GO 5.000% 8/1/31 1,000 1,116Chaffey CA Community College District GO 5.000% 6/1/23 850 949
3 Chino CA Public Financing Authority Special Tax Revenue 5.000% 9/1/30 800 942Chula Vista CA Municipal Financing Authority Special TaxRevenue 5.500% 9/1/27 970 1,095
11 Citrus CA Community College District GO, 5.000% couponrate effective 2/1/2023 Prere. 0.000% 2/1/24 1,000 1,038
Contra Costa CA Community College District GO Prere. 5.000% 8/1/23 1,000 1,124Contra Costa CA Municipal Water District Revenue 5.000% 10/1/33 1,000 1,124Corona-Norco CA Unified School District Special TaxRevenue (Community Facilities District No. 98-1) 5.000% 9/1/22 970 1,047
3 East Side CA Union High School District Santa ClaraCounty GO 3.000% 8/1/32 1,000 1,106
Tax-Managed Balanced Fund
20
CouponMaturity
Date
FaceAmount
($000)
MarketValue•
($000)
11 Foothill/Eastern Transportation Corridor Agency CaliforniaToll Road Revenue, 6.200% coupon rate effective1/15/2024 0.000% 1/15/29 1,390 1,561
Gavilan CA Joint Community College District GO 5.000% 8/1/28 1,000 1,208Golden State Tobacco Securitization Corp. CaliforniaRevenue 5.000% 6/1/25 500 594
7 Golden State Tobacco Securitization Corp. CaliforniaRevenue 0.000% 6/1/27 2,060 1,948
Golden State Tobacco Securitization Corp. CaliforniaRevenue 5.000% 6/1/33 1,140 1,339
Grossmont CA Healthcare District GO 4.000% 7/15/40 2,000 2,234La Quinta CA Redevelopment AgencyTax AllocationRevenue 5.000% 9/1/26 1,500 1,674
La Quinta CA Redevelopment AgencyTax AllocationRevenue 5.000% 9/1/30 1,000 1,149
La Verne CA (Brethren Hillcrest Homes) COP Prere. 5.000% 5/15/22 350 376Long Beach CA Finance Authority Natural Gas PurchaseRevenue 5.250% 11/15/23 435 494
12 Long Beach CA Unified School District GO 0.000% 8/1/24 1,290 1,263Los Angeles CA Community College District GO Prere. 4.000% 8/1/23 2,000 2,198Los Angeles CA Community College District GO Prere. 4.000% 8/1/24 1,000 1,136Los Angeles CA Department of Airports InternationalAirport Revenue 4.000% 5/15/36 2,000 2,461
Los Angeles CA Department of Airports InternationalAirport Revenue 4.000% 5/15/40 2,055 2,500
Los Angeles CA Department ofWater & Power Revenue 5.000% 7/1/33 1,375 1,719Los Angeles CA Department ofWater & Power Revenue 5.000% 7/1/35 1,330 1,724Los Angeles CA Department ofWater & Power Revenue 5.000% 7/1/36 1,000 1,207Los Angeles CA Department ofWater & Power Revenue 5.000% 7/1/36 1,695 2,198Los Angeles CA Department ofWater & Power Revenue 5.000% 7/1/37 1,000 1,239Los Angeles CA Department ofWater & Power Revenue 5.000% 7/1/37 1,145 1,476Los Angeles CA Department ofWater & Power Revenue 5.000% 7/1/38 500 619Los Angeles CA Department ofWater & Power Revenue 5.000% 7/1/38 2,550 3,290Los Angeles CA Department ofWater & Power Revenue 5.000% 7/1/40 1,500 2,009
2 Los Angeles CA Department ofWater & Power RevenueVRDO 0.090% 1/4/21 6,345 6,345
Los Angeles CA Metropolitan Transportation AuthoritySales Tax Revenue 5.000% 6/1/29 5,000 6,804
Los Angeles CA Metropolitan Transportation AuthoritySales Tax Revenue 5.000% 7/1/38 1,400 1,792
Los Angeles CA Unified School District GO 4.000% 7/1/35 2,250 2,798Los Angeles CAWastewater System Revenue 5.000% 6/1/36 1,755 2,201Los Angeles County CA PublicWorks Financing AuthorityLease Revenue 5.000% 8/1/26 500 537
6 Los Angeles County CA School District GO 5.000% 7/1/36 1,000 1,264Los Angeles County CA Unified School District GO 5.000% 7/1/31 1,000 1,338Marysville CA Revenue (Fremont-Rideout Health Group)Prere. 5.250% 1/1/21 600 600
Milpitas CA Redevelopment Agency Successor AgencyTaxAllocation Revenue 5.000% 9/1/31 1,130 1,332
M-S-R CA Energy Authority Gas Revenue 6.500% 11/1/39 555 925Napa Valley CA Unified School District GO 4.000% 8/1/28 1,690 1,836
11 Napa Valley Community College District GO, 4.000%coupon rate effective 2/1/2021 0.000% 8/1/32 1,090 1,240
Newport Mesa CA Unified School District GO 0.000% 8/1/30 630 559Oakland CA Redevelopment AgencyTax AllocationRevenue (Central District Project) 5.000% 9/1/22 500 536
Tax-Managed Balanced Fund
21

CouponMaturity
Date
FaceAmount
($000)
MarketValue•
($000)
3 Oakland CA Unified School District GO 5.000% 8/1/25 1,500 1,808Orange County CA Development AgencyTax AllocationRevenue (Santa Ana Heights Project) 5.000% 3/1/21 1,170 1,178
Orange County CA Local Transportation Authority Sales TaxRevenue 5.000% 2/15/33 1,035 1,365
8 Palomar Pomerado Health California GO 0.000% 8/1/22 1,000 98812 Palomar Pomerado Health California GO 0.000% 8/1/26 1,040 98112 Palomar Pomerado Health California GO 0.000% 8/1/32 740 598
Perris CA Public Financing Authority Tax Allocation Revenue 5.000% 10/1/21 1,085 1,1243 Poway CA Unified School District Public Financing Authority
Special Tax Revenue 5.000% 9/1/31 1,395 1,715Riverside CA Electric Revenue 5.000% 10/1/32 1,830 2,427Riverside County CATransportation Commission Sales TaxRevenue Prere. 5.250% 6/1/23 1,000 1,123
Riverside County CATransportation CommissionTollRevenue 0.000% 6/1/30 2,415 1,953
Roseville CA Natural Gas Financing Authority Gas Revenue 5.000% 2/15/23 340 373Roseville CA Natural Gas Financing Authority Gas Revenue 5.000% 2/15/25 325 383
6 Sacramento CA City Financing Authority Revenue 5.000% 12/1/22 760 8308 Sacramento CA City Financing Authority Tax Allocation
Revenue 0.000% 12/1/30 1,815 1,529Sacramento CA Regional Transportation District FareboxRevenue 5.000% 3/1/23 330 330
Sacramento County CA Sanitation Districts FinancingAuthority Revenue 5.000% 8/1/25 495 604
Sacramento County CA Sanitation Districts FinancingAuthority Revenue 5.000% 8/1/27 575 699
3 San Bernardino CA Community College District GO 0.000% 8/1/22 1,000 994San Diego CA Community College District GO Prere. 5.000% 8/1/21 500 514San Diego CA Community College District GO Prere. 5.000% 8/1/23 1,000 1,123San Diego CA Unified School District GO 0.000% 7/1/27 100 95
3 San Diego CA Unified School District GO 5.500% 7/1/27 520 690San Diego CA Unified School District GO 0.000% 7/1/28 430 401San Diego CA Unified School District GO 0.000% 7/1/29 440 402San Diego CA Unified School District GO 0.000% 7/1/30 100 89San Diego CA Unified School District GO 5.000% 7/1/35 2,000 2,219San Diego CA Unified School District GO ETM 0.000% 7/1/27 320 306San Diego CA Unified School District GO ETM 0.000% 7/1/27 80 77San Diego CA Unified School District GO ETM 0.000% 7/1/28 70 66San Diego CA Unified School District GO ETM 0.000% 7/1/29 60 55San Diego County CA Regional Transportation CommissionSales Tax Revenue Prere. 5.000% 4/1/22 560 594
San Diego County CAWater Authority Revenue 5.000% 5/1/28 1,000 1,203San Francisco CA Bay Area Rapid Transit District GO 5.000% 8/1/30 1,530 1,848San Francisco CA Bay Area Rapid Transit District Sales TaxRevenue 4.000% 7/1/21 350 357
San Francisco CA City & County COP 5.000% 4/1/28 1,635 1,976San Francisco CA City & County COP 4.000% 4/1/33 1,000 1,139San Francisco CA City & County COP 4.000% 4/1/39 1,000 1,164San Francisco CA City & County International AirportRevenue 5.000% 5/1/27 605 643
San Francisco CA City & County International AirportRevenue 5.000% 5/1/30 405 411
San Francisco CA City & County International AirportRevenue 5.000% 5/1/34 1,000 1,292
San Francisco CA City & County International AirportRevenue Prere. 5.000% 5/3/21 95 97
Tax-Managed Balanced Fund
22

CouponMaturity
Date
FaceAmount
($000)
MarketValue•
($000)
San Francisco CA City & County Public UtilitiesCommissionWater Revenue 5.000% 11/1/31 1,700 2,122
San Francisco CA City & County Public UtilitiesCommissionWater Revenue 5.000% 11/1/32 1,000 1,184
San Francisco CA City & County Public UtilitiesCommissionWater Revenue 5.000% 11/1/35 1,500 1,853
San Francisco CA City & County Unified School District GO 4.000% 6/15/32 965 1,020San Francisco CA City & County Unified School District GO 4.250% 6/15/33 1,000 1,060
7 San Ramon CA Public Financing Authority Tax AllocationRevenue 0.000% 2/1/33 1,475 1,163
Santa Clara CA Financing Authority Revenue 3.000% 5/1/39 1,155 1,235Santa Clara CA Unified School District GO 3.000% 7/1/34 1,000 1,094Southern California Public Power Authority Revenue 5.000% 7/1/30 3,000 3,392Southern California Public Power Authority Revenue(Canyon Power Project) 5.000% 7/1/32 2,000 2,377
Southern California Public Power Authority Revenue(Canyon Power Project) Prere. 5.000% 7/1/21 1,105 1,131
State Center California Community College District GO 5.000% 8/1/29 1,000 1,2076 Stockton Public Financing Authority Revenue 5.000% 9/1/29 1,000 1,140
Tahoe-Truckee CA Unified School District GO 5.000% 8/1/34 1,030 1,2688 Union CA Elementary School District GO 0.000% 9/1/28 1,080 999
Union City CA Community Redevelopment AgencySuccessor AgencyTax Allocation Revenue 5.000% 10/1/30 1,635 1,953
University of California Revenue 5.000% 5/15/23 875 890University of California Revenue 5.000% 5/15/28 690 764University of California Revenue 4.000% 5/15/33 1,000 1,128University of California Revenue 5.000% 5/15/33 3,000 4,098University of California Revenue 4.000% 5/15/34 1,000 1,179University of California Revenue 4.000% 5/15/34 1,770 1,945University of California Revenue 4.000% 5/15/35 2,000 2,355University of California Revenue 5.000% 5/15/35 1,620 2,093University of California Revenue 5.000% 5/15/35 1,165 1,500University of California Revenue Prere. 5.000% 5/15/21 160 163University of California Revenue Prere. 5.000% 5/15/23 310 345University of California Revenue PUT 5.000% 5/15/23 3,960 4,405University of California Revenue VRDO 0.050% 1/4/21 2,700 2,700
3,10 West Contra Costa CA Unified School District GO 0.000% 8/1/32 1,155 9578 West Contra Costa CA Unified School District GO 0.000% 8/1/34 1,225 958
319,036Colorado (0.8%)
13 Adams &Weld County CO School District No. 27J GO 5.000% 12/1/34 1,435 1,735Adams County CO COP 5.000% 12/1/31 650 781Board of Governors of the Colorado State UniversitySystem Enterprise Revenue ETM 5.000% 3/1/23 300 331
Colorado (UCDHSC Fitzsimons Academic Projects) COP 5.000% 11/1/21 500 520Colorado COP 4.000% 12/15/33 1,235 1,487Colorado COP 4.000% 12/15/34 1,745 2,097Colorado Educational & Cultural Facilities AuthorityRevenue (University of Denver) 4.000% 3/1/30 500 575
Colorado Health Facilities Authority Hospital Revenue(Adventist Health System/West Obligated Group) 5.000% 11/15/37 1,000 1,293
Colorado Health Facilities Authority Hospital Revenue(Adventist Health System/West Obligated Group) 4.000% 11/15/38 1,000 1,190
Colorado Health Facilities Authority Hospital Revenue(Adventist Health System/West Obligated Group) PUT 5.000% 11/19/26 1,030 1,302
Tax-Managed Balanced Fund
23

CouponMaturity
Date
FaceAmount
($000)
MarketValue•
($000)
Colorado Health Facilities Authority Retirement FacilitiesRevenue (Liberty Heights Project) ETM 0.000% 7/15/24 1,430 1,408
Colorado Health Facilities Authority Revenue (AdventistHealth System/Sunbelt Obligated Group) PUT 5.000% 11/15/23 2,990 3,388
Colorado Health Facilities Authority Revenue (CatholicHealth Initiatives) Prere. 5.250% 2/1/21 2,500 2,509
Colorado Health Facilities Authority Revenue (CovenantRetirement Community Inc.) Prere. 5.000% 12/1/22 500 546
Colorado Health Facilities Authority Revenue (NCMC Inc.)Prere. 4.000% 5/15/26 1,500 1,790
Colorado Housing & Finance Authority Revenue (SingleFamily Mortgage) 3.000% 5/1/50 2,250 2,449
Colorado Springs CO Utility System Revenue Prere. 5.000% 11/15/22 500 545Denver City & County CO Better Denver & Zoo GO 5.000% 8/1/22 1,000 1,076Denver CO City & County Airport Revenue 5.000% 11/15/24 1,200 1,410Denver CO City & County Airport Revenue 5.000% 12/1/26 775 965Denver CO City & County Airport Revenue 4.000% 12/1/38 400 462Denver CO City & County COP 5.000% 6/1/37 1,685 1,988Denver CO City & County DedicatedTax Revenue 0.000% 8/1/29 500 425Denver CO City & County GO 5.000% 8/1/23 1,535 1,725Denver CO City & County School District GO 4.000% 12/1/31 1,000 1,151Denver CO City & County School District GO 5.000% 12/1/36 2,000 2,464
8 E-470 Public Highway Authority Colorado Revenue 0.000% 9/1/23 1,010 9968 E-470 Public Highway Authority Colorado Revenue 0.000% 9/1/29 2,000 1,7778 E-470 Public Highway Authority Colorado Revenue 0.000% 9/1/32 1,000 821
El Paso County CO School District No. 20 Academy GO 5.000% 12/15/30 2,400 2,999El Paso County CO School District No. 3Widefield GO 5.000% 12/1/26 350 381El Paso County CO School District No. 3Widefield GO 5.000% 12/1/27 500 544El Paso County CO School District No. 3Widefield GO 5.000% 12/1/29 500 543El Paso County CO School District No. 3Widefield GO 5.000% 12/1/30 520 565El Paso County CO School District No. 3Widefield GO 5.000% 12/1/31 635 690Garfield, Pitkin, & Eagle County CO School District GO 4.000% 12/15/34 1,000 1,128Jefferson County CO School District No. R-1 GO 5.000% 12/15/36 3,395 4,398Regional Transportation District of Colorado COP 5.000% 6/1/31 1,010 1,323Regional Transportation District of Colorado COP 5.000% 11/1/31 1,000 1,416University of Colorado Enterprise System Revenue 4.000% 6/1/32 1,590 1,868University of Colorado Enterprise System Revenue Prere. 5.000% 6/1/22 515 550University of Colorado Hospital Authority Revenue 5.000% 11/15/36 1,000 1,073
56,684Connecticut (0.8%)
Connecticut GO 5.000% 4/15/21 500 507Connecticut GO 5.000% 11/15/22 1,935 2,106Connecticut GO 5.000% 4/15/24 800 848Connecticut GO 5.000% 2/15/25 1,000 1,186Connecticut GO 5.000% 5/15/25 2,345 2,807Connecticut GO 5.000% 2/15/26 1,000 1,228Connecticut GO 5.000% 9/1/26 1,000 1,163Connecticut GO 5.000% 2/15/27 1,000 1,264Connecticut GO 4.000% 9/15/27 1,000 1,057Connecticut GO 5.000% 4/15/28 500 528Connecticut GO 5.000% 4/15/28 1,000 1,299Connecticut GO 4.000% 6/1/29 1,000 1,249Connecticut GO 5.000% 3/1/32 2,950 3,318Connecticut GO 5.000% 10/15/32 705 756Connecticut GO 4.000% 3/15/35 5,000 5,669
Tax-Managed Balanced Fund
24

CouponMaturity
Date
FaceAmount
($000)
MarketValue•
($000)
5 Connecticut GO 3.000% 1/15/38 2,345 2,603Connecticut Health & Educational Facilities AuthorityRevenue (Connecticut State University System) 5.000% 11/1/31 1,000 1,306
Connecticut Health & Educational Facilities AuthorityRevenue (Covenant Retirement Communities) 5.000% 12/1/31 1,000 1,199
Connecticut Health & Educational Facilities AuthorityRevenue (Hartford Healthcare) 4.000% 7/1/36 1,750 2,066
Connecticut Health & Educational Facilities AuthorityRevenue (Hartford Healthcare) Prere. 5.000% 7/1/21 550 563
Connecticut Health & Educational Facilities AuthorityRevenue (Nuvance Health) 5.000% 7/1/29 1,255 1,585
Connecticut Health & Educational Facilities AuthorityRevenue (Sacred Heart University) 5.000% 7/1/31 850 1,109
Connecticut Health & Educational Facilities AuthorityRevenue (University of Hartford) 5.000% 7/1/31 575 673
Connecticut Health & Educational Facilities AuthorityRevenue (Yale University) PUT 1.450% 7/1/22 875 892
Connecticut Health & Educational Facilities AuthorityRevenue (Yale University) PUT 1.450% 7/1/22 900 917
Connecticut Health & Educational Facilities AuthorityRevenue (Yale University) PUT 5.000% 2/1/23 3,400 3,735
Connecticut Health & Educational Facilities AuthorityRevenue (Yale University) PUT 2.000% 7/1/26 500 542
Connecticut Special Tax Revenue (TransportationInfrastructure) 5.000% 9/1/23 1,185 1,331
Connecticut Special Tax Revenue (TransportationInfrastructure) 5.000% 1/1/28 1,805 2,329
Connecticut Special Tax Revenue (TransportationInfrastructure) 5.000% 10/1/34 1,000 1,275
Connecticut Special Tax Revenue (TransportationInfrastructure) 5.000% 5/1/38 2,250 2,943
Hartford County CT Metropolitan District GO 5.000% 7/15/28 1,255 1,619Hartford County CT Metropolitan District GO 4.000% 7/15/38 2,025 2,382University of Connecticut GO 5.000% 2/15/27 635 749University of Connecticut Revenue 5.000% 11/1/27 1,000 1,284
56,087Delaware (0.1%)
Delaware GO 5.000% 2/1/25 1,010 1,207Delaware Health Facilities Authority Revenue (BeebeMedical Center Project) 5.000% 6/1/30 600 749
Delaware River & Bay Authority Delaware Revenue 3.000% 1/1/38 1,495 1,606Delaware State Economic Development Authority Revenue(NRG Energy Projects) PUT 1.250% 10/1/25 650 659
DelawareTransportation Authority Grant Anticipation Bonds 5.000% 9/1/29 1,750 2,341University of Delaware Revenue 5.000% 11/1/34 440 639University of Delaware Revenue 5.000% 11/1/35 500 732
7,933District of Columbia (0.6%)
District of Columbia GO 5.000% 6/1/25 1,235 1,492District of Columbia GO 5.000% 6/1/29 3,780 4,368District of Columbia GO 5.000% 6/1/32 1,000 1,229District of Columbia GO 5.000% 6/1/34 1,320 1,639District of Columbia Hospital Revenue (Children's HospitalObligated Group) 5.000% 7/15/35 1,000 1,187
District of Columbia IncomeTax Revenue 5.000% 12/1/24 1,350 1,473District of Columbia IncomeTax Revenue 5.000% 12/1/26 655 683
Tax-Managed Balanced Fund
25

CouponMaturity
Date
FaceAmount
($000)
MarketValue•
($000)
District of Columbia IncomeTax Revenue 5.000% 5/1/37 5,735 7,694District of Columbia Revenue Bonds (Latin AmericanMontessori Bilingual Public Charter School) 5.000% 6/1/40 1,000 1,161
District of ColumbiaWater & Sewer Authority Public UtilityRevenue 5.000% 10/1/39 1,125 1,359
District of ColumbiaWater & Sewer Authority Public UtilityRevenue 5.000% 10/1/33 2,175 2,717
MetropolitanWashington DC/VA Airports Authority AirportSystem Revenue 5.000% 10/1/30 2,325 3,197
MetropolitanWashington DC/VA Airports Authority DullesToll Road Revenue (Dulles Metrorail & CapitalImprovement Projects) 5.000% 10/1/33 2,240 2,816
MetropolitanWashington DC/VA Airports Authority DullesToll Road Revenue (Dulles Metrorail & CapitalImprovement Projects) 0.000% 10/1/37 1,300 821
MetropolitanWashington DC/VA Airports Authority DullesToll Road Revenue (Dulles Metrorail & CapitalImprovement Projects) 4.000% 10/1/39 1,000 1,149
Washington Convention & Sports Authority Revenue 5.000% 10/1/26 1,090 1,289Washington Metropolitan AreaTransit Authority Revenue 5.000% 7/15/34 2,800 3,759Washington Metropolitan AreaTransit Authority Revenue 5.000% 7/15/38 2,000 2,648
40,681Florida (2.4%)
Brevard County FL School Board COP 5.000% 7/1/25 1,000 1,110Broward County FL Airport System Revenue Prere. 5.000% 10/1/22 400 434Broward County FL Airport System Revenue Prere. 5.500% 10/1/23 1,000 1,144Capital Projects Finance Authority FL Student housingRevenue (Projects Loan Program) 5.000% 10/1/33 540 626
Capital Trust Agency Florida Educational Facilities Revenue(Advantage Academy of Hillsborough Projects) 5.000% 12/15/29 400 455
Central Florida Expressway Authority Revenue 4.000% 7/1/32 1,015 1,166East Central FL RegionalWastewater Treatment FacilitiesOperation Board Revenue 5.000% 10/1/34 925 1,159
East Central FL RegionalWastewater Treatment FacilitiesOperation Board Revenue 5.000% 10/1/35 1,050 1,314
Escambia County FL Health Facilities Authority Revenue(Baptist Health Care Corp. Obligated Group) 5.000% 8/15/39 1,525 1,882
Florida Board of Education Lottery Revenue 4.000% 7/1/27 1,230 1,296Florida Board of Education Public Education Capital OutlayGO 5.000% 6/1/21 760 775
Florida Board of Education Public Education Capital OutlayGO 5.000% 6/1/24 625 697
Florida Board of Education Public Education Capital OutlayGO 4.000% 6/1/27 1,255 1,323
Florida Board of Education Public Education Capital OutlayGO 4.000% 6/1/29 1,365 1,436
Florida Board of Education Public Education Capital OutlayGO 4.000% 6/1/32 1,675 1,918
Florida Development Finance Corp. Educational FacilitiesRevenue (Mater Academy Projects) 5.000% 6/15/29 400 473
Florida Development Finance Corp. Educational FacilitiesRevenue (Mater Academy Projects) 5.000% 6/15/30 475 558
Florida GO 4.000% 6/1/27 1,455 1,586Florida GO 5.000% 7/1/27 1,440 1,810Florida Gulf Coast University Financing Corp. CapitalImprovement Revenue 4.000% 2/1/38 770 890
Tax-Managed Balanced Fund
26

CouponMaturity
Date
FaceAmount
($000)
MarketValue•
($000)
Florida Higher Educational Facilities Financial AuthorityRevenue (Rollins College Projects) 4.000% 12/1/36 1,750 2,039
Florida Municipal Power Agency Revenue 4.000% 10/1/30 2,775 3,251Florida Turnpike Authority Revenue 4.000% 7/1/34 1,000 1,138Florida Turnpike Authority Revenue 4.000% 7/1/34 1,385 1,601
2 Hillsborough County FL Industrial Development AuthorityHealth System Revenue VRDO 0.110% 1/4/21 17,100 17,100
Hillsborough County FL Industrial Development AuthorityHospital Revenue (Tampa General Hospital Projects) 3.600% 10/1/28 500 559
Hillsborough County FL School Board (Master LeaseProgram) COP Prere. 5.000% 7/1/22 1,650 1,769
Jacksonville FL Electric Authority Electric System Revenue 5.000% 10/1/26 1,005 1,241Jacksonville FL Electric Authority Electric System Revenue 5.000% 10/1/27 1,160 1,313Jacksonville FL Electric Authority Electric System Revenue 5.000% 10/1/31 190 192Jacksonville FL Electric Authority Electric System Revenue 4.000% 10/1/37 1,955 2,290Jacksonville FL Electric Authority Electric System RevenuePrere. 5.000% 4/1/21 310 314
Jacksonville FL Electric AuthorityWater & Sewer Revenue 5.000% 10/1/27 1,905 2,472Jacksonville FL Electric AuthorityWater & Sewer Revenue 5.000% 10/1/27 1,465 1,890Jacksonville FL Health Care Facilities Revenue (BaptistHealth System Obligated Group) 4.000% 8/15/37 1,250 1,437
Jacksonville FL Health Care Facilities Revenue (BrooksRehabilitation) 5.000% 11/1/30 1,085 1,329
Jacksonville FL Special Revenue 5.000% 10/1/27 1,500 1,934Jacksonville FL Special Revenue 5.000% 10/1/28 1,640 2,168Jacksonville FL Special Revenue 5.000% 10/1/32 500 537Jacksonville FL Special Revenue 5.000% 10/1/38 1,410 1,837Jacksonville FLTransportation Authority Local Option GasTax Revenue 5.000% 8/1/34 1,000 1,191
Jacksonville FLTransportation Revenue 5.000% 10/1/28 1,200 1,432Jacksonville FLWater & Sewer Revenue 4.000% 10/1/35 1,655 1,948JEA FL Electric System Revenue 5.000% 10/1/37 2,000 2,147KeyWest FL Utility Board Electricity Revenue 5.000% 10/1/37 1,030 1,304Lakeland FL Educational Facilities Revenue (FloridaSouthern College Project) 5.000% 9/1/31 880 927
Lakeland FL Hospital Revenue (Lakeland Regional HealthSystems) 5.000% 11/15/26 1,475 1,834
Lee Memorial Health System Florida Hospital Revenue 5.000% 4/1/39 1,655 2,085Miami Beach FL Health Facilities Authority Revenue (MountSinai Medical Center) 5.000% 11/15/27 1,000 1,143
Miami Beach FL Resort Tax Revenue 5.000% 9/1/34 1,020 1,182Miami Beach FLWater & Sewer Revenue 5.000% 10/1/30 1,500 1,796Miami Beach FLWater & Sewer Revenue 5.000% 10/1/38 1,000 1,274
3,4 Miami FL Special Obligation Street & SidewalkImprovement Program Revenue 5.000% 1/1/30 1,325 1,661
3,4 Miami FL Special Obligation Street & SidewalkImprovement Program Revenue 5.000% 1/1/35 1,000 1,230
Miami-Dade County FL Aviation Revenue (MiamiInternational Airport) 4.875% 10/1/24 500 500
Miami-Dade County FL Aviation Revenue (MiamiInternational Airport) 5.000% 10/1/33 1,850 2,225
Miami-Dade County FL Aviation Revenue (MiamiInternational Airport) 5.000% 10/1/34 1,000 1,201
Miami-Dade County FL Aviation Revenue (MiamiInternational Airport) 4.000% 10/1/36 1,000 1,203
Miami-Dade County FL Building Better Communities GO 5.000% 7/1/36 1,160 1,422
Tax-Managed Balanced Fund
27

CouponMaturity
Date
FaceAmount
($000)
MarketValue•
($000)
Miami-Dade County FL Expressway Authority Toll SystemRevenue 5.000% 7/1/24 860 988
Miami-Dade County FL Expressway Authority Toll SystemRevenue 5.000% 7/1/25 830 952
Miami-Dade County FL Health Facilities Authority HospitalRevenue (Miami Children's Hospital) 5.000% 8/1/25 1,000 1,109
Miami-Dade County FL Public Health Trust GO 4.000% 7/1/32 1,750 2,086Miami-Dade County FL School Board COP 5.000% 2/1/26 3,035 3,713Miami-Dade County FL School Board GO 5.000% 3/15/31 3,155 3,448Miami-Dade County FL Seaport Revenue 5.750% 10/1/28 1,610 1,820Miami-Dade County FL Special Obligation Revenue 5.000% 10/1/22 1,645 1,781Miami-Dade County FL Special Obligation Revenue 5.000% 4/1/37 1,255 1,615Miami-Dade County FL Special Obligation Revenue 0.000% 10/1/39 1,265 738Miami-Dade County FL Special Obligation Revenue Prere. 5.000% 10/1/22 1,000 1,084Miami-Dade County FL Special Obligation Revenue Prere. 5.000% 10/1/22 500 542Miami-Dade County FLTransit Sales Surtax Revenue 4.000% 7/1/31 1,400 1,622Miami-Dade County FLWater & Sewer Revenue 5.000% 10/1/22 2,060 2,233North Brevard County FL Hospital District Revenue 5.000% 1/1/34 1,000 1,206Orange County FL Health Facilities Authority HospitalRevenue (Orlando Health Inc.) 5.000% 10/1/30 1,510 1,840
Orange County FL School Board COP 5.000% 8/1/33 6,105 7,4653 Orlando FLTourist Development Tax Revenue 5.000% 11/1/28 1,535 1,930
Osceola County FLTransportation Revenue 5.000% 10/1/28 500 632Osceola County FLTransportation Revenue 0.000% 10/1/34 2,000 1,381Palm Beach County FL Health Facilities Authority HospitalRevenue (BRRH Corp. Obligated Group) Prere. 5.000% 12/1/24 560 662
Palm Beach County FL Public Improvement Revenue 5.000% 5/1/33 1,245 1,522Palm Beach County FL School Board COP 5.000% 8/1/29 1,540 1,845Palm Beach County FL School Board COP 5.000% 8/1/32 1,500 1,779Palm Beach County Health Facilities Authority Revenue(Toby & Leon Cooperman Sinai Residences of Boca RationExpansion) 2.625% 6/1/25 150 153
Panama City Beach FL Capital Improvement Revenue 5.000% 11/1/32 375 509Reedy Creek FL Improvement District GO 4.000% 6/1/34 1,190 1,341Reedy Creek FL Improvement District GO 4.000% 6/1/35 1,000 1,157Seacoast FL Utility AuthorityWater & Sewer Revenue 5.000% 3/1/21 1,230 1,239South Broward FL Hospital District Revenue 4.000% 5/1/33 1,020 1,157South Miami FL Health Facilities Authority Revenue(Baptist Health South Florida Obligated Group) 4.000% 8/15/33 1,180 1,356
St. Johns County FLWater & Sewer Revenue 0.000% 6/1/24 1,110 1,089Sunshine State Governmental Financing CommissionFlorida Revenue (Miami Dade County Program) 5.000% 9/1/26 1,000 1,120
Tallahassee FL Energy System Revenue 5.000% 10/1/35 1,000 1,156Tallahassee FL Health Facilities System Revenue (MemorialHealthcare Projects) 5.000% 12/1/40 1,000 1,116
Tallahassee FL Utility System Revenue 5.000% 10/1/29 1,015 1,186Tallahassee FL Utility System Revenue 5.000% 10/1/30 750 875Tallahassee FL Utility System Revenue 5.000% 10/1/34 1,265 1,470Tampa Bay FLWater Utility System Revenue 5.000% 10/1/37 2,040 2,512Tampa FL Cigarette Tax Allocation Revenue (H. Lee MoffittCancer Center Project) 5.000% 9/1/26 200 214
Tampa FL Health System Revenue (BayCare HealthSystem) 5.000% 11/15/33 1,575 1,669
Tampa FL Hospital Revenue 5.000% 7/1/23 750 798Tampa-Hillsborough County FL Expressway AuthorityRevenue 5.000% 7/1/30 200 255
Tax-Managed Balanced Fund
28

CouponMaturity
Date
FaceAmount
($000)
MarketValue•
($000)
Tampa-Hillsborough County FL Expressway AuthorityRevenue 5.000% 7/1/31 250 318
Tohopekaliga FLWater Authority Utility System Revenue 4.000% 10/1/21 1,275 1,311Tohopekaliga FLWater Authority Utility System Revenue 4.000% 10/1/32 1,000 1,141Tohopekaliga FLWater Authority Utility System RevenuePrere. 5.750% 10/1/21 500 521
Volusia County FL Educational Facilities Authority Revenue(Embry-Riddle Aeronautical University Inc.) 5.000% 10/15/29 860 1,067
Volusia County FL School Board COP 5.000% 8/1/25 1,025 1,180
166,071Georgia (1.4%)
Athens-Clarke County GA Unified GovernmentWater &Sewerage Revenue 4.000% 1/1/32 1,000 1,121
Atlanta GA Airport Revenue 5.000% 7/1/30 1,000 1,366Atlanta GA Airport Revenue 5.000% 1/1/33 2,000 2,239Atlanta GAWater &Wastewater Revenue 5.000% 11/1/21 1,500 1,560Atlanta GAWater &Wastewater Revenue 5.000% 11/1/25 1,290 1,552Atlanta GAWater &Wastewater Revenue 5.000% 11/1/36 1,320 1,682Bulloch County GA Development Authority Revenue(Georgia Southern University Housing Foundation) 5.000% 7/1/27 410 509
Bulloch County GA Development Authority Revenue(Georgia Southern University Housing Foundation) ETM 5.000% 7/1/27 100 129
City of Dalton GA Utilities Revenue 4.000% 3/1/37 1,450 1,720Cobb County GA Kennestone Hospital Authority Revenue 5.000% 4/1/24 400 441Coweta County GA Development Authority Revenue(Piedmont Healthcare Inc. Project) 5.000% 7/1/36 1,060 1,368
Dahlonega GA Downtown Development Authority Revenue(North Georgia MAC LLC Project) 5.000% 7/1/31 810 992
DeKalb County GAWater & Sewer Revenue 5.250% 10/1/31 500 517Fulton County GA Development Authority Revenue(Children's Healthcare of Atlanta Obligated Group) 5.000% 7/1/38 1,500 1,926
Fulton County GAWater & Sewer Revenue 4.000% 1/1/34 4,000 4,228Georgia GO 5.000% 7/1/24 1,500 1,752Georgia GO 5.000% 7/1/24 1,000 1,168Georgia GO 5.000% 7/1/25 1,100 1,336Georgia GO 5.000% 2/1/30 1,500 1,894Georgia GO 5.000% 8/1/33 5,000 6,879Georgia Municipal Electric Power Authority Revenue 5.000% 1/1/33 1,335 1,753Griffin-Spalding County GA Hospital Authority Revenue(WellStar Health System Obligated Group) 5.000% 4/1/25 600 712
Griffin-Spalding County GA Hospital Authority Revenue(WellStar Health System Obligated Group) 5.000% 4/1/31 350 434
Griffin-Spalding County GA Hospital Authority Revenue(WellStar Health System Obligated Group) 5.000% 4/1/33 1,575 1,935
Gwinnett County GA School District GO 5.000% 2/1/28 500 596Main Street Natural Gas Inc. Georgia Gas Project Revenue 5.000% 3/15/21 600 605Main Street Natural Gas Inc. Georgia Gas Project Revenue 5.000% 3/15/22 525 554Main Street Natural Gas Inc. Georgia Gas Project Revenue 5.000% 5/15/33 500 623Main Street Natural Gas Inc. Georgia Gas Project Revenue 5.000% 5/15/38 500 712
2 Main Street Natural Gas Inc. Georgia Gas Project RevenuePUT 4.000% 9/1/23 6,210 6,764
2 Main Street Natural Gas Inc. Georgia Gas Project RevenuePUT 4.000% 12/1/23 6,245 6,849
Main Street Natural Gas Inc. Georgia Gas Project RevenuePUT 4.000% 12/2/24 1,475 1,672
Main Street Natural Gas Inc. Georgia Gas Project RevenuePUT 4.000% 9/1/26 2,400 2,819
Tax-Managed Balanced Fund
29

CouponMaturity
Date
FaceAmount
($000)
MarketValue•
($000)
Metropolitan Atlanta GA Rapid Transit Authority Revenue(Third Indenture) 5.000% 7/1/43 2,000 2,366
Metropolitan Atlanta Rapid Transportation Authority GeorgiaSales Tax Revenue 5.000% 7/1/31 1,410 1,741
Metropolitan Atlanta Rapid Transportation Authority GeorgiaSales Tax Revenue 4.000% 7/1/33 1,835 2,165
Metropolitan Atlanta Rapid Transportation Authority GeorgiaSales Tax Revenue 4.000% 7/1/33 5,210 6,541
Municipal Electric Authority Georgia Revenue 5.000% 1/1/26 1,510 1,8336 Municipal Electric Authority Georgia Revenue 5.000% 1/1/28 1,495 1,839
Municipal Electric Authority Georgia Revenue 5.000% 1/1/29 1,795 2,280Municipal Electric Authority Georgia Revenue 5.000% 1/1/35 1,715 1,961Municipal Electric Authority Georgia Revenue 5.000% 1/1/39 1,215 1,518Municipal Electric Authority Georgia Revenue (Plant VoltageUnits 3 & 4 Project M) 5.000% 1/1/32 500 631
Municipal Electric Authority Georgia Revenue (Plant VoltageUnits 3 & 4 Project M) 5.000% 1/1/33 180 226
Municipal Electric Authority Georgia Revenue (Plant VoltageUnits 3 & 4 Project M) 5.000% 1/1/36 600 748
Municipal Electric Authority Georgia Revenue (Plant VoltageUnits 3 & 4 Project P) 5.000% 1/1/28 580 735
Municipal Electric Authority Georgia Revenue (Plant VoltageUnits 3 & 4 Project P) 5.000% 1/1/30 810 1,028
Municipal Electric Authority Georgia Revenue (Plant VoltageUnits 3 & 4 Project P) 5.000% 1/1/34 800 998
Private Colleges & University Authority of Georgia Revenue(Emory University) 5.000% 9/1/27 1,540 1,994
Private Colleges & University Authority of Georgia Revenue(Emory University) 4.000% 9/1/36 2,000 2,478
Private Colleges & University Authority of Georgia Revenue(Emory University) 5.000% 9/1/36 795 1,044
Walton County GA Development Authority Revenue(Piedmont Healthcare Inc. Project) 4.000% 7/1/38 1,145 1,343
93,876Guam (0.1%)
Guam Business PrivilegeTax Revenue 5.000% 11/15/29 865 993Guam Government Business PrivilegeTax Revenue 5.000% 11/15/26 735 854Guam GovernmentWaterworks AuthorityWater &WasteWater System Revenue 5.250% 7/1/23 1,000 1,104
Guam GovernmentWaterworks AuthorityWater &WasteWater System Revenue Prere. 5.250% 7/1/23 1,305 1,466
Guam International Airport Authority Revenue 5.000% 10/1/21 465 4743 Guam Power Authority Revenue 5.000% 10/1/30 250 269
5,160Hawaii (0.7%)
Hawaii Airports System Revenue 5.000% 7/1/29 1,785 2,364Hawaii Airports System Revenue 5.000% 7/1/30 1,000 1,348Hawaii Airports System Revenue 5.000% 7/1/31 2,000 2,676Hawaii Department of Budget & Finance Special PurposeRevenue (Hawaii Pacific Health Obligated Group) 5.000% 7/1/21 400 409
Hawaii GO 5.000% 12/1/21 375 392Hawaii GO 5.000% 8/1/24 1,765 2,065Hawaii GO 5.000% 8/1/25 1,500 1,751Hawaii GO 5.000% 10/1/25 1,575 1,923Hawaii GO 5.000% 1/1/29 1,370 1,779Hawaii GO 5.000% 8/1/29 3,500 3,906
Tax-Managed Balanced Fund
30

CouponMaturity
Date
FaceAmount
($000)
MarketValue•
($000)
Hawaii GO 5.000% 8/1/29 830 963Hawaii GO 4.000% 8/1/32 5,000 5,589Hawaii GO 5.000% 1/1/33 1,575 2,012Hawaii GO 5.000% 1/1/36 4,115 5,204Hawaii GO Prere. 5.000% 12/1/21 310 323Hawaii GO Prere. 5.000% 12/1/21 190 198Honolulu HI City & County GO 5.000% 7/1/24 2,000 2,329Honolulu HI City & County GO 5.000% 10/1/28 1,000 1,209Honolulu HI City & County GO 5.000% 10/1/29 4,000 4,824Honolulu HI City & County GO 4.000% 10/1/32 1,000 1,137Honolulu HI City & County GO Prere. 5.250% 8/1/21 500 515Honolulu HI City & CountyWastewater System RevenuePrere. 5.000% 7/1/25 2,000 2,419
Honolulu HI City & CountyWastewater System RevenuePrere. 5.000% 7/1/25 1,000 1,209
State of Hawaii Airports System Revenue 4.000% 7/1/38 2,500 2,961University of Hawaii Revenue Bonds 4.000% 10/1/33 1,200 1,474
50,979Idaho (0.0%)
Canyon County ID School District No. 139 (Vallivue) GO 4.000% 9/15/21 1,215 1,248Idaho Health Facilities Authority Revenue (St. Luke's HealthSystem Project) 5.000% 3/1/28 1,595 2,037
3,285Illinois (2.8%)
Chicago IL Board of Education GO 5.000% 12/1/21 1,000 1,0278 Chicago IL Board of Education GO 5.250% 12/1/21 540 561
Chicago IL Board of Education GO 5.000% 12/1/23 1,000 1,078Chicago IL Board of Education GO 5.000% 12/1/24 700 771Chicago IL Board of Education GO 5.000% 12/1/24 1,500 1,653Chicago IL Board of Education GO 7.000% 12/1/26 500 611
8 Chicago IL Board of Education GO 0.000% 12/1/28 1,000 804Chicago IL Board of Education GO 5.000% 12/1/28 1,150 1,343
8 Chicago IL Board of Education GO 0.000% 12/1/30 1,350 1,0043 Chicago IL Board of Education GO 5.000% 12/1/30 1,250 1,5508 Chicago IL Board of Education GO 0.000% 12/1/31 1,550 1,109
Chicago IL Board of Education GO 5.250% 12/1/35 1,225 1,331Chicago IL Board of Education GO 5.000% 4/1/36 1,270 1,457Chicago IL GO 5.000% 1/1/24 520 565Chicago IL GO 5.000% 1/1/26 335 370Chicago IL GO 5.125% 1/1/27 100 110Chicago IL GO 5.000% 1/1/28 1,090 1,243Chicago IL GO 5.250% 1/1/28 200 221Chicago IL GO 5.000% 1/1/31 1,500 1,726Chicago IL Housing Authority Revenue 5.000% 1/1/33 1,000 1,221Chicago IL MetropolitanWater Reclamation District GO 5.000% 12/1/31 500 521Chicago IL Midway Airport Revenue 5.000% 1/1/26 240 260Chicago IL Motor Fuel Tax Revenue 5.000% 1/1/22 300 306Chicago IL O'Hare International Airport Revenue 5.250% 1/1/24 200 214Chicago IL O'Hare International Airport Revenue 5.000% 1/1/25 1,010 1,190Chicago IL O'Hare International Airport Revenue 5.500% 1/1/26 1,000 1,074Chicago IL O'Hare International Airport Revenue 5.000% 1/1/29 3,330 3,874Chicago IL O'Hare International Airport Revenue 5.000% 1/1/29 1,140 1,367Chicago IL O'Hare International Airport Revenue 5.000% 1/1/30 1,000 1,194Chicago IL O'Hare International Airport Revenue 5.000% 1/1/31 1,060 1,226Chicago IL O'Hare International Airport Revenue 5.000% 1/1/32 500 521
Tax-Managed Balanced Fund
31

CouponMaturity
Date
FaceAmount
($000)
MarketValue•
($000)
Chicago IL O'Hare International Airport Revenue 5.000% 1/1/33 1,000 1,152Chicago IL O'Hare International Airport Revenue 5.000% 1/1/34 2,430 3,127Chicago IL O'Hare International Airport Revenue 4.000% 1/1/35 3,000 3,555Chicago IL O'Hare International Airport Revenue 5.000% 1/1/35 1,855 2,187Chicago IL O'Hare International Airport Revenue 5.000% 1/1/35 2,835 3,643Chicago IL O'Hare International Airport Revenue 4.000% 1/1/38 1,000 1,173Chicago IL O'Hare International Airport Revenue 5.000% 1/1/38 1,080 1,345Chicago IL O'Hare International Airport Revenue 5.000% 1/1/39 1,000 1,242
6 Chicago IL Park District GO 5.000% 1/1/29 1,000 1,260Chicago IL Park District GO 5.000% 1/1/31 1,000 1,084
6 Chicago IL Park District GO 5.000% 1/1/32 1,225 1,4176 Chicago IL Park District GO 5.000% 1/1/33 1,000 1,210
Chicago IL Transit Authority Revenue (Sales Tax Receipts) 5.250% 12/1/49 1,500 1,721Chicago ILWastewater Transmission Revenue 5.000% 1/1/28 1,000 1,221Chicago ILWastewater Transmission Revenue 5.000% 1/1/29 1,580 1,767
8 Chicago ILWastewater Transmission Revenue 5.500% 1/1/30 1,230 1,550Chicago ILWaterworks Revenue 5.000% 11/1/30 1,000 1,141Cook County IL Community College District GO 5.250% 12/1/32 1,000 1,063Cook County IL GO 5.250% 11/15/25 1,000 1,037
3 Cook County IL GO 5.000% 11/15/26 1,545 1,889Cook County IL GO 5.000% 11/15/28 660 662Cook County IL GO 5.250% 11/15/28 565 584Cook Kane Lake & McHenry Counties IL CommunityCollege District No. 512 (William Rainey Harper College) 3.000% 12/15/35 2,500 2,772
Illinois Finance Authority Revenue (Advocate Health CareNetwork) 5.000% 8/1/26 1,500 1,733
Illinois Finance Authority Revenue (Advocate Health CareNetwork) Prere. 5.000% 8/1/24 2,550 2,979
Illinois Finance Authority Revenue (Ascension Health CreditGroup) Prere. 5.000% 11/15/21 500 521
Illinois Finance Authority Revenue (Centegra HealthSystem) 5.000% 9/1/29 1,300 1,491
Illinois Finance Authority Revenue (CleanWater Initiative) 5.000% 7/1/31 1,000 1,259Illinois Finance Authority Revenue (DePaul University) 5.000% 10/1/33 1,000 1,181Illinois Finance Authority Revenue (DePaul University) 5.000% 10/1/34 1,000 1,180Illinois Finance Authority Revenue (Edward ElmhurstObligated Group) 5.000% 1/1/36 1,000 1,185
Illinois Finance Authority Revenue (FranciscanCommunities Inc.) 5.000% 5/15/37 1,000 1,107
Illinois Finance Authority Revenue (Mercy Health System) 4.000% 12/1/28 1,000 1,1242 Illinois Finance Authority Revenue (Northshore University)
VRDO 0.090% 1/4/21 10,700 10,700Illinois Finance Authority Revenue (Northwest CommunityHospital) 5.000% 7/1/35 1,000 1,177
Illinois Finance Authority Revenue (OSF HealthcareSystem) PUT 5.000% 11/15/24 75 86
Illinois Finance Authority Revenue (OSF HealthcareSystem) PUT 5.000% 11/15/26 125 153
Illinois Finance Authority Revenue (Presence HealthNetwork Obligated Group) 5.000% 2/15/28 1,250 1,577
Illinois Finance Authority Revenue (Rehabilitation Instituteof Chicago) 5.500% 7/1/28 2,000 2,195
Illinois Finance Authority Revenue (Rush University MedicalCenter) 5.000% 11/15/33 1,050 1,228
Illinois Finance Authority Revenue (Trinity Health Corp.)Prere. 5.000% 12/1/21 500 522
Illinois Finance Authority Revenue (University of Chicago) 5.000% 10/1/29 500 517
Tax-Managed Balanced Fund
32

CouponMaturity
Date
FaceAmount
($000)
MarketValue•
($000)
Illinois Finance Authority Revenue (University of Chicago) 5.000% 10/1/35 1,000 1,1403 Illinois GO 5.000% 1/1/21 710 710
Illinois GO 5.000% 5/1/21 505 511Illinois GO 5.000% 8/1/21 605 619Illinois GO 5.000% 11/1/21 3,415 3,512Illinois GO 5.000% 8/1/22 1,000 1,058Illinois GO 5.000% 10/1/22 1,290 1,371Illinois GO 5.000% 11/1/22 2,300 2,428Illinois GO 5.000% 11/1/22 1,000 1,066Illinois GO 5.000% 2/1/23 540 579Illinois GO 5.000% 11/1/23 1,000 1,092Illinois GO 5.500% 7/1/24 1,100 1,199Illinois GO 5.000% 8/1/24 1,500 1,575Illinois GO 5.000% 10/1/24 1,470 1,641Illinois GO 5.000% 11/1/24 1,785 1,958
3 Illinois GO 5.000% 3/1/26 1,125 1,168Illinois GO 5.000% 11/1/26 1,785 2,018Illinois GO 5.000% 2/1/28 1,690 1,947Illinois GO 5.000% 10/1/28 2,000 2,370Illinois GO 5.000% 11/1/28 1,000 1,130Illinois GO 5.000% 10/1/29 1,000 1,197Illinois GO 5.000% 11/1/29 1,000 1,123Illinois GO 5.250% 2/1/30 1,900 2,055Illinois GO 5.250% 7/1/31 1,000 1,065Illinois GO 4.125% 10/1/36 500 551Illinois GO 5.500% 5/1/39 1,000 1,210Illinois GO 4.000% 10/1/40 700 755Illinois Housing Development Authority Revenue 3.000% 10/1/50 5,000 5,496
3,14 Illinois Regional Transportation Authority Revenue 6.250% 7/1/23 500 5706 Illinois Sales Tax Revenue 5.000% 6/15/28 1,000 1,176
Illinois Sales Tax Revenue 5.000% 6/15/36 1,000 1,152Illinois Sales Tax Revenue 5.000% 6/15/37 1,000 1,149Illinois Toll Highway Authority Revenue 5.000% 1/1/30 1,000 1,083Illinois Toll Highway Authority Revenue 5.000% 1/1/30 1,490 1,949Illinois Toll Highway Authority Revenue 5.000% 1/1/30 3,500 4,728Illinois Toll Highway Authority Revenue 5.000% 1/1/31 1,600 2,084Illinois Toll Highway Authority Revenue 5.000% 1/1/32 500 541Illinois Toll Highway Authority Revenue 5.000% 1/1/37 1,200 1,492
3 Kane County IL School District No. 131 (Aurora East Side)GO 4.000% 12/1/33 250 293
3 Metropolitan Pier & Exposition Authority Illinois DedicatedSales Tax Revenue 0.000% 6/15/26 910 840
3 Metropolitan Pier & Exposition Authority Illinois DedicatedSales Tax Revenue 0.000% 6/15/27 1,195 1,076
8 Metropolitan Pier & Exposition Authority Illinois DedicatedSales Tax Revenue 5.500% 6/15/29 2,505 2,950
8 Metropolitan Pier & Exposition Authority Illinois DedicatedSales Tax Revenue 0.000% 12/15/29 2,205 1,826
8 Metropolitan Pier & Exposition Authority Illinois DedicatedSales Tax Revenue 0.000% 6/15/38 1,000 607
8 Metropolitan Pier & Exposition Authority Illinois DedicatedSales Tax Revenue ETM 0.000% 6/15/21 1,100 1,098
Metropolitan Pier & Exposition Authority Illinois DedicatedSales Tax Revenue (McCormick Place Expansion Project) 5.000% 12/15/27 710 848
Metropolitan Pier & Exposition Authority Illinois DedicatedSales Tax Revenue (McCormick Place Expansion Project) 5.000% 12/15/28 1,500 1,563
Tax-Managed Balanced Fund
33

CouponMaturity
Date
FaceAmount
($000)
MarketValue•
($000)
3,10 Metropolitan Pier & Exposition Authority Illinois DedicatedSales Tax Revenue (McCormick Place Expansion Project) 5.500% 6/15/29 400 474
8 Metropolitan Pier & Exposition Authority Illinois DedicatedSales Tax Revenue (McCormick Place Expansion Project) 0.000% 6/15/31 1,540 1,211
8 Metropolitan Pier & Exposition Authority Illinois DedicatedSales Tax Revenue (McCormick Place Expansion Project) 0.000% 12/15/31 340 263
8 Metropolitan Pier & Exposition Authority Illinois DedicatedSales Tax Revenue (McCormick Place Expansion Project) 0.000% 6/15/32 1,215 923
8 Metropolitan Pier & Exposition Authority Illinois DedicatedSales Tax Revenue (McCormick Place Expansion Project) 0.000% 6/15/33 1,130 828
8 Metropolitan Pier & Exposition Authority Illinois DedicatedSales Tax Revenue (McCormick Place Expansion Project) 0.000% 12/15/33 1,790 1,289
8 Metropolitan Pier & Exposition Authority Illinois DedicatedSales Tax Revenue (McCormick Place Expansion Project) 0.000% 6/15/35 500 341
8 Metropolitan Pier & Exposition Authority Illinois DedicatedSales Tax Revenue (McCormick Place Expansion Project) 0.000% 6/15/37 1,075 679
8 Metropolitan Pier & Exposition Authority Illinois DedicatedSales Tax Revenue (McCormick Place Expansion Project) 0.000% 12/15/37 700 435
Northern Illinois Municipal Power Agency Project Revenue 5.000% 12/1/26 1,070 1,334Railsplitter Tobacco Settlement Authority Illinois TobaccoSettlement Revenue 5.000% 6/1/26 1,560 1,912
Railsplitter Tobacco Settlement Authority Illinois TobaccoSettlement Revenue Prere. 6.000% 6/1/21 400 409
Romeoville IL Revenue (Lewis University Project) 5.000% 10/1/28 1,000 1,108Sales Tax Securitization Corp. IL Revenue 5.000% 1/1/29 1,500 1,896Southwestern Illinois Development Authority HealthFacilities Revenue (Hospital Sisters Services Inc.) 5.000% 2/15/28 1,000 1,281
Southwestern Illinois Development Authority Revenue 5.000% 4/15/30 1,275 1,703University of Illinois Auxiliary Facilities System Revenue 4.000% 4/1/31 120 133University of Illinois Auxiliary Facilities System Revenue 4.000% 4/1/33 10 11
6 Will County IL Community High School District No. 210(Lincoln-Way) GO 0.000% 1/1/29 1,000 865
Will County IL Community High School District No. 210(Lincoln-Way) GO 5.000% 1/1/30 1,200 1,276
189,159Indiana (0.6%)
Ball State University Student Fee Indiana Revenue 5.000% 7/1/32 425 526Ball State University Student Fee Indiana Revenue 5.000% 7/1/34 1,110 1,367Ball State University Student Fee Indiana Revenue 5.000% 7/1/35 1,450 1,782Hammond IN Multi-School Building Corp. Revenue 5.000% 1/15/29 790 990Indiana Finance Authority Hospital Revenue (IndianaUniversity Health Obligated Group) 5.000% 12/1/22 1,100 1,197
Indiana Finance Authority Hospital Revenue (IndianaUniversity Health Obligated Group) 5.000% 12/1/33 1,390 1,618
Indiana Finance Authority Hospital Revenue (ParkviewHealth Systems Obligated Group) 5.000% 5/1/27 700 892
Indiana Finance Authority Hospital Revenue (ParkviewHealth Systems Obligated Group) 5.000% 5/1/30 450 613
Indiana Finance Authority Revenue (Butler UniversityProject) 5.000% 2/1/29 1,020 1,268
Indiana Finance Authority Revenue (Community Foundationof Northwest Indiana Obligated Group) Prere. 5.000% 3/1/22 690 728
Indiana Finance Authority Revenue (FranciscanAlliance Inc.) 5.000% 11/1/29 1,175 1,471
Indiana Finance Authority Revenue (FranciscanAlliance Inc.) 5.000% 11/1/30 1,520 1,896
Tax-Managed Balanced Fund
34

CouponMaturity
Date
FaceAmount
($000)
MarketValue•
($000)
Indiana Finance Authority Revenue (FranciscanAlliance Inc.) 5.000% 11/1/31 1,130 1,404
Indiana Finance Authority Revenue (FranciscanAlliance Inc.) 4.000% 11/1/35 1,685 1,953
Indiana Finance Authority Revenue (Marquette Project) 5.000% 3/1/24 1,645 1,789Indiana Finance Authority Revenue (Marquette Project) 5.000% 3/1/25 650 722Indiana Finance Authority Revenue (Stadium Project) 5.250% 2/1/30 1,075 1,287Indiana Finance Authority Revenue (State Revolving Fund)Prere. 5.000% 2/1/23 500 550
Indiana Finance AuthorityWastewater Utility Revenue(CWA Authority Project) 5.000% 10/1/32 500 538
Indiana Municipal Power Agency Revenue 5.000% 1/1/34 1,415 1,708Indiana Municipal Power Agency Revenue 5.000% 1/1/36 1,000 1,243Indiana Municipal Power Agency Revenue 5.000% 1/1/39 4,575 5,480Indianapolis Department of Public UtilitiesWater SystemRevenue 5.000% 10/1/35 1,435 1,836
Indianapolis IN Gas Utilities Distribution System (CitizensEnergy Group) 5.000% 8/15/23 3,250 3,646
IPS Multi-School Building Corp. IN Revenue 5.000% 7/15/28 1,390 1,623Ivy INTech Community College Revenue 5.000% 7/1/32 870 1,115Ivy INTech Community College Revenue 5.000% 7/1/33 880 1,122Purdue University Indiana University Student FacilitiesSystem Revenue 5.000% 7/1/21 870 891
Richmond IN Hospital Authority Revenue (Reid Hospital &Health Care Services Inc.) 5.000% 1/1/24 720 808
Tippecanoe County IN School Building Corp. Revenue 4.000% 7/15/32 1,070 1,318
43,381Iowa (0.2%)
Iowa City IA Community School District GO 3.000% 6/1/30 3,725 4,239Iowa Finance Authority Health Facilities Revenue (MercyMedical Center Project) 5.000% 8/15/27 1,435 1,528
Iowa Finance Authority Midwestern Disaster Area Revenue(Iowa Fertilizer Co. Project) 3.125% 12/1/22 165 169
4 Iowa Finance Authority Midwestern Disaster Area Revenue(Iowa Fertilizer Co. Project) 5.875% 12/1/27 320 330
Iowa Finance Authority Midwestern Disaster Area Revenue(Iowa Fertilizer Co. Project) PUT 5.250% 12/1/37 2,120 2,310
Iowa Finance Authority Revenue 5.000% 8/1/38 1,290 1,745Iowa Higher Education Loan Authority Revenue (DesMoines University Projects) 5.000% 10/1/35 1,250 1,577
Xenia IA Rural Water District Revenue 5.000% 12/1/28 1,000 1,210
13,108Kansas (0.2%)
Johnson County KS Public Building Commission(Courthouse & Medical Examiners Facilities) Revenue 4.000% 9/1/27 1,000 1,200
Kansas Department of Transportation Highway Revenue 5.000% 9/1/26 700 820Kansas Development Finance Authority Revenue 5.000% 5/1/25 1,345 1,487Kansas Development Finance Authority Revenue 5.000% 5/1/27 1,585 1,745Kansas Development Finance Authority Revenue 5.000% 4/1/32 1,325 1,445Lyon County KS Unified School District No 253. GO 4.000% 9/1/32 350 416Sedgwick County KS Unified School District No. 266(Maize) GO 5.000% 9/1/23 1,565 1,764
Sedgwick County KS Unified School District No. 266(Maize) GO 3.000% 9/1/33 2,090 2,302
University of Kansas Hospital Authority Health FacilitiesRefunding & Improvement Bonds 4.000% 9/1/40 1,000 1,112
Tax-Managed Balanced Fund
35

CouponMaturity
Date
FaceAmount
($000)
MarketValue•
($000)
Wichita KS Hospital Facilities Revenue (Via Christi HealthSystem Inc.) Prere. 5.000% 11/15/21 500 520
Wyandotte County/Kansas City KS Unified GovernmentUtility System Revenue Prere. 5.000% 9/1/22 1,000 1,079
13,890Kentucky (0.6%)
Carroll County KY Pollution Control Revenue (KentuckyUtilities Co. Project) PUT 1.550% 9/1/26 1,000 1,015
Kentucky Bond Development Corp. Transient RoomTaxRevenue (Lexington Center Corp. Project) 5.000% 9/1/29 1,980 2,489
8 Kentucky Economic Development Finance Authority HealthSystem Revenue (Norton Healthcare Inc. & Affiliates) 0.000% 10/1/25 1,220 1,147
Kentucky Economic Development Finance AuthorityHospital Revenue (Baptist Healthcare System ObligatedGroup) 5.000% 8/15/31 1,575 1,925
8 Kentucky Municipal Power Agency Power System Revenue 5.000% 9/1/29 1,000 1,1796 Kentucky Property & Building Commission Revenue 5.000% 5/1/34 1,000 1,257
Kentucky Public Energy Authority Gas Supply Revenue PUT 4.000% 4/1/24 9,220 10,196Kentucky Public Energy Authority Gas Supply Revenue PUT 4.000% 1/1/25 6,760 7,599Kentucky Public Energy Authority Gas Supply Revenue PUT 4.000% 6/1/25 775 883Kentucky Public Energy Authority Gas Supply Revenue PUT 4.000% 6/1/25 1,095 1,247Kentucky Public Energy Authority Gas Supply Revenue PUT 4.000% 6/1/26 1,790 2,083Kentucky Public Energy Authority Gas Supply Revenue PUT 4.000% 2/1/28 3,200 3,811Kentucky Public Transportation Infrastructure Authority TollRevenue (Downtown Crossing Project) BAN 0.000% 7/1/21 1,325 1,313
Kentucky Public Transportation Infrastructure Authority TollRevenue (Downtown Crossing Project) BAN 0.000% 7/1/22 810 788
KentuckyTurnpike Authority Economic Development RoadRevenue (Revitalization Project) 5.000% 7/1/28 1,000 1,090
Louisville & Jefferson County KY Metropolitan GovernmentRevenue (Catholic Health Initiatives) Prere. 5.000% 6/1/22 1,000 1,067
Owen County KY Revenue (AmericanWater Capital Corp.)PUT 2.450% 10/1/29 500 548
Owen County KY Revenue (AmericanWater Capital Corp.)PUT 2.450% 10/1/29 1,000 1,095
Warren County KY Hospital Revenue (BowlingGreen-Warren County Community Hospital Corp. Project) 5.000% 4/1/28 1,050 1,143
41,875Louisiana (0.5%)
Bossier City LA Utilities Revenue 5.000% 10/1/22 500 541Bossier City LA Utilities Revenue 5.000% 10/1/23 595 668East Baton Rouge Parish LA Industrial Development BoardRevenue (Exxon Mobil Projects) VRDO 0.100% 1/4/21 9,435 9,435
Louisiana Gasoline & Fuel Tax Revenue 4.000% 5/1/31 1,000 1,048Louisiana Gasoline & Fuel Tax Revenue 4.000% 5/1/32 850 891Louisiana Gasoline & Fuel Tax Revenue 4.000% 5/1/34 330 346Louisiana Gasoline & Fuel Tax Revenue 4.000% 5/1/35 390 409Louisiana Gasoline & Fuel Tax Revenue 5.000% 5/1/35 1,065 1,329Louisiana Gasoline & Fuel Tax Revenue 4.500% 5/1/39 2,665 3,069Louisiana Gasoline & Fuel Tax Revenue PUT 0.600% 5/1/23 1,000 1,003
6 Louisiana Local Government Environmental Facilities &Community Development Authority Revenue 5.000% 10/1/29 1,315 1,686
Louisiana Local Government Environmental Facilities &Community Development Authority Revenue (LCTCSFacilities Corp. Project) 5.000% 10/1/33 1,235 1,389
Tax-Managed Balanced Fund
36

CouponMaturity
Date
FaceAmount
($000)
MarketValue•
($000)
Louisiana Public Facilities Authority Hospital Revenue(Louisiana Children's Medical Center) 5.000% 6/1/36 1,250 1,558
Louisiana Public Facilities Authority Hospital Revenue(Tulane University of Louisiana) 5.000% 4/1/37 1,270 1,632
Louisiana Public Facilities Authority Revenue (OchsnerClinic Projects) PUT 5.000% 5/15/25 220 263
Louisiana Stadium & Exposition District Revenue 5.000% 7/1/24 1,000 1,097Louisiana State University Revenue 5.000% 7/1/23 455 502
3 New Orleans LA Aviation Board Revenue 5.000% 10/1/27 875 1,097New Orleans LA GO 5.000% 12/1/31 500 541St. Charles Parish LA Gulf Opportunity Zone Revenue(Valero Energy Corp.) PUT 4.000% 6/1/22 1,755 1,822
St. John the Baptish Parish LA Revenue (Marathon OilCorp. Project) PUT 2.125% 7/1/24 715 733
St. John the Baptish Parish LA Revenue (Marathon OilCorp. Project) PUT 2.375% 7/1/26 725 754
31,813Maine (0.1%)
Maine Health & Higher Educational Facilities AuthorityRevenue (Mainehealth) 5.000% 7/1/29 445 569
Maine Health & Higher Educational Facilities AuthorityRevenue (Mainehealth) 5.000% 7/1/30 600 761
Maine Municipal Bond Bank (Department of Transportation) 5.000% 9/1/32 1,265 1,693Portland ME General Airport Revenue 4.000% 1/1/39 820 930
3,953Maryland (1.2%)
Anne Arundel County MD GO 5.000% 4/1/23 1,190 1,318Anne Arundel County MD GO 5.000% 10/1/27 1,455 1,773Anne Arundel County MD GO 5.000% 4/1/33 1,000 1,181Baltimore County MD GO 5.000% 8/1/21 1,435 1,475Baltimore County MD GO 4.000% 3/1/30 1,200 1,443Baltimore MD Consolidated Public Improvement GO 5.000% 3/1/32 1,275 1,698Baltimore MD Consolidated Public Improvement GO Prere. 5.000% 10/15/22 650 706Baltimore MD Project Revenue 5.000% 7/1/24 2,095 2,438Harford County MD GO 5.000% 10/1/26 1,250 1,585Howard County MD GO Prere. 5.000% 2/15/21 750 754Howard County MD GO Prere. 5.000% 8/15/21 80 82Howard County MD GO Prere. 5.000% 8/15/21 120 124Maryland Department of Transportation Revenue 4.000% 12/1/23 1,905 1,971Maryland Department of Transportation Revenue 4.000% 12/15/29 1,365 1,505Maryland Department of Transportation Revenue 3.000% 10/1/30 2,620 2,992Maryland GO 5.000% 6/1/21 2,525 2,575Maryland GO 5.000% 8/1/21 1,000 1,028Maryland GO 5.000% 3/15/22 1,000 1,058Maryland GO 5.000% 8/1/22 1,790 1,926Maryland GO 5.000% 8/1/22 1,500 1,614Maryland GO 5.000% 3/15/23 1,145 1,267Maryland GO 4.000% 8/1/23 2,670 2,933Maryland GO 5.000% 8/1/23 1,920 2,158Maryland GO 5.000% 8/1/23 1,670 1,877Maryland GO 5.000% 3/15/24 1,100 1,269Maryland GO 5.000% 8/1/25 6,785 8,270Maryland GO 5.000% 3/15/26 1,235 1,539Maryland GO 4.000% 8/1/26 1,970 2,163Maryland GO 4.000% 3/1/29 3,000 3,123
Tax-Managed Balanced Fund
37
CouponMaturity
Date
FaceAmount
($000)
MarketValue•
($000)
Maryland GO 4.000% 6/1/29 2,000 2,237Maryland GO 3.250% 8/1/30 1,000 1,063Maryland GO 5.000% 8/1/31 5,000 6,561Maryland Health & Higher Educational Facilities AuthorityRevenue (Adventist Healthcare Obligated Group) 5.500% 1/1/31 1,950 2,383
5 Maryland Health & Higher Educational Facilities AuthorityRevenue (Adventist Healthcare) 5.000% 1/1/28 165 194
Maryland Health & Higher Educational Facilities AuthorityRevenue (Anne Arundel Health System) 5.000% 7/1/27 500 531
Maryland Health & Higher Educational Facilities AuthorityRevenue (Anne Arundel Health System) 5.000% 7/1/31 750 913
Maryland Health & Higher Educational Facilities AuthorityRevenue (Johns Hopkins Health System Obligated Group)Prere. 5.000% 7/1/22 500 536
Maryland Health & Higher Educational Facilities AuthorityRevenue (Meritus Medical Center Inc.) 5.000% 7/1/33 1,215 1,401
Maryland Health & Higher Educational Facilities AuthorityRevenue (University of Pittsburgh Medical Center) 4.000% 4/15/38 1,000 1,181
Montgomery County MD GO 5.000% 11/1/22 1,000 1,088Montgomery County MD GO 5.000% 11/1/22 1,275 1,387Montgomery County MD GO 4.000% 11/1/28 2,390 2,948Montgomery County MD GO 4.000% 12/1/30 1,555 1,753Montgomery County MD GO Prere. 4.000% 11/1/24 1,000 1,144Montgomery County MD GO Prere. 5.000% 11/1/24 1,000 1,182Prince Georges County MD GO Prere. 5.000% 9/15/21 580 600Washington MD Suburban Sanitary Commission GO 4.000% 6/15/33 1,000 1,196
82,143Massachusetts (1.3%)
Massachusetts BayTransportation Authority AssessmentRevenue 5.000% 7/1/27 2,880 3,594
Massachusetts BayTransportation Authority Sales TaxRevenue 5.250% 7/1/22 495 533
8 Massachusetts BayTransportation Authority Sales TaxRevenue 5.500% 7/1/26 410 525
Massachusetts BayTransportation Authority Sales TaxRevenue 5.000% 7/1/31 955 1,344
Massachusetts BayTransportation Authority Sales TaxRevenue 5.250% 7/1/34 1,285 1,934
Massachusetts BayTransportation Authority Sales TaxRevenue 5.000% 7/1/38 3,290 4,207
Massachusetts BayTransportation Authority Sales TaxRevenue 5.000% 7/1/40 1,125 1,433
Massachusetts Department of Transportation MetropolitanHighway System Revenue PUT 5.000% 1/1/23 1,110 1,213
Massachusetts Development Finance Agency Revenue(Boston College) 5.000% 7/1/37 1,750 2,152
Massachusetts Development Finance Agency Revenue(CareGroup Inc.) 5.000% 7/1/29 1,225 1,571
Massachusetts Development Finance Agency Revenue(CareGroup Inc.) 5.000% 7/1/38 1,085 1,341
Massachusetts Development Finance Agency Revenue(Harvard University) 5.000% 10/15/29 5,000 6,877
Massachusetts Development Finance Agency Revenue(Lahey Clinic Obligated Group) 5.000% 7/1/34 500 642
Massachusetts Development Finance Agency Revenue(UMass Memorial Medical Center) 5.000% 7/1/25 1,275 1,510
Tax-Managed Balanced Fund
38
CouponMaturity
Date
FaceAmount
($000)
MarketValue•
($000)
Massachusetts Development Finance Agency Revenue(UMass Memorial Medical Center) 5.125% 7/1/26 720 735
Massachusetts Development Finance Agency Revenue(UMass Student Housing Project) 5.000% 10/1/32 525 526
Massachusetts Development Finance Agency Revenue(Western New England University) 5.000% 9/1/32 1,105 1,336
Massachusetts Educational Financing Authority EducationLoan Revenue 5.500% 1/1/22 300 301
Massachusetts GO 5.000% 8/1/22 1,000 1,076Massachusetts GO 5.250% 8/1/23 525 593Massachusetts GO 5.000% 12/1/23 1,520 1,732Massachusetts GO 5.000% 5/1/29 2,180 2,420Massachusetts GO 5.000% 5/1/31 1,675 1,856Massachusetts GO 5.000% 9/1/31 1,500 2,130Massachusetts GO 5.250% 1/1/34 2,665 3,534Massachusetts GO 5.000% 7/1/35 1,000 1,195Massachusetts GO 3.500% 5/1/37 2,000 2,128Massachusetts GO 3.000% 11/1/39 1,500 1,697
9 Massachusetts GO, 67% of 3M USD LIBOR + 0.550% 0.694% 11/1/25 1,380 1,378Massachusetts Port Authority Revenue 5.000% 7/1/35 2,380 3,110Massachusetts School Building Authority Dedicated SalesTax Revenue 5.000% 8/15/23 645 695
Massachusetts School Building Authority Dedicated SalesTax Revenue 5.000% 8/15/31 1,500 1,808
Massachusetts School Building Authority Dedicated SalesTax Revenue 4.000% 8/15/32 600 684
Massachusetts School Building Authority Dedicated SalesTax Revenue 4.750% 8/15/32 1,335 1,572
Massachusetts School Building Authority Dedicated SalesTax Revenue 5.000% 8/15/34 1,010 1,215
Massachusetts School Building Authority Dedicated SalesTax Revenue 5.000% 2/15/36 1,500 1,701
Massachusetts School Building Authority Dedicated SalesTax Revenue 5.000% 8/15/37 1,860 2,227
Massachusetts School Building Authority Dedicated SalesTax Revenue ETM 5.000% 5/15/21 900 916
Massachusetts School Building Authority Dedicated SalesTax Revenue Prere. 5.000% 8/15/22 3,500 3,773
Massachusetts School Building Authority Dedicated SalesTax Revenue Prere. 4.750% 8/15/25 165 199
Massachusetts School Building Authority Dedicated SalesTax Revenue Prere. 5.000% 8/15/25 355 431
8 Massachusetts Special Obligation DedicatedTax Revenue 5.500% 1/1/26 510 628Massachusetts Transportation Fund Revenue 4.000% 6/1/35 1,000 1,186
8 Massachusetts Turnpike Authority Revenue (MetropolitanHighway System) 0.000% 1/1/29 880 799
MassachusettsWater Pollution Abatement Trust Revenue 5.250% 8/1/21 500 515MassachusettsWater Resources Authority Revenue 5.000% 8/1/38 7,465 10,075MassachusettsWater Resources Authority Revenue 4.000% 8/1/40 1,000 1,100MassachusettsWater Resources Authority Revenue 5.000% 8/1/40 3,000 3,666
87,813Michigan (1.4%)
15 Battle Creek MI School District GO 5.000% 5/1/25 535 640Birmingham MI City School District GO 5.000% 5/1/22 740 787
15 Chippewa Valley MI Schools GO 5.000% 5/1/33 1,000 1,20415 Dearborn MI School District GO 5.000% 5/1/34 1,200 1,350
3,15 Detroit MI City School District GO 5.250% 5/1/28 615 796
Tax-Managed Balanced Fund
39

CouponMaturity
Date
FaceAmount
($000)
MarketValue•
($000)
3 Detroit MI Downtown Development Authority TaxAllocation Revenue 5.000% 7/1/35 1,120 1,257
Detroit MIWater & Sewerage Department SewageDisposal System Revenue 5.000% 7/1/22 455 487
Detroit MIWater & Sewerage Department SewageDisposal System Revenue 5.000% 7/1/23 1,050 1,123
Detroit MIWater & Sewerage Department SewageDisposal System Revenue Prere. 5.000% 7/1/22 1,000 1,072
3 Downriver MI UtilityWastewater Authority Revenue 5.000% 4/1/34 1,020 1,274Great Lakes MIWater Authority Sewer Disposal SystemRevenue 5.000% 7/1/27 1,840 2,330
Great Lakes MIWater Authority Sewer Disposal SystemRevenue 5.000% 7/1/28 1,205 1,563
Great Lakes MIWater Authority Sewer Disposal SystemRevenue 5.000% 7/1/29 1,200 1,542
Great Lakes MIWater Authority Sewer Disposal SystemRevenue 5.000% 7/1/31 1,645 2,005
Great Lakes MIWater Authority Sewer Disposal SystemRevenue 5.000% 7/1/37 1,000 1,244
Great Lakes MIWater AuthorityWater Supply SystemRevenue 5.000% 7/1/28 1,030 1,280
Great Lakes MIWater AuthorityWater Supply SystemRevenue 5.000% 7/1/29 1,420 1,847
3 Great Lakes MIWater AuthorityWater Supply SystemRevenue 4.000% 7/1/33 1,000 1,144
Great Lakes MIWater AuthorityWater Supply SystemRevenue 5.000% 7/1/33 1,310 1,709
Great Lakes MIWater AuthorityWater Supply SystemRevenue 5.000% 7/1/40 500 644
15 Hudsonville MI Public Schools GO 5.000% 5/1/31 420 529Ingham County MI Building Authority 3.000% 5/1/34 3,900 4,349KaregnondiWater Authority MichiganWater Supply SystemRevenue (KaregnondiWater Pipeline) 5.000% 11/1/29 625 793
15 Lake Orion MI Community School District GO 5.000% 5/1/38 4,030 5,1533,15 Lincoln MI Consolidated School District GO 5.000% 5/1/24 1,000 1,15515 Marysville MI Public Schools District GO 5.000% 5/1/28 1,630 2,010
Michigan Building Authority Revenue 5.000% 10/15/32 1,395 1,719Michigan Building Authority Revenue 5.000% 4/15/33 1,000 1,197Michigan Building Authority Revenue 5.000% 4/15/36 1,235 1,512Michigan Environmental Program GO 4.000% 5/1/28 1,000 1,179Michigan Finance Authority Hospital Revenue Bonds (TrinityHealth Credit Group) Prere. 5.000% 12/1/21 920 960
9 Michigan Finance Authority Hospital Revenue Bonds (TrinityHealth Credit Group), SIFMA Municipal Swap IndexYield+ 0.850% PUT 0.940% 12/1/24 1,500 1,505
9 Michigan Finance Authority Hospital Revenue Bonds (TrinityHealth Credit Group), SIFMA Municipal Swap IndexYield+ 0.900% PUT 0.990% 12/1/25 500 502
Michigan Finance Authority Revenue 5.000% 10/1/22 500 517Michigan Finance Authority Revenue 5.000% 11/1/28 1,055 1,359Michigan Finance Authority Revenue 4.000% 11/1/32 1,740 2,157Michigan Finance Authority Revenue 5.000% 10/1/34 2,565 3,363
3 Michigan Finance Authority Revenue (Detroit Water &Sewer) 5.000% 7/1/22 1,000 1,071
3 Michigan Finance Authority Revenue (Detroit Water &Sewer) 5.000% 7/1/23 1,000 1,116
Michigan Finance Authority Revenue (Detroit Water &Sewer) 5.000% 7/1/28 750 889
Tax-Managed Balanced Fund
40

CouponMaturity
Date
FaceAmount
($000)
MarketValue•
($000)
Michigan Finance Authority Revenue (Detroit Water &Sewer) 5.000% 7/1/29 1,500 1,719
Michigan Finance Authority Revenue (Detroit Water &Sewer) 5.000% 7/1/33 1,000 1,138
Michigan Finance Authority Revenue (Henry Ford HealthSystem Obligated Group) 5.000% 11/15/26 1,210 1,517
Michigan Finance Authority Revenue (Kalamazoo CollegeProject) 5.000% 12/1/26 850 1,016
Michigan Finance Authority Revenue (Kalamazoo CollegeProject) 5.000% 12/1/27 965 1,172
Michigan Finance Authority Revenue (McLaren Health CareCorp.) 5.000% 2/15/34 1,700 2,181
Michigan Finance Authority Revenue (Sparrow ObligatedGroup) 5.000% 11/15/27 500 539
Michigan Finance Authority Revenue (Sparrow ObligatedGroup) 5.000% 11/15/36 500 533
Michigan Finance Authority Revenue (State CleanWaterRevolving Fund) 5.000% 10/1/22 2,165 2,347
Michigan Finance Authority Revenue (State CleanWaterRevolving Fund) 5.000% 10/1/36 2,000 2,600
Michigan Finance Authority Revenue (State CleanWaterRevolving Fund) Prere. 5.000% 10/1/22 1,000 1,084
Michigan Finance Authority Revenue (State CleanWaterRevolving Fund) Prere. 5.000% 10/1/22 500 542
Michigan Finance Authority Revenue (Tobacco SettlementAsset-Backed) 4.000% 6/1/37 1,000 1,191
Michigan State Housing Development Authority Revenue(Single-Family Mortgage) 3.500% 12/1/50 1,985 2,214
Michigan State Trunk Line Fund (Rebuilding MichiganProgram) 4.000% 11/15/39 5,000 6,177
Oakland University MI Revenue 5.000% 3/1/30 1,250 1,471Portage MI Public Schools GO 5.000% 11/1/34 1,250 1,499
15 Roseville MI School District GO 5.000% 5/1/34 1,665 1,960Royal Oak MI Hospital Finance Authority Hospital Revenue(William Beaumont Hospital) 5.000% 9/1/25 1,450 1,661
University of Michigan Revenue 5.000% 4/1/32 2,020 2,537Wayne County MI Airport Authority Revenue 5.000% 12/1/25 870 1,044Wayne County MI Airport Authority Revenue 5.000% 12/1/30 1,300 1,545
96,020Minnesota (0.5%)
Bloomington MN Independent School District No. 271 GO 5.000% 2/1/22 2,010 2,114Duluth MN Independent School District No. 709 COP 5.000% 2/1/27 365 453Duluth MN Independent School District No. 709 COP 5.000% 2/1/28 350 445Farmington MN Independent School District No. 192 GO 5.000% 2/1/21 1,800 1,806Minneapolis & St. Paul MN Metropolitan AirportsCommission Revenue 5.000% 1/1/26 450 551
Minneapolis MN Special School District No. 1 COP 5.000% 2/1/26 1,855 2,035Minnesota GO 5.000% 8/1/22 1,500 1,615Minnesota GO 5.000% 8/1/24 1,615 1,893Minnesota GO 5.000% 8/1/25 1,500 1,828Minnesota GO 5.000% 8/1/27 1,005 1,220Minnesota GO 5.000% 8/1/28 3,000 4,002Minnesota GO 5.000% 9/1/30 1,235 1,574Minnesota Higher Education Facilities Authority Revenue(Hamline University) 5.000% 10/1/35 595 654
Minnesota Housing Finance Agency (HousingInfrastructure) 4.000% 8/1/36 1,500 1,846
Tax-Managed Balanced Fund
41
CouponMaturity
Date
FaceAmount
($000)
MarketValue•
($000)
Minnesota Housing Finance Agency Residential HousingRevenue 2.800% 12/1/47 1,232 1,272
Osseo MN Independent School District No. 279 GO 5.000% 2/1/28 1,000 1,263Owatonna MN Independent School District No. 761 GO 3.000% 2/1/32 1,190 1,329Rochester MN Health Care Facilities Revenue (Mayo Clinic) 5.000% 11/15/31 1,000 1,419St. Francis MN Independent School District No. 15 GO 5.000% 2/1/26 385 422St. Francis MN Independent School District No. 15 GO 5.000% 2/1/27 485 531St. Francis MN Independent School District No. 15 GO 4.000% 2/1/29 515 550St. Francis MN Independent School District No. 15 GO 4.000% 2/1/30 550 587St. Francis MN Independent School District No. 15 GO 4.000% 2/1/32 775 827University of Minnesota Revenue 5.000% 4/1/23 1,115 1,235West St. Paul MN Independent School District No. 197Revenue (Mendota Heights-Eagan) 4.000% 2/1/28 1,000 1,193
White Bear Lake MN Independent School District No. 624GO 3.000% 2/1/30 1,150 1,308
33,972Mississippi (1.4%)
Mississippi Business Finance Corp. Gulf Opportunity ZoneIndustrial Development Revenue VRDO 0.100% 1/4/21 9,840 9,840
Mississippi Business Finance Corp. Gulf Opportunity ZoneIndustrial Development Revenue VRDO 0.100% 1/4/21 71,560 71,560
Mississippi Development Bank Special Obligation Revenue(Marshall County Industrial Development HighwayRefunding Project) 5.000% 1/1/26 1,335 1,630
Mississippi Development Bank Special Obligation Revenue(Rankin County School District) 5.000% 6/1/27 500 639
Mississippi Development Bank Special Obligation Revenue(Rankin County School District) 5.000% 6/1/30 1,755 2,207
Mississippi GamingTax Revenue 5.000% 10/15/36 1,500 1,817Mississippi GO 5.000% 11/1/29 1,000 1,208Mississippi Hospital Equipment & Facilities AuthorityRevenue (Forrest General Hospital Inc.) 5.000% 1/1/29 830 1,072
Mississippi Hospital Equipment & Facilities AuthorityRevenue (Forrest General Hospital Inc.) 5.000% 1/1/30 625 820
Mississippi Hospital Equipment & Facilities AuthorityRevenue (North Mississippi Health Services) 5.000% 10/1/27 1,000 1,273
Mississippi Institutions of Higher Learning Revenue(University of Mississippi Medical Center) 4.000% 6/1/34 1,000 1,165
Mississippi State University Educational Building Corp.Revenue 5.000% 8/1/30 575 727
Mississippi State University Educational Building Corp.Revenue 5.000% 8/1/31 515 646
Mississippi State University Educational Building Corp.Revenue Prere. 5.000% 8/1/23 1,000 1,124
95,728Missouri (0.7%)
3 Columbia MOWater & Electric System Revenue 3.000% 10/1/31 1,285 1,461Jackson County MO School District No. 4 GO (BlueSprings) 6.000% 3/1/38 1,000 1,387
Jackson County MO Special Obligation Revenue (TrumanSports Complex Project) 5.000% 12/1/31 1,500 1,711
Jackson County MO Special Obligation Revenue (TrumanSports Complex Project) 5.000% 12/1/26 1,215 1,395
Kansas City MO Sanitary Sewer System Revenue 5.000% 1/1/32 1,020 1,309Little Blue Valley MO Sewer District Revenue 3.000% 9/1/33 1,505 1,662Metropolitan St. Louis MO Sewer DistrictWastewaterSystem Revenue 5.000% 5/1/34 525 657
Tax-Managed Balanced Fund
42

CouponMaturity
Date
FaceAmount
($000)
MarketValue•
($000)
Metropolitan St. Louis MO Sewer DistrictWastewaterSystem Revenue 4.000% 5/1/41 4,130 4,668
2 Missouri Development Finance Board Cultural FacilitiesRevenue (Nelson Gallery Foundation) VRDO 0.090% 1/4/21 16,980 16,980
Missouri Health & Educational Facilities AuthorityEducational Facilities Revenue (St. Louis College ofPharmacy Project) 5.000% 5/1/30 1,000 1,063
Missouri Health & Educational Facilities AuthorityEducational Facilities Revenue (St. Louis College ofPharmacy Project) 5.000% 5/1/34 880 930
Missouri Health & Educational Facilities Authority HealthFacilities Revenue (SSM Health System) 5.000% 6/1/25 1,480 1,701
Missouri Health & Educational Facilities Authority HealthFacilities Revenue (St. Luke's Health System) 5.000% 12/1/31 1,000 1,281
Missouri Health & Educational Facilities Authority Revenue(Children's Mercy Hospital) 5.000% 5/15/36 1,100 1,300
Missouri Health & Educational Facilities Authority Revenue(Mercy Health) 5.000% 11/15/34 1,500 1,717
Missouri Highways &Transportation Commission RoadRevenue 5.000% 2/1/23 710 780
Missouri Joint Municipal Electric Utility Commission PowerProject Revenue (Iatan 2 Project) 5.000% 12/1/34 1,425 1,659
Missouri Joint Municipal Electric Utility Commission PowerProject Revenue (Prairie Project) 5.000% 12/1/34 1,010 1,203
3 St. Louis MO Parking Revenue 5.000% 12/15/23 715 806St. Louis MO Sewer &Wastewater Revenue 5.000% 5/1/36 1,000 1,190
44,860Montana (0.0%)
Montana Facility Finance Authority Hospital Revenue(Benefis Health System) 5.000% 2/15/32 825 1,004
Multiple States (0.1%)16 Federal Home Loan Mortgage Corp. Multifamily Housing
Revenue 2.650% 9/15/30 1,565 1,7044,16 Federal Home Loan Mortgage Corp. Multifamily Housing
Revenue 2.600% 9/15/33 1,985 2,1624,16 Federal Home Loan Mortgage Corp. Multifamily Housing
Revenue 2.625% 6/15/35 1,955 2,1464,16 Federal Home Loan Mortgage Corp. Multifamily Housing
Revenue 2.650% 6/15/35 1,380 1,51616 Federal Home Loan Mortgage Corp. Multifamily Housing
Revenue 3.400% 1/25/36 485 5734,16 Federal Home Loan Mortgage Corp. Multifamily Housing
Revenue 2.650% 6/15/36 1,295 1,419
9,520Nebraska (0.3%)
Central Plains Energy Project Nebraska Gas ProjectRevenue PUT 5.000% 1/1/24 280 315
Central Plains Energy Project Nebraska Gas ProjectRevenue (Project No. 3) 5.000% 9/1/27 1,000 1,244
Central Plains Energy Project Nebraska Gas ProjectRevenue (Project No. 3) 5.000% 9/1/42 1,000 1,464
2 Central Plains Energy Project Nebraska Gas SupplyRevenue PUT 4.000% 8/1/25 7,315 8,402
Lincoln County NE Hospital Authority No. 1 HospitalRevenue (Great Plains Regional Medical Center Project)Prere. 5.000% 11/1/21 750 779
Lincoln NE Electric System Revenue Prere. 5.000% 9/1/22 135 145
Tax-Managed Balanced Fund
43

CouponMaturity
Date
FaceAmount
($000)
MarketValue•
($000)
Lincoln NE Electric System Revenue Prere. 5.000% 9/1/22 275 297Municipal Energy Agency of Nebraska Power SupplySystem Revenue 5.000% 4/1/31 345 364
Nebraska Public Power District Revenue 5.000% 1/1/30 1,000 1,043Nebraska Public Power District Revenue 5.000% 1/1/32 1,500 1,564Omaha NE Public Power District Electric Revenue 5.000% 2/1/29 1,270 1,553Omaha NE Sewer Revenue 5.000% 11/15/29 2,500 2,925Scotts Bluff County NE Hospital Authority Revenue(RegionalWest Medical Center) 5.000% 2/1/24 1,685 1,847
21,942Nevada (0.7%)
Carson City NV Hospital Revenue (CarsonTahoe RegionalMedical Center) 5.000% 9/1/26 560 688
Carson City NV Hospital Revenue (CarsonTahoe RegionalMedical Center) 5.000% 9/1/28 1,220 1,510
Carson City NV Hospital Revenue (CarsonTahoe RegionalMedical Center) Prere. 5.000% 9/1/22 1,740 1,872
Clark County NV Airport Improvement Revenue 5.000% 7/1/30 1,950 2,570Clark County NV GO 4.000% 6/1/32 1,505 1,780Clark County NV GO 4.000% 7/1/32 2,190 2,594Clark County NV GO 5.000% 7/1/33 1,000 1,082Clark County NV Highway Improvement Motor Vehicle FuelTax Revenue 5.000% 7/1/31 1,575 1,799
Clark County NV Highway Improvement Motor Vehicle FuelTax Revenue 5.000% 7/1/36 1,075 1,327
Clark County NV Passenger Facility Charge Revenue (LasVegas McCarran International Airport) 5.000% 7/1/31 1,000 1,310
3 Clark County NV School District GO 5.000% 6/15/27 3,000 3,8073 Clark County NV School District GO 4.000% 6/15/33 1,820 2,1026 Clark County NV School District GO 3.000% 6/15/34 1,000 1,1033 Clark County NV School District GO 4.000% 6/15/40 850 1,018
Las Vegas ValleyWater District Nevada GO 5.000% 6/1/21 2,000 2,039Las Vegas ValleyWater District Nevada GO 5.000% 6/1/24 1,190 1,381Las Vegas ValleyWater District Nevada GO 5.000% 12/1/27 1,990 2,381Las Vegas ValleyWater District Nevada GO 5.000% 6/1/35 1,870 2,272Las Vegas ValleyWater District Nevada GO 5.000% 6/1/38 1,000 1,293Las Vegas ValleyWater District Nevada GO 5.000% 6/1/39 1,500 1,935Nevada GO 5.000% 4/1/22 1,740 1,845Nevada GO 5.000% 11/1/23 1,465 1,659Nevada GO 5.000% 11/1/25 1,015 1,218Nevada Highway Improvement Revenue (Motor VehicleFuel Tax) 4.000% 12/1/32 1,660 1,953
Reno NV Sales Tax Revenue (RenoTransportation RailAccess) 5.000% 6/1/27 250 297
Reno NV Sales Tax Revenue (RenoTransportation RailAccess) 5.000% 6/1/28 250 302
Reno NV Sales Tax Revenue (RenoTransportation RailAccess) 5.000% 6/1/32 250 291
Reno NV Sales Tax Revenue (RenoTransportation RailAccess) 5.000% 6/1/33 250 289
Truckee Meadows NVWater AuthorityWater Revenue 5.000% 7/1/34 1,510 1,839
45,556
Tax-Managed Balanced Fund
44
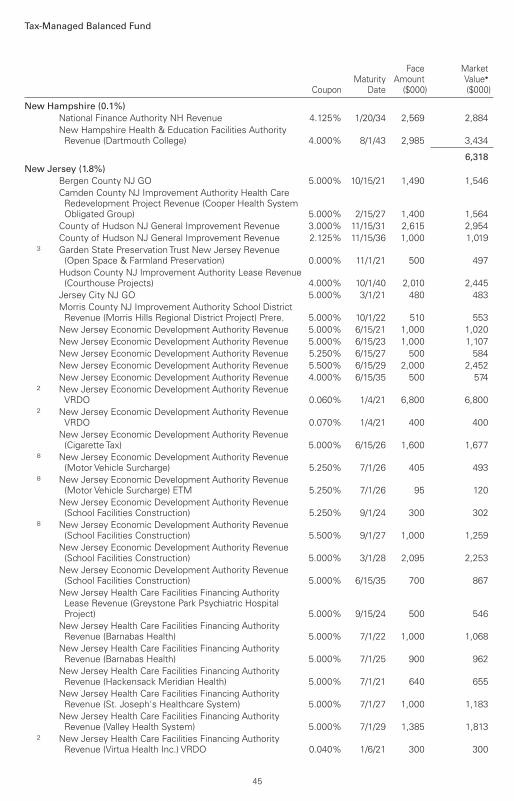
CouponMaturity
Date
FaceAmount
($000)
MarketValue•
($000)
New Hampshire (0.1%)National Finance Authority NH Revenue 4.125% 1/20/34 2,569 2,884New Hampshire Health & Education Facilities AuthorityRevenue (Dartmouth College) 4.000% 8/1/43 2,985 3,434
6,318New Jersey (1.8%)
Bergen County NJ GO 5.000% 10/15/21 1,490 1,546Camden County NJ Improvement Authority Health CareRedevelopment Project Revenue (Cooper Health SystemObligated Group) 5.000% 2/15/27 1,400 1,564
County of Hudson NJ General Improvement Revenue 3.000% 11/15/31 2,615 2,954County of Hudson NJ General Improvement Revenue 2.125% 11/15/36 1,000 1,019
3 Garden State Preservation Trust New Jersey Revenue(Open Space & Farmland Preservation) 0.000% 11/1/21 500 497
Hudson County NJ Improvement Authority Lease Revenue(Courthouse Projects) 4.000% 10/1/40 2,010 2,445
Jersey City NJ GO 5.000% 3/1/21 480 483Morris County NJ Improvement Authority School DistrictRevenue (Morris Hills Regional District Project) Prere. 5.000% 10/1/22 510 553
New Jersey Economic Development Authority Revenue 5.000% 6/15/21 1,000 1,020New Jersey Economic Development Authority Revenue 5.000% 6/15/23 1,000 1,107New Jersey Economic Development Authority Revenue 5.250% 6/15/27 500 584New Jersey Economic Development Authority Revenue 5.500% 6/15/29 2,000 2,452New Jersey Economic Development Authority Revenue 4.000% 6/15/35 500 574
2 New Jersey Economic Development Authority RevenueVRDO 0.060% 1/4/21 6,800 6,800
2 New Jersey Economic Development Authority RevenueVRDO 0.070% 1/4/21 400 400
New Jersey Economic Development Authority Revenue(Cigarette Tax) 5.000% 6/15/26 1,600 1,677
8 New Jersey Economic Development Authority Revenue(Motor Vehicle Surcharge) 5.250% 7/1/26 405 493
8 New Jersey Economic Development Authority Revenue(Motor Vehicle Surcharge) ETM 5.250% 7/1/26 95 120
New Jersey Economic Development Authority Revenue(School Facilities Construction) 5.250% 9/1/24 300 302
8 New Jersey Economic Development Authority Revenue(School Facilities Construction) 5.500% 9/1/27 1,000 1,259
New Jersey Economic Development Authority Revenue(School Facilities Construction) 5.000% 3/1/28 2,095 2,253
New Jersey Economic Development Authority Revenue(School Facilities Construction) 5.000% 6/15/35 700 867
New Jersey Health Care Facilities Financing AuthorityLease Revenue (Greystone Park Psychiatric HospitalProject) 5.000% 9/15/24 500 546
New Jersey Health Care Facilities Financing AuthorityRevenue (Barnabas Health) 5.000% 7/1/22 1,000 1,068
New Jersey Health Care Facilities Financing AuthorityRevenue (Barnabas Health) 5.000% 7/1/25 900 962
New Jersey Health Care Facilities Financing AuthorityRevenue (Hackensack Meridian Health) 5.000% 7/1/21 640 655
New Jersey Health Care Facilities Financing AuthorityRevenue (St. Joseph's Healthcare System) 5.000% 7/1/27 1,000 1,183
New Jersey Health Care Facilities Financing AuthorityRevenue (Valley Health System) 5.000% 7/1/29 1,385 1,813
2 New Jersey Health Care Facilities Financing AuthorityRevenue (Virtua Health Inc.) VRDO 0.040% 1/6/21 300 300
Tax-Managed Balanced Fund
45

CouponMaturity
Date
FaceAmount
($000)
MarketValue•
($000)
2 New Jersey NJ GO VRDO 0.100% 1/4/21 6,300 6,300New JerseyTransportation Trust Fund Authority FederalHighway Reimbursement Revenue 5.000% 6/15/25 1,300 1,521
New JerseyTransportation Trust Fund Authority FederalHighway Reimbursement Revenue 5.000% 6/15/28 1,380 1,632
New JerseyTransportation Trust Fund Authority FederalHighway Reimbursement Revenue 5.000% 6/15/28 620 733
New JerseyTransportation Trust Fund Authority FederalHighway Reimbursement Revenue 5.000% 6/15/29 1,400 1,643
New JerseyTransportation Trust Fund Authority ProgramBonds 4.000% 6/15/37 1,000 1,147
New JerseyTransportation Trust Fund Authority Revenue 5.000% 12/15/27 1,000 1,232New JerseyTransportation Trust Fund Authority Revenue 5.000% 12/15/30 1,285 1,595New JerseyTransportation Trust Fund Authority Revenue 5.000% 6/15/31 1,000 1,238New JerseyTransportation Trust Fund Authority Revenue 5.000% 12/15/33 1,115 1,363New JerseyTransportation Trust Fund Authority Revenue 5.000% 12/15/34 1,115 1,361New JerseyTransportation Trust Fund Authority Revenue 5.000% 12/15/35 1,015 1,235New JerseyTransportation Trust Fund AuthorityTransportation Program Revenue 5.250% 6/15/33 1,500 1,722
New JerseyTransportation Trust Fund AuthorityTransportation Program Revenue 5.000% 6/15/36 2,125 2,279
8 New JerseyTransportation Trust Fund AuthorityTransportation System Revenue 5.250% 12/15/21 345 361
12,14 New JerseyTransportation Trust Fund AuthorityTransportation System Revenue 5.500% 12/15/21 150 157
New JerseyTransportation Trust Fund AuthorityTransportation System Revenue 5.500% 12/15/22 1,315 1,439
New JerseyTransportation Trust Fund AuthorityTransportation System Revenue 5.500% 12/15/23 605 689
New JerseyTransportation Trust Fund AuthorityTransportation System Revenue 5.000% 12/15/24 1,000 1,153
7 New JerseyTransportation Trust Fund AuthorityTransportation System Revenue 0.000% 12/15/26 2,000 1,832
New JerseyTransportation Trust Fund AuthorityTransportation System Revenue 5.000% 12/15/27 5,260 6,480
New JerseyTransportation Trust Fund AuthorityTransportation System Revenue 5.500% 6/15/31 500 510
8 New JerseyTransportation Trust Fund AuthorityTransportation System Revenue 0.000% 12/15/31 1,000 795
New JerseyTransportation Trust Fund AuthorityTransportation System Revenue 5.000% 6/15/32 700 785
New JerseyTurnpike Authority Revenue 5.000% 1/1/26 1,185 1,292New JerseyTurnpike Authority Revenue 5.000% 1/1/28 1,190 1,294New JerseyTurnpike Authority Revenue 5.000% 1/1/32 1,000 1,264New JerseyTurnpike Authority Revenue 4.000% 1/1/33 1,070 1,253New JerseyTurnpike Authority Revenue 4.000% 1/1/34 2,500 2,918New JerseyTurnpike Authority Revenue 5.000% 1/1/35 1,000 1,217New JerseyTurnpike Authority Revenue Prere. 5.000% 1/1/22 1,000 1,048
2,4 New JerseyTurnpike Authority RevenueTOB VRDO 0.290% 1/7/21 5,650 5,650South JerseyTransportation Authority New JerseyTransportation System Revenue 5.000% 11/1/39 1,025 1,155
South JerseyTransportation Authority New JerseyTransportation System Revenue Prere. 5.000% 11/1/22 500 543
State of New Jersey Covid 19 Emergency Bonds GO 5.000% 6/1/25 1,000 1,190State of New Jersey Covid 19 Emergency Bonds GO 5.000% 6/1/27 1,500 1,876State of New Jersey Covid 19 Emergency Bonds GO 5.000% 6/1/28 1,750 2,231State of New Jersey Covid 19 Emergency Bonds GO 5.000% 6/1/29 1,000 1,295
Tax-Managed Balanced Fund
46

CouponMaturity
Date
FaceAmount
($000)
MarketValue•
($000)
State of New Jersey Covid 19 Emergency Bonds GO 4.000% 6/1/30 1,000 1,225Tobacco Settlement Financing Corp. New Jersey Revenue 5.000% 6/1/26 1,825 2,258Tobacco Settlement Financing Corp. New Jersey Revenue 3.200% 6/1/27 280 288Tobacco Settlement Financing Corp. New Jersey Revenue 5.000% 6/1/27 3,200 4,070Tobacco Settlement Financing Corp. New Jersey Revenue 5.000% 6/1/30 685 879Tobacco Settlement Financing Corp. New Jersey Revenue 5.000% 6/1/31 1,000 1,277Tobacco Settlement Financing Corp. New Jersey Revenue 5.000% 6/1/35 450 564Tobacco Settlement Financing Corp. New Jersey Revenue 5.000% 6/1/36 1,500 1,872Tobacco Settlement Financing Corp. New Jersey Revenue 5.000% 6/1/37 1,000 1,245Toms River NJ Board of Education GO 3.000% 7/15/30 3,000 3,307Toms River NJ Board of Education GO 3.000% 7/15/33 3,570 3,859
121,768New Mexico (0.2%)
Albuquerque NM GO 5.000% 7/1/23 5,000 5,593Albuquerque NM Municipal School District No. 12 GO 5.000% 8/1/22 290 312Albuquerque NM Municipal School District No. 12 GO 5.000% 8/1/23 265 296New Mexico Finance Authority Revenue 5.000% 6/1/23 1,210 1,349New Mexico Finance Authority Transportation Revenue 4.000% 6/15/26 2,000 2,106New Mexico Finance Authority Transportation Revenue 5.000% 6/15/27 1,045 1,209New Mexico Hospital Equipment Loan Council HospitalSystem Revenue (Presbyterian Healthcare Services) 5.000% 8/1/28 1,445 1,719
2 New Mexico Municipal Energy Acquisition Authority GasSupply Revenue PUT 5.000% 5/1/25 805 952
13,536New York (7.1%)
Battery Park City NY Authority Revenue 5.000% 11/1/38 750 999Brooklyn Arena Local Development Corp. NY Pilot RevenueRefunding (Barclays Center) 5.000% 7/15/30 700 814
Brooklyn Arena Local Development Corp. NY Pilot RevenueRefunding (Barclays Center) 5.000% 7/15/42 690 778
Dutchess County NY Local Development Corp. (CulinaryInstitute of America Project) 5.000% 7/1/33 200 222
Dutchess County NY Local Development Corp. (CulinaryInstitute of America Project) 5.000% 7/1/34 240 266
Erie County NY Fiscal Stability Authority Revenue 5.000% 9/1/30 500 642Erie County NY Industrial Development Agency SchoolFacility Revenue (Buffalo City School District Project) 5.250% 5/1/31 500 508
3 Hempstead NY GO 4.000% 4/1/29 1,420 1,617HudsonYards Infrastructure Corp. New York Revenue 5.000% 2/15/31 1,550 1,914HudsonYards Infrastructure Corp. New York Revenue 5.000% 2/15/36 1,500 1,822HudsonYards Infrastructure Corp. New York Revenue 5.000% 2/15/37 500 606Long Island NY Power Authority Electric System Revenue 5.000% 9/1/24 130 140Long Island NY Power Authority Electric System Revenue 5.000% 9/1/33 1,185 1,611Long Island NY Power Authority Electric System Revenue 5.000% 9/1/35 1,075 1,381Metropolitan Transportation Authority NY BAN 5.000% 5/15/21 3,000 3,031Metropolitan Transportation Authority NY BAN 5.000% 5/15/22 9,100 9,460Metropolitan Transportation Authority NY Revenue 5.000% 2/1/23 7,000 7,417Metropolitan Transportation Authority NY Revenue 5.000% 11/15/27 1,000 1,159Metropolitan Transportation Authority NY Revenue 5.000% 11/15/29 1,115 1,286Metropolitan Transportation Authority NY Revenue 5.000% 11/15/34 2,500 3,118Metropolitan Transportation Authority NY Revenue 4.000% 11/15/40 1,735 1,920Metropolitan Transportation Authority NY Revenue 5.000% 11/15/43 1,250 1,520Metropolitan Transportation Authority NY Revenue PUT 5.000% 11/15/22 8,095 8,511Metropolitan Transportation Authority NY Revenue PUT 5.000% 5/15/24 7,000 7,639
Tax-Managed Balanced Fund
47

CouponMaturity
Date
FaceAmount
($000)
MarketValue•
($000)
Monroe County NY Industrial Development Agency SchoolFacility Revenue (Rochester Schools ModernizationProject) 5.000% 5/1/31 1,970 2,469
Monroe County NY Industrial Development Corp. Revenue(University of Rochester Project) 5.000% 7/1/37 1,000 1,230
Monroe County NY Industrial Development Corp. Revenue(University of Rochester Projects) 5.000% 12/1/28 555 712
Monroe County NY Industrial Development Revenue(University of Rochester Project) 5.000% 7/1/23 2,000 2,235
Nassau County NY GO 5.000% 4/1/23 1,000 1,095New York City NY GO 5.000% 8/1/21 2,000 2,055New York City NY GO 5.000% 8/1/21 515 529New York City NY GO 5.000% 8/1/21 1,745 1,793New York City NY GO 5.000% 8/1/22 705 757New York City NY GO 5.000% 8/1/22 1,290 1,385New York City NY GO 5.000% 8/1/23 400 430New York City NY GO 5.000% 8/1/23 1,505 1,685New York City NY GO 5.000% 8/1/24 1,000 1,164New York City NY GO 5.000% 8/1/25 770 809New York City NY GO 5.000% 8/1/25 1,245 1,503New York City NY GO 5.000% 8/1/25 1,310 1,581New York City NY GO 5.000% 8/1/25 1,000 1,207New York City NY GO 5.000% 6/1/26 2,450 2,938New York City NY GO 5.000% 8/1/26 500 537New York City NY GO 5.000% 8/1/26 1,000 1,097New York City NY GO 5.000% 8/1/28 5,000 6,566New York City NY GO 5.000% 11/1/29 5,000 6,747New York City NY GO 5.000% 8/1/30 1,000 1,116New York City NY GO 5.000% 12/1/32 1,755 2,155New York City NY GO 5.000% 12/1/33 1,775 2,177New York City NY GO 5.000% 8/1/34 1,000 1,337New York City NY GO 5.000% 12/1/35 1,120 1,369New York City NY GO 4.000% 8/1/37 2,000 2,376New York City NY GO 4.000% 10/1/37 2,680 3,192New York City NY GO Prere. 5.000% 8/1/21 365 375New York City NY GO Prere. 5.000% 10/1/21 500 518New York City NY GO Prere. 5.000% 3/1/23 1,340 1,478
2 New York City NY GO VRDO 0.080% 1/4/21 2,700 2,7002 New York City NY GO VRDO 0.080% 1/4/21 25,000 25,0002 New York City NY GO VRDO 0.100% 1/4/21 3,575 3,5752 New York City NY GO VRDO 0.100% 1/4/21 3,750 3,750
New York City NY Health & Hospital Corp. Revenue (HealthSystem) 5.000% 2/15/30 575 578
New York City NY Housing Development Corp.Multi-Family Housing Revenue 5.250% 7/1/29 1,000 1,110
New York City NY Housing Development Corp.Multi-Family Housing Revenue 3.700% 11/1/38 2,000 2,179
17 New York City NY Housing Development Corp.Multi-Family Housing Revenue 2.350% 11/1/40 2,000 2,024
17 New York City NY Housing Development Corp.Multi-Family Housing Revenue PUT 0.700% 5/1/25 400 400
New York City NY Housing Development Corp.Multi-Family Housing Revenue PUT 2.950% 2/1/26 1,000 1,092
New York City NY Housing Development Corp.Multi-Family Housing Revenue (Sustainable NeighborhoodBonds) 3.000% 11/1/39 1,000 1,059
Tax-Managed Balanced Fund
48

CouponMaturity
Date
FaceAmount
($000)
MarketValue•
($000)
3 New York City NY Industrial Development Agency Revenue(Yankee Stadium Project) 3.000% 3/1/38 2,000 2,179
3 New York City NY Industrial Development Agency Revenue(Yankee Stadium Projects) 3.000% 3/1/36 2,000 2,193
New York City NY Municipal Water Finance AuthorityWater& Sewer System Revenue 5.000% 6/15/27 1,350 1,629
New York City NY Municipal Water Finance AuthorityWater& Sewer System Revenue 5.000% 6/15/31 500 511
New York City NY Municipal Water Finance AuthorityWater& Sewer System Revenue 5.250% 6/15/33 1,000 1,289
New York City NY Municipal Water Finance AuthorityWater& Sewer System Revenue 5.000% 6/15/36 2,000 2,423
New York City NY Municipal Water Finance AuthorityWater& Sewer System Revenue 5.000% 6/15/38 1,000 1,273
New York City NY Municipal Water Finance AuthorityWater& Sewer System Revenue 5.000% 6/15/39 2,075 2,459
New York City NY Municipal Water Finance AuthorityWater& Sewer System Revenue 5.000% 6/15/39 2,500 3,230
2 New York City NY Municipal Water Finance AuthorityWater& Sewer System Revenue VRDO 0.100% 1/4/21 6,100 6,100
2 New York City NY Municipal Water Finance AuthorityWater& Sewer System Revenue VRDO 0.100% 1/4/21 3,000 3,000
New York City NYTransitional Finance Authority BuildingAid Revenue 5.000% 7/15/24 550 589
New York City NYTransitional Finance Authority BuildingAid Revenue 5.000% 7/15/28 1,730 2,068
New York City NYTransitional Finance Authority BuildingAid Revenue 5.000% 7/15/29 2,000 2,386
New York City NYTransitional Finance Authority BuildingAid Revenue 5.000% 7/15/30 1,045 1,264
New York City NYTransitional Finance Authority BuildingAid Revenue 5.000% 7/15/32 250 267
New York City NYTransitional Finance Authority BuildingAid Revenue 5.000% 7/15/35 1,635 2,067
New York City NYTransitional Finance Authority BuildingAid Revenue 4.000% 7/15/38 1,750 2,037
New York City NYTransitional Finance Authority Future TaxRevenue 5.000% 11/1/22 1,140 1,238
New York City NYTransitional Finance Authority Future TaxRevenue 5.000% 11/1/25 460 478
New York City NYTransitional Finance Authority Future TaxRevenue 5.000% 11/1/28 1,325 1,599
New York City NYTransitional Finance Authority Future TaxRevenue 5.000% 5/1/29 850 939
New York City NYTransitional Finance Authority Future TaxRevenue 5.000% 2/1/30 500 546
New York City NYTransitional Finance Authority Future TaxRevenue 5.250% 2/1/30 440 442
New York City NYTransitional Finance Authority Future TaxRevenue 5.000% 2/1/31 500 502
New York City NYTransitional Finance Authority Future TaxRevenue 5.000% 5/1/31 300 318
New York City NYTransitional Finance Authority Future TaxRevenue 5.000% 11/1/31 500 541
New York City NYTransitional Finance Authority Future TaxRevenue 5.000% 8/1/32 1,250 1,446
New York City NYTransitional Finance Authority Future TaxRevenue 5.000% 11/1/32 500 540
Tax-Managed Balanced Fund
49

CouponMaturity
Date
FaceAmount
($000)
MarketValue•
($000)
New York City NYTransitional Finance Authority Future TaxRevenue 5.000% 11/1/32 1,500 1,804
New York City NYTransitional Finance Authority Future TaxRevenue 5.000% 5/1/34 500 529
New York City NYTransitional Finance Authority Future TaxRevenue 5.000% 8/1/34 1,450 1,674
New York City NYTransitional Finance Authority Future TaxRevenue 5.000% 8/1/34 1,710 2,067
New York City NYTransitional Finance Authority Future TaxRevenue 5.000% 11/1/34 1,565 1,870
New York City NYTransitional Finance Authority Future TaxRevenue 5.000% 2/1/35 4,000 4,654
New York City NYTransitional Finance Authority Future TaxRevenue 5.000% 8/1/35 1,525 1,891
New York City NYTransitional Finance Authority Future TaxRevenue 4.000% 11/1/35 2,500 3,086
New York City NYTransitional Finance Authority Future TaxRevenue 5.000% 11/1/35 1,745 2,081
New York City NYTransitional Finance Authority Future TaxRevenue 5.000% 5/1/36 1,580 1,941
New York City NYTransitional Finance Authority Future TaxRevenue 4.000% 8/1/36 1,235 1,438
New York City NYTransitional Finance Authority Future TaxRevenue 4.000% 11/1/36 1,000 1,195
New York City NYTransitional Finance Authority Future TaxRevenue 5.000% 8/1/37 1,680 2,071
New York City NYTransitional Finance Authority Future TaxRevenue 5.000% 5/1/38 2,500 2,744
New York City NYTransitional Finance Authority Future TaxRevenue 5.000% 8/1/38 8,000 9,188
New York City NYTransitional Finance Authority Future TaxRevenue 4.000% 11/1/38 1,000 1,185
New York City NYTransitional Finance Authority Future TaxRevenue 5.000% 8/1/42 3,000 3,432
New York City NYTransitional Finance Authority Future TaxRevenue Prere. 5.250% 2/1/21 60 60
2 New York City NYTransitional Finance Authority Future TaxRevenue VRDO 0.080% 1/4/21 2,600 2,600
2 New York City NYTransitional Finance Authority Future TaxRevenue VRDO 0.080% 1/4/21 6,600 6,600
2 New York City NYTransitional Finance Authority Future TaxRevenue VRDO 0.100% 1/4/21 5,330 5,330
New York City NYTransitional Finance Authority Future TaxSecured Revenue 5.000% 8/1/35 2,015 2,561
New York City NYTransitional Finance Authority Future TaxSecured Revenue 5.000% 8/1/36 2,030 2,577
2,4 New York City NYTransitional Finance Authority Future TaxSecured RevenueTOB VRDO 0.110% 1/7/21 4,300 4,300
New York City NYTransitional Finance Authority Revenue 5.000% 8/1/35 1,500 1,906New York City NYTransitional Finance Authority Revenue 5.000% 8/1/36 5,710 7,249New York City NYTransitional Finance Authority Revenue 5.000% 5/1/38 1,675 2,098New York City NYTransitional Finance Authority Revenue 5.000% 5/1/39 1,335 1,702New York City NYTrust for Cultural Resources Revenue(Lincoln Center for the Performing Arts Inc.) 5.000% 12/1/26 1,350 1,666
New York Liberty Development Corp. Revenue 5.000% 11/15/31 1,090 1,130New York Liberty Development Corp. Revenue (7WorldTrade Center Project) 5.000% 9/15/31 1,000 1,052
Tax-Managed Balanced Fund
50

CouponMaturity
Date
FaceAmount
($000)
MarketValue•
($000)
New York Liberty Development Corp. Revenue (GoldmanSachs Headquarters) 5.250% 10/1/35 945 1,373
New York Metropolitan Transportation Authority Revenue 5.000% 11/15/21 230 236New York Metropolitan Transportation Authority Revenue 5.000% 11/15/21 1,000 1,025
8,10 New York Metropolitan Transportation Authority Revenue 5.250% 11/15/21 325 334New York Metropolitan Transportation Authority Revenue 5.000% 11/15/23 1,045 1,131New York Metropolitan Transportation Authority Revenue 5.000% 11/15/24 2,180 2,419New York Metropolitan Transportation Authority Revenue 5.000% 11/15/25 1,135 1,290New York Metropolitan Transportation Authority Revenue 5.000% 11/15/26 1,645 1,912New York Metropolitan Transportation Authority Revenue 5.000% 11/15/28 1,675 1,937New York Metropolitan Transportation Authority Revenue 5.000% 11/15/29 1,000 1,189New York Metropolitan Transportation Authority Revenue 5.000% 11/15/30 1,000 1,187New York Metropolitan Transportation Authority Revenue 5.000% 11/15/30 1,000 1,244New York Metropolitan Transportation Authority Revenue 4.000% 11/15/31 1,445 1,579New York Metropolitan Transportation Authority Revenue 4.000% 11/15/32 1,500 1,638New York Metropolitan Transportation Authority Revenue 5.000% 11/15/33 680 714New York Metropolitan Transportation Authority RevenuePrere. 5.000% 11/15/22 820 893
New York Metropolitan Transportation Authority RevenuePrere. 5.000% 5/15/23 570 635
New York Metropolitan Transportation Authority RevenuePUT 5.000% 5/15/30 2,500 3,033
New York Metropolitan Transportation Authority Revenue(DedicatedTax Fund) 5.000% 3/1/22 2,000 2,098
New York Metropolitan Transportation Authority Revenue(DedicatedTax Fund) 0.000% 11/15/32 1,000 770
New York Metropolitan Transportation Authority Revenue(DedicatedTax Fund) 4.000% 11/15/33 1,545 1,787
New York Metropolitan Transportation Authority Revenue(HudsonYards Development) 5.000% 11/15/51 4,250 4,388
7 New York State Dormitory Authority Lease Revenue (Cityof New York Court Facilities) 5.500% 5/15/24 500 584
7 New York State Dormitory Authority Lease Revenue (Cityof New York Court Facilities) 5.500% 5/15/27 500 647
New York State Dormitory Authority Revenue 3.000% 10/1/32 1,000 1,090New York State Dormitory Authority Revenue (Icahn Schoolof Medicine at Mount Sinai) 5.000% 7/1/28 1,000 1,176
New York State Dormitory Authority Revenue (Icahn Schoolof Medicine at Mount Sinai) 5.000% 7/1/32 1,000 1,161
New York State Dormitory Authority Revenue (MontefioreObligated Group) 5.000% 9/1/27 1,700 2,084
New York State Dormitory Authority Revenue (PersonalIncomeTax) 5.000% 2/15/23 830 874
New York State Dormitory Authority Revenue (PersonalIncomeTax) 5.000% 12/15/23 1,465 1,601
New York State Dormitory Authority Revenue (PersonalIncomeTax) 5.000% 2/15/24 840 884
New York State Dormitory Authority Revenue (PersonalIncomeTax) 5.000% 2/15/25 1,500 1,789
New York State Dormitory Authority Revenue (PersonalIncomeTax) 5.000% 12/15/26 720 786
New York State Dormitory Authority Revenue (PersonalIncomeTax) 4.000% 3/15/27 1,700 1,971
New York State Dormitory Authority Revenue (PersonalIncomeTax) 5.000% 2/15/28 2,040 2,422
New York State Dormitory Authority Revenue (PersonalIncomeTax) 5.000% 3/15/29 1,085 1,289
Tax-Managed Balanced Fund
51

CouponMaturity
Date
FaceAmount
($000)
MarketValue•
($000)
New York State Dormitory Authority Revenue (PersonalIncomeTax) 5.000% 3/15/29 5,000 6,677
New York State Dormitory Authority Revenue (PersonalIncomeTax) 5.000% 3/15/30 2,000 2,289
New York State Dormitory Authority Revenue (PersonalIncomeTax) 5.000% 3/15/32 500 527
New York State Dormitory Authority Revenue (PersonalIncomeTax) 4.000% 2/15/33 1,975 2,287
New York State Dormitory Authority Revenue (PersonalIncomeTax) 5.000% 2/15/33 300 315
New York State Dormitory Authority Revenue (PersonalIncomeTax) 4.000% 2/15/34 1,905 2,197
New York State Dormitory Authority Revenue (PersonalIncomeTax) 5.000% 3/15/34 2,000 2,282
New York State Dormitory Authority Revenue (PersonalIncomeTax) 4.000% 2/15/35 1,000 1,150
New York State Dormitory Authority Revenue (PersonalIncomeTax) 5.000% 2/15/35 3,000 3,941
New York State Dormitory Authority Revenue (PersonalIncomeTax) 5.000% 2/15/35 5,000 5,878
New York State Dormitory Authority Revenue (PersonalIncomeTax) 4.000% 2/15/39 2,000 2,384
New York State Dormitory Authority Revenue (PersonalIncomeTax) 3.000% 3/15/39 3,000 3,273
New York State Dormitory Authority Revenue (PersonalIncomeTax) 3.000% 3/15/40 3,000 3,265
New York State Dormitory Authority Revenue (PersonalIncomeTax) Prere. 5.000% 2/15/22 170 179
New York State Dormitory Authority Revenue (PersonalIncomeTax) Prere. 5.000% 2/15/22 160 168
3 New York State Dormitory Authority Revenue (SchoolDistricts Financing Program) 5.000% 10/1/21 390 404
New York State Dormitory Authority Sales Tax Revenue 5.000% 3/15/25 1,295 1,550New York State Dormitory Authority Sales Tax Revenue 5.000% 3/15/32 1,480 1,844New York State Dormitory Authority Sales Tax Revenue 5.000% 3/15/33 1,795 2,186New York State Dormitory Authority Sales Tax Revenue 5.000% 3/15/35 1,420 1,689New York State Dormitory Authority Sales Tax Revenue 5.000% 3/15/35 2,000 2,426New York State Dormitory Authority Sales Tax Revenue 5.000% 3/15/36 1,500 1,889New York State Dormitory Authority Sales Tax Revenue 5.000% 3/15/37 2,160 2,711New York State Energy Research & Development AuthorityPollution Control Revenue (New York State Electric & GasCorp.) 3.500% 10/1/29 1,000 1,188
New York State Environmental Facilities Corp. Revenue(State CleanWater & DrinkingWater Revolving Funds) 5.000% 6/15/22 2,075 2,220
New York State Environmental Facilities Corp. Revenue(State CleanWater & DrinkingWater Revolving Funds) 5.000% 6/15/25 500 535
New York State Environmental Facilities Corp. Revenue(State CleanWater & DrinkingWater Revolving Funds) 5.000% 6/15/34 1,500 1,906
New York State Liberty Development Corp. LibertyRevenue (Bank of America Tower at One Bryant ParkProject) 2.450% 9/15/69 3,500 3,518
New York State Liberty Development Corp. LibertyRevenue (Bank of America Tower at One Bryant ParkProject) 2.625% 9/15/69 1,075 1,114
New York State Local Government Assistance Corp.Revenue 5.000% 4/1/21 170 172
New York State Mortgage Agency Homeowner Revenue 3.250% 10/1/50 2,500 2,774New York State Thruway Authority Revenue 5.000% 1/1/35 1,130 1,338
Tax-Managed Balanced Fund
52
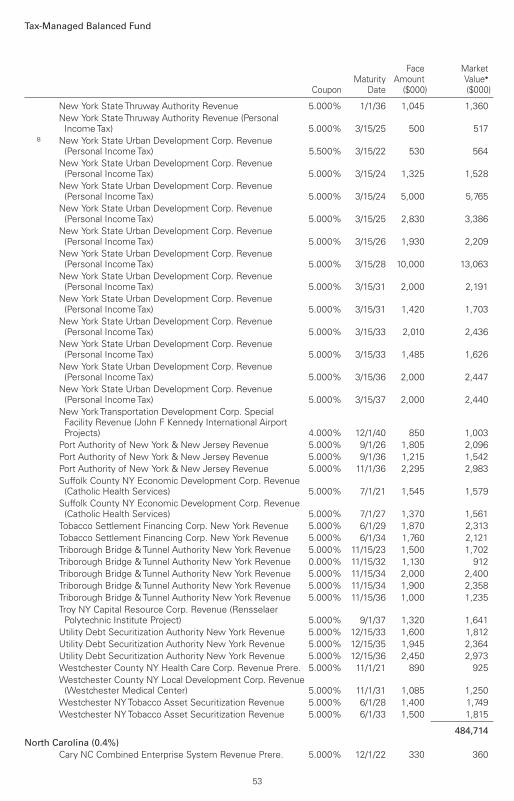
CouponMaturity
Date
FaceAmount
($000)
MarketValue•
($000)
New York State Thruway Authority Revenue 5.000% 1/1/36 1,045 1,360New York State Thruway Authority Revenue (PersonalIncomeTax) 5.000% 3/15/25 500 517
8 New York State Urban Development Corp. Revenue(Personal IncomeTax) 5.500% 3/15/22 530 564
New York State Urban Development Corp. Revenue(Personal IncomeTax) 5.000% 3/15/24 1,325 1,528
New York State Urban Development Corp. Revenue(Personal IncomeTax) 5.000% 3/15/24 5,000 5,765
New York State Urban Development Corp. Revenue(Personal IncomeTax) 5.000% 3/15/25 2,830 3,386
New York State Urban Development Corp. Revenue(Personal IncomeTax) 5.000% 3/15/26 1,930 2,209
New York State Urban Development Corp. Revenue(Personal IncomeTax) 5.000% 3/15/28 10,000 13,063
New York State Urban Development Corp. Revenue(Personal IncomeTax) 5.000% 3/15/31 2,000 2,191
New York State Urban Development Corp. Revenue(Personal IncomeTax) 5.000% 3/15/31 1,420 1,703
New York State Urban Development Corp. Revenue(Personal IncomeTax) 5.000% 3/15/33 2,010 2,436
New York State Urban Development Corp. Revenue(Personal IncomeTax) 5.000% 3/15/33 1,485 1,626
New York State Urban Development Corp. Revenue(Personal IncomeTax) 5.000% 3/15/36 2,000 2,447
New York State Urban Development Corp. Revenue(Personal IncomeTax) 5.000% 3/15/37 2,000 2,440
New York Transportation Development Corp. SpecialFacility Revenue (John F Kennedy International AirportProjects) 4.000% 12/1/40 850 1,003
Port Authority of New York & New Jersey Revenue 5.000% 9/1/26 1,805 2,096Port Authority of New York & New Jersey Revenue 5.000% 9/1/36 1,215 1,542Port Authority of New York & New Jersey Revenue 5.000% 11/1/36 2,295 2,983Suffolk County NY Economic Development Corp. Revenue(Catholic Health Services) 5.000% 7/1/21 1,545 1,579
Suffolk County NY Economic Development Corp. Revenue(Catholic Health Services) 5.000% 7/1/27 1,370 1,561
Tobacco Settlement Financing Corp. New York Revenue 5.000% 6/1/29 1,870 2,313Tobacco Settlement Financing Corp. New York Revenue 5.000% 6/1/34 1,760 2,121Triborough Bridge &Tunnel Authority New York Revenue 5.000% 11/15/23 1,500 1,702Triborough Bridge &Tunnel Authority New York Revenue 0.000% 11/15/32 1,130 912Triborough Bridge &Tunnel Authority New York Revenue 5.000% 11/15/34 2,000 2,400Triborough Bridge &Tunnel Authority New York Revenue 5.000% 11/15/34 1,900 2,358Triborough Bridge &Tunnel Authority New York Revenue 5.000% 11/15/36 1,000 1,235Troy NY Capital Resource Corp. Revenue (RensselaerPolytechnic Institute Project) 5.000% 9/1/37 1,320 1,641
Utility Debt Securitization Authority New York Revenue 5.000% 12/15/33 1,600 1,812Utility Debt Securitization Authority New York Revenue 5.000% 12/15/35 1,945 2,364Utility Debt Securitization Authority New York Revenue 5.000% 12/15/36 2,450 2,973Westchester County NY Health Care Corp. Revenue Prere. 5.000% 11/1/21 890 925Westchester County NY Local Development Corp. Revenue(Westchester Medical Center) 5.000% 11/1/31 1,085 1,250
Westchester NYTobacco Asset Securitization Revenue 5.000% 6/1/28 1,400 1,749Westchester NYTobacco Asset Securitization Revenue 5.000% 6/1/33 1,500 1,815
484,714North Carolina (0.4%)
Cary NC Combined Enterprise System Revenue Prere. 5.000% 12/1/22 330 360
Tax-Managed Balanced Fund
53

CouponMaturity
Date
FaceAmount
($000)
MarketValue•
($000)
Cary NC Combined Enterprise System Revenue Prere. 5.000% 12/1/22 170 1862 Charlotte-Mecklenburg NC Hospital Authority Revenue
(Health Care System) VRDO 0.090% 1/4/21 3,100 3,100Mecklenburg County NC Public Improvement GO 5.000% 12/1/26 1,775 2,262North Carolina GAN 5.000% 3/1/25 1,055 1,258North Carolina GAN 5.000% 3/1/27 1,015 1,203North Carolina GO 5.000% 5/1/22 360 383North Carolina GO 3.000% 5/1/33 1,000 1,163North Carolina Housing Finance Agency HomeownershipRevenue 3.000% 7/1/51 3,000 3,298
North Carolina Medical Care Commission Health CareFacilities Revenue (Presbyterian Homes Obligated) 4.000% 10/1/40 600 673
North Carolina Medical Care Commission Health CareFacilities Revenue (Vidant Health) 5.000% 6/1/21 1,000 1,018
North Carolina Medical Care Commission Health CareFacilities Revenue (WakeMed) 5.000% 10/1/27 1,000 1,069
North Carolina Medical Care Commission Hospital (MosesCone Health System) VRDO 0.110% 1/7/21 2,025 2,025
North Carolina Medical Care Commission Hospital Revenue(Southeastern Regional Medical Center) 5.000% 6/1/24 850 900
North Carolina Turnpike Authority Revenue 5.000% 2/1/24 1,000 1,1333 North Carolina Turnpike Authority Revenue 5.000% 1/1/38 30 37
North Carolina Turnpike Authority Revenue 4.000% 1/1/39 2,000 2,280Orange County NC Public Facilities Co. Revenue 5.000% 10/1/24 320 346Orange County NC Public Facilities Co. Revenue Prere. 5.000% 10/1/22 180 195University of North Carolina at Charlotte Revenue 4.000% 10/1/35 400 481University of North Carolina at Charlotte Revenue 3.000% 10/1/36 1,600 1,752University of North Carolina at Charlotte Revenue 4.000% 10/1/37 1,000 1,196University of North Carolina at Charlotte Revenue 4.000% 10/1/40 325 386Wake County NC GO 5.000% 3/1/23 2,145 2,368Western California University General Revenue 3.000% 4/1/36 1,480 1,616
30,688North Dakota (0.0%)
Grand Forks ND Health Care System Revenue (Altru HealthSystem Obligated Group) 5.000% 12/1/25 1,210 1,420
Ohio (1.6%)Allen County OH Hospital Facilities Revenue (MercyHealth) 4.000% 12/1/40 1,200 1,409
Allen County OH Hospital Facilities Revenue (MercyHealth) 5.000% 8/1/29 1,300 1,668
Allen County OH Hospital Facilities Revenue (MercyHealth) 4.000% 8/1/37 2,200 2,527
American Municipal Power Ohio Inc. Revenue (FremontEnergy Center Project) Prere. 5.250% 2/15/22 570 602
American Municipal Power Ohio Inc. Revenue (FremontEnergy Center Projects) 5.000% 2/15/42 3,000 3,132
American Municipal Power Ohio Inc. Revenue(Hydroelectric Projects) 5.000% 2/15/26 1,025 1,260
Bowling Green State University Ohio Revenue 5.000% 6/1/26 400 489Bowling Green State University Ohio Revenue 5.000% 6/1/27 260 325Buckeye OHTobacco Settlement Financing AuthorityRevenue 5.000% 6/1/34 1,150 1,533
Buckeye OHTobacco Settlement Financing AuthorityRevenue 4.000% 6/1/39 240 289
Buckeye OHTobacco Settlement Financing AuthorityRevenue 5.000% 6/1/55 2,355 2,664
Tax-Managed Balanced Fund
54

CouponMaturity
Date
FaceAmount
($000)
MarketValue•
($000)
Butler County OH Hospital facilities Revenue (CincinnatiChildren's Hospital Medical Center) 5.000% 5/15/32 2,000 2,818
Butler County OH Hospital Facilities Revenue (KetteringHealth Network) 5.250% 4/1/31 500 505
Centerville OH Health Care Revenue (Graceworks LutheranServices) 5.000% 11/1/26 725 785
Centerville OH Health Care Revenue (Graceworks LutheranServices) 5.000% 11/1/27 380 414
Cleveland OH Municipal School District GO 5.000% 12/1/28 1,000 1,1083 Columbus OH City School District GO 0.000% 12/1/29 1,000 892
Columbus OH GO 4.000% 8/15/26 1,730 2,021Columbus OH GO Prere. 5.000% 7/1/22 535 574Columbus OH Sewer Revenue Prere. 5.000% 12/1/24 4,000 4,735Cuyahoga County OH Excise Tax Revenue (Sports FacilitiesImprovement Project) Prere. 5.000% 12/1/23 510 580
Cuyahoga County OH Hospital Revenue (Metro HealthSystem) 5.000% 2/15/32 1,000 1,181
Fairfield County OH Hospital Facilities Revenue (FairfieldMedical Center) 5.125% 6/15/33 615 649
Franklin County OH Convention Facilities AuthorityRevenue 5.000% 12/1/28 1,680 1,949
Franklin County OH Convention Facilities AuthorityRevenue 5.000% 12/1/30 680 713
Franklin County OH Hospital Revenue (NationwideChildren's Hospital) 5.000% 11/1/31 1,000 1,369
Franklin County OH Revenue (Trinity Health Corp.) 5.000% 12/1/31 1,100 1,465Franklin County OH Sales Tax Revenue 5.000% 6/1/28 830 1,098Hamilton County OH Hospital Facilities Revenue (UCHealth) 5.000% 9/15/28 625 813
Hamilton County OH Hospital Facilities Revenue (TriHealthObligated Group) 5.000% 8/15/36 1,000 1,229
Hamilton County OH Hospital Facilities Revenue (UCHealth) 5.000% 2/1/21 200 201
2 Lancaster OH Port Authority Gas Supply Revenue PUT 5.000% 2/1/25 1,100 1,289Lucas County OH Hospital Revenue (ProMedica HealthcareObligated Group) 5.000% 11/15/26 320 329
Lucas County OH Hospital Revenue (ProMedica HealthcareObligated Group) Prere. 5.250% 11/15/21 535 558
Miami Valley OH Career Technology Center GO 5.000% 12/1/25 880 1,081Montgomery County OH Hospital Revenue (Premier HealthPartners) 5.000% 11/15/31 2,290 2,830
Montgomery County OH Hospital Revenue (Premier HealthPartners) 5.000% 11/15/37 2,590 3,125
2 Montgomery County OH Hospital Revenue (Premier HealthPartners) VRDO 0.080% 1/4/21 6,875 6,875
North Royalton OH City School District GO 5.000% 12/1/26 300 361North Royalton OH City School District GO 5.000% 12/1/28 1,400 1,680Ohio Capital Facilities Lease-Appropriation Revenue (AdultCorrectional Building Fund Projects) 5.000% 10/1/33 1,585 1,993
Ohio Capital Facilities Lease-Appropriation Revenue(Mental Health Facilities Improvement Fund Projects) 5.000% 2/1/22 750 788
Ohio Capital Facilities Lease-Appropriation Revenue(Transportation Building Fund Projects) 5.000% 4/1/30 1,155 1,359
Ohio Common Schools GO Prere. 5.000% 6/15/22 1,000 1,070Ohio GO 5.000% 5/1/23 1,270 1,412Ohio GO 5.000% 8/1/23 500 538Ohio GO 5.000% 8/1/24 500 586
Tax-Managed Balanced Fund
55

CouponMaturity
Date
FaceAmount
($000)
MarketValue•
($000)
Ohio GO 5.000% 11/1/24 1,675 1,982Ohio GO 5.000% 2/1/27 1,000 1,233Ohio GO 5.000% 6/15/27 3,425 3,772Ohio GO 5.000% 5/1/33 1,010 1,302Ohio GO 5.000% 3/1/35 1,000 1,254Ohio GO 5.000% 3/15/36 1,005 1,143Ohio GO 5.000% 3/1/38 2,000 2,490Ohio GO Prere. 5.000% 8/1/21 1,110 1,141Ohio Higher Education GO 5.000% 8/1/21 500 514Ohio Higher Education GO 5.000% 5/1/30 5,015 5,996Ohio Higher Educational Facility Commission Revenue(CaseWestern Reserve University Project) 5.000% 12/1/22 585 632
Ohio Major New State Infrastructure Project Revenue 5.000% 12/15/25 2,450 3,021Ohio Major New State Infrastructure Project Revenue 5.000% 12/15/28 1,020 1,258Ohio Parks & Recreation Capital Facilities Revenue 5.000% 12/1/35 1,320 1,702Ohio Parks & Recreation Capital Facilities Revenue 5.000% 12/1/37 2,240 2,872Ohio Revenue (Transportation Building Fund Projects) 5.000% 4/1/26 925 1,149Ohio Turnpike CommissionTurnpike Revenue 5.000% 2/15/28 1,030 1,127Ohio Turnpike CommissionTurnpike Revenue 5.000% 2/15/35 1,310 1,631OhioWater Development AuthorityWater Pollution ControlLoan Fund Revenue 5.000% 12/1/26 1,850 2,354
Penta Career Center Ohio COP 5.250% 4/1/23 125 132Revere OH Local School District GO Prere. 5.000% 6/1/22 1,000 1,068Revere OH Local School District GO Prere. 5.000% 6/1/22 665 710WintonWoods City OH School District GO Prere. 5.000% 5/1/22 550 585WintonWoods City OH School District GO Prere. 5.000% 5/1/22 255 271WintonWoods City OH School District GO Prere. 5.000% 5/1/22 250 266WintonWoods City OH School District GO Prere. 5.000% 5/1/22 260 277WintonWoods City OH School District GO Prere. 5.000% 5/1/22 250 266
107,019Oklahoma (0.2%)
Edmond OK PublicWorks Authority Sales Tax & UtilitySystem Revenue 4.000% 7/1/25 1,160 1,346
Norman OK Regional Hospital Authority Revenue 5.000% 9/1/28 1,245 1,514Oklahoma Capitol Improvement Authority FacilitiesRevenue 5.000% 7/1/26 1,145 1,325
Oklahoma Capitol Improvement Authority FacilitiesRevenue 4.000% 7/1/38 1,000 1,177
Oklahoma City OK GO 5.000% 3/1/24 525 529Oklahoma Development Finance Authority Health SystemRevenue (Integris Baptist Medical Center) 4.000% 8/15/38 1,000 1,102
Oklahoma Development Finance Authority Health SystemRevenue (OU Medicine) 5.000% 8/15/28 1,500 1,858
OklahomaTurnpike Authority Revenue 5.000% 1/1/37 2,000 2,394OklahomaTurnpike Authority Revenue Prere. 5.000% 1/1/21 300 300Tulsa County OK Industrial Authority Senior LivingCommunity Revenue (Montereau Inc.) 5.000% 11/15/23 280 297
University of Oklahoma Revenue 5.000% 7/1/31 475 486
12,328Oregon (0.3%)
Clatsop County OR School District No. 10 Seaside GO 5.000% 6/15/33 1,140 1,426Deschutes & Jefferson Counties OR School District No. 2JGO 0.000% 6/15/31 750 648
Medford Hospital Facilities Authority 5.000% 8/15/35 1,000 1,315Multnomah County OR School District GO 5.000% 6/15/29 1,015 1,216
Tax-Managed Balanced Fund
56

CouponMaturity
Date
FaceAmount
($000)
MarketValue•
($000)
Multnomah County OR School District GO 3.000% 6/15/41 1,000 1,110Oregon Department of Administrative Services LotteryRevenue 5.000% 4/1/25 1,380 1,591
Oregon Department of Administrative Services LotteryRevenue 5.250% 4/1/31 70 71
Oregon Department of Administrative Services LotteryRevenue Prere. 5.250% 4/1/21 430 435
Oregon Department of Transportation Highway User TaxRevenue 5.000% 11/15/39 2,000 2,641
Oregon Facilities Authority Revenue (Legacy HealthProject) 5.000% 6/1/33 1,000 1,196
Oregon Facilities Authority Revenue (Reed CollegeProjects) 4.000% 7/1/31 450 534
Oregon Facilities Authority Revenue (Reed CollegeProjects) 4.000% 7/1/32 450 531
Oregon GO 5.000% 5/1/23 500 532Salem OR Hospital Facilities Authority Revenue (CapitalManor Inc.) 5.000% 5/15/33 550 612
Salem OR Hospital Facilities Authority Revenue (CapitalManor Inc.) 5.000% 5/15/38 500 550
Tri-County Metropolitan Transportation District of OregonRevenue 4.000% 9/1/40 5,645 6,353
Washington County OR School District No. 48J BeavertonGO 5.000% 6/15/36 1,305 1,632
22,393Pennsylvania (2.3%)
Allegheny County PA GO 4.000% 11/1/30 1,025 1,198Allegheny County PA Higher Education Building AuthorityUniversity Revenue (Duquesne University) Prere. 5.500% 3/1/21 325 328
Allegheny County PA Hospital Development AuthorityRevenue 5.000% 4/1/27 1,010 1,262
Allegheny County PA Hospital Development AuthorityRevenue 5.000% 4/1/32 1,000 1,238
Allegheny County PA Hospital Development AuthorityRevenue 5.000% 4/1/33 1,000 1,232
Allegheny County PA Hospital Development AuthorityRevenue 4.000% 4/1/38 500 569
Allegheny County PA Hospital Development AuthorityRevenue (University of Pittsburgh Medical Center) 5.000% 7/15/27 1,000 1,279
9 Allegheny County PA Hospital Development AuthorityRevenue (University of Pittsburgh Medical Center), 67%of 3M USD LIBOR + 0.720% 0.864% 2/1/21 160 160
Allegheny County PA Port Authority Revenue 5.750% 3/1/29 500 504Allegheny County PA Sanitary Authority Sewer Revenue 4.000% 6/1/39 415 506Allentown PA Neighborhood Improvement ZoneDevelopment Authority Tax Revenue 5.000% 5/1/24 1,000 1,049
4 Allentown PA Neighborhood Improvement ZoneDevelopment Authority Tax Revenue 5.000% 5/1/27 250 286
6 Allentown PA School District GO 5.000% 6/1/31 1,000 1,2096 Armstrong PA School District GO 5.000% 3/15/27 995 1,2436 Armstrong PA School District GO 5.000% 3/15/29 920 1,201
Centennial PA School District Bucks County GO 5.000% 12/15/29 1,455 1,973Central Bradford PA Progress Authority Revenue (GuthrieHealthcare System) Prere. 5.500% 12/1/21 530 555
Chester County PA GO Prere. 5.000% 11/15/22 750 8176 Coatesville PA Area School District Building GO 0.000% 10/1/34 450 283
Tax-Managed Balanced Fund
57

CouponMaturity
Date
FaceAmount
($000)
MarketValue•
($000)
6 Coatesville PA School District Building Authority LeaseRevenue 5.000% 12/1/26 335 368
6 Coatesville PA School District Building Authority LeaseRevenue 5.000% 12/1/27 365 400
Commonwealth Financing Authority Pennsylvania Revenue 5.000% 6/1/26 500 6154 Dauphin County PA General Authority Revenue (Harrisburg
University of Science &Technology) 5.000% 10/15/30 840 865Dauphin County PA GO 5.000% 11/15/27 2,055 2,662Delaware River PA Joint Toll Bridge Commission (BridgeSystem Revenue) 5.000% 7/1/34 225 280
7 Delaware Valley PA Regional Finance Authority Revenue 5.500% 8/1/28 250 326East Hempfield Township PA Industrial DevelopmentAuthority Revenue (Millersville University StudentHousing Project) 5.000% 7/1/29 1,000 1,015
Easton PA Area School District GO 4.000% 4/1/28 580 7206,7 Erie PA Sewer Authority Revenue 0.000% 12/1/25 85 806,7 Erie PA Sewer Authority Revenue ETM 0.000% 12/1/25 1,165 1,137
Geisinger Authority PA Health System Revenue (GeisingerHealth System) 5.000% 4/1/35 1,000 1,315
Lehigh County PA General Purpose Hospital AuthorityRevenue (Lehigh Valley Health Network) 5.000% 7/1/29 1,220 1,483
Lehigh County PA General Purpose Hospital AuthorityRevenue (Lehigh Valley Health Network) 5.000% 7/1/29 2,400 3,154
3 Luzerne County PA Industrial Development Authority LeaseRevenue 5.000% 12/15/25 1,000 1,205
ManheimTownship PA School District GO 5.000% 2/1/30 830 997Monroeville PA Finance Authority Revenue (UPMC HealthSystem) 5.000% 2/15/42 1,000 1,065
Montgomery County PA Higher Education & HealthAuthority Hospital Revenue (Abington Memorial Hospital)Prere. 5.000% 6/1/22 500 533
Montgomery County PA Higher Education & HealthAuthority Revenue (Thomas Jefferson University) 5.000% 9/1/32 1,515 1,929
Montgomery County PA Industrial Development AuthorityHealth Services Revenue (Albert Einstein HealthcareNetwork) 5.000% 1/15/23 1,015 1,087
Montgomery County PA Industrial Development AuthorityHealth Services Revenue (Albert Einstein HealthcareNetwork) 5.000% 1/15/25 1,000 1,137
Montgomery County PA Industrial Development AuthorityRetirement Community Revenue (ACTS Retirement- LifeCommunities Obligated Group) Prere. 5.000% 5/15/22 1,250 1,332
Mount Lebanon PA Hospital Authority Revenue (St. ClairMemorial Hospital Project) 5.000% 7/1/38 1,000 1,249
Northampton County PA General Purpose AuthorityHospital Revenue (St. Luke's Hospital Project) 5.000% 8/15/25 1,275 1,515
Pennsylvania COP 5.000% 7/1/26 500 616Pennsylvania COP 5.000% 7/1/27 500 631Pennsylvania Economic Development Financing AuthorityRevenue (UPMC Obligated Group) 5.000% 3/15/29 1,060 1,302
Pennsylvania Economic Development Financing AuthorityRevenue (UPMC Obligated Group) 5.000% 11/15/30 1,510 1,902
Pennsylvania GO 5.375% 7/1/21 500 513Pennsylvania GO 5.000% 8/15/23 2,000 2,243Pennsylvania GO 5.000% 1/1/24 1,500 1,708Pennsylvania GO 5.000% 8/15/24 500 583Pennsylvania GO 5.000% 1/1/26 3,295 4,047Pennsylvania GO 5.000% 9/15/26 1,500 1,884
Tax-Managed Balanced Fund
58

CouponMaturity
Date
FaceAmount
($000)
MarketValue•
($000)
Pennsylvania GO 5.000% 7/15/28 4,975 6,535Pennsylvania GO 4.000% 1/1/29 3,000 3,560
3 Pennsylvania GO 4.000% 8/15/30 1,000 1,148Pennsylvania GO 5.000% 3/15/32 8,000 9,378Pennsylvania GO 5.000% 10/15/32 1,000 1,121
3 Pennsylvania GO 4.000% 3/1/33 1,110 1,3353 Pennsylvania GO 4.000% 3/1/34 1,670 2,002
Pennsylvania GO 4.000% 3/1/36 1,000 1,184Pennsylvania GO 4.000% 3/1/37 1,000 1,178
6 Pennsylvania GO 4.000% 3/1/37 1,000 1,190Pennsylvania GO Prere. 5.000% 11/15/21 500 521Pennsylvania Higher Educational Facilities AuthorityRevenue (Temple University) Prere. 5.000% 4/1/22 500 530
Pennsylvania Higher Educational Facilities AuthorityRevenue (University of Pennsylvania Health System) 4.000% 8/15/36 1,295 1,519
Pennsylvania Turnpike Commission Motor License FundRevenue 5.000% 12/1/32 1,000 1,257
Pennsylvania Turnpike Commission Oil Franchise TaxRevenue 5.000% 12/1/24 1,050 1,190
Pennsylvania Turnpike Commission Oil Franchise TaxRevenue 5.000% 12/1/28 630 778
Pennsylvania Turnpike Commission Revenue 5.000% 6/1/24 1,980 2,260Pennsylvania Turnpike Commission Revenue 5.000% 12/1/25 1,690 2,073Pennsylvania Turnpike Commission Revenue 5.000% 6/1/26 1,960 2,378
3 Pennsylvania Turnpike Commission Revenue 5.000% 6/1/26 1,635 2,022Pennsylvania Turnpike Commission Revenue 5.000% 12/1/26 750 926Pennsylvania Turnpike Commission Revenue 5.000% 6/1/27 2,255 2,753Pennsylvania Turnpike Commission Revenue 5.000% 12/1/29 1,570 2,014Pennsylvania Turnpike Commission Revenue 5.000% 6/1/32 1,500 1,830Pennsylvania Turnpike Commission Revenue 5.000% 12/1/32 2,000 2,313Pennsylvania Turnpike Commission Revenue 5.000% 12/1/32 1,250 1,609
3 Pennsylvania Turnpike Commission Revenue 6.250% 6/1/33 1,760 2,244Pennsylvania Turnpike Commission Revenue 5.000% 6/1/35 1,500 1,789Pennsylvania Turnpike Commission Revenue 5.000% 12/1/37 1,000 1,264Pennsylvania Turnpike Commission Revenue 6.375% 12/1/38 1,000 1,320Pennsylvania Turnpike Commission Revenue 5.000% 12/1/39 1,520 1,978Pennsylvania Turnpike Commission Revenue 5.250% 12/1/39 1,000 1,152
9 Pennsylvania Turnpike Commission Revenue, SIFMAMunicipal Swap IndexYield + 0.980% 1.070% 12/1/21 1,315 1,319
Philadelphia PA Airport Revenue 5.000% 7/1/34 1,500 1,960Philadelphia PA Authority for Industrial DevelopmentRevenue (Temple University) 5.000% 4/1/24 1,015 1,159
Philadelphia PA Authority for Industrial DevelopmentRevenue (Temple University) 5.000% 4/1/27 1,000 1,175
Philadelphia PA GasWorks Revenue 5.000% 10/1/25 1,625 1,950Philadelphia PA GasWorks Revenue 5.000% 10/1/26 1,000 1,231Philadelphia PA GasWorks Revenue 5.000% 8/1/36 1,300 1,582Philadelphia PA Hospitals & Higher Education FacilitiesAuthority Hospital Revenue (Temple University HealthSystem Obligated Group) 5.000% 7/1/25 1,000 1,149
2 Philadelphia PA Hospitals & Higher Education FacilitiesAuthority Hospital Revenue (The Children's Hospital ofPhiladelphia Projects) VRDO 0.090% 1/4/21 1,000 1,000
Philadelphia PA School District GO 5.000% 9/1/31 940 1,107Philadelphia PAWater &Wastewater Revenue 5.000% 7/1/26 1,000 1,152Philadelphia PAWater &Wastewater Revenue 5.000% 10/1/34 2,500 3,357
Tax-Managed Balanced Fund
59

CouponMaturity
Date
FaceAmount
($000)
MarketValue•
($000)
Philadelphia PAWater &Wastewater Revenue 4.000% 7/1/35 1,110 1,2313 Pittsburgh & Allegheny County PA Sports & Exhibition
Authority Sales Tax Revenue 5.000% 2/1/31 1,000 1,3023 Pittsburgh PAWater & Sewer Authority Revenue 5.000% 9/1/33 1,000 1,309
3,9 Pittsburgh PAWater & Sewer Authority Revenue, SIFMAMunicipal Swap IndexYield + 0.650% PUT 0.740% 12/1/23 350 351
3 Reading PA School District GO 5.000% 3/1/25 955 1,124Saint Mary PA Hospital Authority Health System Revenue(Trinity Health Corp. Obligated Group) 5.000% 11/15/25 815 983
Saint Mary PA Hospital Authority Health System Revenue(Trinity Health Corp. Obligated Group) 5.000% 11/15/26 770 956
Snyder County PA Higher Education Authority UniversityRevenue (Susquehanna University Project) 5.000% 1/1/27 1,135 1,404
Southcentral Pennsylvania General Authority Revenue(WellSpan Health Obligated Group) Prere. 5.000% 6/1/24 1,085 1,258
6 State Public School Building Authority Pennsylvania CollegeRevenue (Community College of Allegheny CountyProject) 4.000% 6/15/29 1,075 1,231
6 State Public School Building Authority Pennsylvania LeaseRevenue (School District of Philadelphia) 5.000% 6/1/24 1,535 1,762
3 State Public School Building Authority Pennsylvania LeaseRevenue (School District of Philadelphia) 5.000% 6/1/26 1,650 2,015
West Shore PA Area Authority Hospital Revenue (HolySpirit Hospital of the Sisters of Christian Charity Project)Prere. 6.250% 1/1/21 80 80
156,288Puerto Rico (0.3%)
8 Puerto Rico Electric Power Authority Revenue 5.000% 7/1/21 500 50210,18 Puerto Rico Highway &Transportation Authority Revenue 5.250% 7/1/21 500 510
Puerto Rico Housing Finance Authority Capital FundModernization Program (Puerto Rico Public HousingProjects) 5.000% 12/1/27 1,000 1,259
3,12 Puerto Rico Public Finance Corp. Revenue ETM 6.000% 8/1/26 1,000 1,292Puerto Rico Sales Tax Financing Corp. Revenue 0.000% 7/1/24 198 187Puerto Rico Sales Tax Financing Corp. Revenue 0.000% 7/1/27 1,327 1,182Puerto Rico Sales Tax Financing Corp. Revenue 0.000% 7/1/29 2,774 2,356Puerto Rico Sales Tax Financing Corp. Revenue 0.000% 7/1/31 145 113Puerto Rico Sales Tax Financing Corp. Revenue 4.329% 7/1/40 7,096 7,690Puerto Rico Sales Tax Financing Corp. Revenue 4.329% 7/1/40 1,735 1,879Puerto Rico Sales Tax Financing Corp. Revenue 4.550% 7/1/40 65 71Puerto Rico Sales Tax Financing Corp. Revenue 4.550% 7/1/40 135 148
17,189Rhode Island (0.1%)
Narragansett RI CommissionWastewater System RevenuePrere. 5.000% 2/1/25 1,950 2,326
Rhode Island Commerce Corp. Airport Revenue 5.000% 7/1/30 500 569Rhode Island Health & Educational Building Corp. HigherEducation Facilities Revenue (University of Rhode Island) 5.000% 9/15/25 500 598
Tobacco Settlement Financing Corp. Rhode Island Revenue 2.250% 6/1/41 825 865
4,358South Carolina (0.5%)
Charleston County SC Airport District System Revenue 5.000% 7/1/34 250 316Charleston SC Educational Excellence Financing Corp.Revenue (Charleston County School District, SouthCarolina Project) 5.000% 12/1/23 590 669
Columbia SCWaterworks & Sewer System Revenue 3.000% 2/1/35 875 991
Tax-Managed Balanced Fund
60

CouponMaturity
Date
FaceAmount
($000)
MarketValue•
($000)
Columbia SCWaterworks & Sewer System Revenue Prere. 5.000% 2/1/22 250 263Georgetown County SC School District GO 3.000% 3/1/31 1,665 1,894Greenville SC Hospital Systems Facilities Revenue(Trustees Hospital) 5.000% 5/1/29 1,820 1,913
Lancaster County SC School District GO 4.000% 3/1/32 1,000 1,180Lexington County SC Health Services District Inc. HospitalRevenue 5.000% 11/1/25 1,000 1,209
Lexington County SC Health Services District Inc. HospitalRevenue 5.000% 11/1/34 1,500 1,777
Myrtle Beach SC Hospitality Fee Revenue 5.000% 6/1/25 1,030 1,1692 Patriots Energy Group Finance Authority SC Gas Supply
Revenue PUT 4.000% 2/1/24 1,895 2,0868 Piedmont SC Municipal Power Agency Revenue 0.000% 1/1/24 1,600 1,564
South Carolina Association of Governmental OrganizationsEducational Facilities Corp. Revenue (Pickens SchoolDistrict) 5.000% 12/1/26 1,420 1,670
South Carolina Jobs Economic Development AuthorityHospital Revenue (Palmetto Health) Prere. 5.250% 8/1/23 1,000 1,129
South Carolina Jobs Economic Development AuthorityHospital Revenue (Prisma Health) 5.000% 5/1/37 1,500 1,826
South Carolina Public Service Authority Revenue 5.000% 12/1/26 1,140 1,335South Carolina Public Service Authority Revenue 5.000% 12/1/31 1,200 1,632South Carolina Public Service Authority Revenue 5.000% 12/1/37 2,430 2,917South Carolina Public Service Authority Revenue 5.000% 12/1/37 1,095 1,334South Carolina Public Service Authority Revenue 5.000% 12/1/38 1,125 1,256South Carolina Public Service Authority Revenue Prere. 5.000% 12/1/21 1,465 1,529South Carolina Transportation Infrastructure Revenue 5.000% 10/1/32 1,290 1,649
3 Spartanburg SC Regional Health Services District 5.000% 4/15/34 510 6646 Sumter Two School Facilities Inc. South Carolina
Installment Purchase Revenue 5.000% 12/1/26 1,000 1,196
33,168South Dakota (0.1%)
Educational Enhancement Funding Corp. South DakotaTobacco Settlement Revenue 5.000% 6/1/25 2,000 2,203
South Dakota Health & Educational Facilities AuthorityRevenue (Regional Health System Obligated Group) 5.000% 9/1/32 2,915 3,591
South Dakota Health & Educational Facilities AuthorityRevenue (Regional Health System Obligated Group) 4.000% 9/1/34 2,125 2,459
8,253Tennessee (1.1%)
ChattanoogaTN Electric System Revenue 5.000% 9/1/31 1,000 1,202ChattanoogaTN Health Educational & Housing FacilityBoard Revenue (Catholic Health Initiatives) Prere. 5.000% 1/1/23 1,500 1,639
ChattanoogaTN Health Educational & Housing FacilityBoard Revenue (Common Spirit Health) 5.000% 8/1/29 2,880 3,747
Chattanooga-Hamilton County TN Hospital AuthorityHospital Revenue 5.000% 10/1/27 1,035 1,163
Greeneville TN Health & Educational Facilities BoardHospital Revenue (Ballad Health) 5.000% 7/1/27 1,590 1,975
JacksonTN Hospital Improvement Revenue (WestTennessee Healthcare Obligated Group) 5.000% 4/1/38 3,810 4,708
Knox County TN Health Educational & Housing FacilitiesBoard Hospital Facilities Revenue (Covenant Healthcare) 5.000% 1/1/36 1,000 1,191
Knox County TN Health Educational & Housing FacilitiesBoard Hospital Facilities Revenue (University HealthSystem Inc.) 5.000% 9/1/27 925 1,104
Memphis TN GO 5.000% 5/1/30 500 507
Tax-Managed Balanced Fund
61

CouponMaturity
Date
FaceAmount
($000)
MarketValue•
($000)
Memphis TN GO 4.000% 6/1/31 1,000 1,171Memphis TN GO 4.000% 5/1/35 5,685 6,810Memphis-Shelby County TN Airport Authority Revenue 5.000% 7/1/34 500 655Metropolitan Government of Nashville & Davidson CountyTN GO 5.000% 7/1/21 625 626
Metropolitan Government of Nashville & Davidson CountyTN Health & Educational Facilities Board Revenue(Blakeford at Green Hills) 5.000% 7/1/27 500 520
2,3 Shelby County TN Health Educational & Housing FacilitiesBoard Revenue VRDO 0.090% 1/4/21 19,400 19,400
2 Tennergy Corp. TN Gas Revenue PUT 5.000% 10/1/24 5,090 5,909Tennessee Energy Acquisition Corp. Gas Revenue 5.250% 9/1/22 1,835 1,979Tennessee Energy Acquisition Corp. Gas Revenue 5.000% 2/1/24 1,800 2,029Tennessee Energy Acquisition Corp. Gas Revenue 5.000% 2/1/25 915 1,061Tennessee Energy Acquisition Corp. Gas Revenue 5.250% 9/1/26 1,035 1,271Tennessee Energy Acquisition Corp. Gas Revenue 5.000% 2/1/27 1,185 1,439Tennessee Energy Acquisition Corp. Gas Revenue PUT 4.000% 5/1/23 4,040 4,347Tennessee Energy Acquisition Corp. Gas Revenue PUT 4.000% 11/1/25 1,625 1,867Tennessee GO 5.000% 8/1/22 1,475 1,587Tennessee GO 4.000% 8/1/28 4,850 5,619Tennessee GO 5.000% 8/1/32 1,000 1,196Tennessee School Bond Authority Higher EducationalFacilities Revenue (2nd Program) 5.000% 11/1/33 50 63
Tennessee School Bond Authority Higher EducationalFacilities Revenue (2nd Program) 5.000% 11/1/34 10 12
Tennessee School Bond Authority Higher EducationalFacilities Revenue (2nd Program) 5.000% 11/1/37 1,390 1,834
Williamson County TN GO Prere. 4.000% 5/1/23 1,320 1,437
78,068Texas (5.1%)
AlamoTX Regional Mobility Authority Revenue 5.000% 6/15/27 1,280 1,53019 Allen TX Independent School District GO 5.000% 2/15/26 1,035 1,27419 ArlingtonTX Higher Education Finance Corp. Revenue
(Riverwalk Education Foundation Inc.) 4.000% 8/15/33 600 72919 ArlingtonTX Independent School District (UnlimitedTax)
GO 5.000% 2/15/26 1,090 1,2953 ArlingtonTX Special Tax Revenue 5.000% 2/15/27 420 5183 ArlingtonTX Special Tax Revenue 5.000% 2/15/28 305 3846 ArlingtonTX Special Tax Revenue 5.000% 2/15/32 1,160 1,388
Austin TX Airport System Revenue 5.000% 11/15/26 1,120 1,401Austin TX Airport System Revenue 5.000% 11/15/32 1,200 1,453Austin TX Community College District Public Facilities Corp.Lease Revenue 5.000% 8/1/27 1,000 1,199
Austin TXWater &Wastewater System Revenue 5.000% 11/15/37 1,000 1,234Austin TXWater &Wastewater System Revenue ETM 5.000% 11/15/21 500 521Bexar County TX GO Prere. 5.000% 6/15/23 3,230 3,610Bexar County TX GO Prere. 5.000% 6/15/24 1,145 1,334Brownsville TX Utility System Revenue Prere. 4.000% 9/1/23 1,000 1,100Central Texas Regional Mobility Authority Revenue 5.000% 1/1/24 1,015 1,148Central Texas Regional Mobility Authority Revenue 0.000% 1/1/25 100 95Central Texas Regional Mobility Authority Revenue 5.000% 1/1/25 250 287Central Texas Regional Mobility Authority Revenue 0.000% 1/1/26 180 169Central Texas Regional Mobility Authority Revenue 5.000% 1/1/26 1,115 1,346Central Texas Regional Mobility Authority Revenue 5.000% 1/1/30 855 1,002Central Texas Regional Mobility Authority Revenue 5.000% 1/1/32 945 1,238Central Texas Regional Mobility Authority Revenue 5.000% 1/1/34 1,450 1,703
Tax-Managed Balanced Fund
62

CouponMaturity
Date
FaceAmount
($000)
MarketValue•
($000)
Central Texas Regional Mobility Authority Revenue 4.000% 1/1/36 1,115 1,304Central Texas Regional Mobility Authority Revenue Prere. 5.000% 1/1/23 565 619
19 Clear CreekTX Independent School District GO 5.000% 2/15/34 910 1,142CliftonTX Higher Education Finance Corp. Revenue (BaylorUniversity) Prere. 5.250% 3/1/21 200 202
Collin County TX Community College District GO 4.000% 8/15/34 2,500 3,09219 Comal Texas Independent School District 4.000% 2/1/39 5,000 5,46019 Cypress-FairbanksTX Independent School District GO
Prere. 5.000% 2/15/21 500 503Dallas County TX Community College District GO 5.000% 2/15/26 1,000 1,226Dallas TX Area Rapid Transit Sales Tax Revenue 5.000% 12/1/32 1,670 2,027Dallas TX Area Rapid Transit Sales Tax Revenue 5.000% 12/1/32 2,065 2,774Dallas TX Area Rapid Transit Sales Tax Revenue Prere. 5.000% 12/1/22 500 546
19 Dallas TX Independent School District GO 5.000% 2/15/23 485 48819 Dallas TX Independent School District GO 4.000% 2/15/29 2,265 2,580
Dallas TXWaterworks & Sewer System Revenue 5.000% 10/1/21 1,340 1,388Dallas TXWaterworks & Sewer System Revenue 5.000% 10/1/22 210 217Dallas TXWaterworks & Sewer System Revenue 4.000% 10/1/31 1,675 2,062Dallas TXWaterworks & Sewer System Revenue Prere. 5.000% 10/1/21 195 202Dallas-FortWorth TX International Airport Revenue 5.250% 11/1/29 1,000 1,128Dallas-FortWorth TX International Airport Revenue 5.000% 11/1/30 3,700 5,030
19 Eagle Mountain & SaginawTX Independent School DistrictGO PUT 2.000% 8/1/24 1,035 1,088
El PasoTX GO 5.000% 8/15/28 750 992El PasoTX GO 5.000% 8/15/31 850 1,134El PasoTX GO 4.000% 8/15/34 1,000 1,234
19 El PasoTX Independent School District Revenue 5.000% 8/15/42 5,000 6,062FortWorth TX GO 5.000% 3/1/25 1,115 1,333FortWorth TXWater & Sewer Revenue 5.000% 2/15/25 450 452FriscoTX Refunding & Improvement GO 5.000% 2/15/28 1,425 1,694GarlandTX Electric Utility System Revenue 5.000% 3/1/30 675 886
19 GarlandTX Independent School District GO 5.000% 2/15/22 1,025 1,08011 Grand ParkwayTransportation Corp. Texas SystemToll
Revenue, 5.050% coupon rate effective 10/1/2023 0.000% 10/1/30 1,550 1,827Grand ParkwayTransportation Corp. TX BAN 5.000% 2/1/23 2,500 2,717Harris County TX Cultural Education Facilities Finance Corp.(Houston Methodist Projects) VRDO 0.090% 1/4/21 7,900 7,900
Harris County TX Cultural Education Facilities Finance Corp.Thermal Utility Revenue (TECO Project) 5.000% 11/15/30 1,000 1,268
Harris County TX Flood Control Improvement GO 3.000% 10/1/39 2,000 2,262Harris County TX GO 5.000% 8/15/22 1,960 2,113Harris County TX GO 5.000% 10/1/23 20 21Harris County TX GO 5.000% 8/15/32 1,025 1,101Harris County TX GO 5.000% 10/1/36 1,200 1,445Harris County TX GO 5.000% 10/1/40 2,470 2,955Harris County TX GO Prere. 5.000% 10/1/21 280 290Harris County TXToll Road Revenue 5.000% 8/15/32 515 550Harris County TXToll Road Revenue 5.000% 8/15/41 1,695 2,047Hidalgo County TX Certificates GO 4.000% 8/15/37 1,000 1,209HoustonTX Airport System Revenue 5.000% 7/1/26 1,160 1,436HoustonTX Airport System Revenue 5.000% 7/1/31 115 145HoustonTX Airport System Revenue 5.000% 7/1/37 1,720 2,122HoustonTX GO 5.000% 3/1/27 1,000 1,273HoustonTX GO 4.000% 3/1/35 1,500 1,739HoustonTX Hotel OccupancyTax & Special Revenue(Convention & Entertainment Facilities) 5.000% 9/1/24 1,070 1,189
Tax-Managed Balanced Fund
63

CouponMaturity
Date
FaceAmount
($000)
MarketValue•
($000)
19 HoustonTX Independent School District GO 5.000% 2/15/27 1,750 2,152HoustonTX Utility System Revenue 5.000% 5/15/25 1,160 1,341HoustonTX Utility System Revenue 5.000% 11/15/26 1,350 1,711HoustonTX Utility System Revenue 4.000% 11/15/31 1,000 1,185HoustonTX Utility System Revenue 5.000% 11/15/34 1,000 1,161HoustonTX Utility System Revenue 5.000% 11/15/34 1,000 1,372
19 Katy TX Independent School District GO 4.000% 2/15/27 275 29619 Katy TX Independent School District GO 4.000% 2/15/28 375 40319 Klein TX Independent School District GO 5.000% 8/1/34 1,200 1,49019 Klein TX Independent School District GO 4.000% 2/1/45 1,000 1,12119 LakeTravis TX Independent School District GO Prere. 5.000% 2/15/21 500 50319 Lamar TX Consolidated Independent School District GO 5.000% 2/15/26 1,360 1,620
LaredoTX Community College District GO 5.000% 8/1/25 1,000 1,16019 LaredoTX Independent School District GO 4.000% 8/1/28 1,635 1,83519 Lewisville TX Independent School District (UnlimitedTax
Building) GO 5.000% 8/15/25 3,820 4,649Lone Star College SystemTexas GO 5.000% 2/15/28 5,500 6,747Lower Colorado River Authority Texas Revenue 5.000% 5/15/37 1,330 1,403Lower Colorado River Authority TexasTransmissionContract Revenue (LCRATransmission Services Corp.) 5.000% 5/15/28 1,200 1,428
Lower Colorado River Authority TexasTransmissionContract Revenue (LCRATransmission Services Corp.) 5.000% 5/15/28 1,000 1,149
Lower Colorado River Authority TexasTransmissionContract Revenue (LCRATransmission Services Corp.) 5.000% 5/15/34 1,115 1,424
Lower Colorado River Authority TexasTransmissionContract Revenue (LCRATransmission Services Corp.) 5.000% 5/15/36 1,085 1,421
LubbockTX GO Prere. 5.000% 2/15/22 500 52719 Mansfield TX Independent School District GO Prere. 4.000% 2/15/23 1,265 1,36719 Mansfield TX Independent School District GO Prere. 5.000% 2/15/23 1,250 1,377
Mesquite TX Health Facilities Development Corp.Retirement Facility Revenue (Christian Care Centers Inc.Project) 5.000% 2/15/24 285 281
19 Mesquite TX Independent School District GO 4.000% 8/15/30 1,155 1,33119 Midlothian TX Independent School District Revenue GO
PUT 2.000% 8/1/24 1,005 1,058Montgomery TX GO 4.000% 3/1/30 1,840 2,223
19 Montgomery TX Independent School District RefundingBonds 4.000% 2/15/45 2,000 2,231
New HopeTX Cultural Education Facilities Finance Corp.First Mortgage Revenue (Morningside Ministries Project) 6.250% 1/1/33 1,640 1,719
New HopeTX Cultural Education Facilities Finance Corp.Retirement Facilities Revenue (Westminster ManorProject) 5.000% 11/1/26 1,060 1,220
New HopeTX Cultural Education Facilities Finance Corp.Retirement Facilities Revenue (Westminster ManorProject) 5.000% 11/1/27 1,000 1,149
New HopeTX Cultural Education Facilities Finance Corp.Retirement Facilities Revenue (Westminster ManorProject) 5.000% 11/1/28 870 996
New HopeTX Cultural Education Facilities Finance Corp.Student Housing Revenue (Tarleton State UniversityProject) ETM 5.000% 4/1/23 200 220
New HopeTX Cultural Education Facilities Finance Corp.Student Housing Revenue (Tarleton State UniversityProject) ETM 5.000% 4/1/24 210 240
New HopeTX Cultural Education Facilities Finance Corp.Student Housing Revenue (Tarleton State UniversityProject) ETM 5.000% 4/1/25 240 285
Tax-Managed Balanced Fund
64
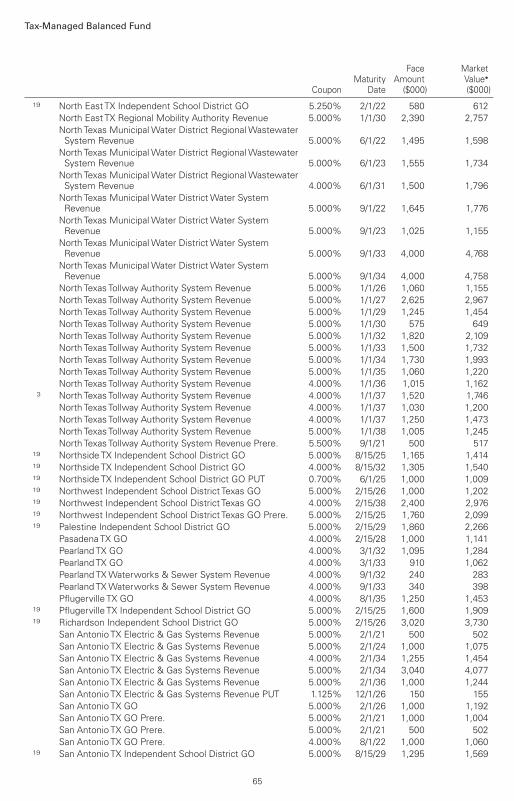
CouponMaturity
Date
FaceAmount
($000)
MarketValue•
($000)
19 North East TX Independent School District GO 5.250% 2/1/22 580 612North East TX Regional Mobility Authority Revenue 5.000% 1/1/30 2,390 2,757North Texas Municipal Water District RegionalWastewaterSystem Revenue 5.000% 6/1/22 1,495 1,598
North Texas Municipal Water District RegionalWastewaterSystem Revenue 5.000% 6/1/23 1,555 1,734
North Texas Municipal Water District RegionalWastewaterSystem Revenue 4.000% 6/1/31 1,500 1,796
North Texas Municipal Water DistrictWater SystemRevenue 5.000% 9/1/22 1,645 1,776
North Texas Municipal Water DistrictWater SystemRevenue 5.000% 9/1/23 1,025 1,155
North Texas Municipal Water DistrictWater SystemRevenue 5.000% 9/1/33 4,000 4,768
North Texas Municipal Water DistrictWater SystemRevenue 5.000% 9/1/34 4,000 4,758
North TexasTollway Authority System Revenue 5.000% 1/1/26 1,060 1,155North TexasTollway Authority System Revenue 5.000% 1/1/27 2,625 2,967North TexasTollway Authority System Revenue 5.000% 1/1/29 1,245 1,454North TexasTollway Authority System Revenue 5.000% 1/1/30 575 649North TexasTollway Authority System Revenue 5.000% 1/1/32 1,820 2,109North TexasTollway Authority System Revenue 5.000% 1/1/33 1,500 1,732North TexasTollway Authority System Revenue 5.000% 1/1/34 1,730 1,993North TexasTollway Authority System Revenue 5.000% 1/1/35 1,060 1,220North TexasTollway Authority System Revenue 4.000% 1/1/36 1,015 1,162
3 North TexasTollway Authority System Revenue 4.000% 1/1/37 1,520 1,746North TexasTollway Authority System Revenue 4.000% 1/1/37 1,030 1,200North TexasTollway Authority System Revenue 4.000% 1/1/37 1,250 1,473North TexasTollway Authority System Revenue 5.000% 1/1/38 1,005 1,245North TexasTollway Authority System Revenue Prere. 5.500% 9/1/21 500 517
19 NorthsideTX Independent School District GO 5.000% 8/15/25 1,165 1,41419 NorthsideTX Independent School District GO 4.000% 8/15/32 1,305 1,54019 NorthsideTX Independent School District GO PUT 0.700% 6/1/25 1,000 1,00919 Northwest Independent School District Texas GO 5.000% 2/15/26 1,000 1,20219 Northwest Independent School District Texas GO 4.000% 2/15/38 2,400 2,97619 Northwest Independent School District Texas GO Prere. 5.000% 2/15/25 1,760 2,09919 Palestine Independent School District GO 5.000% 2/15/29 1,860 2,266
PasadenaTX GO 4.000% 2/15/28 1,000 1,141PearlandTX GO 4.000% 3/1/32 1,095 1,284PearlandTX GO 4.000% 3/1/33 910 1,062PearlandTXWaterworks & Sewer System Revenue 4.000% 9/1/32 240 283PearlandTXWaterworks & Sewer System Revenue 4.000% 9/1/33 340 398Pflugerville TX GO 4.000% 8/1/35 1,250 1,453
19 Pflugerville TX Independent School District GO 5.000% 2/15/25 1,600 1,90919 Richardson Independent School District GO 5.000% 2/15/26 3,020 3,730
San Antonio TX Electric & Gas Systems Revenue 5.000% 2/1/21 500 502San Antonio TX Electric & Gas Systems Revenue 5.000% 2/1/24 1,000 1,075San Antonio TX Electric & Gas Systems Revenue 4.000% 2/1/34 1,255 1,454San Antonio TX Electric & Gas Systems Revenue 5.000% 2/1/34 3,040 4,077San Antonio TX Electric & Gas Systems Revenue 5.000% 2/1/36 1,000 1,244San Antonio TX Electric & Gas Systems Revenue PUT 1.125% 12/1/26 150 155San Antonio TX GO 5.000% 2/1/26 1,000 1,192San Antonio TX GO Prere. 5.000% 2/1/21 1,000 1,004San Antonio TX GO Prere. 5.000% 2/1/21 500 502San Antonio TX GO Prere. 4.000% 8/1/22 1,000 1,060
19 San Antonio TX Independent School District GO 5.000% 8/15/29 1,295 1,569
Tax-Managed Balanced Fund
65

CouponMaturity
Date
FaceAmount
($000)
MarketValue•
($000)
19 San Antonio TX Independent School District GO 5.000% 8/15/37 2,495 2,968San Antonio TXWater Revenue 5.000% 5/15/34 1,000 1,247San Antonio TXWater Revenue 5.000% 5/15/37 1,680 2,102San Antonio TXWater Revenue 5.000% 5/15/38 1,440 1,840San Antonio TXWater Revenue 4.000% 5/15/40 3,000 3,366Southwest Texas Higher Education Authority Inc. Revenue(Southern Methodist University Project) 4.000% 10/1/34 1,350 1,565
19 SpringTX Independent School District GO 5.000% 8/15/32 1,000 1,19719 SpringTX Independent School District GO 5.000% 8/15/35 1,370 1,690
Sugar LandTX GO 5.000% 2/15/26 510 629Tarrant County TX Cultural Education Facilities FinanceCorp. Hospital Revenue (Cook Children's Medical Center) 5.000% 12/1/25 350 429
Tarrant County TX Cultural Education Facilities FinanceCorp. Hospital Revenue (Methodist Hospitals of Dallas) 5.250% 10/1/31 1,000 1,117
19 Texas City TX Independent School District GO 5.000% 8/15/26 3,365 4,064Texas GO 5.000% 10/1/22 1,120 1,214Texas GO 5.000% 10/1/24 1,210 1,424Texas GO 5.000% 8/1/26 925 951Texas GO 5.000% 8/1/31 500 514Texas GO Prere. 5.000% 4/1/24 1,330 1,536Texas Municipal Gas Acquisition & Supply Corp I. Revenue 5.250% 12/15/21 365 382Texas Municipal Gas Acquisition & Supply Corp I. Revenue 5.250% 12/15/23 245 279Texas Municipal Gas Acquisition & Supply Corp I. Revenue 5.250% 12/15/24 580 685Texas Municipal Gas Acquisition & Supply Corp I. Revenue 6.250% 12/15/26 155 186Texas Municipal Gas Acquisition & Supply Corp III. Revenue 5.000% 12/15/22 1,005 1,092Texas Municipal Gas Acquisition & Supply Corp III. Revenue 5.000% 12/15/23 380 412Texas Municipal Gas Acquisition & Supply Corp III. Revenue 5.000% 12/15/25 2,215 2,400Texas Municipal Gas Acquisition & Supply Corp III. Revenue 5.000% 12/15/28 1,335 1,437Texas Municipal Power Agency Revenue 5.000% 9/1/27 520 522Texas Private Activity Bond SurfaceTransportation Corp.Revenue (Infrastructure Group LLC I-635 Managed LanesProject) 4.000% 12/31/31 1,000 1,223
Texas Private Activity Bond SurfaceTransportation Corp.Revenue (Infrastructure Group LLC I-635 Managed LanesProject) 4.000% 6/30/32 2,000 2,421
Texas Private Activity Bond SurfaceTransportation Corp.Revenue (Infrastructure Group LLC I-635 Managed LanesProject) 4.000% 12/31/35 1,000 1,192
Texas Private Activity Bond SurfaceTransportation Corp.Revenue (Infrastructure Group LLC I-635 Managed LanesProject) 4.000% 6/30/40 2,000 2,338
Texas Private Activity Bond SurfaceTransportation Corp.Revenue (Infrastructure Group LLC I-635 Managed LanesProjects) 4.000% 6/30/38 1,200 1,413
Texas Private Activity Bond SurfaceTransportation Corp.Revenue (Infrastructure Group LLC I-635 Managed LanesProjects) 4.000% 12/31/38 1,000 1,174
6 Texas Public Finance Authority Revenue (Texas SouthernUniversity) 5.000% 11/1/21 1,020 1,052
Texas State University System Financing System Revenue 5.000% 3/15/32 1,625 2,038TexasTransportation Commission GO 5.000% 10/1/21 1,545 1,600TexasTransportation Commission GO 5.000% 10/1/22 1,480 1,604TexasTransportation Commission GO 5.000% 10/1/29 1,500 1,821TexasTransportation Commission GO 5.000% 4/1/32 2,000 2,461TexasTransportation Commission Mobility Fund GO 5.000% 10/1/34 1,705 2,174TexasTransportation Commission Revenue 5.000% 4/1/23 2,100 2,325
Tax-Managed Balanced Fund
66

CouponMaturity
Date
FaceAmount
($000)
MarketValue•
($000)
TexasTransportation CommissionTurnpike SystemRevenue 5.000% 8/15/33 525 597
TexasTransportation CommissionTurnpike SystemRevenue 5.000% 8/15/34 880 1,000
TexasTransportation CommissionTurnpike SystemRevenue 5.000% 8/15/37 2,460 2,804
TexasWater Development Board Revenue 4.000% 10/15/32 1,065 1,303TexasWater Development Board Revenue 4.000% 10/15/33 1,635 2,017TexasWater Development Board Revenue 4.000% 10/15/34 1,465 1,805TexasWater Development Board Revenue 4.000% 10/15/35 2,860 3,448TexasWater Development Board Revenue 4.000% 10/15/35 1,770 2,080TexasWater Development Board State ImplementationRevenue Fund (Master Trust) 3.000% 10/15/39 1,755 2,011
TexasWater Financial Assistance GO 5.000% 8/1/27 260 267TexasWater Financial Assistance GO Prere. 5.000% 8/1/21 740 760Travis TX GO 5.000% 3/1/27 1,545 1,902Trinity River Authority of Texas RegionalWastewaterSystem Revenue 5.000% 8/1/27 1,000 1,253
Trinity River Authority of Texas RegionalWastewaterSystem Revenue 5.000% 8/1/37 1,235 1,577
19 UnitedTX Independent School District GO Prere. 5.000% 8/15/24 2,550 2,979University of HoustonTexas Revenue 5.000% 2/15/28 5,000 6,127University of HoustonTexas Revenue 3.000% 2/15/31 3,490 3,988University of HoustonTexas Revenue 4.000% 2/15/33 1,840 2,083University of HoustonTexas Revenue 5.000% 2/15/35 4,500 5,384University of North Texas Revenue 4.000% 4/15/34 1,110 1,311University of North Texas Revenue 5.000% 4/15/36 1,275 1,559University of Texas System Revenue Financing SystemRevenue 5.000% 8/15/23 1,150 1,296
6 West Travis County TX Public Utility Agency Revenue 5.000% 8/15/27 1,235 1,5756 West Travis County TX Public Utility Agency Revenue 4.000% 8/15/32 270 316
Williamson County TX GO 5.000% 2/15/23 230 242
350,251Utah (0.3%)
Alpine UT School District GO 5.000% 3/15/30 1,025 1,290Central UtahWater Conservancy District GO 5.000% 4/1/30 500 505Central UtahWater Conservancy District Revenue 4.000% 10/1/32 1,000 1,197Granite UT School District Salt Lake County GO 5.000% 6/1/28 6,260 8,272Jordan Valley UTWater Conservancy District Revenue 4.000% 10/1/32 750 890Utah County UT Hospital Revenue (IHC Health Services) 5.000% 5/15/34 750 960Utah County UT Hospital Revenue (IHC Health Services) 5.000% 5/15/35 850 1,086Utah GO 5.000% 7/1/21 1,300 1,331Utah GO 5.000% 7/1/22 1,410 1,512Utah GO 5.000% 7/1/24 1,015 1,185UtahTransit Authority Sales Tax Revenue 5.000% 6/15/26 1,000 1,199UtahTransit Authority Sales Tax Revenue 5.000% 6/15/37 585 672UtahTransit Authority Sales Tax Revenue Prere. 5.000% 6/15/25 1,285 1,555
21,654Vermont (0.0%)
University of Vermont & State Agricultural College GO 5.000% 10/1/38 1,000 1,486
Virginia (0.8%)2 Albemarle County VA Economic Development Authority
Hospital Revenue (Sentara Martha Jefferson Obliged)VRDO 0.070% 1/4/21 1,200 1,200
Arlington County VA GO Prere. 5.000% 8/1/22 600 646
Tax-Managed Balanced Fund
67

CouponMaturity
Date
FaceAmount
($000)
MarketValue•
($000)
Chesapeake VAToll Road Revenue 5.000% 7/15/21 500 512Fairfax County VA GO 5.000% 10/1/23 1,255 1,421Fairfax County VA GO 4.000% 10/1/32 1,415 1,691Fairfax County VA GO 5.000% 10/1/34 695 943Fairfax County VA Public Improvement GO 5.000% 4/1/21 420 425Fairfax County VAWater Authority Revenue Prere. 5.000% 4/1/22 500 530Hampton Roads VATransportation AccountabilityCommission Revenue 5.000% 7/1/22 1,700 1,819
Henrico County VA Economic Development AuthorityResidential Care Facilities Revenue (WestminsterCanterbury Richmond) 4.000% 10/1/33 600 683
Mosaic VA District Community Development AuthorityRevenue 4.000% 3/1/33 750 894
Norfolk VA Economic Development Authority HospitalFacilities Revenue (Sentara Healthcare) PUT 5.000% 11/1/28 1,170 1,522
Norfolk VA GO 5.000% 8/1/21 2,040 2,097Norfolk VA GO Prere. 5.000% 9/1/24 1,090 1,280Norfolk VA GO Prere. 5.000% 9/1/24 1,345 1,579Norfolk VAWater Revenue 5.000% 11/1/31 5 5Norfolk VAWater Revenue 5.000% 11/1/34 1,155 1,463Norfolk VAWater Revenue Prere. 5.000% 5/1/22 495 527Richmond VA GO Prere. 5.000% 3/1/23 1,000 1,104Richmond VA Public Utility Revenue 5.000% 1/15/28 1,000 1,229Roanoke VA Economic Development Authority HospitalRevenue (Carilion Clinic Obligated Group) 5.000% 7/1/30 500 531
Stafford County VA Economic Development AuthorityHospital Facilities Revenue (MaryWashington HealthcareObligated Group) 5.000% 6/15/24 1,120 1,283
Virginia Beach VA Development Authority Residential CareFacility Revenue (Westminster-Canterbury on ChesapeakeBay) 5.000% 9/1/30 600 700
Virginia Beach VA Development Authority Residential CareFacility Revenue (Westminster-Canterbury on ChesapeakeBay) 5.000% 9/1/33 425 492
Virginia College Building Authority Educational FacilitiesRevenue (21st Century College & Equipment Programs) 5.000% 2/1/27 1,845 2,272
Virginia College Building Authority Educational FacilitiesRevenue (21st Century College & Equipment Programs) 3.000% 2/1/35 1,500 1,707
Virginia College Building Authority Educational FacilitiesRevenue (Public Higher Education Financing Program) 5.000% 9/1/22 265 286
Virginia College Building Authority Educational FacilitiesRevenue (Public Higher Education Financing Program) 4.000% 9/1/36 2,130 2,556
Virginia College Building Authority Educational FacilitiesRevenue (Public Higher Education Financing Program)ETM 5.000% 9/1/22 90 97
Virginia Commonwealth Transportation Board Revenue 5.000% 9/15/21 2,410 2,491Virginia Commonwealth Transportation Board Revenue 5.000% 5/15/26 1,405 1,756Virginia Commonwealth Transportation Board Revenue 4.000% 5/15/35 1,280 1,507Virginia Commonwealth Transportation Board Revenue 4.000% 5/15/35 1,750 2,084Virginia Public Building Authority Public Facilities Revenue 5.000% 8/1/24 1,250 1,462Virginia Public Building Authority Revenue 5.000% 11/1/31 125 136Virginia Public School Authority Revenue 5.000% 8/1/22 1,335 1,436Virginia Public School Authority Revenue 5.000% 8/1/24 6,080 7,103
Tax-Managed Balanced Fund
68

CouponMaturity
Date
FaceAmount
($000)
MarketValue•
($000)
Virginia Public School Authority School Technology &Security Notes Revenue 5.000% 4/15/24 2,180 2,517
Wise County VA Industrial development Authority SolidWaste & Sewage Disposal Revenue (Virginia Electric &Power Co. Project) PUT 0.750% 9/2/25 575 580
52,566Washington (1.0%)
5 BellinghamWAWater & Sewer Revenue Refunding Bonds 5.000% 8/1/25 400 474Central Puget SoundWA Regional Transit Authority Sales &UseTax Revenue 5.000% 11/1/26 795 1,004
Clark CountyWA School District No. 37 Vancouver Revenue 5.000% 12/1/32 1,080 1,424Energy NorthwestWashington Electric Revenue (ColumbiaGenerating Station) 5.000% 7/1/31 1,225 1,459
Energy NorthwestWashington Electric Revenue (ProjectNo. 3) 5.000% 7/1/26 1,735 2,172
King CountyWA GO 5.000% 1/1/24 500 524King CountyWA GO 4.000% 12/1/32 1,500 1,737King CountyWA Housing Authority Revenue 3.000% 6/1/40 1,000 1,074Lewis CountyWA Public Utility District No. 1 Revenue(Cowlitz Falls Hydroelectric Project) 5.000% 10/1/21 1,060 1,098
Mason CountyWA Public Utility District No. 3 Revenue 4.000% 12/1/32 1,000 1,237Northwest EnergyWashington Electric Revenue(Bonneville Power Administration) 5.000% 7/1/28 2,550 2,726
Pierce County School District No. 3 Puyallup GO 5.000% 12/1/25 1,000 1,089Port of SeattleWA Revenue 5.000% 8/1/28 1,005 1,073Port of SeattleWA Revenue 5.000% 8/1/29 250 267Snohomish CountyWA School District No. 103 (Monroe)GO 5.000% 12/1/31 1,000 1,199
University ofWashington Revenue 5.000% 4/1/31 335 339Washington (Motor Vehicle Fuel Tax) GO 5.000% 7/1/23 375 384Washington (Motor Vehicle Fuel Tax) GO 5.000% 7/1/27 1,000 1,184Washington (Motor Vehicle Fuel Tax) GO 4.000% 7/1/31 1,500 1,677Washington Economic Development Finance AuthorityLease Revenue (Washington Biomedical ResearchProperties 2) 5.000% 6/1/25 1,090 1,287
Washington GO 5.000% 7/1/22 1,445 1,549Washington GO 5.000% 7/1/23 1,155 1,293Washington GO 5.000% 7/1/25 560 600Washington GO 5.000% 7/1/25 1,500 1,748Washington GO 5.000% 8/1/26 5,105 6,419Washington GO 4.000% 7/1/27 2,425 2,561Washington GO 5.000% 8/1/27 1,000 1,211Washington GO 4.000% 7/1/28 1,135 1,197Washington GO 5.000% 7/1/28 2,000 2,365Washington GO 4.000% 7/1/29 2,720 2,953Washington GO 5.000% 7/1/30 1,100 1,297Washington GO 5.000% 7/1/32 1,250 1,470
5 Washington GO 5.000% 6/1/35 1,500 2,004Washington GO 5.000% 8/1/36 2,070 2,667Washington GO 5.000% 8/1/37 3,685 4,237Washington GO 5.000% 8/1/38 2,070 2,652Washington GO Prere. 5.000% 2/1/22 500 526Washington Health Care Facilities Authority Revenue(Central Washington Health Services Association) 5.000% 7/1/30 1,760 2,025
Washington Health Care Facilities Authority Revenue(CommonSpirit Health) 5.000% 8/1/32 1,750 2,243
Tax-Managed Balanced Fund
69

CouponMaturity
Date
FaceAmount
($000)
MarketValue•
($000)
Washington Health Care Facilities Authority Revenue(CommonSpirit Health) 5.000% 8/1/36 1,500 1,898
Washington Health Care Facilities Authority Revenue(CommonSpirit Health) PUT 5.000% 8/1/24 1,000 1,132
Washington Health Care Facilities Authority Revenue(MultiCare Health System) 5.000% 8/15/32 1,000 1,274
Washington Health Care Facilities Authority Revenue(Providence Health & Services) 5.000% 10/1/33 880 938
Washington Higher Education Facilities Authority Revenue(Seattle University Project) 5.000% 10/1/35 1,000 1,223
Washington State Convention Center Public FacilitiesDistrict Revenue (LodgingTax Bonds) 5.000% 7/1/34 250 299
Washington State University General Revenue Prere. 5.000% 10/1/21 500 518
71,727West Virginia (0.2%)
West Virginia Commissioner of Highways Revenue (SurfaceTransportation Improvements) 5.000% 9/1/33 1,155 1,434
West Virginia Economic Development Authority LotteryRevenue 4.000% 6/15/37 1,545 1,775
West Virginia GO 5.000% 12/1/35 1,000 1,283West Virginia GO 5.000% 6/1/36 1,000 1,281West Virginia GO 5.000% 6/1/38 2,500 3,253West Virginia Higher Education Policy CommissionRevenue 5.000% 7/1/37 1,315 1,593
West Virginia Hospital Finance Authority Hospital Revenue(Cabell Huntington Hospital Inc.) 5.000% 1/1/29 765 974
West Virginia Parkways Authority Turnpike Toll Revenue 5.000% 6/1/33 825 1,058West Virginia University Revenue PUT 5.000% 10/1/29 1,000 1,286
13,937Wisconsin (0.9%)
MadisonWI AreaTechnical College GO 4.000% 3/1/25 1,835 2,116MadisonWI GO 4.000% 10/1/26 1,500 1,812MilwaukeeWI GO 5.000% 4/1/26 1,935 2,378
2 University ofWisconsin Hospitals & Clinics AuthorityRevenue VRDO 0.080% 1/4/21 8,100 8,100
3 Wisconsin Center District Tax Revenue 0.000% 12/15/34 1,250 9013 Wisconsin Center District Tax Revenue 0.000% 12/15/39 1,250 730
Wisconsin GO 5.000% 5/1/21 835 8485 Wisconsin GO 5.000% 5/1/23 3,400 3,767
Wisconsin GO 5.000% 5/1/29 1,000 1,105Wisconsin GO 4.000% 5/1/33 1,665 1,984Wisconsin GO 5.000% 5/1/34 1,780 2,182Wisconsin GO 5.000% 5/1/34 3,880 5,017Wisconsin GO 5.000% 5/1/35 1,000 1,224Wisconsin GO 5.000% 5/1/36 2,000 2,363Wisconsin GO 5.000% 5/1/36 1,000 1,222Wisconsin GO 5.000% 5/1/38 1,740 2,173Wisconsin GO ETM 5.000% 5/1/21 15 15Wisconsin GO Prere. 5.000% 5/1/22 500 532Wisconsin GO Prere. 5.000% 5/1/22 35 37Wisconsin GO Prere. 5.000% 5/1/22 2,210 2,352Wisconsin Health & Educational Facilities AuthorityRevenue (Agnesian HealthCare Inc.) 5.000% 7/1/31 1,065 1,309
Wisconsin Health & Educational Facilities AuthorityRevenue (Ascension Health Alliance Credit Group) 4.000% 11/15/34 1,540 1,767
Tax-Managed Balanced Fund
70

CouponMaturity
Date
FaceAmount
($000)
MarketValue•
($000)
Wisconsin Health & Educational Facilities AuthorityRevenue (Ascension Health Alliance Credit Group) 5.000% 11/15/36 2,265 2,744
Wisconsin Health & Educational Facilities AuthorityRevenue (Aspirus, Inc. Obligated Group) 5.000% 8/15/25 1,670 1,861
Wisconsin Health & Educational Facilities AuthorityRevenue (Children's Hospital ofWisconsin Inc.) 4.000% 8/15/31 1,010 1,188
Wisconsin Health & Educational Facilities AuthorityRevenue (Marquette University) 5.000% 10/1/30 500 536
Wisconsin Health & Educational Facilities AuthorityRevenue (ThedaCare Inc. Obligated Group) 4.000% 12/15/39 1,595 1,879
Wisconsin Public Finance Authority Exempt FacilitiesRevenue (Wingate University) 5.250% 10/1/32 740 837
Wisconsin Public Finance Authority Hospital Revenue(Renown Regional Medical Center) 5.000% 6/1/28 750 959
Wisconsin Public Finance Authority Hospital Revenue(Renown Regional Medical Center) 5.000% 6/1/30 1,085 1,307
Wisconsin Public Finance Authority Hospital Revenue(Renown Regional Medical Center) 4.000% 6/1/39 1,000 1,167
Wisconsin Public Power System Power Supply SystemRevenue 5.000% 7/1/32 500 554
Wisconsin Transportation Revenue 5.000% 7/1/31 1,490 1,886Wisconsin Transportation Revenue 5.000% 7/1/31 1,370 1,695Wisconsin Transportation Revenue 5.000% 7/1/33 2,755 3,173Wisconsin Transportation Revenue Prere. 5.000% 7/1/22 115 123Wisconsin Transportation Revenue Prere. 5.000% 7/1/22 385 413
64,256Wyoming (0.1%)
Lincoln CountyWY Pollution Control Revenue (ExxonMobilProject) VRDO 0.100% 1/4/21 8,635 8,635
6 Wyoming Municipal Power Agency Power Supply Revenue 5.000% 1/1/34 1,000 1,213
9,848
TotalTax-Exempt Municipal Bonds (Cost $3,252,340) 3,450,560
Tax-Managed Balanced Fund
71

CouponMaturity
Date
FaceAmount
($000)
MarketValue•
($000)
Temporary Cash Investments (0.1%)
U.S. Government and Agency Obligations (0.1%)United States Treasury Bill (Cost $2,760) 0.115% 2/16/21 2,760 2,760
Total Investments (99.4%) (Cost $4,674,877) 6,815,787
Other Assets and Liabilities—Net (0.6%) 43,065
Net Assets (100%) 6,858,852
Cost is in $000.• See Note A in Notes to Financial Statements.* Non-income-producing security.1 Considered an affiliated company of the fund as the issuer is another member of The Vanguard Group.2 Scheduled principal and interest payments are guaranteed by bank letter of credit.3 Scheduled principal and interest payments are guaranteed by Assured Guaranty Municipal Corp.4 Security exempt from registration under Rule 144A of the Securities Act of 1933. Such securities may be sold in transactions exempt
from registration, normally to qualified institutional buyers. At December 31, 2020, the aggregate value of these securities was$22,899,000, representing 0.3% of net assets.
5 Includes securities purchased on a when-issued or delayed-delivery basis for which the fund has not taken delivery as of December 31,2020.
6 Scheduled principal and interest payments are guaranteed by Build America Mutual Assurance Co.7 Scheduled principal and interest payments are guaranteed by Ambac Assurance Corp.8 Scheduled principal and interest payments are guaranteed by National Public Finance Guarantee Corp.9 Variable rate security; rate shown is effective rate at period end. Certain variable rate securities are not based on a published
reference rate and spread but are determined by the issuer or agent based on current market conditions.10 Scheduled principal and interest payments are guaranteed by Financial Guaranty Insurance Co.11 Step bond.12 Scheduled principal and interest payments are guaranteed by Assured Guaranty Corp.13 Securities with a value of $431,000 have been segregated as initial margin for open futures contracts.14 Scheduled principal and interest payments are guaranteed by Municipal Bond Insurance Association.15 Scheduled principal and interest payments are guaranteed by Michigan School Board Loan Fund.16 The issuer was placed under federal conservatorship in September 2008; since that time, its daily operations have been managed by
the Federal Housing Finance Agency and it receives capital from the U.S. Treasury, as needed to maintain a positive net worth, inexchange for senior preferred stock.
17 Scheduled principal and interest payments are guaranteed by Federal Housing Authority.18 Scheduled principal and interest payments are guaranteed by Berkshire Hathaway Assurance Corp.19 Scheduled principal and interest payments are guaranteed by Texas Permanent School Fund.3M—3-month.BAN—Bond Anticipation Note.COP—Certificate of Participation.ETM—Escrowed to Maturity.GAN—Grant Anticipation Note.GO—Government Obligation Bond.LIBOR—London Interbank Offered Rate.Prere.—Prerefunded.PUT—Put Option Obligation.REIT—Real Estate Investment Trust.SIFMA—Securities Industry and Financial Markets Association.TOB—Tender Option Bond.VRDO—Variable Rate Demand Obligation.
Tax-Managed Balanced Fund
72

Derivative Financial Instruments Outstanding as of Period End
Futures Contracts
($000)
Expiration
Number ofLong (Short)Contracts
NotionalAmount
Value andUnrealized
Appreciation(Depreciation)
Long Futures Contracts
5-Year U.S. Treasury Note March 2021 391 49,330 114
E-mini S&P 500 Index March 2021 247 46,298 965
1,079
Short Futures Contracts
Ultra Long U.S. Treasury Bond March 2021 (54) (11,533) 131
1,210
See accompanying Notes, which are an integral part of the Financial Statements.
Tax-Managed Balanced Fund
73
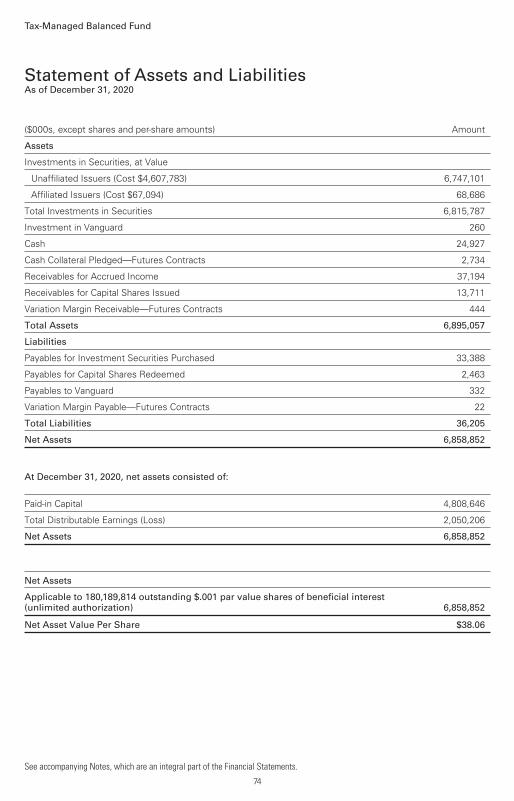
($000s, except shares and per-share amounts) Amount
Assets
Investments in Securities, at Value
Unaffiliated Issuers (Cost $4,607,783) 6,747,101
Affiliated Issuers (Cost $67,094) 68,686
Total Investments in Securities 6,815,787
Investment in Vanguard 260
Cash 24,927
Cash Collateral Pledged—Futures Contracts 2,734
Receivables for Accrued Income 37,194
Receivables for Capital Shares Issued 13,711
Variation Margin Receivable—Futures Contracts 444
Total Assets 6,895,057
Liabilities
Payables for Investment Securities Purchased 33,388
Payables for Capital Shares Redeemed 2,463
Payables to Vanguard 332
Variation Margin Payable—Futures Contracts 22
Total Liabilities 36,205
Net Assets 6,858,852
At December 31, 2020, net assets consisted of:
Paid-in Capital 4,808,646
Total Distributable Earnings (Loss) 2,050,206
Net Assets 6,858,852
Net Assets
Applicable to 180,189,814 outstanding $.001 par value shares of beneficial interest(unlimited authorization) 6,858,852
Net Asset Value Per Share $38.06
See accompanying Notes, which are an integral part of the Financial Statements.
Tax-Managed Balanced Fund
Statement of Assets and LiabilitiesAs of December 31, 2020
74

Year EndedDecember 31, 2020
($000)
Investment Income
Income
Dividends1 45,749
Interest 72,979
Total Income 118,728
Expenses
The Vanguard Group—Note B
Investment Advisory Services 430
Management and Administrative 4,520
Marketing and Distribution 329
Custodian Fees 21
Auditing Fees 31
Shareholders’ Reports 38
Trustees’ Fees and Expenses 4
Total Expenses 5,373
Net Investment Income 113,355
Realized Net Gain (Loss)
Investment Securities Sold1,2 (27,906)
Futures Contracts 2,116
Realized Net Gain (Loss) (25,790)
Change in Unrealized Appreciation (Depreciation)
Investment Securities1 659,188
Futures Contracts 432
Change in Unrealized Appreciation (Depreciation) 659,620
Net Increase (Decrease) in Net Assets Resulting from Operations 747,185
1 Dividend income, realized net gain (loss), and change in unrealized appreciation (depreciation) from an affiliated company of the fundwere $747,000, $353,000, and $1,592,000, respectively. Purchases and sales were $119,781,000 and $53,040,000, respectively.
2 Includes $15,877,000 of net gain (loss) resulting from in-kind redemptions.
See accompanying Notes, which are an integral part of the Financial Statements.
Tax-Managed Balanced Fund
Statement of Operations
75

Year Ended December 31,
2020($000)
2019($000)
Increase (Decrease) in Net Assets
Operations
Net Investment Income 113,355 111,513
Realized Net Gain (Loss) (25,790) (13,758)
Change in Unrealized Appreciation (Depreciation) 659,620 733,500
Net Increase (Decrease) in Net Assets Resulting from Operations 747,185 831,255
Distributions1
Total Distributions (113,354) (113,064)
Capital Share Transactions
Issued 1,240,383 1,111,257
Issued in Lieu of Cash Distributions 93,196 93,909
Redeemed (917,289) (484,987)
Net Increase (Decrease) from Capital Share Transactions 416,290 720,179
Total Increase (Decrease) 1,050,121 1,438,370
Net Assets
Beginning of Period 5,808,731 4,370,361
End of Period 6,858,852 5,808,731
1 Certain prior-period numbers have been reclassified to conform with the current-period presentation.
See accompanying Notes, which are an integral part of the Financial Statements.
Tax-Managed Balanced Fund
Statement of Changes in Net Assets
76
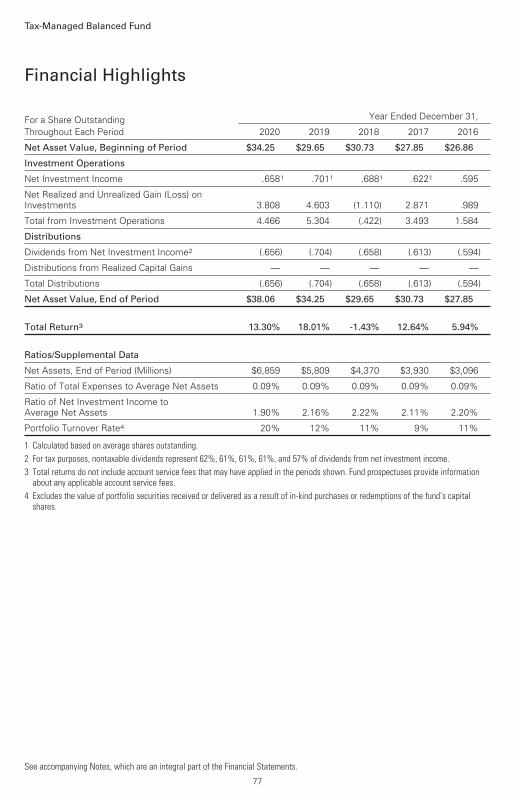
For a Share OutstandingThroughout Each Period
Year Ended December 31,
2020 2019 2018 2017 2016
Net Asset Value, Beginning of Period $34.25 $29.65 $30.73 $27.85 $26.86
Investment Operations
Net Investment Income .6581 .7011 .6881 .6221 .595
Net Realized and Unrealized Gain (Loss) onInvestments 3.808 4.603 (1.110) 2.871 .989
Total from Investment Operations 4.466 5.304 (.422) 3.493 1.584
Distributions
Dividends from Net Investment Income2 (.656) (.704) (.658) (.613) (.594)
Distributions from Realized Capital Gains — — — — —
Total Distributions (.656) (.704) (.658) (.613) (.594)
Net Asset Value, End of Period $38.06 $34.25 $29.65 $30.73 $27.85
Total Return3 13.30% 18.01% -1.43% 12.64% 5.94%
Ratios/Supplemental Data
Net Assets, End of Period (Millions) $6,859 $5,809 $4,370 $3,930 $3,096
Ratio of Total Expenses to Average Net Assets 0.09% 0.09% 0.09% 0.09% 0.09%
Ratio of Net Investment Income toAverage Net Assets 1.90% 2.16% 2.22% 2.11% 2.20%
Portfolio Turnover Rate4 20% 12% 11% 9% 11%
1 Calculated based on average shares outstanding.2 For tax purposes, nontaxable dividends represent 62%, 61%, 61%, 61%, and 57% of dividends from net investment income.3 Total returns do not include account service fees that may have applied in the periods shown. Fund prospectuses provide information
about any applicable account service fees.4 Excludes the value of portfolio securities received or delivered as a result of in-kind purchases or redemptions of the fund’s capital
shares.
Tax-Managed Balanced Fund
Financial Highlights
See accompanying Notes, which are an integral part of the Financial Statements.
77

Vanguard Tax-Managed Balanced Fund is registered under the Investment Company Act of 1940 asan open-end investment company, or mutual fund. The fund invests in debt instruments of manymunicipal issuers; the issuers’ abilities to meet their obligations may be affected by economic andpolitical developments in a specific state or region. Many municipalities insure repayment of theirbonds. The insurance does not guarantee the market value of the municipal bonds.
Market disruptions associated with the COVID-19 pandemic have had a global impact, anduncertainty exists as to the long-term implications. Such disruptions can adversely affect assets ofthe fund and thus fund performance.
A. The following significant accounting policies conform to generally accepted accountingprinciples for U.S. investment companies. The fund consistently follows such policies in preparingits financial statements.
1. Security Valuation: Securities are valued as of the close of trading on the New York StockExchange (generally 4 p.m., Eastern time) on the valuation date. Equity securities are valued at thelatest quoted sales prices or official closing prices taken from the primary market in which eachsecurity trades; such securities not traded on the valuation date are valued at the mean of thelatest quoted bid and asked prices. Bonds and temporary cash investments are valued using thelatest bid prices or using valuations based on a matrix system (which considers such factors assecurity prices, yields, maturities, and ratings), both as furnished by independent pricing services.Securities for which market quotations are not readily available, or whose values have beenmaterially affected by events occurring before the fund's pricing time but after the close of thesecurities’ primary markets, are valued by methods deemed by the board of trustees to representfair value.
2. Futures Contracts: The fund uses futures contracts to invest in fixed income asset classes withgreater efficiency and lower cost than is possible through direct investment, to add value whenthese instruments are attractively priced, or to adjust sensitivity to changes in interest rates. Thefund also uses index futures contracts to a limited extent, with the objective of maintaining fullexposure to the stock market while maintaining liquidity. The fund may purchase or sell futurescontracts to achieve a desired level of investment, whether to accommodate portfolio turnover orcash flows from capital share transactions. The primary risks associated with the use of futurescontracts are imperfect correlation between changes in market values of bonds or stocks held bythe fund and the prices of futures contracts, and the possibility of an illiquid market. Counterpartyrisk involving futures is mitigated because a regulated clearinghouse is the counterparty instead ofthe clearing broker. To further mitigate counterparty risk, the fund trades futures contracts on anexchange, monitors the financial strength of its clearing brokers and clearinghouse, and hasentered into clearing agreements with its clearing brokers. The clearinghouse imposes initialmargin requirements to secure the fund’s performance and requires daily settlement of variationmargin representing changes in the market value of each contract. Any securities pledged as initialmargin for open contracts are noted in the Schedule of Investments.
Futures contracts are valued at their quoted daily settlement prices. The notional amounts of thecontracts are not recorded in the Statement of Assets and Liabilities. Fluctuations in the value ofthe contracts are recorded in the Statement of Assets and Liabilities as an asset (liability) and inthe Statement of Operations as unrealized appreciation (depreciation) until the contracts areclosed, when they are recorded as realized gains (losses) on futures contracts.
Tax-Managed Balanced Fund
Notes to Financial Statements
78

During the year ended December 31, 2020, the fund’s average investments in long and shortfutures contracts represented 1% and less than 1% of net assets, respectively, based on theaverage of the notional amounts at each quarter-end during the period.
3. Federal IncomeTaxes: The fund intends to continue to qualify as a regulated investmentcompany and distribute all of its taxable income. The fund’s tax returns are open to examination bythe relevant tax authorities until expiration of the applicable statute of limitations, which isgenerally three years after the filing of the tax return. Management has analyzed the fund’s taxpositions taken for all open federal and state income tax years, and has concluded that noprovision for income tax is required in the fund’s financial statements.
4. Distributions: Distributions to shareholders are recorded on the ex-dividend date. Distributionsare determined on a tax basis at the fiscal year-end and may differ from net investment incomeand realized capital gains for financial reporting purposes.
5. Credit Facilities and Interfund Lending Program: The fund and certain other funds managed byThe Vanguard Group ("Vanguard") participate in a $4.3 billion committed credit facility provided by asyndicate of lenders pursuant to a credit agreement and an uncommitted credit facility provided byVanguard. Both facilities may be renewed annually. Each fund is individually liable for itsborrowings, if any, under the credit facilities. Borrowings may be utilized for temporary oremergency purposes, subject to the fund’s regulatory and contractual borrowing restrictions.Withrespect to the committed credit facility, the participating funds are charged administrative fees andan annual commitment fee of 0.10% of the undrawn committed amount of the facility; these feesare allocated to the funds based on a method approved by the fund’s board of trustees andincluded in Management and Administrative expenses on the fund’s Statement of Operations. Anyborrowings under either facility bear interest at a rate based upon the higher of the one-monthLondon Interbank Offered Rate (or an acceptable alternate rate, if necessary), federal fundseffective rate, or overnight bank funding rate plus an agreed-upon spread, except that borrowingsunder the uncommitted credit facility may bear interest based upon an alternative rate agreed toby the fund and Vanguard.
In accordance with an exemptive order (the “Order”) from the SEC, the fund may participate in ajoint lending and borrowing program that allows registered open-end Vanguard funds to borrowmoney from and lend money to each other for temporary or emergency purposes (the “InterfundLending Program”), subject to compliance with the terms and conditions of the Order, and to theextent permitted by the fund’s investment objective and investment policies. Interfund loans andborrowings normally extend overnight, but can have a maximum duration of seven days. Loansmay be called on one business day’s notice. The interest rate to be charged is governed by theconditions of the Order and internal procedures adopted by the board of trustees. The board oftrustees is responsible for overseeing the Interfund Lending Program.
For the year ended December 31, 2020, the fund did not utilize the credit facilities or the InterfundLending Program.
6. Other: Dividend income is recorded on the ex-dividend date. Non-cash dividends included individend income, if any, are recorded at the fair value of the securities received. Interest income isaccrued daily. Premiums and discounts on debt securities are amortized and accreted,respectively, to interest income over the lives of the respective securities, except for premiums on
Tax-Managed Balanced Fund
79

certain callable debt securities that are amortized to the earliest call date. Security transactions areaccounted for on the date securities are bought or sold. Costs used to determine realized gains(losses) on the sale of investment securities are those of the specific securities sold.
B. In accordance with the terms of a Funds’ Service Agreement (the “FSA”) between Vanguardand the fund, Vanguard furnishes to the fund investment advisory, corporate management,administrative, marketing, and distribution services at Vanguard’s cost of operations (as defined bythe FSA). These costs of operations are allocated to the fund based on methods and guidelinesapproved by the board of trustees and are generally settled twice a month.
Upon the request of Vanguard, the fund may invest up to 0.40% of its net assets as capital inVanguard. At December 31, 2020, the fund had contributed to Vanguard capital in the amount of$260,000, representing less than 0.01% of the fund’s net assets and 0.10% of Vanguard’s capitalreceived pursuant to the FSA. The fund’s trustees and officers are also directors and employees,respectively, of Vanguard.
C. Various inputs may be used to determine the value of the fund’s investments and derivatives.These inputs are summarized in three broad levels for financial statement purposes. The inputs ormethodologies used to value securities are not necessarily an indication of the risk associated withinvesting in those securities.
Level 1—Quoted prices in active markets for identical securities.
Level 2—Other significant observable inputs (including quoted prices for similar securities, interestrates, prepayment speeds, credit risk, etc.).
Level 3—Significant unobservable inputs (including the fund’s own assumptions used todetermine the fair value of investments). Any investments and derivatives valued with significantunobservable inputs are noted on the Schedule of Investments.
The following table summarizes the market value of the fund's investments and derivatives as ofDecember 31, 2020, based on the inputs used to value them:
Level 1($000)
Level 2($000)
Level 3($000)
Total($000)
Investments
Assets
Common Stocks 3,362,467 — — 3,362,467
Tax-Exempt Municipal Bonds — 3,450,560 — 3,450,560
Temporary Cash Investments — 2,760 — 2,760
Total 3,362,467 3,453,320 — 6,815,787
Derivative Financial Instruments
Assets
Futures Contracts1 444 — — 444
Liabilities
Futures Contracts1 22 — — 22
1 Represents variation margin on the last day of the reporting period.
D. Permanent differences between book-basis and tax-basis components of net assets arereclassified among capital accounts in the financial statements to reflect their tax character. These
Tax-Managed Balanced Fund
80
reclassifications have no effect on net assets or net asset value per share. As of period end,permanent differences primarily attributable to the accounting for in-kind redemptions werereclassified between the following accounts:
Amount($000)
Paid-in Capital 15,877
Total Distributable Earnings (Loss) (15,877)
Temporary differences between book-basis and tax-basis components of total distributableearnings (losses) arise when certain items of income, gain, or loss are recognized in differentperiods for financial statement and tax purposes; these differences will reverse at some time inthe future. The differences are primarily related to the deferral of losses from wash sales; thedeferral of losses from straddles; the recognition of unrealized gains or losses from certainderivative contracts; and the classification of securities for tax purposes. As of period end, thetax-basis components of total distributable earnings (losses) are detailed in the table as follows:
Amount($000)
Undistributed Tax-Exempt Income 82
Undistributed Ordinary Income 14
Undistributed Long-Term Gains —
Capital Loss Carryforwards (87,047)
Qualified Late-Year Losses —
Net Unrealized Gains (Losses) 2,137,157
The tax character of distributions paid was as follows:
Year Ended December 31,
2020Amount
($000)
2019Amount
($000)
Tax-Exempt Income 69,539 68,608
Ordinary Income 43,815 44,456
Long-Term Capital Gains — —
Total 113,354 113,064
As of December 31, 2020, gross unrealized appreciation and depreciation for investments andderivatives based on cost for U.S. federal income tax purposes were as follows:
Amount($000)
Tax Cost 4,678,630
Gross Unrealized Appreciation 2,149,656
Gross Unrealized Depreciation (12,499)
Net Unrealized Appreciation (Depreciation) 2,137,157
Tax-Managed Balanced Fund
81

E. During the year ended December 31, 2020, the fund purchased $1,498,337,000 of investmentsecurities and sold $1,187,061,000 of investment securities, other than temporary cashinvestments. Purchases and sales include $0 and $16,962,000, respectively, in connection within-kind purchases and redemptions of the fund’s capital shares.
The fund purchased securities from and sold securities to other Vanguard funds or accountsmanaged by Vanguard or its affiliates, in accordance with procedures adopted by the board oftrustees in compliance with Rule 17a-7 of the Investment Company Act of 1940. For the yearended December 31, 2020, such purchases and sales were $489,185,000 and $389,570,000,respectively; these amounts, other than temporary cash investments, are included in thepurchases and sales of investment securities noted above.
F. Capital shares issued and redeemed were:
Year Ended December 31,
2020Shares
(000)
2019Shares
(000)
Issued 35,874 34,370
Issued in Lieu of Cash Distributions 2,756 2,858
Redeemed (28,026) (15,016)
Net Increase (Decrease) in Shares Outstanding 10,604 22,212
G. Management has determined that no events or transactions occurred subsequent toDecember 31, 2020, that would require recognition or disclosure in these financial statements.
Tax-Managed Balanced Fund
82

All of the returns in this report represent past performance, which is not a guarantee offuture results that may be achieved by the fund. (Current performance may be lower orhigher than the performance data cited. For performance data current to the most recentmonth-end, visit our website at vanguard.com/performance.) Note, too, that bothinvestment returns and principal value can fluctuate widely, so an investor’s shares, whensold, could be worth more or less than their original cost.The returns shown do not reflecttaxes that a shareholder would pay on fund distributions or on the sale of fund shares.
Cumulative Performance: December 31, 2010,Through December 31, 2020Initial Investment of $10,000
$43,000
6,000
37,405
2020201920182017201620152014201320122011
Average Annual Total ReturnsPeriods Ended December 31, 2020
OneYear
FiveYears
TenYears
Final Valueof a $10,000Investment
Tax-Managed Capital Appreciation FundAdmiral Shares 21.07% 15.70% 14.10% $37,405
Russell 1000 Index 20.96 15.60 14.01 37,102
Dow Jones U.S. Total Stock Market FloatAdjusted Index 20.79 15.36 13.74 36,240
OneYear
FiveYears
TenYears
Final Valueof a $5,000,000
Investment
Tax-Managed Capital Appreciation FundInstitutional Shares 21.08% 15.74% 14.14% $18,762,111
Russell 1000 Index 20.96 15.60 14.01 18,550,944
Dow Jones U.S. Total Stock Market Float AdjustedIndex 20.79 15.36 13.74 18,120,128
Tax-Managed Capital Appreciation Fund
Performance Summary
See Financial Highlights for dividend and capital gains information.
83

Basic Materials 1.8%
Consumer Discretionary 17.0
Consumer Services 0.0
Consumer Staples 5.3
Energy 2.1
Financials 10.3
Health Care 12.8
Industrials 14.2
Other 0.0
Real Estate 3.1
Technology 27.4
Telecommunications 3.3
Utilities 2.7
The table reflects the fund’s investments, except for short-terminvestments and derivatives. Sector categories are based on theIndustry Classification Benchmark (“ICB”), except for the “Other”category (if applicable), which includes securities that have notbeen provided an ICB classification as of the effective reportingperiod.
The Industry Classification Benchmark (“ICB”) is owned by FTSE. FTSE does not accept any liability to any person for anyloss or damage arising out of any error or omission in the ICB.
Tax-Managed Capital Appreciation Fund
Fund AllocationAs of December 31, 2020
84

The fund files its complete schedule of portfolio holdings with the Securities and ExchangeCommission (SEC) for the first and third quarters of each fiscal year as an exhibit to its reports onForm N-PORT. The fund’s Form N-PORT reports are available on the SEC’s website atwww.sec.gov.
Shares
MarketValue•
($000)
Common Stocks (99.9%)
Basic Materials (1.8%)Linde plc 184,824 48,703Ecolab Inc. 124,671 26,974Newmont Corp. 319,112 19,112Air Products andChemicals Inc. 64,373 17,588
FMC Corp. 139,839 16,072Albemarle Corp. 93,422 13,782Celanese Corp. Class A 99,812 12,969Fastenal Co. 264,288 12,905Scotts Miracle-Gro Co. 58,646 11,679LyondellBasell IndustriesNV Class A 123,383 11,309
Southern Copper Corp. 151,668 9,877Freeport-McMoRan Inc. 357,538 9,303
* Alcoa Corp. 363,031 8,368Dow Inc. 129,023 7,161Mosaic Co. 265,008 6,098Reliance Steel &Aluminum Co. 47,511 5,689
Nucor Corp. 71,365 3,796Element Solutions Inc. 176,547 3,130Eastman Chemical Co. 20,871 2,093International Paper Co. 41,683 2,072
* AdvanSix Inc. 90,394 1,807Hexcel Corp. 33,002 1,600Westlake Chemical Corp. 18,022 1,471CF IndustriesHoldings Inc. 35,526 1,375
W R Grace & Co. 22,732 1,246Royal Gold Inc. 6,912 735United States SteelCorp. 22,107 371
Avery Dennison Corp. 1,541 239Ashland GlobalHoldings Inc. 2,523 200
International Flavors &Fragrances Inc. 1,345 146
257,870Consumer Discretionary (17.0%)* Amazon.com Inc. 167,755 546,366
Shares
MarketValue•
($000)
* Tesla Inc. 291,805 205,918* Walt Disney Co. 718,969 130,263
Home Depot Inc. 407,845 108,332* Netflix Inc. 168,110 90,902
Walmart Inc. 527,802 76,083NIKE Inc. Class B 465,745 65,889CostcoWholesale Corp. 174,571 65,775McDonald's Corp. 281,388 60,380Lowe's Cos. Inc. 335,319 53,822Starbucks Corp. 481,204 51,479
* Copart Inc. 312,132 39,719* Booking Holdings Inc. 15,692 34,950
Estee Lauder Cos. Inc.Class A 120,437 32,059
Target Corp. 168,692 29,779Activision Blizzard Inc. 314,746 29,224TJX Cos. Inc. 420,379 28,708Ross Stores Inc. 212,711 26,123Marriott International Inc.Class A 190,777 25,167
* O'Reilly Automotive Inc. 52,052 23,557* AutoZone Inc. 19,261 22,833
eBay Inc. 369,857 18,585* NVR Inc. 4,451 18,159
Dollar General Corp. 85,818 18,048Electronic Arts Inc. 115,721 16,618
* CarMax Inc. 173,013 16,343Yum! Brands Inc. 148,953 16,170
* Uber Technologies Inc. 311,686 15,896DR Horton Inc. 223,326 15,392
* Spotify Technology SA 47,026 14,797* Dollar Tree Inc. 129,701 14,013
Southwest Airlines Co. 284,914 13,280Yum China Holdings Inc. 219,948 12,557
* Lululemon Athletica Inc. 35,968 12,518Delta Air Lines Inc. 310,335 12,479General Motors Co. 298,701 12,438
* Capri Holdings Ltd. 277,612 11,660Dolby Laboratories Inc.Class A 115,638 11,232
* Chipotle MexicanGrill Inc. Class A 8,048 11,160
Tax-Managed Capital Appreciation Fund
Financial Statements
Schedule of InvestmentsAs of December 31, 2020
85

Shares
MarketValue•
($000)
Lennar Corp. Class A 139,359 10,623* Tempur Sealy
International Inc. 390,092 10,532PVH Corp. 112,051 10,520Gentex Corp. 302,760 10,273PulteGroup Inc. 230,354 9,933
* Zynga Inc. Class A 926,065 9,140* Trade Desk Inc. Class A 11,201 8,972
Expedia Group Inc. 67,567 8,946Darden Restaurants Inc. 71,885 8,563HiltonWorldwideHoldings Inc. 76,165 8,474
* Live NationEntertainment Inc. 114,264 8,396
Advance Auto Parts Inc. 53,298 8,395VF Corp. 85,904 7,337Hasbro Inc. 76,898 7,193MGM ResortsInternational 224,393 7,071
Royal Caribbean CruisesLtd. 90,926 6,791
Aptiv plc 51,636 6,728* Liberty Media
Corp.-Liberty SiriusXMClass C 154,212 6,710
* Visteon Corp. 52,868 6,636* Take-Two Interactive
Software Inc. 30,974 6,436* JetBlue Airways Corp. 435,300 6,329* Burlington Stores Inc. 23,758 6,214
Interpublic Group of Cos.Inc. 259,529 6,104
* Norwegian Cruise LineHoldings Ltd. 234,147 5,954
Las Vegas Sands Corp. 99,438 5,927Hyatt Hotels Corp.Class A 77,726 5,771
* AutoNation Inc. 81,769 5,707* IAA Inc. 87,027 5,655* Discovery Inc. Class C 211,533 5,540* Carvana Co. Class A 23,076 5,528* Under Armour Inc.
Class C 365,732 5,442ViacomCBS Inc. Class B 142,313 5,303American AirlinesGroup Inc. 333,400 5,258
* Wayfair Inc. Class A 23,136 5,224Brinker International Inc. 88,019 4,979
* United AirlinesHoldings Inc. 114,917 4,970
* Mohawk Industries Inc. 32,130 4,529BorgWarner Inc. 115,872 4,477
* Bright Horizons FamilySolutions Inc. 25,671 4,441
Vail Resorts Inc. 15,867 4,426* Floor & Decor
Holdings Inc. Class A 47,227 4,385
Shares
MarketValue•
($000)
Best Buy Co. Inc. 43,631 4,354Toll Brothers Inc. 97,169 4,224
* AMC Networks Inc.Class A 113,435 4,058
* Liberty MediaCorp.-Liberty SiriusXMClass A 93,616 4,043
Sirius XM Holdings Inc. 614,472 3,914* Liberty Media
Corp.-Liberty FormulaOne Class C 90,972 3,875
Ford Motor Co. 439,632 3,864Lear Corp. 24,271 3,860Murphy USA Inc. 29,029 3,799Tractor Supply Co. 23,667 3,327
* Ulta Beauty Inc. 11,054 3,174Qurate Retail Inc.Class A 287,788 3,157
Omnicom Group Inc. 50,464 3,147* Etsy Inc. 16,913 3,009* Peloton Interactive Inc.
Class A 19,400 2,943Hanesbrands Inc. 201,094 2,932
* Five Below Inc. 16,637 2,911Wynn Resorts Ltd. 24,711 2,788
* Terminix GlobalHoldings Inc. 54,101 2,760
Ralph Lauren Corp.Class A 26,366 2,735
Pool Corp. 7,269 2,708News Corp. Class A 149,164 2,680Foot Locker Inc. 66,070 2,672
* LKQ Corp. 74,828 2,637* Planet Fitness Inc.
Class A 30,743 2,387Carnival Corp. 105,373 2,282Polaris Inc. 22,874 2,179
* Lyft Inc. Class A 43,861 2,155Harley-Davidson Inc. 53,991 1,981Domino's Pizza Inc. 5,111 1,960
* Mattel Inc. 111,801 1,951* Madison Square Garden
Sports Corp. 10,563 1,945* frontdoor Inc. 36,832 1,849* Liberty Media
Corp.-Liberty FormulaOne Class A 48,061 1,826
* Skechers U.S.A. Inc.Class A 50,066 1,799
Aramark 45,301 1,743* TripAdvisor Inc. 59,730 1,719
AMERCO 3,700 1,680Genuine Parts Co. 15,808 1,588
* Urban Outfitters Inc. 60,542 1,550* Discovery Inc. Class A 48,210 1,451
KAR AuctionServices Inc. 70,720 1,316
Tax-Managed Capital Appreciation Fund
86

Shares
MarketValue•
($000)
* Madison Square GardenEntertainment Corp. 11,299 1,187
* Grand CanyonEducation Inc. 11,186 1,042
Nordstrom Inc. 26,916 840JohnWiley & Sons Inc.Class A 17,354 792
Tiffany & Co. 5,492 722* Lions Gate
Entertainment Corp.Class B 62,992 654
Lennar Corp. Class B 10,425 638New York Times Co.Class A 10,912 565
* 2U Inc. 8,853 354Garmin Ltd. 2,897 347
* Under Armour Inc.Class A 19,750 339
* Airbnb Inc. Class A 1,720 252Service Corp.International 4,359 214
Thor Industries Inc. 2,150 200Wendy's Co. 7,938 174Nexstar MediaGroup Inc. Class A 1,169 128
Warner Music GroupCorp. Class A 1,414 54
Graham Holdings Co.Class B 1 1
2,409,940Consumer Staples (5.2%)
Procter & Gamble Co. 952,158 132,483Coca-Cola Co. 1,464,748 80,327PepsiCo Inc. 535,067 79,350Philip MorrisInternational Inc. 562,458 46,566
MondelezInternational Inc.Class A 613,781 35,888
Colgate-Palmolive Co. 383,803 32,819CVS Health Corp. 442,343 30,212
* Monster Beverage Corp. 298,547 27,610Constellation Brands Inc.Class A 83,261 18,238
McCormick & Co. Inc.(Non-Voting) 172,666 16,507
Altria Group Inc. 380,314 15,593Brown-Forman Corp.Class B 191,278 15,193
Church & Dwight Co.Inc. 172,528 15,050
Clorox Co. 72,758 14,691Kroger Co. 430,206 13,663Kimberly-Clark Corp. 97,965 13,209McKesson Corp. 71,832 12,493Hershey Co. 80,963 12,333
Shares
MarketValue•
($000)
Archer-Daniels-MidlandCo. 242,636 12,231
Corteva Inc. 299,039 11,579Walgreens BootsAlliance Inc. 274,260 10,937
AmerisourceBergenCorp. Class A 108,828 10,639
Tyson Foods Inc. Class A 163,958 10,565Hormel Foods Corp. 224,493 10,464General Mills Inc. 150,379 8,842Sysco Corp. 93,436 6,939J M Smucker Co. 51,896 5,999Campbell Soup Co. 103,441 5,001Ingredion Inc. 54,756 4,308Keurig Dr Pepper Inc. 121,099 3,875
* US Foods Holding Corp. 102,093 3,401Molson Coors BeverageCo. Class B 71,712 3,241
Kraft Heinz Co. 83,022 2,877* Post Holdings Inc. 25,230 2,548* Hain Celestial Group Inc. 62,113 2,494* Beyond Meat Inc. 18,411 2,301
Energizer Holdings Inc. 44,751 1,888LambWestonHoldings Inc. 23,087 1,818
Kellogg Co. 26,928 1,676Bunge Ltd. 20,905 1,371
* Herbalife Nutrition Ltd. 27,738 1,333Edgewell Personal CareCo. 22,863 791
Conagra Brands Inc. 13,899 504* Pilgrim's Pride Corp. 24,098 473
Casey's GeneralStores Inc. 1,891 338
* TreeHouse Foods Inc. 7,588 322* Grocery Outlet Holding
Corp. 6,987 274Brown-Forman Corp.Class A 2,600 191
Flowers Foods Inc. 8,141 184Spectrum BrandsHoldings Inc. 10 1
741,630Energy (2.1%)
Exxon Mobil Corp. 1,633,681 67,340Chevron Corp. 665,782 56,225ConocoPhillips 457,409 18,292Schlumberger NV 550,315 12,013Phillips 66 163,306 11,422Valero Energy Corp. 175,202 9,911EOG Resources Inc. 176,032 8,779Pioneer NaturalResources Co. 65,052 7,409
* Transocean Ltd. 3,013,163 6,960* WPX Energy Inc. 819,659 6,680
Halliburton Co. 347,020 6,559
Tax-Managed Capital Appreciation Fund
87

Shares
MarketValue•
($000)
Occidental PetroleumCorp. 332,618 5,758
Hess Corp. 108,797 5,743* Antero Resources Corp. 1,030,781 5,618
Williams Cos. Inc. 279,381 5,602* Cheniere Energy Inc. 91,545 5,495
Baker Hughes Co.Class A 260,058 5,422
Marathon PetroleumCorp. 125,738 5,201
* First Solar Inc. 45,956 4,546DiamondbackEnergy Inc. 92,292 4,467
Concho Resources Inc. 66,922 3,905Cabot Oil & Gas Corp. 209,282 3,407
* Range Resources Corp. 489,375 3,279National OilwellVarco Inc. 212,970 2,924
* Enphase Energy Inc. 16,400 2,878EQT Corp. 224,460 2,853Targa Resources Corp. 89,415 2,359Apache Corp. 149,548 2,122
* ChampionX Corp. 137,859 2,109* SolarEdge
Technologies Inc. 6,500 2,074Patterson-UTI Energy Inc. 331,355 1,743Parsley Energy Inc.Class A 116,188 1,650
Cimarex Energy Co. 39,650 1,487Marathon Oil Corp. 220,746 1,472ContinentalResources Inc. 86,664 1,413
Devon Energy Corp. 87,270 1,380HollyFrontier Corp. 30,826 797ONEOK Inc. 20,529 788
* Centennial ResourceDevelopment Inc.Class A 514,904 772
Antero Midstream Corp. 96,216 742Equitrans MidstreamCorp. 61,755 496
300,092Financials (10.3%)* Berkshire Hathaway Inc.
Class B 745,275 172,807JPMorgan Chase & Co. 1,202,373 152,785Bank of America Corp. 3,186,741 96,590Morgan Stanley 844,604 57,881Citigroup Inc. 826,483 50,961S&P Global Inc. 126,526 41,593MSCI Inc. Class A 89,792 40,095Goldman SachsGroup Inc. 137,848 36,352
Wells Fargo & Co. 1,142,746 34,488Charles Schwab Corp. 633,197 33,585
Shares
MarketValue•
($000)
IntercontinentalExchange Inc. 258,215 29,770
Aon plc Class A 129,905 27,445Progressive Corp. 276,677 27,358BlackRock Inc. 37,553 27,096Moody's Corp. 79,453 23,060CME Group Inc. 109,179 19,876US Bancorp 404,442 18,843PNC Financial ServicesGroup Inc. 122,468 18,248
Marsh & McLennan Cos.Inc. 151,096 17,678
Discover FinancialServices 192,833 17,457
Truist Financial Corp. 349,960 16,774Ameriprise Financial Inc. 84,696 16,459Brown & Brown Inc. 339,907 16,115Chubb Ltd. 103,207 15,886First Republic Bank 104,915 15,415Aflac Inc. 336,336 14,956Nasdaq Inc. 108,085 14,347T. Rowe Price Group Inc. 94,267 14,271Travelers Cos. Inc. 100,507 14,108Allstate Corp. 115,698 12,719State Street Corp. 161,007 11,718Prudential Financial Inc. 148,776 11,615
* Arch Capital Group Ltd. 303,636 10,952W R Berkley Corp. 163,287 10,845Assurant Inc. 78,002 10,625Globe Life Inc. 102,754 9,757
* Markel Corp. 9,152 9,457CommerceBancshares Inc. 143,269 9,413
* Texas CapitalBancshares Inc. 151,742 9,029
Fifth Third Bancorp 324,179 8,938Broadridge FinancialSolutions Inc. 57,899 8,870
* SVB Financial Group 22,411 8,692MetLife Inc. 184,637 8,669Popular Inc. 153,360 8,637Raymond JamesFinancial Inc. 89,742 8,586
SLM Corp. 676,250 8,379MFA Financial Inc. 2,009,395 7,816Zions Bancorp NA 173,074 7,518Alleghany Corp. 12,001 7,245Lincoln National Corp. 142,402 7,164Bank of New York MellonCorp. 167,334 7,102
SEI Investments Co. 123,446 7,094KeyCorp 427,062 7,008Reinsurance Group ofAmerica Inc. 59,891 6,941
EastWest Bancorp Inc. 134,347 6,813
Tax-Managed Capital Appreciation Fund
88

Shares
MarketValue•
($000)
American InternationalGroup Inc. 171,026 6,475
IHS Markit Ltd. 72,004 6,468White MountainsInsurance Group Ltd. 6,215 6,219
OneMain Holdings Inc. 127,257 6,129M&T Bank Corp. 46,002 5,856Eaton Vance Corp. 85,976 5,840Hanover InsuranceGroup Inc. 49,487 5,786
Principal FinancialGroup Inc. 113,203 5,616
Signature Bank 38,591 5,221Willis TowersWatson plc 23,242 4,897Loews Corp. 106,017 4,773New ResidentialInvestment Corp. 438,693 4,361
Cullen/Frost Bankers Inc. 47,275 4,124Hartford FinancialServices Group Inc. 77,281 3,785
* Athene Holding Ltd.Class A 87,204 3,762
Wintrust Financial Corp. 61,293 3,744CIT Group Inc. 99,556 3,574Interactive BrokersGroup Inc. Class A 54,320 3,309
Two Harbors InvestmentCorp. 512,367 3,264
Voya Financial Inc. 49,756 2,926American FinancialGroup Inc. 32,116 2,814
Northern Trust Corp. 28,975 2,699BOK Financial Corp. 38,470 2,634MGIC Investment Corp. 200,841 2,521CNA Financial Corp. 61,718 2,404Jefferies FinancialGroup Inc. 94,994 2,337
Starwood PropertyTrust Inc. 110,744 2,137
Pinnacle FinancialPartners Inc. 29,247 1,883
Ally Financial Inc. 52,542 1,874First Horizon Corp. 138,758 1,770Chimera InvestmentCorp. 172,128 1,764
Arthur J Gallagher & Co. 11,257 1,393Sterling Bancorp 76,528 1,376
* BrighthouseFinancial Inc. 36,791 1,332
Western AllianceBancorp 22,046 1,322
Bank of Hawaii Corp. 15,647 1,199Fidelity NationalFinancial Inc. 29,371 1,148
TFS Financial Corp. 59,947 1,057Associated Banc-Corp 60,223 1,027Lazard Ltd. Class A 18,454 781
Shares
MarketValue•
($000)
* Credit Acceptance Corp. 2,050 710Santander ConsumerUSA Holdings Inc. 30,462 671
* Rocket Cos. Inc. Class A 33,000 667* Lemonade Inc. 4,300 527
New York CommunityBancorp Inc. 49,670 524
MarketAxessHoldings Inc. 871 497
Morningstar Inc. 1,993 461FactSet ResearchSystems Inc. 1,172 390
Kemper Corp. 3,979 306Affiliated ManagersGroup Inc. 2,736 278
Navient Corp. 24,311 239Primerica Inc. 877 117First CitizensBancShares Inc.Class A 100 57
Erie Indemnity Co.Class A 166 41
1,450,987Health Care (12.8%)
Johnson & Johnson 1,054,235 165,916UnitedHealth Group Inc. 364,357 127,773Merck & Co. Inc. 982,523 80,370Pfizer Inc. 2,122,285 78,121Thermo FisherScientific Inc. 155,049 72,219
Abbott Laboratories 643,664 70,475AbbVie Inc. 635,184 68,060Bristol-Myers Squibb Co. 918,374 56,967Amgen Inc. 244,879 56,303Medtronic plc 479,846 56,209Danaher Corp. 234,546 52,102Eli Lilly & Co. 304,769 51,457Zoetis Inc. 254,386 42,101Cigna Corp. 174,369 36,300Anthem Inc. 105,426 33,851
* Intuitive Surgical Inc. 40,605 33,219Becton Dickinson & Co. 127,458 31,893Stryker Corp. 115,763 28,367Humana Inc. 66,624 27,334
* VertexPharmaceuticals Inc. 114,915 27,159
* Boston Scientific Corp. 752,501 27,052Gilead Sciences Inc. 461,939 26,913Agilent Technologies Inc. 207,812 24,624
* Charles RiverLaboratoriesInternational Inc. 75,470 18,857
* Illumina Inc. 48,292 17,868* Edwards Lifesciences
Corp. 195,834 17,866Teleflex Inc. 42,189 17,364
Tax-Managed Capital Appreciation Fund
89

Shares
MarketValue•
($000)
* Biogen Inc. 70,383 17,234* Regeneron
Pharmaceuticals Inc. 34,720 16,774Cooper Cos. Inc. 45,386 16,490PerkinElmer Inc. 107,266 15,393Zimmer BiometHoldings Inc. 99,842 15,385
HCA Healthcare Inc. 93,286 15,342* Laboratory Corp. of
America Holdings 71,685 14,591Baxter International Inc. 179,475 14,401Bio-Techne Corp. 44,945 14,272
* DexCom Inc. 35,827 13,246* Moderna Inc. 121,626 12,706* IDEXX Laboratories Inc. 24,812 12,403* QIAGEN NV 227,726 12,035* Seagen Inc. 67,982 11,906* IQVIA Holdings Inc. 66,306 11,880* Align Technology Inc. 21,036 11,241* Centene Corp. 174,963 10,503* Veeva Systems Inc.
Class A 37,867 10,309Universal HealthServices Inc. Class B 69,799 9,597
Bruker Corp. 162,910 8,818Quest Diagnostics Inc. 73,465 8,755
* Varian MedicalSystems Inc. 47,186 8,258
* Incyte Corp. 94,863 8,251* Henry Schein Inc. 123,189 8,236* Bio-Rad Laboratories Inc.
Class A 13,813 8,052ResMed Inc. 37,271 7,922Cardinal Health Inc. 146,440 7,843
* AlexionPharmaceuticals Inc. 49,101 7,672
* Teladoc Health Inc. 36,226 7,244* Hologic Inc. 97,853 7,127* Exelixis Inc. 353,309 7,091
Cerner Corp. 89,396 7,016* Alnylam
Pharmaceuticals Inc. 53,959 7,013* Viatris Inc. 371,002 6,953* Catalent Inc. 56,383 5,868
DENTSPLY SIRONA Inc. 110,655 5,794* Novocure Ltd. 31,069 5,376* Ionis
Pharmaceuticals Inc. 90,509 5,117* DaVita Inc. 40,030 4,700
STERIS plc 20,974 3,975* SageTherapeutics Inc. 44,900 3,884* BioMarin
Pharmaceutical Inc. 43,646 3,827West PharmaceuticalServices Inc. 12,440 3,524
* Insulet Corp. 12,068 3,085
Shares
MarketValue•
($000)
* Masimo Corp. 11,382 3,055* Molina Healthcare Inc. 14,204 3,021* Exact Sciences Corp. 22,681 3,005* HorizonTherapeutics plc 35,313 2,583* Neurocrine
Biosciences Inc. 26,196 2,511Cantel Medical Corp. 28,876 2,277
* Acadia Healthcare Co.Inc. 43,965 2,210
* Penumbra Inc. 11,973 2,095* Envista Holdings Corp. 57,545 1,941* Repligen Corp. 10,100 1,935* MEDNAX Inc. 78,243 1,920* UnitedTherapeutics
Corp. 12,486 1,895* Integra LifeSciences
Holdings Corp. 28,188 1,830* Jazz Pharmaceuticals plc 10,251 1,692
Hill-Rom Holdings Inc. 14,895 1,459* Elanco Animal
Health Inc. 46,390 1,423* PRA Health
Sciences Inc. 7,939 996* Brookdale Senior
Living Inc. 212,574 942Chemed Corp. 1,705 908
* Guardant Health Inc. 6,968 898* Quidel Corp. 4,800 862* Avantor Inc. 29,947 843
Premier Inc. Class A 23,021 808* ICU Medical Inc. 3,463 743* ABIOMED Inc. 1,539 499* Adaptive Biotechnologies
Corp. 7,594 449Encompass Health Corp. 4,425 366
* Alkermes plc 10,236 204* Varex Imaging Corp. 10,568 176
Perrigo Co. plc 3,816 171* Sarepta Therapeutics Inc. 940 160* GoodRx Holdings Inc.
Class A 303 12
1,807,738Industrials (14.2%)
Visa Inc. Class A 652,984 142,827Mastercard Inc. Class A 349,780 124,850
* PayPal Holdings Inc. 522,612 122,396Accenture plc Class A 237,433 62,020Union Pacific Corp. 268,758 55,961Global Payments Inc. 240,244 51,753Boeing Co. 220,687 47,240HoneywellInternational Inc. 205,312 43,670
United ParcelService Inc. Class B 231,441 38,975
* Fiserv Inc. 322,884 36,764General Electric Co. 3,388,827 36,599
Tax-Managed Capital Appreciation Fund
90

Shares
MarketValue•
($000)
Fidelity NationalInformationServices Inc. 244,418 34,575
American Express Co. 278,851 33,7163M Co. 192,197 33,594RaytheonTechnologiesCorp. 467,597 33,438
Sherwin-Williams Co. 43,850 32,226CSX Corp. 354,891 32,206Caterpillar Inc. 176,137 32,060
* Mettler-ToledoInternational Inc. 26,317 29,993
Norfolk Southern Corp. 124,683 29,626Verisk Analytics Inc.Class A 139,675 28,995
FedEx Corp. 110,809 28,768Illinois ToolWorks Inc. 140,698 28,686
* Square Inc. Class A 128,422 27,950Cintas Corp. 75,609 26,725
* TransDigm Group Inc. 42,034 26,013Old Dominion FreightLine Inc. 124,615 24,322
Deere & Co. 83,352 22,426Northrop GrummanCorp. 73,450 22,382
Automatic DataProcessing Inc. 119,374 21,034
Ball Corp. 221,978 20,684Lockheed Martin Corp. 57,607 20,449AMETEK Inc. 153,098 18,516Parker-Hannifin Corp. 67,177 18,300General Dynamics Corp. 114,543 17,046
* KeysightTechnologies Inc. 127,690 16,867
Eaton Corp. plc 132,269 15,891* Waters Corp. 64,206 15,886
IDEX Corp. 78,733 15,684* Zebra Technologies Corp.
Class A 40,590 15,600Jacobs EngineeringGroup Inc. 141,129 15,377
* Crown Holdings Inc. 142,855 14,314Equifax Inc. 74,207 14,310Martin MariettaMaterials Inc. 48,394 13,742
Vulcan Materials Co. 90,102 13,363Expeditors InternationalofWashington Inc. 139,607 13,278
Toro Co. 139,713 13,250Emerson Electric Co. 163,699 13,156PACCAR Inc. 146,055 12,602Cummins Inc. 52,527 11,929Capital One FinancialCorp. 119,995 11,861
Carrier Global Corp. 314,383 11,859DuPont de Nemours Inc. 164,198 11,676Lennox International Inc. 40,714 11,154
Shares
MarketValue•
($000)
AGCO Corp. 105,204 10,845JB Hunt TransportServices Inc. 78,704 10,755
OtisWorldwide Corp. 157,191 10,618Landstar System Inc. 78,365 10,553WW Grainger Inc. 24,754 10,108Carlisle Cos. Inc. 60,277 9,414Xylem Inc. 91,046 9,268Eagle Materials Inc. 88,370 8,956CoreLogic Inc. 115,740 8,949BWXTechnologies Inc. 143,634 8,658Synchrony Financial 241,273 8,375Fortive Corp. 117,845 8,346Jack Henry &Associates Inc. 51,040 8,268
Genpact Ltd. 193,618 8,008Owens Corning 104,712 7,933
* FleetCorTechnologies Inc. 28,478 7,770
Huntington IngallsIndustries Inc. 44,901 7,655
FLIR Systems Inc. 164,529 7,211Textron Inc. 148,787 7,191Graco Inc. 98,621 7,135Oshkosh Corp. 80,575 6,935ArmstrongWorldIndustries Inc. 90,528 6,734
Robert HalfInternational Inc. 91,824 5,737
Donaldson Co. Inc. 102,283 5,716Johnson ControlsInternational plc 119,676 5,576
ITT Inc. 68,646 5,287Westinghouse Air BrakeTechnologies Corp. 71,671 5,246
Stanley Black &Decker Inc. 29,193 5,213
PPG Industries Inc. 34,752 5,012Valmont Industries Inc. 27,975 4,894ManpowerGroup Inc. 54,157 4,884
* EuronetWorldwide Inc. 33,136 4,802Quanta Services Inc. 62,470 4,499TraneTechnologies plc 30,477 4,424Sealed Air Corp. 93,708 4,291RockwellAutomation Inc. 17,102 4,289
* Livent Corp. 226,166 4,261* Trimble Inc. 62,991 4,206* Teledyne
Technologies Inc. 10,446 4,095* Bill.com Holdings Inc. 29,000 3,958
HEICO Corp. 28,866 3,822Packaging Corp. ofAmerica 27,444 3,785
Paychex Inc. 40,000 3,727CH RobinsonWorldwide Inc. 39,317 3,691
Tax-Managed Capital Appreciation Fund
91

Shares
MarketValue•
($000)
MSC Industrial DirectCo. Inc. Class A 41,610 3,511
* Virgin GalacticHoldings Inc. 146,500 3,476
* StoneCo Ltd. Class A 39,800 3,340Flowserve Corp. 87,321 3,218Howmet Aerospace Inc. 108,682 3,102
* ResideoTechnologies Inc. 142,255 3,024
AllisonTransmissionHoldings Inc. 62,972 2,716
* WESCOInternational Inc. 30,666 2,407
Cognex Corp. 27,531 2,210MDU ResourcesGroup Inc. 80,095 2,110
* AECOM 42,191 2,100* Berry Global Group Inc. 35,739 2,008* WEX Inc. 8,803 1,792
TransUnion 17,546 1,741* Axalta Coating Systems
Ltd. 58,104 1,659* Sensata Technologies
Holding plc 31,461 1,659Spirit AeroSystemsHoldings Inc. Class A 41,506 1,622
Allegion plc 13,639 1,587* Vontier Corp. 47,138 1,574
O-I Glass Inc. 127,791 1,521* Coherent Inc. 9,143 1,372* Fair Isaac Corp. 2,573 1,315* Ingersoll Rand Inc. 26,893 1,225
MKS Instruments Inc. 5,395 812Booz Allen HamiltonHolding Corp. Class A 8,520 743
* Pluralsight Inc. Class A 33,207 696RPM International Inc. 5,251 477Littelfuse Inc. 1,596 406AptarGroup Inc. 2,836 388Silgan Holdings Inc. 10,388 385
* Paylocity Holding Corp. 1,635 337Brunswick Corp. 3,484 266Sonoco Products Co. 2,414 143
* Middleby Corp. 198 26
2,014,652Other (0.0%)*,1 American International
Group Inc.WarrantsExp. 1/19/2021 6,859 —
Real Estate (3.1%)AmericanTower Corp. 191,001 42,872SBA CommunicationsCorp. Class A 108,028 30,478
Prologis Inc. 291,452 29,046Crown CastleInternational Corp. 164,871 26,246
Shares
MarketValue•
($000)
Equinix Inc. 35,362 25,255* CBRE Group Inc. Class A 273,143 17,132* CoStar Group Inc. 18,223 16,843
Digital Realty Trust Inc. 110,688 15,442Public Storage 59,763 13,801Equity LifeStyleProperties Inc. 191,794 12,152
American Homes 4 RentClass A 341,378 10,241
Weyerhaeuser Co. 295,383 9,904Alexandria Real EstateEquities Inc. 52,941 9,435
Extra Space Storage Inc. 80,139 9,285AvalonBayCommunities Inc. 55,765 8,946
Equity Residential 145,906 8,649* Zillow Group Inc. Class C 65,681 8,525
Essex Property Trust Inc. 34,528 8,198Mid-America ApartmentCommunities Inc. 64,098 8,121
* Jones Lang LaSalle Inc. 49,345 7,321Simon PropertyGroup Inc. 84,491 7,205
Invitation Homes Inc. 221,589 6,581Sun Communities Inc. 41,814 6,354Duke Realty Corp. 145,639 5,821
* Howard Hughes Corp. 69,984 5,524* Zillow Group Inc. Class A 40,603 5,520
Douglas Emmett Inc. 159,344 4,650UDR Inc. 116,035 4,459Camden Property Trust 41,323 4,129Lamar Advertising Co.Class A 49,553 4,124
Host Hotels &Resorts Inc. 279,419 4,088
* Apartment Income REITCorp. 104,262 4,005
Realty Income Corp. 60,940 3,789CyrusOne Inc. 47,552 3,478Americold Realty Trust 80,428 3,002Welltower Inc. 45,845 2,962CubeSmart 76,313 2,565VEREIT Inc. 67,259 2,542STORE Capital Corp. 74,155 2,520Rexford IndustrialRealty Inc. 48,775 2,395
* RealPage Inc. 26,577 2,319Life Storage Inc. 19,094 2,280Ventas Inc. 44,433 2,179First Industrial RealtyTrust Inc. 50,561 2,130
Empire State RealtyTrust Inc. Class A 228,476 2,129
CoreSite Realty Corp. 15,875 1,989Cousins Properties Inc. 58,449 1,958Kimco Realty Corp. 115,366 1,732
Tax-Managed Capital Appreciation Fund
92

Shares
MarketValue•
($000)
American CampusCommunities Inc. 37,690 1,612
Park Hotels &Resorts Inc. 92,830 1,592
Rayonier Inc. 52,081 1,530Hudson PacificProperties Inc. 62,320 1,497
Kilroy Realty Corp. 24,308 1,395Outfront Media Inc. 56,792 1,111Apple HospitalityREIT Inc. 82,797 1,069
Weingarten RealtyInvestors 47,877 1,037
EPR Properties 29,242 950VICI Properties Inc. 32,219 822Iron Mountain Inc. 23,460 692Federal RealtyInvestment Trust 8,082 688
Paramount Group Inc. 75,062 679Corporate OfficeProperties Trust 17,300 451
SL Green Realty Corp. 6,470 385Apartment Investment &Management Co.Class A 1 —
435,831Technology (27.4%)
Apple Inc. 6,595,422 875,147Microsoft Corp. 2,978,070 662,382
* Facebook Inc. Class A 953,491 260,456* Alphabet Inc. Class A 119,418 209,297* Alphabet Inc. Class C 115,669 202,638
NVIDIA Corp. 239,682 125,162* Adobe Inc. 205,882 102,966
Intel Corp. 1,600,152 79,720* salesforce.com Inc. 357,633 79,584
QUALCOMM Inc. 463,222 70,567Texas Instruments Inc. 364,394 59,808Broadcom Inc. 135,881 59,495Oracle Corp. 747,334 48,345Intuit Inc. 126,429 48,024Applied Materials Inc. 533,823 46,069Lam Research Corp. 96,753 45,694
* Cadence DesignSystems Inc. 319,022 43,524
* Autodesk Inc. 137,631 42,024* Advanced Micro
Devices Inc. 432,954 39,706* Synopsys Inc. 152,426 39,515* ServiceNow Inc. 69,715 38,373
International BusinessMachines Corp. 266,290 33,521
* MicronTechnology Inc. 425,885 32,018Teradyne Inc. 262,921 31,522KLA Corp. 97,261 25,182Roper Technologies Inc. 54,880 23,658
Shares
MarketValue•
($000)
* Match Group Inc. 155,145 23,456Amphenol Corp. Class A 175,784 22,987
* Zoom VideoCommunications Inc.Class A 62,300 21,015
Cognizant TechnologySolutions Corp. Class A 246,738 20,220
Analog Devices Inc. 135,294 19,987Corning Inc. 448,584 16,149
* Twilio Inc. Class A 43,659 14,779* Fortinet Inc. 90,195 13,397* Twitter Inc. 245,298 13,283* Workday Inc. Class A 54,903 13,155* Atlassian Corp. plc
Class A 55,455 12,969Xilinx Inc. 89,071 12,628
* Palo Alto Networks Inc. 33,244 11,815* DocuSign Inc. Class A 52,897 11,759* ANSYS Inc. 30,794 11,203
Citrix Systems Inc. 82,541 10,739* Arrow Electronics Inc. 106,274 10,340
HP Inc. 409,070 10,059* VeriSign Inc. 44,478 9,625* Black Knight Inc. 108,710 9,605
NetApp Inc. 137,603 9,115MicrochipTechnology Inc. 63,884 8,823
* CrowdstrikeHoldings Inc. Class A 41,498 8,790
* IAC/InterActiveCorp 45,781 8,669Hewlett PackardEnterprise Co. 711,355 8,430
Marvell TechnologyGroup Ltd. 166,294 7,906
* Pinterest Inc. Class A 119,700 7,888* Gartner Inc. 49,072 7,861* RingCentral Inc. Class A 20,650 7,826* Okta Inc. 30,391 7,727
SS&CTechnologiesHoldings Inc. 101,768 7,404
* Splunk Inc. 37,404 6,355* Qorvo Inc. 37,483 6,232* Guidewire Software Inc. 47,991 6,178* Nuance
Communications Inc. 139,537 6,152* GoDaddy Inc. Class A 73,840 6,125
Western Digital Corp. 106,868 5,919* Dell Technologies Inc.
Class C 77,738 5,697NortonLifeLock Inc. 266,482 5,537
* Coupa Software Inc. 15,414 5,224Maxim IntegratedProducts Inc. 56,459 5,005
Skyworks Solutions Inc. 32,649 4,991* Paycom Software Inc. 9,641 4,360* ON Semiconductor Corp. 132,764 4,345
Tax-Managed Capital Appreciation Fund
93

Shares
MarketValue•
($000)
* Zendesk Inc. 29,758 4,259* Slack Technologies Inc.
Class A 99,100 4,186* NCR Corp. 107,900 4,054* VMware Inc. Class A 27,456 3,851* Tyler Technologies Inc. 8,729 3,810* PTC Inc. 31,366 3,752
Avnet Inc. 105,416 3,701* Manhattan
Associates Inc. 33,339 3,507Universal Display Corp. 15,011 3,450
* EPAM Systems Inc. 8,604 3,083* Akamai Technologies Inc. 28,114 2,952* Fastly Inc. Class A 33,300 2,909* Ceridian HCM
Holding Inc. 27,055 2,883* MongoDB Inc. 7,865 2,824* Alteryx Inc. Class A 22,246 2,709
Leidos Holdings Inc. 24,871 2,614CDW Corp. 19,425 2,560
* HubSpot Inc. 6,425 2,547CDK Global Inc. 48,394 2,508
* FireEye Inc. 108,421 2,500* Cerence Inc. 24,199 2,431* Grubhub Inc. 27,361 2,032* Datadog Inc. Class A 20,599 2,028* IPG Photonics Corp. 8,932 1,999
DXCTechnology Co. 74,093 1,908* Arista Networks Inc. 6,087 1,769
Monolithic PowerSystems Inc. 4,730 1,732
Perspecta Inc. 71,796 1,729* Avalara Inc. 9,649 1,591
Xerox Holdings Corp. 63,021 1,461* Change Healthcare Inc. 75,615 1,410* Proofpoint Inc. 9,697 1,323* Pure Storage Inc. Class A 58,388 1,320* Covetrus Inc. 41,807 1,202* Nutanix Inc. Class A 36,620 1,167* Teradata Corp. 49,671 1,116* CACI International Inc.
Class A 4,244 1,058* Zscaler Inc. 4,355 870
Amdocs Ltd. 11,856 841* AspenTechnology Inc. 4,300 560* F5 Networks Inc. 3,138 552* Elastic NV 3,124 456* Dynatrace Inc. 9,146 396
Entegris Inc. 4,076 392Pegasystems Inc. 2,595 346
* Smartsheet Inc. Class A 4,621 320* Dropbox Inc. Class A 11,393 253* Palantir Technologies Inc.
Class A 3,398 80* Snowflake Inc. Class A 246 69* Unity Software Inc. 333 51
Shares
MarketValue•
($000)
* ZoomInfoTechnologies Inc.Class A 593 29
* DoorDash Inc. Class A 206 29
3,873,305Telecommunications (3.3%)
VerizonCommunications Inc. 1,607,909 94,465
Comcast Corp. Class A 1,684,374 88,261Cisco Systems Inc. 1,631,686 73,018AT&T Inc. 2,533,965 72,877
* T-Mobile US Inc. 292,807 39,485* Charter
Communications Inc.Class A 52,799 34,929
L3HarrisTechnologies Inc. 84,964 16,060
* Roku Inc. 40,709 13,516* Liberty Broadband Corp.
Class C 70,146 11,109Motorola Solutions Inc. 42,782 7,276Juniper Networks Inc. 273,671 6,160
* Liberty Broadband Corp.Class A 20,734 3,267
* DISH Network Corp.Class A 78,701 2,545
* CommScope Holding Co.Inc. 153,970 2,063
* Ciena Corp. 36,136 1,910Cable One Inc. 819 1,825
* Altice USA Inc. Class A 32,075 1,215* United States Cellular
Corp. 27,060 830
470,811Utilities (2.7%)
NextEra Energy Inc. 750,784 57,923Duke Energy Corp. 308,844 28,278Dominion Energy Inc. 323,987 24,364Southern Co. 338,442 20,791AmericanWaterWorksCo. Inc. 124,293 19,075
WEC Energy Group Inc. 199,699 18,378Waste Management Inc. 149,550 17,636Exelon Corp. 386,434 16,315Eversource Energy 183,279 15,855Sempra Energy 124,369 15,846CMS Energy Corp. 211,659 12,913American Electric PowerCo. Inc. 135,702 11,300
DTE Energy Co. 81,571 9,904Consolidated Edison Inc. 133,006 9,612Essential Utilities Inc. 193,616 9,156AES Corp. 388,888 9,139Public Service EnterpriseGroup Inc. 151,363 8,824
Edison International 139,688 8,775
Tax-Managed Capital Appreciation Fund
94

Shares
MarketValue•
($000)
Xcel Energy Inc. 128,690 8,580Atmos Energy Corp. 77,734 7,418FirstEnergy Corp. 215,147 6,586NiSource Inc. 276,272 6,338Alliant Energy Corp. 91,615 4,721CenterPoint Energy Inc. 213,200 4,614Ameren Corp. 58,997 4,605Entergy Corp. 43,027 4,296
* PG&E Corp. 341,179 4,251Evergy Inc. 67,360 3,739NRG Energy Inc. 98,641 3,704PPL Corp. 122,981 3,468Republic Services Inc.Class A 31,721 3,055
UGI Corp. 82,918 2,899* Stericycle Inc. 40,057 2,777* Clean Harbors Inc. 20,375 1,551
National Fuel Gas Co. 9,448 389
387,075
Total Common Stocks(Cost $4,667,470) 14,149,931
Preferred Stocks (0.0%)
Qurate Retail Inc. Pfd.,8.000%, 9/15/25(Cost $373) 8,633 855
Shares
MarketValue•
($000)
Temporary Cash Investments (0.0%)
Money Market Fund (0.0%)2 Vanguard Market
Liquidity Fund, 0.111%(Cost$7,413) 74,132 7,413
Total Investments (99.9%)(Cost $4,675,256) 14,158,199
Other Assets andLiabilities—Net (0.1%) 11,632
Net Assets (100%) 14,169,831
Cost is in $000.• See Note A in Notes to Financial Statements.* Non-income-producing security.1 Security value determined using significant unobservableinputs.
2 Affiliated money market fund available only to Vanguard fundsand certain trusts and accounts managed by Vanguard. Rateshown is the 7-day yield.REIT—Real Estate Investment Trust.
Derivative Financial Instruments Outstanding as of Period End
Futures Contracts
($000)
Expiration
Number ofLong (Short)Contracts
NotionalAmount
Value andUnrealized
Appreciation(Depreciation)
Long Futures Contracts
E-mini S&P 500 Index March 2021 86 16,120 250
See accompanying Notes, which are an integral part of the Financial Statements.
Tax-Managed Capital Appreciation Fund
95

($000s, except shares and per-share amounts) Amount
Assets
Investments in Securities, at Value
Unaffiliated Issuers (Cost $4,667,843) 14,150,786
Affiliated Issuers (Cost $7,413) 7,413
Total Investments in Securities 14,158,199
Investment in Vanguard 535
Cash Collateral Pledged—Futures Contracts 947
Receivables for Accrued Income 8,828
Receivables for Capital Shares Issued 13,069
Variation Margin Receivable—Futures Contracts 106
Total Assets 14,181,684
Liabilities
Due to Custodian 5
Payables for Investment Securities Purchased 4
Payables for Capital Shares Redeemed 11,184
Payables to Vanguard 660
Total Liabilities 11,853
Net Assets 14,169,831
At December 31, 2020, net assets consisted of:
Paid-in Capital 4,990,796
Total Distributable Earnings (Loss) 9,179,035
Net Assets 14,169,831
Admiral Shares—Net Assets
Applicable to 63,466,964 outstanding $.001 par value shares ofbeneficial interest (unlimited authorization) 12,542,852
Net Asset Value Per Share—Admiral Shares $197.63
Institutional Shares—Net Assets
Applicable to 16,569,820 outstanding $.001 par value shares ofbeneficial interest (unlimited authorization) 1,626,979
Net Asset Value Per Share—Institutional Shares $98.19
See accompanying Notes, which are an integral part of the Financial Statements.
Tax-Managed Capital Appreciation Fund
Statement of Assets and LiabilitiesAs of December 31, 2020
96

Year EndedDecember 31, 2020
($000)
Investment Income
Income
Dividends 200,715
Interest1 113
Total Income 200,828
Expenses
The Vanguard Group—Note B
Investment Advisory Services 1,718
Management and Administrative—Admiral Shares 7,587
Management and Administrative—Institutional Shares 527
Marketing and Distribution—Admiral Shares 388
Marketing and Distribution—Institutional Shares 15
Custodian Fees 30
Auditing Fees 32
Shareholders’ Reports—Admiral Shares 31
Shareholders’ Reports—Institutional Shares —
Trustees’ Fees and Expenses 7
Total Expenses 10,335
Net Investment Income 190,493
Realized Net Gain (Loss)
Investment Securities Sold1,2 (77,163)
Futures Contracts (4,834)
Realized Net Gain (Loss) (81,997)
Change in Unrealized Appreciation (Depreciation)
Investment Securities1 2,310,978
Futures Contracts 194
Change in Unrealized Appreciation (Depreciation) 2,311,172
Net Increase (Decrease) in Net Assets Resulting from Operations 2,419,668
1 Interest income, realized net gain (loss), and change in unrealized appreciation (depreciation) from an affiliated company of the fundwere $105,000, ($19,000), and $1,000, respectively. Purchases and sales are for temporary cash investment purposes.
2 Includes $99,627,000 of net gain (loss) resulting from in-kind redemptions.
See accompanying Notes, which are an integral part of the Financial Statements.
Tax-Managed Capital Appreciation Fund
Statement of Operations
97

Year Ended December 31,
2020($000)
2019($000)
Increase (Decrease) in Net Assets
Operations
Net Investment Income 190,493 179,926
Realized Net Gain (Loss) (81,997) 95,096
Change in Unrealized Appreciation (Depreciation) 2,311,172 2,539,490
Net Increase (Decrease) in Net Assets Resulting from Operations 2,419,668 2,814,512
Distributions1
Admiral Shares (166,755) (158,601)
Institutional Shares (19,301) (19,010)
Total Distributions (186,056) (177,611)
Capital Share Transactions
Admiral Shares (56,921) 269,997
Institutional Shares 190,473 (7,534)
Net Increase (Decrease) from Capital Share Transactions 133,552 262,463
Total Increase (Decrease) 2,367,164 2,899,364
Net Assets
Beginning of Period 11,802,667 8,903,303
End of Period 14,169,831 11,802,667
1 Certain prior-period numbers have been reclassified to conform with the current-period presentation.
See accompanying Notes, which are an integral part of the Financial Statements.
Tax-Managed Capital Appreciation Fund
Statement of Changes in Net Assets
98
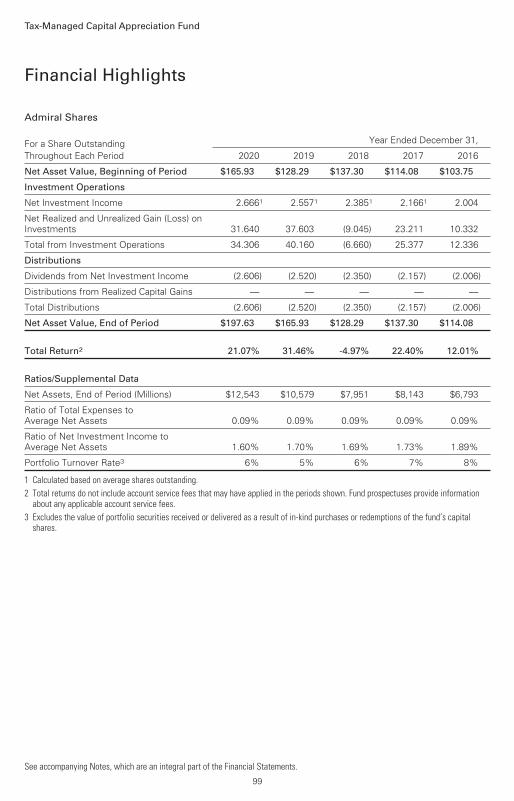
Admiral Shares
For a Share OutstandingThroughout Each Period
Year Ended December 31,
2020 2019 2018 2017 2016
Net Asset Value, Beginning of Period $165.93 $128.29 $137.30 $114.08 $103.75
Investment Operations
Net Investment Income 2.6661 2.5571 2.3851 2.1661 2.004
Net Realized and Unrealized Gain (Loss) onInvestments 31.640 37.603 (9.045) 23.211 10.332
Total from Investment Operations 34.306 40.160 (6.660) 25.377 12.336
Distributions
Dividends from Net Investment Income (2.606) (2.520) (2.350) (2.157) (2.006)
Distributions from Realized Capital Gains — — — — —
Total Distributions (2.606) (2.520) (2.350) (2.157) (2.006)
Net Asset Value, End of Period $197.63 $165.93 $128.29 $137.30 $114.08
Total Return2 21.07% 31.46% -4.97% 22.40% 12.01%
Ratios/Supplemental Data
Net Assets, End of Period (Millions) $12,543 $10,579 $7,951 $8,143 $6,793
Ratio of Total Expenses toAverage Net Assets 0.09% 0.09% 0.09% 0.09% 0.09%
Ratio of Net Investment Income toAverage Net Assets 1.60% 1.70% 1.69% 1.73% 1.89%
Portfolio Turnover Rate3 6% 5% 6% 7% 8%
1 Calculated based on average shares outstanding.2 Total returns do not include account service fees that may have applied in the periods shown. Fund prospectuses provide information
about any applicable account service fees.3 Excludes the value of portfolio securities received or delivered as a result of in-kind purchases or redemptions of the fund’s capital
shares.
Tax-Managed Capital Appreciation Fund
Financial Highlights
See accompanying Notes, which are an integral part of the Financial Statements.
99

Institutional Shares
For a Share OutstandingThroughout Each Period
Year Ended December 31,
2020 2019 2018 2017 2016
Net Asset Value, Beginning of Period $82.46 $63.75 $68.23 $56.69 $51.55
Investment Operations
Net Investment Income 1.3601 1.2921 1.2071 1.0991 1.011
Net Realized and Unrealized Gain (Loss) onInvestments 15.690 18.693 (4.499) 11.531 5.141
Total from Investment Operations 17.050 19.985 (3.292) 12.630 6.152
Distributions
Dividends from Net Investment Income (1.320) (1.275) (1.188) (1.090) (1.012)
Distributions from Realized Capital Gains — — — — —
Total Distributions (1.320) (1.275) (1.188) (1.090) (1.012)
Net Asset Value, End of Period $98.19 $82.46 $63.75 $68.23 $56.69
Total Return 21.08% 31.51% -4.95% 22.43% 12.06%
Ratios/Supplemental Data
Net Assets, End of Period (Millions) $1,627 $1,223 $952 $1,006 $613
Ratio of Total Expenses to Average Net Assets 0.06% 0.06% 0.06% 0.06% 0.06%
Ratio of Net Investment Income toAverage Net Assets 1.63% 1.73% 1.72% 1.76% 1.92%
Portfolio Turnover Rate2 6% 5% 6% 7% 8%
1 Calculated based on average shares outstanding.2 Excludes the value of portfolio securities received or delivered as a result of in-kind purchases or redemptions of the fund’s capital
shares.
Tax-Managed Capital Appreciation Fund
Financial Highlights
See accompanying Notes, which are an integral part of the Financial Statements.
100
Vanguard Tax-Managed Capital Appreciation Fund is registered under the Investment Company Actof 1940 as an open-end investment company, or mutual fund. The fund offers two classes ofshares: Admiral Shares and Institutional Shares. Each of the share classes has different eligibilityand minimum purchase requirements, and is designed for different types of investors.
Market disruptions associated with the COVID-19 pandemic have had a global impact, anduncertainty exists as to the long-term implications. Such disruptions can adversely affect assets ofthe fund and thus fund performance.
A. The following significant accounting policies conform to generally accepted accountingprinciples for U.S. investment companies. The fund consistently follows such policies in preparingits financial statements.
1. Security Valuation: Securities are valued as of the close of trading on the New York StockExchange (generally 4 p.m., Eastern time) on the valuation date. Equity securities are valued at thelatest quoted sales prices or official closing prices taken from the primary market in which eachsecurity trades; such securities not traded on the valuation date are valued at the mean of thelatest quoted bid and asked prices. Securities for which market quotations are not readily available,or whose values have been materially affected by events occurring before the fund's pricing timebut after the close of the securities’ primary markets, are valued by methods deemed by the boardof trustees to represent fair value. Investments in Vanguard Market Liquidity Fund are valued atthat fund's net asset value. Temporary cash investments are valued using the latest bid prices orusing valuations based on a matrix system (which considers such factors as security prices, yields,maturities, and ratings), both as furnished by independent pricing services.
2. Futures Contracts: The fund uses index futures contracts to a limited extent, with the objectiveof maintaining full exposure to the stock market while maintaining liquidity. The fund may purchaseor sell futures contracts to achieve a desired level of investment, whether to accommodateportfolio turnover or cash flows from capital share transactions. The primary risks associated withthe use of futures contracts are imperfect correlation between changes in market values of stocksheld by the fund and the prices of futures contracts, and the possibility of an illiquid market.Counterparty risk involving futures is mitigated because a regulated clearinghouse is thecounterparty instead of the clearing broker. To further mitigate counterparty risk, the fund tradesfutures contracts on an exchange, monitors the financial strength of its clearing brokers andclearinghouse, and has entered into clearing agreements with its clearing brokers. Theclearinghouse imposes initial margin requirements to secure the fund’s performance and requiresdaily settlement of variation margin representing changes in the market value of each contract. Anysecurities pledged as initial margin for open contracts are noted in the Schedule of Investments.
Futures contracts are valued at their quoted daily settlement prices. The notional amounts of thecontracts are not recorded in the Statement of Assets and Liabilities. Fluctuations in the value ofthe contracts are recorded in the Statement of Assets and Liabilities as an asset (liability) and inthe Statement of Operations as unrealized appreciation (depreciation) until the contracts areclosed, when they are recorded as realized gains (losses) on futures contracts.
During the year ended December 31, 2020, the fund’s average investments in long and shortfutures contracts represented less than 1% and 0% of net assets, respectively, based on theaverage of the notional amounts at each quarter-end during the period.
Tax-Managed Capital Appreciation Fund
Notes to Financial Statements
101

3. Federal IncomeTaxes: The fund intends to continue to qualify as a regulated investmentcompany and distribute all of its taxable income. The fund’s tax returns are open to examination bythe relevant tax authorities until expiration of the applicable statute of limitations, which isgenerally three years after the filing of the tax return. Management has analyzed the fund’s taxpositions taken for all open federal and state income tax years, and has concluded that noprovision for income tax is required in the fund’s financial statements.
4. Distributions: Distributions to shareholders are recorded on the ex-dividend date. Distributionsare determined on a tax basis at the fiscal year-end and may differ from net investment incomeand realized capital gains for financial reporting purposes.
5. Credit Facilities and Interfund Lending Program: The fund and certain other funds managed byThe Vanguard Group ("Vanguard") participate in a $4.3 billion committed credit facility provided by asyndicate of lenders pursuant to a credit agreement and an uncommitted credit facility provided byVanguard. Both facilities may be renewed annually. Each fund is individually liable for itsborrowings, if any, under the credit facilities. Borrowings may be utilized for temporary oremergency purposes, subject to the fund’s regulatory and contractual borrowing restrictions.Withrespect to the committed credit facility, the participating funds are charged administrative fees andan annual commitment fee of 0.10% of the undrawn committed amount of the facility; these feesare allocated to the funds based on a method approved by the fund’s board of trustees andincluded in Management and Administrative expenses on the fund’s Statement of Operations. Anyborrowings under either facility bear interest at a rate based upon the higher of the one-monthLondon Interbank Offered Rate (or an acceptable alternate rate, if necessary), federal fundseffective rate, or overnight bank funding rate plus an agreed-upon spread, except that borrowingsunder the uncommitted credit facility may bear interest based upon an alternative rate agreed toby the fund and Vanguard.
In accordance with an exemptive order (the “Order”) from the SEC, the fund may participate in ajoint lending and borrowing program that allows registered open-end Vanguard funds to borrowmoney from and lend money to each other for temporary or emergency purposes (the “InterfundLending Program”), subject to compliance with the terms and conditions of the Order, and to theextent permitted by the fund’s investment objective and investment policies. Interfund loans andborrowings normally extend overnight, but can have a maximum duration of seven days. Loansmay be called on one business day’s notice. The interest rate to be charged is governed by theconditions of the Order and internal procedures adopted by the board of trustees. The board oftrustees is responsible for overseeing the Interfund Lending Program.
For the year ended December 31, 2020, the fund did not utilize the credit facilities or the InterfundLending Program.
6. Other: Dividend income is recorded on the ex-dividend date. Non-cash dividends included individend income, if any, are recorded at the fair value of the securities received. Interest incomeincludes income distributions received from Vanguard Market Liquidity Fund and is accrued daily.Premiums and discounts on debt securities are amortized and accreted, respectively, to interestincome over the lives of the respective securities, except for premiums on certain callable debtsecurities that are amortized to the earliest call date. Security transactions are accounted for onthe date securities are bought or sold. Costs used to determine realized gains (losses) on the saleof investment securities are those of the specific securities sold.
Tax-Managed Capital Appreciation Fund
102

Each class of shares has equal rights as to assets and earnings, except that each class separatelybears certain class-specific expenses related to maintenance of shareholder accounts (included inManagement and Administrative expenses) and shareholder reporting. Marketing and distributionexpenses are allocated to each class of shares based on a method approved by the board oftrustees. Income, other non-class-specific expenses, and gains and losses on investments areallocated to each class of shares based on its relative net assets.
B. In accordance with the terms of a Funds’ Service Agreement (the “FSA”) between Vanguardand the fund, Vanguard furnishes to the fund investment advisory, corporate management,administrative, marketing, and distribution services at Vanguard’s cost of operations (as defined bythe FSA). These costs of operations are allocated to the fund based on methods and guidelinesapproved by the board of trustees and are generally settled twice a month.
Upon the request of Vanguard, the fund may invest up to 0.40% of its net assets as capital inVanguard. At December 31, 2020, the fund had contributed to Vanguard capital in the amount of$535,000, representing less than 0.01% of the fund’s net assets and 0.21% of Vanguard’s capitalreceived pursuant to the FSA. The fund’s trustees and officers are also directors and employees,respectively, of Vanguard.
C. Various inputs may be used to determine the value of the fund’s investments and derivatives.These inputs are summarized in three broad levels for financial statement purposes. The inputs ormethodologies used to value securities are not necessarily an indication of the risk associated withinvesting in those securities.
Level 1—Quoted prices in active markets for identical securities.
Level 2—Other significant observable inputs (including quoted prices for similar securities, interestrates, prepayment speeds, credit risk, etc.).
Level 3—Significant unobservable inputs (including the fund’s own assumptions used todetermine the fair value of investments). Any investments and derivatives valued with significantunobservable inputs are noted on the Schedule of Investments.
At December 31, 2020, 100% of the market value of the fund's investments and derivatives wasdetermined based on Level 1 inputs.
D. Permanent differences between book-basis and tax-basis components of net assets arereclassified among capital accounts in the financial statements to reflect their tax character. Thesereclassifications have no effect on net assets or net asset value per share. As of period end,permanent differences primarily attributable to the accounting for in-kind redemptions werereclassified between the following accounts:
Amount($000)
Paid-in Capital 99,627
Total Distributable Earnings (Loss) (99,627)
Temporary differences between book-basis and tax-basis components of total distributableearnings (losses) arise when certain items of income, gain, or loss are recognized in differentperiods for financial statement and tax purposes; these differences will reverse at some time inthe future. The differences are primarily related to the deferral of losses from wash sales and the
Tax-Managed Capital Appreciation Fund
103

recognition of unrealized gains or losses from certain derivative contracts; and the classification ofsecurities for tax purposes. As of period end, the tax-basis components of total distributableearnings (losses) are detailed in the table as follows:
Amount($000)
Undistributed Ordinary Income 1,577
Undistributed Long-Term Gains —
Capital Loss Carryforwards (306,816)
Qualified Late-Year Losses —
Net Unrealized Gains (Losses) 9,484,274
The tax character of distributions paid was as follows:
Year Ended December 31,
2020Amount
($000)
2019Amount
($000)
Ordinary Income* 186,056 177,611
Long-Term Capital Gains — —
Total 186,056 177,611
* Includes short-term capital gains, if any.
As of December 31, 2020, gross unrealized appreciation and depreciation for investments andderivatives based on cost for U.S. federal income tax purposes were as follows:
Amount($000)
Tax Cost 4,673,925
Gross Unrealized Appreciation 9,501,778
Gross Unrealized Depreciation (17,504)
Net Unrealized Appreciation (Depreciation) 9,484,274
E. During the year ended December 31, 2020, the fund purchased $1,021,945,000 of investmentsecurities and sold $834,646,000 of investment securities, other than temporary cashinvestments. Purchases and sales include $0 and $108,983,000, respectively, in connection within-kind purchases and redemptions of the fund’s capital shares.
Tax-Managed Capital Appreciation Fund
104

F. Capital share transactions for each class of shares were:
Year Ended December 31,
2020 2019
Amount($000)
Shares(000)
Amount($000)
Shares(000)
Admiral Shares
Issued 1,194,481 7,559 842,966 5,578
Issued in Lieu of Cash Distributions 114,425 723 111,351 721
Redeemed (1,365,827) (8,571) (684,320) (4,522)
Net Increase (Decrease)—Admiral Shares (56,921) (289) 269,997 1,777
Institutional Shares
Issued 374,832 4,366 37,251 494
Issued in Lieu of Cash Distributions 10,490 131 9,015 118
Redeemed (194,849) (2,764) (53,800) (705)
Net Increase (Decrease)—Institutional Shares 190,473 1,733 (7,534) (93)
G. Management has determined that no events or transactions occurred subsequent toDecember 31, 2020, that would require recognition or disclosure in these financial statements.
Tax-Managed Capital Appreciation Fund
105
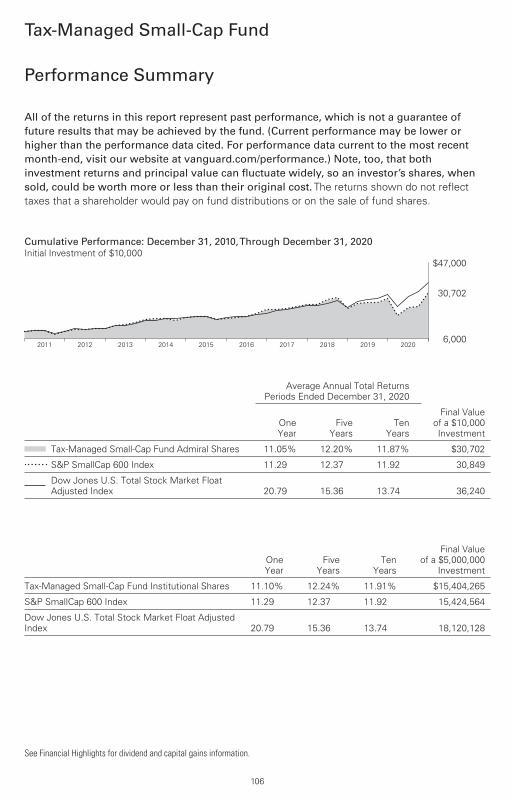
All of the returns in this report represent past performance, which is not a guarantee offuture results that may be achieved by the fund. (Current performance may be lower orhigher than the performance data cited. For performance data current to the most recentmonth-end, visit our website at vanguard.com/performance.) Note, too, that bothinvestment returns and principal value can fluctuate widely, so an investor’s shares, whensold, could be worth more or less than their original cost.The returns shown do not reflecttaxes that a shareholder would pay on fund distributions or on the sale of fund shares.
Cumulative Performance: December 31, 2010,Through December 31, 2020Initial Investment of $10,000
$47,000
6,000
30,702
2020201920182017201620152014201320122011
Average Annual Total ReturnsPeriods Ended December 31, 2020
OneYear
FiveYears
TenYears
Final Valueof a $10,000Investment
Tax-Managed Small-Cap Fund Admiral Shares 11.05% 12.20% 11.87% $30,702
S&P SmallCap 600 Index 11.29 12.37 11.92 30,849
Dow Jones U.S. Total Stock Market FloatAdjusted Index 20.79 15.36 13.74 36,240
OneYear
FiveYears
TenYears
Final Valueof a $5,000,000
Investment
Tax-Managed Small-Cap Fund Institutional Shares 11.10% 12.24% 11.91% $15,404,265
S&P SmallCap 600 Index 11.29 12.37 11.92 15,424,564
Dow Jones U.S. Total Stock Market Float AdjustedIndex 20.79 15.36 13.74 18,120,128
Tax-Managed Small-Cap Fund
Performance Summary
See Financial Highlights for dividend and capital gains information.
106

Communication Services 2.4%
Consumer Discretionary 15.0
Consumer Staples 3.6
Energy 3.0
Financials 16.5
Health Care 12.0
Industrials 17.4
Information Technology 15.0
Materials 5.9
Other 0.0
Real Estate 7.7
Utilities 1.5
The table reflects the fund’s investments, except for short-terminvestments and derivatives. Sector categories are based on theGlobal Industry Classification Standard (“GICS”), except for the“Other” category (if applicable), which includes securities thathave not been provided a GICS classification as of the effectivereporting period.
The Global Industry Classification Standard (“GICS”) was developed by and is the exclusive property and a service markof MSCI Inc. (“MSCI”) and Standard and Poor’s, a division of McGraw-Hill Companies, Inc. (“S&P”), and is licensed foruse by Vanguard. Neither MSCI, S&P nor any third party involved in making or compiling the GICS or any GICSclassification makes any express or implied warranties or representations with respect to such standard or classification(or the results to be obtained by the use thereof), and all such parties hereby expressly disclaim all warranties oforiginality, accuracy, completeness, merchantability or fitness for a particular purpose with respect to any such standardor classification. Without limiting any of the foregoing, in no event shall MSCI, S&P, any of its affiliates or any third partyinvolved in making or compiling the GICS or any GICS classification have any liability for any direct, indirect, special,punitive, consequential or any other damages (including lost profits) even if notified of the possibility of such damages.
Tax-Managed Small-Cap Fund
Fund AllocationAs of December 31, 2020
107

The fund files its complete schedule of portfolio holdings with the Securities and ExchangeCommission (SEC) for the first and third quarters of each fiscal year as an exhibit to its reports onForm N-PORT. The fund’s Form N-PORT reports are available on the SEC’s website atwww.sec.gov.
Shares
MarketValue•
($000)
Common Stocks (99.6%)
Communication Services (2.4%)* Iridium
Communications Inc. 924,877 36,371* Vonage Holdings Corp. 2,009,818 25,876
Cogent CommunicationsHoldings Inc. 362,958 21,730
ShenandoahTelecommunications Co. 395,817 17,119
* TechTarget Inc. 209,381 12,377* Glu Mobile Inc. 1,207,430 10,879* QuinStreet Inc. 423,959 9,090
EW Scripps Co. Class A 558,352 8,537Meredith Corp. 351,787 6,754
* AMC Networks Inc.Class A 133,100 4,761
* Cincinnati Bell Inc. 307,992 4,706* Consolidated
CommunicationsHoldings Inc. 823,253 4,026
ATN International Inc. 84,009 3,508Scholastic Corp. 128,605 3,215Spok Holdings Inc. 279,424 3,110
* Gannett Co. Inc. 226,500 761Marcus Corp. 10,005 135
172,955Consumer Discretionary (15.0%)* Capri Holdings Ltd. 1,146,713 48,162* YETI Holdings Inc. 572,303 39,186* Crocs Inc. 579,198 36,293
Macy's Inc. 2,825,743 31,790LCI Industries 217,355 28,187
* Stamps.com Inc. 140,866 27,636* Meritage Homes Corp. 326,818 27,067* Asbury Automotive
Group Inc. 166,953 24,332Steven Madden Ltd. 681,751 24,079WolverineWorldWide Inc. 770,273 24,071
* Shake Shack Inc. Class A 274,643 23,284MDC Holdings Inc. 478,817 23,270Callaway Golf Co. 858,574 20,614
Shares
MarketValue•
($000)
Group 1 Automotive Inc. 155,042 20,332* LGI Homes Inc. 191,442 20,264* Dorman Products Inc. 231,145 20,068* Sleep Number Corp. 244,982 20,054
Brinker International Inc. 349,144 19,751* Installed Building
Products Inc. 189,195 19,285Bed Bath & Beyond Inc. 1,043,100 18,525Winnebago Industries Inc. 309,022 18,523
* iRobot Corp. 227,275 18,248* Gentherm Inc. 274,892 17,928
Cooper Tire & Rubber Co. 432,986 17,536Rent-A-Center Inc. 447,303 17,127Kontoor Brands Inc. 411,112 16,675La-Z-Boy Inc. 392,259 15,628Monro Inc. 290,196 15,467Bloomin' Brands Inc. 763,896 14,835
* ODP Corp. 497,062 14,564Patrick Industries Inc. 207,152 14,159Big Lots Inc. 311,152 13,358
* Cavco Industries Inc. 75,024 13,163Signet Jewelers Ltd. 479,200 13,068
* Tupperware Brands Corp. 398,000 12,891Shutterstock Inc. 172,173 12,345Abercrombie & Fitch Co.Class A 589,309 11,998
* Century Communities Inc. 268,677 11,763Cheesecake Factory Inc. 317,100 11,752
* M/I Homes Inc. 263,234 11,659Core-Mark Holding Co.Inc. 389,672 11,445
* Boot Barn Holdings Inc. 261,614 11,344* Vista Outdoor Inc. 472,030 11,215
Dave & Buster'sEntertainment Inc. 371,000 11,137
Oxford Industries Inc. 155,244 10,170* GameStop Corp. Class A 519,077 9,779* American Axle &
ManufacturingHoldings Inc. 1,138,155 9,492
Guess? Inc. 415,309 9,394Dine Brands Global Inc. 157,717 9,148
Tax-Managed Small-Cap Fund
Financial Statements
Schedule of InvestmentsAs of December 31, 2020
108

Shares
MarketValue•
($000)
Sonic Automotive Inc.Class A 231,186 8,917
Sturm Ruger & Co. Inc. 135,538 8,819* Sally Beauty Holdings Inc. 650,322 8,480* Hibbett Sports Inc. 170,653 7,881* Perdoceo Education Corp. 609,547 7,699* MarineMax Inc. 207,756 7,278
Buckle Inc. 242,484 7,081* Michaels Cos. Inc. 543,174 7,067* G-III Apparel Group Ltd. 295,444 7,014
Standard MotorProducts Inc. 166,876 6,752
* Zumiez Inc. 182,212 6,702BJ's Restaurants Inc. 172,505 6,640
* America's Car-Mart Inc. 57,500 6,316* Universal Electronics Inc. 117,532 6,166
Ruth's HospitalityGroup Inc. 344,515 6,108
* Monarch Casino &Resort Inc. 95,572 5,851
* Lumber LiquidatorsHoldings Inc. 182,674 5,615
PetMed Express Inc. 167,230 5,361* Liquidity Services Inc. 319,019 5,076* Children's Place Inc. 98,568 4,938
Haverty Furniture Cos.Inc. 162,786 4,504
* American PublicEducation Inc. 141,732 4,320
* Chuy's Holdings Inc. 161,179 4,270* Cooper-Standard
Holdings Inc. 119,858 4,155Caleres Inc. 263,893 4,130
* Motorcar Parts ofAmerica Inc. 206,780 4,057
* Genesco Inc. 131,184 3,947Designer Brands Inc.Class A 487,305 3,728
* El Pollo LocoHoldings Inc. 194,185 3,515
* Fossil Group Inc. 400,414 3,472Shoe Carnival Inc. 73,945 2,897
* Aaron's Co. Inc. 140,000 2,654* Unifi Inc. 114,646 2,034* Fiesta Restaurant
Group Inc. 176,490 2,012* Barnes & Noble
Education Inc. 426,283 1,982Chico's FAS Inc. 1,026,471 1,632
* Movado Group Inc. 91,883 1,527Cato Corp. Class A 135,022 1,295
* Red Robin GourmetBurgers Inc. 59,400 1,142
* Conn's Inc. 52,815 617Ethan Allen Interiors Inc. 19,782 400
Shares
MarketValue•
($000)
* Vera Bradley Inc. 29,700 236* Regis Corp. 19,182 176
1,096,524Consumer Staples (3.6%)
WD-40 Co. 110,094 29,250* Simply Good Foods Co. 707,100 22,175
Medifast Inc. 100,787 19,789J & J Snack Foods Corp. 124,160 19,291PriceSmart Inc. 191,370 17,432B&G Foods Inc. 590,029 16,362Vector Group Ltd. 1,011,599 11,785
* Central Garden & Pet Co.Class A 309,025 11,227
* Cal-Maine Foods Inc. 294,386 11,051Universal Corp. 223,458 10,862Coca-ColaConsolidated Inc. 39,777 10,591
Calavo Growers Inc. 149,683 10,392Inter Parfums Inc. 156,307 9,455National Beverage Corp. 108,400 9,203
* USANA HealthSciences Inc. 112,684 8,688
* United Natural Foods Inc. 489,427 7,816Andersons Inc. 312,031 7,648
* Chefs'Warehouse Inc. 263,700 6,774MGP Ingredients Inc. 130,155 6,125SpartanNash Co. 328,997 5,728John B Sanfilippo &Son Inc. 57,650 4,546
* Central Garden & Pet Co. 117,130 4,522* Seneca Foods Corp.
Class A 88,875 3,546Fresh Del MonteProduce Inc. 10,493 253
264,511Energy (3.0%)
Helmerich & Payne Inc. 1,218,317 28,216* Renewable Energy
Group Inc. 351,680 24,906* Southwestern Energy Co. 5,546,065 16,527* Range Resources Corp. 2,199,821 14,739
Patterson-UTI Energy Inc. 2,542,093 13,371Archrock Inc. 1,448,071 12,540Core Laboratories NV 452,753 12,003
* Matador Resources Co. 939,431 11,330* Dril-Quip Inc. 367,152 10,875* PDC Energy Inc. 450,623 9,251* Oceaneering
International Inc. 1,020,537 8,113PBF Energy Inc. Class A 1,131,179 8,031DMC Global Inc. 143,900 6,224
* Bristow Group Inc. 217,982 5,737Nabors Industries Ltd. 87,916 5,119
* Green Plains Inc. 383,589 5,052
Tax-Managed Small-Cap Fund
109

Shares
MarketValue•
($000)
* REX American ResourcesCorp. 65,261 4,795
* Bonanza CreekEnergy Inc. 213,954 4,136
QEP Resources Inc. 1,620,251 3,872* Par Pacific Holdings Inc. 229,950 3,215* Callon Petroleum Co. 158,140 2,081* Penn Virginia Corp. 195,429 1,984
US Silica Holdings Inc. 271,761 1,908* Talos Energy Inc. 226,119 1,863* Matrix Service Co. 148,039 1,631
SM Energy Co. 251,800 1,541* Dorian LPG Ltd. 115,204 1,404* Laredo Petroleum Inc. 20,504 404* Helix Energy Solutions
Group Inc. 93,500 393* ProPetro Holding Corp. 44,898 332* CONSOL Energy Inc. 29,583 213* Oil States
International Inc. 9,100 46* RPC Inc. 8,434 27* Exterran Corp. 557 3
221,882Financials (16.4%)* Trupanion Inc. 263,700 31,568
BankUnited Inc. 802,571 27,913First Hawaiian Inc. 1,163,134 27,427Community BankSystem Inc. 437,826 27,281
First Bancorp 2,232,891 25,617* Green Dot Corp. Class A 439,930 24,548
Old National Bancorp 1,441,612 23,873Pacific PremierBancorp Inc. 742,631 23,267
Walker & Dunlop Inc. 252,494 23,234American EquityInvestment Life HoldingCo. 836,941 23,150
Ameris Bancorp 598,961 22,802Columbia BankingSystem Inc. 609,648 21,886
Independent Bank Corp.(Massachusetts) 294,390 21,502
CVB Financial Corp. 1,100,774 21,465Simmons First NationalCorp. Class A 989,005 21,353
PennyMac MortgageInvestment Trust 1,138,050 20,018
United CommunityBanks Inc. 700,659 19,927
First MidwestBancorp Inc. 1,141,862 18,178
* Axos Financial Inc. 480,951 18,050Cadence Bancorp Class A 1,097,948 18,028Assured Guaranty Ltd. 565,669 17,813
Shares
MarketValue•
($000)
Waddell & ReedFinancial Inc. Class A 696,245 17,733
* Mr Cooper Group Inc. 549,000 17,035Independent BankGroup Inc. 260,578 16,291
* PRA Group Inc. 405,284 16,074ServisFirstBancshares Inc. 393,562 15,857
* NMI Holdings Inc. Class A 693,350 15,704* Palomar Holdings Inc. 170,725 15,167
Banner Corp. 325,349 15,158Renasant Corp. 449,502 15,139Horace Mann EducatorsCorp. 353,248 14,851
Piper Sandler Cos. 145,702 14,701Virtus InvestmentPartners Inc. 67,490 14,645
* Seacoast Banking Corp.of Florida 484,129 14,258
* eHealth Inc. 199,326 14,074James River GroupHoldings Ltd. 282,752 13,897
Veritex Holdings Inc. 518,868 13,314First Financial Bancorp 743,838 13,039NBT Bancorp Inc. 394,898 12,676Westamerica Bancorp 222,424 12,298NorthwestBancshares Inc. 962,700 12,265
GreatWesternBancorp Inc. 578,003 12,080
Flagstar Bancorp Inc. 282,949 11,533Stewart InformationServices Corp. 236,889 11,456
* Triumph Bancorp Inc. 229,364 11,136City Holding Co. 151,444 10,533
* Encore Capital Group Inc. 268,909 10,474Meta Financial Group Inc. 286,432 10,472Eagle Bancorp Inc. 253,032 10,450Apollo Commercial RealEstate Finance Inc. 915,900 10,231
Safety InsuranceGroup Inc. 131,127 10,215
New York MortgageTrust Inc. 2,729,227 10,071
SouthsideBancshares Inc. 311,077 9,653
National Bank HoldingsCorp. Class A 292,987 9,598
Brookline Bancorp Inc. 776,744 9,352Employers Holdings Inc. 288,542 9,288Capitol FederalFinancial Inc. 741,100 9,264
Berkshire HillsBancorp Inc. 538,909 9,226
First CommonwealthFinancial Corp. 831,902 9,101
OFG Bancorp 489,877 9,082
Tax-Managed Small-Cap Fund
110

Shares
MarketValue•
($000)
Hope Bancorp Inc. 812,392 8,863AMERISAFE Inc. 148,041 8,502HomeStreet Inc. 250,294 8,447Tompkins Financial Corp. 117,587 8,302Heritage Financial Corp. 353,605 8,271Park National Corp. 73,301 7,697
* Enova International Inc. 309,786 7,673* StoneX Group Inc. 132,203 7,655
Northfield Bancorp Inc. 607,598 7,492Banc of California Inc. 493,661 7,262Provident FinancialServices Inc. 400,211 7,188
Brightsphere InvestmentGroup Inc. 371,132 7,155
S&T Bancorp Inc. 287,542 7,143Ready Capital Corp. 567,639 7,067ProAssurance Corp. 391,819 6,970TrustCo Bank Corp. 1,004,358 6,699KKR Real Estate FinanceTrust Inc. 355,665 6,374
Capstead Mortgage Corp. 1,087,714 6,320RedwoodTrust Inc. 713,849 6,268FB Financial Corp. 173,745 6,034
* World Acceptance Corp. 58,058 5,935* Third Point Reinsurance
Ltd. 619,200 5,895Dime CommunityBancshares Inc. 360,595 5,687
BancFirst Corp. 94,134 5,526AllegianceBancshares Inc. 157,976 5,392
Invesco MortgageCapital Inc. 1,559,543 5,271
* Blucora Inc. 310,618 4,942Preferred Bank 97,059 4,899HCI Group Inc. 93,506 4,890Central Pacific FinancialCorp. 245,103 4,659
* Ambac FinancialGroup Inc. 302,654 4,655
United Fire Group Inc. 172,541 4,331WisdomTreeInvestments Inc. 769,683 4,118
Boston Private FinancialHoldings Inc. 479,415 4,051
* Customers Bancorp Inc. 206,359 3,832Universal InsuranceHoldings Inc. 223,472 3,377
Granite Point MortgageTrust Inc. 298,135 2,978
* Donnelley FinancialSolutions Inc. 160,149 2,718
Hanmi Financial Corp. 233,934 2,653ARMOUR ResidentialREIT Inc. 236,105 2,548
* EZCORP Inc. Class A 510,668 2,446
Shares
MarketValue•
($000)
United InsuranceHoldings Corp. 36,920 211
Greenhill & Co. Inc. 10,900 132
1,204,819Health Care (11.9%)* NeoGenomics Inc. 933,752 50,273* Omnicell Inc. 363,194 43,591
Ensign Group Inc. 437,860 31,929CONMED Corp. 262,141 29,360
* Select Medical HoldingsCorp. 1,024,999 28,351
* AMN HealthcareServices Inc. 414,470 28,288
* Glaukos Corp. 370,274 27,867* HMS Holdings Corp. 739,474 27,176* Merit Medical
Systems Inc. 464,644 25,792* Covetrus Inc. 843,390 24,239* Integer Holdings Corp. 289,699 23,521* BioTelemetry Inc. 324,677 23,403* Pacira BioSciences Inc. 386,300 23,116* Corcept Therapeutics Inc. 850,677 22,254* R1 RCM Inc. 865,400 20,787* Xencor Inc. 454,709 19,839* Magellan Health Inc. 215,304 17,836* Allscripts Healthcare
Solutions Inc. 1,199,524 17,321Owens & Minor Inc. 605,708 16,384
* MEDNAX Inc. 618,487 15,178* Addus HomeCare Corp. 123,135 14,418
US Physical Therapy Inc. 117,200 14,093* REGENXBIO Inc. 303,006 13,744* Cardiovascular
Systems Inc. 311,916 13,649* Providence Service Corp. 97,815 13,560* Endo International plc 1,810,721 13,001* Pennant Group Inc. 221,480 12,859* Supernus
Pharmaceuticals Inc. 497,793 12,524* Myriad Genetics Inc. 605,860 11,981* Cytokinetics Inc. 570,908 11,863
Mesa Laboratories Inc. 35,801 10,262* CorVel Corp. 91,060 9,652* Heska Corp. 64,954 9,461* NextGen Healthcare Inc. 459,246 8,377* Coherus Biosciences Inc. 454,682 7,902* CryoLife Inc. 334,148 7,889
Luminex Corp. 340,386 7,870* Innoviva Inc. 628,018 7,781* Tabula Rasa
HealthCare Inc. 180,932 7,751Simulations Plus Inc. 107,710 7,747
* Orthofix Medical Inc. 179,712 7,724* Tivity Health Inc. 367,500 7,199* Community Health
Systems Inc. 907,468 6,743
Tax-Managed Small-Cap Fund
111

Shares
MarketValue•
($000)
* Meridian Bioscience Inc. 344,269 6,434* OraSureTechnologies Inc. 594,339 6,291* Amphastar
Pharmaceuticals Inc. 310,166 6,237* Anika Therapeutics Inc. 137,615 6,228
LeMaitre Vascular Inc. 147,782 5,985* Enanta
Pharmaceuticals Inc. 141,506 5,957* Tactile Systems
Technology Inc. 128,719 5,785* Inogen Inc. 129,279 5,776* Surmodics Inc. 125,977 5,483* RadNet Inc. 269,583 5,276* Fulgent Genetics Inc. 99,800 5,200* Vanda
Pharmaceuticals Inc. 363,289 4,774* Eagle
Pharmaceuticals Inc. 101,619 4,732* HealthStream Inc. 210,975 4,608* Spectrum
Pharmaceuticals Inc. 1,327,823 4,528Computer Programs &Systems Inc. 162,558 4,363
Phibro Animal HealthCorp. Class A 198,007 3,845
* Natus Medical Inc. 182,297 3,653* Cutera Inc. 148,725 3,586* Hanger Inc. 158,786 3,492
Invacare Corp. 375,689 3,362* Varex Imaging Corp. 200,876 3,351* Cross Country
Healthcare Inc. 361,475 3,206* AngioDynamics Inc. 148,542 2,277* Lannett Co. Inc. 331,211 2,160* ANI Pharmaceuticals Inc. 46,648 1,355* Lantheus Holdings Inc. 26,963 364* Zynex Inc. 14,447 194
873,057Industrials (17.3%)* Saia Inc. 214,637 38,806
Exponent Inc. 421,194 37,920* Proto Labs Inc. 230,334 35,333* Chart Industries Inc. 285,220 33,596* Aerojet Rocketdyne
Holdings Inc. 616,645 32,590John BeanTechnologiesCorp. 282,196 32,134
UFP Industries Inc. 546,461 30,356UniFirst Corp. 133,974 28,361WattsWaterTechnologies Inc.Class A 221,778 26,990
Applied IndustrialTechnologies Inc. 338,332 26,386
Hillenbrand Inc. 628,635 25,020
Shares
MarketValue•
($000)
Allegiant Travel Co.Class A 129,620 24,529
Arcosa Inc. 425,842 23,391Moog Inc. Class A 293,512 23,275Brady Corp. Class A 436,249 23,043
* ResideoTechnologies Inc. 1,077,759 22,913ABM Industries Inc. 598,845 22,660
* SPX FLOW Inc. 383,916 22,252Franklin Electric Co. Inc. 318,713 22,058Korn Ferry 502,400 21,854ESCOTechnologies Inc. 210,169 21,694AAON Inc. 323,663 21,566Matson Inc. 364,475 20,764Barnes Group Inc. 408,784 20,721
* SPX Corp. 366,651 19,997Albany International Corp.Class A 269,471 19,785
* Gibraltar Industries Inc. 273,156 19,651Forward Air Corp. 253,798 19,502
* Meritor Inc. 643,122 17,950Mueller Industries Inc. 508,084 17,839Cubic Corp. 279,280 17,327Federal Signal Corp. 520,014 17,249
* Hub Group Inc. Class A 301,715 17,198* AeroVironment Inc. 197,784 17,187
Comfort SystemsUSA Inc. 316,247 16,654
SkyWest Inc. 382,037 15,400EnPro Industries Inc. 193,207 14,591
* AmericanWoodmarkCorp. 149,298 14,012
* Vicor Corp. 148,533 13,698Kaman Corp. 237,716 13,581
* Atlas AirWorldwideHoldings Inc. 231,459 12,624
Greenbrier Cos. Inc. 345,364 12,564* GMS Inc. 407,405 12,418* Harsco Corp. 661,205 11,888
EnerpacTool Group Corp.Class A 524,983 11,870
Alamo Group Inc. 85,527 11,798Lindsay Corp. 90,791 11,663Tennant Co. 165,064 11,583AZZ Inc. 231,645 10,989EncoreWire Corp. 181,296 10,981
* PGT Innovations Inc. 534,169 10,865* MYR Group Inc. 164,919 9,912
Granite Construction Inc. 370,800 9,904Raven Industries Inc. 295,817 9,789Astec Industries Inc. 164,296 9,509Deluxe Corp. 310,186 9,057Pitney Bowes Inc. 1,384,270 8,527US Ecology Inc. 231,270 8,402Standex InternationalCorp. 108,311 8,396
MartenTransport Ltd. 486,205 8,377
Tax-Managed Small-Cap Fund
112

Shares
MarketValue•
($000)
Quanex Building ProductsCorp. 374,644 8,306
AAR Corp. 222,628 8,064Griffon Corp. 393,364 8,017Wabash National Corp. 441,059 7,599ArcBest Corp. 171,598 7,322
* Echo Global Logistics Inc. 268,559 7,203* SEACOR Holdings Inc. 163,402 6,773* Aegion Corp. Class A 314,972 5,981
Kelly Services Inc. Class A 279,173 5,743Hawaiian Holdings Inc. 314,041 5,558Heartland Express Inc. 306,033 5,539Viad Corp. 143,911 5,205Heidrick & StrugglesInternational Inc. 170,675 5,014
* CIRCOR International Inc. 128,950 4,957Apogee Enterprises Inc. 155,195 4,917Triumph Group Inc. 388,600 4,881
* TrueBlue Inc. 255,631 4,778* Forrester Research Inc. 112,916 4,731
Insteel Industries Inc. 195,383 4,351ResourcesConnection Inc. 328,047 4,124
National PrestoIndustries Inc. 45,493 4,023
* Lydall Inc. 107,983 3,243Interface Inc. Class A 304,723 3,200Park Aerospace Corp. 232,914 3,123Powell Industries Inc. 99,676 2,939
* Team Inc. 257,800 2,810* NOW Inc. 315,355 2,264
Matthews InternationalCorp. Class A 70,368 2,069
* DXP Enterprises Inc. 85,551 1,902* Veritiv Corp. 67,484 1,403
Titan International Inc. 264,475 1,285* Foundation Building
Materials Inc. 5,500 106
1,268,379InformationTechnology (15.0%)
Brooks Automation Inc. 593,602 40,276Power Integrations Inc. 458,814 37,558
* Alarm.com Holdings Inc. 356,650 36,895* LivePerson Inc. 536,031 33,357* Advanced Energy
Industries Inc. 331,368 32,133* Viavi Solutions Inc. 2,056,497 30,796* SPS Commerce Inc. 282,586 30,686* 8x8 Inc. 889,258 30,653* Itron Inc. 305,374 29,285* FormFactor Inc. 651,381 28,022* MicroStrategy Inc.
Class A 66,237 25,736* Rogers Corp. 165,650 25,724* ExlService Holdings Inc. 300,384 25,572* Fabrinet 321,099 24,914
Shares
MarketValue•
($000)
* Diodes Inc. 337,507 23,794* Insight Enterprises Inc. 305,345 23,234
Badger Meter Inc. 235,852 22,184* MaxLinear Inc. 580,196 22,158* Onto Innovation Inc. 443,649 21,095
EVERTEC Inc. 521,667 20,512* Plexus Corp. 262,163 20,504
ManTech InternationalCorp. Class A 229,432 20,406
Xperi Holding Corp. 970,249 20,278* Sanmina Corp. 602,295 19,207
Progress Software Corp. 395,285 17,863Kulicke & SoffaIndustries Inc. 548,716 17,455
* BottomlineTechnologiesDE Inc. 324,438 17,111
* Rambus Inc. 950,097 16,589* Knowles Corp. 807,441 14,881* OSI Systems Inc. 153,442 14,304* Perficient Inc. 292,323 13,929* Virtusa Corp. 258,225 13,203
NIC Inc. 510,378 13,183Methode Electronics Inc. 334,396 12,801
* TTMTechnologies Inc. 920,881 12,704CSG SystemsInternational Inc. 281,528 12,688
* Sykes Enterprises Inc. 334,954 12,618* Cardtronics plc Class A 350,598 12,376* Ultra Clean Holdings Inc. 384,790 11,986* FAROTechnologies Inc. 159,815 11,288
Cohu Inc. 292,140 11,154* 3D Systems Corp. 1,048,437 10,988
BenchmarkElectronics Inc. 385,523 10,413
CTS Corp. 303,272 10,411TTEC Holdings Inc. 142,312 10,379
* ePlus Inc. 115,386 10,148* Axcelis Technologies Inc. 308,032 8,970* Unisys Corp. 447,611 8,809* NETGEAR Inc. 209,800 8,524* Extreme Networks Inc. 1,162,220 8,008* Diebold Nixdorf Inc. 751,060 8,006* Agilysys Inc. 202,050 7,755
Plantronics Inc. 284,765 7,697Ebix Inc. 197,187 7,487
* Photronics Inc. 648,709 7,240* CEVA Inc. 154,146 7,014* Ichor Holdings Ltd. 232,256 7,001* Digi International Inc. 361,321 6,829* Veeco Instruments Inc. 366,766 6,367* ScanSource Inc. 234,336 6,182* Harmonic Inc. 797,584 5,894
MTS Systems Corp. 100,011 5,817* OneSpan Inc. 272,086 5,627* PDF Solutions Inc. 258,070 5,574* Arlo Technologies Inc. 692,018 5,391
Tax-Managed Small-Cap Fund
113

Shares
MarketValue•
($000)
ADTRAN Inc. 361,838 5,344* SMART Global
Holdings Inc. 127,947 4,815ComtechTelecommunicationsCorp. 224,130 4,637
* PC Connection Inc. 87,794 4,152* DSP Group Inc. 231,046 3,833* CalAmp Corp. 362,784 3,599* Applied
Optoelectronics Inc. 260,767 2,219Bel Fuse Inc. Class B 113,343 1,703Daktronics Inc. 234,709 1,098BMTechnologies Inc. 31,757 446
1,099,489Materials (5.9%)
Cleveland-Cliffs Inc. 3,668,216 53,409Balchem Corp. 265,040 30,538Quaker Chemical Corp. 111,900 28,354
* Livent Corp. 1,328,878 25,036HB Fuller Co. 439,608 22,807
* Arconic Corp. 761,497 22,693Stepan Co. 167,166 19,946Trinseo SA 376,211 19,266Innospec Inc. 211,790 19,216
* AlleghenyTechnologies Inc. 1,015,541 17,031
Boise Cascade Co. 347,482 16,610Kaiser Aluminum Corp. 143,350 14,177Materion Corp. 178,538 11,376Schweitzer-MauduitInternational Inc. 271,229 10,906
* Ferro Corp. 725,268 10,611* GCP Applied
Technologies Inc. 416,318 9,846Warrior Met Coal Inc. 449,413 9,581
* Kraton Corp. 312,672 8,689* Century Aluminum Co. 621,577 6,856
Carpenter TechnologyCorp. 235,361 6,854
* Koppers Holdings Inc. 214,113 6,672* Clearwater Paper Corp. 155,957 5,887
Myers Industries Inc. 282,940 5,880Hawkins Inc. 100,111 5,237
* AdvanSix Inc. 251,748 5,032Neenah Inc. 81,080 4,485Glatfelter Corp. 269,528 4,415Tredegar Corp. 258,645 4,319American Vanguard Corp. 268,629 4,169
* US Concrete Inc. 100,553 4,019Mercer International Inc. 367,863 3,771FutureFuel Corp. 271,152 3,444
* Rayonier AdvancedMaterials Inc. 476,097 3,104
* TimkenSteel Corp. 577,614 2,697Haynes International Inc. 87,066 2,076
Shares
MarketValue•
($000)
Olympic Steel Inc. 119,973 1,599SunCoke Energy Inc. 229,627 999
431,607Other (0.0%)*,1 Lantheus Holdings Inc.
CVR 933,227 —
Real Estate (7.6%)Innovative IndustrialProperties Inc. 177,000 32,414
Agree Realty Corp. 426,531 28,398Lexington Realty Trust 2,083,796 22,130Uniti Group Inc. 1,830,811 21,475CareTrust REIT Inc. 852,382 18,906National Storage AffiliatesTrust 520,052 18,738
Four Corners PropertyTrust Inc. 608,448 18,114
Essential PropertiesRealty Trust Inc. 850,200 18,024
Retail Properties ofAmerica Inc. Class A 1,979,273 16,943
Brandywine Realty Trust 1,351,159 16,092Washington REIT 701,478 15,173
* Realogy Holdings Corp. 1,134,214 14,881Retail OpportunityInvestments Corp. 1,107,701 14,832
Easterly GovernmentProperties Inc. 619,577 14,033
LTC Properties Inc. 351,809 13,689Global Net Lease Inc. 792,001 13,575Industrial LogisticsProperties Trust 577,340 13,446
SITE Centers Corp. 1,316,404 13,322American AssetsTrust Inc. 419,156 12,105
Kite Realty GroupTrust 783,951 11,728Independence RealtyTrust Inc. 805,952 10,824
* DiamondRock HospitalityCo. 1,246,693 10,285
Office Properties IncomeTrust 451,948 10,268
iStar Inc. 674,100 10,010Diversified HealthcareTrust 2,334,683 9,619
Summit HotelProperties Inc. 1,052,483 9,483
GEO Group Inc. 1,030,588 9,131Xenia Hotels &Resorts Inc. 598,052 9,090
Mack-Cali Realty Corp. 720,375 8,976Tanger Factory OutletCenters Inc. 887,477 8,839
Community HealthcareTrust Inc. 183,000 8,621
Tax-Managed Small-Cap Fund
114

Shares
MarketValue•
($000)
NexPoint ResidentialTrust Inc. 202,383 8,563
Alexander & Baldwin Inc. 494,892 8,502Getty Realty Corp. 305,957 8,426Safehold Inc. 113,073 8,197St. Joe Co. 189,054 8,025Centerspace 103,500 7,311Universal Health RealtyIncomeTrust 112,547 7,233
Chatham LodgingTrust 538,407 5,815Hersha Hospitality TrustClass A 729,717 5,758
RE/MAX Holdings Inc.Class A 158,378 5,754
Acadia Realty Trust 399,964 5,676* Marcus & Millichap Inc. 152,390 5,674
Franklin Street PropertiesCorp. 1,212,700 5,300
Armada HofflerProperties Inc. 441,103 4,949
RPT Realty 493,457 4,268Urstadt BiddleProperties Inc. Class A 184,948 2,613
Whitestone REIT 231,556 1,846Saul Centers Inc. 53,434 1,693CoreCivic Inc. 248,365 1,627
560,394Utilities (1.5%)
American StatesWaterCo. 315,121 25,055
Avista Corp. 599,477 24,063CaliforniaWater ServiceGroup 419,875 22,686
South JerseyIndustries Inc. 877,302 18,906
Northwest NaturalHolding Co. 260,800 11,994
Chesapeake UtilitiesCorp. 89,100 9,642
112,346
Total Common Stocks(Cost $4,318,290) 7,305,963
Shares
MarketValue•
($000)
Temporary Cash Investments (0.2%)
Money Market Fund (0.2%)2 Vanguard Market Liquidity
Fund, 0.111% 150,084 15,009
FaceAmount
($000)
U.S. Government and Agency Obligations (0.0%)3 United States Treasury
Bill, 0.116%, 2/16/21 539 539
TotalTemporary Cash Investments(Cost $15,548) 15,548
Total Investments (99.8%)(Cost $4,333,838) 7,321,511
Other Assets andLiabilities—Net (0.2%) 13,271
Net Assets (100%) 7,334,782
Cost is in $000.• See Note A in Notes to Financial Statements.* Non-income-producing security.1 Security value determined using significant unobservableinputs.
2 Affiliated money market fund available only to Vanguard fundsand certain trusts and accounts managed by Vanguard. Rateshown is the 7-day yield.
3 Securities with a value of $539,000 have been segregated asinitial margin for open futures contracts.CVR—Contingent Value Rights.REIT—Real Estate Investment Trust.
Tax-Managed Small-Cap Fund
115

Derivative Financial Instruments Outstanding as of Period End
Futures Contracts
($000)
Expiration
Number ofLong (Short)Contracts
NotionalAmount
Value andUnrealized
Appreciation(Depreciation)
Long Futures Contracts
E-mini Russell 2000 Index March 2021 240 23,698 723
See accompanying Notes, which are an integral part of the Financial Statements.
Tax-Managed Small-Cap Fund
116
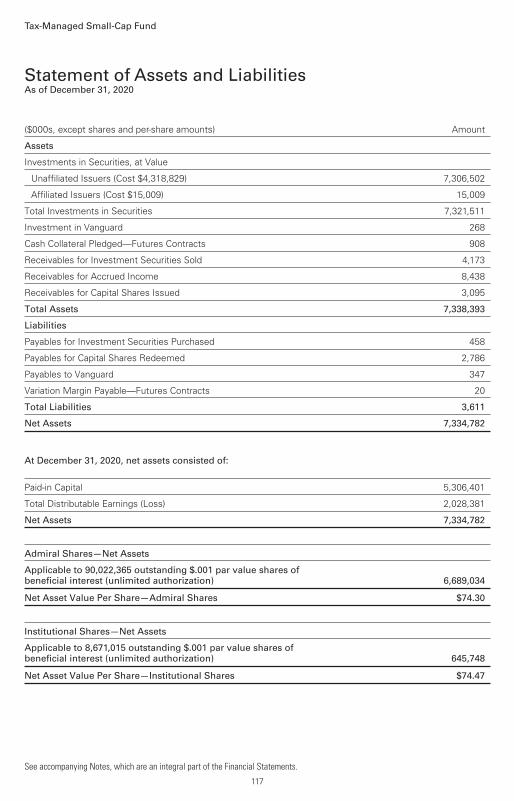
($000s, except shares and per-share amounts) Amount
Assets
Investments in Securities, at Value
Unaffiliated Issuers (Cost $4,318,829) 7,306,502
Affiliated Issuers (Cost $15,009) 15,009
Total Investments in Securities 7,321,511
Investment in Vanguard 268
Cash Collateral Pledged—Futures Contracts 908
Receivables for Investment Securities Sold 4,173
Receivables for Accrued Income 8,438
Receivables for Capital Shares Issued 3,095
Total Assets 7,338,393
Liabilities
Payables for Investment Securities Purchased 458
Payables for Capital Shares Redeemed 2,786
Payables to Vanguard 347
Variation Margin Payable—Futures Contracts 20
Total Liabilities 3,611
Net Assets 7,334,782
At December 31, 2020, net assets consisted of:
Paid-in Capital 5,306,401
Total Distributable Earnings (Loss) 2,028,381
Net Assets 7,334,782
Admiral Shares—Net Assets
Applicable to 90,022,365 outstanding $.001 par value shares ofbeneficial interest (unlimited authorization) 6,689,034
Net Asset Value Per Share—Admiral Shares $74.30
Institutional Shares—Net Assets
Applicable to 8,671,015 outstanding $.001 par value shares ofbeneficial interest (unlimited authorization) 645,748
Net Asset Value Per Share—Institutional Shares $74.47
See accompanying Notes, which are an integral part of the Financial Statements.
Tax-Managed Small-Cap Fund
Statement of Assets and LiabilitiesAs of December 31, 2020
117

Year EndedDecember 31, 2020
($000)
Investment Income
Income
Dividends—Unaffiliated Issuers 88,401
Dividends—Affiliated Issuers —
Interest—Unaffiliated Issuers 5
Interest—Affiliated Issuers 69
Total Income 88,475
Expenses
The Vanguard Group—Note B
Investment Advisory Services 896
Management and Administrative—Admiral Shares 3,742
Management and Administrative—Institutional Shares 214
Marketing and Distribution—Admiral Shares 270
Marketing and Distribution—Institutional Shares 10
Custodian Fees 26
Auditing Fees 32
Shareholders’ Reports—Admiral Shares 46
Shareholders’ Reports—Institutional Shares 3
Trustees’ Fees and Expenses 4
Total Expenses 5,243
Net Investment Income 83,232
Realized Net Gain (Loss)
Investment Securities Sold—Unaffiliated Issuers1 (158,133)
Investment Securities Sold—Affiliated Issuers (66,264)
Futures Contracts 7,940
Realized Net Gain (Loss) (216,457)
Change in Unrealized Appreciation (Depreciation)
Investment Securities—Unaffiliated Issuers 758,432
Investment Securities—Affiliated Issuers 4,488
Futures Contracts 666
Change in Unrealized Appreciation (Depreciation) 763,586
Net Increase (Decrease) in Net Assets Resulting from Operations 630,361
1 Includes $298,595,000 of net gain (loss) resulting from in-kind redemptions.
See accompanying Notes, which are an integral part of the Financial Statements.
Tax-Managed Small-Cap Fund
Statement of Operations
118

Year Ended December 31,
2020 2019
($000) ($000)
Increase (Decrease) in Net Assets
Operations
Net Investment Income 83,232 80,873
Realized Net Gain (Loss) (216,457) 145,349
Change in Unrealized Appreciation (Depreciation) 763,586 1,119,748
Net Increase (Decrease) in Net Assets Resulting from Operations 630,361 1,345,970
Distributions1
Admiral Shares (73,881) (74,592)
Institutional Shares (7,189) (6,814)
Total Distributions (81,070) (81,406)
Capital Share Transactions
Admiral Shares (307,848) 41,266
Institutional Shares (5,978) 16,943
Net Increase (Decrease) from Capital Share Transactions (313,826) 58,209
Total Increase (Decrease) 235,465 1,322,773
Net Assets
Beginning of Period 7,099,317 5,776,544
End of Period 7,334,782 7,099,317
1 Certain prior-period numbers have been reclassified to conform with the current-period presentation.
See accompanying Notes, which are an integral part of the Financial Statements.
Tax-Managed Small-Cap Fund
Statement of Changes in Net Assets
119
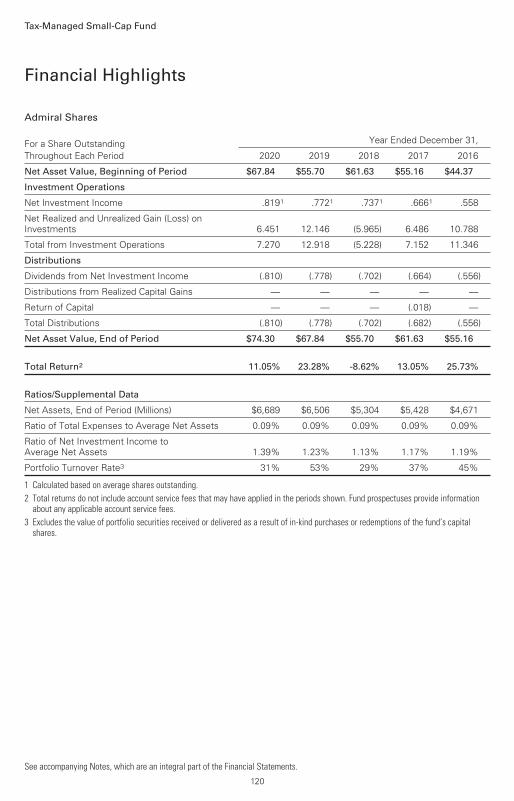
Admiral Shares
For a Share OutstandingThroughout Each Period
Year Ended December 31,
2020 2019 2018 2017 2016
Net Asset Value, Beginning of Period $67.84 $55.70 $61.63 $55.16 $44.37
Investment Operations
Net Investment Income .8191 .7721 .7371 .6661 .558
Net Realized and Unrealized Gain (Loss) onInvestments 6.451 12.146 (5.965) 6.486 10.788
Total from Investment Operations 7.270 12.918 (5.228) 7.152 11.346
Distributions
Dividends from Net Investment Income (.810) (.778) (.702) (.664) (.556)
Distributions from Realized Capital Gains — — — — —
Return of Capital — — — (.018) —
Total Distributions (.810) (.778) (.702) (.682) (.556)
Net Asset Value, End of Period $74.30 $67.84 $55.70 $61.63 $55.16
Total Return2 11.05% 23.28% -8.62% 13.05% 25.73%
Ratios/Supplemental Data
Net Assets, End of Period (Millions) $6,689 $6,506 $5,304 $5,428 $4,671
Ratio of Total Expenses to Average Net Assets 0.09% 0.09% 0.09% 0.09% 0.09%
Ratio of Net Investment Income toAverage Net Assets 1.39% 1.23% 1.13% 1.17% 1.19%
Portfolio Turnover Rate3 31% 53% 29% 37% 45%
1 Calculated based on average shares outstanding.2 Total returns do not include account service fees that may have applied in the periods shown. Fund prospectuses provide information
about any applicable account service fees.3 Excludes the value of portfolio securities received or delivered as a result of in-kind purchases or redemptions of the fund’s capital
shares.
Tax-Managed Small-Cap Fund
Financial Highlights
See accompanying Notes, which are an integral part of the Financial Statements.
120
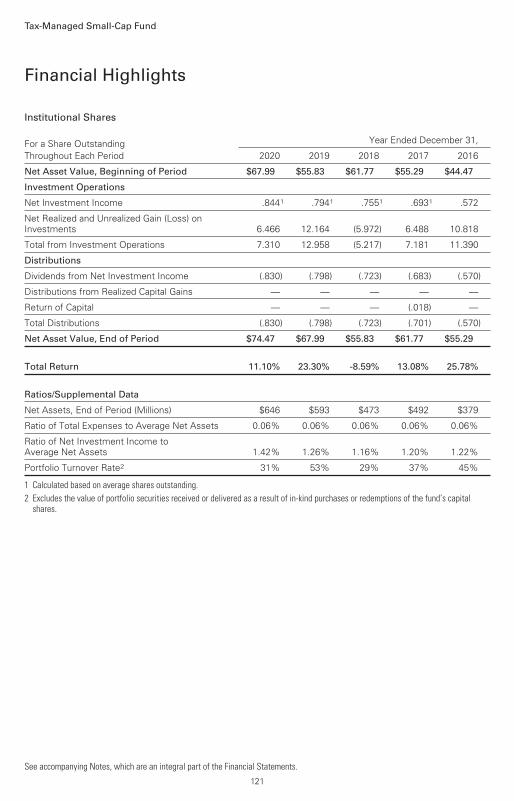
Institutional Shares
For a Share OutstandingThroughout Each Period
Year Ended December 31,
2020 2019 2018 2017 2016
Net Asset Value, Beginning of Period $67.99 $55.83 $61.77 $55.29 $44.47
Investment Operations
Net Investment Income .8441 .7941 .7551 .6931 .572
Net Realized and Unrealized Gain (Loss) onInvestments 6.466 12.164 (5.972) 6.488 10.818
Total from Investment Operations 7.310 12.958 (5.217) 7.181 11.390
Distributions
Dividends from Net Investment Income (.830) (.798) (.723) (.683) (.570)
Distributions from Realized Capital Gains — — — — —
Return of Capital — — — (.018) —
Total Distributions (.830) (.798) (.723) (.701) (.570)
Net Asset Value, End of Period $74.47 $67.99 $55.83 $61.77 $55.29
Total Return 11.10% 23.30% -8.59% 13.08% 25.78%
Ratios/Supplemental Data
Net Assets, End of Period (Millions) $646 $593 $473 $492 $379
Ratio of Total Expenses to Average Net Assets 0.06% 0.06% 0.06% 0.06% 0.06%
Ratio of Net Investment Income toAverage Net Assets 1.42% 1.26% 1.16% 1.20% 1.22%
Portfolio Turnover Rate2 31% 53% 29% 37% 45%
1 Calculated based on average shares outstanding.2 Excludes the value of portfolio securities received or delivered as a result of in-kind purchases or redemptions of the fund’s capital
shares.
Tax-Managed Small-Cap Fund
Financial Highlights
See accompanying Notes, which are an integral part of the Financial Statements.
121

Vanguard Tax-Managed Small-Cap Fund is registered under the Investment Company Act of 1940as an open-end investment company, or mutual fund. The fund offers two classes of shares:Admiral Shares and Institutional Shares. Each of the share classes has different eligibility andminimum purchase requirements, and is designed for different types of investors.
Market disruptions associated with the COVID-19 pandemic have had a global impact, anduncertainty exists as to the long-term implications. Such disruptions can adversely affect assets ofthe fund and thus fund performance.
A. The following significant accounting policies conform to generally accepted accountingprinciples for U.S. investment companies. The fund consistently follows such policies in preparingits financial statements.
1. Security Valuation: Securities are valued as of the close of trading on the New York StockExchange (generally 4 p.m., Eastern time) on the valuation date. Equity securities are valued at thelatest quoted sales prices or official closing prices taken from the primary market in which eachsecurity trades; such securities not traded on the valuation date are valued at the mean of thelatest quoted bid and asked prices. Securities for which market quotations are not readily available,or whose values have been materially affected by events occurring before the fund's pricing timebut after the close of the securities’ primary markets, are valued by methods deemed by the boardof trustees to represent fair value. Investments in Vanguard Market Liquidity Fund are valued atthat fund's net asset value. Temporary cash investments are valued using the latest bid prices orusing valuations based on a matrix system (which considers such factors as security prices, yields,maturities, and ratings), both as furnished by independent pricing services.
2. Futures Contracts: The fund uses index futures contracts to a limited extent, with the objectiveof maintaining full exposure to the stock market while maintaining liquidity. The fund may purchaseor sell futures contracts to achieve a desired level of investment, whether to accommodateportfolio turnover or cash flows from capital share transactions. The primary risks associated withthe use of futures contracts are imperfect correlation between changes in market values of stocksheld by the fund and the prices of futures contracts, and the possibility of an illiquid market.Counterparty risk involving futures is mitigated because a regulated clearinghouse is thecounterparty instead of the clearing broker. To further mitigate counterparty risk, the fund tradesfutures contracts on an exchange, monitors the financial strength of its clearing brokers andclearinghouse, and has entered into clearing agreements with its clearing brokers. Theclearinghouse imposes initial margin requirements to secure the fund’s performance and requiresdaily settlement of variation margin representing changes in the market value of each contract. Anysecurities pledged as initial margin for open contracts are noted in the Schedule of Investments.
Futures contracts are valued at their quoted daily settlement prices. The notional amounts of thecontracts are not recorded in the Statement of Assets and Liabilities. Fluctuations in the value ofthe contracts are recorded in the Statement of Assets and Liabilities as an asset (liability) and inthe Statement of Operations as unrealized appreciation (depreciation) until the contracts areclosed, when they are recorded as realized gains (losses) on futures contracts.
During the year ended December 31, 2020, the fund’s average investments in long and shortfutures contracts represented less than 1% and 0% of net assets, respectively, based on theaverage of the notional amounts at each quarter-end during the period.
Tax-Managed Small-Cap Fund
Notes to Financial Statements
122

3. Federal IncomeTaxes: The fund intends to continue to qualify as a regulated investmentcompany and distribute all of its taxable income. The fund’s tax returns are open to examination bythe relevant tax authorities until expiration of the applicable statute of limitations, which isgenerally three years after the filing of the tax return. Management has analyzed the fund’s taxpositions taken for all open federal and state income tax years, and has concluded that noprovision for income tax is required in the fund’s financial statements.
4. Distributions: Distributions to shareholders are recorded on the ex-dividend date. Distributionsare determined on a tax basis at the fiscal year-end and may differ from net investment incomeand realized capital gains for financial reporting purposes.
5. Credit Facilities and Interfund Lending Program: The fund and certain other funds managed byThe Vanguard Group ("Vanguard") participate in a $4.3 billion committed credit facility provided by asyndicate of lenders pursuant to a credit agreement and an uncommitted credit facility provided byVanguard. Both facilities may be renewed annually. Each fund is individually liable for itsborrowings, if any, under the credit facilities. Borrowings may be utilized for temporary oremergency purposes, subject to the fund’s regulatory and contractual borrowing restrictions.Withrespect to the committed credit facility, the participating funds are charged administrative fees andan annual commitment fee of 0.10% of the undrawn committed amount of the facility; these feesare allocated to the funds based on a method approved by the fund’s board of trustees andincluded in Management and Administrative expenses on the fund’s Statement of Operations. Anyborrowings under either facility bear interest at a rate based upon the higher of the one-monthLondon Interbank Offered Rate (or an acceptable alternate rate, if necessary), federal fundseffective rate, or overnight bank funding rate plus an agreed-upon spread, except that borrowingsunder the uncommitted credit facility may bear interest based upon an alternative rate agreed toby the fund and Vanguard.
In accordance with an exemptive order (the “Order”) from the SEC, the fund may participate in ajoint lending and borrowing program that allows registered open-end Vanguard funds to borrowmoney from and lend money to each other for temporary or emergency purposes (the “InterfundLending Program”), subject to compliance with the terms and conditions of the Order, and to theextent permitted by the fund’s investment objective and investment policies. Interfund loans andborrowings normally extend overnight, but can have a maximum duration of seven days. Loansmay be called on one business day’s notice. The interest rate to be charged is governed by theconditions of the Order and internal procedures adopted by the board of trustees. The board oftrustees is responsible for overseeing the Interfund Lending Program.
For the year ended December 31, 2020, the fund did not utilize the credit facilities or the InterfundLending Program.
6. Other: Dividend income is recorded on the ex-dividend date. Non-cash dividends included individend income, if any, are recorded at the fair value of the securities received. Interest incomeincludes income distributions received from Vanguard Market Liquidity Fund and is accrued daily.Premiums and discounts on debt securities are amortized and accreted, respectively, to interestincome over the lives of the respective securities, except for premiums on certain callable debtsecurities that are amortized to the earliest call date. Security transactions are accounted for onthe date securities are bought or sold. Costs used to determine realized gains (losses) on the saleof investment securities are those of the specific securities sold.
Tax-Managed Small-Cap Fund
123

Each class of shares has equal rights as to assets and earnings, except that each class separatelybears certain class-specific expenses related to maintenance of shareholder accounts (included inManagement and Administrative expenses) and shareholder reporting. Marketing and distributionexpenses are allocated to each class of shares based on a method approved by the board oftrustees. Income, other non-class-specific expenses, and gains and losses on investments areallocated to each class of shares based on its relative net assets.
B. In accordance with the terms of a Funds’ Service Agreement (the “FSA”) between Vanguardand the fund, Vanguard furnishes to the fund investment advisory, corporate management,administrative, marketing, and distribution services at Vanguard’s cost of operations (as defined bythe FSA). These costs of operations are allocated to the fund based on methods and guidelinesapproved by the board of trustees and are generally settled twice a month.
Upon the request of Vanguard, the fund may invest up to 0.40% of its net assets as capital inVanguard. At December 31, 2020, the fund had contributed to Vanguard capital in the amount of$268,000, representing less than 0.01% of the fund’s net assets and 0.11% of Vanguard’s capitalreceived pursuant to the FSA. The fund’s trustees and officers are also directors and employees,respectively, of Vanguard.
C. Various inputs may be used to determine the value of the fund’s investments and derivatives.These inputs are summarized in three broad levels for financial statement purposes. The inputs ormethodologies used to value securities are not necessarily an indication of the risk associated withinvesting in those securities.
Level 1—Quoted prices in active markets for identical securities.
Level 2—Other significant observable inputs (including quoted prices for similar securities, interestrates, prepayment speeds, credit risk, etc.).
Level 3—Significant unobservable inputs (including the fund’s own assumptions used todetermine the fair value of investments). Any investments and derivatives valued with significantunobservable inputs are noted on the Schedule of Investments.
The following table summarizes the market value of the fund's investments and derivatives as ofDecember 31, 2020, based on the inputs used to value them:
Level 1($000)
Level 2($000)
Level 3($000)
Total($000)
Investments
Assets
Common Stocks 7,305,517 446 — 7,305,963
Temporary Cash Investments 15,009 539 — 15,548
Total 7,320,526 985 — 7,321,511
Derivative Financial Instruments
Liabilities
Futures Contracts1 20 — — 20
1 Represents variation margin on the last day of the reporting period.
D. Permanent differences between book-basis and tax-basis components of net assets arereclassified among capital accounts in the financial statements to reflect their tax character. These
Tax-Managed Small-Cap Fund
124
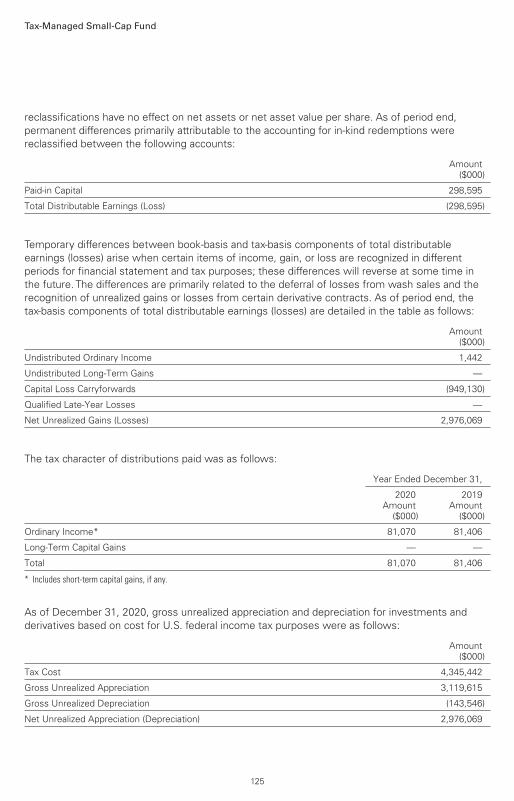
reclassifications have no effect on net assets or net asset value per share. As of period end,permanent differences primarily attributable to the accounting for in-kind redemptions werereclassified between the following accounts:
Amount($000)
Paid-in Capital 298,595
Total Distributable Earnings (Loss) (298,595)
Temporary differences between book-basis and tax-basis components of total distributableearnings (losses) arise when certain items of income, gain, or loss are recognized in differentperiods for financial statement and tax purposes; these differences will reverse at some time inthe future. The differences are primarily related to the deferral of losses from wash sales and therecognition of unrealized gains or losses from certain derivative contracts. As of period end, thetax-basis components of total distributable earnings (losses) are detailed in the table as follows:
Amount($000)
Undistributed Ordinary Income 1,442
Undistributed Long-Term Gains —
Capital Loss Carryforwards (949,130)
Qualified Late-Year Losses —
Net Unrealized Gains (Losses) 2,976,069
The tax character of distributions paid was as follows:
Year Ended December 31,
2020Amount
($000)
2019Amount
($000)
Ordinary Income* 81,070 81,406
Long-Term Capital Gains — —
Total 81,070 81,406
* Includes short-term capital gains, if any.
As of December 31, 2020, gross unrealized appreciation and depreciation for investments andderivatives based on cost for U.S. federal income tax purposes were as follows:
Amount($000)
Tax Cost 4,345,442
Gross Unrealized Appreciation 3,119,615
Gross Unrealized Depreciation (143,546)
Net Unrealized Appreciation (Depreciation) 2,976,069
Tax-Managed Small-Cap Fund
125

E. During the year ended December 31, 2020, the fund purchased $2,020,243,000 of investmentsecurities and sold $2,341,836,000 of investment securities, other than temporary cashinvestments. Purchases and sales include $0 and $474,951,000, respectively, in connection within-kind purchases and redemptions of the fund’s capital shares.
F. Capital share transactions for each class of shares were:
Year Ended December 31,
2020 2019
Amount($000)
Shares(000)
Amount($000)
Shares(000)
Admiral Shares
Issued 1,131,338 20,286 1,173,529 18,603
Issued in Lieu of Cash Distributions 52,404 905 55,426 865
Redeemed (1,491,590) (27,073) (1,187,689) (18,781)
Net Increase (Decrease)—Admiral Shares (307,848) (5,882) 41,266 687
Institutional Shares
Issued 66,229 1,208 46,891 735
Issued in Lieu of Cash Distributions 4,490 77 4,214 66
Redeemed (76,697) (1,343) (34,162) (540)
Net Increase (Decrease)—Institutional Shares (5,978) (58) 16,943 261
G. Transactions during the period in investments where the issuer is another member of TheVanguard Group were as follows:
Current Period Transactions
Dec. 31, 2019Market Value
($000)
Purchasesat Cost($000)
Proceedsfrom
SecuritiesSold
($000)
RealizedNet Gain
(Loss)($000)
Change inUnrealizedApp. (Dep.)
($000)Income($000)
Capital GainDistributions
Received($000)
Dec. 31, 2020Market Value
($000)
VanguardMarket LiquidityFund 6,697 NA1 NA1 10 — 69 — 15,009
Vanguard RealEstate ETF 324,765 288,967 551,946 (66,274) 4,488 — — —
Total 331,462 288,967 551,946 (66,264) 4,488 69 — 15,009
1 Not applicable—purchases and sales are for temporary cash investment purposes.
H. Management has determined that no events or transactions occurred subsequent toDecember 31, 2020, that would require recognition or disclosure in these financial statements.
Tax-Managed Small-Cap Fund
126

To the Board of Trustees of Vanguard Tax-Managed Funds and Shareholders of VanguardTax-Managed Balanced Fund, Vanguard Tax-Managed Capital Appreciation Fund and VanguardTax-Managed Small-Cap Fund
Opinions on the Financial StatementsWe have audited the accompanying statements of assets and liabilities, including the schedules ofinvestments, of Vanguard Tax-Managed Balanced Fund, Vanguard Tax-Managed Capital AppreciationFund and Vanguard Tax-Managed Small-Cap Fund (three of the funds constituting VanguardTax-Managed Funds, hereafter collectively referred to as the "Funds") as of December 31, 2020,the related statements of operations for the year ended December 31, 2020, the statements ofchanges in net assets for each of the two years in the period ended December 31, 2020, includingthe related notes, and the financial highlights for each of the five years in the period endedDecember 31, 2020 (collectively referred to as the “financial statements”). In our opinion, thefinancial statements present fairly, in all material respects, the financial position of each of theFunds as of December 31, 2020, the results of each of their operations for the year then ended,the changes in each of their net assets for each of the two years in the period endedDecember 31, 2020 and each of the financial highlights for each of the five years in the periodended December 31, 2020 in conformity with accounting principles generally accepted in theUnited States of America.
Basis for OpinionsThese financial statements are the responsibility of the Funds’ management. Our responsibility isto express an opinion on the Funds’ financial statements based on our audits. We are a publicaccounting firm registered with the Public Company Accounting Oversight Board (United States)(PCAOB) and are required to be independent with respect to the Funds in accordance with theU.S. federal securities laws and the applicable rules and regulations of the Securities and ExchangeCommission and the PCAOB.
We conducted our audits of these financial statements in accordance with the standards of thePCAOB. Those standards require that we plan and perform the audit to obtain reasonableassurance about whether the financial statements are free of material misstatement, whether dueto error or fraud.
Our audits included performing procedures to assess the risks of material misstatement of thefinancial statements, whether due to error or fraud, and performing procedures that respond tothose risks. Such procedures included examining, on a test basis, evidence regarding the amountsand disclosures in the financial statements. Our audits also included evaluating the accountingprinciples used and significant estimates made by management, as well as evaluating the overallpresentation of the financial statements. Our procedures included confirmation of securitiesowned as of December 31, 2020 by correspondence with the custodian, transfer agent andbrokers; when replies were not received from brokers, we performed other auditing procedures.We believe that our audits provide a reasonable basis for our opinions.
/s/PricewaterhouseCoopers LLPPhiladelphia, PennsylvaniaFebruary 16, 2021
We have served as the auditor of one or more investment companies in The Vanguard Group ofFunds since 1975.
Report of Independent RegisteredPublic Accounting Firm
127

Special 2020 tax information (unaudited) for VanguardTax-Managed Funds
This information for the fiscal year ended December 31, 2020, is included pursuant to provisions ofthe Internal Revenue Code.
TheTax-Managed Balanced Fund designates 62% of its income dividends as exempt-interestdividends.
The funds distributed qualified dividend income to shareholders during the fiscal year as follows:
Fund ($000)
Tax-Managed Balanced Fund 42,413
Tax-Managed Capital Appreciation Fund 186,056
Tax-Managed Small-Cap Fund 69,972
The funds distributed qualified business income to shareholders during the fiscal year as follows:
Fund ($000)
Tax-Managed Balanced Fund 1,402
Tax-Managed Capital Appreciation Fund —
Tax-Managed Small-Cap Fund 9,769
For corporate shareholders, the percentage of investment income (dividend income plusshort-term gains, if any) that qualifies for the dividends-received deduction is as follows:
Fund Percentage
Tax-Managed Balanced Fund 93.3%
Tax-Managed Capital Appreciation Fund 99.3
Tax-Managed Small-Cap Fund 83.6
128

BLOOMBERG is a trademark and service mark of Bloomberg Finance L.P. BARCLAYS is a trademark and service mark ofBarclays Bank Plc, used under license. Bloomberg Finance L.P. and its affiliates, including Bloomberg Index ServicesLimited (BISL) (collectively, Bloomberg), or Bloomberg’s licensors, own all proprietary rights in the Bloomberg Barclays1–15 Year Municipal Bond Index (the Index or Bloomberg Barclays Index).
Neither Barclays Bank Plc, Barclays Capital Inc., or any affiliate (collectively Barclays) or Bloomberg is the issuer orproducer of the Tax-Managed Balanced Fund and neither Bloomberg nor Barclays has any responsibilities, obligations orduties to investors in the Tax-Managed Balanced Fund. The Index is licensed for use by The Vanguard Group, Inc.(Vanguard) as the sponsor of the Tax-Managed Balanced Fund. Bloomberg and Barclays’ only relationship with Vanguardin respect of the Index is the licensing of the Index, which is determined, composed and calculated by BISL, or anysuccessor thereto, without regard to the Issuer or the Tax-Managed Balanced Fund or the owners of the Tax-ManagedBalanced Fund.
Additionally, Vanguard may for itself execute transaction(s) with Barclays in or relating to the Index in connection withthe Tax-Managed Balanced Fund. Investors acquire the Tax-Managed Balanced Fund from Vanguard and investorsneither acquire any interest in the Index nor enter into any relationship of any kind whatsoever with Bloomberg orBarclays upon making an investment in the Tax-Managed Balanced Fund. The Tax-Managed Balanced Fund is notsponsored, endorsed, sold or promoted by Bloomberg or Barclays. Neither Bloomberg nor Barclays makes anyrepresentation or warranty, express or implied regarding the advisability of investing in the Tax-Managed Balanced Fundor the advisability of investing in securities generally or the ability of the Index to track corresponding or relative marketperformance. Neither Bloomberg nor Barclays has passed on the legality or suitability of the Tax-Managed BalancedFund with respect to any person or entity. Neither Bloomberg nor Barclays is responsible for and has not participated inthe determination of the timing of, prices at, or quantities of the Tax-Managed Balanced Fund to be issued. NeitherBloomberg nor Barclays has any obligation to take the needs of the Issuer or the owners of the Tax-Managed BalancedFund or any other third party into consideration in determining, composing or calculating the Index. Neither Bloombergnor Barclays has any obligation or liability in connection with administration, marketing or trading of the Tax-ManagedBalanced Fund.
The licensing agreement between Bloomberg and Barclays is solely for the benefit of Bloomberg and Barclays and notfor the benefit of the owners of the Tax-Managed Balanced Fund, investors or other third parties. In addition, thelicensing agreement between Vanguard and Bloomberg is solely for the benefit of Vanguard and Bloomberg and not forthe benefit of the owners of the Tax-Managed Balanced Fund, investors or other third parties.
NEITHER BLOOMBERG NOR BARCLAYS SHALL HAVE ANY LIABILITY TO THE ISSUER, INVESTORS OR TO OTHER THIRDPARTIES FOR THE QUALITY, ACCURACY AND/OR COMPLETENESS OF THE BLOOMBERG BARCLAYS INDEX OR ANYDATA INCLUDED THEREIN OR FOR INTERRUPTIONS IN THE DELIVERY OF THE BLOOMBERG BARCLAYS INDEX. NEITHERBLOOMBERG NOR BARCLAYS MAKES ANY WARRANTY, EXPRESS OR IMPLIED, AS TO RESULTS TO BE OBTAINED BYTHE ISSUER, THE INVESTORS OR ANY OTHER PERSON OR ENTITY FROM THE USE OF THE BLOOMBERG BARCLAYSINDEX OR ANY DATA INCLUDED THEREIN. NEITHER BLOOMBERG NOR BARCLAYS MAKES ANY EXPRESS OR IMPLIEDWARRANTIES, AND EACH HEREBY EXPRESSLY DISCLAIMS ALL WARRANTIES OF MERCHANTABILITY OR FITNESS FORA PARTICULAR PURPOSE OR USE WITH RESPECT TO THE BLOOMBERG BARCLAYS INDEX OR ANY DATA INCLUDEDTHEREIN. BLOOMBERG RESERVES THE RIGHT TO CHANGE THE METHODS OF CALCULATION OR PUBLICATION, OR TOCEASE THE CALCULATION OR PUBLICATION OF THE BLOOMBERG BARCLAYS INDEX, AND NEITHER BLOOMBERG NORBARCLAYS SHALL BE LIABLE FOR ANY MISCALCULATION OF OR ANY INCORRECT, DELAYED OR INTERRUPTEDPUBLICATION WITH RESPECT TO ANY OF THE BLOOMBERG BARCLAYS INDEX. NEITHER BLOOMBERG NOR BARCLAYSSHALL BE LIABLE FOR ANY DAMAGES, INCLUDING, WITHOUT LIMITATION, ANY SPECIAL, INDIRECT ORCONSEQUENTIAL DAMAGES, OR ANY LOST PROFITS AND EVEN IF ADVISED OF THE POSSIBILITY OF SUCH, RESULTINGFROM THE USE OF THE BLOOMBERG BARCLAYS INDEX OR ANY DATA INCLUDED THEREIN OR WITH RESPECT TO THETAX-MANAGED BALANCED FUND.
None of the information supplied by Bloomberg or Barclays and used in this publication may be reproduced in anymanner without the prior written permission of both Bloomberg and Barclays Capital, the investment banking division ofBarclays Bank Plc. Barclays Bank Plc is registered in England No. 1026167. Registered office 1 Churchill Place LondonE14 5HP.
© 2021 Bloomberg. Used with Permission.
Source: Bloomberg Index Services Limited. Copyright 2021, Bloomberg. All rights reserved.
129

This page intentionally left blank.

The trustees of your mutual fund are there to see that the fund is operated and managed in yourbest interests since, as a shareholder, you are a part owner of the fund. Your fund’s trustees alsoserve on the board of directors of The Vanguard Group, Inc., which is owned by the Vanguard fundsand provides services to them.
A majority of Vanguard’s board members are independent, meaning that they have no affiliationwith Vanguard or the funds they oversee, apart from the sizable personal investments they havemade as private individuals. The independent board members have distinguished backgrounds inbusiness, academia, and public service. Each of the trustees and executive officers oversees 211Vanguard funds.
Information for each trustee and executive officer of the fund appears below. That information, aswell as the Vanguard fund count, is as of the date on the cover of this fund report. The mailingaddress of the trustees and officers is P.O. Box 876, Valley Forge, PA 19482. More informationabout the trustees is in the Statement of Additional Information, which can be obtained, withoutcharge, by contacting Vanguard at 800-662-7447, or online at vanguard.com.
Interested Trustee1
Mortimer J. BuckleyBorn in 1969. Trustee since January 2018. Principaloccupation(s) during the past five years and otherexperience: chairman of the board (2019–present) ofVanguard and of each of the investment companiesserved by Vanguard; chief executive officer(2018–present) of Vanguard; chief executive officer,president, and trustee (2018–present) of each of theinvestment companies served by Vanguard; presidentand director (2017–present) of Vanguard; andpresident (2018–present) of Vanguard MarketingCorporation. Chief investment officer (2013–2017),managing director (2002–2017), head of the RetailInvestor Group (2006–2012), and chief informationofficer (2001–2006) of Vanguard. Chairman of theboard (2011–2017) and trustee (2009–2017) of theChildren’s Hospital of Philadelphia; and trustee(2018–present) and vice chair (2019–present) of TheShipley School.
Independent Trustees
Emerson U. FullwoodBorn in 1948. Trustee since January 2008. Principaloccupation(s) during the past five years and otherexperience: executive chief staff and marketingofficer for North America and corporate vice president(retired 2008) of Xerox Corporation (documentmanagement products and services). Formerpresident of theWorldwide Channels Group, LatinAmerica, andWorldwide Customer Service andexecutive chief staff officer of Developing Markets ofXerox. Executive in residence and 2009–2010Distinguished Minett Professor at the RochesterInstitute of Technology. Director of SPX FLOW, Inc.(multi-industry manufacturing). Director of theUniversity of Rochester Medical Center, the MonroeCommunity College Foundation, the UnitedWay ofRochester, North Carolina A&T University, andRobertsWesleyan College. Trustee of the Universityof Rochester.
Amy GutmannBorn in 1949. Trustee since June 2006. Principaloccupation(s) during the past five years and otherexperience: president (2004–present) of theUniversity of Pennsylvania. Christopher H. BrowneDistinguished Professor of Political Science, School ofArts and Sciences, and professor of communication,Annenberg School for Communication, withsecondary faculty appointments in the Department ofPhilosophy, School of Arts and Sciences, and at theGraduate School of Education, University ofPennsylvania.
1 Mr. Buckley is considered “interested person,” as defined in the Investment Company Act of 1940, because he is an officer of theVanguard funds.
The People Who Govern Your Fund

F. Joseph LoughreyBorn in 1949. Trustee since October 2009. Principaloccupation(s) during the past five years and otherexperience: president and chief operating officer(retired 2009) and vice chairman of the board(2008–2009) of Cummins Inc. (industrial machinery).Chairman of the board of Hillenbrand, Inc. (specializedconsumer services) and the Lumina Foundation.Director of the V Foundation. Member of the advisorycouncil for the College of Arts and Letters and chair ofthe advisory board to the Kellogg Institute forInternational Studies, both at the University of NotreDame.
Mark LoughridgeBorn in 1953. Trustee since March 2012. Principaloccupation(s) during the past five years and otherexperience: senior vice president and chief financialofficer (retired 2013) of IBM (information technologyservices). Fiduciary member of IBM’s RetirementPlan Committee (2004–2013), senior vice presidentand general manager (2002–2004) of IBM GlobalFinancing, vice president and controller (1998–2002)of IBM, and a variety of other prior management rolesat IBM. Member of the Council on Chicago Booth.
Scott C. MalpassBorn in 1962. Trustee since March 2012. Principaloccupation(s) during the past five years and otherexperience: chief investment officer (retired June2020) and vice president (retired June 2020) of theUniversity of Notre Dame. Assistant professor offinance at the Mendoza College of Business,University of Notre Dame, and member of the NotreDame 403(b) Investment Committee (retired June2020). Member of the board of Catholic InvestmentServices, Inc. (investment advisors) and the board ofsuperintendence of the Institute for theWorks ofReligion.
Deanna MulliganBorn in 1963. Trustee since January 2018. Principaloccupation(s) during the past five years and otherexperience: board chair (2020–present), chiefexecutive officer (2011–2020), and president(2010–2019) of The Guardian Life Insurance Companyof America. Chief operating officer (2010–2011) andexecutive vice president (2008–2010) of the individuallife and disability division of Guardian Life. Member ofthe board of the American Council of Life Insurersand the board of the Economic Club of New York.Trustee of the Partnership for New York City(business leadership), Chief Executives for CorporatePurpose, NewYork-Presbyterian Hospital, Catalyst,and the Bruce Museum (arts and science). Memberof the Advisory Council for the Stanford GraduateSchool of Business.
André F. PeroldBorn in 1952. Trustee since December 2004. Principaloccupation(s) during the past five years and otherexperience: George Gund Professor of Finance andBanking, Emeritus at the Harvard Business School(retired 2011). Chief investment officer andco-managing partner of HighVista Strategies (privateinvestment firm). Member of the board of advisorsand member of the investment committee of theMuseum of Fine Arts Boston. Member of the board(2018–present) of RIT Capital Partners (investmentfirm). Member of the investment committee ofPartners Health Care System.
Sarah Bloom RaskinBorn in 1961. Trustee since January 2018. Principaloccupation(s) during the past five years and otherexperience: deputy secretary (2014–2017) of theUnited States Department of theTreasury. Governor(2010–2014) of the Federal Reserve Board.Commissioner (2007–2010) of financial regulation forthe State of Maryland. Member of the board ofdirectors (2012–2014) of Neighborhood ReinvestmentCorporation. Director (2017–present) of i(x)Investments, LLC; director (2017–present) of ReserveTrust. Rubenstein Fellow (2017–present) of DukeUniversity; trustee (2017–present) of AmherstCollege, and trustee (2019–present) of the FolgerShakespeare Library.
Peter F. VolanakisBorn in 1955. Trustee since July 2009. Principaloccupation(s) during the past five years and otherexperience: president and chief operating officer(retired 2010) of Corning Incorporated(communications equipment) and director of CorningIncorporated (2000–2010) and Dow Corning(2001–2010). Director (2012) of SPX Corporation(multi-industry manufacturing). Overseer of the AmosTuck School of Business Administration, DartmouthCollege (2001–2013). Chairman of the board oftrustees of Colby-Sawyer College. Member of theboard of Hypertherm Inc. (industrial cutting systems,software, and consumables).
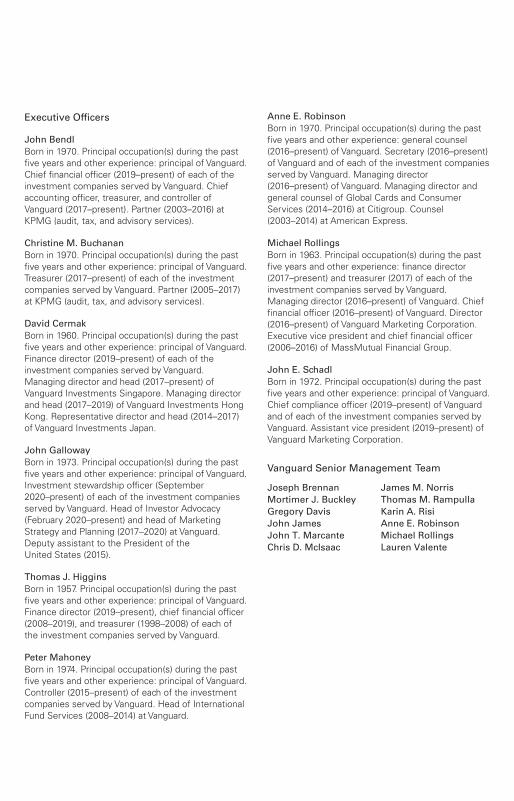
Executive Officers
John BendlBorn in 1970. Principal occupation(s) during the pastfive years and other experience: principal of Vanguard.Chief financial officer (2019–present) of each of theinvestment companies served by Vanguard. Chiefaccounting officer, treasurer, and controller ofVanguard (2017–present). Partner (2003–2016) atKPMG (audit, tax, and advisory services).
Christine M. BuchananBorn in 1970. Principal occupation(s) during the pastfive years and other experience: principal of Vanguard.Treasurer (2017–present) of each of the investmentcompanies served by Vanguard. Partner (2005–2017)at KPMG (audit, tax, and advisory services).
David CermakBorn in 1960. Principal occupation(s) during the pastfive years and other experience: principal of Vanguard.Finance director (2019–present) of each of theinvestment companies served by Vanguard.Managing director and head (2017–present) ofVanguard Investments Singapore. Managing directorand head (2017–2019) of Vanguard Investments HongKong. Representative director and head (2014–2017)of Vanguard Investments Japan.
John GallowayBorn in 1973. Principal occupation(s) during the pastfive years and other experience: principal of Vanguard.Investment stewardship officer (September2020–present) of each of the investment companiesserved by Vanguard. Head of Investor Advocacy(February 2020–present) and head of MarketingStrategy and Planning (2017–2020) at Vanguard.Deputy assistant to the President of theUnited States (2015).
Thomas J. HigginsBorn in 1957. Principal occupation(s) during the pastfive years and other experience: principal of Vanguard.Finance director (2019–present), chief financial officer(2008–2019), and treasurer (1998–2008) of each ofthe investment companies served by Vanguard.
Peter MahoneyBorn in 1974. Principal occupation(s) during the pastfive years and other experience: principal of Vanguard.Controller (2015–present) of each of the investmentcompanies served by Vanguard. Head of InternationalFund Services (2008–2014) at Vanguard.
Anne E. RobinsonBorn in 1970. Principal occupation(s) during the pastfive years and other experience: general counsel(2016–present) of Vanguard. Secretary (2016–present)of Vanguard and of each of the investment companiesserved by Vanguard. Managing director(2016–present) of Vanguard. Managing director andgeneral counsel of Global Cards and ConsumerServices (2014–2016) at Citigroup. Counsel(2003–2014) at American Express.
Michael RollingsBorn in 1963. Principal occupation(s) during the pastfive years and other experience: finance director(2017–present) and treasurer (2017) of each of theinvestment companies served by Vanguard.Managing director (2016–present) of Vanguard. Chieffinancial officer (2016–present) of Vanguard. Director(2016–present) of Vanguard Marketing Corporation.Executive vice president and chief financial officer(2006–2016) of MassMutual Financial Group.
John E. SchadlBorn in 1972. Principal occupation(s) during the pastfive years and other experience: principal of Vanguard.Chief compliance officer (2019–present) of Vanguardand of each of the investment companies served byVanguard. Assistant vice president (2019–present) ofVanguard Marketing Corporation.
Vanguard Senior Management Team
Joseph Brennan James M. NorrisMortimer J. Buckley Thomas M. RampullaGregory Davis Karin A. RisiJohn James Anne E. RobinsonJohn T. Marcante Michael RollingsChris D. McIsaac Lauren Valente

Connect withVanguard® > vanguard.com
Fund Information > 800-662-7447
Direct Investor Account Services > 800-662-2739
Institutional Investor Services > 800-523-1036
TextTelephone for PeopleWhoAre Deaf or Hard of Hearing > 800-749-7273
This material may be used in conjunctionwith the offering of shares of any Vanguardfund only if preceded or accompanied bythe fund’s current prospectus.
All comparative mutual fund data are from Morningstar,Inc., unless otherwise noted.
You can obtain a free copy of Vanguard’s proxy votingguidelines by visiting vanguard.com/proxyreporting or bycalling Vanguard at 800-662-2739. The guidelines arealso available from the SEC’s website, www.sec.gov. Inaddition, you may obtain a free report on how your fundvoted the proxies for securities it owned during the 12months ended June 30. To get the report, visit eithervanguard.com/proxyreporting or www.sec.gov.
You can review information about your fund on the SEC’swebsite, and you can receive copies of this information,for a fee, by sending a request via email addressed [email protected].
© 2021 The Vanguard Group, Inc.All rights reserved.Vanguard Marketing Corporation, Distributor.
Q1030 022021