vanguard u.s. stock etfs prospectusvanguard u.s. stock etfs prospectus april 28, 2020...
TRANSCRIPT

Vanguard U.S. Stock ETFsProspectus
April 28, 2020
Exchange-traded fund shares that are not individually redeemable and arelisted on NYSE Arca
Vanguard Total Stock Market Index Fund ETF Shares (VTI)
Vanguard Extended Market Index Fund ETF Shares (VXF)
Vanguard Large-Cap Index Fund ETF Shares (VV)
Vanguard Mid-Cap Index Fund ETF Shares (VO)
Vanguard Small-Cap Index Fund ETF Shares (VB)
Vanguard Value Index Fund ETF Shares (VTV)
Vanguard Mid-Cap Value Index Fund ETF Shares (VOE)
Vanguard Small-Cap Value Index Fund ETF Shares (VBR)
Vanguard Growth Index Fund ETF Shares (VUG)
Vanguard Mid-Cap Growth Index Fund ETF Shares (VOT)
Vanguard Small-Cap Growth Index Fund ETF Shares (VBK)
See the inside front cover for important information about access to yourfund’s annual and semiannual shareholder reports.
This prospectus contains financial data for the Funds through the fiscal year ended December 31, 2019.
The Securities and Exchange Commission (SEC) has not approved or disapproved thesesecurities or passed upon the adequacy of this prospectus. Any representation to the contrary isa criminal offense.

Important information about access to shareholder reports
Beginning on January 1, 2021, as permitted by regulations adopted by theSEC, paper copies of your fund’s annual and semiannual shareholder reportswill no longer be sent to you by mail, unless you specifically request them.Instead, you will be notified by mail each time a report is posted on thewebsite and will be provided with a link to access the report.
If you have already elected to receive shareholder reports electronically, youwill not be affected by this change and do not need to take any action. You mayelect to receive shareholder reports and other communications from the fundelectronically by contacting your financial intermediary (such as a broker-dealeror bank) or, if you invest directly with the fund, by calling Vanguard at one ofthe phone numbers on the back cover of this prospectus or by logging on tovanguard.com.
You may elect to receive paper copies of all future shareholder reports free ofcharge. If you invest through a financial intermediary, you can contact theintermediary to request that you continue to receive paper copies. If you investdirectly with the fund, you can call Vanguard at one of the phone numbers onthe back cover of this prospectus or log on to vanguard.com. Your election toreceive paper copies will apply to all the funds you hold through anintermediary or directly with Vanguard.
Contents
Total Stock Market ETF 1
Extended Market ETF 6
Large-Cap ETF 11
Mid-Cap ETF 16
Small-Cap ETF 21
Value ETF 26
Mid-Cap Value ETF 31
Small-Cap Value ETF 36
Growth ETF 41
Mid-Cap Growth ETF 47
Small-Cap Growth ETF 52
Investing in Vanguard ETF®
Shares 57
Investing in Index Funds 59
More on the Funds and ETF Shares 60
The Funds and Vanguard 69
Investment Advisor 69
Dividends, Capital Gains, and Taxes 71
Share Price and Market Price 73
Additional Information 75
Financial Highlights 77
Glossary of Investment Terms 89

Vanguard Total Stock Market ETF
Investment ObjectiveThe Fund seeks to track the performance of a benchmark index that measuresthe investment return of the overall stock market.
Fees and ExpensesThe following table describes the fees and expenses you may pay if you buy andhold ETF Shares of the Fund.
Shareholder Fees(Fees paid directly from your investment)
Transaction Fee on Purchases and Sales None through Vanguard (Broker fees vary)Transaction Fee on Reinvested Dividends None through Vanguard (Broker fees vary)Transaction Fee on Conversion to ETF Shares None through Vanguard (Broker fees vary)
Annual Fund Operating Expenses(Expenses that you pay each year as a percentage of the value of your investment)
Management Fees 0.02%12b-1 Distribution Fee NoneOther Expenses 0.01%Total Annual Fund Operating Expenses 0.03%
Example
The following example is intended to help you compare the cost of investing inthe Fund’s ETF Shares with the cost of investing in other funds. It illustrates thehypothetical expenses that you would incur over various periods if you were toinvest $10,000 in the Fund’s shares. This example assumes that the sharesprovide a return of 5% each year and that total annual fund operating expensesremain as stated in the preceding table. You would incur these hypotheticalexpenses whether or not you were to sell your shares at the end of the givenperiod. Although your actual costs may be higher or lower, based on theseassumptions your costs would be:
1 Year 3 Years 5 Years 10 Years$3 $10 $17 $39
This example does not include the brokerage commissions that you may pay tobuy and sell ETF Shares of the Fund.
1

Portfolio Turnover
The Fund pays transaction costs, such as commissions, when it buys and sellssecurities (or “turns over” its portfolio). A higher portfolio turnover rate mayindicate higher transaction costs and may result in more taxes when Fundshares are held in a taxable account. These costs, which are not reflected inannual fund operating expenses or in the previous expense example, reduce theFund’s performance. During the most recent fiscal year, the Fund’s portfolioturnover rate was 4% of the average value of its portfolio.
Principal Investment StrategiesThe Fund employs an indexing investment approach designed to track theperformance of the CRSP US Total Market Index, which representsapproximately 100% of the investable U.S. stock market and includes large-,mid-, small-, and micro-cap stocks. The Fund invests by sampling the Index,meaning that it holds a broadly diversified collection of securities that, in theaggregate, approximates the full Index in terms of key characteristics. These keycharacteristics include industry weightings and market capitalization, as well ascertain financial measures, such as price/earnings ratio and dividend yield.
Principal RisksAn investment in the Fund could lose money over short or long periods of time.You should expect the Fund’s share price and total return to fluctuate within awide range. The Fund is subject to the following risks, which could affect theFund’s performance:
• Stock market risk, which is the chance that stock prices overall will decline.Stock markets tend to move in cycles, with periods of rising prices and periodsof falling prices. In addition, the Fund’s target index may, at times, becomefocused in stocks of a particular market sector, which would subject the Fund toproportionately higher exposure to the risks of that sector.
• Index sampling risk, which is the chance that the securities selected for theFund, in the aggregate, will not provide investment performance matching thatof the Fund‘s target index. Index sampling risk for the Fund is expected tobe low.
Because ETF Shares are traded on an exchange, they are subject toadditional risks:
• The Fund’s ETF Shares are listed for trading on NYSE Arca and are bought andsold on the secondary market at market prices. Although it is expected that themarket price of an ETF Share typically will approximate its net asset value (NAV),there may be times when the market price and the NAV differ significantly. Thus,
2

you may pay more or less than NAV when you buy ETF Shares on the secondarymarket, and you may receive more or less than NAV when you sell those shares.
• Although the Fund’s ETF Shares are listed for trading on NYSE Arca, it ispossible that an active trading market may not be maintained.
• Trading of the Fund’s ETF Shares may be halted by the activation of individualor marketwide trading halts (which halt trading for a specific period of time whenthe price of a particular security or overall market prices decline by a specifiedpercentage). Trading of the Fund’s ETF Shares may also be halted if (1) theshares are delisted from NYSE Arca without first being listed on anotherexchange or (2) NYSE Arca officials determine that such action is appropriate inthe interest of a fair and orderly market or for the protection of investors.
An investment in the Fund is not a deposit of a bank and is not insured orguaranteed by the Federal Deposit Insurance Corporation or any othergovernment agency.
Annual Total ReturnsThe following bar chart and table are intended to help you understand the risksof investing in the Fund. The bar chart shows how the performance of the Fund‘sETF Shares (based on NAV) has varied from one calendar year to another overthe periods shown. The table shows how the average annual total returns of theETF Shares compare with those of the Fund’s target index and othercomparative indexes, which have investment characteristics similar to those ofthe Fund. The Spliced Total Stock Market Index reflects the performance of theMSCI US Broad Market Index through June 2, 2013, and the CRSP US TotalMarket Index thereafter. Keep in mind that the Fund’s past performance (beforeand after taxes) does not indicate how the Fund will perform in the future.Updated performance information is available on our website atvanguard.com/performance or by calling Vanguard toll-free at 800-662-7447.
3

Annual Total Returns — Vanguard Total Stock Market Index Fund ETF Shares
2010 2011 2012 2013 2014 2015 2016 2017 2018 2019
0%10%20%30%40%50%
-10%-20%
17.26
1.06
16.41
33.51
12.56
0.40
12.6821.16
–5.13
30.80
During the periods shown in the bar chart, the highest and lowest returns for acalendar quarter were:
Total Return QuarterHighest 14.03% March 31, 2019Lowest -15.23% September 30, 2011
Average Annual Total Returns for Periods Ended December 31, 2019
1 Year 5 Years 10 YearsVanguard Total Stock Market Index Fund ETF Shares
Based on NAVReturn Before Taxes 30.80% 11.21% 13.43%Return After Taxes on Distributions 30.19 10.68 12.95Return After Taxes on Distributions and Sale of Fund Shares 18.57 8.80 11.17Based on Market PriceReturn Before Taxes 30.80 11.20 13.42Comparative Indexes(reflect no deduction for fees, expenses, or taxes)MSCI US Broad Market Index 31.07% 11.26% 13.48%Spliced Total Stock Market Index 30.84 11.21 13.44CRSP US Total Market Index 30.84 11.21 —
Actual after-tax returns depend on your tax situation and may differ from thoseshown in the preceding table. When after-tax returns are calculated, it isassumed that the shareholder was in the highest individual federal marginalincome tax bracket at the time of each distribution of income or capital gains orupon redemption. State and local income taxes are not reflected in thecalculations. Please note that after-tax returns are not relevant for a shareholderwho holds fund shares in a tax-deferred account, such as an individual retirementaccount or a 401(k) plan. Also, figures captioned Return After Taxes on
4
Distributions and Sale of Fund Shares may be higher than other figures for thesame period if a capital loss occurs upon redemption and results in an assumedtax deduction for the shareholder.
Investment AdvisorThe Vanguard Group, Inc. (Vanguard)
Portfolio Managers
Walter Nejman, Portfolio Manager at Vanguard. He has co-managed the Fundsince 2016.
Gerard C. O’Reilly, Principal of Vanguard. He has managed the Fund since 2001(co-managed since 2016).
Purchase and Sale of Fund SharesYou can buy and sell ETF Shares of the Fund through a brokerage firm. The priceyou pay or receive for ETF Shares will be the prevailing market price, which maybe more or less than the NAV of the shares. The brokerage firm may charge youa commission to execute the transaction. Unless imposed by your brokeragefirm, there is no minimum dollar amount you must invest and no minimumnumber of shares you must buy. ETF Shares of the Fund cannot be directlypurchased from or redeemed with the Fund, except by certain authorizedbroker-dealers. These broker-dealers may purchase and redeem ETF Shares onlyin large blocks (Creation Units), typically in exchange for baskets of securities.
Tax InformationThe Fund’s distributions may be taxable as ordinary income or capital gain. If youare investing through a tax-advantaged account, such as an IRA or anemployer-sponsored retirement or savings plan, special tax rules apply.
Payments to Financial IntermediariesThe Fund and its investment advisor do not pay financial intermediaries for salesof Fund shares.
5
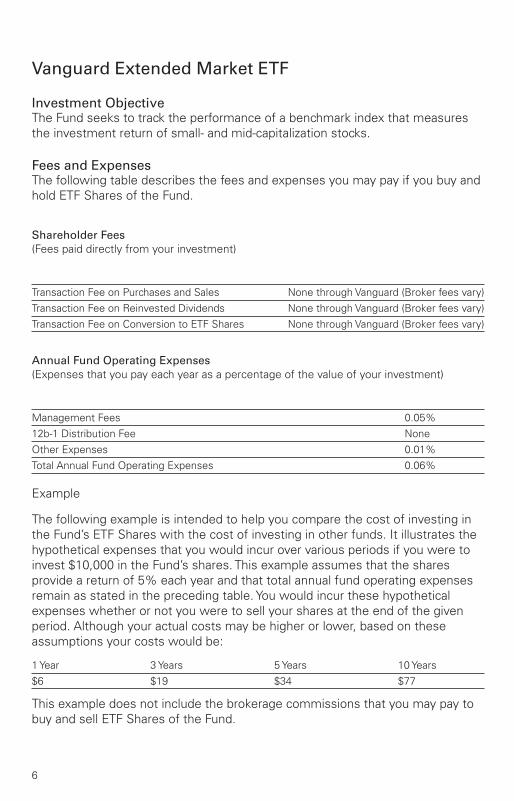
Vanguard Extended Market ETF
Investment ObjectiveThe Fund seeks to track the performance of a benchmark index that measuresthe investment return of small- and mid-capitalization stocks.
Fees and ExpensesThe following table describes the fees and expenses you may pay if you buy andhold ETF Shares of the Fund.
Shareholder Fees(Fees paid directly from your investment)
Transaction Fee on Purchases and Sales None through Vanguard (Broker fees vary)Transaction Fee on Reinvested Dividends None through Vanguard (Broker fees vary)Transaction Fee on Conversion to ETF Shares None through Vanguard (Broker fees vary)
Annual Fund Operating Expenses(Expenses that you pay each year as a percentage of the value of your investment)
Management Fees 0.05%12b-1 Distribution Fee NoneOther Expenses 0.01%Total Annual Fund Operating Expenses 0.06%
Example
The following example is intended to help you compare the cost of investing inthe Fund’s ETF Shares with the cost of investing in other funds. It illustrates thehypothetical expenses that you would incur over various periods if you were toinvest $10,000 in the Fund’s shares. This example assumes that the sharesprovide a return of 5% each year and that total annual fund operating expensesremain as stated in the preceding table. You would incur these hypotheticalexpenses whether or not you were to sell your shares at the end of the givenperiod. Although your actual costs may be higher or lower, based on theseassumptions your costs would be:
1 Year 3 Years 5 Years 10 Years$6 $19 $34 $77
This example does not include the brokerage commissions that you may pay tobuy and sell ETF Shares of the Fund.
6

Portfolio Turnover
The Fund pays transaction costs, such as commissions, when it buys and sellssecurities (or “turns over” its portfolio). A higher portfolio turnover rate mayindicate higher transaction costs and may result in more taxes when Fundshares are held in a taxable account. These costs, which are not reflected inannual fund operating expenses or in the previous expense example, reduce theFund’s performance. During the most recent fiscal year, the Fund’s portfolioturnover rate was 13% of the average value of its portfolio.
Principal Investment StrategiesThe Fund employs an indexing investment approach designed to track theperformance of the Standard & Poor‘s Completion Index, a broadly diversifiedindex of stocks of small and mid-size U.S. companies. The S&P Completion Indexcontains all of the U.S. common stocks regularly traded on the New York StockExchange and the Nasdaq over-the-counter market, except those stocks includedin the S&P 500 Index. The Fund invests by sampling the Index, meaning that itholds a broadly diversified collection of securities that, in the aggregate,approximates the full Index in terms of key characteristics. These characteristicsinclude industry weightings and market capitalization, as well as certain financialmeasures, such as price/earnings ratio and dividend yield.
Principal RisksAn investment in the Fund could lose money over short or long periods of time.You should expect the Fund’s share price and total return to fluctuate within awide range. The Fund is subject to the following risks, which could affect theFund’s performance:
• Stock market risk, which is the chance that stock prices overall will decline.Stock markets tend to move in cycles, with periods of rising prices and periodsof falling prices. The Fund’s target index tracks a subset of the U.S. stock market,which could cause the Fund to perform differently from the overall stock market.In addition, the Fund’s target index may, at times, become focused in stocks of aparticular market sector, which would subject the Fund to proportionately higherexposure to the risks of that sector.
• Investment style risk, which is the chance that returns from small- andmid-capitalization stocks will trail returns from the overall stock market.Historically, small- and mid-cap stocks have been more volatile in price than thelarge-cap stocks that dominate the overall market, and they often perform quitedifferently. The stock prices of small and mid-size companies tend to experiencegreater volatility because, among other things, these companies tend to be moresensitive to changing economic conditions.
7

• Index sampling risk, which is the chance that the securities selected for theFund, in the aggregate, will not provide investment performance matching thatof the Fund‘s target index. Index sampling risk for the Fund is expected tobe low.
Because ETF Shares are traded on an exchange, they are subject toadditional risks:
• The Fund’s ETF Shares are listed for trading on NYSE Arca and are bought andsold on the secondary market at market prices. Although it is expected that themarket price of an ETF Share typically will approximate its net asset value (NAV),there may be times when the market price and the NAV differ significantly. Thus,you may pay more or less than NAV when you buy ETF Shares on the secondarymarket, and you may receive more or less than NAV when you sell those shares.
• Although the Fund’s ETF Shares are listed for trading on NYSE Arca, it ispossible that an active trading market may not be maintained.
• Trading of the Fund’s ETF Shares may be halted by the activation of individualor marketwide trading halts (which halt trading for a specific period of time whenthe price of a particular security or overall market prices decline by a specifiedpercentage). Trading of the Fund’s ETF Shares may also be halted if (1) theshares are delisted from NYSE Arca without first being listed on anotherexchange or (2) NYSE Arca officials determine that such action is appropriate inthe interest of a fair and orderly market or for the protection of investors.
An investment in the Fund is not a deposit of a bank and is not insured orguaranteed by the Federal Deposit Insurance Corporation or any othergovernment agency.
Annual Total ReturnsThe following bar chart and table are intended to help you understand the risksof investing in the Fund. The bar chart shows how the performance of the Fund‘sETF Shares (based on NAV) has varied from one calendar year to another overthe periods shown. The table shows how the average annual total returns of theETF Shares compare with those of the Fund’s target index, which haveinvestment characteristics similar to those of the Fund. Keep in mind that theFund’s past performance (before and after taxes) does not indicate how the Fundwill perform in the future. Updated performance information is available on ourwebsite at vanguard.com/performance or by calling Vanguard toll-free at800-662-7447.
8

Annual Total Returns — Vanguard Extended Market Index Fund ETF Shares
2010 2011 2012 2013 2014 2015 2016 2017 2018 2019
0%10%20%30%40%50%
-10%-20%
27.55
–3.61
18.48
38.37
7.55
–3.26
16.16 18.10
–9.37
28.04
During the periods shown in the bar chart, the highest and lowest returns for acalendar quarter were:
Total Return QuarterHighest 15.98% March 31, 2019Lowest -21.00% September 30, 2011
Average Annual Total Returns for Periods Ended December 31, 2019
1 Year 5 Years 10 YearsVanguard Extended Market Index Fund ETF Shares
Based on NAVReturn Before Taxes 28.04% 9.02% 12.81%Return After Taxes on Distributions 27.53 8.57 12.41Return After Taxes on Distributions and Sale of Fund Shares 16.77 6.98 10.61Based on Market PriceReturn Before Taxes 28.06 9.02 12.81Standard & Poor’s Completion Index(reflects no deduction for fees, expenses, or taxes) 27.95% 8.90% 12.71%
Actual after-tax returns depend on your tax situation and may differ from thoseshown in the preceding table. When after-tax returns are calculated, it isassumed that the shareholder was in the highest individual federal marginalincome tax bracket at the time of each distribution of income or capital gains orupon redemption. State and local income taxes are not reflected in thecalculations. Please note that after-tax returns are not relevant for a shareholderwho holds fund shares in a tax-deferred account, such as an individual retirementaccount or a 401(k) plan. Also, figures captioned Return After Taxes onDistributions and Sale of Fund Shares may be higher than other figures for thesame period if a capital loss occurs upon redemption and results in an assumedtax deduction for the shareholder.
9

Investment AdvisorThe Vanguard Group, Inc. (Vanguard)
Portfolio Managers
Donald M. Butler, CFA, Principal of Vanguard. He has managed the Fund since1997 (co-managed since 2016).
William A. Coleman, CFA, Portfolio Manager at Vanguard. He has co-managedthe Fund since 2017.
Purchase and Sale of Fund SharesYou can buy and sell ETF Shares of the Fund through a brokerage firm. The priceyou pay or receive for ETF Shares will be the prevailing market price, which maybe more or less than the NAV of the shares. The brokerage firm may charge youa commission to execute the transaction. Unless imposed by your brokeragefirm, there is no minimum dollar amount you must invest and no minimumnumber of shares you must buy. ETF Shares of the Fund cannot be directlypurchased from or redeemed with the Fund, except by certain authorizedbroker-dealers. These broker-dealers may purchase and redeem ETF Shares onlyin large blocks (Creation Units), typically in exchange for baskets of securities.
Tax InformationThe Fund’s distributions may be taxable as ordinary income or capital gain. If youare investing through a tax-advantaged account, such as an IRA or anemployer-sponsored retirement or savings plan, special tax rules apply.
Payments to Financial IntermediariesThe Fund and its investment advisor do not pay financial intermediaries for salesof Fund shares.
10

Vanguard Large-Cap ETF
Investment ObjectiveThe Fund seeks to track the performance of a benchmark index that measuresthe investment return of large-capitalization stocks.
Fees and ExpensesThe following table describes the fees and expenses you may pay if you buy andhold ETF Shares of the Fund.
Shareholder Fees(Fees paid directly from your investment)
Transaction Fee on Purchases and Sales None through Vanguard (Broker fees vary)Transaction Fee on Reinvested Dividends None through Vanguard (Broker fees vary)Transaction Fee on Conversion to ETF Shares None through Vanguard (Broker fees vary)
Annual Fund Operating Expenses(Expenses that you pay each year as a percentage of the value of your investment)
Management Fees 0.03%12b-1 Distribution Fee NoneOther Expenses 0.01%Total Annual Fund Operating Expenses 0.04%
Example
The following example is intended to help you compare the cost of investing inthe Fund’s ETF Shares with the cost of investing in other funds. It illustrates thehypothetical expenses that you would incur over various periods if you were toinvest $10,000 in the Fund’s shares. This example assumes that the sharesprovide a return of 5% each year and that total annual fund operating expensesremain as stated in the preceding table. You would incur these hypotheticalexpenses whether or not you were to sell your shares at the end of the givenperiod. Although your actual costs may be higher or lower, based on theseassumptions your costs would be:
1 Year 3 Years 5 Years 10 Years$4 $13 $23 $51
This example does not include the brokerage commissions that you may pay tobuy and sell ETF Shares of the Fund.
11

Portfolio Turnover
The Fund pays transaction costs, such as commissions, when it buys and sellssecurities (or “turns over” its portfolio). A higher portfolio turnover rate mayindicate higher transaction costs and may result in more taxes when Fundshares are held in a taxable account. These costs, which are not reflected inannual fund operating expenses or in the previous expense example, reduce theFund’s performance. During the most recent fiscal year, the Fund’s portfolioturnover rate was 5% of the average value of its portfolio.
Principal Investment StrategiesThe Fund employs an indexing investment approach designed to track theperformance of the CRSP US Large Cap Index, a broadly diversified index oflarge U.S. companies representing approximately the top 85% of the U.S.market capitalization. The Fund attempts to replicate the target index by investingall, or substantially all, of its assets in the stocks that make up the Index, holdingeach stock in approximately the same proportion as its weighting in the Index.
Principal RisksAn investment in the Fund could lose money over short or long periods of time.You should expect the Fund’s share price and total return to fluctuate within awide range. The Fund is subject to the following risks, which could affect theFund’s performance:
• Stock market risk, which is the chance that stock prices overall will decline.Stock markets tend to move in cycles, with periods of rising prices and periodsof falling prices. The Fund’s target index tracks a subset of the U.S. stock market,which could cause the Fund to perform differently from the overall stock market.In addition, the Fund’s target index may, at times, become focused in stocks of aparticular market sector, which would subject the Fund to proportionately higherexposure to the risks of that sector.
• Investment style risk, which is the chance that returns from large-capitalizationstocks will trail returns from the overall stock market. Large-cap stocks tend togo through cycles of doing better—or worse—than other segments of the stockmarket or the stock market in general. These periods have, in the past, lasted foras long as several years.
Because ETF Shares are traded on an exchange, they are subject toadditional risks:
• The Fund’s ETF Shares are listed for trading on NYSE Arca and are bought andsold on the secondary market at market prices. Although it is expected that themarket price of an ETF Share typically will approximate its net asset value (NAV),
12

there may be times when the market price and the NAV differ significantly. Thus,you may pay more or less than NAV when you buy ETF Shares on the secondarymarket, and you may receive more or less than NAV when you sell those shares.
• Although the Fund’s ETF Shares are listed for trading on NYSE Arca, it ispossible that an active trading market may not be maintained.
• Trading of the Fund’s ETF Shares may be halted by the activation of individualor marketwide trading halts (which halt trading for a specific period of time whenthe price of a particular security or overall market prices decline by a specifiedpercentage). Trading of the Fund’s ETF Shares may also be halted if (1) theshares are delisted from NYSE Arca without first being listed on anotherexchange or (2) NYSE Arca officials determine that such action is appropriate inthe interest of a fair and orderly market or for the protection of investors.
An investment in the Fund is not a deposit of a bank and is not insured orguaranteed by the Federal Deposit Insurance Corporation or any othergovernment agency.
Annual Total ReturnsThe following bar chart and table are intended to help you understand the risksof investing in the Fund. The bar chart shows how the performance of the Fund‘sETF Shares (based on NAV) has varied from one calendar year to another overthe periods shown. The table shows how the average annual total returns of theETF Shares compare with those of the Fund’s target index and othercomparative indexes, which have investment characteristics similar to those ofthe Fund. The Spliced Large Cap Index reflects the performance of the MSCI USPrime Market 750 Index through January 30, 2013, and the CRSP US Large CapIndex thereafter. Keep in mind that the Fund’s past performance (before and aftertaxes) does not indicate how the Fund will perform in the future. Updatedperformance information is available on our website atvanguard.com/performance or by calling Vanguard toll-free at 800-662-7447.
13

Annual Total Returns — Vanguard Large-Cap Index Fund ETF Shares
2010 2011 2012 2013 2014 2015 2016 2017 2018 2019
0%10%20%30%40%50%
-10%-20%
15.81
1.58
16.09
32.65
13.39
1.0711.65
22.03
–4.44
31.39
During the periods shown in the bar chart, the highest and lowest returns for acalendar quarter were:
Total Return QuarterHighest 13.74% March 31, 2019Lowest -14.40% September 30, 2011
Average Annual Total Returns for Periods Ended December 31, 2019
1 Year 5 Years 10 YearsVanguard Large-Cap Index Fund ETF Shares
Based on NAVReturn Before Taxes 31.39% 11.57% 13.51%Return After Taxes on Distributions 30.77 11.05 13.04Return After Taxes on Distributions and Sale of Fund Shares 18.94 9.11 11.25Based on Market PriceReturn Before Taxes 31.37 11.57 13.51Comparative Indexes(reflect no deduction for fees, expenses, or taxes)MSCI US Prime Market 750 Index 31.65% 11.61% 13.59%Spliced Large Cap Index 31.44 11.61 13.58CRSP US Large Cap Index 31.44 11.61 —
Actual after-tax returns depend on your tax situation and may differ from thoseshown in the preceding table. When after-tax returns are calculated, it isassumed that the shareholder was in the highest individual federal marginalincome tax bracket at the time of each distribution of income or capital gains orupon redemption. State and local income taxes are not reflected in thecalculations. Please note that after-tax returns are not relevant for a shareholderwho holds fund shares in a tax-deferred account, such as an individual retirementaccount or a 401(k) plan. Also, figures captioned Return After Taxes on
14
Distributions and Sale of Fund Shares may be higher than other figures for thesame period if a capital loss occurs upon redemption and results in an assumedtax deduction for the shareholder.
Investment AdvisorThe Vanguard Group, Inc. (Vanguard)
Portfolio Managers
Michael A. Johnson, Portfolio Manager at Vanguard. He has co-managed theFund since 2016.
Walter Nejman, Portfolio Manager at Vanguard. He has co-managed the Fundsince 2016.
Purchase and Sale of Fund SharesYou can buy and sell ETF Shares of the Fund through a brokerage firm. The priceyou pay or receive for ETF Shares will be the prevailing market price, which maybe more or less than the NAV of the shares. The brokerage firm may charge youa commission to execute the transaction. Unless imposed by your brokeragefirm, there is no minimum dollar amount you must invest and no minimumnumber of shares you must buy. ETF Shares of the Fund cannot be directlypurchased from or redeemed with the Fund, except by certain authorizedbroker-dealers. These broker-dealers may purchase and redeem ETF Shares onlyin large blocks (Creation Units), typically in exchange for baskets of securities.
Tax InformationThe Fund’s distributions may be taxable as ordinary income or capital gain. If youare investing through a tax-advantaged account, such as an IRA or anemployer-sponsored retirement or savings plan, special tax rules apply.
Payments to Financial IntermediariesThe Fund and its investment advisor do not pay financial intermediaries for salesof Fund shares.
15
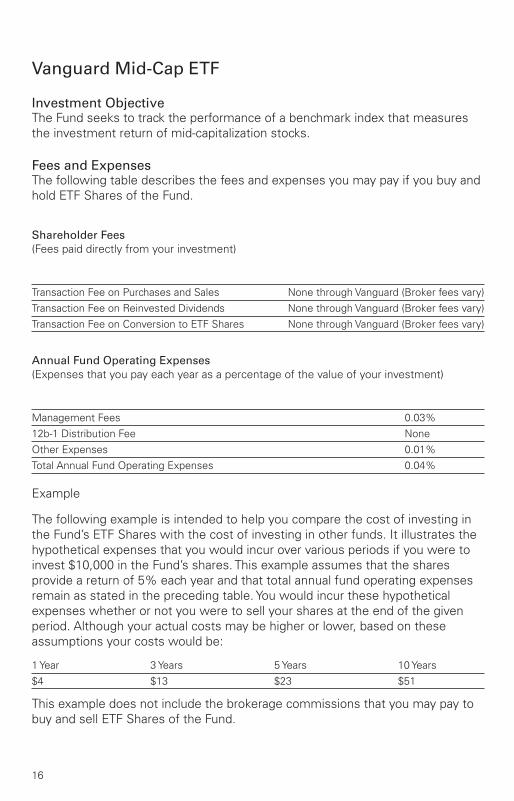
Vanguard Mid-Cap ETF
Investment ObjectiveThe Fund seeks to track the performance of a benchmark index that measuresthe investment return of mid-capitalization stocks.
Fees and ExpensesThe following table describes the fees and expenses you may pay if you buy andhold ETF Shares of the Fund.
Shareholder Fees(Fees paid directly from your investment)
Transaction Fee on Purchases and Sales None through Vanguard (Broker fees vary)Transaction Fee on Reinvested Dividends None through Vanguard (Broker fees vary)Transaction Fee on Conversion to ETF Shares None through Vanguard (Broker fees vary)
Annual Fund Operating Expenses(Expenses that you pay each year as a percentage of the value of your investment)
Management Fees 0.03%12b-1 Distribution Fee NoneOther Expenses 0.01%Total Annual Fund Operating Expenses 0.04%
Example
The following example is intended to help you compare the cost of investing inthe Fund’s ETF Shares with the cost of investing in other funds. It illustrates thehypothetical expenses that you would incur over various periods if you were toinvest $10,000 in the Fund’s shares. This example assumes that the sharesprovide a return of 5% each year and that total annual fund operating expensesremain as stated in the preceding table. You would incur these hypotheticalexpenses whether or not you were to sell your shares at the end of the givenperiod. Although your actual costs may be higher or lower, based on theseassumptions your costs would be:
1 Year 3 Years 5 Years 10 Years$4 $13 $23 $51
This example does not include the brokerage commissions that you may pay tobuy and sell ETF Shares of the Fund.
16

Portfolio Turnover
The Fund pays transaction costs, such as commissions, when it buys and sellssecurities (or “turns over” its portfolio). A higher portfolio turnover rate mayindicate higher transaction costs and may result in more taxes when Fundshares are held in a taxable account. These costs, which are not reflected inannual fund operating expenses or in the previous expense example, reduce theFund’s performance. During the most recent fiscal year, the Fund’s portfolioturnover rate was 15% of the average value of its portfolio.
Principal Investment StrategiesThe Fund employs an indexing investment approach designed to track theperformance of the CRSP US Mid Cap Index, a broadly diversified index ofstocks of mid-size U.S. companies. The Fund attempts to replicate the targetindex by investing all, or substantially all, of its assets in the stocks that make upthe Index, holding each stock in approximately the same proportion as itsweighting in the Index.
Principal RisksAn investment in the Fund could lose money over short or long periods of time.You should expect the Fund’s share price and total return to fluctuate within awide range. The Fund is subject to the following risks, which could affect theFund’s performance:
• Stock market risk, which is the chance that stock prices overall will decline.Stock markets tend to move in cycles, with periods of rising prices and periodsof falling prices. The Fund’s target index tracks a subset of the U.S. stock market,which could cause the Fund to perform differently from the overall stock market.In addition, the Fund’s target index may, at times, become focused in stocks of aparticular market sector, which would subject the Fund to proportionately higherexposure to the risks of that sector.
• Investment style risk, which is the chance that returns from mid-capitalizationstocks will trail returns from the overall stock market. Historically, mid-cap stockshave been more volatile in price than the large-cap stocks that dominate theoverall market, and they often perform quite differently. The stock prices ofmid-size companies tend to experience greater volatility because, among otherthings, these companies tend to be more sensitive to changingeconomic conditions.
Because ETF Shares are traded on an exchange, they are subject toadditional risks:
17

• The Fund’s ETF Shares are listed for trading on NYSE Arca and are bought andsold on the secondary market at market prices. Although it is expected that themarket price of an ETF Share typically will approximate its net asset value (NAV),there may be times when the market price and the NAV differ significantly. Thus,you may pay more or less than NAV when you buy ETF Shares on the secondarymarket, and you may receive more or less than NAV when you sell those shares.
• Although the Fund’s ETF Shares are listed for trading on NYSE Arca, it ispossible that an active trading market may not be maintained.
• Trading of the Fund’s ETF Shares may be halted by the activation of individualor marketwide trading halts (which halt trading for a specific period of time whenthe price of a particular security or overall market prices decline by a specifiedpercentage). Trading of the Fund’s ETF Shares may also be halted if (1) theshares are delisted from NYSE Arca without first being listed on anotherexchange or (2) NYSE Arca officials determine that such action is appropriate inthe interest of a fair and orderly market or for the protection of investors.
An investment in the Fund is not a deposit of a bank and is not insured orguaranteed by the Federal Deposit Insurance Corporation or any othergovernment agency.
Annual Total ReturnsThe following bar chart and table are intended to help you understand the risksof investing in the Fund. The bar chart shows how the performance of the Fund‘sETF Shares (based on NAV) has varied from one calendar year to another overthe periods shown. The table shows how the average annual total returns of theETF Shares compare with those of the Fund’s target index and othercomparative indexes, which have investment characteristics similar to those ofthe Fund. The Spliced Mid Cap Index reflects the performance of the MSCI USMid Cap 450 Index through January 30, 2013, and the CRSP US Mid Cap Indexthereafter. Keep in mind that the Fund’s past performance (before and aftertaxes) does not indicate how the Fund will perform in the future. Updatedperformance information is available on our website atvanguard.com/performance or by calling Vanguard toll-free at 800-662-7447.
18

Annual Total Returns — Vanguard Mid-Cap Index Fund ETF Shares
2010 2011 2012 2013 2014 2015 2016 2017 2018 2019
0%10%20%30%40%50%
-10%-20%
25.57
–1.96
15.98
35.15
13.76
–1.34
11.2319.25
–9.21
31.04
During the periods shown in the bar chart, the highest and lowest returns for acalendar quarter were:
Total Return QuarterHighest 13.74% March 31, 2019Lowest -14.40% September 30, 2011
Average Annual Total Returns for Periods Ended December 31, 2019
1 Year 5 Years 10 YearsVanguard Mid-Cap Index Fund ETF Shares
Based on NAVReturn Before Taxes 31.04% 9.26% 13.08%Return After Taxes on Distributions 30.50 8.82 12.71Return After Taxes on Distributions and Sale of Fund Shares 18.63 7.22 10.89Based on Market PriceReturn Before Taxes 31.07 9.25 13.07Comparative Indexes(reflect no deduction for fees, expenses, or taxes)MSCI US Mid Cap 450 Index 30.61% 10.08% 13.59%Spliced Mid Cap Index 31.09 9.29 13.13CRSP US Mid Cap Index 31.09 9.29 —
Actual after-tax returns depend on your tax situation and may differ from thoseshown in the preceding table. When after-tax returns are calculated, it isassumed that the shareholder was in the highest individual federal marginalincome tax bracket at the time of each distribution of income or capital gains orupon redemption. State and local income taxes are not reflected in thecalculations. Please note that after-tax returns are not relevant for a shareholderwho holds fund shares in a tax-deferred account, such as an individual retirementaccount or a 401(k) plan. Also, figures captioned Return After Taxes on
19

Distributions and Sale of Fund Shares may be higher than other figures for thesame period if a capital loss occurs upon redemption and results in an assumedtax deduction for the shareholder.
Investment AdvisorThe Vanguard Group, Inc. (Vanguard)
Portfolio Managers
Donald M. Butler, CFA, Principal of Vanguard. He has managed the Fund since itsinception in 2004 (co-managed since 2016).
Michael A. Johnson, Portfolio Manager at Vanguard. He has co-managed theFund since 2016.
Purchase and Sale of Fund SharesYou can buy and sell ETF Shares of the Fund through a brokerage firm. The priceyou pay or receive for ETF Shares will be the prevailing market price, which maybe more or less than the NAV of the shares. The brokerage firm may charge youa commission to execute the transaction. Unless imposed by your brokeragefirm, there is no minimum dollar amount you must invest and no minimumnumber of shares you must buy. ETF Shares of the Fund cannot be directlypurchased from or redeemed with the Fund, except by certain authorizedbroker-dealers. These broker-dealers may purchase and redeem ETF Shares onlyin large blocks (Creation Units), typically in exchange for baskets of securities.
Tax InformationThe Fund’s distributions may be taxable as ordinary income or capital gain. If youare investing through a tax-advantaged account, such as an IRA or anemployer-sponsored retirement or savings plan, special tax rules apply.
Payments to Financial IntermediariesThe Fund and its investment advisor do not pay financial intermediaries for salesof Fund shares.
20
Vanguard Small-Cap ETF
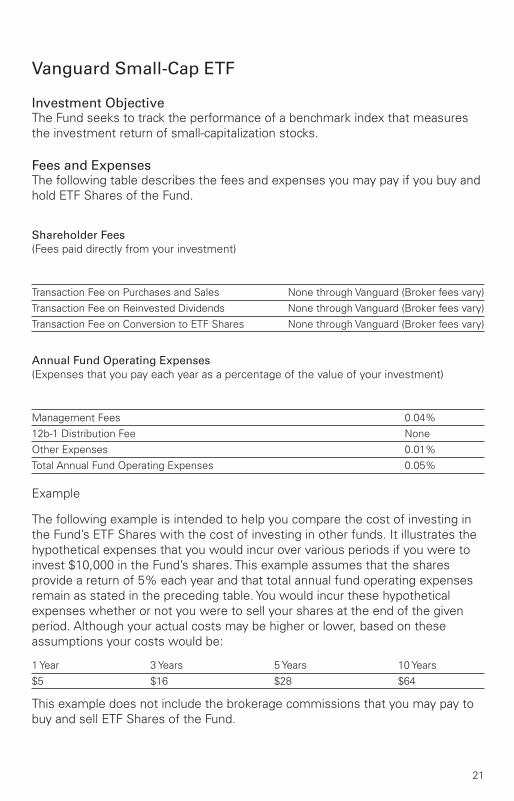
Investment ObjectiveThe Fund seeks to track the performance of a benchmark index that measuresthe investment return of small-capitalization stocks.
Fees and ExpensesThe following table describes the fees and expenses you may pay if you buy andhold ETF Shares of the Fund.
Shareholder Fees(Fees paid directly from your investment)
Transaction Fee on Purchases and Sales None through Vanguard (Broker fees vary)Transaction Fee on Reinvested Dividends None through Vanguard (Broker fees vary)Transaction Fee on Conversion to ETF Shares None through Vanguard (Broker fees vary)
Annual Fund Operating Expenses(Expenses that you pay each year as a percentage of the value of your investment)
Management Fees 0.04%12b-1 Distribution Fee NoneOther Expenses 0.01%Total Annual Fund Operating Expenses 0.05%
Example
The following example is intended to help you compare the cost of investing inthe Fund’s ETF Shares with the cost of investing in other funds. It illustrates thehypothetical expenses that you would incur over various periods if you were toinvest $10,000 in the Fund’s shares. This example assumes that the sharesprovide a return of 5% each year and that total annual fund operating expensesremain as stated in the preceding table. You would incur these hypotheticalexpenses whether or not you were to sell your shares at the end of the givenperiod. Although your actual costs may be higher or lower, based on theseassumptions your costs would be:
1 Year 3 Years 5 Years 10 Years$5 $16 $28 $64
This example does not include the brokerage commissions that you may pay tobuy and sell ETF Shares of the Fund.
21

Portfolio Turnover
The Fund pays transaction costs, such as commissions, when it buys and sellssecurities (or “turns over” its portfolio). A higher portfolio turnover rate mayindicate higher transaction costs and may result in more taxes when Fundshares are held in a taxable account. These costs, which are not reflected inannual fund operating expenses or in the previous expense example, reduce theFund’s performance. During the most recent fiscal year, the Fund’s portfolioturnover rate was 16% of the average value of its portfolio.
Principal Investment StrategiesThe Fund employs an indexing investment approach designed to track theperformance of the CRSP US Small Cap Index, a broadly diversified index ofstocks of small U.S. companies. The Fund attempts to replicate the target indexby investing all, or substantially all, of its assets in the stocks that make up theIndex, holding each stock in approximately the same proportion as its weightingin the Index.
Principal RisksAn investment in the Fund could lose money over short or long periods of time.You should expect the Fund’s share price and total return to fluctuate within awide range. The Fund is subject to the following risks, which could affect theFund’s performance:
• Stock market risk, which is the chance that stock prices overall will decline.Stock markets tend to move in cycles, with periods of rising prices and periodsof falling prices. The Fund’s target index tracks a subset of the U.S. stock market,which could cause the Fund to perform differently from the overall stock market.In addition, the Fund’s target index may, at times, become focused in stocks of aparticular market sector, which would subject the Fund to proportionately higherexposure to the risks of that sector.
• Investment style risk, which is the chance that returns from small-capitalizationstocks will trail returns from the overall stock market. Historically, small-capstocks have been more volatile in price than the large-cap stocks that dominatethe overall market, and they often perform quite differently. The stock prices ofsmall companies tend to experience greater volatility because, among otherthings, these companies tend to be more sensitive to changingeconomic conditions.
Because ETF Shares are traded on an exchange, they are subject toadditional risks:
22

• The Fund’s ETF Shares are listed for trading on NYSE Arca and are bought andsold on the secondary market at market prices. Although it is expected that themarket price of an ETF Share typically will approximate its net asset value (NAV),there may be times when the market price and the NAV differ significantly. Thus,you may pay more or less than NAV when you buy ETF Shares on the secondarymarket, and you may receive more or less than NAV when you sell those shares.
• Although the Fund’s ETF Shares are listed for trading on NYSE Arca, it ispossible that an active trading market may not be maintained.
• Trading of the Fund’s ETF Shares may be halted by the activation of individualor marketwide trading halts (which halt trading for a specific period of time whenthe price of a particular security or overall market prices decline by a specifiedpercentage). Trading of the Fund’s ETF Shares may also be halted if (1) theshares are delisted from NYSE Arca without first being listed on anotherexchange or (2) NYSE Arca officials determine that such action is appropriate inthe interest of a fair and orderly market or for the protection of investors.
An investment in the Fund is not a deposit of a bank and is not insured orguaranteed by the Federal Deposit Insurance Corporation or any othergovernment agency.
Annual Total ReturnsThe following bar chart and table are intended to help you understand the risksof investing in the Fund. The bar chart shows how the performance of the Fund‘sETF Shares (based on NAV) has varied from one calendar year to another overthe periods shown. The table shows how the average annual total returns of theETF Shares compare with those of the Fund’s target index and othercomparative indexes, which have investment characteristics similar to those ofthe Fund. The Spliced Small Cap Index reflects the performance of the MSCI USSmall Cap 1750 Index through January 30, 2013, and the CRSP US Small CapIndex thereafter. Keep in mind that the Fund’s past performance (before and aftertaxes) does not indicate how the Fund will perform in the future. Updatedperformance information is available on our website atvanguard.com/performance or by calling Vanguard toll-free at 800-662-7447.
23

Annual Total Returns — Vanguard Small-Cap Index Fund ETF Shares
2010 2011 2012 2013 2014 2015 2016 2017 2018 2019
0%10%20%30%40%50%
-10%-20%
27.89
–2.68
18.22
37.80
7.51
–3.65
18.31 16.24
–9.30
27.37
During the periods shown in the bar chart, the highest and lowest returns for acalendar quarter were:
Total Return QuarterHighest 16.19% March 31, 2019Lowest -21.40% September 30, 2011
Average Annual Total Returns for Periods Ended December 31, 2019
1 Year 5 Years 10 YearsVanguard Small-Cap Index Fund ETF Shares
Based on NAVReturn Before Taxes 27.37% 8.89% 12.81%Return After Taxes on Distributions 26.84 8.41 12.36Return After Taxes on Distributions and Sale of Fund Shares 16.40 6.86 10.58Based on Market PriceReturn Before Taxes 27.44 8.88 12.82Comparative Indexes(reflect no deduction for fees, expenses, or taxes)MSCI US Small Cap 1750 Index 25.86% 8.31% 12.45%Spliced Small Cap Index 27.35 8.86 12.78CRSP US Small Cap Index 27.35 8.86 —
Actual after-tax returns depend on your tax situation and may differ from thoseshown in the preceding table. When after-tax returns are calculated, it isassumed that the shareholder was in the highest individual federal marginalincome tax bracket at the time of each distribution of income or capital gains orupon redemption. State and local income taxes are not reflected in thecalculations. Please note that after-tax returns are not relevant for a shareholderwho holds fund shares in a tax-deferred account, such as an individual retirementaccount or a 401(k) plan. Also, figures captioned Return After Taxes on
24

Distributions and Sale of Fund Shares may be higher than other figures for thesame period if a capital loss occurs upon redemption and results in an assumedtax deduction for the shareholder.
Investment AdvisorThe Vanguard Group, Inc. (Vanguard)
Portfolio Managers
William A. Coleman, CFA, Portfolio Manager at Vanguard. He has co-managedthe Fund since 2016.
Gerard C. O’Reilly, Principal of Vanguard. He has co-managed the Fundsince 2016.
Purchase and Sale of Fund SharesYou can buy and sell ETF Shares of the Fund through a brokerage firm. The priceyou pay or receive for ETF Shares will be the prevailing market price, which maybe more or less than the NAV of the shares. The brokerage firm may charge youa commission to execute the transaction. Unless imposed by your brokeragefirm, there is no minimum dollar amount you must invest and no minimumnumber of shares you must buy. ETF Shares of the Fund cannot be directlypurchased from or redeemed with the Fund, except by certain authorizedbroker-dealers. These broker-dealers may purchase and redeem ETF Shares onlyin large blocks (Creation Units), typically in exchange for baskets of securities.
Tax InformationThe Fund’s distributions may be taxable as ordinary income or capital gain. If youare investing through a tax-advantaged account, such as an IRA or anemployer-sponsored retirement or savings plan, special tax rules apply.
Payments to Financial IntermediariesThe Fund and its investment advisor do not pay financial intermediaries for salesof Fund shares.
25

Vanguard Value ETF
Investment ObjectiveThe Fund seeks to track the performance of a benchmark index that measuresthe investment return of large-capitalization value stocks.
Fees and ExpensesThe following table describes the fees and expenses you may pay if you buy andhold ETF Shares of the Fund.
Shareholder Fees(Fees paid directly from your investment)
Transaction Fee on Purchases and Sales None through Vanguard (Broker fees vary)Transaction Fee on Reinvested Dividends None through Vanguard (Broker fees vary)Transaction Fee on Conversion to ETF Shares None through Vanguard (Broker fees vary)
Annual Fund Operating Expenses(Expenses that you pay each year as a percentage of the value of your investment)
Management Fees 0.03%12b-1 Distribution Fee NoneOther Expenses 0.01%Total Annual Fund Operating Expenses 0.04%
Example
The following example is intended to help you compare the cost of investing inthe Fund’s ETF Shares with the cost of investing in other funds. It illustrates thehypothetical expenses that you would incur over various periods if you were toinvest $10,000 in the Fund’s shares. This example assumes that the sharesprovide a return of 5% each year and that total annual fund operating expensesremain as stated in the preceding table. You would incur these hypotheticalexpenses whether or not you were to sell your shares at the end of the givenperiod. Although your actual costs may be higher or lower, based on theseassumptions your costs would be:
1 Year 3 Years 5 Years 10 Years$4 $13 $23 $51
This example does not include the brokerage commissions that you may pay tobuy and sell ETF Shares of the Fund.
26

Portfolio Turnover
The Fund pays transaction costs, such as commissions, when it buys and sellssecurities (or “turns over” its portfolio). A higher portfolio turnover rate mayindicate higher transaction costs and may result in more taxes when Fundshares are held in a taxable account. These costs, which are not reflected inannual fund operating expenses or in the previous expense example, reduce theFund’s performance. During the most recent fiscal year, the Fund’s portfolioturnover rate was 12% of the average value of its portfolio.
Principal Investment StrategiesThe Fund employs an indexing investment approach designed to track theperformance of the CRSP US Large Cap Value Index, a broadly diversified indexpredominantly made up of value stocks of large U.S. companies. The Fundattempts to replicate the target index by investing all, or substantially all, of itsassets in the stocks that make up the Index, holding each stock in approximatelythe same proportion as its weighting in the Index.
Principal RisksAn investment in the Fund could lose money over short or long periods of time.You should expect the Fund’s share price and total return to fluctuate within awide range. The Fund is subject to the following risks, which could affect theFund’s performance:
• Stock market risk, which is the chance that stock prices overall will decline.Stock markets tend to move in cycles, with periods of rising prices and periodsof falling prices. The Fund’s target index tracks a subset of the U.S. stock market,which could cause the Fund to perform differently from the overall stock market.In addition, the Fund’s target index may, at times, become focused in stocks of aparticular market sector, which would subject the Fund to proportionately higherexposure to the risks of that sector.
• Investment style risk, which is the chance that returns from large-capitalizationvalue stocks will trail returns from the overall stock market. Large-cap valuestocks tend to go through cycles of doing better—or worse—than othersegments of the stock market or the stock market in general. These periodshave, in the past, lasted for as long as several years.
Because ETF Shares are traded on an exchange, they are subject toadditional risks:
• The Fund’s ETF Shares are listed for trading on NYSE Arca and are bought andsold on the secondary market at market prices. Although it is expected that themarket price of an ETF Share typically will approximate its net asset value (NAV),
27

there may be times when the market price and the NAV differ significantly. Thus,you may pay more or less than NAV when you buy ETF Shares on the secondarymarket, and you may receive more or less than NAV when you sell those shares.
• Although the Fund’s ETF Shares are listed for trading on NYSE Arca, it ispossible that an active trading market may not be maintained.
• Trading of the Fund’s ETF Shares may be halted by the activation of individualor marketwide trading halts (which halt trading for a specific period of time whenthe price of a particular security or overall market prices decline by a specifiedpercentage). Trading of the Fund’s ETF Shares may also be halted if (1) theshares are delisted from NYSE Arca without first being listed on anotherexchange or (2) NYSE Arca officials determine that such action is appropriate inthe interest of a fair and orderly market or for the protection of investors.
An investment in the Fund is not a deposit of a bank and is not insured orguaranteed by the Federal Deposit Insurance Corporation or any othergovernment agency.
Annual Total ReturnsThe following bar chart and table are intended to help you understand the risksof investing in the Fund. The bar chart shows how the performance of the Fund‘sETF Shares (based on NAV) has varied from one calendar year to another overthe periods shown. The table shows how the average annual total returns of theETF Shares compare with those of the Fund’s target index and othercomparative indexes, which have investment characteristics similar to those ofthe Fund. The Spliced Value Index reflects the performance of the MSCI USPrime Market Value Index through April 16, 2013, and the CRSP US Large CapValue Index thereafter. Keep in mind that the Fund’s past performance (beforeand after taxes) does not indicate how the Fund will perform in the future.Updated performance information is available on our website atvanguard.com/performance or by calling Vanguard toll-free at 800-662-7447.
28
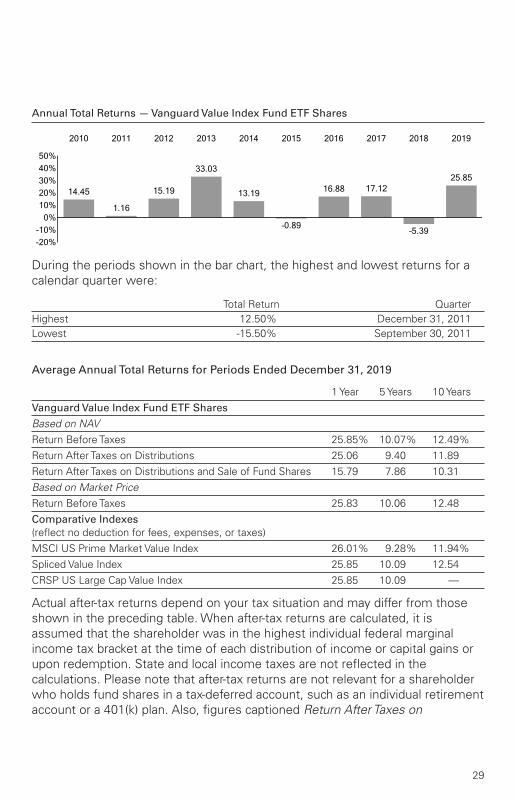
Annual Total Returns — Vanguard Value Index Fund ETF Shares
2010 2011 2012 2013 2014 2015 2016 2017 2018 2019
0%10%20%30%40%50%
-10%-20%
14.45
1.16
15.19
33.03
13.19
–0.89
16.88 17.12
–5.39
25.85
During the periods shown in the bar chart, the highest and lowest returns for acalendar quarter were:
Total Return QuarterHighest 12.50% December 31, 2011Lowest -15.50% September 30, 2011
Average Annual Total Returns for Periods Ended December 31, 2019
1 Year 5 Years 10 YearsVanguard Value Index Fund ETF Shares
Based on NAVReturn Before Taxes 25.85% 10.07% 12.49%Return After Taxes on Distributions 25.06 9.40 11.89Return After Taxes on Distributions and Sale of Fund Shares 15.79 7.86 10.31Based on Market PriceReturn Before Taxes 25.83 10.06 12.48Comparative Indexes(reflect no deduction for fees, expenses, or taxes)MSCI US Prime Market Value Index 26.01% 9.28% 11.94%Spliced Value Index 25.85 10.09 12.54CRSP US Large Cap Value Index 25.85 10.09 —
Actual after-tax returns depend on your tax situation and may differ from thoseshown in the preceding table. When after-tax returns are calculated, it isassumed that the shareholder was in the highest individual federal marginalincome tax bracket at the time of each distribution of income or capital gains orupon redemption. State and local income taxes are not reflected in thecalculations. Please note that after-tax returns are not relevant for a shareholderwho holds fund shares in a tax-deferred account, such as an individual retirementaccount or a 401(k) plan. Also, figures captioned Return After Taxes on
29
Distributions and Sale of Fund Shares may be higher than other figures for thesame period if a capital loss occurs upon redemption and results in an assumedtax deduction for the shareholder.
Investment AdvisorThe Vanguard Group, Inc. (Vanguard)
Portfolio Managers
Walter Nejman, Portfolio Manager at Vanguard. He has co-managed the Fundsince 2016.
Gerard C. O’Reilly, Principal of Vanguard. He has managed the Fund since 1994(co-managed since 2016).
Purchase and Sale of Fund SharesYou can buy and sell ETF Shares of the Fund through a brokerage firm. The priceyou pay or receive for ETF Shares will be the prevailing market price, which maybe more or less than the NAV of the shares. The brokerage firm may charge youa commission to execute the transaction. Unless imposed by your brokeragefirm, there is no minimum dollar amount you must invest and no minimumnumber of shares you must buy. ETF Shares of the Fund cannot be directlypurchased from or redeemed with the Fund, except by certain authorizedbroker-dealers. These broker-dealers may purchase and redeem ETF Shares onlyin large blocks (Creation Units), typically in exchange for baskets of securities.
Tax InformationThe Fund’s distributions may be taxable as ordinary income or capital gain. If youare investing through a tax-advantaged account, such as an IRA or anemployer-sponsored retirement or savings plan, special tax rules apply.
Payments to Financial IntermediariesThe Fund and its investment advisor do not pay financial intermediaries for salesof Fund shares.
30

Vanguard Mid-Cap Value ETF
Investment ObjectiveThe Fund seeks to track the performance of a benchmark index that measuresthe investment return of mid-capitalization value stocks.
Fees and ExpensesThe following table describes the fees and expenses you may pay if you buy andhold ETF Shares of the Fund.
Shareholder Fees(Fees paid directly from your investment)
Transaction Fee on Purchases and Sales None through Vanguard (Broker fees vary)Transaction Fee on Reinvested Dividends None through Vanguard (Broker fees vary)Transaction Fee on Conversion to ETF Shares None through Vanguard (Broker fees vary)
Annual Fund Operating Expenses(Expenses that you pay each year as a percentage of the value of your investment)
Management Fees 0.06%12b-1 Distribution Fee NoneOther Expenses 0.01%Total Annual Fund Operating Expenses 0.07%
Example
The following example is intended to help you compare the cost of investing inthe Fund’s ETF Shares with the cost of investing in other funds. It illustrates thehypothetical expenses that you would incur over various periods if you were toinvest $10,000 in the Fund’s shares. This example assumes that the sharesprovide a return of 5% each year and that total annual fund operating expensesremain as stated in the preceding table. You would incur these hypotheticalexpenses whether or not you were to sell your shares at the end of the givenperiod. Although your actual costs may be higher or lower, based on theseassumptions your costs would be:
1 Year 3 Years 5 Years 10 Years$7 $23 $40 $90
This example does not include the brokerage commissions that you may pay tobuy and sell ETF Shares of the Fund.
31
Portfolio Turnover
The Fund pays transaction costs, such as commissions, when it buys and sellssecurities (or “turns over” its portfolio). A higher portfolio turnover rate mayindicate higher transaction costs and may result in more taxes when Fundshares are held in a taxable account. These costs, which are not reflected inannual fund operating expenses or in the previous expense example, reduce theFund’s performance. During the most recent fiscal year, the Fund’s portfolioturnover rate was 17% of the average value of its portfolio.
Principal Investment StrategiesThe Fund employs an indexing investment approach designed to track theperformance of the CRSP US Mid Cap Value Index, a broadly diversified index ofvalue stocks of mid-size U.S. companies. The Fund attempts to replicate thetarget index by investing all, or substantially all, of its assets in the stocks thatmake up the Index, holding each stock in approximately the same proportion asits weighting in the Index.
Principal RisksAn investment in the Fund could lose money over short or long periods of time.You should expect the Fund’s share price and total return to fluctuate within awide range. The Fund is subject to the following risks, which could affect theFund’s performance:
• Stock market risk, which is the chance that stock prices overall will decline.Stock markets tend to move in cycles, with periods of rising prices and periodsof falling prices. The Fund’s target index tracks a subset of the U.S. stock market,which could cause the Fund to perform differently from the overall stock market.In addition, the Fund’s target index may, at times, become focused in stocks of aparticular market sector, which would subject the Fund to proportionately higherexposure to the risks of that sector.
• Investment style risk, which is the chance that returns from mid-capitalizationvalue stocks will trail returns from the overall stock market. Historically, mid-capstocks have been more volatile in price than the large-cap stocks that dominatethe overall market, and they often perform quite differently. The stock prices ofmid-size companies tend to experience greater volatility because, among otherthings, these companies tend to be more sensitive to changingeconomic conditions.
Because ETF Shares are traded on an exchange, they are subject toadditional risks:
32

• The Fund’s ETF Shares are listed for trading on NYSE Arca and are bought andsold on the secondary market at market prices. Although it is expected that themarket price of an ETF Share typically will approximate its net asset value (NAV),there may be times when the market price and the NAV differ significantly. Thus,you may pay more or less than NAV when you buy ETF Shares on the secondarymarket, and you may receive more or less than NAV when you sell those shares.
• Although the Fund’s ETF Shares are listed for trading on NYSE Arca, it ispossible that an active trading market may not be maintained.
• Trading of the Fund’s ETF Shares may be halted by the activation of individualor marketwide trading halts (which halt trading for a specific period of time whenthe price of a particular security or overall market prices decline by a specifiedpercentage). Trading of the Fund’s ETF Shares may also be halted if (1) theshares are delisted from NYSE Arca without first being listed on anotherexchange or (2) NYSE Arca officials determine that such action is appropriate inthe interest of a fair and orderly market or for the protection of investors.
An investment in the Fund is not a deposit of a bank and is not insured orguaranteed by the Federal Deposit Insurance Corporation or any othergovernment agency.
Annual Total ReturnsThe following bar chart and table are intended to help you understand the risksof investing in the Fund. The bar chart shows how the performance of the Fund‘sETF Shares (based on NAV) has varied from one calendar year to another overthe periods shown. The table shows how the average annual total returns of theETF Shares compare with those of the Fund’s target index and othercomparative indexes, which have investment characteristics similar to those ofthe Fund. The Spliced Mid Cap Value Index reflects the performance of the MSCIUS Mid Cap Value Index through April 16, 2013, and the CRSP US Mid Cap ValueIndex thereafter. Keep in mind that the Fund’s past performance (before and aftertaxes) does not indicate how the Fund will perform in the future. Updatedperformance information is available on our website atvanguard.com/performance or by calling Vanguard toll-free at 800-662-7447.
33

Annual Total Returns — Vanguard Mid-Cap Value Index Fund ETF Shares
2010 2011 2012 2013 2014 2015 2016 2017 2018 2019
0%
20%
40%
60%
-20%
-40%
21.83
–0.32
16.04
37.65
13.98
–1.80
15.26 17.05
–12.41
27.98
During the periods shown in the bar chart, the highest and lowest returns for acalendar quarter were:
Total Return QuarterHighest 14.35% March 31, 2013Lowest -18.07% September 30, 2011
Average Annual Total Returns for Periods Ended December 31, 2019
1 Year 5 Years 10 YearsVanguard Mid-Cap Value Index Fund ETF Shares
Based on NAVReturn Before Taxes 27.98% 8.23% 12.63%Return After Taxes on Distributions 27.29 7.65 12.12Return After Taxes on Distributions and Sale of Fund Shares 16.94 6.37 10.46Based on Market PriceReturn Before Taxes 28.00 8.23 12.62Comparative Indexes(reflect no deduction for fees, expenses, or taxes)MSCI US Mid Cap Value Index 27.64% 9.51% 12.91%Spliced Mid Cap Value Index 28.05 8.27 12.69CRSP US Mid Cap Value Index 28.05 8.27 —
Actual after-tax returns depend on your tax situation and may differ from thoseshown in the preceding table. When after-tax returns are calculated, it isassumed that the shareholder was in the highest individual federal marginalincome tax bracket at the time of each distribution of income or capital gains orupon redemption. State and local income taxes are not reflected in thecalculations. Please note that after-tax returns are not relevant for a shareholderwho holds fund shares in a tax-deferred account, such as an individual retirementaccount or a 401(k) plan. Also, figures captioned Return After Taxes on
34

Distributions and Sale of Fund Shares may be higher than other figures for thesame period if a capital loss occurs upon redemption and results in an assumedtax deduction for the shareholder.
Investment AdvisorThe Vanguard Group, Inc. (Vanguard)
Portfolio Managers
Donald M. Butler, CFA, Principal of Vanguard. He has managed the Fund since itsinception in 2006 (co-managed since 2016).
Michael A. Johnson, Portfolio Manager at Vanguard. He has co-managed theFund since 2016.
Purchase and Sale of Fund SharesYou can buy and sell ETF Shares of the Fund through a brokerage firm. The priceyou pay or receive for ETF Shares will be the prevailing market price, which maybe more or less than the NAV of the shares. The brokerage firm may charge youa commission to execute the transaction. Unless imposed by your brokeragefirm, there is no minimum dollar amount you must invest and no minimumnumber of shares you must buy. ETF Shares of the Fund cannot be directlypurchased from or redeemed with the Fund, except by certain authorizedbroker-dealers. These broker-dealers may purchase and redeem ETF Shares onlyin large blocks (Creation Units), typically in exchange for baskets of securities.
Tax InformationThe Fund’s distributions may be taxable as ordinary income or capital gain. If youare investing through a tax-advantaged account, such as an IRA or anemployer-sponsored retirement or savings plan, special tax rules apply.
Payments to Financial IntermediariesThe Fund and its investment advisor do not pay financial intermediaries for salesof Fund shares.
35

Vanguard Small-Cap Value ETF
Investment ObjectiveThe Fund seeks to track the performance of a benchmark index that measuresthe investment return of small-capitalization value stocks.
Fees and ExpensesThe following table describes the fees and expenses you may pay if you buy andhold ETF Shares of the Fund.
Shareholder Fees(Fees paid directly from your investment)
Transaction Fee on Purchases and Sales None through Vanguard (Broker fees vary)Transaction Fee on Reinvested Dividends None through Vanguard (Broker fees vary)Transaction Fee on Conversion to ETF Shares None through Vanguard (Broker fees vary)
Annual Fund Operating Expenses(Expenses that you pay each year as a percentage of the value of your investment)
Management Fees 0.06%12b-1 Distribution Fee NoneOther Expenses 0.01%Total Annual Fund Operating Expenses 0.07%
Example
The following example is intended to help you compare the cost of investing inthe Fund’s ETF Shares with the cost of investing in other funds. It illustrates thehypothetical expenses that you would incur over various periods if you were toinvest $10,000 in the Fund’s shares. This example assumes that the sharesprovide a return of 5% each year and that total annual fund operating expensesremain as stated in the preceding table. You would incur these hypotheticalexpenses whether or not you were to sell your shares at the end of the givenperiod. Although your actual costs may be higher or lower, based on theseassumptions your costs would be:
1 Year 3 Years 5 Years 10 Years$7 $23 $40 $90
This example does not include the brokerage commissions that you may pay tobuy and sell ETF Shares of the Fund.
36

Portfolio Turnover
The Fund pays transaction costs, such as commissions, when it buys and sellssecurities (or “turns over” its portfolio). A higher portfolio turnover rate mayindicate higher transaction costs and may result in more taxes when Fundshares are held in a taxable account. These costs, which are not reflected inannual fund operating expenses or in the previous expense example, reduce theFund’s performance. During the most recent fiscal year, the Fund’s portfolioturnover rate was 19% of the average value of its portfolio.
Principal Investment StrategiesThe Fund employs an indexing investment approach designed to track theperformance of the CRSP US Small Cap Value Index, a broadly diversified indexof value stocks of small U.S. companies. The Fund attempts to replicate thetarget index by investing all, or substantially all, of its assets in the stocks thatmake up the Index, holding each stock in approximately the same proportion asits weighting in the Index.
Principal RisksAn investment in the Fund could lose money over short or long periods of time.You should expect the Fund’s share price and total return to fluctuate within awide range. The Fund is subject to the following risks, which could affect theFund’s performance:
• Stock market risk, which is the chance that stock prices overall will decline.Stock markets tend to move in cycles, with periods of rising prices and periodsof falling prices. The Fund’s target index tracks a subset of the U.S. stock market,which could cause the Fund to perform differently from the overall stock market.In addition, the Fund’s target index may, at times, become focused in stocks of aparticular market sector, which would subject the Fund to proportionately higherexposure to the risks of that sector.
• Investment style risk, which is the chance that returns from small-capitalizationvalue stocks will trail returns from the overall stock market. Historically, small-capstocks have been more volatile in price than the large-cap stocks that dominatethe overall market, and they often perform quite differently. The stock prices ofsmall companies tend to experience greater volatility because, among otherthings, these companies tend to be more sensitive to changingeconomic conditions.
Because ETF Shares are traded on an exchange, they are subject toadditional risks:
37

• The Fund’s ETF Shares are listed for trading on NYSE Arca and are bought andsold on the secondary market at market prices. Although it is expected that themarket price of an ETF Share typically will approximate its net asset value (NAV),there may be times when the market price and the NAV differ significantly. Thus,you may pay more or less than NAV when you buy ETF Shares on the secondarymarket, and you may receive more or less than NAV when you sell those shares.
• Although the Fund’s ETF Shares are listed for trading on NYSE Arca, it ispossible that an active trading market may not be maintained.
• Trading of the Fund’s ETF Shares may be halted by the activation of individualor marketwide trading halts (which halt trading for a specific period of time whenthe price of a particular security or overall market prices decline by a specifiedpercentage). Trading of the Fund’s ETF Shares may also be halted if (1) theshares are delisted from NYSE Arca without first being listed on anotherexchange or (2) NYSE Arca officials determine that such action is appropriate inthe interest of a fair and orderly market or for the protection of investors.
An investment in the Fund is not a deposit of a bank and is not insured orguaranteed by the Federal Deposit Insurance Corporation or any othergovernment agency.
Annual Total ReturnsThe following bar chart and table are intended to help you understand the risksof investing in the Fund. The bar chart shows how the performance of the Fund‘sETF Shares (based on NAV) has varied from one calendar year to another overthe periods shown. The table shows how the average annual total returns of theETF Shares compare with those of the Fund’s target index and othercomparative indexes, which have investment characteristics similar to those ofthe Fund. The Spliced Small Cap Value Index reflects the performance of theMSCI US Small Cap Value Index through April 16, 2013, and the CRSP US SmallCap Value Index thereafter. Keep in mind that the Fund’s past performance(before and after taxes) does not indicate how the Fund will perform in thefuture. Updated performance information is available on our website atvanguard.com/performance or by calling Vanguard toll-free at 800-662-7447.
38

Annual Total Returns — Vanguard Small-Cap Value Index Fund ETF Shares
2010 2011 2012 2013 2014 2015 2016 2017 2018 2019
0%
20%
40%
60%
-20%
-40%
24.97
–4.05
18.78
36.57
10.55
–4.67
24.8011.79
–12.22
22.76
During the periods shown in the bar chart, the highest and lowest returns for acalendar quarter were:
Total Return QuarterHighest 15.23% December 31, 2011Lowest -20.68% September 30, 2011
Average Annual Total Returns for Periods Ended December 31, 2019
1 Year 5 Years 10 YearsVanguard Small-Cap Value Index Fund ETF Shares
Based on NAVReturn Before Taxes 22.76% 7.46% 11.91%Return After Taxes on Distributions 22.00 6.85 11.32Return After Taxes on Distributions and Sale of Fund Shares 13.75 5.69 9.75Based on Market PriceReturn Before Taxes 22.77 7.46 11.92Comparative Indexes(reflect no deduction for fees, expenses, or taxes)MSCI US Small Cap Value Index 22.29% 7.08% 11.17%Spliced Small Cap Value Index 22.76 7.47 11.94CRSP US Small Cap Value Index 22.76 7.47 —
Actual after-tax returns depend on your tax situation and may differ from thoseshown in the preceding table. When after-tax returns are calculated, it isassumed that the shareholder was in the highest individual federal marginalincome tax bracket at the time of each distribution of income or capital gains orupon redemption. State and local income taxes are not reflected in thecalculations. Please note that after-tax returns are not relevant for a shareholderwho holds fund shares in a tax-deferred account, such as an individual retirementaccount or a 401(k) plan. Also, figures captioned Return After Taxes on
39

Distributions and Sale of Fund Shares may be higher than other figures for thesame period if a capital loss occurs upon redemption and results in an assumedtax deduction for the shareholder.
Investment AdvisorThe Vanguard Group, Inc. (Vanguard)
Portfolio Managers
William A. Coleman, CFA, Portfolio Manager at Vanguard. He has co-managedthe Fund since 2016.
Gerard C. O’Reilly, Principal of Vanguard. He has co-managed the Fundsince 2016.
Purchase and Sale of Fund SharesYou can buy and sell ETF Shares of the Fund through a brokerage firm. The priceyou pay or receive for ETF Shares will be the prevailing market price, which maybe more or less than the NAV of the shares. The brokerage firm may charge youa commission to execute the transaction. Unless imposed by your brokeragefirm, there is no minimum dollar amount you must invest and no minimumnumber of shares you must buy. ETF Shares of the Fund cannot be directlypurchased from or redeemed with the Fund, except by certain authorizedbroker-dealers. These broker-dealers may purchase and redeem ETF Shares onlyin large blocks (Creation Units), typically in exchange for baskets of securities.
Tax InformationThe Fund’s distributions may be taxable as ordinary income or capital gain. If youare investing through a tax-advantaged account, such as an IRA or anemployer-sponsored retirement or savings plan, special tax rules apply.
Payments to Financial IntermediariesThe Fund and its investment advisor do not pay financial intermediaries for salesof Fund shares.
40

Vanguard Growth ETF
Investment ObjectiveThe Fund seeks to track the performance of a benchmark index that measuresthe investment return of large-capitalization growth stocks.
Fees and ExpensesThe following table describes the fees and expenses you may pay if you buy andhold ETF Shares of the Fund.
Shareholder Fees(Fees paid directly from your investment)
Transaction Fee on Purchases and Sales None through Vanguard (Broker fees vary)Transaction Fee on Reinvested Dividends None through Vanguard (Broker fees vary)Transaction Fee on Conversion to ETF Shares None through Vanguard (Broker fees vary)
Annual Fund Operating Expenses(Expenses that you pay each year as a percentage of the value of your investment)
Management Fees 0.03%12b-1 Distribution Fee NoneOther Expenses 0.01%Total Annual Fund Operating Expenses 0.04%
Example
The following example is intended to help you compare the cost of investing inthe Fund’s ETF Shares with the cost of investing in other funds. It illustrates thehypothetical expenses that you would incur over various periods if you were toinvest $10,000 in the Fund’s shares. This example assumes that the sharesprovide a return of 5% each year and that total annual fund operating expensesremain as stated in the preceding table. You would incur these hypotheticalexpenses whether or not you were to sell your shares at the end of the givenperiod. Although your actual costs may be higher or lower, based on theseassumptions your costs would be:
1 Year 3 Years 5 Years 10 Years$4 $13 $23 $51
This example does not include the brokerage commissions that you may pay tobuy and sell ETF Shares of the Fund.
41

Portfolio Turnover
The Fund pays transaction costs, such as commissions, when it buys and sellssecurities (or “turns over” its portfolio). A higher portfolio turnover rate mayindicate higher transaction costs and may result in more taxes when Fundshares are held in a taxable account. These costs, which are not reflected inannual fund operating expenses or in the previous expense example, reduce theFund’s performance. During the most recent fiscal year, the Fund’s portfolioturnover rate was 11% of the average value of its portfolio.
Principal Investment StrategiesThe Fund employs an indexing investment approach designed to track theperformance of the CRSP US Large Cap Growth Index, a broadly diversifiedindex predominantly made up of growth stocks of large U.S. companies. TheFund attempts to replicate the target index by investing all, or substantially all, ofits assets in the stocks that make up the Index, holding each stock inapproximately the same proportion as its weighting in the Index. The Fund maybecome nondiversified, as defined under the Investment Company Act of 1940,solely as a result of a change in relative market capitalization or index weightingof one or more constituents of the Index.
Principal RisksAn investment in the Fund could lose money over short or long periods of time.You should expect the Fund’s share price and total return to fluctuate within awide range. The Fund is subject to the following risks, which could affect theFund’s performance:
• Stock market risk, which is the chance that stock prices overall will decline.Stock markets tend to move in cycles, with periods of rising prices and periodsof falling prices. The Fund’s target index tracks a subset of the U.S. stock market,which could cause the Fund to perform differently from the overall stock market.In addition, the Fund’s target index may, at times, become focused in stocks of aparticular market sector, which would subject the Fund to proportionately higherexposure to the risks of that sector.
• Investment style risk, which is the chance that returns from large-capitalizationgrowth stocks will trail returns from the overall stock market. Large-cap growthstocks tend to go through cycles of doing better—or worse—than othersegments of the stock market or the stock market in general. These periodshave, in the past, lasted for as long as several years.
• Sector risk, which is the chance that significant problems will affect a particularsector, or that returns from that sector will trail returns from the overall stockmarket. Daily fluctuations in specific market sectors are often more extreme or
42

volatile than fluctuations in the overall market. Because a significant portion ofthe Fund’s assets are invested in the information technology sector, the Fund’sperformance is impacted by the general condition of that sector. Companies inthe information technology sector could be affected by, among other things,overall economic conditions, short product cycles, rapid obsolescence ofproducts, competition, and government regulation. Sector risk is expected to behigh for the Fund.
• Nondiversification risk. Due to an index rebalance and in order to closely trackthe composition of the Fund’s target index, more than 25% of the Fund’s totalassets are invested in issuers representing more than 5% of the Fund’s totalassets. As a result, the Fund is nondiversified under the Investment CompanyAct of 1940, although it continues to hold approximately 300 stocks across anumber of sectors. The Fund’s performance may be hurt disproportionately bythe poor performance of relatively few stocks, or even a single stock, and theFund’s shares may experience significant fluctuations in value.
Because ETF Shares are traded on an exchange, they are subject toadditional risks:
• The Fund’s ETF Shares are listed for trading on NYSE Arca and are bought andsold on the secondary market at market prices. Although it is expected that themarket price of an ETF Share typically will approximate its net asset value (NAV),there may be times when the market price and the NAV differ significantly. Thus,you may pay more or less than NAV when you buy ETF Shares on the secondarymarket, and you may receive more or less than NAV when you sell those shares.
• Although the Fund’s ETF Shares are listed for trading on NYSE Arca, it ispossible that an active trading market may not be maintained.
• Trading of the Fund’s ETF Shares may be halted by the activation of individualor marketwide trading halts (which halt trading for a specific period of time whenthe price of a particular security or overall market prices decline by a specifiedpercentage). Trading of the Fund’s ETF Shares may also be halted if (1) theshares are delisted from NYSE Arca without first being listed on anotherexchange or (2) NYSE Arca officials determine that such action is appropriate inthe interest of a fair and orderly market or for the protection of investors.
An investment in the Fund is not a deposit of a bank and is not insured orguaranteed by the Federal Deposit Insurance Corporation or any othergovernment agency.
43

Annual Total ReturnsThe following bar chart and table are intended to help you understand the risksof investing in the Fund. The bar chart shows how the performance of the Fund‘sETF Shares (based on NAV) has varied from one calendar year to another overthe periods shown. The table shows how the average annual total returns of theETF Shares compare with those of the Fund’s target index and othercomparative indexes, which have investment characteristics similar to those ofthe Fund. The Spliced Growth Index reflects the performance of the MSCI USPrime Market Growth Index through April 16, 2013, and the CRSP US Large CapGrowth Index thereafter. Keep in mind that the Fund’s past performance (beforeand after taxes) does not indicate how the Fund will perform in the future.Updated performance information is available on our website atvanguard.com/performance or by calling Vanguard toll-free at 800-662-7447.
Annual Total Returns — Vanguard Growth Index Fund ETF Shares
2010 2011 2012 2013 2014 2015 2016 2017 2018 2019
0%10%20%30%40%50%
-10%-20%
17.11
1.87
17.03
32.38
13.623.32 6.13
27.80
–3.32
37.26
During the periods shown in the bar chart, the highest and lowest returns for acalendar quarter were:
Total Return QuarterHighest 16.90% March 31, 2019Lowest -16.29% December 31, 2018
44

Average Annual Total Returns for Periods Ended December 31, 2019
1 Year 5 Years 10 YearsVanguard Growth Index Fund ETF Shares
Based on NAVReturn Before Taxes 37.26% 13.21% 14.59%Return After Taxes on Distributions 36.90 12.86 14.27Return After Taxes on Distributions and Sale of Fund Shares 22.24 10.49 12.26Based on Market PriceReturn Before Taxes 37.26 13.20 14.59Comparative Indexes(reflect no deduction for fees, expenses, or taxes)MSCI US Prime Market Growth Index 37.37% 13.85% 15.16%Spliced Growth Index 37.31 13.24 14.66CRSP US Large Cap Growth Index 37.31 13.24 —
Actual after-tax returns depend on your tax situation and may differ from thoseshown in the preceding table. When after-tax returns are calculated, it isassumed that the shareholder was in the highest individual federal marginalincome tax bracket at the time of each distribution of income or capital gains orupon redemption. State and local income taxes are not reflected in thecalculations. Please note that after-tax returns are not relevant for a shareholderwho holds fund shares in a tax-deferred account, such as an individual retirementaccount or a 401(k) plan. Also, figures captioned Return After Taxes onDistributions and Sale of Fund Shares may be higher than other figures for thesame period if a capital loss occurs upon redemption and results in an assumedtax deduction for the shareholder.
Investment AdvisorThe Vanguard Group, Inc. (Vanguard)
Portfolio Managers
Walter Nejman, Portfolio Manager at Vanguard. He has co-managed the Fundsince 2016.
Gerard C. O’Reilly, Principal of Vanguard. He has managed the Fund since 2004(co-managed since 2016).
Purchase and Sale of Fund SharesYou can buy and sell ETF Shares of the Fund through a brokerage firm. The priceyou pay or receive for ETF Shares will be the prevailing market price, which maybe more or less than the NAV of the shares. The brokerage firm may charge you
45

a commission to execute the transaction. Unless imposed by your brokeragefirm, there is no minimum dollar amount you must invest and no minimumnumber of shares you must buy. ETF Shares of the Fund cannot be directlypurchased from or redeemed with the Fund, except by certain authorizedbroker-dealers. These broker-dealers may purchase and redeem ETF Shares onlyin large blocks (Creation Units), typically in exchange for baskets of securities.
Tax InformationThe Fund’s distributions may be taxable as ordinary income or capital gain. If youare investing through a tax-advantaged account, such as an IRA or anemployer-sponsored retirement or savings plan, special tax rules apply.
Payments to Financial IntermediariesThe Fund and its investment advisor do not pay financial intermediaries for salesof Fund shares.
46

Vanguard Mid-Cap Growth ETF
Investment ObjectiveThe Fund seeks to track the performance of a benchmark index that measuresthe investment return of mid-capitalization growth stocks.
Fees and ExpensesThe following table describes the fees and expenses you may pay if you buy andhold ETF Shares of the Fund.
Shareholder Fees(Fees paid directly from your investment)
Transaction Fee on Purchases and Sales None through Vanguard (Broker fees vary)Transaction Fee on Reinvested Dividends None through Vanguard (Broker fees vary)Transaction Fee on Conversion to ETF Shares None through Vanguard (Broker fees vary)
Annual Fund Operating Expenses(Expenses that you pay each year as a percentage of the value of your investment)
Management Fees 0.06%12b-1 Distribution Fee NoneOther Expenses 0.01%Total Annual Fund Operating Expenses 0.07%
Example
The following example is intended to help you compare the cost of investing inthe Fund’s ETF Shares with the cost of investing in other funds. It illustrates thehypothetical expenses that you would incur over various periods if you were toinvest $10,000 in the Fund’s shares. This example assumes that the sharesprovide a return of 5% each year and that total annual fund operating expensesremain as stated in the preceding table. You would incur these hypotheticalexpenses whether or not you were to sell your shares at the end of the givenperiod. Although your actual costs may be higher or lower, based on theseassumptions your costs would be:
1 Year 3 Years 5 Years 10 Years$7 $23 $40 $90
This example does not include the brokerage commissions that you may pay tobuy and sell ETF Shares of the Fund.
47

Portfolio Turnover
The Fund pays transaction costs, such as commissions, when it buys and sellssecurities (or “turns over” its portfolio). A higher portfolio turnover rate mayindicate higher transaction costs and may result in more taxes when Fundshares are held in a taxable account. These costs, which are not reflected inannual fund operating expenses or in the previous expense example, reduce theFund’s performance. During the most recent fiscal year, the Fund’s portfolioturnover rate was 18% of the average value of its portfolio.
Principal Investment StrategiesThe Fund employs an indexing investment approach designed to track theperformance of the CRSP US Mid Cap Growth Index, a broadly diversified indexof growth stocks of mid-size U.S. companies. The Fund attempts to replicate thetarget index by investing all, or substantially all, of its assets in the stocks thatmake up the Index, holding each stock in approximately the same proportion asits weighting in the Index.
Principal RisksAn investment in the Fund could lose money over short or long periods of time.You should expect the Fund’s share price and total return to fluctuate within awide range. The Fund is subject to the following risks, which could affect theFund’s performance:
• Stock market risk, which is the chance that stock prices overall will decline.Stock markets tend to move in cycles, with periods of rising prices and periodsof falling prices. The Fund’s target index tracks a subset of the U.S. stock market,which could cause the Fund to perform differently from the overall stock market.In addition, the Fund’s target index may, at times, become focused in stocks of aparticular market sector, which would subject the Fund to proportionately higherexposure to the risks of that sector.
• Investment style risk, which is the chance that returns from mid-capitalizationgrowth stocks will trail returns from the overall stock market. Historically,mid-cap stocks have been more volatile in price than the large-cap stocks thatdominate the overall market, and they often perform quite differently. The stockprices of mid-size companies tend to experience greater volatility because,among other things, these companies tend to be more sensitive to changingeconomic conditions.
Because ETF Shares are traded on an exchange, they are subject toadditional risks:
48
• The Fund’s ETF Shares are listed for trading on NYSE Arca and are bought andsold on the secondary market at market prices. Although it is expected that themarket price of an ETF Share typically will approximate its net asset value (NAV),there may be times when the market price and the NAV differ significantly. Thus,you may pay more or less than NAV when you buy ETF Shares on the secondarymarket, and you may receive more or less than NAV when you sell those shares.
• Although the Fund’s ETF Shares are listed for trading on NYSE Arca, it ispossible that an active trading market may not be maintained.
• Trading of the Fund’s ETF Shares may be halted by the activation of individualor marketwide trading halts (which halt trading for a specific period of time whenthe price of a particular security or overall market prices decline by a specifiedpercentage). Trading of the Fund’s ETF Shares may also be halted if (1) theshares are delisted from NYSE Arca without first being listed on anotherexchange or (2) NYSE Arca officials determine that such action is appropriate inthe interest of a fair and orderly market or for the protection of investors.
An investment in the Fund is not a deposit of a bank and is not insured orguaranteed by the Federal Deposit Insurance Corporation or any othergovernment agency.
Annual Total ReturnsThe following bar chart and table are intended to help you understand the risksof investing in the Fund. The bar chart shows how the performance of the Fund‘sETF Shares (based on NAV) has varied from one calendar year to another overthe periods shown. The table shows how the average annual total returns of theETF Shares compare with those of the Fund’s target index and othercomparative indexes, which have investment characteristics similar to those ofthe Fund. The Spliced Mid Cap Growth Index reflects the performance of theMSCI US Mid Cap Growth Index through April 16, 2013, and the CRSP US MidCap Growth Index thereafter. Keep in mind that the Fund’s past performance(before and after taxes) does not indicate how the Fund will perform in thefuture. Updated performance information is available on our website atvanguard.com/performance or by calling Vanguard toll-free at 800-662-7447.
49
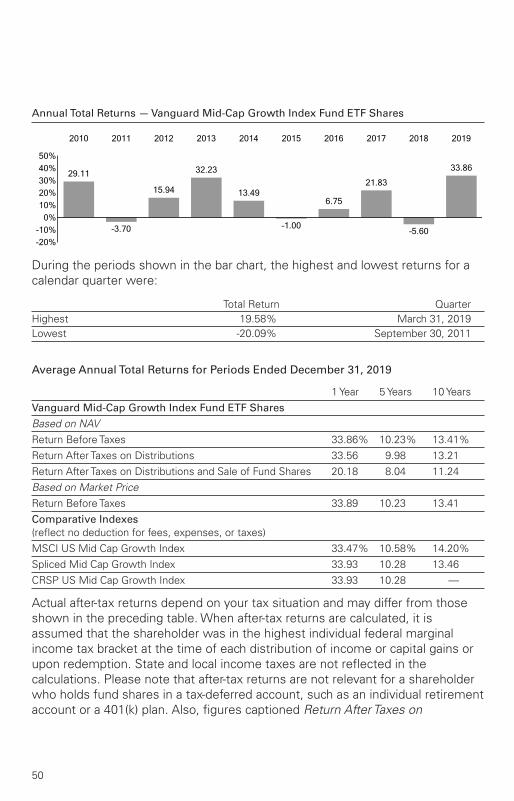
Annual Total Returns — Vanguard Mid-Cap Growth Index Fund ETF Shares
2010 2011 2012 2013 2014 2015 2016 2017 2018 2019
0%10%20%30%40%50%
-10%-20%
29.11
–3.70
15.94
32.23
13.49
–1.00
6.75
21.83
–5.60
33.86
During the periods shown in the bar chart, the highest and lowest returns for acalendar quarter were:
Total Return QuarterHighest 19.58% March 31, 2019Lowest -20.09% September 30, 2011
Average Annual Total Returns for Periods Ended December 31, 2019
1 Year 5 Years 10 YearsVanguard Mid-Cap Growth Index Fund ETF Shares
Based on NAVReturn Before Taxes 33.86% 10.23% 13.41%Return After Taxes on Distributions 33.56 9.98 13.21Return After Taxes on Distributions and Sale of Fund Shares 20.18 8.04 11.24Based on Market PriceReturn Before Taxes 33.89 10.23 13.41Comparative Indexes(reflect no deduction for fees, expenses, or taxes)MSCI US Mid Cap Growth Index 33.47% 10.58% 14.20%Spliced Mid Cap Growth Index 33.93 10.28 13.46CRSP US Mid Cap Growth Index 33.93 10.28 —
Actual after-tax returns depend on your tax situation and may differ from thoseshown in the preceding table. When after-tax returns are calculated, it isassumed that the shareholder was in the highest individual federal marginalincome tax bracket at the time of each distribution of income or capital gains orupon redemption. State and local income taxes are not reflected in thecalculations. Please note that after-tax returns are not relevant for a shareholderwho holds fund shares in a tax-deferred account, such as an individual retirementaccount or a 401(k) plan. Also, figures captioned Return After Taxes on
50

Distributions and Sale of Fund Shares may be higher than other figures for thesame period if a capital loss occurs upon redemption and results in an assumedtax deduction for the shareholder.
Investment AdvisorThe Vanguard Group, Inc. (Vanguard)
Portfolio Managers
Donald M. Butler, CFA, Principal of Vanguard. He has managed the Fund since2013 (co-managed since 2016).
Michael A. Johnson, Portfolio Manager at Vanguard. He has co-managed theFund since 2016.
Purchase and Sale of Fund SharesYou can buy and sell ETF Shares of the Fund through a brokerage firm. The priceyou pay or receive for ETF Shares will be the prevailing market price, which maybe more or less than the NAV of the shares. The brokerage firm may charge youa commission to execute the transaction. Unless imposed by your brokeragefirm, there is no minimum dollar amount you must invest and no minimumnumber of shares you must buy. ETF Shares of the Fund cannot be directlypurchased from or redeemed with the Fund, except by certain authorizedbroker-dealers. These broker-dealers may purchase and redeem ETF Shares onlyin large blocks (Creation Units), typically in exchange for baskets of securities.
Tax InformationThe Fund’s distributions may be taxable as ordinary income or capital gain. If youare investing through a tax-advantaged account, such as an IRA or anemployer-sponsored retirement or savings plan, special tax rules apply.
Payments to Financial IntermediariesThe Fund and its investment advisor do not pay financial intermediaries for salesof Fund shares.
51

Vanguard Small-Cap Growth ETF
Investment ObjectiveThe Fund seeks to track the performance of a benchmark index that measuresthe investment return of small-capitalization growth stocks.
Fees and ExpensesThe following table describes the fees and expenses you may pay if you buy andhold ETF Shares of the Fund.
Shareholder Fees(Fees paid directly from your investment)
Transaction Fee on Purchases and Sales None through Vanguard (Broker fees vary)Transaction Fee on Reinvested Dividends None through Vanguard (Broker fees vary)Transaction Fee on Conversion to ETF Shares None through Vanguard (Broker fees vary)
Annual Fund Operating Expenses(Expenses that you pay each year as a percentage of the value of your investment)
Management Fees 0.06%12b-1 Distribution Fee NoneOther Expenses 0.01%Total Annual Fund Operating Expenses 0.07%
Example
The following example is intended to help you compare the cost of investing inthe Fund’s ETF Shares with the cost of investing in other funds. It illustrates thehypothetical expenses that you would incur over various periods if you were toinvest $10,000 in the Fund’s shares. This example assumes that the sharesprovide a return of 5% each year and that total annual fund operating expensesremain as stated in the preceding table. You would incur these hypotheticalexpenses whether or not you were to sell your shares at the end of the givenperiod. Although your actual costs may be higher or lower, based on theseassumptions your costs would be:
1 Year 3 Years 5 Years 10 Years$7 $23 $40 $90
This example does not include the brokerage commissions that you may pay tobuy and sell ETF Shares of the Fund.
52

Portfolio Turnover
The Fund pays transaction costs, such as commissions, when it buys and sellssecurities (or “turns over” its portfolio). A higher portfolio turnover rate mayindicate higher transaction costs and may result in more taxes when Fundshares are held in a taxable account. These costs, which are not reflected inannual fund operating expenses or in the previous expense example, reduce theFund’s performance. During the most recent fiscal year, the Fund’s portfolioturnover rate was 18% of the average value of its portfolio.
Principal Investment StrategiesThe Fund employs an indexing investment approach designed to track theperformance of the CRSP US Small Cap Growth Index, a broadly diversifiedindex of growth stocks of small U.S. companies. The Fund attempts to replicatethe target index by investing all, or substantially all, of its assets in the stocksthat make up the Index, holding each stock in approximately the same proportionas its weighting in the Index.
Principal RisksAn investment in the Fund could lose money over short or long periods of time.You should expect the Fund’s share price and total return to fluctuate within awide range. The Fund is subject to the following risks, which could affect theFund’s performance:
• Stock market risk, which is the chance that stock prices overall will decline.Stock markets tend to move in cycles, with periods of rising prices and periodsof falling prices. The Fund’s target index tracks a subset of the U.S. stock market,which could cause the Fund to perform differently from the overall stock market.In addition, the Fund’s target index may, at times, become focused in stocks of aparticular market sector, which would subject the Fund to proportionately higherexposure to the risks of that sector.
• Investment style risk, which is the chance that returns from small-capitalizationgrowth stocks will trail returns from the overall stock market. Historically,small-cap stocks have been more volatile in price than the large-cap stocks thatdominate the overall market, and they often perform quite differently. The stockprices of small companies tend to experience greater volatility because, amongother things, these companies tend to be more sensitive to changingeconomic conditions.
Because ETF Shares are traded on an exchange, they are subject toadditional risks:
53
• The Fund’s ETF Shares are listed for trading on NYSE Arca and are bought andsold on the secondary market at market prices. Although it is expected that themarket price of an ETF Share typically will approximate its net asset value (NAV),there may be times when the market price and the NAV differ significantly. Thus,you may pay more or less than NAV when you buy ETF Shares on the secondarymarket, and you may receive more or less than NAV when you sell those shares.
• Although the Fund’s ETF Shares are listed for trading on NYSE Arca, it ispossible that an active trading market may not be maintained.
• Trading of the Fund’s ETF Shares may be halted by the activation of individualor marketwide trading halts (which halt trading for a specific period of time whenthe price of a particular security or overall market prices decline by a specifiedpercentage). Trading of the Fund’s ETF Shares may also be halted if (1) theshares are delisted from NYSE Arca without first being listed on anotherexchange or (2) NYSE Arca officials determine that such action is appropriate inthe interest of a fair and orderly market or for the protection of investors.
An investment in the Fund is not a deposit of a bank and is not insured orguaranteed by the Federal Deposit Insurance Corporation or any othergovernment agency.
Annual Total ReturnsThe following bar chart and table are intended to help you understand the risksof investing in the Fund. The bar chart shows how the performance of the Fund‘sETF Shares (based on NAV) has varied from one calendar year to another overthe periods shown. The table shows how the average annual total returns of theETF Shares compare with those of the Fund’s target index and othercomparative indexes, which have investment characteristics similar to those ofthe Fund. The Spliced Small Cap Growth Index reflects the performance of theMSCI US Small Cap Growth Index through April 16, 2013, and the CRSP USSmall Cap Growth Index thereafter. Keep in mind that the Fund’s pastperformance (before and after taxes) does not indicate how the Fund willperform in the future. Updated performance information is available on ourwebsite at vanguard.com/performance or by calling Vanguard toll-free at800-662-7447.
54

Annual Total Returns — Vanguard Small-Cap Growth Index Fund ETF Shares
2010 2011 2012 2013 2014 2015 2016 2017 2018 2019
0%10%20%30%40%50%
-10%-20%
30.87
–1.43
17.67
38.18
4.02
–2.51
10.74
21.90
–5.68
32.75
During the periods shown in the bar chart, the highest and lowest returns for acalendar quarter were:
Total Return QuarterHighest 19.51% March 31, 2019Lowest -22.12% September 30, 2011
Average Annual Total Returns for Periods Ended December 31, 2019
1 Year 5 Years 10 YearsVanguard Small-Cap Growth Index Fund ETF Shares
Based on NAVReturn Before Taxes 32.75% 10.51% 13.65%Return After Taxes on Distributions 32.52 10.20 13.39Return After Taxes on Distributions and Sale of Fund Shares 19.47 8.23 11.41Based on Market PriceReturn Before Taxes 32.86 10.50 13.66Comparative Indexes(reflect no deduction for fees, expenses, or taxes)MSCI US Small Cap Growth Index 29.50% 9.49% 13.67%Spliced Small Cap Growth Index 32.75 10.46 13.57CRSP US Small Cap Growth Index 32.75 10.46 —
Actual after-tax returns depend on your tax situation and may differ from thoseshown in the preceding table. When after-tax returns are calculated, it isassumed that the shareholder was in the highest individual federal marginalincome tax bracket at the time of each distribution of income or capital gains orupon redemption. State and local income taxes are not reflected in thecalculations. Please note that after-tax returns are not relevant for a shareholderwho holds fund shares in a tax-deferred account, such as an individual retirementaccount or a 401(k) plan. Also, figures captioned Return After Taxes on
55
Distributions and Sale of Fund Shares may be higher than other figures for thesame period if a capital loss occurs upon redemption and results in an assumedtax deduction for the shareholder.
Investment AdvisorThe Vanguard Group, Inc. (Vanguard)
Portfolio Managers
William A. Coleman, CFA, Portfolio Manager at Vanguard. He has co-managedthe Fund since 2016.
Gerard C. O’Reilly, Principal of Vanguard. He has managed the Fund since 2004(co-managed since 2016).
Purchase and Sale of Fund SharesYou can buy and sell ETF Shares of the Fund through a brokerage firm. The priceyou pay or receive for ETF Shares will be the prevailing market price, which maybe more or less than the NAV of the shares. The brokerage firm may charge youa commission to execute the transaction. Unless imposed by your brokeragefirm, there is no minimum dollar amount you must invest and no minimumnumber of shares you must buy. ETF Shares of the Fund cannot be directlypurchased from or redeemed with the Fund, except by certain authorizedbroker-dealers. These broker-dealers may purchase and redeem ETF Shares onlyin large blocks (Creation Units), typically in exchange for baskets of securities.
Tax InformationThe Fund’s distributions may be taxable as ordinary income or capital gain. If youare investing through a tax-advantaged account, such as an IRA or anemployer-sponsored retirement or savings plan, special tax rules apply.
Payments to Financial IntermediariesThe Fund and its investment advisor do not pay financial intermediaries for salesof Fund shares.
56

Investing in Vanguard ETF®
Shares
What Are Vanguard ETF Shares?Vanguard ETF Shares are an exchange-traded class of shares issued by certainVanguard funds. ETF Shares represent an interest in the portfolio of stocks orbonds held by the issuing fund. The following ETF Shares are offered throughthis prospectus:
Vanguard Fund Vanguard ETF Shares Seeks to Track
Total Stock Market Index Fund Total Stock Market ETF The overall stock marketExtended Market Index Fund Extended Market ETF Mid- and small-cap stocksLarge-Cap Index Fund Large-Cap ETF Large-cap stocksMid-Cap Index Fund Mid-Cap ETF Mid-cap stocksSmall-Cap Index Fund Small-Cap ETF Small-cap stocksValue Index Fund Value ETF Large-cap value stocksMid-Cap Value Index Fund Mid-Cap Value ETF Mid-cap value stocksSmall-Cap Value Index Fund Small-Cap Value ETF Small-cap value stocksGrowth Index Fund Growth ETF Large-cap growth stocksMid-Cap Growth Index Fund Mid-Cap Growth ETF Mid-cap growth stocksSmall-Cap Growth Index Fund Small-Cap Growth ETF Small-cap growth stocks
In addition to ETF Shares, each Fund offers one or more conventional (notexchange-traded) classes of shares. This prospectus, however, relates only toETF Shares.
How Are Vanguard ETF Shares Different From Conventional MutualFund Shares?Conventional mutual fund shares can be directly purchased from and redeemedwith the issuing fund for cash at the net asset value (NAV), typically calculatedonce a day. ETF Shares, by contrast, cannot be purchased directly from orredeemed directly with the issuing fund by an individual investor. Rather, ETFShares can only be purchased or redeemed directly from the issuing fund bycertain authorized broker-dealers. These broker-dealers may purchase andredeem ETF Shares only in large blocks (Creation Units), usually in exchange forbaskets of securities and not for cash (although some funds issue and redeemCreation Units in exchange for cash or a combination of cash and securities).
An organized secondary trading market is expected to exist for ETF Shares,unlike conventional mutual fund shares, because ETF Shares are listed fortrading on a national securities exchange. Individual investors can purchase andsell ETF Shares on the secondary market through a broker. Secondary-markettransactions occur not at NAV, but at market prices that are subject to changethroughout the day based on the supply of and demand for ETF Shares, changesin the prices of the fund’s portfolio holdings, and other factors.
57

The market price of a fund’s ETF Shares typically will differ somewhat from theNAV of those shares. The difference between market price and NAV is expectedto be small most of the time, but in times of market disruption or extrememarket volatility, the difference may become significant.
How Do I Buy and Sell Vanguard ETF Shares?ETF Shares of the Funds are listed for trading on NYSE Arca. You can buy and sellETF Shares on the secondary market in the same way you buy and sell any otherexchange-traded security—through a broker. Your broker may charge acommission to execute a transaction. You will also incur the cost of the “bid-askspread,” which is the difference between the price a dealer will pay for a securityand the somewhat higher price at which the dealer will sell the same security.Because secondary-market transactions occur at market prices, you may paymore (premium) or less (discount) than NAV when you buy ETF Shares andreceive more or less than NAV when you sell those shares. In times of severemarket disruption, the bid-ask spread and premiums/discounts can increasesignificantly. Unless imposed by your broker, there is no minimum dollar amountyou must invest and no minimum number of ETF Shares you must buy.
Your ownership of ETF Shares will be shown on the records of the brokerthrough which you hold the shares. Vanguard will not have any record of yourownership. Your account information will be maintained by your broker, whichwill provide you with account statements, confirmations of your purchases andsales of ETF Shares, and tax information. Your broker also will be responsible forensuring that you receive income and capital gains distributions, as well asshareholder reports and other communications from the fund whose ETF Sharesyou own. You will receive other services (e.g., dividend reinvestment andaverage cost information) only if your broker offers these services.
58
Investing in Index Funds
What Is Indexing?Indexing is an investment strategy for tracking the performance of a specifiedmarket benchmark, or “index.” An index is a group of securities whose overallperformance is used as a standard to measure the investment performance of aparticular market. There are many types of indexes. Some represent entiremarkets—such as the U.S. stock market or the U.S. bond market. Other indexescover market segments—such as small-capitalization stocks or short-termbonds. One cannot invest directly in an index.
The index sponsor determines the securities to include in the index and theweighting of each security in the index. Under normal circumstances, the indexsponsor will rebalance an index on a regular schedule. An index sponsor maycarry out additional ad hoc index rebalances, delay or cancel a scheduledrebalance. Generally, the index sponsor does not provide any warranty, or acceptany liability, with respect to the quality, accuracy, or completeness of either thetarget index or its related data. Errors made by the index sponsor may occurfrom time to time and may not be identified by the index sponsor for a period oftime or at all. Vanguard does not provide any warranty or guarantee against sucherrors. Therefore, the gains, losses, or costs associated with the index sponsor’serrors will generally be borne by the index fund and its shareholders.
An index fund seeks to hold all, or a representative sample, of the securities thatmake up its target index. Index funds attempt to mirror the performance of thetarget index, for better or worse. However, an index fund generally does notperform exactly like its target index. For example, index funds have operatingexpenses and transaction costs. Market indexes do not, and therefore they willusually have a slight performance advantage over funds that track them. Theability of an index fund to match its performance to that of its target index canalso be impacted by, among other things, the timing and size of cash flows andthe size of the fund. Market disruptions and regulatory restrictions could alsohave an adverse effect on a fund’s ability to adjust its exposure to the requiredlevels in order to track the index.
Index funds typically have the following characteristics:
• Variety of investments. Index funds generally invest in the securities of avariety of companies and industries.
• Relative performance consistency. Because they seek to track marketbenchmarks, index funds usually do not perform dramatically better or worsethan their benchmarks.
• Low cost. Index funds are generally inexpensive to run compared with activelymanaged funds. They have low or no research costs and typically keep tradingactivity— and thus brokerage commissions and other transaction costs—to aminimum compared with actively managed funds.
59

More on the Funds and ETF Shares
This prospectus describes the principal risks you would face as a Fundshareholder. It is important to keep in mind one of the main principles ofinvesting: generally, the higher the risk of losing money, the higher the potentialreward. The reverse, also, is generally true: the lower the risk, the lower thepotential reward. As you consider an investment in any fund, you should takeinto account your personal tolerance for fluctuations in the securities markets.Look for this symbol throughout the prospectus. It is used to mark detailedinformation about the more significant risks that you would confront as a Fundshareholder. To highlight terms and concepts important to fund investors, wehave provided Plain Talk® explanations along the way. Reading the prospectuswill help you decide whether a Fund is the right investment for you. We suggestthat you keep this prospectus for future reference.
Share Class OverviewThis prospectus offers the Funds’ ETF Shares, an exchange-traded class ofshares. Separate prospectuses offer the Funds’ Investor Shares and AdmiralTM
Shares, which generally have investment minimums of $3,000. Additionalprospectuses offer the Funds’ Institutional Shares and Institutional Plus Shares (ifavailable), which are generally for investors who invest a minimum of $5 millionand $100 million, respectively. Other prospectuses for the Extended MarketIndex Fund and the Total Stock Market Index Fund offer Institutional SelectShares, which are generally for investors who invest a minimum of $3 billion and$5 billion, respectively.
All share classes offered by a Fund have the same investment objective,strategies, and policies. However, different share classes have differentexpenses; as a result, their investment returns will differ.
A Note to InvestorsVanguard ETF Shares can be purchased directly from the issuing Fund only bycertain authorized broker-dealers in exchange for a basket of securities (or, insome cases, for cash or a combination of cash and securities). Individualinvestors generally will not be able to purchase ETF Shares directly from a Fund.Instead, these investors will purchase ETF Shares on the secondary marketthrough a broker.
60

Plain Talk About Costs of Investing
Costs are an important consideration in choosing an ETF. That is becauseyou, as a shareholder, pay a proportionate share of the costs of operating afund and any transaction costs incurred when the fund buys or sellssecurities. These costs can erode a substantial portion of the gross incomeor the capital appreciation a fund achieves. Even seemingly small differencesin expenses can, over time, have a dramatic effect on a fund’s performance.
The following sections explain the principal investment strategies and policiesthat each Fund uses in pursuit of its objective. The Fund’s board of trustees,which oversees each Fund’s management, may change investment strategies orpolicies in the interest of shareholders without a shareholder vote, unless thosestrategies or policies are designated as fundamental. Under normalcircumstances, each Fund will invest at least 80% of its assets in the stocks thatmake up its target index. A Fund may change its 80% policy only upon 60 days’notice to shareholders.
Market Exposure
Each Fund is subject to stock market risk, which is the chance that stockprices overall will decline. Stock markets tend to move in cycles, withperiods of rising prices and periods of falling prices. Excluding the TotalStock Market Index Fund (which seeks to track the overall stock market),each Fund’s target index tracks a subset of the U.S. stock market, whichcould cause the Fund to perform differently from the overall stockmarket. In addition, each Fund’s target index may, at times, becomefocused in stocks of a particular market sector, which would subject theFund to proportionately higher exposure to the risks of that sector.
Keep in mind that the S&P 500 Index tracks mainly large-cap stocks. Historically,small- and mid-cap stocks have been more volatile than—and at times haveperformed quite differently from—the large-cap stocks of the S&P 500 Index.
Similarly, indexes that focus on growth stocks or value stocks will not necessarilyperform in the same way as the broader S&P 500 Index. Both growth and valuestocks have the potential at times to be more volatile than the broader markets.
Stocks of publicly traded companies are often classified according to marketcapitalization, which is the market value of a company’s outstanding shares.These classifications typically include small-cap, mid-cap, and large-cap. It is
61
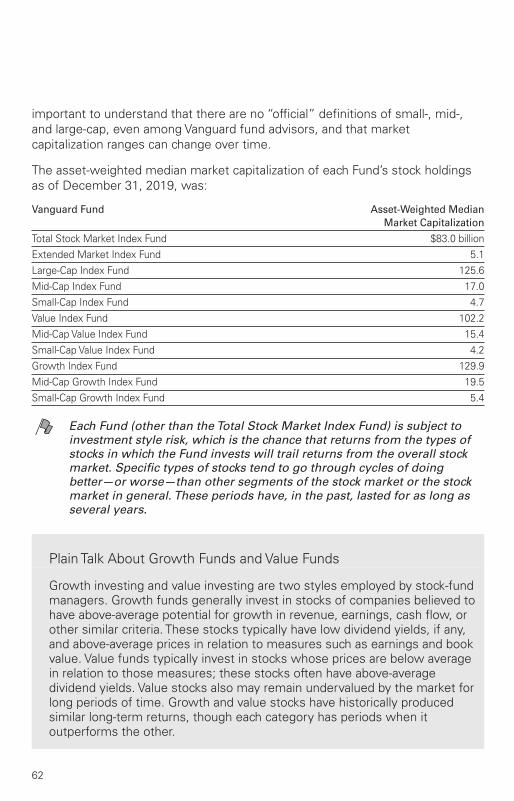
important to understand that there are no “official” definitions of small-, mid-,and large-cap, even among Vanguard fund advisors, and that marketcapitalization ranges can change over time.
The asset-weighted median market capitalization of each Fund’s stock holdingsas of December 31, 2019, was:
Vanguard Fund Asset-Weighted MedianMarket Capitalization
Total Stock Market Index Fund $83.0 billionExtended Market Index Fund 5.1Large-Cap Index Fund 125.6Mid-Cap Index Fund 17.0Small-Cap Index Fund 4.7Value Index Fund 102.2Mid-Cap Value Index Fund 15.4Small-Cap Value Index Fund 4.2Growth Index Fund 129.9Mid-Cap Growth Index Fund 19.5Small-Cap Growth Index Fund 5.4
Each Fund (other than the Total Stock Market Index Fund) is subject toinvestment style risk, which is the chance that returns from the types ofstocks in which the Fund invests will trail returns from the overall stockmarket. Specific types of stocks tend to go through cycles of doingbetter—or worse—than other segments of the stock market or the stockmarket in general. These periods have, in the past, lasted for as long asseveral years.
Plain Talk About Growth Funds and Value Funds
Growth investing and value investing are two styles employed by stock-fundmanagers. Growth funds generally invest in stocks of companies believed tohave above-average potential for growth in revenue, earnings, cash flow, orother similar criteria. These stocks typically have low dividend yields, if any,and above-average prices in relation to measures such as earnings and bookvalue. Value funds typically invest in stocks whose prices are below averagein relation to those measures; these stocks often have above-averagedividend yields. Value stocks also may remain undervalued by the market forlong periods of time. Growth and value stocks have historically producedsimilar long-term returns, though each category has periods when itoutperforms the other.
62
Security SelectionEach Fund attempts to track the investment performance of a benchmark indexthat measures the return of a particular market segment. The Total Stock MarketIndex Fund and Extended Market Index Fund use a sampling method ofindexing, meaning that the Fund’s advisor, using computer programs, generallyselects from the target index a representative sample of securities that willresemble the target index in terms of key risk factors and other characteristics.These include industry weightings, market capitalization, and other financialcharacteristics of stocks.
The Total Stock Market Index Fund and Extended Market Index Fund aresubject to index sampling risk, which is the chance that the securitiesselected for each Fund, in the aggregate, will not provide investmentperformance matching that of the Fund’s target index. Index samplingrisk for each Fund is expected to be low.
The remaining Funds use the replication method of indexing, meaning that eachFund generally holds the same stocks as its target index and in approximatelythe same proportions.
The Growth Index Fund is subject to nondiversification risk. In order toclosely track the composition of the Fund’s target index, the Fund’s totalassets are invested in multiple issuers representing more than 5% of theFund’s total assets. As a result, the Fund may become nondiversifiedunder the Investment Company Act of 1940, although it continues to holdmultiple stocks across a number of sectors. The Fund’s performance maybe hurt disproportionately by the poor performance of relatively fewstocks, or even a single stock, and the Fund’s shares may experiencesignificant fluctuations in value.
The Growth Index Fund is subject to sector risk, which is the chance thatsignificant problems will affect a particular sector, or that returns fromthat sector will trail returns from the overall stock market. Dailyfluctuations in specific market sectors are often more extreme or volatilethan fluctuations in the overall market. Because a significant portion ofthe Fund’s assets are invested in the information technology sector, theFund’s performance is impacted by the general condition of that sector.Companies in the information technology sector could be affected by,among other things, overall economic conditions, short product cycles,rapid obsolescence of products, competition, and government regulation.Sector risk is expected to be high for the Fund.
63

Other Investment Policies and RisksEach Fund reserves the right to substitute a different index for the index itcurrently tracks if the current index is discontinued, if the Fund’s agreement withthe sponsor of its target index is terminated, or for any other reason determinedin good faith by the Fund’s board of trustees. In any such instance, the substituteindex would represent the same market segment as the current index.
Each Fund may invest in foreign securities to the extent necessary to carry outits investment strategy of holding all, substantially all, or a representative sampleof the stocks that make up the index it tracks. It is not expected that any Fundwill invest more than 5% of its assets in foreign securities.
To track their target indexes as closely as possible, the Funds attempt to remainfully invested in stocks. To help stay fully invested and to reduce transactioncosts, the Funds may invest, to a limited extent, in derivatives, including equityfutures. The Funds may also use derivatives such as total return swaps to obtainexposure to a stock, a basket of stocks, or an index. Generally speaking, aderivative is a financial contract whose value is based on the value of a financialasset (such as a stock, a bond, or a currency), a physical asset (such as gold, oil,or wheat), a market index, or a reference rate. Investments in derivatives maysubject the Funds to risks different from, and possibly greater than, those ofinvestments directly in the underlying securities or assets. The Funds will notuse derivatives for speculation or for the purpose of leveraging (magnifying)investment returns.
Cash ManagementEach Fund’s daily cash balance may be invested in Vanguard Market LiquidityFund and/or Vanguard Municipal Cash Management Fund (each, a CMT Fund),which are low-cost money market funds. When investing in a CMT Fund, eachFund bears its proportionate share of the expenses of the CMT Fund in which itinvests. Vanguard receives no additional revenue from Fund assets invested in aCMT Fund.
Methods Used to Meet Redemption RequestsRedemptions of ETF Shares are typically met through a combination of cash andsecurities held by each Fund; see “How Are Vanguard ETF Shares Different FromConventional Mutual Fund Shares?” If cash is used to meet redemptions, theFund typically obtains such cash through positive cash flows or the sale of Fundholdings consistent with the Fund’s investment objective and strategy. Pleaseconsult the Fund’s Statement of Additional Information for further information onredemptions of ETF Shares.
64

Under certain circumstances, a Fund may borrow money (subject to certainregulatory conditions and if available under board-approved procedures) throughan interfund lending facility or through a bank line-of-credit, including a jointcommitted credit facility, in order to meet redemption requests.
Temporary Investment MeasuresEach Fund may temporarily depart from its normal investment policies andstrategies when the advisor believes that doing so is in the Fund’s best interest,so long as the strategy or policy employed is consistent with the Fund’sinvestment objective. For instance, a Fund may invest beyond its normal limits inderivatives or exchange-traded funds that are consistent with the Fund’sinvestment objective when those instruments are more favorably priced orprovide needed liquidity, as might be the case when the Fund receives largecash flows that it cannot prudently invest immediately.
Special Risks of Exchange-Traded Shares
ETF Shares are not individually redeemable. They can be redeemed withthe issuing Fund at NAV only by certain authorized broker-dealers and only inlarge blocks known as Creation Units. Consequently, if you want to liquidatesome or all of your ETF Shares, you must sell them on the secondary marketat prevailing market prices.
The market price of ETF Shares may differ from NAV. Although it isexpected that the market price of an ETF Share typically will approximate itsNAV, there may be times when the market price and the NAV differsignificantly. Thus, you may pay more (premium) or less (discount) than NAVwhen you buy ETF Shares on the secondary market, and you may receivemore or less than NAV when you sell those shares. These discounts andpremiums are likely to be greatest during times of market disruption orextreme market volatility.
Vanguard’s website at vanguard.com shows the previous day’s closing NAV andclosing market price for each Fund’s ETF Shares. The website also discloses, inthe Premium/Discount Analysis section of the ETF Shares’ Price & Performancepage, how frequently each Fund’s ETF Shares traded at a premium or discountto NAV (based on closing NAVs and market prices) and the magnitudes of suchpremiums and discounts.
65

An active trading market may not exist. Although Vanguard ETF Shares arelisted on a national securities exchange, it is possible that an active tradingmarket may not be maintained. Although this could happen at any time, it ismore likely to occur during times of severe market disruption. If you attemptto sell your ETF Shares when an active trading market is not functioning, youmay have to sell at a significant discount to NAV. In extreme cases, you maynot be able to sell your shares at all.
Trading may be halted. Trading of Vanguard ETF Shares on an exchange maybe halted by the activation of individual or marketwide trading halts (which halttrading for a specific period of time when the price of a particular security oroverall market prices decline by a specified percentage). Trading of ETF Sharesmay also be halted if (1) the shares are delisted from the listing exchangewithout first being listed on another exchange or (2) exchange officialsdetermine that such action is appropriate in the interest of a fair and orderlymarket or for the protection of investors.
Conversion PrivilegeOwners of conventional shares issued by a Fund may convert those shares toETF Shares of equivalent value of the same fund. Please note that investors whoown conventional shares through a 401(k) plan or other employer-sponsoredretirement or benefit plan generally may not convert those shares to ETF Sharesand should check with their plan sponsor or recordkeeper. ETF Shares, whetheracquired through a conversion or purchased on the secondary market, cannot beconverted to conventional shares by a shareholder. Also, ETF Shares of one fundcannot be exchanged for ETF Shares of another fund.
Note to investors in Vanguard Institutional Total Stock Market Index Fund:Owners of shares issued by Vanguard Institutional Total Stock Market Index Fundcannot convert their shares to ETF Shares of Vanguard Total Stock Market IndexFund because the Funds are separate and distinct. Vanguard Institutional TotalStock Market Index Fund currently does not issue ETF Shares.
You must hold ETF Shares in a brokerage account. Thus, before convertingconventional shares to ETF Shares, you must have an existing, or open a new,brokerage account. This account may be with Vanguard Brokerage Services
®or
with any other brokerage firm. To initiate a conversion of conventional shares toETF Shares, please contact your broker.
Vanguard Brokerage Services does not impose a fee on conversions fromVanguard conventional shares to Vanguard ETF Shares. However, otherbrokerage firms may charge a fee to process a conversion. Vanguard reservesthe right, in the future, to impose a transaction fee on conversions or to limit,temporarily suspend, or terminate the conversion privilege.
66

Converting conventional shares to ETF Shares is generally accomplished asfollows. First, after your broker notifies Vanguard of your request to convert,Vanguard will transfer your conventional shares from your account to thebroker’s omnibus account with Vanguard (an account maintained by the brokeron behalf of all its customers who hold conventional Vanguard fund sharesthrough the broker). After the transfer, Vanguard’s records will reflect your broker,not you, as the owner of the shares. Next, your broker will instruct Vanguard toconvert the appropriate number or dollar amount of conventional shares in itsomnibus account to ETF Shares of equivalent value, based on the respectiveNAVs of the two share classes.
Your Fund’s transfer agent will reflect ownership of all ETF Shares in the name ofthe Depository Trust Company (DTC). The DTC will keep track of which ETFShares belong to your broker, and your broker, in turn, will keep track of whichETF Shares belong to you.
Because the DTC is unable to handle fractional shares, only whole shares can beconverted. For example, if you owned 300.25 conventional shares, and this wasequivalent in value to 90.75 ETF Shares, the DTC account would receive 90 ETFShares. Conventional shares with a value equal to 0.75 ETF Shares (in thisexample, that would be 2.481 conventional shares) would remain in the broker’somnibus account with Vanguard. Your broker then could either (1) credit youraccount with 0.75 ETF Shares or (2) redeem the 2.481 conventional shares forcash at NAV and deliver that cash to your account. If your broker chose toredeem your conventional shares, you would realize a gain or loss on theredemption that must be reported on your tax return (unless you hold the sharesin an IRA or other tax-deferred account). Please consult your broker forinformation on how it will handle the conversion process, including whether itwill impose a fee to process a conversion.
If you convert your conventional shares to ETF Shares through VanguardBrokerage Services, all conventional shares for which you request conversionwill be converted to ETF Shares of equivalent value. Because no fractionalshares will have to be sold, the transaction will not be taxable.
Here are some important points to keep in mind when converting conventionalshares of a Vanguard fund to ETF Shares:
• The conversion process can take anywhere from several days to severalweeks, depending on your broker. Vanguard generally will process conversionrequests either on the day they are received or on the next business day.Vanguard imposes conversion blackout windows around the dates when a fundwith ETF Shares declares dividends. This is necessary to prevent a shareholder
67

from collecting a dividend from both the conventional share class currently heldand also from the ETF share class to which the shares will be converted.
• Until the conversion process is complete, you will remain fully invested in afund’s conventional shares, and your investment will increase or decrease invalue in tandem with the NAV of those shares.
• The conversion transaction is nontaxable except, if applicable, to the verylimited extent previously described.
A precautionary note to investment companies: Vanguard ETF Shares areissued by registered investment companies, and therefore the acquisition ofsuch shares by other investment companies is subject to the restrictions ofSection 12(d)(1) of the Investment Company Act of 1940. Vanguard has obtainedan SEC exemptive order that allows registered investment companies to investin the issuing funds beyond the limits of Section 12(d)(1), subject to certainterms and conditions, including the requirement to enter into a participationagreement with Vanguard.
Frequent Trading and Market-TimingUnlike frequent trading of a Vanguard fund’s conventional (i.e., notexchange-traded) classes of shares, frequent trading of ETF Shares does notdisrupt portfolio management or otherwise harm fund shareholders. The vastmajority of trading in ETF Shares occurs on the secondary market. Becausethese trades do not involve the issuing fund, they do not harm the fund or itsshareholders. Certain broker-dealers are authorized to purchase and redeem ETFShares directly with the issuing fund. Because these trades typically are effectedin kind (i.e., for securities and not for cash), or are assessed a transaction feewhen effected in cash, they do not cause any of the harmful effects to theissuing fund (as previously noted) that may result from frequent trading. Forthese reasons, the board of trustees of each fund that issues ETF Shares hasdetermined that it is not necessary to adopt policies and procedures to detectand deter frequent trading and market-timing of ETF Shares.
Portfolio HoldingsPlease consult the Fund’s Statement of Additional Information or our website fora description of the policies and procedures that govern disclosure of a Fund’sportfolio holdings.
Turnover RateAlthough the Funds generally seek to invest for the long term, each Fund maysell securities regardless of how long they have been held. Generally, an indexfund sells securities in response to redemption requests from shareholders ofconventional (not exchange-traded) shares or to changes in the composition of
68

its target index. Turnover rates for large-cap stock index funds tend to be lowbecause large-cap indexes typically do not change significantly from year to year.Turnover rates for mid-cap and small-cap stock index funds tend to be higherthan for large-cap stock index funds (although still relatively low, compared withactively managed stock funds) because the indexes they track are more likely tochange as a result of companies merging, growing, or failing. The FinancialHighlights section of this prospectus shows historical turnover rates for theFunds. A turnover rate of 100%, for example, would mean that a Fund had soldand replaced securities valued at 100% of its net assets within a one-yearperiod. In general, the greater the turnover rate, the greater the impacttransaction costs will have on a fund’s return. Also, funds with high turnoverrates may be more likely to generate capital gains, including short-term capitalgains, that must be distributed to shareholders and will be taxable toshareholders investing through a taxable account.
The Funds and Vanguard
Each Fund is a member of The Vanguard Group, a family of over 200 funds. All ofthe funds that are members of The Vanguard Group (other than funds of funds)share in the expenses associated with administrative services and businessoperations, such as personnel, office space, and equipment.
Vanguard Marketing Corporation provides marketing services to the funds.Although fund shareholders do not pay sales commissions or 12b-1 distributionfees, each fund (other than a fund of funds) or each share class of a fund (in thecase of a fund with multiple share classes) pays its allocated share of theVanguard funds’ marketing costs.
Plain Talk About Vanguard’s Unique Corporate Structure
The Vanguard Group is owned jointly by the funds it oversees and thusindirectly by the shareholders in those funds. Most other mutual funds areoperated by management companies that are owned by third parties—eitherpublic or private stockholders—and not by the funds they serve.
Investment Advisor
The Vanguard Group, Inc., P.O. Box 2600, Valley Forge, PA 19482, which beganoperations in 1975, serves as advisor to the Funds through its Equity IndexGroup. As of December 31, 2019, Vanguard served as advisor for approximately
69

$5 trillion in assets. Vanguard provides investment advisory services to theFunds pursuant to the Funds’ Service Agreement and subject to the supervisionand oversight of the trustees and officers of the Funds.
For the fiscal year ended December 31, 2019, the advisory expensesrepresented an effective annual rate of each Fund’s average net assets asfollows: for the Total Stock Market Index Fund, less than 0.01%; for theExtended Market Index, Mid-Cap Index, Small-Cap Index, Value Index, Small-CapValue Index, Growth Index, Small-Cap Growth Index, Large-Cap Index Funds,Mid-Cap Growth Index, and Mid-Cap Value Index Funds 0.01%.
Under the terms of an SEC exemption, the Funds’ board of trustees may,without prior approval from shareholders, change the terms of an advisoryagreement with a third-party investment advisor or hire a new third-partyinvestment advisor—either as a replacement for an existing advisor or as anadditional advisor. Any significant change in a Fund’s advisory arrangements willbe communicated to shareholders in writing. As the Funds’ sponsor and overallmanager, Vanguard may provide investment advisory services to a Fund at anytime. Vanguard may also recommend to the board of trustees that an advisor behired, terminated, or replaced or that the terms of an existing advisoryagreement be revised. The Funds have filed an application seeking a similar SECexemption with respect to investment advisors that are wholly ownedsubsidiaries of Vanguard. If the exemption is granted, the Funds may rely on thenew SEC relief.
For a discussion of why the board of trustees approved each Fund’s investmentadvisory arrangement, see the most recent semiannual reports to shareholderscovering the fiscal period ended June 30.
The managers primarily responsible for the day-to-day management of theFunds are:
Donald M. Butler, CFA, Principal of Vanguard. He has been with Vanguard since1992, has managed investment portfolios including the Extended Market IndexFund, since 1997 (co-managed since 2016); has managed the Mid-Cap Index andMid-Cap Value Index Funds since their inceptions in 2004 and 2006, respectively(co-managed since 2016); and has managed the Mid-Cap Growth Index Fundsince 2013 (co-managed since 2016). Education: B.S.B.A.,Shippensburg University.
70

William A. Coleman, CFA, Portfolio Manager at Vanguard. He has worked ininvestment management since joining Vanguard in 2006 has co-managed theExtended Market Index Fund since 2017; and has co-managed the Small-CapIndex, Small-Cap Value Index, and Small-Cap Growth Index Funds since 2016.Education: B.S., King’s College; M.S., Saint Joseph’s University.
Michael A. Johnson, Portfolio Manager at Vanguard. He has been with Vanguardsince 1999, has managed investment portfolios since 2010, and has co-managedthe Mid-Cap Index, Mid-Cap Value Index, Mid-Cap Growth Index, and Large-CapIndex Funds since 2016. Education: B.S.B.A., Shippensburg University.
Walter Nejman, Portfolio Manager at Vanguard. He has been with Vanguardsince 2005, has worked in investment management since 2008, and hasco-managed the Total Stock Market Index, Large-Cap Index, Value Index, andGrowth Index Funds since 2016. Education: B.A., Arcadia University; M.B.A.,Villanova University.
Gerard C. O’Reilly, Principal of Vanguard. He has been with Vanguard since1992, has managed investment portfolios since 1994; has managed the ValueIndex Fund since 1994 (co-managed since 2016); the Total Stock Market IndexFund since 2001 (co-managed since 2016); the Value Index and the Small-CapGrowth Index Funds since 2004 (co-managed since 2016); and has co-managedthe Small-Cap Index and Small-Cap Value Index Funds since 2016. Education:B.S., Villanova University.
The Funds’ Statement of Additional Information provides information about eachportfolio manager’s compensation, other accounts under management, andownership of shares of the Funds.
Dividends, Capital Gains, and Taxes
Fund DistributionsEach Fund distributes to shareholders virtually all of its net income (interest anddividends, less expenses) as well as any net short-term or long-term capitalgains realized from the sale of its holdings. Income dividends for the Fundsgenerally are distributed quarterly in March, June, September, and December.Capital gains distributions, if any, generally occur annually in December. Inaddition, each Fund may occasionally make a supplemental distribution at someother time during the year.
71

Plain Talk About Distributions
As a shareholder, you are entitled to your portion of a fund’s income frominterest and dividends as well as capital gains from the fund’s sale ofinvestments. Income consists of both the dividends that the fund earns fromany stock holdings and the interest it receives from any money market andbond investments. Capital gains are realized whenever the fund sellssecurities for higher prices than it paid for them. These capital gains areeither short-term or long-term, depending on whether the fund held thesecurities for one year or less or for more than one year.
Reinvestment of DistributionsIn order to reinvest dividend and capital gains distributions, investors in a Fund’sETF Shares must hold their shares at a broker that offers a reinvestment service.This can be the broker’s own service or a service made available by a third party,such as the broker’s outside clearing firm or the Depository Trust Company(DTC). If a reinvestment service is available, distributions of income and capitalgains can automatically be reinvested in additional whole and fractional ETFShares of the Fund. If a reinvestment service is not available, investors willreceive their distributions in cash. To determine whether a reinvestment serviceis available and whether there is a commission or other charge for using thisservice, consult your broker.
As with all exchange-traded funds, reinvestment of dividend and capital gainsdistributions in additional ETF Shares will occur four business days or more afterthe ex-dividend date (the date when a distribution of dividends or capital gains isdeducted from the price of a Fund’s shares). The exact number of days dependson your broker. During that time, the amount of your distribution will not beinvested in the Fund and therefore will not share in the Fund’s income, gains,and losses.
Basic Tax PointsInvestors in taxable accounts should be aware of the following basic federalincome tax points:
• Distributions are taxable to you whether or not you reinvest these amounts inadditional ETF Shares.
• Distributions declared in December—if paid to you by the end of January—aretaxable as if received in December.
• Any dividend distribution or short-term capital gains distribution that youreceive is taxable to you as ordinary income. If you are an individual and meet
72

certain holding-period requirements with respect to your ETF Shares, you maybe eligible for reduced tax rates on “qualified dividend income,” if any, distributedby the Fund.
• Any distribution of net long-term capital gains is taxable to you as long-termcapital gains, no matter how long you have owned ETF Shares.
• Capital gains distributions may vary considerably from year to year as a resultof the Funds’ normal investment activities and cash flows.
• A sale of ETF Shares is a taxable event. This means that you may have acapital gain to report as income, or a capital loss to report as a deduction, whenyou complete your tax return.
Individuals, trusts, and estates whose income exceeds certain thresholdamounts are subject to a 3.8% Medicare contribution tax on “net investmentincome.” Net investment income takes into account distributions paid by theFund and capital gains from any sale of ETF Shares.
Dividend distributions and capital gains distributions that you receive, as well asyour gains or losses from any sale of ETF Shares, may be subject to state andlocal income taxes.
This prospectus provides general tax information only. If you are investingthrough a tax-advantaged account, such as an IRA or an employer-sponsoredretirement or savings plan, special tax rules apply. Please consult your taxadvisor for detailed information about any tax consequences for you.
Share Price and Market Price
Share price, also known as net asset value (NAV), is calculated as of the close ofregular trading on the New York Stock Exchange (NYSE), generally 4 p.m.,Eastern time, on each day that the NYSE is open for business (a business day).In the rare event the NYSE experiences unanticipated disruptions and isunavailable at the close of the trading day, a Fund reserves the right to treat suchday as a business day and calculate NAVs as of the close of regular trading onthe Nasdaq (or another alternate exchange if the Nasdaq is unavailable, asdetermined at Vanguard’s discretion), generally 4 p.m., Eastern time. Each shareclass has its own NAV, which is computed by dividing the total assets, minusliabilities, allocated to the share class by the number of Fund shares outstandingfor that class. On U.S. holidays or other days when the NYSE is closed, the NAVis not calculated, and the Funds do not sell or redeem shares. However, onthose days the value of a Fund’s assets may be affected to the extent that theFund holds securities that change in value on those days (such as foreignsecurities that trade on foreign markets that are open).
73

Remember: If you buy or sell ETF Shares on the secondary market, you will payor receive the market price, which may be higher or lower than NAV. Yourtransaction will be priced at NAV only if you purchase or redeem your ETF Sharesin Creation Unit blocks (an option available only to certain authorizedbroker-dealers) or if you convert your conventional fund shares to ETF Shares.
Stocks held by a Vanguard fund are valued at their market value when reliablemarket quotations are readily available from the principal exchange or market onwhich they are traded. Such securities are generally valued at their official closingprice, the last reported sales price, or if there were no sales that day, the meanbetween the closing bid and asking prices. When a fund determines that marketquotations either are not readily available or do not accurately reflect the value ofa security, the security is priced at its fair value (the amount that the ownermight reasonably expect to receive upon the current sale of the security).
The values of any foreign securities held by a fund are converted into U.S. dollarsusing an exchange rate obtained from an independent third party as of the closeof regular trading on the NYSE. The values of any mutual fund shares, includinginstitutional money market fund shares, held by a fund are based on the NAVs ofthe shares. The values of any ETF shares or closed-end fund shares held by afund are based on the market value of the shares.
A fund also will use fair-value pricing if the value of a security it holds has beenmaterially affected by events occurring before the fund’s pricing time but afterthe close of the principal exchange or market on which the security is traded.This most commonly occurs with foreign securities, which may trade on foreignexchanges that close many hours before the fund’s pricing time. Interveningevents might be company-specific (e.g., earnings report, merger announcement)or country-specific or regional/global (e.g., natural disaster, economic or politicalnews, act of terrorism, interest rate change). Intervening events include pricemovements in U.S. markets that exceed a specified threshold or that areotherwise deemed to affect the value of foreign securities.
Fair-value pricing may be used for domestic securities—for example, if (1) tradingin a security is halted and does not resume before the fund’s pricing time or asecurity does not trade in the course of a day and (2) the fund holds enough ofthe security that its price could affect the NAV.
Fair-value prices are determined by Vanguard according to procedures adoptedby the board of trustees. When fair-value pricing is employed, the prices ofsecurities used by a fund to calculate the NAV may differ from quoted orpublished prices for the same securities.
74

Vanguard’s website will show the previous day’s closing NAV and closing marketprice for each Fund’s ETF Shares.
Additional InformationCGS identifiers have been provided by CUSIP Global Services, managed on behalf of the American BankersAssociation by Standard & Poor’s Financial Services, LLC, and are not for use or dissemination in a manner that wouldserve as a substitute for any CUSIP service. The CUSIP Database, ©2020 American Bankers Association. “CUSIP” is aregistered trademark of the American Bankers Association.
75

Inception Date
VanguardFund
NumberCUSIP
NumberTotal Stock Market Index Fund
ETF Shares 5/24/2001(Investor Shares—4/27/1992)
970 922908769
Extended Market Index Fund
ETF Shares 12/27/2001(Investor Shares—12/21/1987)
965 922908652
Large-Cap Index Fund
ETF Shares 1/27/2004(Investor Shares—1/30/2004)
961 922908637
Mid-Cap Index Fund
ETF Shares 1/26/2004(Investor Shares—5/21/1998)
939 922908629
Small-Cap Index Fund
ETF Shares 1/26/2004(Investor Shares—10/3/1960)
969 922908751
Value Index Fund
ETF Shares 1/26/2004(Investor Shares—11/2/1992)
966 922908744
Mid-Cap Value Index Fund
ETF Shares 8/17/2006(Investor Shares—8/24/2006)
935 922908512
Small-Cap Value Index Fund
ETF Shares 1/26/2004(Investor Shares—5/21/1998)
937 922908611
Growth Index Fund
ETF Shares 1/26/2004(Investor Shares—11/2/1992)
967 922908736
Mid-Cap Growth Index Fund
ETF Shares 8/17/2006(Investor Shares—8/24/2006)
932 922908538
Small-Cap Growth Index Fund
ETF Shares 1/26/2004(Investor Shares—5/21/1998)
938 922908595
Certain affiliates of the Funds and the advisor may purchase and resell ETFShares pursuant to the prospectus.
76

Financial Highlights
Financial highlights information is intended to help you understand a fund’sperformance for the past five years (or, if shorter, its period of operations).Certain information reflects financial results for a single fund share. Total returnrepresents the rate that an investor would have earned or lost each period on aninvestment in a fund or share class the Fund (assuming reinvestment of alldistributions). This information has been obtained from the financial statementsaudited by PricewaterhouseCoopers LLP, an independent registered publicaccounting firm, whose report, along with fund financial statements, is includedin a fund’s most recent annual report to shareholders. You may obtain a free copyof a fund’s latest annual or semiannual report, which is available upon request.
Vanguard Total Stock Market Index ETF Shares
Year Ended December 31,For a Share Outstanding Throughout Each Period 2019 2018 2017 2016 2015Net Asset Value, Beginning of Period $127.56 $137.06 $115.21 $104.34 $106.00
Investment Operations
Net Investment Income 2.8091 2.7811 2.3611 2.214 2.082Net Realized and Unrealized Gain (Loss) onInvestments
36.236 (9.676) 21.832 10.871 (1.675)
Total from Investment Operations 39.045 (6.895) 24.193 13.085 0.407Distributions
Dividends from Net Investment Income (2.905) (2.605) (2.343) (2.215) (2.067)Distributions from Realized Capital Gains — — — — —Total Distributions (2.905) (2.605) (2.343) (2.215) (2.067)Net Asset Value, End of Period $163.70 $127.56 $137.06 $115.21 $104.34
Total Return 30.80% –5.13% 21.16% 12.68% 0.40%
Ratios/Supplemental Data
Net Assets, End of Period (Millions) $138,067 $94,809 $91,862 $69,889 $57,434Ratio of Total Expenses to Average Net Assets 0.03% 0.03% 0.04% 0.04% 0.05%Ratio of Net Investment Income to Average NetAssets
1.89% 1.97% 1.87% 2.09% 1.96%
Portfolio Turnover Rate2 4% 3% 3% 4% 3%
1 Calculated based on average shares outstanding.2 Excludes the value of portfolio securities received or delivered as a result of in-kind purchases or redemptions of
the fund’s capital shares, including ETF Creation Units.
77

Vanguard Extended Market Index ETF Shares
Year Ended December 31,For a Share Outstanding Throughout Each Period 2019 2018 2017 2016 2015Net Asset Value, Beginning of Period $99.77 $111.72 $95.86 $83.80 $87.79
Investment Operations
Net Investment Income 1.6361 1.7421 1.4201 1.324 1.171Net Realized and Unrealized Gain (Loss) onInvestments
26.255 (12.036) 15.835 12.107 (4.033)
Total from Investment Operations 27.891 (10.294) 17.255 13.431 (2.862)Distributions
Dividends from Net Investment Income (1.641) (1.656) (1.395) (1.371) (1.128)Distributions from Realized Capital Gains — — — — —Total Distributions (1.641) (1.656) (1.395) (1.371) (1.128)Net Asset Value, End of Period $126.02 $99.77 $111.72 $95.86 $83.80
Total Return 28.04% –9.37% 18.10% 16.16% –3.26%
Ratios/Supplemental Data
Net Assets, End of Period (Millions) $8,119 $6,095 $5,711 $4,387 $4,272Ratio of Total Expenses to Average Net Assets 0.06% 0.07% 0.08% 0.08% 0.09%Ratio of Net Investment Income to Average NetAssets
1.40% 1.50% 1.37% 1.61% 1.33%
Portfolio Turnover Rate2 13% 10% 11% 12% 6%
1 Calculated based on average shares outstanding.2 Excludes the value of portfolio securities received or delivered as a result of in-kind purchases or redemptions of
the fund’s capital shares, including ETF Creation Units.
78

Vanguard Large-Cap Index ETF Shares
Year Ended December 31,For a Share Outstanding Throughout Each Period 2019 2018 2017 2016 2015Net Asset Value, Beginning of Period $114.77 $122.49 $102.27 $93.52 $94.36
Investment Operations
Net Investment Income 2.5811 2.5721 2.1681 2.018 1.850Net Realized and Unrealized Gain (Loss) onInvestments
33.204 (7.896) 20.196 8.754 (0.859)
Total from Investment Operations 35.785 (5.324) 22.364 10.772 0.991Distributions
Dividends from Net Investment Income (2.675) (2.396) (2.144) (2.022) (1.831)Distributions from Realized Capital Gains — — — — —Total Distributions (2.675) (2.396) (2.144) (2.022) (1.831)Net Asset Value, End of Period $147.88 $114.77 $122.49 $102.27 $93.52
Total Return 31.39% –4.44% 22.03% 11.65% 1.07%
Ratios/Supplemental Data
Net Assets, End of Period (Millions) $16,270 $12,358 $11,613 $8,468 $6,469Ratio of Total Expenses to Average Net Assets 0.04% 0.04% 0.05% 0.06% 0.08%Ratio of Net Investment Income to Average NetAssets
1.93% 2.04% 1.93% 2.14% 1.98%
Portfolio Turnover Rate2 5% 4% 3% 5% 4%
1 Calculated based on average shares outstanding.2 Excludes the value of portfolio securities received or delivered as a result of in-kind purchases or redemptions of
the fund’s capital shares, including ETF Creation Units.
79

Vanguard Mid-Cap Index ETF Shares
Year Ended December 31,For a Share Outstanding Throughout Each Period 2019 2018 2017 2016 2015Net Asset Value, Beginning of Period $138.08 $154.65 $131.55 $120.07 $123.50
Investment Operations
Net Investment Income 2.6631 2.5351 2.1121 1.877 1.793Net Realized and Unrealized Gain (Loss) onInvestments
40.043 (16.584) 23.076 11.510 (3.457)
Total from Investment Operations 42.706 (14.049) 25.188 13.387 (1.664)Distributions
Dividends from Net Investment Income (2.646) (2.521) (2.088) (1.907) (1.766)Distributions from Realized Capital Gains — — — — —Total Distributions (2.646) (2.521) (2.088) (1.907) (1.766)Net Asset Value, End of Period $178.14 $138.08 $154.65 $131.55 $120.07
Total Return 31.04% –9.21% 19.25% 11.23% –1.34%
Ratios/Supplemental Data
Net Assets, End of Period (Millions) $29,014 $21,261 $21,937 $16,544 $12,984Ratio of Total Expenses to Average Net Assets 0.04% 0.04% 0.05% 0.06% 0.08%Ratio of Net Investment Income to Average NetAssets
1.62% 1.62% 1.46% 1.54% 1.47%
Portfolio Turnover Rate2 15% 16% 14% 15% 15%
1 Calculated based on average shares outstanding.2 Excludes the value of portfolio securities received or delivered as a result of in-kind purchases or redemptions of
the fund’s capital shares, including ETF Creation Units.
80
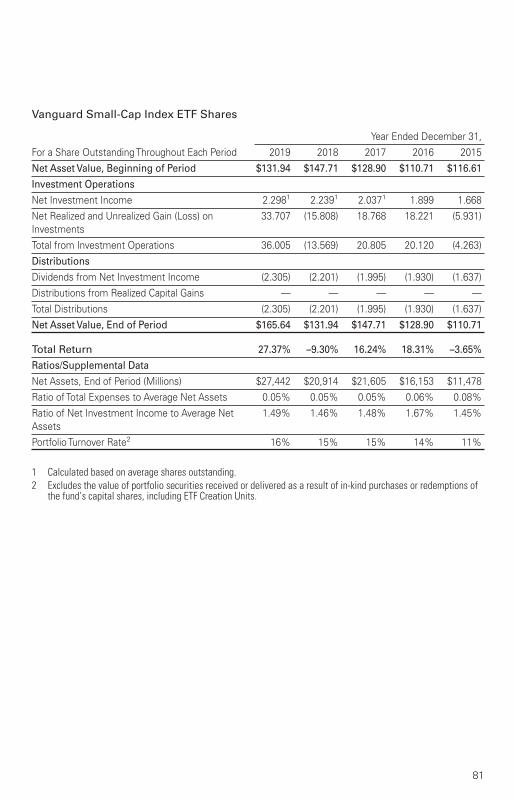
Vanguard Small-Cap Index ETF Shares
Year Ended December 31,For a Share Outstanding Throughout Each Period 2019 2018 2017 2016 2015Net Asset Value, Beginning of Period $131.94 $147.71 $128.90 $110.71 $116.61
Investment Operations
Net Investment Income 2.2981 2.2391 2.0371 1.899 1.668Net Realized and Unrealized Gain (Loss) onInvestments
33.707 (15.808) 18.768 18.221 (5.931)
Total from Investment Operations 36.005 (13.569) 20.805 20.120 (4.263)Distributions
Dividends from Net Investment Income (2.305) (2.201) (1.995) (1.930) (1.637)Distributions from Realized Capital Gains — — — — —Total Distributions (2.305) (2.201) (1.995) (1.930) (1.637)Net Asset Value, End of Period $165.64 $131.94 $147.71 $128.90 $110.71
Total Return 27.37% –9.30% 16.24% 18.31% –3.65%
Ratios/Supplemental Data
Net Assets, End of Period (Millions) $27,442 $20,914 $21,605 $16,153 $11,478Ratio of Total Expenses to Average Net Assets 0.05% 0.05% 0.05% 0.06% 0.08%Ratio of Net Investment Income to Average NetAssets
1.49% 1.46% 1.48% 1.67% 1.45%
Portfolio Turnover Rate2 16% 15% 15% 14% 11%
1 Calculated based on average shares outstanding.2 Excludes the value of portfolio securities received or delivered as a result of in-kind purchases or redemptions of
the fund’s capital shares, including ETF Creation Units.
81

Vanguard Value Index ETF Shares
Year Ended December 31,For a Share Outstanding Throughout Each Period 2019 2018 2017 2016 2015Net Asset Value, Beginning of Period $97.84 $106.14 $92.87 $81.56 $84.45
Investment Operations
Net Investment Income 3.0461 2.7221 2.4731 2.282 2.123Net Realized and Unrealized Gain (Loss) onInvestments
22.014 (8.352) 13.234 11.301 (2.890)
Total from Investment Operations 25.060 (5.630) 15.707 13.583 (0.767)Distributions
Dividends from Net Investment Income (3.000) (2.670) (2.437) (2.273) (2.123)Distributions from Realized Capital Gains — — — — —Total Distributions (3.000) (2.670) (2.437) (2.273) (2.123)Net Asset Value, End of Period $119.90 $97.84 $106.14 $92.87 $81.56
Total Return 25.85% –5.39% 17.12% 16.88% –0.89%
Ratios/Supplemental Data
Net Assets, End of Period (Millions) $55,909 $41,510 $36,560 $27,126 $18,648Ratio of Total Expenses to Average Net Assets 0.04% 0.04% 0.05% 0.06% 0.08%Ratio of Net Investment Income to Average NetAssets
2.76% 2.56% 2.52% 2.76% 2.58%
Portfolio Turnover Rate2 12% 8% 9% 7% 8%
1 Calculated based on average shares outstanding.2 Excludes the value of portfolio securities received or delivered as a result of in-kind purchases or redemptions of
the fund’s capital shares, including ETF Creation Units.
82
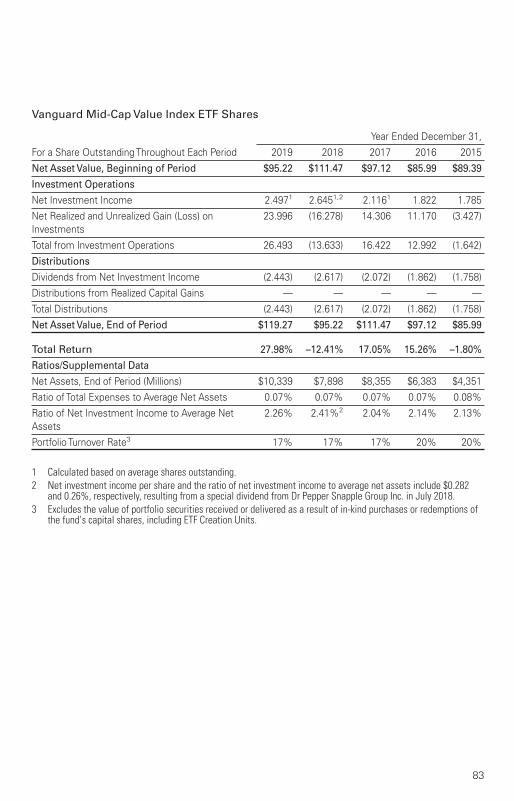
Vanguard Mid-Cap Value Index ETF Shares
Year Ended December 31,For a Share Outstanding Throughout Each Period 2019 2018 2017 2016 2015Net Asset Value, Beginning of Period $95.22 $111.47 $97.12 $85.99 $89.39
Investment Operations
Net Investment Income 2.4971 2.6451,2 2.1161 1.822 1.785Net Realized and Unrealized Gain (Loss) onInvestments
23.996 (16.278) 14.306 11.170 (3.427)
Total from Investment Operations 26.493 (13.633) 16.422 12.992 (1.642)Distributions
Dividends from Net Investment Income (2.443) (2.617) (2.072) (1.862) (1.758)Distributions from Realized Capital Gains — — — — —Total Distributions (2.443) (2.617) (2.072) (1.862) (1.758)Net Asset Value, End of Period $119.27 $95.22 $111.47 $97.12 $85.99
Total Return 27.98% –12.41% 17.05% 15.26% –1.80%
Ratios/Supplemental Data
Net Assets, End of Period (Millions) $10,339 $7,898 $8,355 $6,383 $4,351Ratio of Total Expenses to Average Net Assets 0.07% 0.07% 0.07% 0.07% 0.08%Ratio of Net Investment Income to Average NetAssets
2.26% 2.41%2 2.04% 2.14% 2.13%
Portfolio Turnover Rate3 17% 17% 17% 20% 20%
1 Calculated based on average shares outstanding.2 Net investment income per share and the ratio of net investment income to average net assets include $0.282
and 0.26%, respectively, resulting from a special dividend from Dr Pepper Snapple Group Inc. in July 2018.3 Excludes the value of portfolio securities received or delivered as a result of in-kind purchases or redemptions of
the fund’s capital shares, including ETF Creation Units.
83

Vanguard Small-Cap Value Index ETF Shares
Year Ended December 31,For a Share Outstanding Throughout Each Period 2019 2018 2017 2016 2015Net Asset Value, Beginning of Period $114.05 $132.71 $120.95 $98.81 $105.71
Investment Operations
Net Investment Income 2.8401 2.7201 2.4271 2.119 1.933Net Realized and Unrealized Gain (Loss) onInvestments
22.984 (18.702) 11.709 22.159 (6.870)
Total from Investment Operations 25.824 (15.982) 14.136 24.278 (4.937)Distributions
Dividends from Net Investment Income (2.824) (2.678) (2.376) (2.138) (1.963)Distributions from Realized Capital Gains — — — — —Total Distributions (2.824) (2.678) (2.376) (2.138) (1.963)Net Asset Value, End of Period $137.05 $114.05 $132.71 $120.95 $98.81
Total Return 22.76% –12.22% 11.79% 24.80% –4.67%
Ratios/Supplemental Data
Net Assets, End of Period (Millions) $14,808 $11,560 $12,650 $10,042 $5,679Ratio of Total Expenses to Average Net Assets 0.07% 0.07% 0.07% 0.07% 0.08%Ratio of Net Investment Income to Average NetAssets
2.19% 2.04% 1.94% 2.08% 1.90%
Portfolio Turnover Rate2 19% 18% 19% 18% 16%
1 Calculated based on average shares outstanding.2 Excludes the value of portfolio securities received or delivered as a result of in-kind purchases or redemptions of
the fund’s capital shares, including ETF Creation Units.
84

Vanguard Growth Index ETF Shares
Year Ended December 31,For a Share Outstanding Throughout Each Period 2019 2018 2017 2016 2015Net Asset Value, Beginning of Period $134.21 $140.55 $111.33 $106.40 $104.33
Investment Operations
Net Investment Income 1.7731 1.8071 1.6261 1.528 1.420Net Realized and Unrealized Gain (Loss) onInvestments
48.065 (6.373) 29.200 4.949 2.038
Total from Investment Operations 49.838 (4.566) 30.826 6.477 3.458Distributions
Dividends from Net Investment Income (1.738) (1.774) (1.606) (1.547) (1.388)Distributions from Realized Capital Gains — — — — —Total Distributions (1.738) (1.774) (1.606) (1.547) (1.388)Net Asset Value, End of Period $182.31 $134.21 $140.55 $111.33 $106.40
Total Return 37.26% –3.32% 27.80% 6.13% 3.32%
Ratios/Supplemental Data
Net Assets, End of Period (Millions) $46,481 $32,489 $31,399 $23,040 $20,706Ratio of Total Expenses to Average Net Assets 0.04% 0.04% 0.05% 0.06% 0.08%Ratio of Net Investment Income to Average NetAssets
1.09% 1.21% 1.27% 1.43% 1.34%
Portfolio Turnover Rate2 11% 11% 8% 11% 9%
1 Calculated based on average shares outstanding.2 Excludes the value of portfolio securities received or delivered as a result of in-kind purchases or redemptions of
the fund’s capital shares, including ETF Creation Units.
85

Vanguard Mid-Cap Growth Index ETF Shares
Year Ended December 31,For a Share Outstanding Throughout Each Period 2019 2018 2017 2016 2015Net Asset Value, Beginning of Period $119.58 $127.67 $105.60 $99.75 $101.57
Investment Operations
Net Investment Income 1.3861 1.0161 0.9321 0.863 0.805Net Realized and Unrealized Gain (Loss) onInvestments
39.040 (8.101) 22.058 5.848 (1.815)
Total from Investment Operations 40.426 (7.085) 22.990 6.711 (1.010)Distributions
Dividends from Net Investment Income (1.246) (1.005) (0.920) (0.861) (0.810)Distributions from Realized Capital Gains — — — — —Total Distributions (1.246) (1.005) (0.920) (0.861) (0.810)Net Asset Value, End of Period $158.76 $119.58 $127.67 $105.60 $99.75
Total Return 33.86% –5.60% 21.83% 6.75% –1.00%
Ratios/Supplemental Data
Net Assets, End of Period (Millions) $6,995 $4,956 $5,130 $3,576 $3,302Ratio of Total Expenses to Average Net Assets 0.07% 0.07% 0.07% 0.07% 0.08%Ratio of Net Investment Income to Average NetAssets
0.95% 0.76% 0.79% 0.86% 0.82%
Portfolio Turnover Rate2 18% 25% 23% 21% 23%
1 Calculated based on average shares outstanding.2 Excludes the value of portfolio securities received or delivered as a result of in-kind purchases or redemptions of
the fund’s capital shares, including ETF Creation Units.
86

Vanguard Small-Cap Growth Index ETF Shares
Year Ended December 31,For a Share Outstanding Throughout Each Period 2019 2018 2017 2016 2015Net Asset Value, Beginning of Period $150.57 $160.81 $133.07 $121.53 $125.88
Investment Operations
Net Investment Income 1.1751 1.2141 1.3201 1.416 1.202Net Realized and Unrealized Gain (Loss) onInvestments
48.077 (10.263) 27.731 11.563 (4.362)
Total from Investment Operations 49.252 (9.049) 29.051 12.979 (3.160)Distributions
Dividends from Net Investment Income (1.142) (1.191) (1.311) (1.439) (1.190)Distributions from Realized Capital Gains — — — — —Total Distributions (1.142) (1.191) (1.311) (1.439) (1.190)Net Asset Value, End of Period $198.68 $150.57 $160.81 $133.07 $121.53
Total Return 32.75% –5.68% 21.90% 10.74% –2.51%
Ratios/Supplemental Data
Net Assets, End of Period (Millions) $9,833 $7,286 $6,981 $5,328 $4,422Ratio of Total Expenses to Average Net Assets 0.07% 0.07% 0.07% 0.07% 0.08%Ratio of Net Investment Income to Average NetAssets
0.64% 0.70% 0.90% 1.15% 0.94%
Portfolio Turnover Rate2 18% 22% 19% 27% 23%
1 Calculated based on average shares outstanding.2 Excludes the value of portfolio securities received or delivered as a result of in-kind purchases or redemptions of
the fund’s capital shares, including ETF Creation Units.
87
CFA® is a registered trademark owned by CFA Institute.Vanguard funds are not sponsored, endorsed, sold, or promoted by the University of Chicago or its Center forResearch in Security Prices, and neither the University of Chicago nor its Center for Research in Security Prices makesany representation regarding the advisability of investing in the funds.The “Standard and Poor’s Completion Index” (the “Index”) is a product of S&P Dow Jones Indices LLC (“SPDJI”), andhas been licensed for use by Vanguard. Standard & Poor’s® and S&P® are registered trademarks of Standard & Poor’sFinancial Services LLC (“S&P”); Dow Jones® is a registered trademark of Dow Jones Trademark Holdings LLC (“DowJones”); S&P® and S&P 500® are trademarks of S&P; and these trademarks have been licensed for use by SPDJI andsublicensed for certain purposes by Vanguard. Vanguard Extended Market ETF is not sponsored, endorsed, sold orpromoted by SPDJI, Dow Jones, S&P, or any of their respective affiliates (collectively, “S&P Dow Jones Indices”). S&PDow Jones Indices makes no representation or warranty, express or implied, to the owners of Vanguard ExtendedMarket ETF or any member of the public regarding the advisability of investing in securities generally or in VanguardExtended Market ETF particularly or the ability of the Standard & Poor’s Completion Index to track general marketperformance. S&P Dow Jones Indices’ only relationship to Vanguard with respect to the Standard & Poor’sCompletion Index is the licensing of the Index and certain trademarks, service marks and/or trade names of S&P DowJones Indices and/or its licensors. The Standard & Poor’s Completion Index is determined, composed and calculatedby S&P Dow Jones Indices without regard to Vanguard or Vanguard Extended Market ETF. S&P Dow Jones Indiceshas no obligation to take the needs of Vanguard or the owners of Vanguard Extended Market ETF into consideration indetermining, composing or calculating the Standard and Poor’s Completion Index. S&P Dow Jones Indices is notresponsible for and has not participated in the determination of the prices, and amount of Vanguard Extended MarketETF or the timing of the issuance or sale of Vanguard Extended Market ETF or in the determination or calculation ofthe equation by which Vanguard Extended Market ETF is to be converted into cash, surrendered or redeemed, as thecase may be. S&P Dow Jones Indices has no obligation or liability in connection with the administration, marketing ortrading of Vanguard Extended Market ETF. There is no assurance that investment products based on the Standard andPoor’s Completion Index will accurately track index performance or provide positive investment returns. S&P DowJones Indices LLC is not an investment advisor. Inclusion of a security within an index is not a recommendation byS&P Dow Jones Indices to buy, sell, or hold such security, nor is it considered to be investment advice.S&P DOW JONES INDICES DOES NOT GUARANTEE THE ADEQUACY, ACCURACY, TIMELINESS AND/OR THECOMPLETENESS OF THE INDEX OR ANY DATA RELATED THERETO OR ANY COMMUNICATION, INCLUDING BUT NOTLIMITED TO, ORAL OR WRITTEN COMMUNICATION (INCLUDING ELECTRONIC COMMUNICATIONS) WITH RESPECTTHERETO. S&P DOW JONES INDICES SHALL NOT BE SUBJECT TO ANY DAMAGES OR LIABILITY FOR ANY ERRORS,OMISSIONS, OR DELAYS THEREIN. S&P DOW JONES INDICES MAKES NO EXPRESS OR IMPLIED WARRANTIES,AND EXPRESSLY DISCLAIMS ALL WARRANTIES, OF MERCHANTABILITY OR FITNESS FOR A PARTICULAR PURPOSEOR USE OR AS TO RESULTS TO BE OBTAINED BY VANGUARD, OWNERS OF VANGUARD EXTENDED MARKET INDEXFUND, OR ANY OTHER PERSON OR ENTITY FROM THE USE OF THE INDEX OR WITH RESPECT TO ANY DATARELATED THERETO. WITHOUT LIMITING ANY OF THE FOREGOING, IN NO EVENT WHATSOEVER SHALL S&P DOWJONES INDICES BE LIABLE FOR ANY INDIRECT, SPECIAL, INCIDENTAL, PUNITIVE, OR CONSEQUENTIAL DAMAGESINCLUDING BUT NOT LIMITED TO, LOSS OF PROFITS, TRADING LOSSES, LOST TIME OR GOODWILL, EVEN IF THEYHAVE BEEN ADVISED OF THE POSSIBILITY OF SUCH DAMAGES, WHETHER IN CONTRACT, TORT, STRICT LIABILITY,OR OTHERWISE. THERE ARE NO THIRD PARTY BENEFICIARIES OF ANY AGREEMENTS OR ARRANGEMENTSBETWEEN S&P DOW JONES INDICES AND VANGUARD, OTHER THAN THE LICENSORS OF S&P DOWJONES INDICES.
88

Glossary of Investment Terms
Authorized Participant. Institutional investors that are permitted to purchaseCreation Units directly from, and redeem Creation Units directly with, the issuingfund. To be an Authorized Participant, an entity must be a participant in theDepository Trust Company and must enter into an agreement with thefund’s Distributor.
Bid-Ask Spread. The difference between the price a dealer is willing to pay for asecurity (the bid price) and the somewhat higher price at which the dealer iswilling to sell the same security (the ask price).
Capital Gains Distributions. Payments to fund shareholders of gains realized onsecurities that a fund has sold at a profit, minus any realized losses.
Common Stock. A security representing ownership rights in a corporation.
Creation Unit. A large block of a specified number of ETF Shares. Certainbroker-dealers known as “Authorized Participants” may purchase and redeemETF Shares from the issuing fund in Creation Unit size blocks.
Dividend Distributions. Payments to fund shareholders of income from interestor dividends generated by a fund’s investments.
Ex-Dividend Date. The date when a distribution of dividends and/or capital gainsis deducted from the share price of a mutual fund, ETF, or stock. On theex-dividend date, the share price drops by the amount of the distribution pershare (plus or minus any market activity).
Expense Ratio. A fund’s total annual operating expenses expressed as apercentage of the fund’s average net assets. The expense ratio includesmanagement and administrative expenses, but it does not include thetransaction costs of buying and selling portfolio securities.
Inception Date. The date on which the assets of a fund (or one of its shareclasses) are first invested in accordance with the fund’s investment objective.For funds with a subscription period, the inception date is the day after thatperiod ends. Investment performance is generally measured from theinception date.
Indexing. A low-cost investment strategy in which a fund attempts totrack—rather than outperform—a specified market benchmark, or “index.”
89

Joint Committed Credit Facility. Each Fund participates, along with other fundsmanaged by Vanguard, in a committed credit facility provided by a syndicate oflenders pursuant to a credit agreement that may be renewed annually; eachVanguard fund is individually liable for its borrowings, if any, under the creditfacility. The amount and terms of the committed credit facility are subject toapproval by the Funds’ board of trustees and renegotiation with the lendersyndicate on an annual basis.
Median Market Capitalization. An indicator of the size of companies in which afund invests; the midpoint of market capitalization (market price x sharesoutstanding) of a fund’s stocks, weighted by the proportion of the fund’s assetsinvested in each stock. Stocks representing half of the fund’s assets have marketcapitalizations above the median, and the rest are below it.
MSCI US Broad Market Index. An index that tracks virtually all stocks that tradein the U.S. stock market.
MSCI US Mid Cap 450 Index. An index that tracks the stocks of approximately450 mid-capitalization companies in the U.S. market.
MSCI US Mid Cap Growth Index. An index that tracks the growth companiesof the MSCI US Mid Cap 450 Index as identified by factors such as historicalsales growth and expected earnings growth.
MSCI US Mid Cap Value Index. An index that tracks the value companies of theMSCI US Mid Cap 450 Index as identified by factors such as book value to priceratio, earnings to price ratio, and dividend yield.
MSCI US Prime Market 750 Index. An index that tracks the stocks ofapproximately 750 large- and mid-capitalization companies representing the vastmajority of U.S. stock market capitalization.
MSCI US Prime Market Growth Index. An index that tracks the growthcompanies of the MSCI US Prime Market 750 Index as identified by factors suchas historical sales growth and expected earnings growth.
MSCI US Prime Market Value Index. An index that tracks the value companiesof the MSCI US Prime Market 750 Index as identified by factors such as bookvalue to price ratio, earnings to price ratio, and dividend yield.
MSCI US Small Cap 1750 Index. An index that tracks the stocks ofapproximately 1,750 small-capitalization companies in the U.S. market.
90
MSCI US Small Cap Growth Index. An index that tracks the growth companiesof the MSCI US Small Cap 1750 Index as identified by factors such as historicalsales growth and expected earnings growth.
MSCI US Small Cap Value Index. An index that tracks the value companies ofthe MSCI US Small Cap 1750 Index as identified by factors such as book value toprice ratio, earnings to price ratio, and dividend yield.
Mutual Fund. An investment company that pools the money of many peopleand invests it in a variety of securities in an effort to achieve a specific objectiveover time.
New York Stock Exchange (NYSE). A stock exchange based in New York Citythat is open for regular trading on business days, Monday through Friday, from9:30 a.m. to 4 p.m., Eastern time.
Price/Earnings (P/E) Ratio. The current share price of a stock, divided by itsper-share earnings (profits). A stock selling for $20, with earnings of $2 pershare, has a price/earnings ratio of 10.
Securities. Stocks, bonds, money market instruments, and other investments.
Total Return. A percentage change, over a specified time period, in a fund’s netasset value, assuming the reinvestment of all distributions of dividends andcapital gains.
Volatility. The fluctuations in value of a mutual fund or other security. The greatera fund’s volatility, the wider the fluctuations in its returns.
Yield. Income (interest or dividends) earned by an investment, expressed as apercentage of the investment’s price.
91

This page intentionally left blank.

This page intentionally left blank.

Connect with Vanguard®
> vanguard.com
For More InformationIf you would like more information about VanguardU.S. Stock ETFs, the following documents are availablefree upon request:
Annual/Semiannual Reports to ShareholdersAdditional information about the Funds’ investments isavailable in the Funds’ annual and semiannual reportsto shareholders. In the annual reports, you will find adiscussion of the market conditions and investmentstrategies that significantly affected the Funds’performance during their last fiscal year.
Statement of Additional Information (SAI)The SAI provides more detailed information about theFunds’ ETF Shares and is incorporated by reference into(and thus legally a part of) this prospectus.
To receive a free copy of the latest annual orsemiannual reports or the SAI, or to request additionalinformation about Vanguard ETF Shares, please visitvanguard.com or contact us as follows:
Telephone: 866-499-8473; Text telephone for peoplewith hearing impairment: 800-749-7273
Information Provided by the Securities andExchange Commission (SEC)Reports and other information about the Funds areavailable in the EDGAR database on the SEC’s websiteat www.sec.gov, or you can receive copies of thisinformation, for a fee, by electronic request at thefollowing email address: [email protected].
Funds’ Investment Company Act file number: 811-02652
© 2020 The Vanguard Group, Inc. All rights reserved.U.S. Patent Nos. 6,879,964; 7,337,138; 7,720,749; 7,925,573; 8,090,646;and 8,417,623.Vanguard Marketing Corporation, Distributor.
P 961 042020