vapor leaks: pressure’s building -...
TRANSCRIPT

Presented by
Gary S. Lynn, P.E.
Vapor Leaks: Pressure’s Building

What Causes Vapor Leaks?UST Pressurization
Delivery Pressure SpikesStage II System Design and Operation
Vapor GrowthA/L Ratio > 1ORVR System Incompatibility
Leaky Components

Stage I vs Stage II Vapor RecoveryStage I - Recovering Vapors While Filling UST
Stage II - Recovering Vapors While Filling Vehicle
Courtesy Gilbarco/Veeder Root

ORVR Vehicle Tank
Vapors are routed to ORVR canister. Fill pipe diameter narrowsafter unleaded restrictor plate. This creates a liquid seal that forcesvapors into ORVR canister. It also causes an inward flow of air intothe fill pipe. There is no vapor for a vacuum assist system to recover.Vacuum assist systems return air to UST.

Leaky Components
Atmospheric LeaksPressure Vents, Dispenser Leaks, Nozzles
Subsurface LeaksDry Breaks, ATG Covers, Fill Caps, threaded connections…..
Fixing Atmospheric Leaks Promotes Subsurface Leaks

Why are Vapor Leaks Important?
Numerous Vulnerable Systems PresentStage I Systems – Most of Existing TanksStage II Systems – 45,000 USTs
Leaks are CommonNH Pressure Decay vs. MtBE Concentration Study
Suggests 75% of Stage II stations with leaks Leaks, when present, average 30ppm MtBE near UST

Why are Vapor Leaks Important?
Volatile Constituent ProblemVolatile components concentrate in vapor phase, represents high % of mass in leak
MtBE low biodegradability yields MtBE dominant sites (Lahvis API modeling, NH DES site review)
Reimbursement Fund SpendingReceptor Threats
Benzene, Ethanol high biodegradability yields DO sink?

Vapor Composition FactorLiquid/Gas Composition*
RFG Gas Composition
Vp (mm Hg)
Constituent
15 / 46.3%15%1824 to 151
Butanes, pentanes, hexanes & enes
2.2 / 5.2%18.2 / 7.8%4 / 0.6%15.4 / 2.1%
0 to 4.9%1 to 20%.2 to 4%1 to 18%
8628106.6-8.7
BenzeneTolueneEthylbenzeneXylenes
3.7 / 9.3%10 to 15%251MtBE
* Example composition from Lauri Saarinen People and Work Research Report 51. Note: Ethanol has a vapor pressure of 53 mm.

NH Studies
NH Site Data Review (MtBE only or dominant sites at approximately 30% of the NH Stage II System Equipped Sites)UST System Pressures ProfilingStage I System Vapor LeaksStage II System Pressure Reduction

-1
-0 .5
0
0 .5
1
1 .5
2
2 .5
3
3 .5
4
03/
30/0
4 1
1:29
:22
03/
30/0
4 1
9:49
:22
03/
31/0
4 0
4:09
:22
03/
31/0
4 1
2:29
:22
03/
31/0
4 2
0:49
:22
04/
01/0
4 0
5:09
:22
04/
01/0
4 1
3:29
:22
04/
01/0
4 2
1:49
:22
04/
02/0
4 0
6:09
:22
04/
02/0
4 1
4:29
:22
04/
02/0
4 2
2:49
:22
04/
03/0
4 0
7:09
:22
04/
03/0
4 1
5:29
:22
04/
03/0
4 2
3:49
:22
04/
04/0
4 0
8:09
:22
04/
04/0
4 1
6:29
:22
04/
05/0
4 0
0:49
:22
04/
05/0
4 0
9:09
:22
04/
05/0
4 1
7:29
:22
04/
08/0
4 1
4:52
:00
UST
Pres
sure
(in
wc)
Delivery Event Delivery
Event
Stage II - Balance System Pressure Profile

Plaistow Citgo, New HampshireUST pressure in inwc
-8
-6
-4
-2
0
2
4
6
8
10
07/1
4/04
12:
45:0
9
07/1
5/04
05:
25:0
9
07/1
5/04
22:
05:0
9
07/1
6/04
14:
45:0
9
07/1
7/04
07:
25:0
9
07/1
8/04
00:
05:0
9
07/1
8/04
16:
45:0
9
07/1
9/04
09:
25:0
9
07/2
0/04
02:
05:0
9
07/2
0/04
18:
45:0
9
07/2
1/04
11:
25:0
9
07/2
2/04
04:
05:0
9
07/2
2/04
20:
45:0
9
07/2
3/04
13:
25:0
9
07/2
4/04
06:
05:0
9
07/2
4/04
22:
45:0
9
07/2
5/04
15:
25:0
9
07/2
6/04
08:
05:0
9
07/2
7/04
00:
45:0
9
07/2
7/04
17:
25:0
9
07/2
8/04
10:
05:0
9
in w
c
Delivery spike
Delivery spike
Delivery Spike

O'Briens, a tighter vacuum assist systemUST pressure in inwc
-8-7.5
-7-6.5
-6-5.5
-5-4.5
-4-3.5
-3-2.5
-2-1.5
-1-0.5
00.5
11.5
22.5
33.5
44.5
04/2
2/04
07:
57:36
04/2
2/04
13:
22:21
04/2
2/04
17:
22:21
04/2
2/04
21:
22:21
04/2
3/04
01:
22:21
04/2
3/04
05:
22:21
04/2
3/04
09:
22:21
04/2
3/04
13:
22:21
04/2
3/04
17:
22:21
04/2
3/04
21:
22:21
04/2
4/04
01:
22:21
04/2
4/04
05:
22:21
04/2
4/04
09:
22:21
04/2
4/04
13:
22:21
04/2
4/04
17:
22:21
04/2
4/04
21:
22:21
04/2
5/04
01:
22:21
04/2
5/04
05:
22:21
04/2
5/04
09:
22:21
04/2
5/04
13:
22:21
04/2
5/04
17:
22:21
04/2
5/04
21:
22:21
04/2
6/04
01:
22:21
04/2
6/04
05:
22:21
04/2
6/04
09:
22:21
04/2
6/04
13:
22:21
04/2
6/04
17:
22:21
04/2
6/04
21:
22:21
04/2
7/04
01:
22:21
04/2
7/04
05:
22:21
in wc
Pressure Bleeds Out at Night
UST Pressure Builds During the Day

-8-7.5
-7-6.5
-6-5.5
-5-4.5
-4-3.5
-3-2.5
-2-1.5
-1-0.5
00.5
11.5
22.5
33.5
44.5
55.5
6
09/1
5/04
11:
16:4
509
/15/
04 1
7:56
:45
09/1
6/04
00:
36:4
509
/16/
04 0
7:16
:45
09/1
6/04
13:
56:4
509
/16/
04 2
0:36
:45
09/1
7/04
03:
16:4
509
/17/
04 0
9:56
:45
09/1
7/04
16:
36:4
509
/17/
04 2
3:16
:45
09/1
8/04
05:
56:4
509
/18/
04 1
2:36
:45
09/1
8/04
19:
16:4
509
/19/
04 0
1:56
:45
09/1
9/04
08:
36:4
509
/19/
04 1
5:16
:45
09/1
9/04
21:
56:4
509
/20/
04 0
4:36
:45
09/2
0/04
11:
16:4
509
/20/
04 1
7:56
:45
09/2
1/04
00:
36:4
509
/21/
04 0
7:16
:45
09/2
1/04
13:
56:4
509
/21/
04 2
0:36
:45
09/2
2/04
03:
16:4
509
/22/
04 0
9:56
:45
09/2
2/04
16:
36:4
509
/22/
04 2
3:16
:45
09/2
3/04
05:
56:4
509
/23/
04 1
2:36
:45
09/2
3/04
19:
16:4
509
/24/
04 0
1:56
:45
09/2
4/04
08:
36:4
509
/24/
04 1
5:16
:45
09/2
4/04
21:
56:4
509
/25/
04 0
4:36
:45
09/2
5/04
11:
16:4
509
/25/
04 1
7:56
:45
09/2
6/04
00:
36:4
509
/26/
04 0
7:16
:45
09/2
6/04
13:
56:4
509
/26/
04 2
0:36
:45
09/2
7/04
03:
16:4
509
/27/
04 0
9:56
:45
09/2
7/04
16:
36:4
509
/27/
04 2
3:16
:45
09/2
8/04
05:
56:4
5
in w
c
Delivery spike
More Delivery spikes
Leak repairs on 9/23/04
Healy ORVR Nozzle
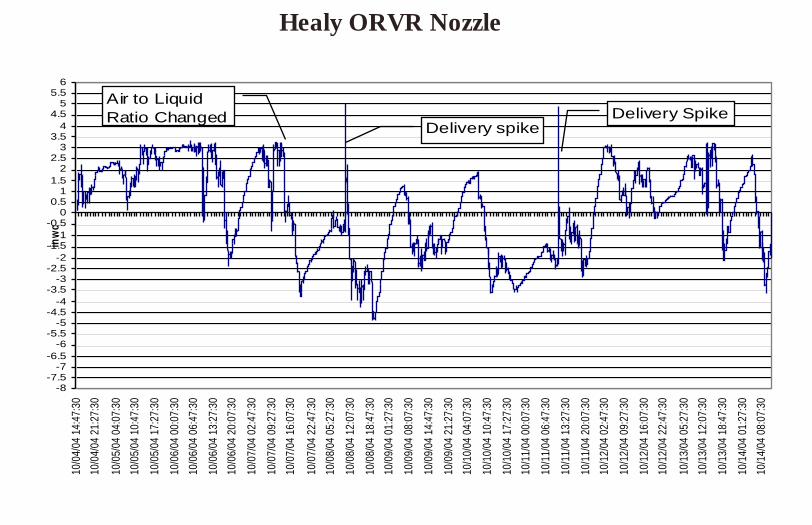
Healy ORVR Nozzle
-8-7.5
-7-6.5
-6-5.5
-5-4.5
-4-3.5
-3-2.5
-2-1.5
-1-0.5
00.5
11.5
22.5
33.5
44.5
55.5
610
/04/
04 1
4:47
:30
10/0
4/04
21:
27:3
0
10/0
5/04
04:
07:3
010
/05/
04 1
0:47
:30
10/0
5/04
17:
27:3
0
10/0
6/04
00:
07:3
010
/06/
04 0
6:47
:30
10/0
6/04
13:
27:3
010
/06/
04 2
0:07
:30
10/0
7/04
02:
47:3
0
10/0
7/04
09:
27:3
010
/07/
04 1
6:07
:30
10/0
7/04
22:
47:3
010
/08/
04 0
5:27
:30
10/0
8/04
12:
07:3
0
10/0
8/04
18:
47:3
010
/09/
04 0
1:27
:30
10/0
9/04
08:
07:3
0
10/0
9/04
14:
47:3
0
10/0
9/04
21:
27:3
010
/10/
04 0
4:07
:30
10/1
0/04
10:
47:3
0
10/1
0/04
17:
27:3
010
/11/
04 0
0:07
:30
10/1
1/04
06:
47:3
0
10/1
1/04
13:
27:3
0
10/1
1/04
20:
07:3
010
/12/
04 0
2:47
:30
10/1
2/04
09:
27:3
0
10/1
2/04
16:
07:3
010
/12/
04 2
2:47
:30
10/1
3/04
05:
27:3
010
/13/
04 1
2:07
:30
10/1
3/04
18:
47:3
0
10/1
4/04
01:
27:3
010
/14/
04 0
8:07
:30
in wc
Delivery spike
Air to Liquid Ratio Changed Delivery Spike

Stage I Leak Study
Fremont Village Market Shallow, thin overburden aquifer (2 to 5 feet water table, 15 feet to bedrock)BTEX contamination in one well (original release)New MtBE problem impacting surrounding dug wells (2 wells with treatment systems 6 wells total impacted)MtBE at approximately 1 ppm in groundwater

Addressing the Stage I leakSVE system installed in tank gravel packVapor release during fuel deliveries observed in vapors collected by SVEVapor releases identified and repaired during subsequent inspectionRevisit to observe changes in vapor collection during deliveries pending

SVE System Shed

0
10
20
30
40
50
60
8 : 00 9: 00 1 0 :0 0 1 1 :0 0 1 2 :0 0 13 :0 0 14 : 00 1 5: 00 1 6: 00 1 7: 0 0
Ti me
Start and End of Fuel Delivery
Fremont – SVE TVOC vs. Time
Return to Background

SVE Influent Grab Sample for Fremont Site
4,910Hexane2,850Heptane
14,000Toluene
118,000MtBE
2,070Xylenes and all others
5,330Benzene
Results PPBvContaminant

Solution: SVE + Inspection & Repair
Delivery Inspection by former UST Inspector, now remedial program PMLeaks found at dry break and several ATGs
Dry break may have been bypassedLast delivery of route, 2AM deliveries
SVE operation bracketing delivery (timer set for Thursday thru Sunday)
MtBE at 41ppb versus up to 1,760 ppb prior to intervention

Fremont Site Dry Break
Dry break vapor leak

Dry Break
Scored by Screwdriver?

Fremont Site ATG Cover
Leaking Threaded Connection
Note: Gravel pack around sump

Stage II Leak Study
Waterhouse Country Store MtBE concentrations in groundwater detected above 400,000 ppbLimited BTEX in groundwaterMtBE only contaminant above soil standards5 private wells with MtBE treatment systemsDouble wall tank and piping, in complianceVacuum assist vapor recovery system/vapor release concern

Addressing the Stage II LeakProfile UST System Operating Pressures and Document Release(s)
Tank pressure monitoring w/ data loggerPraxair Enhanced TracerTight testing
Reduce Pressures with Vaporsaver Monitor Long-term Changes in MtBE Concentrations in Groundwater
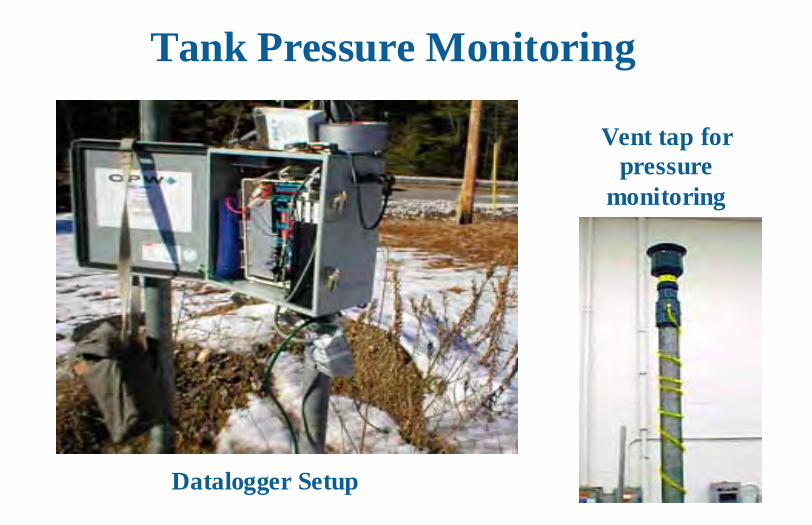
Tank Pressure Monitoring
Datalogger Setup
Vent tap for pressure
monitoring

Waterhouse in WindhamUST pressure UST inwc
-5.0
-4.5
-4.0
-3.5
-3.0
-2.5
-2.0
-1.5
-1.0
-0.5
0.0
0.5
1.0
1.5
2.0
2.5
3.0
02/1
1/0
4 1
1:13
:20
02/1
2/0
4 1
8:43
:39
02/1
3/0
4 0
3:03
:39
02/1
3/0
4 1
1:23
:39
02/1
3/0
4 1
9:43
:39
02/1
4/0
4 0
4:03
:39
02/1
4/0
4 1
2:23
:39
02/1
4/0
4 2
0:43
:39
02/1
5/0
4 0
5:03
:39
02/1
5/0
4 1
3:23
:39
02/1
5/0
4 2
1:43
:39
02/1
6/0
4 0
6:03
:39
02/1
6/0
4 1
4:23
:39
02/1
6/0
4 2
2:43
:39
02/1
7/0
4 0
7:03
:39
02/1
7/0
4 1
5:23
:39
02/1
7/0
4 2
3:43
:39
02/1
8/0
4 0
8:03
:39
in w
c
OPW Vaporsaver 1 operating
UST pressure flat line at night indicates leak.
UST pressure builds during customer dispensing times, drops to atmospheric overnight
Deliveries

Vaporsaver Installation
Vaporsaver and temporary base
Custom fitting for vent withdrawal and return

Test SiteUST pressure UST inwc
-0.90
-0.80
-0.70
-0.60
-0.50
-0.40
-0.30
-0.20
-0.10
0.00
0.10
0.20
0.30
0.40
0.50
0.60
0.70
0.80
0.90
02/1
8/04
06:
00:3
9
02/1
8/04
06:
30:3
9
02/1
8/04
07:
00:3
9
02/1
8/04
07:
30:3
9
02/1
8/04
08:
00:3
9
02/1
8/04
08:
30:3
9
02/1
8/04
09:
00:3
9
02/1
8/04
09:
30:3
9
02/1
8/04
10:
00:3
9
02/1
8/04
10:
30:3
9
02/1
8/04
11:
00:3
9
02/1
8/04
11:
30:3
9
02/1
8/04
12:
00:3
9
02/1
8/04
12:
30:3
9
02/1
8/04
13:
00:3
9
02/1
8/04
13:
30:3
9
02/1
8/04
14:
00:3
9
02/1
8/04
14:
30:3
9
Vaporsaver operating: +0.10 in wc to -0.50 in wc
Data Logger removed for download.

Groundwater Data for Research Site (JB-16/MW)
65%65%31%% Reduction
225,000168,00017,000Average Initial MtBE Conc. (8 rds)
79,00059,00010,000Post Pressure MtBE Reduction (5rds)
Well JB16(ppb MtBE)
Well JB14 (ppb MtBE)
MW-JB13(ppb MtBE)
Date
Note: Vaporsaver unit operation from February ’04 to November ’05 (30% downtime). MW-JB16D also shows 65% reduction.

Unit Operational ProblemsRetrofit Problem
Only the Second Retrofit Unit Compressor Problem (recirculation?)
VoltageBelt AlignmentLoose FanOPW Working on Problems100% Reliability Needed

Lessons LearnedUST Pressurization needs to be minimizedGasoline Composition Important
MtBE and other ether problemCompounds w/ similar physical properties issue
Coordination w/ Vapor Recovery Program Essential
Subsurface/atmospheric release tradeoffStepped up inspection and repairRevision to rules, testing, hardware necessary

Solutions/Follow up Studies
UST Merged w/ Vapor Recovery ProgramMore, better coordinated inspectionsVapor Recovery Program rule changes
Monthly inspections, annual maintenanceLeak detection inspections during deliveries
Independent Oil Company PilotInspection/Maintenance implementationORVR compatible nozzlesPressure Reduction

Oil Company Pilot PilotIntensive Inspection/Repair Program
36 enhanced inspections during deliveriesTracer Testing Inspect/RepairStage II Pressure Decay Testing
Gilbarco/Veeder Root ORVR NozzleHealy ORVR Nozzle plus Bladder TankVapor System Technology/OPW VaporsaverCheap generic SVE system

UST Enhanced Inspection Program at Cumbys
By former UST Inspector, now in remedial section 13 Enhanced Inspections, 8 Regular Inspections
Enhanced Inspections during gas deliveries, pressures monitored, fittings soaped, repairs made while onsite
Findings (77 leaks or 4/gas station)Vapor Leaks: 15 Dry Breaks, 14 Fill Caps, 14 ATG covers, 6 vent covers, 4 spill bucket drains, 6 dispenser vapor leaksLiquid Leaks: 6 spill buckets, 4 product in sumps and 7 liquid releases from fittings under dispensers
Score: Enhanced Inspections 67 Regular Insp. 10

Dry Break Leaks - Epping
Corroded Dry Break

Dry Break Leaks - Keene
Dry Break Vapor Release

Dry Break Leaks - Plaistow
New, just out of box, dry break leak

Leaky ATG - Greenland
Sheen on water

Product Leaks –Newington/Milford
Sensor set above product
Gravel pack around sump

Oil Company Pilot TimelineSecure Funding (spring of 2005)
SEP NegotiationsGREE Fund MoneyEPA Funding Application
Complete Delivery Inspections (end of 04)Baseline groundwater contamination (diffusion bags) spring 2005Installation of hardware (summer 2005)
Instrument Gas Station (pressures, soil temps. Etc)

Contact Information
Gary Lynn, P.E. Office: 603 271-8873E-mail: [email protected]
Mail: New Hampshire Department of Environmental Services
29 Hazen DriveConcord, New Hampshire 03304