vapour compression cycle
DESCRIPTION
Vapour compression cycle. Refrigerator Air conditioning plant Heat pump. ( “ ENERGY MANAGEMENT HANDBOOK” Sixth Edition, Chapter 8). Refrigerator. Electric-motor-driven vapour compression cycle. Engine-driven vapour compression cycle. Absorption heat pump. Applications of Heat pumps. - PowerPoint PPT PresentationTRANSCRIPT
1
Vapour compression cycle
•Refrigerator•Air conditioning plant•Heat pump
(“ ENERGY MANAGEMENT HANDBOOK” Sixth Edition, Chapter 8)
2
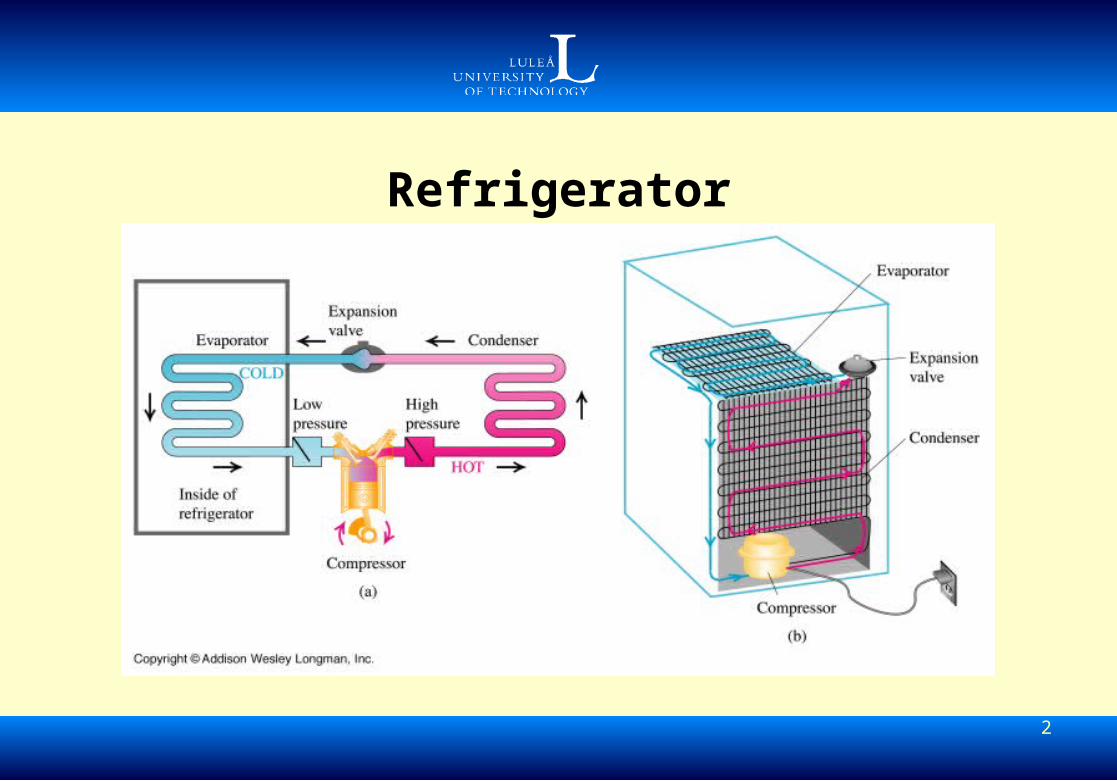
Refrigerator
3
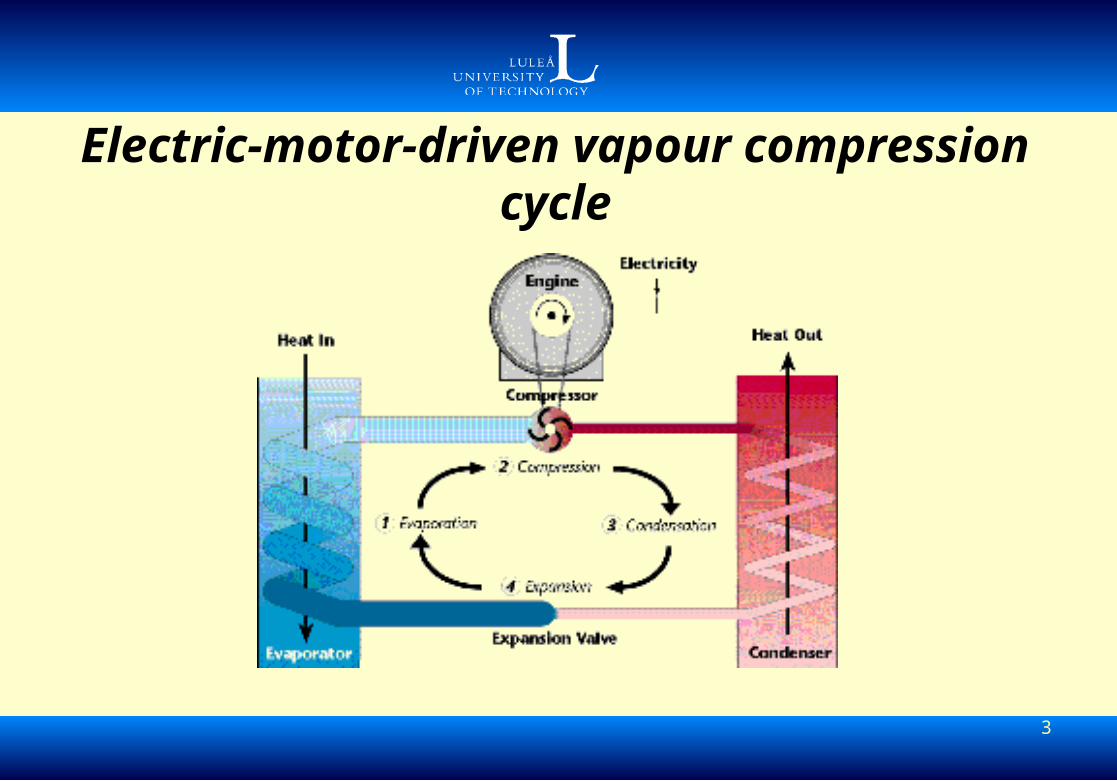
Electric-motor-driven vapour compression cycle
4
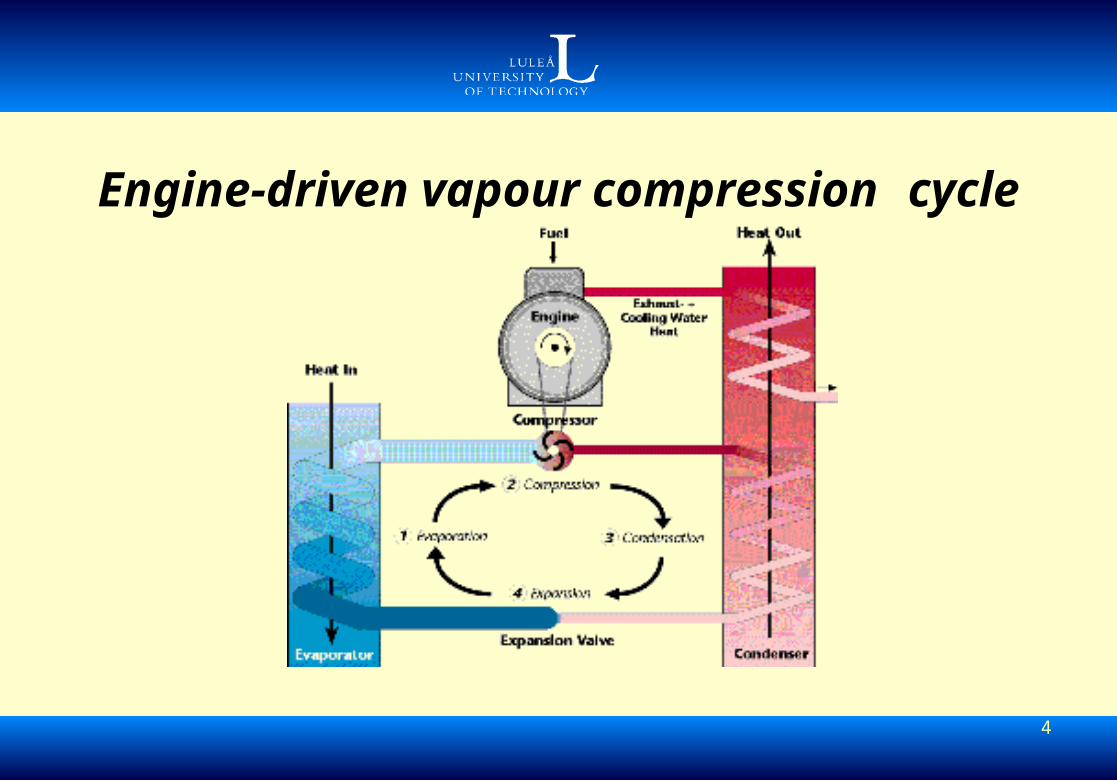
Engine-driven vapour compression cycle
5
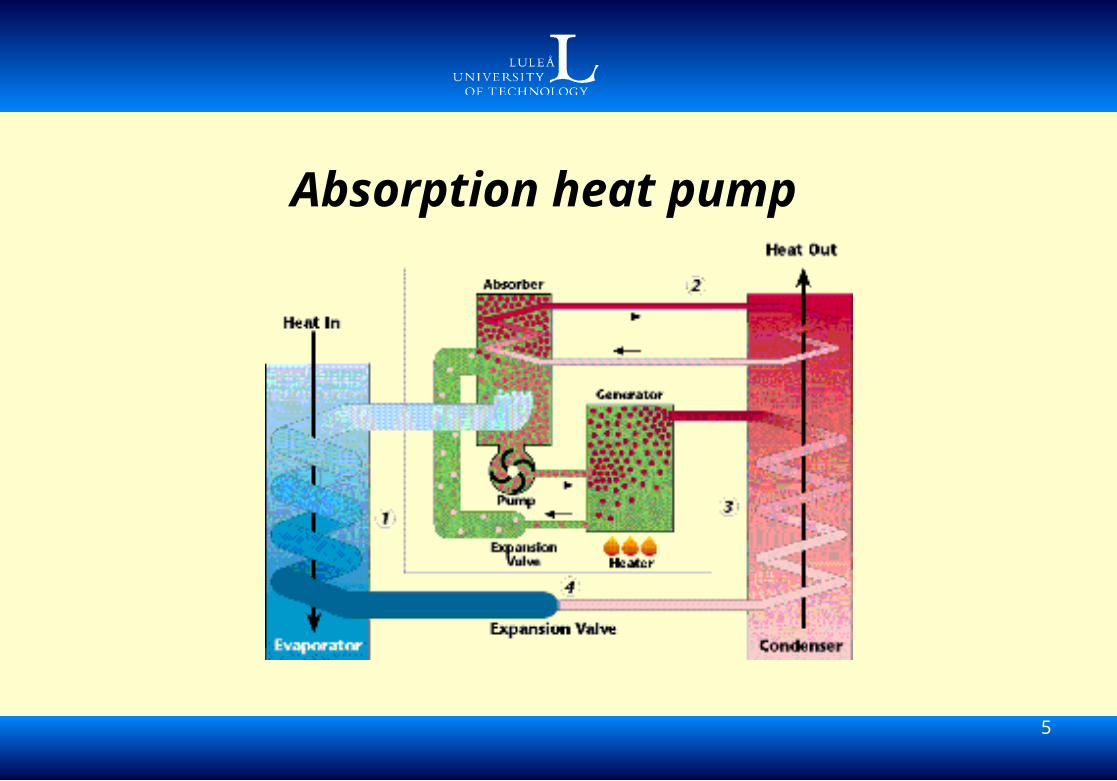
Absorption heat pump
6
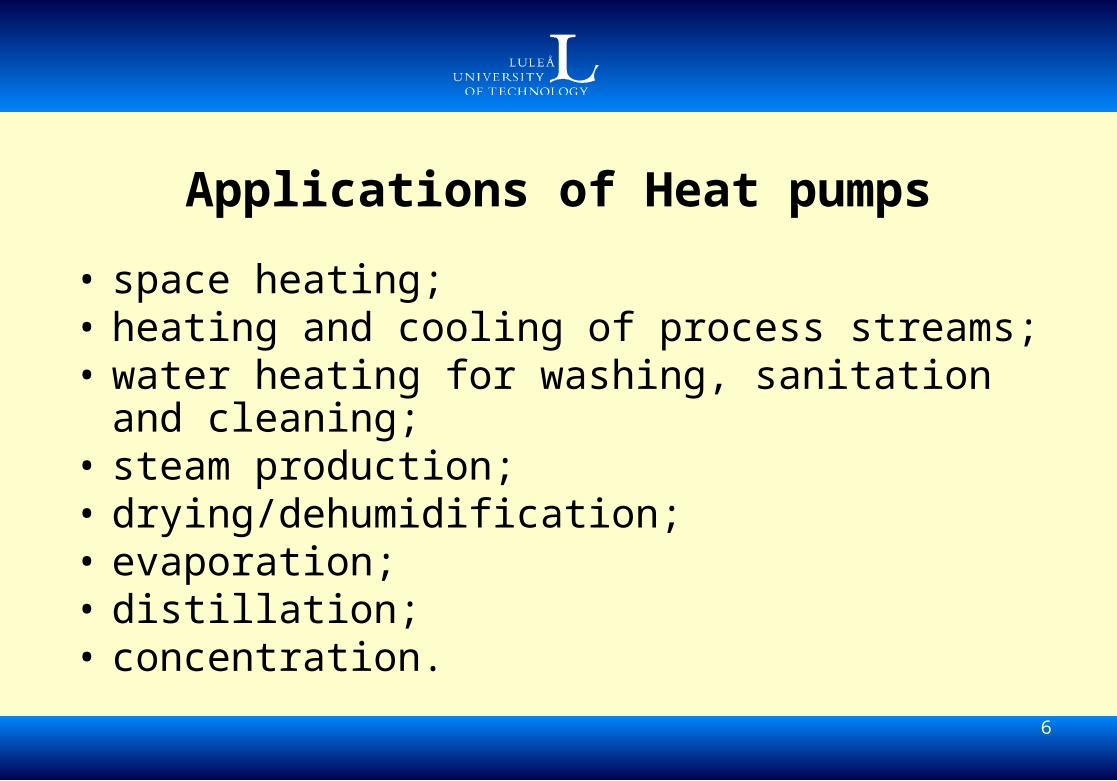
Applications of Heat pumps
• space heating; • heating and cooling of process streams; • water heating for washing, sanitation and
cleaning; • steam production; • drying/dehumidification; • evaporation; • distillation; • concentration.
7
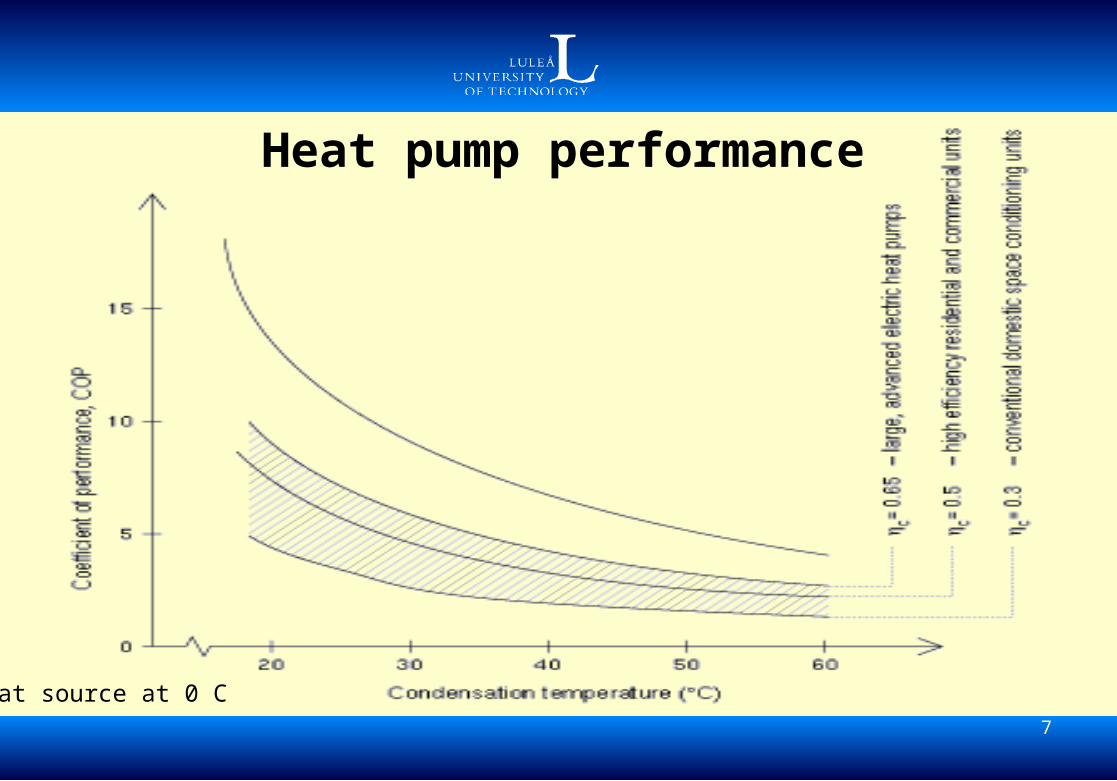
Heat pump performance
Heat source at 0 C
8
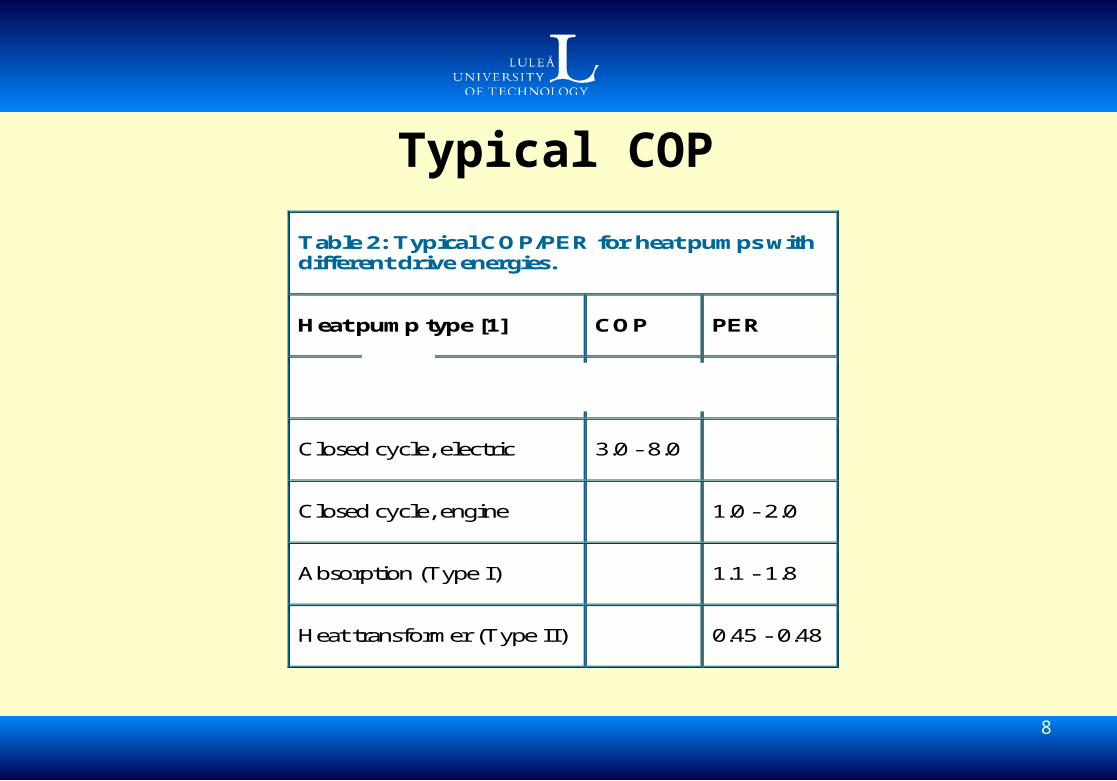
Typical COP
Table 2: Typical COP/PER for heat pumps with different drive energies.
Heat pump type [1] COP PER
MVR 10 - 30
Closed cycle, electric 3.0 - 8.0
Closed cycle, engine 1.0 - 2.0
Absorption (Type I) 1.1 - 1.8
Heat transformer (Type II) 0.45 - 0.48
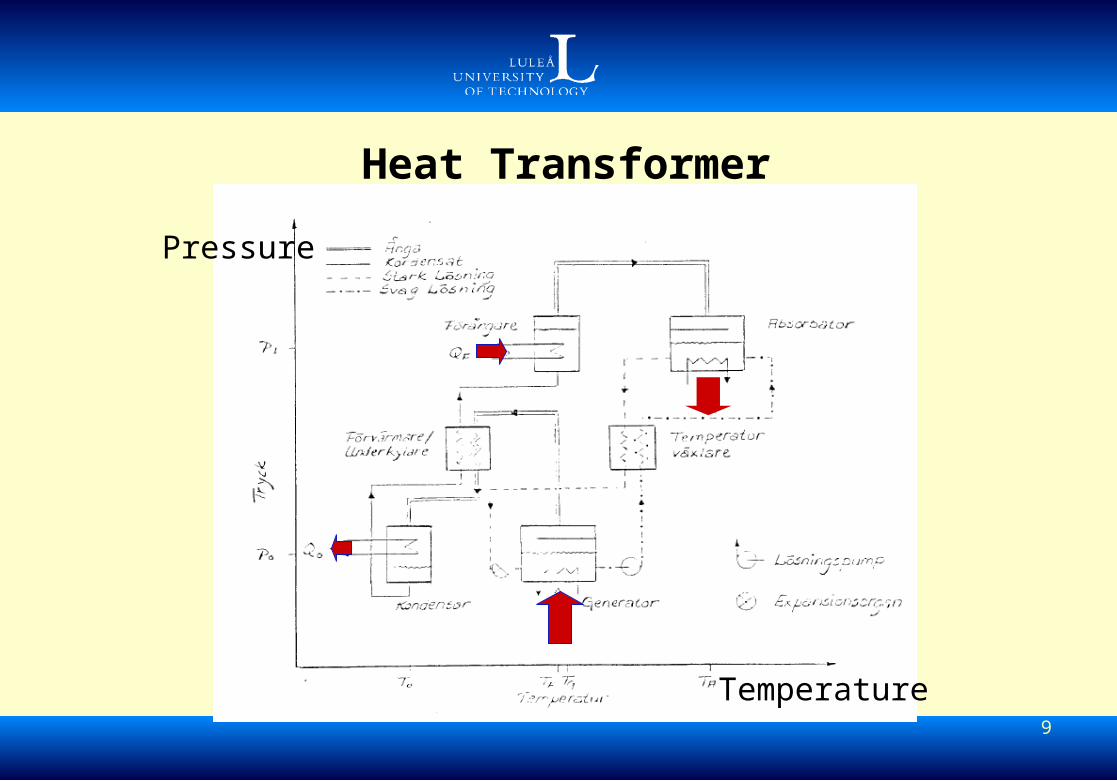
9
Temperature
Pressure
Heat Transformer
10
Factors affecting heat pump performance
• the climate - annual heating and cooling demand and maximum peak loads;
• the temperatures of the heat source and heat distribution system;
• the auxiliary energy consumption (pumps, fans, supplementary heat for bivalent system etc.);
• the technical standard of the heat pump; • the sizing of the heat pump in relation to the
heat demand and the operating characteristics of the heat pump;
• the heat pump control system.
11
How heat pumps achieve energy savings and CO2 emissions reduction
• Heat pumps and energy saving • An efficient technology • A large and worldwide potential
12
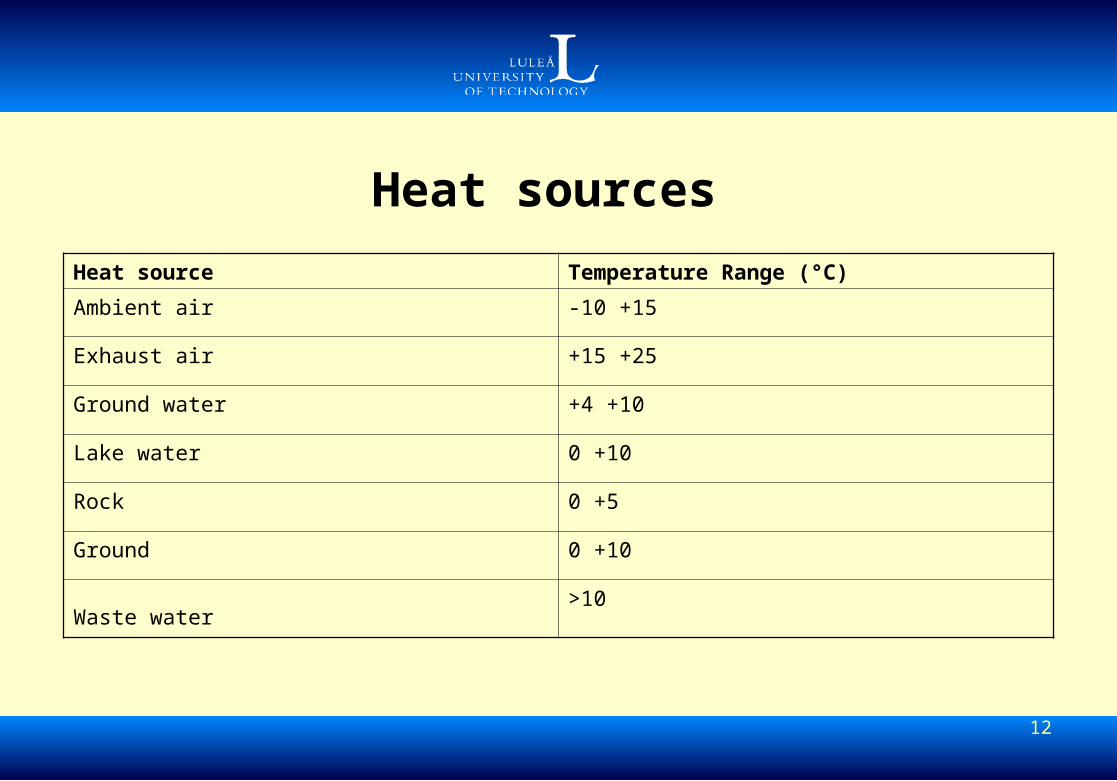
Heat sources
Heat source Temperature Range (°C)
Ambient air -10 +15
Exhaust air +15 +25
Ground water +4 +10
Lake water 0 +10
Rock 0 +5
Ground 0 +10
Waste water >10
13
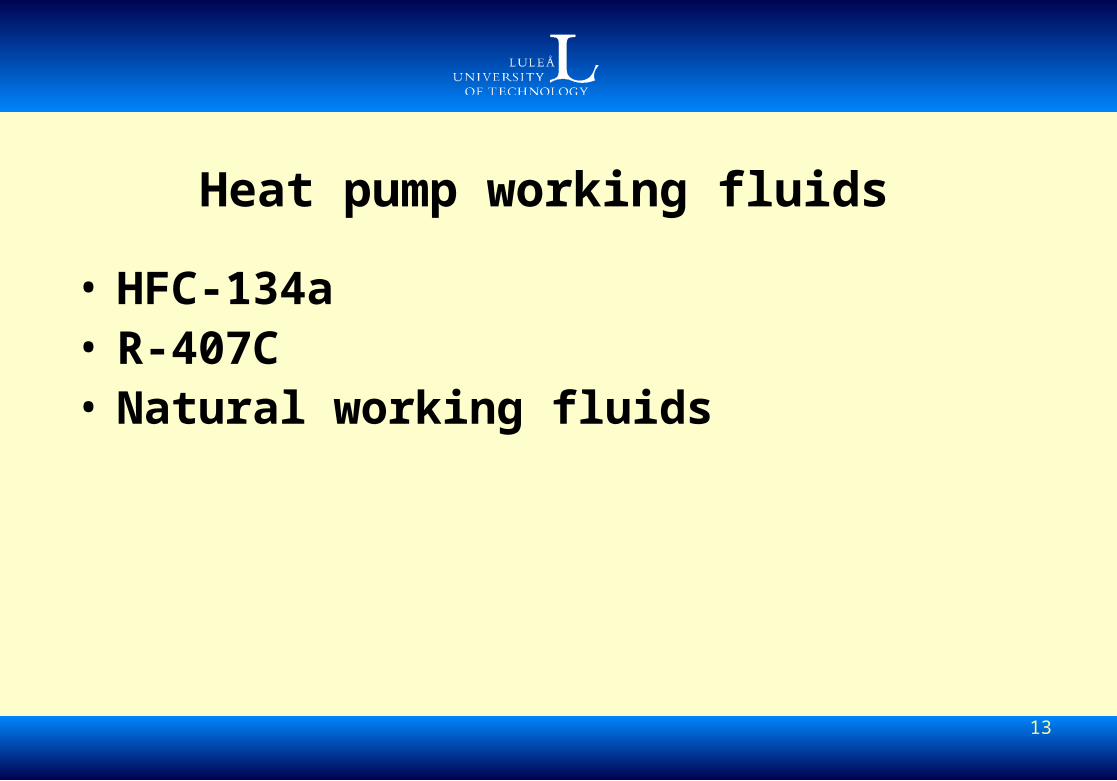
Heat pump working fluids
• HFC-134a • R-407C • Natural working fluids
14
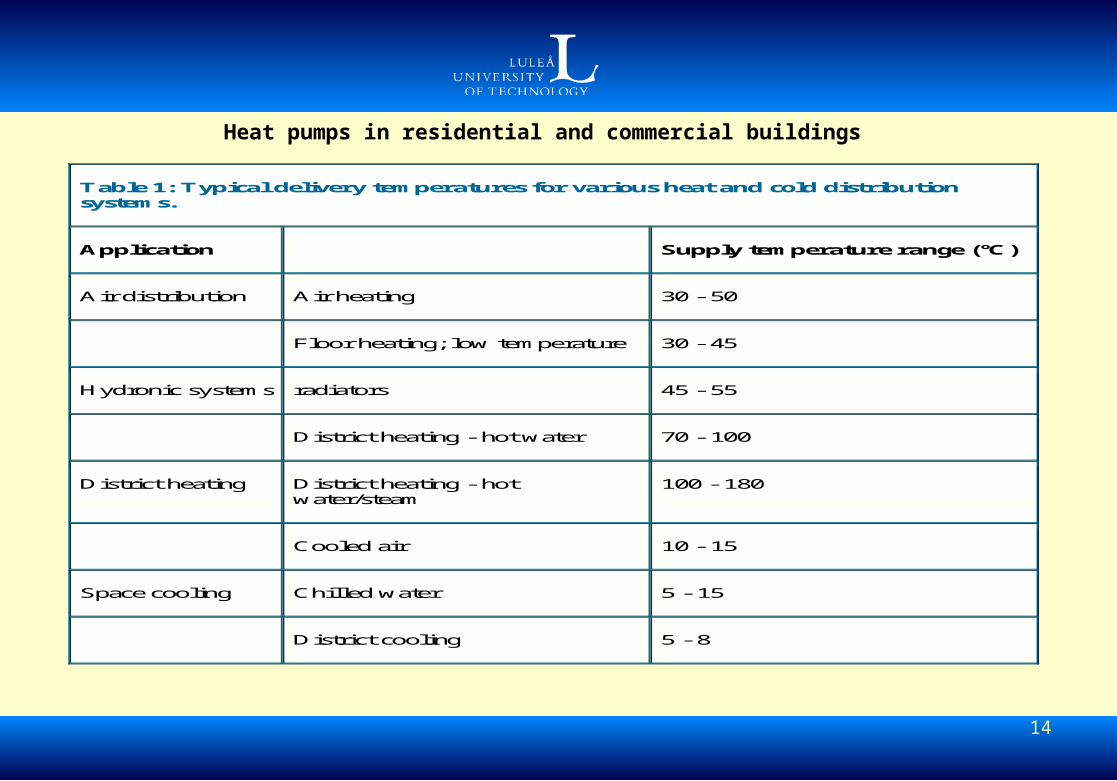
Heat pumps in residential and commercial buildings Table 1: Typical delivery temperatures for various heat and cold distribution systems.
Application Supply temperature range (°C)
Air distribution Air heating 30 - 50
Floor heating; low temperature 30 - 45
Hydronic systems radiators 45 - 55
District heating - hot water 70 - 100
District heating District heating - hot water/steam
100 - 180
Cooled air 10 - 15
Space cooling Chilled water 5 - 15
District cooling 5 - 8
15
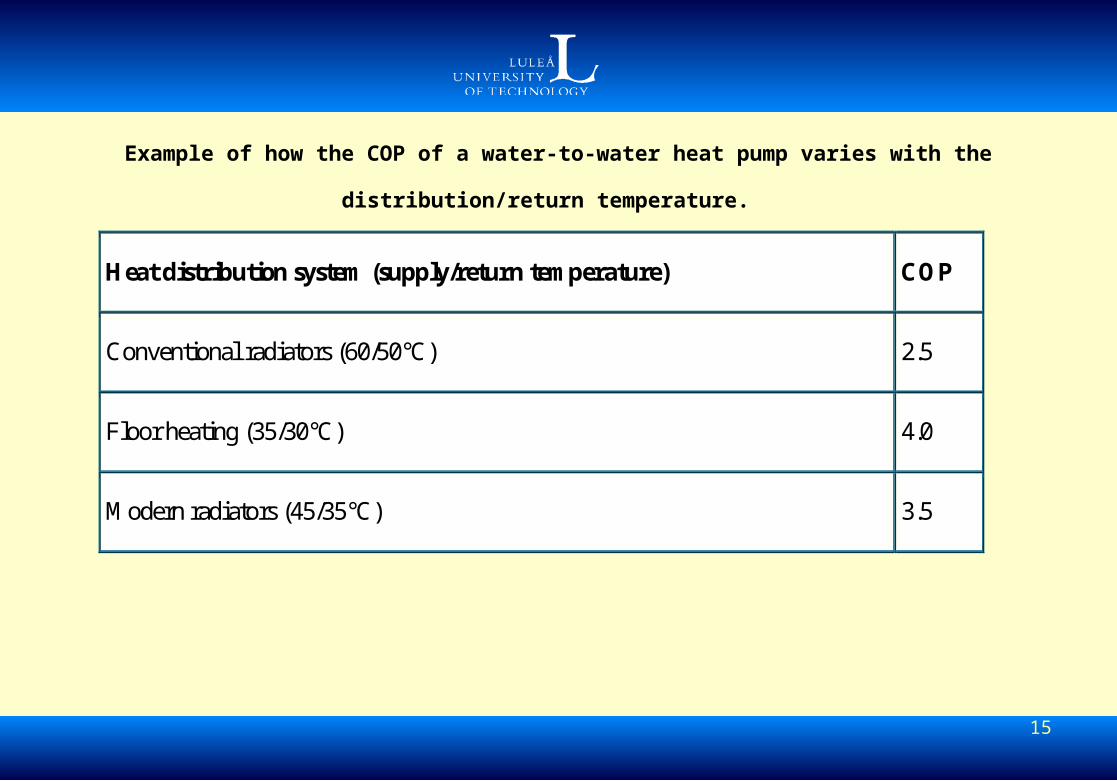
Example of how the COP of a water-to-water heat pump varies with the
distribution/return temperature.
Heat distribution system (supply/return temperature) COP
Conventional radiators (60/50°C) 2.5
Floor heating (35/30°C) 4.0
Modern radiators (45/35°C) 3.5
16
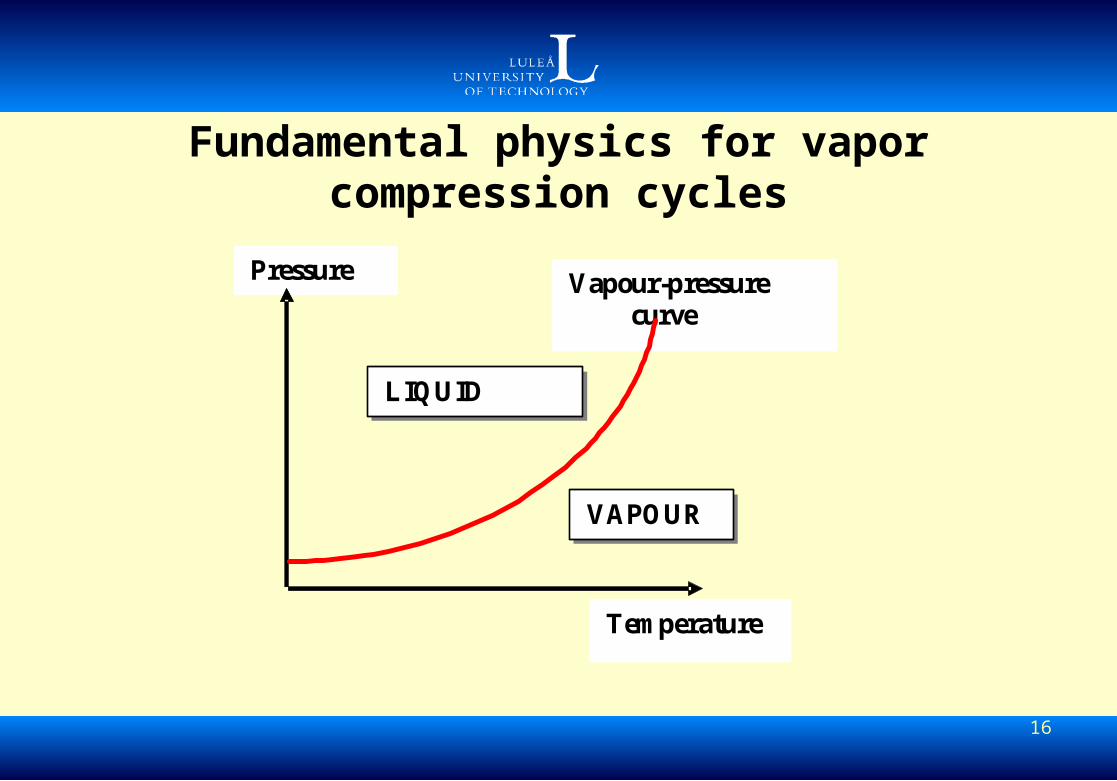
Fundamental physics for vapor compression cycles
Vapour-pressure curve
Pressure
Temperature
LIQUID
VAPOUR
17
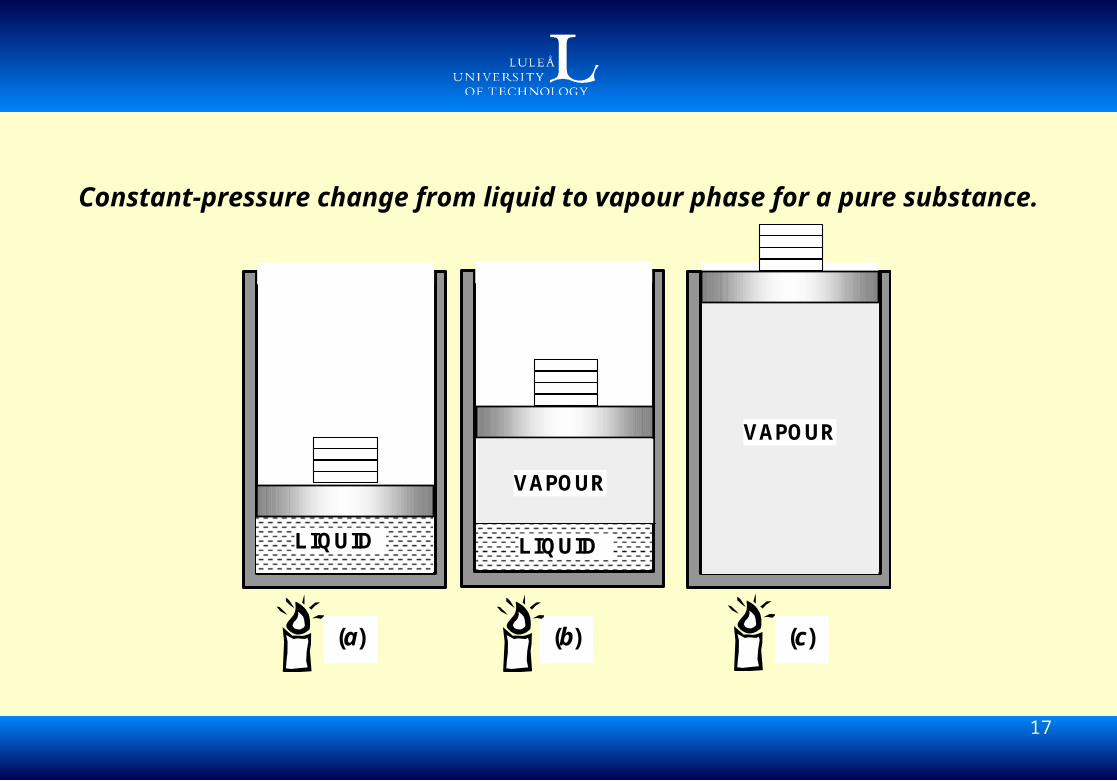
Constant-pressure change from liquid to vapour phase for a
pure substance.
LIQUID
VAPOUR
VAPOUR
(a) (b) (c)
LIQUID
18
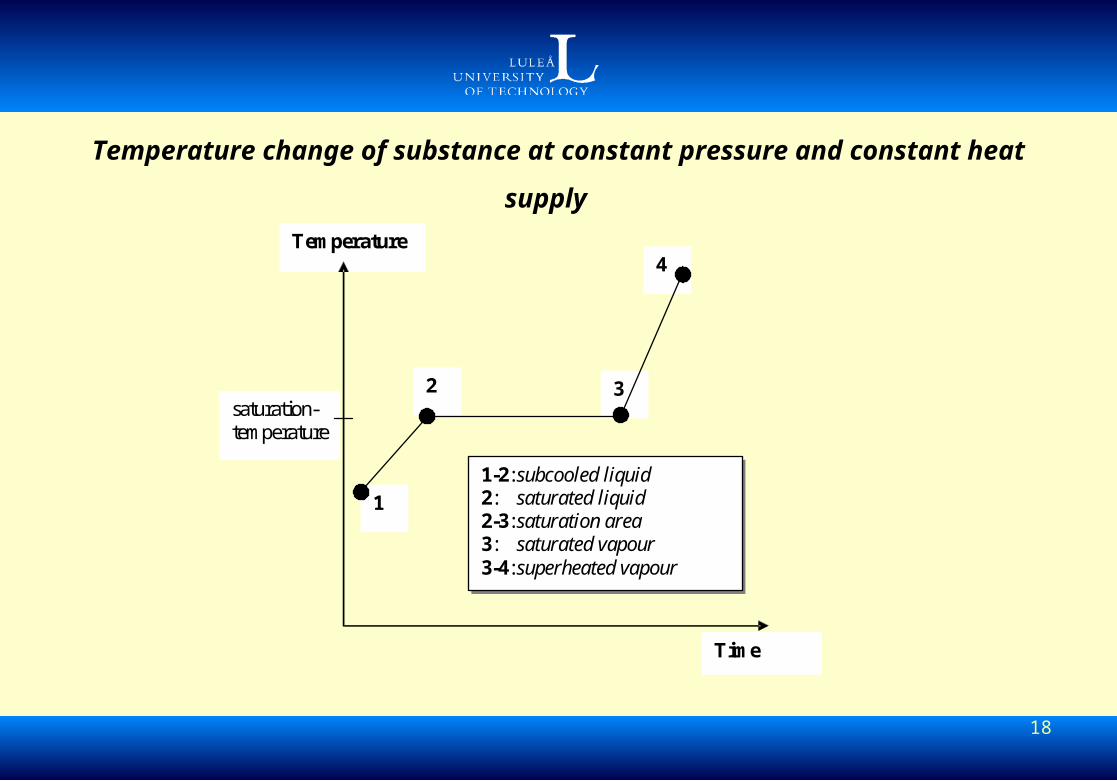
Temperature change of substance at constant pressure and
constant heat supply Temperature
saturation- temperature
Time
4
3 2
1
1-2: subcooled liquid 2: saturated liquid 2-3: saturation area 3: saturated vapour 3-4: superheated vapour
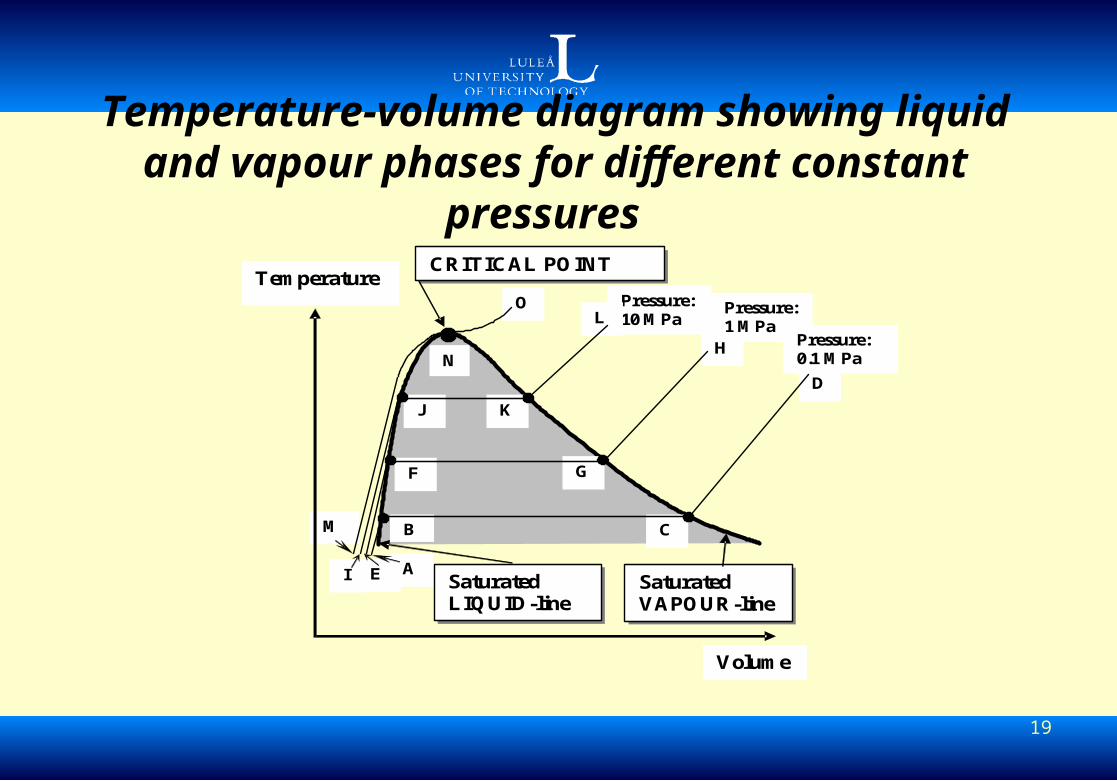
19
Temperature-volume diagram showing liquid and vapour phases for different
constant pressures
Pressure: 1 MPa
Pressure: 0.1 MPa
Pressure: 10 MPa
H
L O
D
I E
M
A
Volume
Temperature
C B
G F
J K
N
CRITICAL POINT
Saturated LIQUID-line
Saturated VAPOUR-line
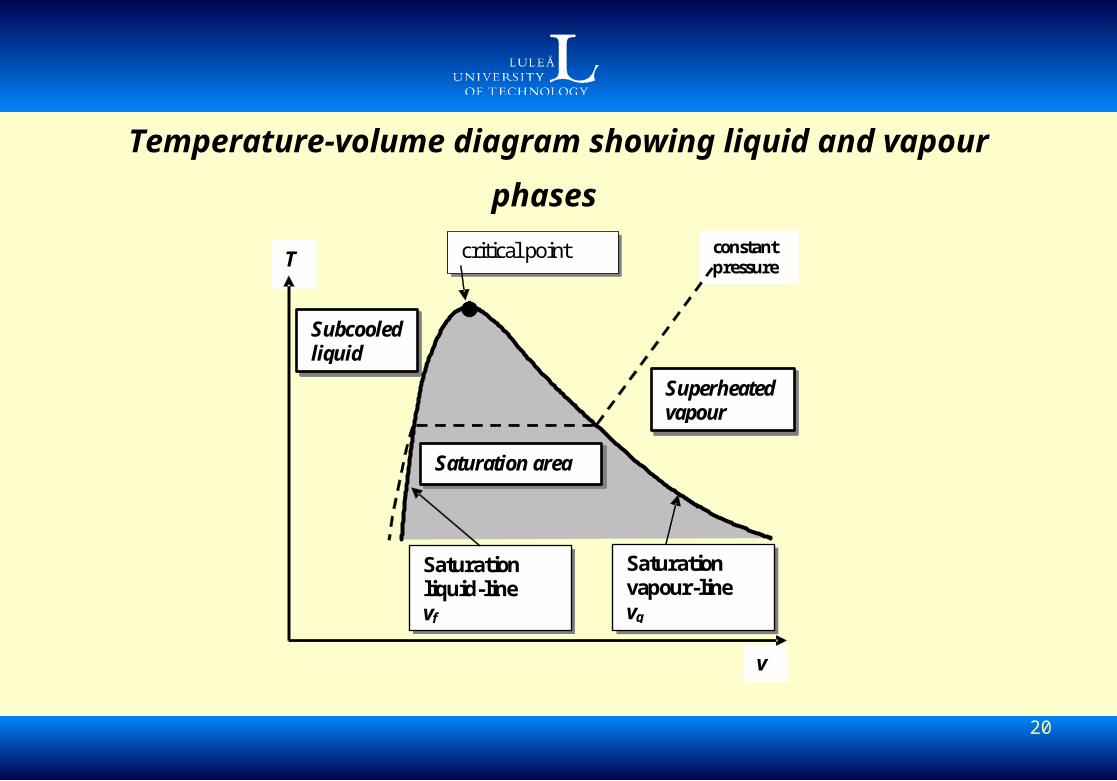
20
Temperature-volume diagram showing liquid and
vapour phases
Saturation vapour-line vg
Subcooled liquid
constant pressure
v
T critical point
Saturation liquid-line vf
Saturation area
Superheated vapour
21
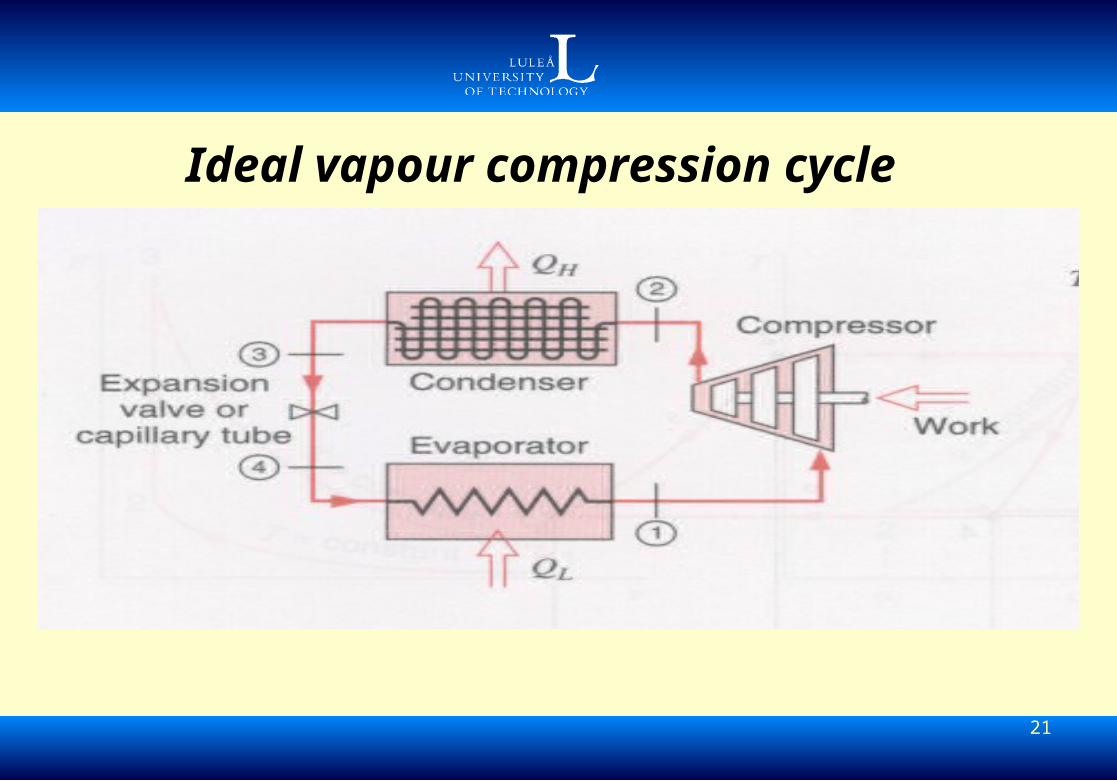
Ideal vapour compression cycle
22
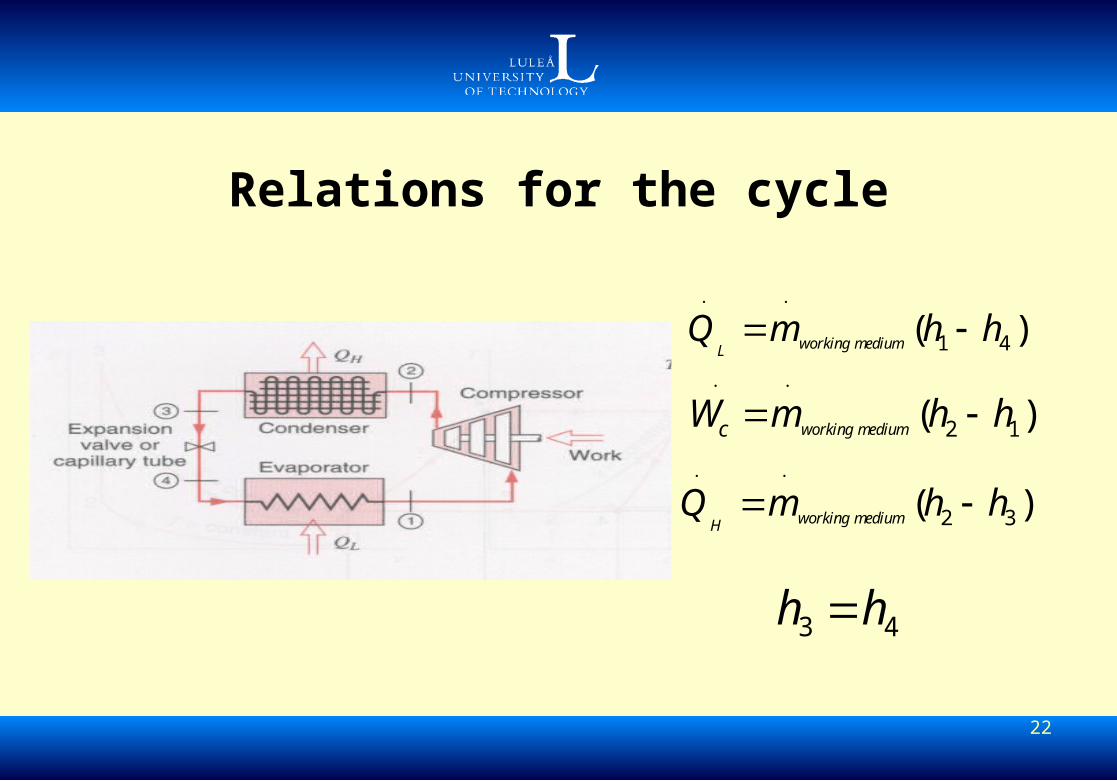
Relations for the cycle
1 4( )working mediumLQ m h h
2 1( )working mediumcW m h h
2 3( )working mediumHQ m h h
3 4h h
23
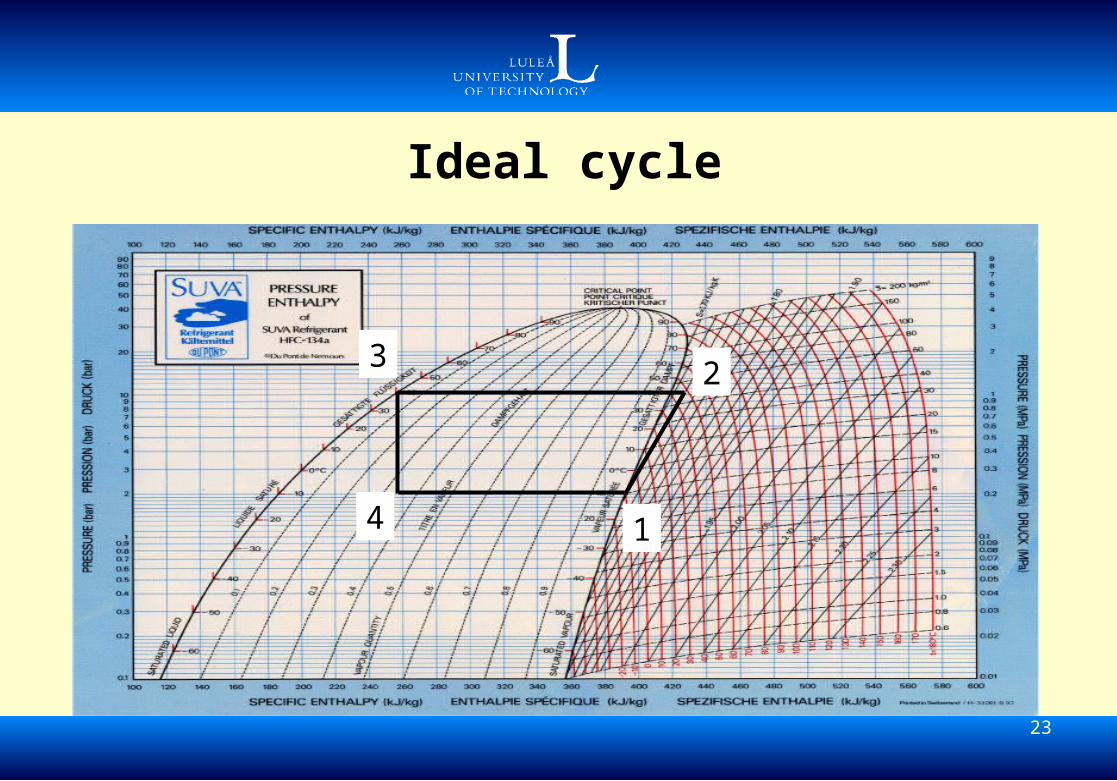
Ideal cycle
1
2
4
3
24
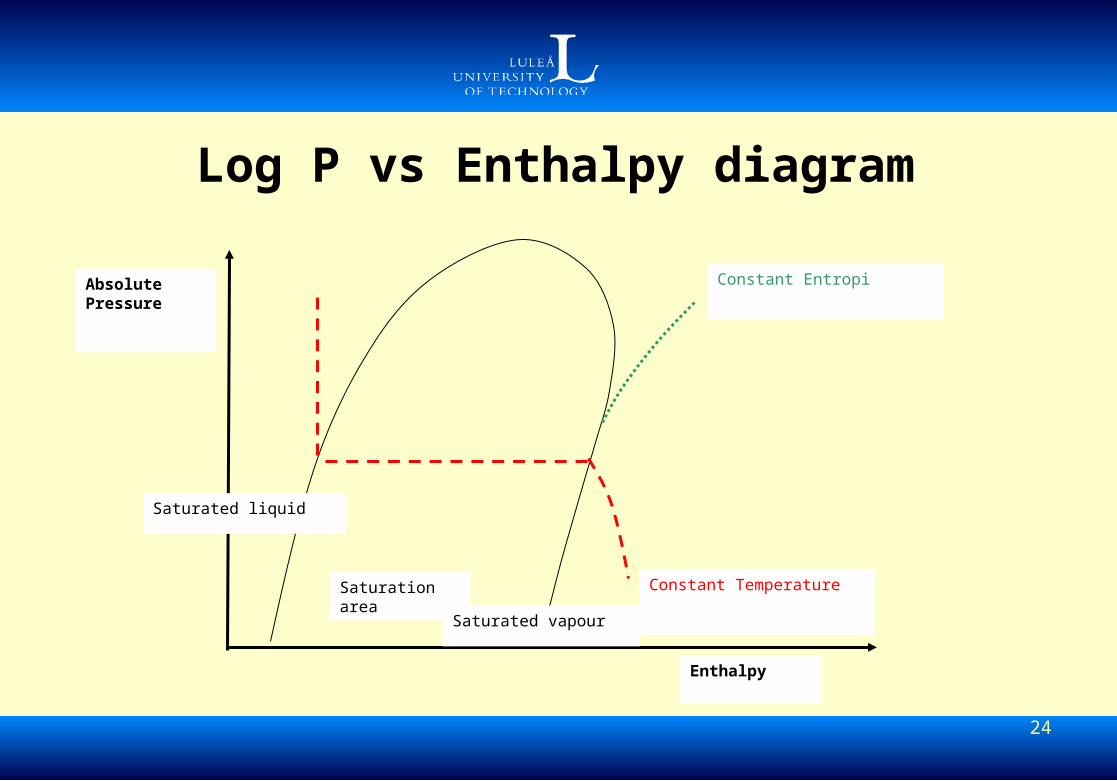
Log P vs Enthalpy diagram
Constant Temperature
AbsolutePressure
Saturation area
Saturated liquid
Saturated vapour
Constant Entropi
Enthalpy
25
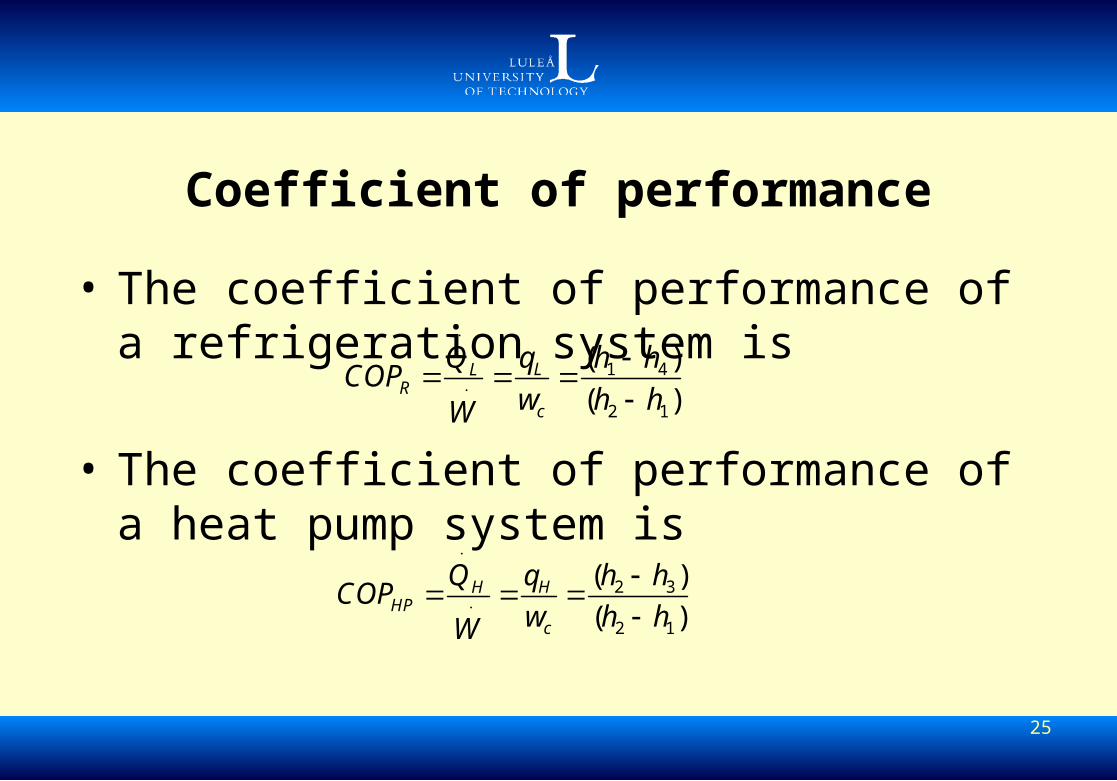
Coefficient of performance
• The coefficient of performance of a refrigeration system is
• The coefficient of performance of a heat pump system is
1 4
2 1
( )
( )LL
Rc
Q q h hCOP
w h hW
2 3
2 1
( )
( )HH
HPc
Q q h hCOP
w h hW
26
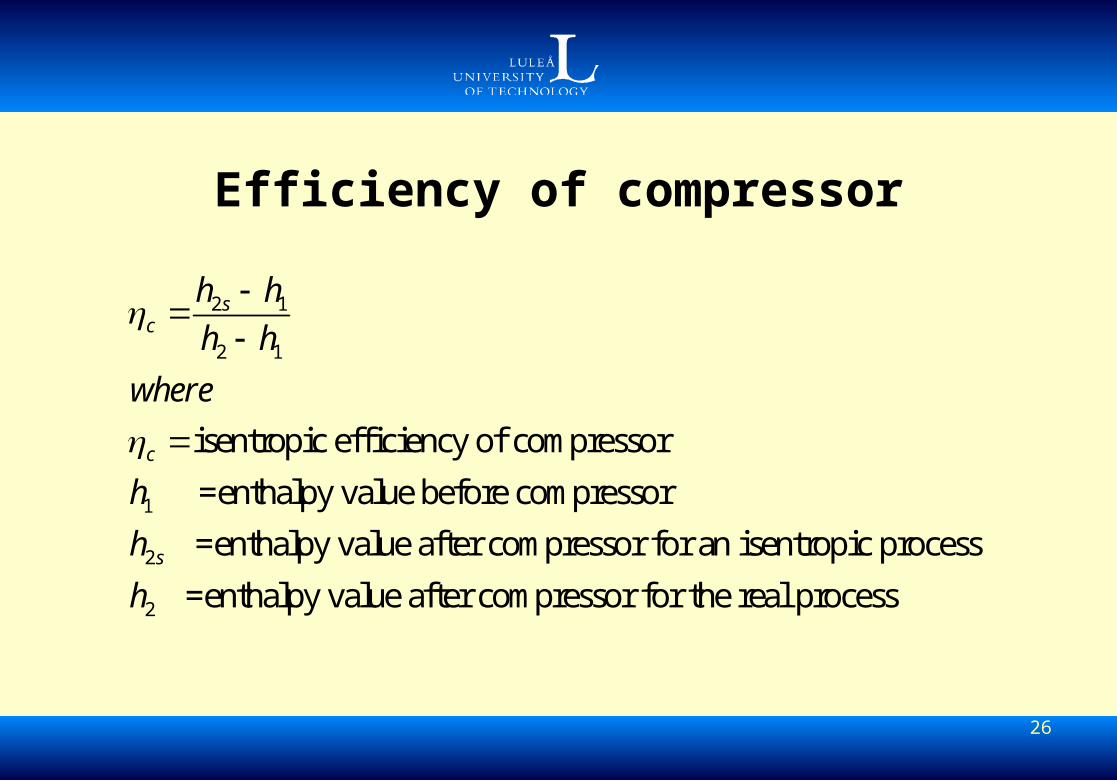
Efficiency of compressor
2 1
2 1
1
2
2
isentropic efficiency of compressor
=enthalpy value before compressor
=enthalpy value after compressor for an isentropic process
=enthalpy value after compressor f
sc
c
s
h h
h h
where
h
h
h
or the real process
27
28
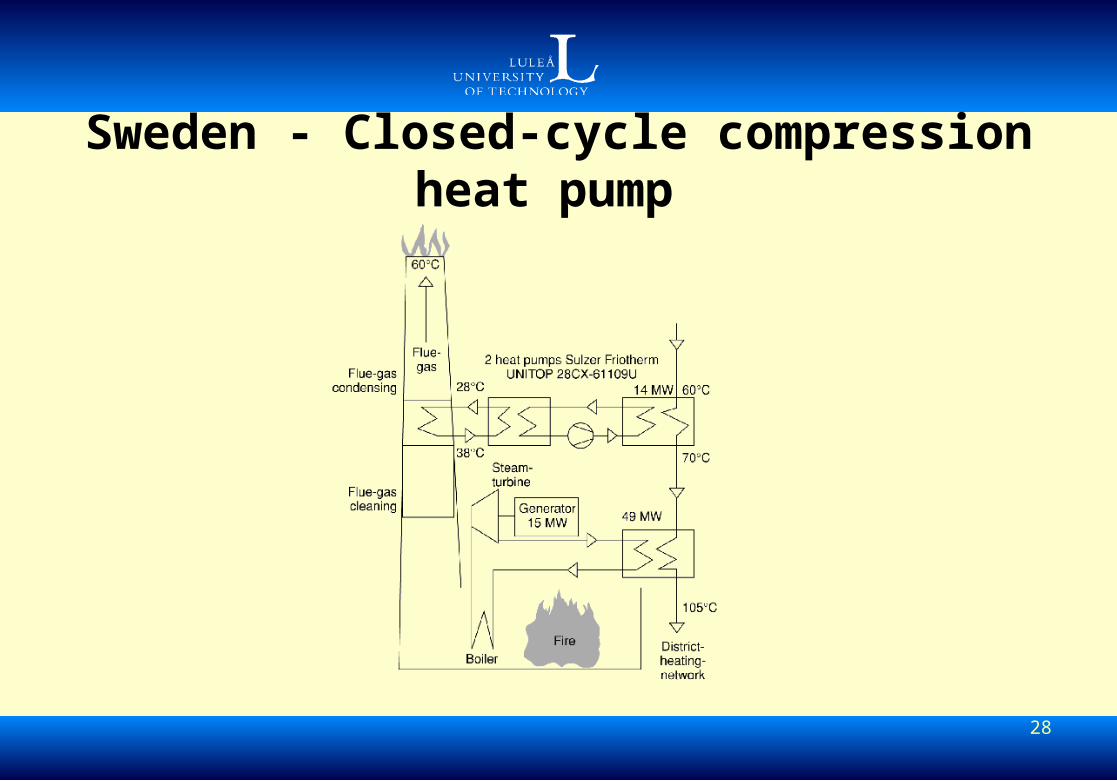
Sweden - Closed-cycle compression heat pump
29
30
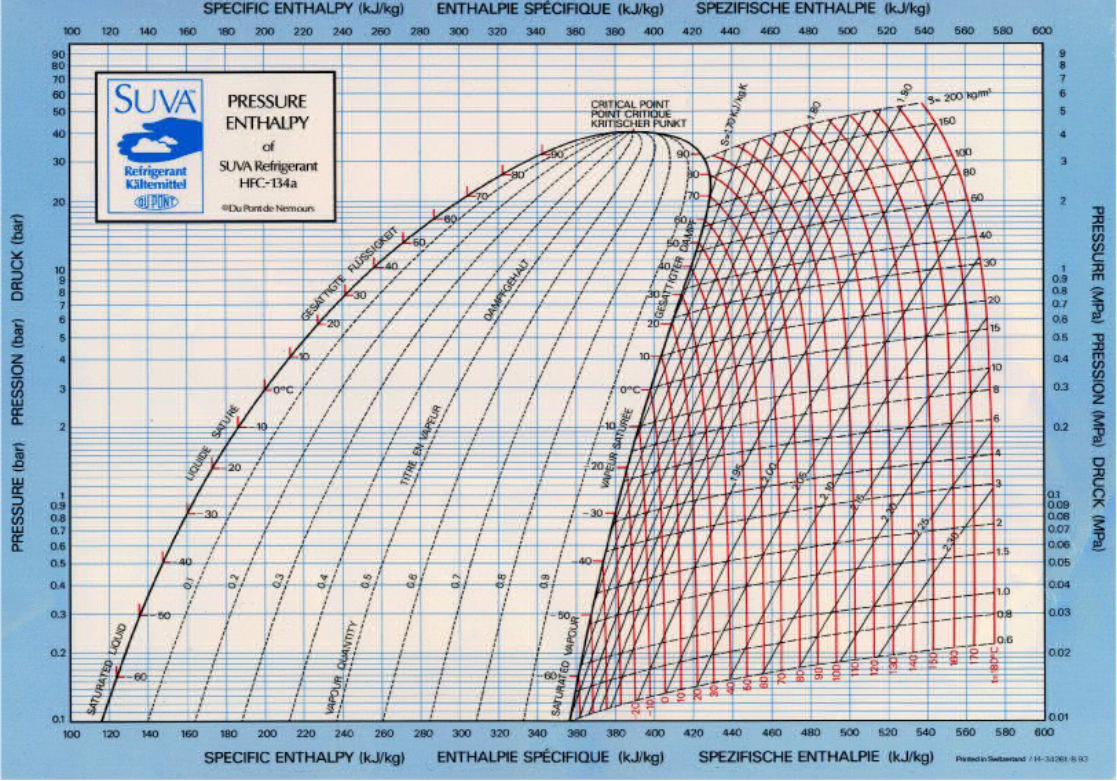
Example refrigerator/Heat Pump
• An refrigerator has an cooling capacity of 500 W.Evaporator pressure 2 bar(a), Condenser pressure 10 bar(a). An ideal cycle is assumed
Determine• Power input to compressor• Heat transfer rate from Condenser
31
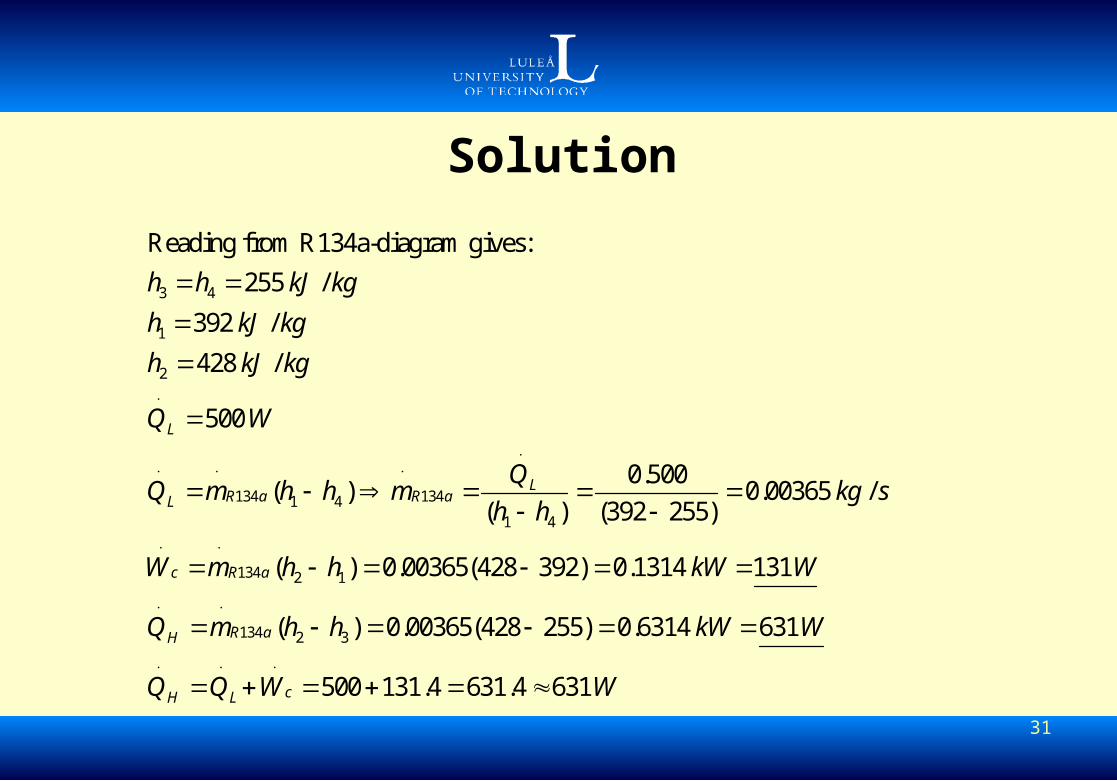
Solution
3 4
1
2
134 1341 41 4
134 2 1
134
Reading from R134a-diagram gives:
255 /
392 /
428 /
500
0.500( ) 0.00365 /
( ) (392 255)
( ) 0.00365(428 392) 0.1314 131
L
LR a R aL
c R a
RH
h h kJ kg
h kJ kg
h kJ kg
Q W
QQ m h h m kg s
h h
W m h h kW W
Q m
2 3( ) 0.00365(428 255) 0.6314 631
500 131.4 631.4 631
a
cH L
h h kW W
Q Q W W