variability in metabolism of imipramine and desipramine using urinary excretion data
TRANSCRIPT
Variability in Metabolism of Imipramine and Desipramine Using Urinary Excretion Data†
Kelley Ramey1, Joseph D. Ma1,2, Brookie M. Best1,3, Rabia S. Atayee1,2 and Candis M. Morello1,4*
1Skaggs School of Pharmacy and Pharmaceutical Sciences, University of California San Diego (UCSD), Pharmaceutical Sciences Building
(PSB), Dean’s Suite, Room 1121, 9500 Gilman Drive, MC 0657, La Jolla, CA 92093-0657, USA, 2Doris A. Howell Palliative Care Service, San
Diego, CA, USA, 3UCSD Department of Pediatrics, Rady Children’s Hospital, San Diego, CA, USA and 4Diabetes Intense Medical
Management Clinic, Veterans Affairs San Diego Healthcare System, La Jolla, CA, USA
*Author to whom correspondence should be addressed. Email: [email protected]
Variability in imipramine and desipramine metabolism was evaluatedusing urinary excretion data from patients with pain. Liquid chroma-tography–tandem mass spectrometry was used to quantitate con-centrations in urine specimens. Interpatient population contained600 unique imipramine specimens, whereas intrapatient populationhad 137 patients with two or more specimens. Normal concentrationranges of imipramine, desipramine and the desipramine/imipraminemetabolic ratio (MR) were established, and various factors were test-ed for MR impact. Geometric mean of imipramine urine concentrationwas 0.46 mg/g of creatinine, and desipramine was 0.67 mg/g ofcreatinine. Gender, concomitant known CYP2C19 inhibitor use andurine pH did not affect MR. However, proton-pump inhibitor (PPI)users had a significantly lower mean MR than those without a listedPPI. Early age group (18–36 years) had a significantly higher meanMR than middle (37–66 years) and late (67–90 years) age groups.Approximately one-third were positive for one or more of hydroco-done, oxycodone, hydromorphone or oxymorphone. Patients withno opioids reported in the medication list had a significantly lowergeometric mean MR than those with prescribed opioids (1.03 vs.1.54, P 5 0.004). Patients with only one prescribed opioid had alower MR than those with two or more prescribed opioids. Patientswith younger age, prescribed opioids and no listed PPI weremore likely to have a higher geometric mean urinary desipramine/imipramine MR.
Introduction
Imipramine is a tricyclic antidepressant (TCA) that can be pre-
scribed for the treatment of neuropathic pain (NP). Although
the primary use of TCAs for the treatment of depression has de-
creased with the introduction of many other antidepressants,
which have a more tolerable side-effect profile compared with
the TCAs, the TCAs remain an effective therapeutic option for cer-
tain types of depressive illnesses and NP. TCAs are considered first-
line treatment for NP, and are effective for central poststroke NP,
painful polyneuropathy and painful diabetic neuropathy (1, 2).
Both norepinephrine and serotonin reuptake inhibition are impor-
tant in the treatment of NP (2), yet TCAs have also been shown to
have direct opioid receptor activity (3).
All TCAs have low affinity for the m-opioid receptor, and imip-
ramine and desipramine have higher affinity for the k-opioid re-
ceptor over other receptor subtypes (3). Stimulation of these
various opioid receptors may be the means through which the
TCAs elicit their analgesic effects, which have been documented
in both humans and rats (3). Also, stimulation of d-opioid
receptors may help with depression (3). Several studies have
found that opioid receptor antagonists block the antinociceptive
effects of TCAs (3, 4) and when administered with morphine,
TCAs provide synergistic analgesia (3). The effects of TCAs on
opioid receptors are not fully understood, but these interactions
may be vital to their efficacy in the treatment of NP and
depression.
Imipramine’s affinity for muscarinic acetylcholine receptors is
the cause of adverse effects such as dry mouth, blurry vision,
urine retention, constipation, memory loss and tachycardia (5).
Strong binding to histamine H1-receptors can cause moderate
sedation and lower the seizure threshold (6). These effects are
less common with desipramine due to its secondary amine struc-
ture (6). Finally, overdoses of both imipramine and desipramine
can have cardiotoxic effects, where imipramine can cause QT
prolongation and desipramine can induce changes in the QRS
complex (6). Understanding imipramine’s metabolism and sourc-
es of its variability in and among patients will help clinicians rec-
ognizewhy certain patients are less able to tolerate the drug than
others.
Imipramine is extensivelymetabolized in the liver by cytochrome
P450 (CYP) enzymes. Imipramine undergoesN-demethylation to its
main, active metabolite desipramine via CYP2C19, CYP1A2 and
CYP3A4. CYP2C19 contributes the most to this process, while
CYP1A2 and CYP3A4 have smaller contributions, with wide fluctu-
ations in CYP2C19 and CYP3A4 activity among poor and extensive
metabolizers (7–9). CYP2D6 is responsible for hydroxylation of
both imipramine and desipramine into 2-, 10-hydroxyimipramine
and 2-, 10-hydroxydesipramine, respectively. Desipramine does
not undergo metabolism by any other CYP enzymes and thus is
more sensitive to CYP2D6 polymorphisms. For example, the plasma
metabolic ratio (MR) of desipramine/imipramine is able to discrim-
inate between CYP2D6 extensive and poor metabolizers (10, 11).
This is of clinical significance in that response to desipramine use
may differ based on CYP2D6 metabolizer status. Whether the
same MR in urine is able to reproduce findings in plasma is un-
known. A large majority of imipramine metabolites are recovered
in the urine (.75%), while up to �20% is excreted via the bile
and feces (12). Imipramine metabolites in the urine are found in
the following amounts: imipramine þ desipramine (1–4%), other
non-conjugated metabolites (15–35%), glucuronide metabolites
(40–60%) and non-extractable polar metabolites (20–30%) (13).
In the population of patients with pain, where often one drug
is not sufficient to treat the pain, it is essential to understand the
potential interactions between imipramine and medications
taken concomitantly, especially opioids. In addition, variability
in drug response and metabolism is due to genetic, non-genetic
and environmental factors. This analysis of urinary excretion data
examined factors such as age, sex, urine pH and concomitant
†Presented as a poster at: PAINWeek: National Conference on Pain for
Frontline Practitioners, 5–8 September 2012, Las Vegas, NV.
# The Author 2014. Published by Oxford University Press. All rights reserved. For Permissions, please email: [email protected]
Journal of Analytical Toxicology 2014;38:368–374
doi:10.1093/jat/bku034 Advance Access publication April 29, 2014 Article
medications to determine their effect on imipramine and desipr-
amine metabolism.
Methods
Urine specimens for patients being treated for chronic pain were
analyzed for routine clinical care using LC–MS-MS at Millennium
Laboratories (San Diego, CA, USA). For this study, a retrospective
data analysis was conducted using de-identified data already col-
lected from clinical specimens to determine the urinary concen-
trations of imipramine, desipramine and creatinine. The dataset
included subject identification number, specimen identification
number, date of urine sample collection, subject’s date of birth,
sex, physician’s practice code, subject’s current medication list,
urine-creatinine concentration, urine pH and urine drug concen-
trations of imipramine, desipramine and other pain medications.
Institutional Review Board-exempt status was granted by the
University of California–San Diego Human Research Protection
Program.
Subjects and specimens
Between January 2011 and April 2012, 715,651 urine specimens
were tested for imipramine and desipramine. Selected specimens
were positive for both imipramine and desipramine, defined as
concentrations of �50 ng/mL. Specimens with urine-creatinine
concentration of ,20 mg/dL were excluded to limit for subject
variability due to hydration status. Patients whomet the inclusion
criteria with one visit or the first of several visits were defined as
the intersubject population. The intrasubject population was de-
fined as subjects who met the inclusion criteria with two or
more visits.
LC–MS-MS analysis
An Agilent 1200 series binary pump SL LC system, well-plate sam-
pler and thermostatted column compartment paired with an
Agilent Triple Quadrupole mass spectrometer and an Agilent
Mass Hunter software were used for analysis of imipramine
and desipramine. Chromatographic separation was performed
using an acetonitrile– formic acid–water gradient running at
0.4 mL/min and a 2.1 � 50 mm2, 1.8-mm Zorbax SB-C18 column.
Mobile phase A ¼ þ0.1% formic acid in water, B ¼ 0.1% formic
acid in acetonitrile and column temperature was set to 508C.Samples were prepared for injection by incubating 25 mL of
urine with 50 units of b-glucuronidase Type L-II from Patella
vulgata (keyhole limpet) Sigma Product number G 8132
(Sigma-Aldrich Corp., St. Louis, MO, USA) in 50 mL of 0.4 M ace-
tate buffer (pH 4.5) for 3 h at 458C. Five microliters of the solu-
tion was injected for each sample.
All spectra were collected using positive electrospray ioniza-
tion. The optimized instrumental parameters were as follows:
gas temperature, 3508C; drying gas, 12 L/min; nebulizer gas
(nitrogen), 35 psi (�24,100 Pa); capillary voltage, 3,000 V and
fragmenter voltage, 60 V. Multiple reaction monitoring (MRM)
mode was used for quantitation. Scan time was set to 500 ms.
In the MRM mode, two transitions were used to identify and
quantitate a single compound. Data were acquired running
the QQQ in MRM mode, using transitions imipramine: 281.1!86, 281.1! 58 and desipramine: 267.1! 72, 267.1! 44.
A quantitative transition was used to calculate concentration
based on the quantifier ion, and a second transition was used
to ensure accurate identification of the target compound based
on the ratio of the quantifier ion to the quantifier ion.
HPLC-grade water, acetonitrile, methanol and formic acid
were obtained from VWR (Westchester, PA, USA). Imipramine
and desipramine were obtained from Cerrilliant Corp. (Round
Rock, TX, USA). The deuterated internal standards were diluted
to 1,000 ng/mL by adding them to synthetic urine (Microgenics
Corp., Fremont, CA, USA).
Quantitative analysis was performed using the Agilent Mass
Hunter Quantitative Analysis software. A four-point calibration
curve was created by using a linear fit and forcing the line to
go through the origin. Accepted accuracy for calibrators was
+20% of the target value and the coefficient of determination
(R2) was required to be �0.99 as verification of linearity and
goodness of fit. The lower limit of quantitation for both the imip-
ramine and desipramine was 50 ng/mL. The upper limit of line-
arity for both the imipramine and desipramine assays was
50,000 ng/mL.
Calculations, statistical methods and graphical analyses
Imipramine and desipramine concentrations were normalized
using creatinine concentration to account for hydration status
(14). The analyte concentration (ng/mL) was divided by the
urine-creatinine level (mg/dL), and divided by 10 to correct
the volume, with the final concentration reported as milligram
analyte per gram creatinine (mg/g cr). The MR was defined as
the concentration ratio of desipramine to imipramine, a unitless
value. Dosage information was not originally collected as part of
the routine clinical urine drug monitoring, so doses were not
available for this retrospective analysis. In the absence of dosage
information, the MR is the best estimate of imipramine metabo-
lism to desipramine. The imipramine and desipramine creatinine-
corrected urine concentrations were also summed together by
converting from milligrams of drug to millimoles.
Descriptive statistics and graphical analyses were performed
using Microsoft Excelw 2010 (Microsoft Corp., Redmond, WA,
USA) and OriginPro 8.6 (OriginLab Corp., Northampton, MA,
USA). To achieve normal distributions of analyte concentrations,
the creatinine-corrected concentrations were log transformed.
Log-transformed data were used to calculate descriptive statis-
tics. The log-transformed data were back-transformed to deter-
mine the geometric mean and geometric 95% confidence
intervals (CIs).
Concomitant medications
Each concomitant drug that was detected in the urine specimen
was tested individually for its effect on the log MR. For each case,
two-sample populations were created: samples that were positive
for an opioid, benzodiazepine or other pain medications versus
those that were negative for that concomitant medication.
Differences in log MR were then compared between populations
of reported and no reported opioid use, using provider-reported
medication lists. Differences in log MR were also compared be-
tween the population reporting two or more opioids with the
population reporting only one opioid. Similarly, the effect of
CYP2C19 inhibitors on the log MR was tested between groups
Metabolism of Imipramine and Its Metabolite Desipramine 369
with reported use and no reported use of a CYP2C19 inhibitor.
CYP2C19 inhibitors were determined from the ‘P450 Drug
Interaction Table’ from the Indiana University’s School of
Medicine website (15). For these comparisons above, two-sided,
two sample t-tests were performed, and a significance level of
0.05 was used.
Evaluation of other factors
Age, sex and urinary pHwere also evaluated for their effect on the
MR and on the sum of imipramine plus desipramine (Iþ D). Based
on the age groups from a previous study (16), the interpatient
population was divided into three age categories: young (18–36
years), middle (37–66 years) and old (67–90 years). The corre-
sponding log MR and I þ D values for the three age groups were
compared with an one-way ANOVA test. A two-sample t-test com-
pared MR and I þ D by sex. Linear regression analyses using the
least-squares method was performed using urine pH; values
ranged from 4.6 to 9.3.
Results
Of the 715,651 patients tested for imipramine, 882 tested posi-
tive for imipramine in the urine and satisfied our inclusion crite-
ria. After removing duplicate specimens from the same patient
ID, 600 unique specimens remained, characterizing the interpa-
tient population. Of the 600 patients, only 105 had imipramine
reported in the medications list. The intrapatient population con-
sisted of 137 patients with two or more positive imipramine
urine specimens from separate visits. The number of visits
in the intrapatient population ranged from 3 to 13 visits.
Imipramine and desipramine concentrations did not exceed
the upper limit of linearity (50,000 ng/mL). No subjects report-
ed desipramine in the medication list.
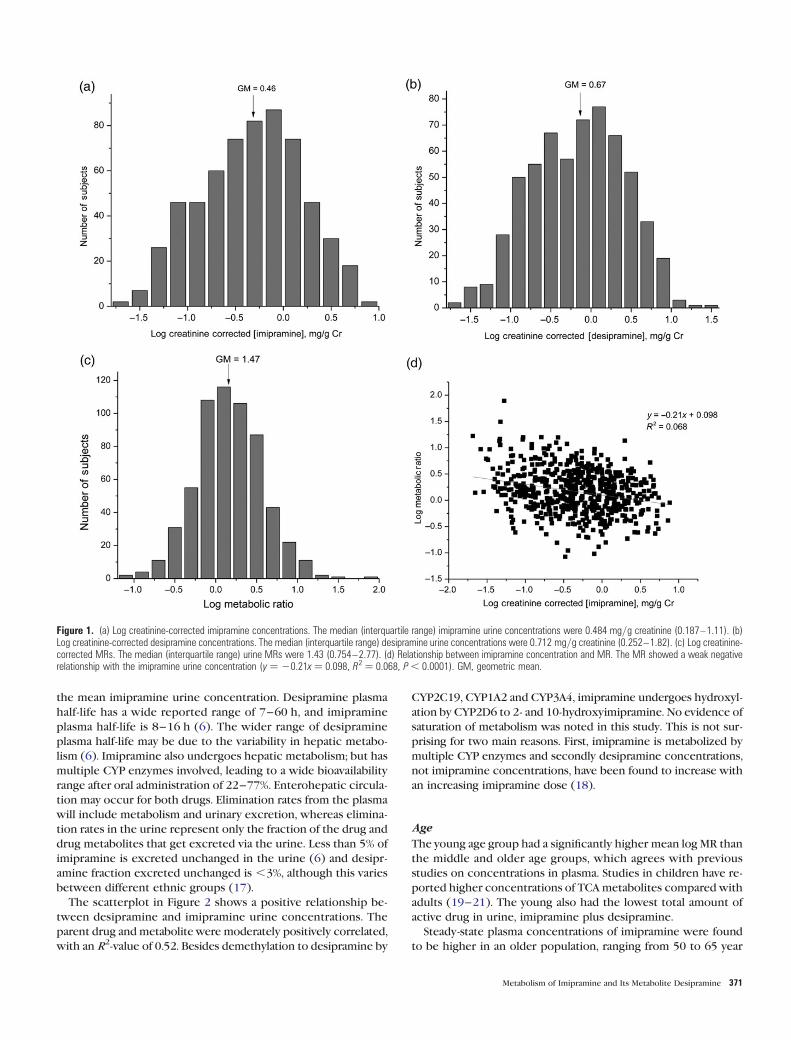
Imipramine and desipramine concentrations are shown in
Figure 1. A Gaussian distribution was observed for the log-
transformed concentrations of imipramine, desipramine and
MR. The imipramine geometric mean was 0.461 mg/g cr and
the 95% CI of the mean was 0.417–0.508. The geometric mean
for desipramine concentration was 0.674 mg/g cr and the 95% CI
of the mean was 0.606–0.750. The observed range of desipr-
amine concentrations was slightly higher than imipramine. The
geometric mean for the sum of imipramine plus desipramine
was 4.605 nmoles/g cr and the 95% CI of the mean was 4.181–
5.072.
For the intrapatient population, the imipramine geometric
mean urine concentration was 0.600 mg/g cr and the 95% CI
of the mean was 0.502–0.716. The desipramine geometric
mean concentration was 0.810 mg/g cr and the 95% CI of the
mean was 0.665–0.987. Once again, urine desipramine concen-
trations were slightly higher than imipramine concentrations.
For the intrasubject population, the geometric mean for the
sum of imipramine plus desipramine was 6.219 nmoles/g cr
and the 95% CI of the mean was 4.981–7.764.
Linear regression analysis was used to determine the relation-
ship between imipramine and desipramine concentrations, as
well as imipramine concentration and MR. A positive correlation
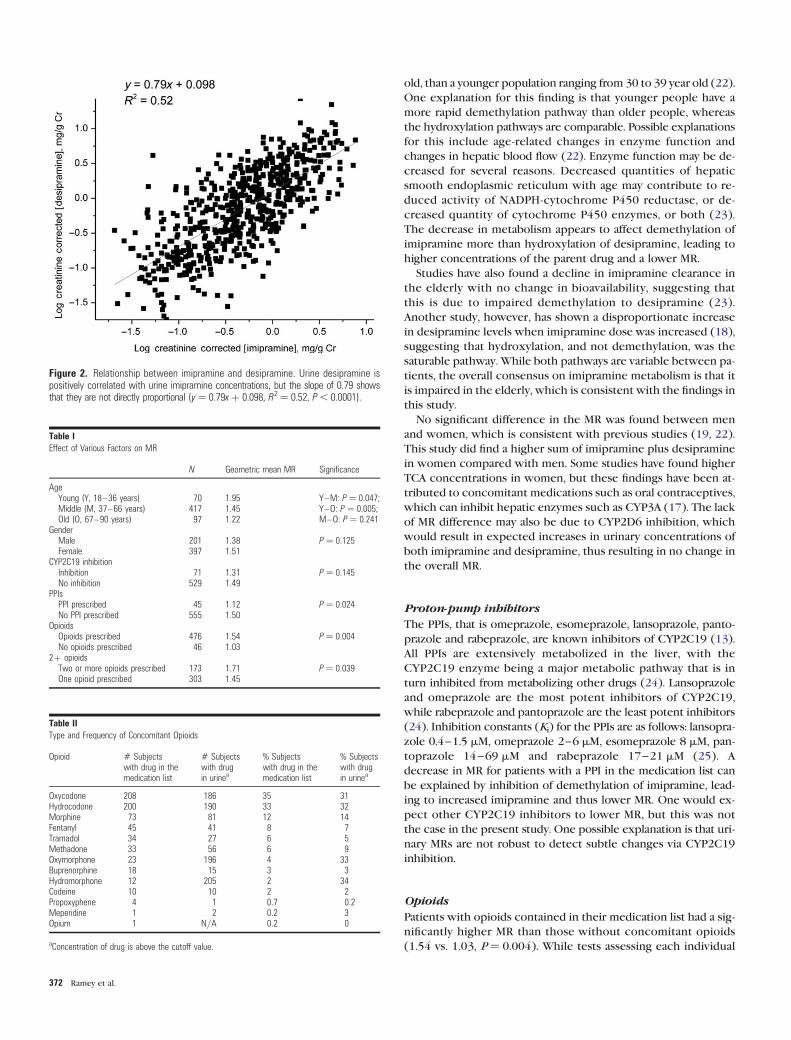
(y ¼ 0.79x þ 0.098, R2 ¼ 0.52; Figure 2) was observed between
imipramine and desipramine concentrations.
The relationship between parent drug and metabolite was fur-
ther assessed by examining MR. The MRs were similar between
the two populations; the geometric mean for the interpatient
population was 1.47 with a 95% CI of 1.36–1.59, whereas the
intrapatient geometric mean was 1.35 with a 95% CI of 1.17–
1.57. Linear regression with imipramine concentration and MR
produced a poor linear fit (R2 ¼ 0.068; Figure 1d), showing
that a correlation between the two was quite small.
Other factors and MR variability
The young age group had a significantly higher mean log MR than
the middle and older age groups, as shown in Table I, with geo-
metric means of 1.95, 1.45 and 1.22, respectively. Sex, CYP2C19
inhibitors and urine pHwere not significantly related to the imip-
ramine MR; all relevant two-sample t-tests produced results of
P . 0.05. However, proton-pump inhibitors (PPIs), when tested
alone without the other CYP2C19 inhibitors, were significantly
associated with lower imipramine MR (1.12 vs. 1.50, P ¼ 0.02).
The patients had the following PPIs in their medication list:
omeprazole (20), esomeprazole (17), pantoprazole (4), rabepra-
zole (3) and lansoprazole (1).
The young group also had a significantly lower sum of I þ D in
the urine compared with the middle age group, with geometric
means in the young, middle and older age groups of 3.24, 4.98
and 4.35, respectively (P ¼ 0.018). When assessing the sum of
I þ D, females had higher values than males, 5.06+ 3.26 vs.
3.81+3.43 nmoles/g cr (P ¼ 0.0062). Urine pH showed a signif-
icant negative relationship with I þ D, but the correlation was
weak (R2 ¼ 0.013).
Concomitant medications
About 30% of patients were positive for one or more of the fol-
lowing: hydrocodone, oxycodone, hydromorphone or oxymor-
phone. Fourteen percent were positive for morphine, and 9%
were positive for methadone. The concomitant opioid frequen-
cies are shown in Table II.
Evaluation of the individual opioids for their impact on the
imipramine MR produced no significant results. However, imip-
ramine patients with no reported opioids in the medication list
had a significantly lower geometric mean MR than the
opioid-reporting population, as shown in Table II. Furthermore,
patients with two or more reported opioids had a significantly
higher MR than those with only one reported opioid (1.71 vs.
1.45, P , 0.05). A slightly, but not significantly, higher mean
MR was found in subjects positive for oxymorphone (P ¼ 0.07),
with geometric mean MRs of 1.59 and 1.40, respectively. A slightly
higher MR was also seen for patients positive for hydromorphone
(P ¼ 0.09), where the respective means were 1.57 and 1.41. Other
common concomitant drugs, including gabapentin, carisoprodol
and benzodiazepines, were not significantly related to the MR
(P . 0.05).
Discussion
The results of this study help establish observed normal ranges
for urinary concentrations of imipramine and desipramine. The
mean desipramine urine concentration was slightly higher than
370 Ramey et al.
the mean imipramine urine concentration. Desipramine plasma
half-life has a wide reported range of 7–60 h, and imipramine
plasma half-life is 8–16 h (6). The wider range of desipramine
plasma half-life may be due to the variability in hepatic metabo-
lism (6). Imipramine also undergoes hepatic metabolism; but has
multiple CYP enzymes involved, leading to a wide bioavailability
range after oral administration of 22–77%. Enterohepatic circula-
tion may occur for both drugs. Elimination rates from the plasma
will include metabolism and urinary excretion, whereas elimina-
tion rates in the urine represent only the fraction of the drug and
drug metabolites that get excreted via the urine. Less than 5% of
imipramine is excreted unchanged in the urine (6) and desipr-
amine fraction excreted unchanged is ,3%, although this varies
between different ethnic groups (17).
The scatterplot in Figure 2 shows a positive relationship be-
tween desipramine and imipramine urine concentrations. The
parent drug andmetabolitewere moderately positively correlated,
with an R2-value of 0.52. Besides demethylation to desipramine by
CYP2C19, CYP1A2 and CYP3A4, imipramine undergoes hydroxyl-
ation by CYP2D6 to 2- and 10-hydroxyimipramine. No evidence of
saturation of metabolism was noted in this study. This is not sur-
prising for two main reasons. First, imipramine is metabolized by
multiple CYP enzymes and secondly desipramine concentrations,
not imipramine concentrations, have been found to increase with
an increasing imipramine dose (18).
Age
The young age group had a significantly higher mean log MR than
the middle and older age groups, which agrees with previous
studies on concentrations in plasma. Studies in children have re-
ported higher concentrations of TCAmetabolites compared with
adults (19–21). The young also had the lowest total amount of
active drug in urine, imipramine plus desipramine.
Steady-state plasma concentrations of imipramine were found
to be higher in an older population, ranging from 50 to 65 year
Figure 1. (a) Log creatinine-corrected imipramine concentrations. The median (interquartile range) imipramine urine concentrations were 0.484 mg/g creatinine (0.187–1.11). (b)Log creatinine-corrected desipramine concentrations. The median (interquartile range) desipramine urine concentrations were 0.712 mg/g creatinine (0.252–1.82). (c) Log creatinine-corrected MRs. The median (interquartile range) urine MRs were 1.43 (0.754–2.77). (d) Relationship between imipramine concentration and MR. The MR showed a weak negativerelationship with the imipramine urine concentration (y ¼ 20.21x ¼ 0.098, R2 ¼ 0.068, P , 0.0001). GM, geometric mean.
Metabolism of Imipramine and Its Metabolite Desipramine 371
old, than a younger population ranging from 30 to 39 year old (22).
One explanation for this finding is that younger people have a
more rapid demethylation pathway than older people, whereas
the hydroxylation pathways are comparable. Possible explanations
for this include age-related changes in enzyme function and
changes in hepatic blood flow (22). Enzyme function may be de-
creased for several reasons. Decreased quantities of hepatic
smooth endoplasmic reticulum with age may contribute to re-
duced activity of NADPH-cytochrome P450 reductase, or de-
creased quantity of cytochrome P450 enzymes, or both (23).
The decrease in metabolism appears to affect demethylation of
imipramine more than hydroxylation of desipramine, leading to
higher concentrations of the parent drug and a lower MR.
Studies have also found a decline in imipramine clearance in
the elderly with no change in bioavailability, suggesting that
this is due to impaired demethylation to desipramine (23).
Another study, however, has shown a disproportionate increase
in desipramine levels when imipramine dose was increased (18),
suggesting that hydroxylation, and not demethylation, was the
saturable pathway. While both pathways are variable between pa-
tients, the overall consensus on imipramine metabolism is that it
is impaired in the elderly, which is consistent with the findings in
this study.
No significant difference in the MR was found between men
and women, which is consistent with previous studies (19, 22).
This study did find a higher sum of imipramine plus desipramine
in women compared with men. Some studies have found higher
TCA concentrations in women, but these findings have been at-
tributed to concomitant medications such as oral contraceptives,
which can inhibit hepatic enzymes such as CYP3A (17). The lack
of MR difference may also be due to CYP2D6 inhibition, which
would result in expected increases in urinary concentrations of
both imipramine and desipramine, thus resulting in no change in
the overall MR.
Proton-pump inhibitors
The PPIs, that is omeprazole, esomeprazole, lansoprazole, panto-
prazole and rabeprazole, are known inhibitors of CYP2C19 (13).
All PPIs are extensively metabolized in the liver, with the
CYP2C19 enzyme being a major metabolic pathway that is in
turn inhibited from metabolizing other drugs (24). Lansoprazole
and omeprazole are the most potent inhibitors of CYP2C19,
while rabeprazole and pantoprazole are the least potent inhibitors
(24). Inhibition constants (Ki) for the PPIs are as follows: lansopra-
zole 0.4–1.5 mM, omeprazole 2–6 mM, esomeprazole 8 mM, pan-
toprazole 14–69 mM and rabeprazole 17–21 mM (25). A
decrease in MR for patients with a PPI in the medication list can
be explained by inhibition of demethylation of imipramine, lead-
ing to increased imipramine and thus lower MR. One would ex-
pect other CYP2C19 inhibitors to lower MR, but this was not
the case in the present study. One possible explanation is that uri-
nary MRs are not robust to detect subtle changes via CYP2C19
inhibition.
Opioids
Patients with opioids contained in their medication list had a sig-
nificantly higher MR than those without concomitant opioids
(1.54 vs. 1.03, P ¼ 0.004). While tests assessing each individual
Figure 2. Relationship between imipramine and desipramine. Urine desipramine ispositively correlated with urine imipramine concentrations, but the slope of 0.79 showsthat they are not directly proportional (y¼ 0.79xþ 0.098, R2¼ 0.52, P , 0.0001).
Table IEffect of Various Factors on MR
N Geometric mean MR Significance
AgeYoung (Y, 18–36 years) 70 1.95 Y–M: P ¼ 0.047;Middle (M, 37–66 years) 417 1.45 Y–O: P ¼ 0.005;Old (O, 67–90 years) 97 1.22 M–O: P ¼ 0.241
GenderMale 201 1.38 P ¼ 0.125Female 397 1.51
CYP2C19 inhibitionInhibition 71 1.31 P ¼ 0.145No inhibition 529 1.49
PPIsPPI prescribed 45 1.12 P ¼ 0.024No PPI prescribed 555 1.50
OpioidsOpioids prescribed 476 1.54 P ¼ 0.004No opioids prescribed 46 1.03
2þ opioidsTwo or more opioids prescribed 173 1.71 P ¼ 0.039One opioid prescribed 303 1.45
Table IIType and Frequency of Concomitant Opioids
Opioid # Subjectswith drug in themedication list
# Subjectswith drugin urinea
% Subjectswith drug in themedication list
% Subjectswith drugin urinea
Oxycodone 208 186 35 31Hydrocodone 200 190 33 32Morphine 73 81 12 14Fentanyl 45 41 8 7Tramadol 34 27 6 5Methadone 33 56 6 9Oxymorphone 23 196 4 33Buprenorphine 18 15 3 3Hydromorphone 12 205 2 34Codeine 10 10 2 2Propoxyphene 4 1 0.7 0.2Meperidine 1 2 0.2 3Opium 1 N/A 0.2 0
aConcentration of drug is above the cutoff value.
372 Ramey et al.
opioid were not significant in their effect on imipramine MR, opi-
oids in general may increase it. It should be noted that inaccura-
cies in the physician-reported medication list were a possibility,
and some lists (78) were not filled out. One possible explanation
for this increased MR is the inhibition of desipramine metabolism
by CYP2D6. Tramadol, codeine, oxycodone and hydrocodone are
all substrates of CYP2D6 (23), and methadone is a known com-
petitive inhibitor of CYP2D6 (26). Also, drugs metabolized by
CYP2D6 often follow nonlinear pharmacokinetics due to the en-
zyme’s saturable nature (27, 28). In addition, genetic polymor-
phisms of CYP2D6 exist, with .80 known variant alleles.
Several CYP2D6 variant alleles are known to result in enzyme ac-
tivity that may be normal, increased, decreased or even absent
(27, 29). The prevalence of these mutations differs among ethnic
groups, with 7% of Caucasians and 1–3% of other ethnic groups
known to have limited CYP2D6 function (28). While this is only
one possible explanation that was seen as a class effect, there is a
need for further research in this matter.
Physicians may want to proceed with caution when prescrib-
ing opioids concurrently with imipramine. Impairment of metab-
olism due to either impaired CYP2D6 function or concomitant
use of medications that are CYP2D6 substrates or inhibitors
may result in increased levels of desipramine. Elevated TCA plas-
ma concentrations lead to increased adverse effects and can lead
to serious events such as prolonged cardiac QT interval, central
nervous system effects, coma and even death (30, 31). The de-
creased availability of CYP2D6 may also cause a slight increase
in imipramine plasma concentration, as this is also a substrate
of the enzyme. Patients taking the aforementioned opioids may
need a lower imipramine dose to prevent increased plasma con-
centrations of both the parent drug and the metabolite.
Limitations
A key limitation of this study is that dose amount and time of dose
administration were not known. Changes in MR over time could
be due to differences in postdose sampling times and differences
in half-lives of the two compounds. Additional limitations include
the lack of CYP 2D6 genotype information, which could help in-
terpret MR findings. Finally, the lack of plasma concentration data
precludes any direct comparisons between urine findings from
this study and expected plasma concentrations. Although these
limitations must be taken into consideration when interpreting
these results, advantages of this study were a large sample size
and robust quantitative drug and metabolite assay results within
each subject.
Conclusion
Urinary concentrations of imipramine and desipramine display
large variability both in and among patients. The MR (desipr-
amine/imipramine) was increased in young patients (18–36 year
old) compared with both middle (37–66 year old) and older
(67–90 year old) populations. At the same time, the sum of imip-
ramine plus desipramine in urine was significantly lower for young
patients. Sex and CYP2C19 inhibitors were not significantly related
to the MR, but PPIs alone were associated with lower MR, possibly
due to decreased imipramine metabolism. Females had signifi-
cantly higher sums of imipramine plus desipramine in urine.
While individual opioids alone were not significantly associated
with the MR, patients positive for oxymorphone or hydromor-
phone had a slightly increased MR. Patients with no opioids in
their medications list had a significantly lower MR than those
with prescribed opioids. Furthermore, patients with only one pre-
scribed opioid had a lower MR than those with two or more pre-
scribed opioids. This suggests that opioids may inhibit CYP2D6
metabolism of desipramine or induce N-demethylation of imipra-
mine, leading to higher concentrations of this active metabolite.
This analysis of urinary excretion ranges of imipramine and
desipramine establishes typical urinary concentrations for pain
patients and discusses variables that can alter those ranges.
Physicians may want to closely monitor imipramine doses in
younger patients, female patients and patients taking concomi-
tant opioids or PPIs. Adverse effects have been shown to occur
over very wide ranges of both imipramine and desipramine plas-
ma concentrations, but the ranges listed here may be useful to
clinical providers as a reference.
Acknowledgments
K.R. was awarded a student fellowship stipend to participate in this
project, supported by the UC San Diego Skaggs School of Pharmacy
and Pharmaceutical Sciences and an unrestricted gift to the UC San
Diego Skaggs School of Pharmacy and Pharmaceutical Sciences
from Millennium Research Institute. The authors thank Dr
Amadeo J. Pesce for his expert advice and guidance in this project.
Conflict of interest
J.D.M. is a paid consultant for Millennium Laboratories.
References
1. Dharmshaktu, P., Tayal, V., Kalra, B.S. (2012) Efficacy of antidepres-
sants as analgesics: a review. Journal of Clinical Pharmacology,
52, 6–17.2. Dworkin, R.H., O’Connor, A.B., Audette, J., Baron, R., Gourlay, G.K.,
Haanpaa, M.L. et al. (2010) Recommendations for the pharmacolog-
ical management of neuropathic pain: an overview and literature up-
date. Mayo Clinic Proceedings, 85, S3–S14.3. Onali, P., Dedoni, S., Olianas, M.C. (2010) Direct agonist activity of tri-
cyclic antidepressants at distinct opioid receptor subtypes. Journal
of Pharmacology and Experimental Therapeutics, 332, 255–265.4. Biegon, A., Samuel, D. (1980) Interaction of tricyclic antidepressants
with opiate receptors. Biochemical Pharmacology, 29, 460–462.5. Gillman, P.K. (2007) Tricyclic antidepressant pharmacology and
therapeutic drug interactions updated. British Journal of
Pharmacology, 151, 737–748.6. Clinical Pharmacology. Imipramine Monograph. 2012. http://www.
clinicalpharmacology-ip.com/Forms/Monograph/monograph.
aspx?cpnum=309&sec=monadve&t=0 (accessed Aug 15, 2012).
7. Su, P., Coutts, R.T., Baker, G.B., Daneshtalab, M. (1993) Analysis of
imipramine and three metabolites produced by isozyme CYP2D6 ex-
pressed in a human cell line. Xenobiotica, 23, 1289–1298.8. Lemoine, A., Gautier, J.C., Azoulay, D., Kiffel, L., Belloc, C.,
Guengerich, F.P. et al. (1993) Major pathway of imipramine metabo-
lism is catalyzed by cytochromes P-450 1A2 and P-450 3A4 in human
liver. Molecular Pharmacology, 43, 827–832.9. Brøsen, K., Klysner, R., Gram, L.F., Otton, S.V., Bech, P., Bertilsson, L.
(1986) Steady-state concentrations of imipramine and its metabolites
in relation to the sparteine/debrisoquine polymorphism. European
Journal of Clinical Pharmacology, 30, 679–684.
Metabolism of Imipramine and Its Metabolite Desipramine 373
10. Koyama, E., Tanaka, T., Chiba, K., Kawakatsu, S., Morinobu, S., Totsuka,
S. et al. (1996) Steady-state plasma concentrations of imipramine
and desipramine in relation to S-mephenytoin 40-hydroxylationstatus in Japanese depressive patients. Journal of Clinical
Psychopharmacology, 16, 286–293.11. Koyama, E., Sohn, D.R., Shin, S.G., Chiba, K., Shin, J.G., Kim, Y.H. et al.
(1994) Metabolic disposition of imipramine in oriental subjects: rela-
tion to metoprolol alpha-hydroxylation and S-mephenytoin
40-hydroxylation phenotypes. Journal of Pharmacology and
Experimental Therapeutics, 271, 860–867.12. Crammer, J.L., Scott, B., Woods, H., Rolfe, B. (1968) Metabolism
of 14C-imipramine. I. Excretion in the rat and in man.
Psychopharmacologia, 12, 263–277.13. Gram, L.F. (1974) Metabolism of tricyclic antidepressants. A review.
Danish Medical Bulletin, 21, 218–231.14. Cone, E.J., Caplan, Y.H., Moser, F., Robert, T., Shelby, M.K., Black, D.L.
(2009) Normalization of urinary drug concentrations with specific
gravity and creatinine. Journal of Analytical Toxicology, 33, 1–7.15. Indiana University/Division of Clinical Pharmacology. P450 Drug
Interaction Table. 2012. http://medicine.iupui.edu/clinpharm/ddis/table.aspx (accessed June 25, 2012).
16. Ishizawa, Y., Yasui-Furukori, N., Takahata, T., Sasaki, M., Tateishi, T.
(2005) The effect of aging on the relationship between the cyto-
chrome P450 2C19 genotype and omeprazole pharmacokinetics.
Clinical Pharmacokinetics, 44, 1179–1189.17. Rudorfer, M.V., Lane, E.A., Chang, W.H., Zhang, M.D., Potter, W.Z.
(1984) Desipramine pharmacokinetics in Chinese and Caucasian vol-
unteers. British Journal of Clinical Pharmacology, 17, 433–440.18. Bjerre, M., Gram, L.F., Kragh-Sorensen, P., Kristensen, C.B., Pedersen,
O.L., Moller, M. et al. (1981) Dose-dependent kinetics of imipramine
in elderly patients. Psychopharmacology, 75, 354–357.19. Rudorfer, M.V., Potter, W.Z. (1999) Metabolism of tricyclic antide-
pressants. Cellular and Molecular Neurobiology, 19, 373–409.20. Potter, W.Z., Calil, H.M., Sutfin, T.A., Zavadil, A.P., Jusko, W.J., Rapoport,
J. et al. (1982) Active metabolites of imipramine and desipramine in
man. Clinical Pharmacology and Therapeutics, 31, 393–401.
21. Preskorn, S.H., Bupp, S.J., Weller, E.B., Weller, R.A. (1989) Plasma lev-
els of imipramine and metabolites in 68 hospitalized children.
Journal of the American Academy of Child and Adolescent
Psychiatry, 28, 373–375.22. Gram, L.F., Sondergaard, I., Christiansen, J., Petersen, G.O., Bech, P.,
Reisby, N. et al. (1977) Steady-state kinetics of imipramine in pa-
tients. Psychopharmacology, 54, 255–261.23. Abernethy, D.R., Greenblatt, D.J., Shader, R.I. (1985) Imipramine and
desipramine disposition in the elderly. Journal of Pharmacology
and Experimental Therapeutics, 232, 183–188.24. Lettino, M. (2010) Inhibition of the antithrombotic effects of clopi-
dogrel by proton pump inhibitors: facts of fancies? European
Journal of Internal Medicine, 21, 484–489.25. Li, X.Q., Andersson, T.B., Ahlstrom, M., Weidolf, L. (2004) Comparison
of inhibitory effects of the proton pump-inhibiting drugs omepra-
zole, esomeprazole, lansoprazole, pantoprazole, and rabeprazole on
human cytochrome P450 activities. Drug Metabolism and
Disposition, 32, 821–827.26. Wu, D., Otton, S.V., Sproule, B.A., Busto, U., Inaba, T., Kalow, W. et al.
(1993) Inhibition of human cytochrome P450 2D6 (CYP2D6)
by methadone. British Journal of Clinical Pharmacology, 35,30–34.
27. Kroemer, H.K., Eichelbaum, M. (1995) ‘It’s the genes, stupid’.
Molecular bases and clinical consequences of genetic cytochrome
P450 2D6 polymorphism. Life Sciences, 56, 2285–2298.28. Leppert, W. (2011) CYP2D6 in the metabolism of opioids for mild to
moderate pain. Pharmacology, 87, 274–285.29. Stamer, U.M., Stuber, F. (2007) Genetic factors in pain and its treat-
ment. Current Opinion in Anesthesiology, 20, 478–484.30. Billups, S.J., Delate, T., Dugan, D. (2009) Evaluation of risk factors for
elevated tricyclic antidepressant plasma concentrations.
Pharmacoepidemiology and Drug Safety, 18, 253–257.31. Labianca, R., Sarzi-Puttini, P., Zuccaro, S.M., Cherubino, P., Vellucci, R.,
Fornasari, D. (2012) Adverse effects associated with non-opioid and
opioid treatment in patients with chronic pain. Clinical Drug
Investigation, 32, 53–63.
374 Ramey et al.