variable coding and modulation experiment using … · variable coding and modulation experiment...
TRANSCRIPT

Joseph A. Downey, Dale J. Mortensen, and Michael A. EvansGlenn Research Center, Cleveland, Ohio
Nicholas S. TollisVantage Partners, LLC, Brook Park, Ohio
Variable Coding and Modulation Experiment UsingNASA’s Space Communication and Navigation Testbed
NASA/TM—2016-219249
July 2016
NASA STI Program . . . in Profi le
Since its founding, NASA has been dedicated to the advancement of aeronautics and space science. The NASA Scientifi c and Technical Information (STI) Program plays a key part in helping NASA maintain this important role.
The NASA STI Program operates under the auspices of the Agency Chief Information Offi cer. It collects, organizes, provides for archiving, and disseminates NASA’s STI. The NASA STI Program provides access to the NASA Technical Report Server—Registered (NTRS Reg) and NASA Technical Report Server—Public (NTRS) thus providing one of the largest collections of aeronautical and space science STI in the world. Results are published in both non-NASA channels and by NASA in the NASA STI Report Series, which includes the following report types: • TECHNICAL PUBLICATION. Reports of
completed research or a major signifi cant phase of research that present the results of NASA programs and include extensive data or theoretical analysis. Includes compilations of signifi cant scientifi c and technical data and information deemed to be of continuing reference value. NASA counter-part of peer-reviewed formal professional papers, but has less stringent limitations on manuscript length and extent of graphic presentations.
• TECHNICAL MEMORANDUM. Scientifi c
and technical fi ndings that are preliminary or of specialized interest, e.g., “quick-release” reports, working papers, and bibliographies that contain minimal annotation. Does not contain extensive analysis.
• CONTRACTOR REPORT. Scientifi c and technical fi ndings by NASA-sponsored contractors and grantees.
• CONFERENCE PUBLICATION. Collected papers from scientifi c and technical conferences, symposia, seminars, or other meetings sponsored or co-sponsored by NASA.
• SPECIAL PUBLICATION. Scientifi c,
technical, or historical information from NASA programs, projects, and missions, often concerned with subjects having substantial public interest.
• TECHNICAL TRANSLATION. English-
language translations of foreign scientifi c and technical material pertinent to NASA’s mission.
For more information about the NASA STI program, see the following:
• Access the NASA STI program home page at http://www.sti.nasa.gov
• E-mail your question to [email protected] • Fax your question to the NASA STI
Information Desk at 757-864-6500
• Telephone the NASA STI Information Desk at 757-864-9658 • Write to:
NASA STI Program Mail Stop 148 NASA Langley Research Center Hampton, VA 23681-2199

Joseph A. Downey, Dale J. Mortensen, and Michael A. EvansGlenn Research Center, Cleveland, Ohio
Nicholas S. TollisVantage Partners, LLC, Brook Park, Ohio
Variable Coding and Modulation Experiment UsingNASA’s Space Communication and Navigation Testbed
NASA/TM—2016-219249
July 2016
National Aeronautics andSpace Administration
Glenn Research CenterCleveland, Ohio 44135
Acknowledgments
The authors would like to thank the SCaN Testbed Operations and Ground Station team for supporting the testing campaign over several months. There were lessons learned that will be applied to future experiments.
Available from
Level of Review: This material has been technically reviewed by technical management.
NASA STI ProgramMail Stop 148NASA Langley Research CenterHampton, VA 23681-2199
National Technical Information Service5285 Port Royal RoadSpringfi eld, VA 22161
703-605-6000
This report is available in electronic form at http://www.sti.nasa.gov/ and http://ntrs.nasa.gov/

Abstract
National Aeronautics and Space Administration (NASA)’s Space Communication and Navigation Testbedon the International Space Station provides a unique opportunity to evaluate advanced communicationtechniques in an operational system. The experimental nature of the Testbed allows for rapid demonstrationswhile using flight hardware in a deployed system within NASA’s networks. One example is variable codingand modulation, which is a method to increase data-throughput in a communication link. This paperdescribes recent flight testing with variable coding and modulation over S-band using a direct-to-earth linkbetween the SCaN Testbed and the Glenn Research Center. The testing leverages the established Digital VideoBroadcasting Second Generation (DVB-S2) standard to provide various modulation and coding options. Theexperiment was conducted in a challenging environment due to the multipath and shadowing caused bythe International Space Station structure. Performance of the variable coding and modulation system isevaluated and compared to the capacity of the link, as well as standard NASA waveforms.
I. INTRODUCTION
Variable Coding and Modulation (VCM) is a method to increase the overall throughput and efficiencyof a communication system by dynamically changing the modulation and forward error correction. Whenlink conditions are predicted to be favorable, high-order modulations and forward error correction schemeswith minimal overhead are used to maximize the data transfer. Conversely in poor link conditions, robustmodulation and coding are used to maximize the link margin, but at reduced throughput. VCM techniquesare effective when the link dynamics can be predicted with accurate modeling, for example, varying free-space path loss. Otherwise, adaptive coding and modulation (ACM) can be more effective, aided by afeedback path to relay channel state information back to the source.
The second generation Digital Video Broadcasting for Satellites (DVB-S2) standard [1] includes aprovision for VCM and ACM functionality. While the DVB-S2 standard is primarily used within thetelecommunications industry for video broadcast and Internet access, it is also applicable to spacecrafttelemetry. The original application of VCM in the DVB-S2 standard was to optimize bandwidth utilizationbased on data priority, while ACM was used to accommodate changes in the weather (rain fade). However,it can also be used to adapt to varying noise, interference, pointing errors, and dynamic link conditions(path loss) which are seen with spacecraft operations. Due to the availability of intellectual property (IP)cores and low-cost receiver hardware, it is becoming an attractive option for certain missions. See [2] forexamples of missions using or considering DVB-S2 (CubeSats, etc). Recognizing the potential applicationfor space missions, the Consultative Committee for Space Data Systems (CCSDS) has recommended amethod of using the DVB-S2 standard [3] which accommodates the preferred Space Data Link Protocol forspacecraft telemetry [4]. Other relevant CCSDS standards which support VCM are the Serial ConcatenatedConvolutional Turbo Codes [5], and another currently in development [6] which uses modulations andcodes already defined in existing CCSDS standards [7]. Due to the availability of receiver equipment,DVB-S2 was selected for this experiment.
Variable Coding and Modulation Experiment Using NASA’s Space Communication and
Navigation Testbed
Joseph A. Downey, Dale J. Mortensen, and Michael A. Evans National Aeronautics and Space Administration
Glenn Research Center Cleveland, Ohio 44130
Nicholas S. Tollis
Vantage Partners, LLC Brook Park, Ohio 44142
NASA/TM—2016-219126 1
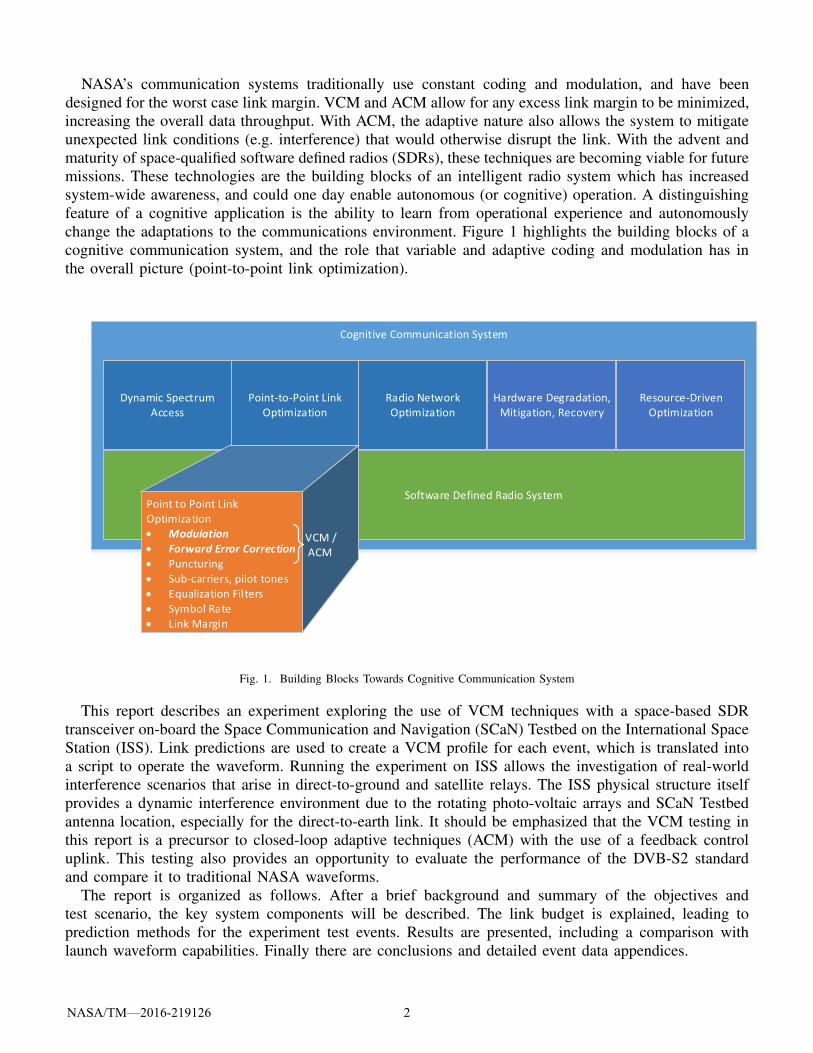
increasing the overall data throughput. With ACM, the adaptive nature also allows the system to mitigateunexpected link conditions (e.g. interference) that would otherwise disrupt the link. With the advent andmaturity of space-qualified software defined radios (SDRs), these techniques are becoming viable for futuremissions. These technologies are the building blocks of an intelligent radio system which has increasedsystem-wide awareness, and could one day enable autonomous (or cognitive) operation. A distinguishingfeature of a cognitive application is the ability to learn from operational experience and autonomouslychange the adaptations to the communications environment. Figure 1 highlights the building blocks of acognitive communication system, and the role that variable and adaptive coding and modulation has inthe overall picture (point-to-point link optimization).
Cognitive Communication System
Software Defined Radio System
Dynamic Spectrum Access
Point-to-Point Link Optimization
Radio Network Optimization
Hardware Degradation, Mitigation, Recovery
Resource-Driven Optimization
Point to Point Link Optimization Modulation Forward Error Correction Puncturing Sub-carriers, pilot tones Equalization Filters Symbol Rate Link Margin
VCM / ACM
Fig. 1. Building Blocks Towards Cognitive Communication System
This report describes an experiment exploring the use of VCM techniques with a space-based SDRtransceiver on-board the Space Communication and Navigation (SCaN) Testbed on the International SpaceStation (ISS). Link predictions are used to create a VCM profile for each event, which is translated intoa script to operate the waveform. Running the experiment on ISS allows the investigation of real-worldinterference scenarios that arise in direct-to-ground and satellite relays. The ISS physical structure itselfprovides a dynamic interference environment due to the rotating photo-voltaic arrays and SCaN Testbedantenna location, especially for the direct-to-earth link. It should be emphasized that the VCM testing inthis report is a precursor to closed-loop adaptive techniques (ACM) with the use of a feedback controluplink. This testing also provides an opportunity to evaluate the performance of the DVB-S2 standardand compare it to traditional NASA waveforms.
The report is organized as follows. After a brief background and summary of the objectives andtest scenario, the key system components will be described. The link budget is explained, leading toprediction methods for the experiment test events. Results are presented, including a comparison withlaunch waveform capabilities. Finally there are conclusions and detailed event data appendices.
NASA’s communication systems traditionally use constant coding and modulation, and have beendesigned for the worst case link margin. VCM and ACM allow for any excess link margin to be minimized,
NASA/TM—2016-219126 2
II. BACKGROUND
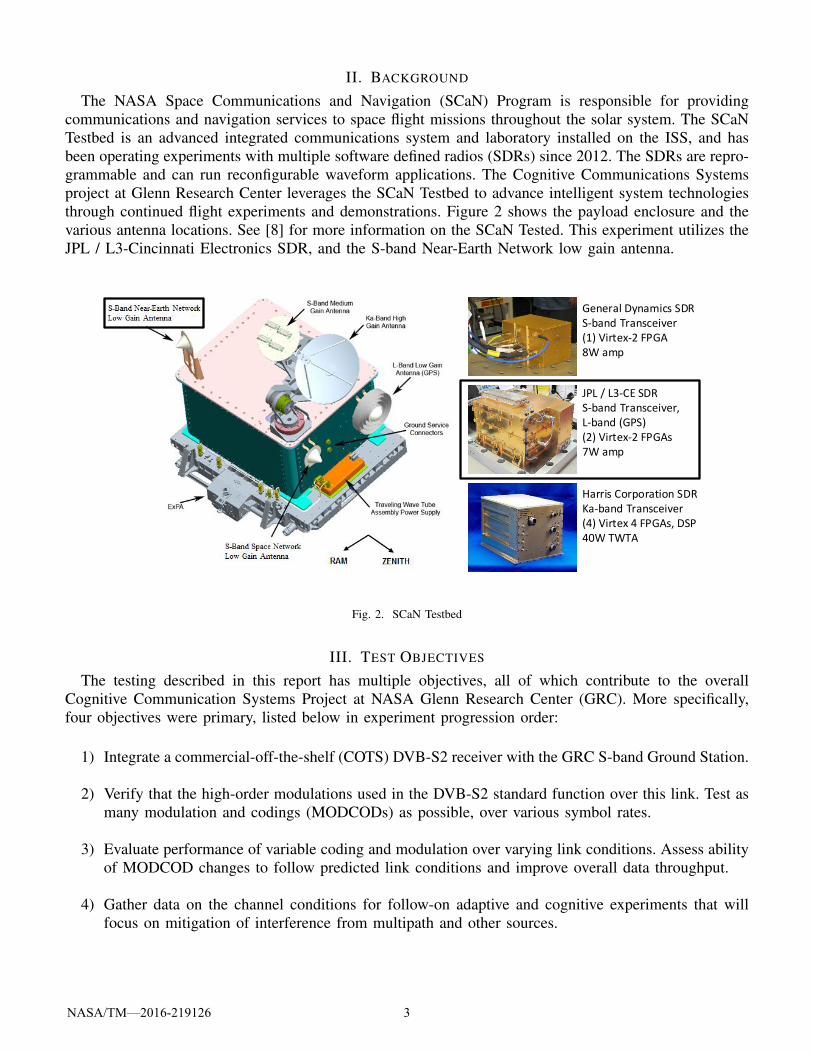
The NASA Space Communications and Navigation (SCaN) Program is responsible for providingcommunications and navigation services to space flight missions throughout the solar system. The SCaNTestbed is an advanced integrated communications system and laboratory installed on the ISS, and hasbeen operating experiments with multiple software defined radios (SDRs) since 2012. The SDRs are repro-grammable and can run reconfigurable waveform applications. The Cognitive Communications Systemsproject at Glenn Research Center leverages the SCaN Testbed to advance intelligent system technologiesthrough continued flight experiments and demonstrations. Figure 2 shows the payload enclosure and thevarious antenna locations. See [8] for more information on the SCaN Tested. This experiment utilizes theJPL / L3-Cincinnati Electronics SDR, and the S-band Near-Earth Network low gain antenna.
General Dynamics SDRS-band Transceiver(1) Virtex-2 FPGA8W amp
JPL / L3-CE SDRS-band Transceiver,L-band (GPS)(2) Virtex-2 FPGAs7W amp
Harris Corporation SDRKa-band Transceiver(4) Virtex 4 FPGAs, DSP40W TWTA
Fig. 2. SCaN Testbed
III. TEST OBJECTIVES
The testing described in this report has multiple objectives, all of which contribute to the overallCognitive Communication Systems Project at NASA Glenn Research Center (GRC). More specifically,four objectives were primary, listed below in experiment progression order:
1) Integrate a commercial-off-the-shelf (COTS) DVB-S2 receiver with the GRC S-band Ground Station.
2) Verify that the high-order modulations used in the DVB-S2 standard function over this link. Test asmany modulation and codings (MODCODs) as possible, over various symbol rates.
3) Evaluate performance of variable coding and modulation over varying link conditions. Assess abilityof MODCOD changes to follow predicted link conditions and improve overall data throughput.
4) Gather data on the channel conditions for follow-on adaptive and cognitive experiments that willfocus on mitigation of interference from multipath and other sources.
NASA/TM—2016-219126 3
IV. TEST SCENARIO
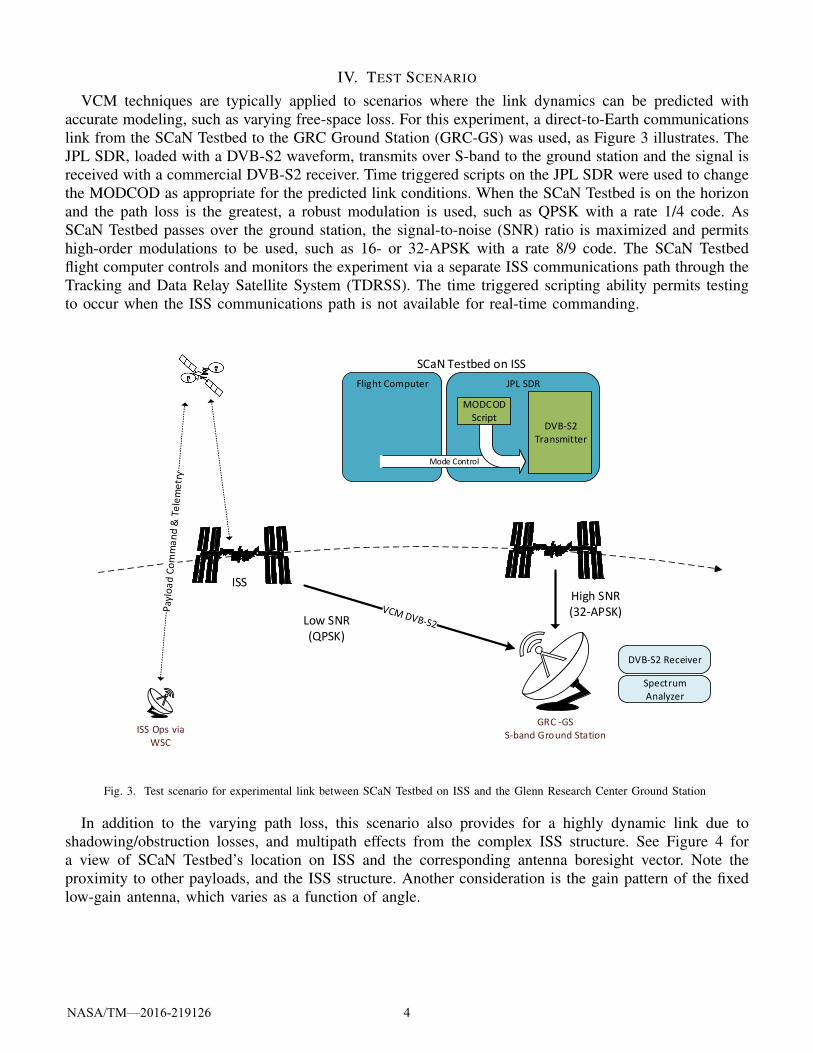
VCM techniques are typically applied to scenarios where the link dynamics can be predicted withaccurate modeling, such as varying free-space loss. For this experiment, a direct-to-Earth communicationslink from the SCaN Testbed to the GRC Ground Station (GRC-GS) was used, as Figure 3 illustrates. TheJPL SDR, loaded with a DVB-S2 waveform, transmits over S-band to the ground station and the signal isreceived with a commercial DVB-S2 receiver. Time triggered scripts on the JPL SDR were used to changethe MODCOD as appropriate for the predicted link conditions. When the SCaN Testbed is on the horizonand the path loss is the greatest, a robust modulation is used, such as QPSK with a rate 1/4 code. AsSCaN Testbed passes over the ground station, the signal-to-noise (SNR) ratio is maximized and permitshigh-order modulations to be used, such as 16- or 32-APSK with a rate 8/9 code. The SCaN Testbedflight computer controls and monitors the experiment via a separate ISS communications path through theTracking and Data Relay Satellite System (TDRSS). The time triggered scripting ability permits testingto occur when the ISS communications path is not available for real-time commanding.
JPL SDR
ISS
GRC -GSS-band Ground Station
DVB-S2 Receiver
Spectrum Analyzer
MODCODScript
DVB-S2 Transmitter
Flight Computer
Mode Control
High SNR (32-APSK)
Low SNR(QPSK)
ISS
SCaN Testbed on ISS
ISS Ops via WSC
Fig. 3. Test scenario for experimental link between SCaN Testbed on ISS and the Glenn Research Center Ground Station
In addition to the varying path loss, this scenario also provides for a highly dynamic link due toshadowing/obstruction losses, and multipath effects from the complex ISS structure. See Figure 4 fora view of SCaN Testbed’s location on ISS and the corresponding antenna boresight vector. Note theproximity to other payloads, and the ISS structure. Another consideration is the gain pattern of the fixedlow-gain antenna, which varies as a function of angle.
NASA/TM—2016-219126 4

Fig. 4. SCaN Testbed onboard the ISS with boresight vector for the S-band Near Earth Network - Low Gain Antenna
A. SCaN Testbed Analysis ToolThe SCaN Testbed Analysis Tool (STAT) was used to provide detailed predictions for each event, which
take into account antenna pattern variations, major line-of-sight obstructions, and averages the effects ofpotential multipath. Prior to this experiment, the direct-to-ground link was characterized over the courseof several months, and an effective antenna pattern emerged. See [9] for details on the measurementapproach. Figure 5 shows an example STAT model prediction compared to the actual received signal.Although the absolute magnitude differs by several dB, it accurately predicts when a nearby payload (theJapanese Experiment Module (JEM)) will disrupt the link, and when the signal will drop off as the antennapattern transitions to the back lobe. This experiment attemps to account for these known obstructions byadjusting the modulation and coding (MODCOD) accordingly.
0 50 100 150 200 250 300 35045
50
55
60
65
70
75
80
85
90
Time (seconds)
C/N
o (d
B−
Hz)
JEM Obstruction
STAT ModelReceived
Transition to Backlobe
Fig. 5. STAT model prediction versus actual received signal including shadowing from JEM and multipath
NASA/TM—2016-219126 5

B. GRC S-band Ground StationThe experimental S-band ground station (GS) used for these tests is located at GRC on the rooftop of
building 110, a 3-story building. The ground station has a steerable antenna which tracks the SCaN Testbedusing open-loop pointing. The GRC-GS is equipped with various power meters and a spectrum analyzerto monitor the link, as well as ports for easy integration of local ground modems and test equipment viaan intra-building RF-over-fiber system. In this manner, the experimenter equipment can be adjacent to theSCaN Testbed operations center. Key ground station specifications are listed in Table I for the downlink.See [10] for more details on the GRC-GS.
TABLE IGROUND STATION DOWNLINK PARAMETERS
Characteristic ValueFrequency S-bandDiameter 2.4 meterPolarization Left hand circularHalf-power beamwidth 3.9 degreesGain 31.5 dBG/T 2 dB/K
Open-loop pointing error is an important consideration for this experiment, and is comprised of severalfactors: 1) Elevation angle restrictions - the GRC-GS antenna has a 10◦ restriction above the horizon. Thebeginning of each event will have additional pointing loss until SCaN Testbed is above 10◦ elevation. 2)Oblate versus spherical earth model - early versions of the antenna pointing software used a spherical earthmodel leading to pointing errors. 3) Key-hole effect - two-axis gimbaled antenna systems cannot rotatearound fast enough near high elevation angles while tracking. For the GRC-GS, this occurs at elevationangles >80◦.
Only the 10◦ elevation angle restriction was captured in the STAT model prediction at the time oftesting. The spherical earth model error has been corrected in subsequent updates to the antenna pointingsoftware, and the STAT model now accounts for the key-hole effect; however both were a source of errorfor this VCM experiment. Example pointing losses are shown in Figure 6 for a set of events. Note thatthe pointing loss for the spherical vs. oblate model error increases as a function of the elevation angle.The peak pointing error from the spherical model occurs when the signal-to-noise ratio is the highest,limiting data throughput.
C. Link BudgetThe link budget for this scenario is described in Table II, using best case values for free space loss
and the nominal boresight gain of the antenna. With these ideal conditions, there is sufficient link marginfor the highest modulation and code rates (MODCODs) and the highest symbol rate of 4.55 MBaud.This basic link budget assumes no fade margin and the nominal boresight gain of the antenna; actualperformance is dependent on the geometry, antenna pattern, and multipath environment. The spectrumlicense for the downlink between SCaN Testbed and the GRS-GS has 5 MHz of bandwidth, which limitsthe symbol rate to 4.55 MBaud.
In order to down-select potential ground station contacts, a minimum C/No of 63 dB-Hz was specified,which corresponds to an Es/No of at least 3 dB with the lowest symbol rate (1 MBaud). A higher level, 75dB-Hz, was preferred for running higher symbol rates and high-order modulation modes. This criteria wasused to down-select potential ground station contacts which were predicted to have poor signal strength,or limited duration above the specified thresholds. The thresholds are based on the performance of thecommercial DVB-S2 receiver, as shown in Figure 10.
NASA/TM—2016-219126 6

0 50 100 150 200 250 300 350 400
Event Time (s)
-2
0
2
4
6
8
10
12
14
Poi
ntin
g Lo
ss (
dB)
Elevation AngleRestriction Spherical vs Oblate Earth
Error
Peak elevation
53°
37°
62°
Fig. 6. Pointing Loss for Several Events
TABLE IILINK BUDGET
Parameter Value NotesFrequency (MHz) 2216.5Transmit Power (dBW) 7.5Transmit Circuit Loss (dB) -1.7Boresight Antenna Gain (dBi) 1.81 Peak gain is 4.86 dBiEIRP (dBW) 7.61Free Space Loss (dB) 152.62 Best case, 90 degrees elevationAtmospheric Loss (dB) 0.37 5 degree elevation (worst case)Rain Attenuation (dB) 0.14 99.9%Fade Margin (dB) 0Ground Station Pointing Loss (dB) 2 2 dB assumed in STAT model predictionsGround G/T (dB/K) 2Boltzmann’s Constant -228.6 dBW/K/HzC/No at Ground (dB-Hz) 83.1
1 MBaud Lowest rate supported by receiverNet Es/No (dB) 23.1 =C/No - 10log10(Symbol Rate)Required Es/No (dB) 21.87 MODCOD 27: 32-APSK, Rate 8/9 CodeLink Margin (dB) 1.23
4.55 MBaud Highest rate supported in channel bandwidthNet Es/No (dB) 16.52 =C/No - 10log10(Symbol Rate)Required Es/No (dB) 14.45 MODCOD 22: 16-APSK, Rate 8/9 CodeLink Margin (dB) 2.07
NASA/TM—2016-219126 7
V. DVB-S2 WAVEFORM IMPLEMENTATION
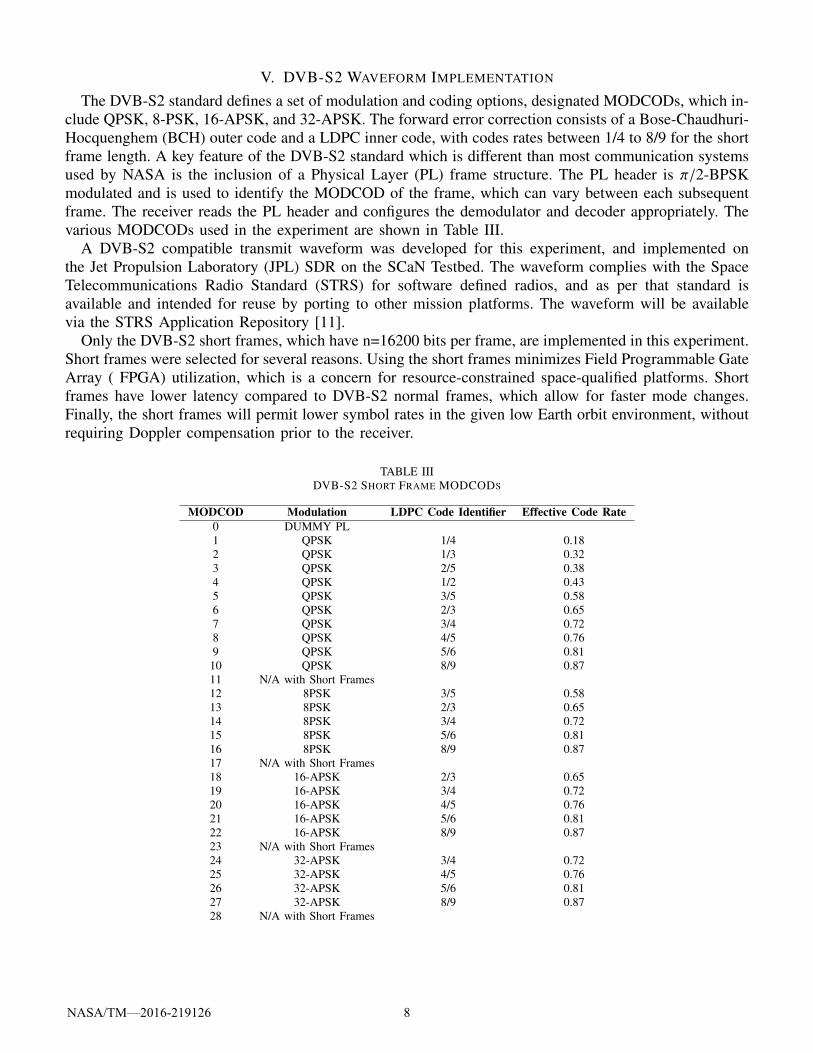
The DVB-S2 standard defines a set of modulation and coding options, designated MODCODs, which in-clude QPSK, 8-PSK, 16-APSK, and 32-APSK. The forward error correction consists of a Bose-Chaudhuri-Hocquenghem (BCH) outer code and a LDPC inner code, with codes rates between 1/4 to 8/9 for the shortframe length. A key feature of the DVB-S2 standard which is different than most communication systemsused by NASA is the inclusion of a Physical Layer (PL) frame structure. The PL header is π/2-BPSKmodulated and is used to identify the MODCOD of the frame, which can vary between each subsequentframe. The receiver reads the PL header and configures the demodulator and decoder appropriately. Thevarious MODCODs used in the experiment are shown in Table III.
A DVB-S2 compatible transmit waveform was developed for this experiment, and implemented onthe Jet Propulsion Laboratory (JPL) SDR on the SCaN Testbed. The waveform complies with the SpaceTelecommunications Radio Standard (STRS) for software defined radios, and as per that standard isavailable and intended for reuse by porting to other mission platforms. The waveform will be availablevia the STRS Application Repository [11].
Only the DVB-S2 short frames, which have n=16200 bits per frame, are implemented in this experiment.Short frames were selected for several reasons. Using the short frames minimizes Field Programmable GateArray ( FPGA) utilization, which is a concern for resource-constrained space-qualified platforms. Shortframes have lower latency compared to DVB-S2 normal frames, which allow for faster mode changes.Finally, the short frames will permit lower symbol rates in the given low Earth orbit environment, withoutrequiring Doppler compensation prior to the receiver.
TABLE IIIDVB-S2 SHORT FRAME MODCODS
MODCOD Modulation LDPC Code Identifier Effective Code Rate0 DUMMY PL1 QPSK 1/4 0.182 QPSK 1/3 0.323 QPSK 2/5 0.384 QPSK 1/2 0.435 QPSK 3/5 0.586 QPSK 2/3 0.657 QPSK 3/4 0.728 QPSK 4/5 0.769 QPSK 5/6 0.8110 QPSK 8/9 0.8711 N/A with Short Frames12 8PSK 3/5 0.5813 8PSK 2/3 0.6514 8PSK 3/4 0.7215 8PSK 5/6 0.8116 8PSK 8/9 0.8717 N/A with Short Frames18 16-APSK 2/3 0.6519 16-APSK 3/4 0.7220 16-APSK 4/5 0.7621 16-APSK 5/6 0.8122 16-APSK 8/9 0.8723 N/A with Short Frames24 32-APSK 3/4 0.7225 32-APSK 4/5 0.7626 32-APSK 5/6 0.8127 32-APSK 8/9 0.8728 N/A with Short Frames
NASA/TM—2016-219126 8
The following subsections describe the hardware, firmware, software, and scripting of the DVB-S2waveform.
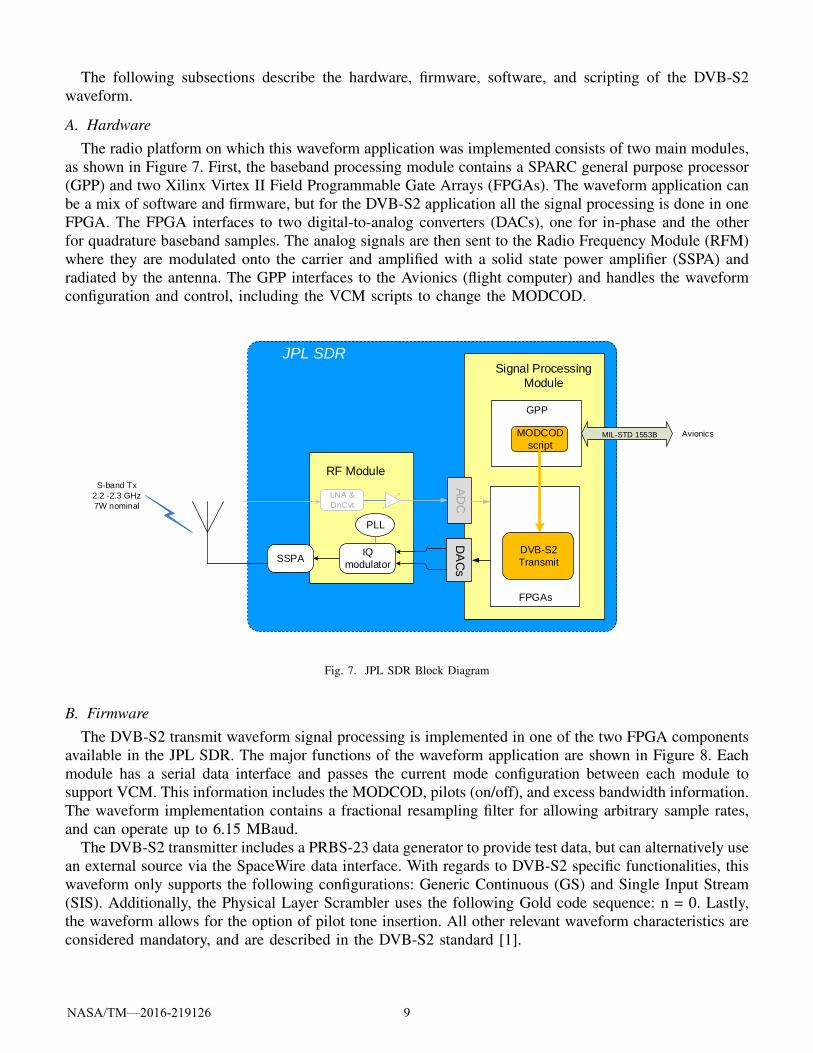
A. HardwareThe radio platform on which this waveform application was implemented consists of two main modules,
as shown in Figure 7. First, the baseband processing module contains a SPARC general purpose processor(GPP) and two Xilinx Virtex II Field Programmable Gate Arrays (FPGAs). The waveform application canbe a mix of software and firmware, but for the DVB-S2 application all the signal processing is done in oneFPGA. The FPGA interfaces to two digital-to-analog converters (DACs), one for in-phase and the otherfor quadrature baseband samples. The analog signals are then sent to the Radio Frequency Module (RFM)where they are modulated onto the carrier and amplified with a solid state power amplifier (SSPA) andradiated by the antenna. The GPP interfaces to the Avionics (flight computer) and handles the waveformconfiguration and control, including the VCM scripts to change the MODCOD.
JPL SDR
RF Module
Signal Processing
Module
DA
Cs
AD
C
FPGAs
PLL
IQ
modulatorSSPA
DVB-S2
Transmit
LNA &
DnCvt
GPP
MODCOD
scriptMIL-STD 1553B Avionics
S-band Tx
2.2 -2.3 GHz
7W nominal
Fig. 7. JPL SDR Block Diagram
B. FirmwareThe DVB-S2 transmit waveform signal processing is implemented in one of the two FPGA components
available in the JPL SDR. The major functions of the waveform application are shown in Figure 8. Eachmodule has a serial data interface and passes the current mode configuration between each module tosupport VCM. This information includes the MODCOD, pilots (on/off), and excess bandwidth information.The waveform implementation contains a fractional resampling filter for allowing arbitrary sample rates,and can operate up to 6.15 MBaud.
The DVB-S2 transmitter includes a PRBS-23 data generator to provide test data, but can alternatively usean external source via the SpaceWire data interface. With regards to DVB-S2 specific functionalities, thiswaveform only supports the following configurations: Generic Continuous (GS) and Single Input Stream(SIS). Additionally, the Physical Layer Scrambler uses the following Gold code sequence: n = 0. Lastly,the waveform allows for the option of pilot tone insertion. All other relevant waveform characteristics areconsidered mandatory, and are described in the DVB-S2 standard [1].
NASA/TM—2016-219126 9

Data Slicer +Baseband Header
ACM/VCMCommands
Randomizer BCHEncoder
LDPCEncoder
BlockInterleaver
SymbolMapper
Physical LayerFramer + Pilots
Dummy PhysicalLayer Frames
Physical LayerScrambler
SRRCPulse Shaping
PRBS-23Data
Samplesto DAC
Fig. 8. DVB-S2 Waveform Processing Functions
C. SoftwareUser control of the DVB-S2 waveform is provided through several layers. Since SCaN Testbed is an
experimental payload on the International Space Station (ISS), it utilizes ground terminal applicationsdeveloped for it using the Telescience Resource Kit (TReK) in order to provide a command and telemetryinterface for experiment operators. An operator at the NASA GRC Telescience Center can therefore directlycontrol the SCaN Testbed and JPL SDR in real-time through the NASA ground and space network. Onorbit, the payload Avionics integrates control of all subsystems, interpreting commands and aggregatingtelemetry for each, including the JPL SDR.
The JPL SDR interfaces with Avionics via a MIL-STD-1553B connection and has two separate interfacemodes. The first mode acts as a bootloader where new software and FPGA configurations can be uploaded,stored and booted. The second mode provides full control of the waveform through the JPL OperatingEnvironment (OE). The OE is a software framework for implementing an SDR waveform based on theNASA Space Telecommunications Radio System (STRS) architecture standard that runs on the Real-TimeExecutive for Multiprocessor Systems (RTEMS) operating system. This allows a consistent approach fordeveloping and running different waveforms on the radio.
The DVB-S2 waveform consists of both an FPGA component and a software component to controland configure it. The software handles all aspects of getting the waveform up and running and managesits operation while running. To be STRS-compliant all waveforms must have a defined set of propertiesthat can be configured or queried that are specific to the particular waveform. The DVB-S2 waveform isdesigned for VCM and ACM and has properties that can be configured dynamically while operating suchas MODCOD, symbol rate, pulse-shape filter (PSF) roll-off, pilots, etc. These prominent properties existwithin the waveform’s FPGA components and the software gains access to them through an abstractionlayer. The software also manages platform level components through existing drivers to control fixedresources such as Phase Locked Loops (PLL) and the transmitter SSPA.
D. ScriptingInitial testing relied upon the user manually commanding the MODCOD during an event, but proved
cumbersome. In order to improve upon manually operating the VCM testing, time triggered scripting wasadded as a function in the waveform software to provide more precise MODCOD control to the tests. This
NASA/TM—2016-219126 10

allows a script to be executed automatically at the beginning of an experiment event and then sequenceMODCOD changes to the waveform at appropriate times throughout the duration. Scripts were generatedprior to each event based on the STAT predicted link characteristics.
The scripting requires that the JPL SDR be time synchronized with Avionics in order to begin executingthe script at the proper time. On initial use of this feature, the script began 17 seconds prior to the timeexpected. It was found that Avionics is synchronized with ISS time which is global positioning system(GPS) time and that the scripting function expected Greenwich Mean Time (GMT) time. Because GPS timedoes not account for leap seconds, the time synchronization of the JPL SDR requires a small compensationfor the delta. After identifying the discrepancy, all subsequent tests triggered properly and executed thescripts as expected.
VI. EXPERIMENTER GROUND EQUIPMENT
The experimenter ground equipment is shown in Figure 9. The mobile rack supports laboratory tests withthe SDR breadboard and engineering models, and can then be moved to the SCaN Testbed operations centerto support flight testing. Key features of the rack include integrated additive white Gaussian noise (AWGN)testing, Doppler simulation, and internal loop-back testing. One lesson learned was that an automatic gaincircuit (AGC) is needed between the GRC-GS and the experimenter test equipment. Predicted powerlevels are used to set an attenuator for each event, and if the actual signal level is significantly higherthan predicted there is the potential to saturate the user test equipment. An AGC circuit is now integratedin the rack.
Precision Attenuator
Signal Analyzer
Downconverter
Control PC / DekTec DVB-S2 Receiver
Synthesizer
AGC
Doppler Simulation
AWGN
Fig. 9. Experimenter Equipment Rack
As a low-cost DVB-S2 receiver, DekTec’s DTA-2137C PCI-Express-based card was used in a hostcomputer for real-time bit collection and processing. The DekTek PCIe receiver can operate between2 and 45 MBaud, and down to 1 MBaud with additional degradation. DekTec provided the APIs to
NASA/TM—2016-219126 11

transfer raw binary data from the card to the host PC, and a custom C++ application was written to aligndata frames and implement a bit-error rate tester. Additionally, the card provides metrics such as SNR,MER, decoder statistics, and current MODCOD value, which are all logged to file. The logging rate isconfigurable, but was set to 1 Hz for this testing.
An important factor when selecting DVB-S2 receivers was support for the raw DVB-S2 basebandframes, bypassing any transport layer protocols which are normally used with DVB-S2 such as Multi-protocol Encapsulation (MPE) or Generic Stream Encapsulation (GSE). Support for raw DVB-S2 framespermits custom framing, as needed for the CCSDS recommended practice of sending Space Data LinkProtocol frames over DVB-S2. The DekTec receive application saves the raw data within the L3 BasebandFrame format [12], which includes a time-stamp, and signal-to-noise estimate for each received DVB-S2frame. The frame format is intended to be used in an adaptive coding and modulation system, and is alsouseful for analyzing link performance since it records the SNR for each frame.
Ground tests were performed to characterize the Dektec DVB-S2 receiver and to determine the thresholdfor quasi-error free performance. The JPL SDR development breadboard was used as the signal source,and a white Gaussian noise generator was added to the signal with a combiner. The signal amplitudeof the DVB-S2 transmitter was varied with a precision step attenuator and swept over a range of SNR.Figure 10 shows the results of the characterization. Of note, there is significant degradation for the lowestMODCOD compared to the reference data provided in [13], and [14], as well as for 32-APSK modulations(highest MODCODs). The data provided is for a frame error rate (FER) of 1e-5.
−5 0 5 10 15 20 250
0.5
1
1.5
2
2.5
3
3.5
4
4.5
Es/No (Modem Estimator)
Spe
ctra
l Effi
cien
cy (
bits
/cha
nnel
use
)
1
2 3 4
5 6
7 8 9
10 1213
14
15
1618
1920
21
22 242526
27
DVB−S2 ReferenceDekTec, 3 MBaud
Fig. 10. Receiver Performance per MODCOD at 1e-5 FER, pilots off
During this characterization, several issues were observed with 32-APSK modulation modes, where thereceiver would occasionally drop frames, especially during transitions between modulation types. Thisdisrupted the real-time BER software implementation, and eliminated the ability to properly monitor thelink during the brief duration of typical events. Consequently, 32-APSK modulation was used sparely,with the focus on 16-APSK. Since this testing, the real-time BER software has been improved to beresilient to dropped frames.
NASA/TM—2016-219126 12

VII. VCM PREDICTIONS BECOMING OPERATIONS
Preparing for an experiment event using VCM required a multi-step sequence leading up to operationof the link. Typical steps to select and prepare for a VCM test event are as follows:
1) Initial STAT assessment and ISS obstruction analysis of ground station passes for week(s) of testing.
2) Experimenter down-select of worthwhile events using predicted link performance, of which thecarrier-to-noise ratio (C/No) variation over the event duration is of most interest.
3) Day of event, updated event timing and performance prediction is provided by GS operator basedon updated ISS orbit and attitude information.
4) Using the predicted C/No, a recommended symbol rate and MODCOD profile is generated usinga custom MATLAB script with a settable link margin, as shown in Figure 11. The script estimatesthe throughput for a set of user-defined symbol-rates.
5) A sequenced command script for the on-orbit SDR is generated from same MATLAB script as step4. The script contains the start and stop times of the event, as well as all the timed MODCODchanges during the event. The appendices show plots of the actual VCM MODCOD over time foreach event, which was controlled by this script.
6) SDR script is uploaded via the ISS primary communications path to the Avionics. The script file isthen transferred to the SDR via the command and telemetry interface.
7) GMT-synchronized SDR waveform script is started.
8) Event occurs, SDR waveform script starts automatically and controls the MODCOD based on thepredicted profile.
0 100 200 300 40060
62
64
66
68
70
72
74
76
C/N
o (d
B−
Hz)
Time (seconds)0 100 200 300 400
0
5
10
15
20
25
Time (seconds)
MO
DC
OD
1 2 3 4 54
4.5
5
5.5
6
6.5
7x 10
8
Symbol Rate in Msym/s
Thr
ough
put (
bits
)
1 MBaud3 Mbaud4.55 MBaud
Best Case
Fig. 11. Example pre-event MATLAB script output used to select symbol rate and generate MODCOD profile
NASA/TM—2016-219126 13

VIII. TEST RESULTS
Variable coding and modulation tests were conducted October 20th to 23rd, and November 2nd to 4th.In total, 19 successful events were made between the JPL SDR and GRC-GS, during seven days. Asubset consisting of 9 events were chosen for detailed analysis, after eliminating events used for systemcheckout and events with poor signal-to-noise ratio or excessive obstructions. In Appendix B there isdetailed information and statistics for each event in the subset.
A. ThroughputOne metric for comparing event performance is the total throughput (bits) of the link. In Table IV the
total throughput is compared with the predicted throughput based on the STAT model, the theoreticalcapacity based on received signal Es/No, and the estimated performance of a standard NASA waveform.The standard NASA waveform is QPSK with an inner rate 1/2 convolutional code and an outer ReedSolomon (255,223) code. On average, the VCM protocol performed within 1.7 dB of the link capacity,and was 2.7 dB better than the standard NASA waveform.
TABLE IVSUMMARY OF TEST RESULTS
Run Number Actual vs Prediction (dB) Actual vs Capacity (dB) Actual vs NASA Standard (dB)9 -2.14 -2.09 1.2910 -1.22 -0.95 4.1011 -0.37 -1.90 2.0312 -0.30 -1.50 4.2114 0.89 -2.82 1.1916 0.09 -1.77 2.6017 -0.03 -2.30 1.8218 0.16 -1.76 1.6019 -0.59 -0.80 3.71Average -1.73 2.66
B. Bit Error Rate PerformanceThere were two sources of bit errors observed in this experiment, expected errors when the link margin
dropped near or below threshold, and large bursts of errors which occurred during modulation typetransitions. The large bursts of errors were typically followed by a set of dropped / missing frames. Thisbehaviour was not expected, and is possibly an issue with the DVB-S2 receiver performance or modeconfiguration. These error sources are independent, since the large bursts from modulation type transitionare not dependent on SNR. Subsequent testing with a different DVB-S2 receiver did not have issues withmodulation type transitions. The final BER of a typical event was 1e-5, and was dominated by the largebursts and errors near receiver threshold. Otherwise, the link operated error-free with no observable floor.Performance in this scenario could be improved by using a higher-level protocol with frame validationand a retransmission capability.
Figure 12 shows the BER and dropped frames observed from a typical event. The left plot shows thenumber of bit errors per DVB-S2 physical layer (PL) frame as the frames accumulate over the event.Overlaid on this is the actual measured link margin, so as a correlation between bit errors and low linkmargin can be observed. The link margin is calculated by comparing the recieved SNR to the receiverthreshold. Note that the PL frames that cannot be recovered due to poor conditions are not included in thisplot; these plots only include frames that were actually received. A look at the dropped frames over theevent is shown on right, with an overlay of the MODCOD profile. Note the burst of errors and droppedframes which occur as the modulation transitions from QPSK to 8-PSK (MODCOD 10 to 13).
Plots are provided for each event in the Appendix.
NASA/TM—2016-219126 14
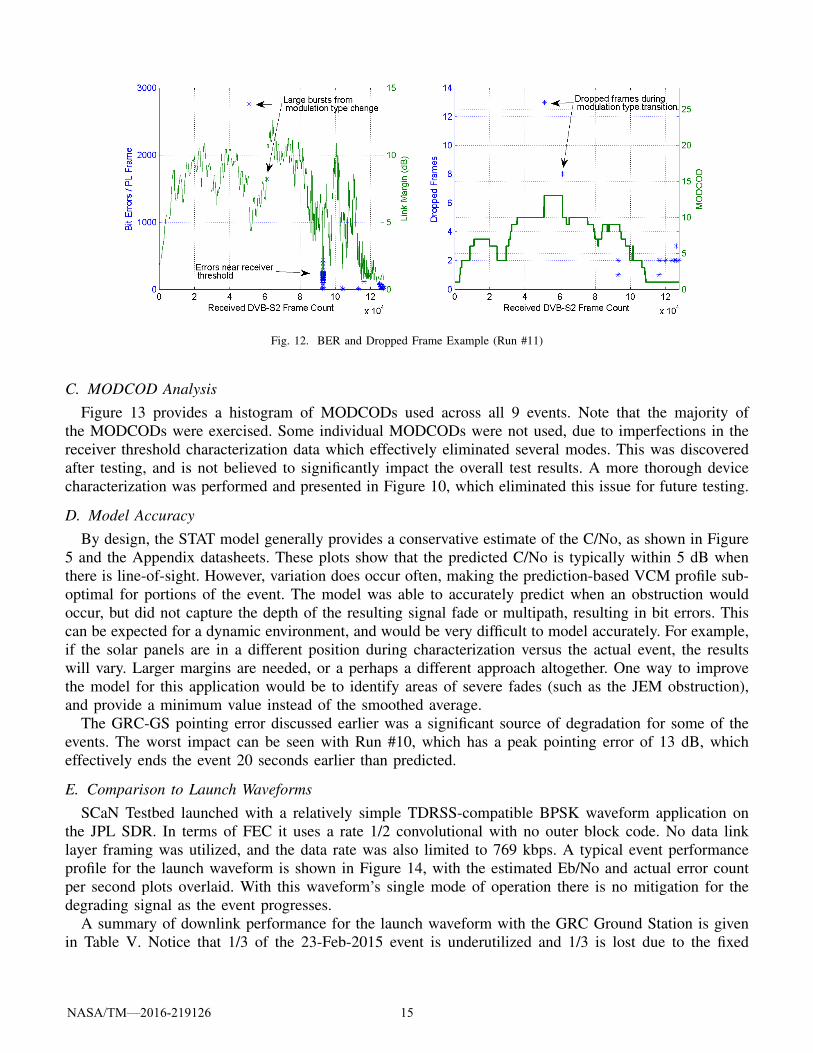
Fig. 12. BER and Dropped Frame Example (Run #11)
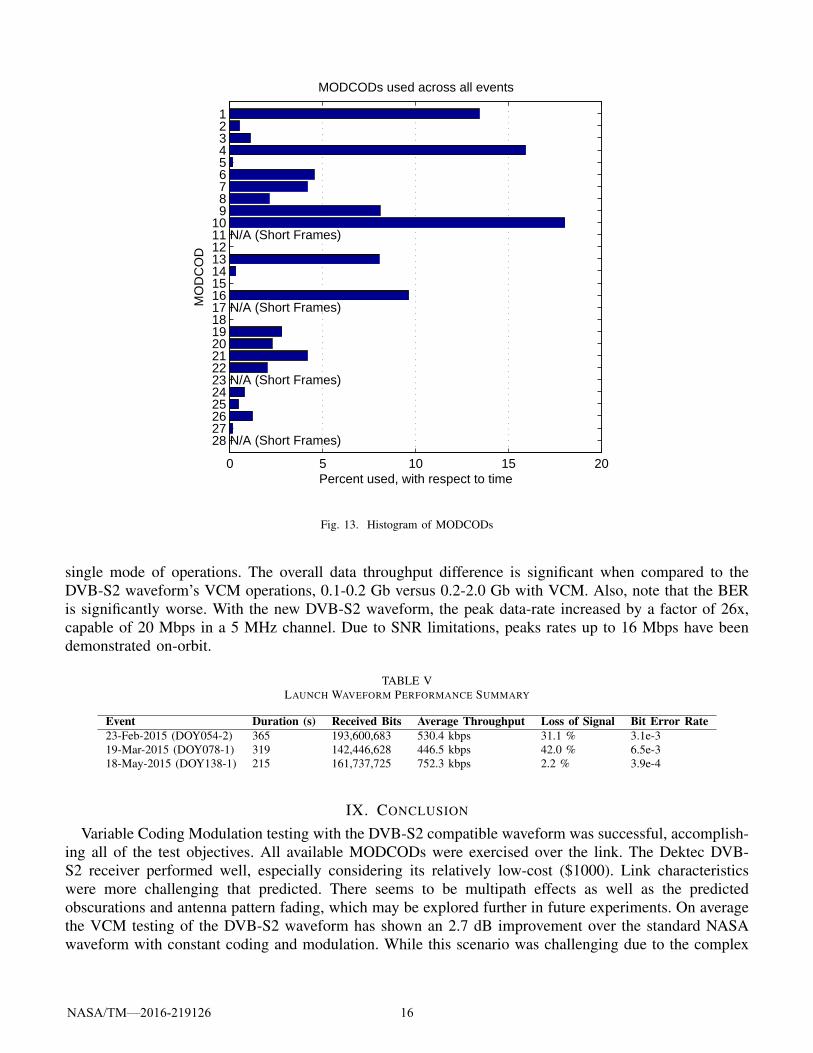
C. MODCOD AnalysisFigure 13 provides a histogram of MODCODs used across all 9 events. Note that the majority of
the MODCODs were exercised. Some individual MODCODs were not used, due to imperfections in thereceiver threshold characterization data which effectively eliminated several modes. This was discoveredafter testing, and is not believed to significantly impact the overall test results. A more thorough devicecharacterization was performed and presented in Figure 10, which eliminated this issue for future testing.
D. Model AccuracyBy design, the STAT model generally provides a conservative estimate of the C/No, as shown in Figure
5 and the Appendix datasheets. These plots show that the predicted C/No is typically within 5 dB whenthere is line-of-sight. However, variation does occur often, making the prediction-based VCM profile sub-optimal for portions of the event. The model was able to accurately predict when an obstruction wouldoccur, but did not capture the depth of the resulting signal fade or multipath, resulting in bit errors. Thiscan be expected for a dynamic environment, and would be very difficult to model accurately. For example,if the solar panels are in a different position during characterization versus the actual event, the resultswill vary. Larger margins are needed, or a perhaps a different approach altogether. One way to improvethe model for this application would be to identify areas of severe fades (such as the JEM obstruction),and provide a minimum value instead of the smoothed average.
The GRC-GS pointing error discussed earlier was a significant source of degradation for some of theevents. The worst impact can be seen with Run #10, which has a peak pointing error of 13 dB, whicheffectively ends the event 20 seconds earlier than predicted.
E. Comparison to Launch WaveformsSCaN Testbed launched with a relatively simple TDRSS-compatible BPSK waveform application on
the JPL SDR. In terms of FEC it uses a rate 1/2 convolutional with no outer block code. No data linklayer framing was utilized, and the data rate was also limited to 769 kbps. A typical event performanceprofile for the launch waveform is shown in Figure 14, with the estimated Eb/No and actual error countper second plots overlaid. With this waveform’s single mode of operation there is no mitigation for thedegrading signal as the event progresses.
A summary of downlink performance for the launch waveform with the GRC Ground Station is givenin Table V. Notice that 1/3 of the 23-Feb-2015 event is underutilized and 1/3 is lost due to the fixed
NASA/TM—2016-219126 15
0 5 10 15 20
123456789
10111213141516171819202122232425262728 N/A (Short Frames)
N/A (Short Frames)
N/A (Short Frames)
N/A (Short Frames)
MO
DC
OD
Percent used, with respect to time
MODCODs used across all events
Fig. 13. Histogram of MODCODs
single mode of operations. The overall data throughput difference is significant when compared to theDVB-S2 waveform’s VCM operations, 0.1-0.2 Gb versus 0.2-2.0 Gb with VCM. Also, note that the BERis significantly worse. With the new DVB-S2 waveform, the peak data-rate increased by a factor of 26x,capable of 20 Mbps in a 5 MHz channel. Due to SNR limitations, peaks rates up to 16 Mbps have beendemonstrated on-orbit.
TABLE VLAUNCH WAVEFORM PERFORMANCE SUMMARY
Event Duration (s) Received Bits Average Throughput Loss of Signal Bit Error Rate23-Feb-2015 (DOY054-2) 365 193,600,683 530.4 kbps 31.1 % 3.1e-319-Mar-2015 (DOY078-1) 319 142,446,628 446.5 kbps 42.0 % 6.5e-318-May-2015 (DOY138-1) 215 161,737,725 752.3 kbps 2.2 % 3.9e-4
IX. CONCLUSION
Variable Coding Modulation testing with the DVB-S2 compatible waveform was successful, accomplish-ing all of the test objectives. All available MODCODs were exercised over the link. The Dektec DVB-S2 receiver performed well, especially considering its relatively low-cost ($1000). Link characteristicswere more challenging that predicted. There seems to be multipath effects as well as the predictedobscurations and antenna pattern fading, which may be explored further in future experiments. On averagethe VCM testing of the DVB-S2 waveform has shown an 2.7 dB improvement over the standard NASAwaveform with constant coding and modulation. While this scenario was challenging due to the complex
NASA/TM—2016-219126 16

Fig. 14. Launch Waveform Performance
ISS structure, VCM did improve the total user data throughput and should be considered for missionswith more deterministic link dynamics.
There are better methods to operate the VCM waveform in this scenario. The STAT model predictionaccurately captures the overall link profile, but was not accurate enough for the aggressive link marginspursued. To avoid data loss a fade margin is needed, and could be determined from the data sets captured.A larger overall link margin is needed (>2 dB) to handle differences in actual versus predicted power. Arobust retransmission protocol would be required to tolerate unforgiving link dynamics. Furthermore, theoperational complexity of uploading custom MODCOD script files for every event would need automationto become practical.
ACM testing is expected to improve further on the VCM test results presented herein by an averageof 1.8 dB, mainly due to unpredictable link variations in the ISS to ground link. This would yield atotal improvement of 4.5 dB over the standard NASA waveforms. ACM is also expected to reduce thesignificant amount of preparations needed for VCM operations with this scenario.
REFERENCES
[1] Digital Video Broadcasting (DVB); Second generation framing structure, channel coding and modulation systems for Broadcasting,Interactive Services, News Gathering and other broadband satellite applications; Part 1: (DVB-S2), ETSI EN 302 307-1 V1.4.1 (2014-11).
[2] JL. Issler, JP. Millerioux, "Use Cases of DVB-S2 for telemetry", CCSDS Meeting Presentation, April, 2014.[3] CCSDS Space Link Protocols over ETSI DVB-S2 Standard, CCSDS 131.3-B-1. Blue Book. Issue 1. Washington, D.C: CCSDS, March,
2013.[4] AOS Space Data Link Protocol, CCSDS 732.0-B-2. Blue Book. Issue 2. Washington, D.C: CCSDS, September, 2003.[5] Flexible Advanced Coding and Modulation Scheme for High Rate Telemetry Applications, CCSDS 131.2-B-1. Blue Book. Issue 1.
Washington, D.C: CCSDS, March, 2012.[6] Variable Coded Modulation Protocol, CCSDS 131.5-M-1.3. Draft Magenta Book. Washington, D.C: CCSDS, April, 2015.[7] TM Space Data Link Protocol. Recommendation for Space Data System Standards,, CCSDS 132.0-B-1. Blue Book. Issue 1. Washington,
D.C: CCSDS, September 2003.[8] https://spaceflightsystems.grc.nasa.gov/sopo/scsmo/scan-testbed/
NASA/TM—2016-219126 17
[9] B. W. Welch and M. T. Piasecki, "Earth-Facing Antenna Characterization in Complex Ground Plane/Multipath Rich Environment",Antenna Measurement Techniques Association, Long Beach, CA, November, 2015.
[10] Glenn Research Center Ground Station Description, Performance, and Interface Document, GRC-CONN-DOC-1073. April, 2015.[11] https://strs.grc.nasa.gov/repository/[12] Mode Adaptation Input and Output Interfaces for DVB-S2 equipment - Version 1.3, SatLab Group EEIG, February. 2008.[13] CCSDS Protocols over DVB-S2 - Summary of Definition, Implementation and Performance, CCSDS 130.12-G-0. Draft Green Book.
Washington, D.C: CCSDS, May, 2015.[14] Digital Video Broadcasting (DVB) User guidelines for the second generation system for Broadcasting, Interactive Services, News
Gathering and other broadband satellite applications (DVB-S2), ETSI TR 102 376 V1.1.1 (2005-02).
NASA/TM—2016-219126 18
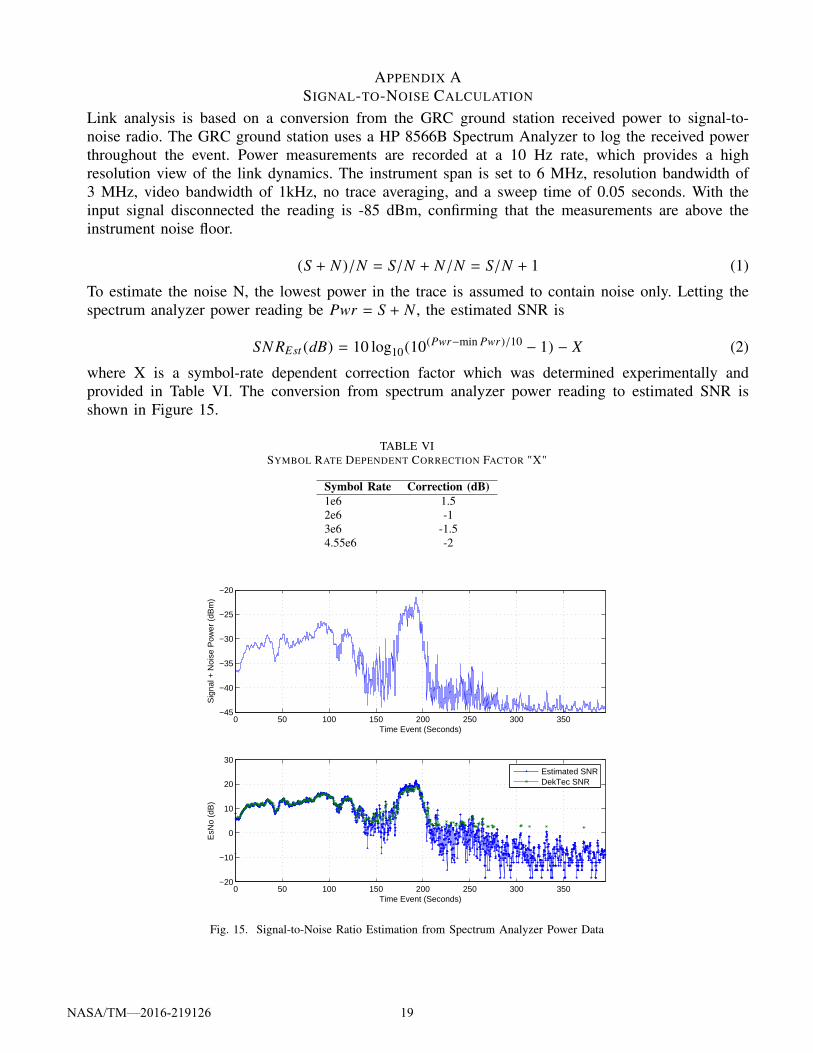
APPENDIX ASIGNAL-TO-NOISE CALCULATION
Link analysis is based on a conversion from the GRC ground station received power to signal-to-noise radio. The GRC ground station uses a HP 8566B Spectrum Analyzer to log the received powerthroughout the event. Power measurements are recorded at a 10 Hz rate, which provides a highresolution view of the link dynamics. The instrument span is set to 6 MHz, resolution bandwidth of3 MHz, video bandwidth of 1kHz, no trace averaging, and a sweep time of 0.05 seconds. With theinput signal disconnected the reading is -85 dBm, confirming that the measurements are above theinstrument noise floor.
(S + N )/N = S/N + N/N = S/N + 1 (1)
To estimate the noise N, the lowest power in the trace is assumed to contain noise only. Letting thespectrum analyzer power reading be Pwr = S + N , the estimated SNR is
SN REst (dB) = 10 log10(10(Pwr−min Pwr)/10 − 1) − X (2)
where X is a symbol-rate dependent correction factor which was determined experimentally andprovided in Table VI. The conversion from spectrum analyzer power reading to estimated SNR isshown in Figure 15.
TABLE VISYMBOL RATE DEPENDENT CORRECTION FACTOR "X"
Symbol Rate Correction (dB)1e6 1.52e6 -13e6 -1.54.55e6 -2
0 50 100 150 200 250 300 350−45
−40
−35
−30
−25
−20
Time Event (Seconds)
Sig
nal +
Noi
se P
ower
(dB
m)
0 50 100 150 200 250 300 350−20
−10
0
10
20
30
Time Event (Seconds)
EsN
o (d
B)
Estimated SNRDekTec SNR
Fig. 15. Signal-to-Noise Ratio Estimation from Spectrum Analyzer Power Data
NASA/TM—2016-219126 19


APPENDIX BEVENT DATASHEETS
The event datasheets provide detailed information and statistics for each event. Each datasheet hasa header containing date and time, symbol rate, link margin, and known obstructions. The datasheetcontains four plots of event performance. The upper left plot compares the STAT model predictionversus the actual signal-to-noise ratio over the event time. The companion lower left plot comparesthe waveform MODCOD profile with the theoretical link capacity. Color bands indicate the fourpossible modulation schemes for the DVB-S2 waveform. Signal drop-outs are designated with a red"x" marker along the bottom axis. On the right side of the event datasheets there are two data linklayer performance plots. The upper right plot shows the number of bit errors per DVB-S2 physicallayer (PL) frame as the frames accumulate over the event. Overlaid on this is the actual measured linkmargin. A look at the dropped frames over the event is shown in the lower right plot, with an overlayof the MODCOD received.Finally, there are two summary tables underneath the quad plots, summarizing event statistics andcomparing overall VCM performance. The average throughput rate is simply the total received bitsdivided by the event time. The Gain/Loss table is computed from the ratios of these average datathroughput rates. The bit error rate (BER) is only computed on valid received frames for the actualevent data, while the Loss of Signal percentages are calculated from the corresponding prediction ormeasurement of received signal.
NASA/TM—2016-219126 21

Run #: 9 Symbol Rate: 1.00 MspsEvent Start: "22 Oct 2015 22:08:41.00" VCM Method: VCM Script (SDR)Event Stop: "22 Oct 2015 22:14:37.00" Link Margin: 2 dBObstruction: JEM at t=55s
Received Bits Avg Throughput Loss of Signal BERPrediction (Pre-event) 290070234 0.81 Mbps 48.0% -Capacity (Post-event) 286802694 0.81 Mbps 66.7% -Actual 177412824 0.50 Mbps 50.3% 3.22e-05NASA Standard 131921448 0.37 Mbps 57.0% -
Gain/LossActual vs Prediction -2.14 dBActual vs Capacity -2.09 dBActual vs NASA Standard 1.29 dB
NASA/TM—2016-219126 22

Run #: 10 Symbol Rate: 4.55 MspsEvent Start: "22 Oct 2015 23:44:56.00" VCM Method: VCM Script (SDR)Event Stop: "22 Oct 2015 23:49:16.00" Link Margin: 2 dBObstruction: Solar Panels at t=215s
Received Bits Avg Throughput Loss of Signal BERPrediction (Pre-event) 2837350782 10.91 Mbps 5.0% -Capacity (Post-event) 2667672468 10.26 Mbps 19.2% -Actual 2142743808 8.24 Mbps 18.5% 2.52e-06NASA Standard 834011080 3.21 Mbps 18.1% -
Gain/LossActual vs Prediction -1.22 dBActual vs Capacity -0.95 dBActual vs NASA Standard 4.10 dB
NASA/TM—2016-219126 23
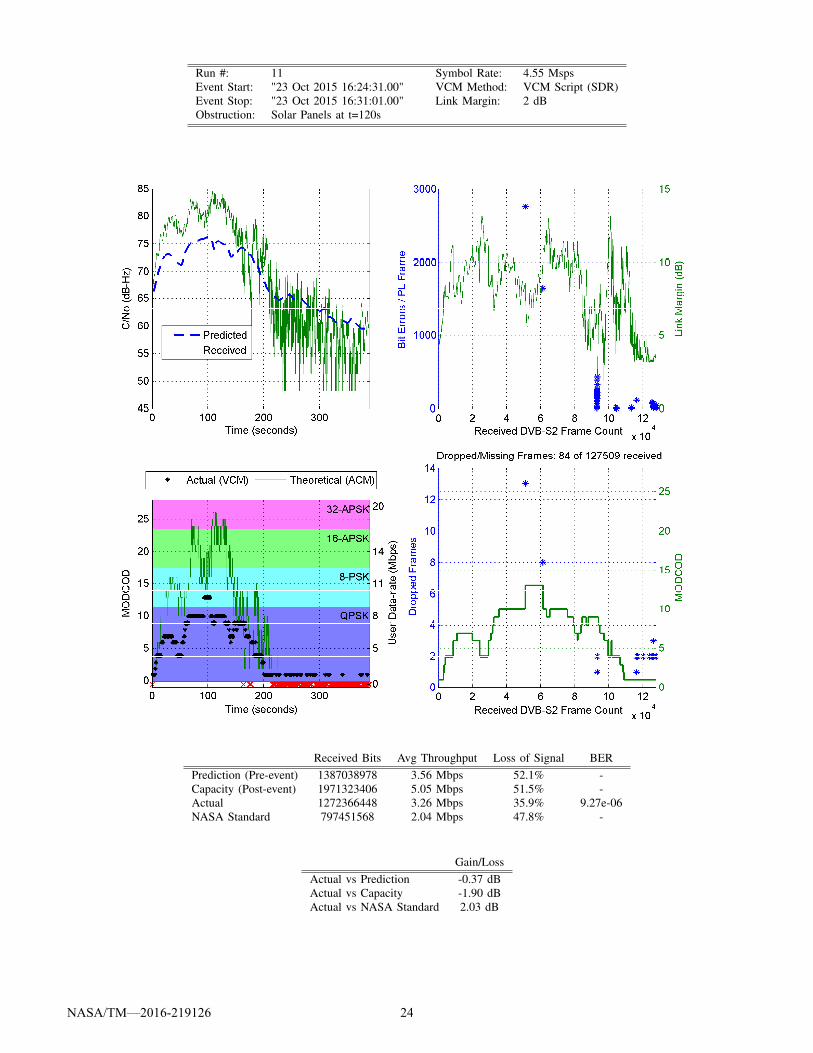
Run #: 11 Symbol Rate: 4.55 MspsEvent Start: "23 Oct 2015 16:24:31.00" VCM Method: VCM Script (SDR)Event Stop: "23 Oct 2015 16:31:01.00" Link Margin: 2 dBObstruction: Solar Panels at t=120s
Received Bits Avg Throughput Loss of Signal BERPrediction (Pre-event) 1387038978 3.56 Mbps 52.1% -Capacity (Post-event) 1971323406 5.05 Mbps 51.5% -Actual 1272366448 3.26 Mbps 35.9% 9.27e-06NASA Standard 797451568 2.04 Mbps 47.8% -
Gain/LossActual vs Prediction -0.37 dBActual vs Capacity -1.90 dBActual vs NASA Standard 2.03 dB
NASA/TM—2016-219126 24
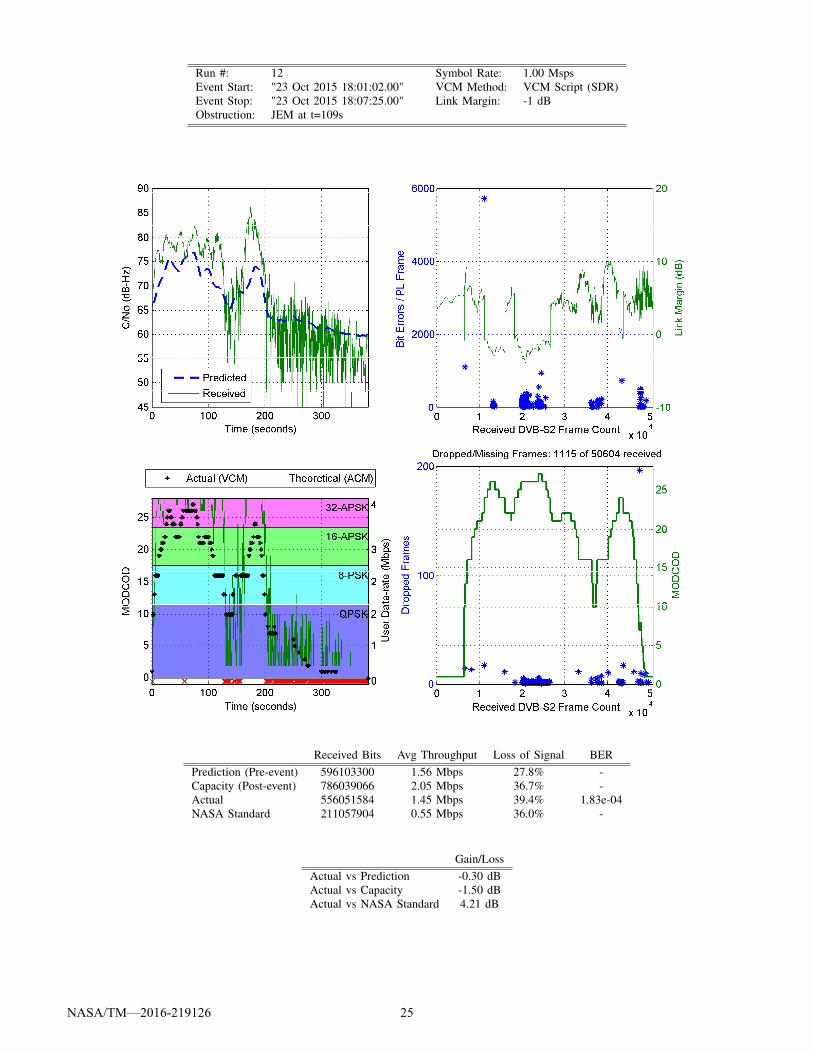
Run #: 12 Symbol Rate: 1.00 MspsEvent Start: "23 Oct 2015 18:01:02.00" VCM Method: VCM Script (SDR)Event Stop: "23 Oct 2015 18:07:25.00" Link Margin: -1 dBObstruction: JEM at t=109s
Received Bits Avg Throughput Loss of Signal BERPrediction (Pre-event) 596103300 1.56 Mbps 27.8% -Capacity (Post-event) 786039066 2.05 Mbps 36.7% -Actual 556051584 1.45 Mbps 39.4% 1.83e-04NASA Standard 211057904 0.55 Mbps 36.0% -
Gain/LossActual vs Prediction -0.30 dBActual vs Capacity -1.50 dBActual vs NASA Standard 4.21 dB
NASA/TM—2016-219126 25

Run #: 14 Symbol Rate: 1.00 MspsEvent Start: "2 Nov 2015 20:31:34.00" VCM Method: VCM Script (SDR)Event Stop: "2 Nov 2015 20:35:52.00" Link Margin: 1 dBObstruction: Solar Panels at t=0s
Received Bits Avg Throughput Loss of Signal BERPrediction (Pre-event) 147238884 0.57 Mbps 60.8% -Capacity (Post-event) 346394880 1.34 Mbps 43.8% -Actual 180866968 0.70 Mbps 41.9% 3.01e-06NASA Standard 137596352 0.53 Mbps 38.1% -
Gain/LossActual vs Prediction 0.89 dBActual vs Capacity -2.82 dBActual vs NASA Standard 1.19 dB
NASA/TM—2016-219126 26

Run #: 16 Symbol Rate: 4.55 MspsEvent Start: "3 Nov 2015 18:01:37.00" VCM Method: VCM Script (SDR)Event Stop: "3 Nov 2015 18:08:12.00" Link Margin: 1 dBObstruction: JEM at t=138s
Received Bits Avg Throughput Loss of Signal BERPrediction (Pre-event) 1462373028 3.70 Mbps 52.1% -Capacity (Post-event) 2242103490 5.68 Mbps 50.1% -Actual 1492585064 3.78 Mbps 37.5% 1.85e-05NASA Standard 819355520 2.07 Mbps 47.1% -
Gain/LossActual vs Prediction 0.09 dBActual vs Capacity -1.77 dBActual vs NASA Standard 2.60 dB
NASA/TM—2016-219126 27

Run #: 17 Symbol Rate: 3.00 MspsEvent Start: "3 Nov 2015 19:38:11.00" VCM Method: VCM Script (SDR)Event Stop: "3 Nov 2015 19:43:59.00" Link Margin: 1 dBObstruction: Solar Panels at t=0s
Received Bits Avg Throughput Loss of Signal BERPrediction (Pre-event) 819983250 2.36 Mbps 52.1% -Capacity (Post-event) 1383781158 3.98 Mbps 43.5% -Actual 814134360 2.34 Mbps 37.9% 1.07e-05NASA Standard 534966296 1.54 Mbps 40.5% -
Gain/LossActual vs Prediction -0.03 dBActual vs Capacity -2.30 dBActual vs NASA Standard 1.82 dB
NASA/TM—2016-219126 28

Run #: 18 Symbol Rate: 2.00 MspsEvent Start: "4 Nov 2015 17:08:52.00" VCM Method: VCM Script (SDR)Event Stop: "4 Nov 2015 17:14:55.00" Link Margin: 1 dBObstruction: JEM at t=70s
Received Bits Avg Throughput Loss of Signal BERPrediction (Pre-event) 384636600 1.06 Mbps 64.5% -Capacity (Post-event) 599164614 1.65 Mbps 60.1% -Actual 399489320 1.10 Mbps 36.4% 3.96e-05NASA Standard 276091840 0.76 Mbps 55.8% -
Gain/LossActual vs Prediction 0.16 dBActual vs Capacity -1.76 dBActual vs NASA Standard 1.60 dB
NASA/TM—2016-219126 29

Run #: 19 Symbol Rate: 4.55 MspsEvent Start: "4 Nov 2015 18:45:08.00" VCM Method: VCM Script (SDR)Event Stop: "4 Nov 2015 18:49:41.00" Link Margin: 1 dBObstruction: Solar Panels at t=126s
Received Bits Avg Throughput Loss of Signal BERPrediction (Pre-event) 2374957908 8.70 Mbps 20.3% -Capacity (Post-event) 2490589458 9.12 Mbps 19.0% -Actual 2072553160 7.59 Mbps 19.0% 4.59e-05NASA Standard 882632216 3.23 Mbps 17.5% -
Gain/LossActual vs Prediction -0.59 dBActual vs Capacity -0.80 dBActual vs NASA Standard 3.71 dB
NASA/TM—2016-219126 30