variable flow pumps – control strategies · variable flow pumps – control strategies agenda:...
TRANSCRIPT
•1
Variable Flow Pumps – Control StrategiesBBT Conference – Feb 4/5, 2015
Presented by Steve ThompsonVP - Residential Product Management – Taco Inc.
Mobile (401) 441-2934E Mail: [email protected]
Variable Flow Pumps – Control StrategiesAgenda:
• Introduction• General Descriptors• VFD or not VFD – That is the Question (VFD Assessment Tool)• System & Pump Curves• Selfsensing Pumps• Applications• Balancing VFD Pumping Systems• Delta T• Warning!!!• Efficiency
– To trim or not to trim– ECM Permanent Magnet Technology– Affinity Laws
• Commissioning Tips• DOE / ASHRAE / ACEEE

•2
General Descriptors∆T Differential Temperature
• Net temperature differential between two points (typically supply and return)• 20 Deg F “Normal” differential temperature design for high mass, medium temperature systems• 10 to 15 Deg F for radiant• 10 to 12 Deg F for chilled water primaries
Setpoint Temperature• Temperature sensed at single location• If sensor built into the pump, the pump must be installed at sensing location• Make-up air coil a good example
∆P Differential Pressure• Pressure measured or sensed across two points• Typical closed loop system pup inlet pressure is relatively constant• ∆PC – Differential Pressure Constant (flat pump curve)• ∆PV – Proportional Pressure (inclining pump curve)
Self Sensing• Pump (Circ) adjusts speed without any physical sensors• Reacts to changes in impeller loading as a result of system flow change
Primary Circuit• Dedicated to moving fluid to/from heating or cooling source
Secondary Circuit• Supplies fluid to building conditioned space
Circulator vs Pump• Pumps boost pressure (Well Pumps, Pressure Booster Pumps, Boiler Feed Pumps• Circulators invoke fluid movement by overcoming friction loss (could be any Hp)
Residential vs Commercial
What’s a Variable Flow System ApplicationAnd Why Does This Matter?
• An HVAC system is like our body• Brain = BMS (BAS) system• Heart = pump• Stomach = boiler or chiller• Arteries = piping system
• Working out - system under load• Body - heart rate up, increased blood pressure,
consumes more energy• Building – more BTU’s (flow), more head
• Sleeping - system under low load or setback• Body – heart rate and blood pressure down,
consumes less energy• Building – less BTU’s, lower head
At least that’s the way it is supposed to work!What if our heart and blood pressure didn’t change?Conclusion – all HVAC APPS are variable flow!
•3
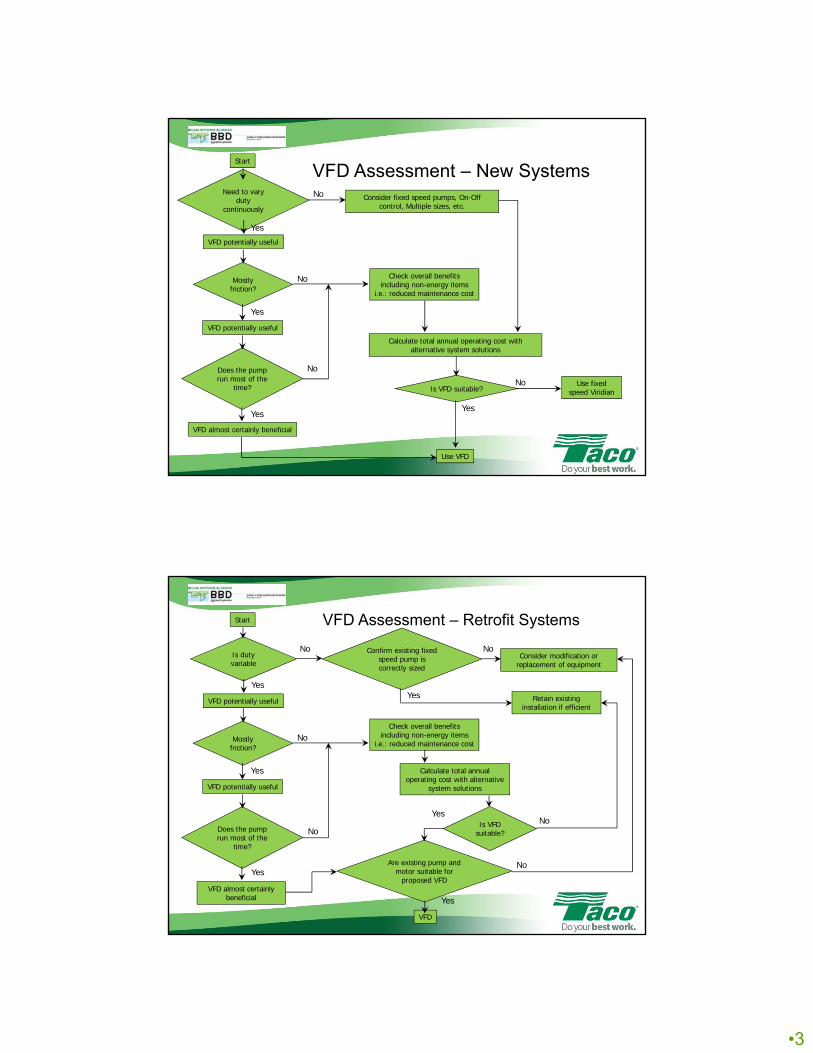
VFD Assessment – New SystemsStart
Need to vary duty
continuously
Consider fixed speed pumps, On-Off control, Multiple sizes, etc.
VFD potentially useful
Mostly friction?
VFD potentially useful
Check overall benefits including non-energy items
i.e.: reduced maintenance cost
Does the pump run most of the
time?
VFD almost certainly beneficial
Use VFD
Calculate total annual operating cost with alternative system solutions
Is VFD suitable?Use fixed
speed Viridian
No
No
No
No
Yes
Yes
YesYes
VFD Assessment – Retrofit SystemsStart
Is duty variable
Consider modification or replacement of equipment
VFD potentially useful
Mostly friction?
VFD potentially useful
Check overall benefits including non-energy items
i.e.: reduced maintenance cost
Does the pump run most of the
time?
VFD almost certainly beneficial
VFD
Calculate total annual operating cost with alternative
system solutions
Is VFD suitable?
Retain existing installation if efficient
No
No
No
No
Yes
Yes
Yes
Yes
Confirm existing fixed speed pump is correctly sized
Are existing pump and motor suitable for
proposed VFD
Yes
Yes
No
No
•4
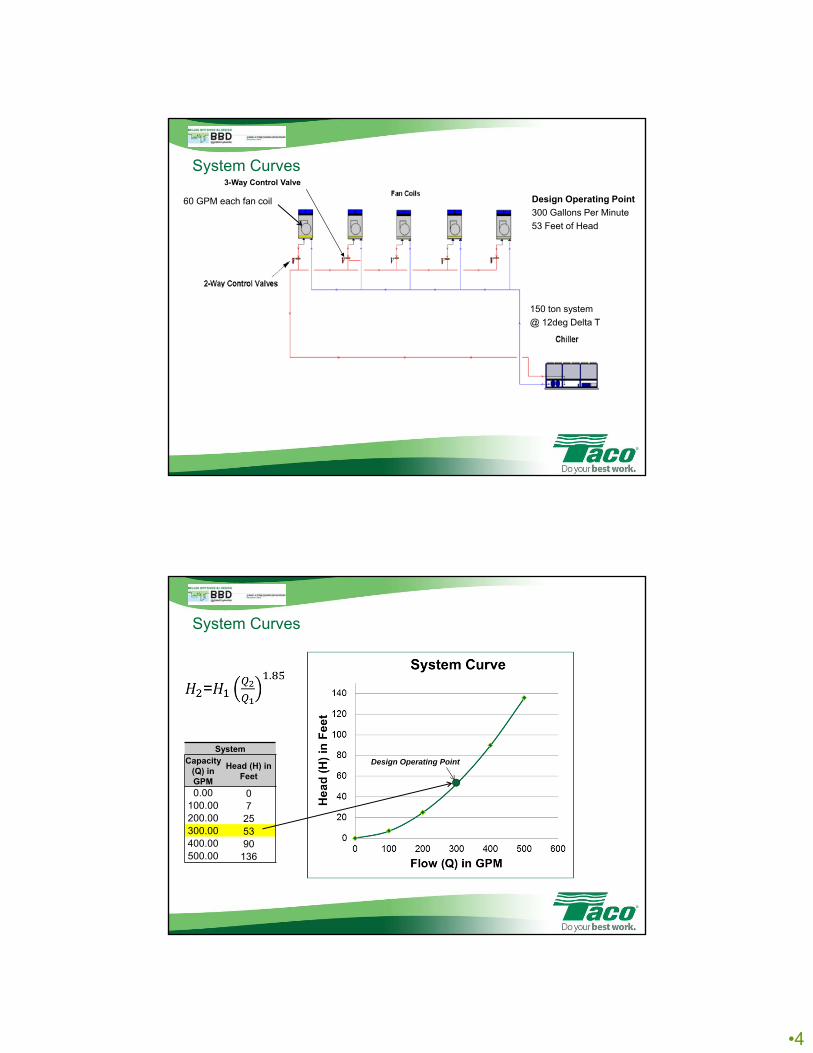
Design Operating Point
300 Gallons Per Minute
53 Feet of Head
System Curves
150 ton system
@ 12deg Delta T
60 GPM each fan coil
3-Way Control Valve
SystemCapacity
(Q) inGPM
Head (H) in Feet
0.00 0100.00 7200.00 25300.00 53400.00 90500.00 136
Design Operating Point
System Curves

•5
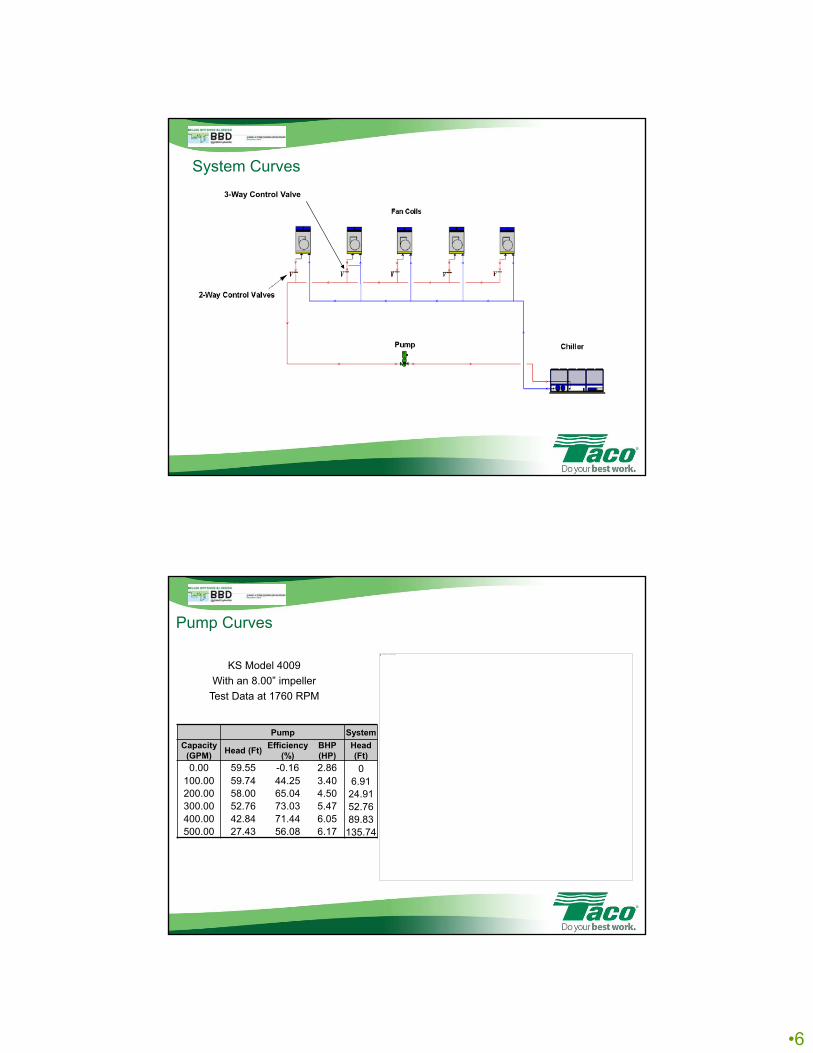
System Curves
8.00" Diameter
Capacity (GPM)
Head (Ft)
Efficiency (%)
BHP (HP)
0.00 59.55 -0.16 2.86100.00 59.74 44.25 3.40200.00 58.00 65.04 4.50300.00 52.76 73.03 5.47400.00 42.84 71.44 6.05500.00 27.43 56.08 6.17
KS Model 4009
Test Data at 1760 RPM
0
10
20
30
40
50
60
70
0 100 200 300 400 500
Hea
d (
H)
in F
eet
Flow (Q) in GPM
Pump CurvePump Curves
•6
System Curves
3-Way Control Valve
Pump System
Capacity (GPM)
Head (Ft)Efficiency
(%)BHP (HP)
Head (Ft)
0.00 59.55 -0.16 2.86 0100.00 59.74 44.25 3.40 6.91200.00 58.00 65.04 4.50 24.91300.00 52.76 73.03 5.47 52.76400.00 42.84 71.44 6.05 89.83500.00 27.43 56.08 6.17 135.74
KS Model 4009
With an 8.00” impeller
Test Data at 1760 RPM
This image cannot currently be displayed.
Pump Curves
•7
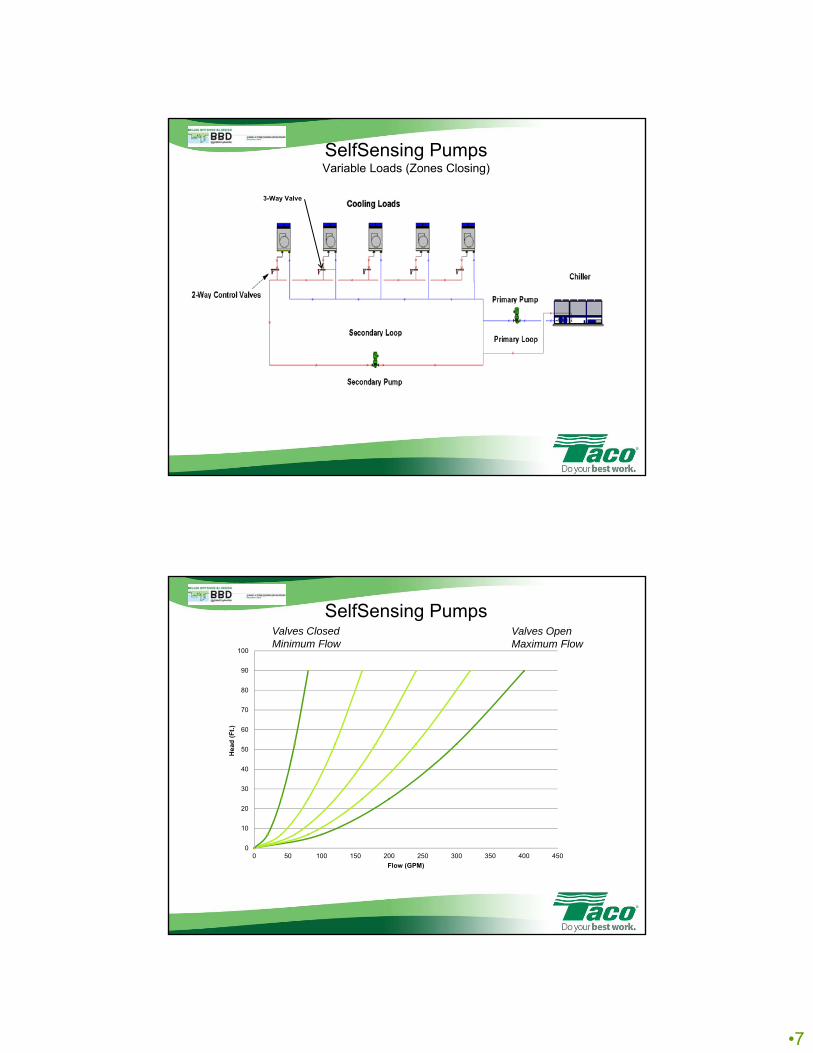
SelfSensing PumpsVariable Loads (Zones Closing)
3-Way Valve
0
10
20
30
40
50
60
70
80
90
100
0 50 100 150 200 250 300 350 400 450
Hea
d (
Ft.
)
Flow (GPM)
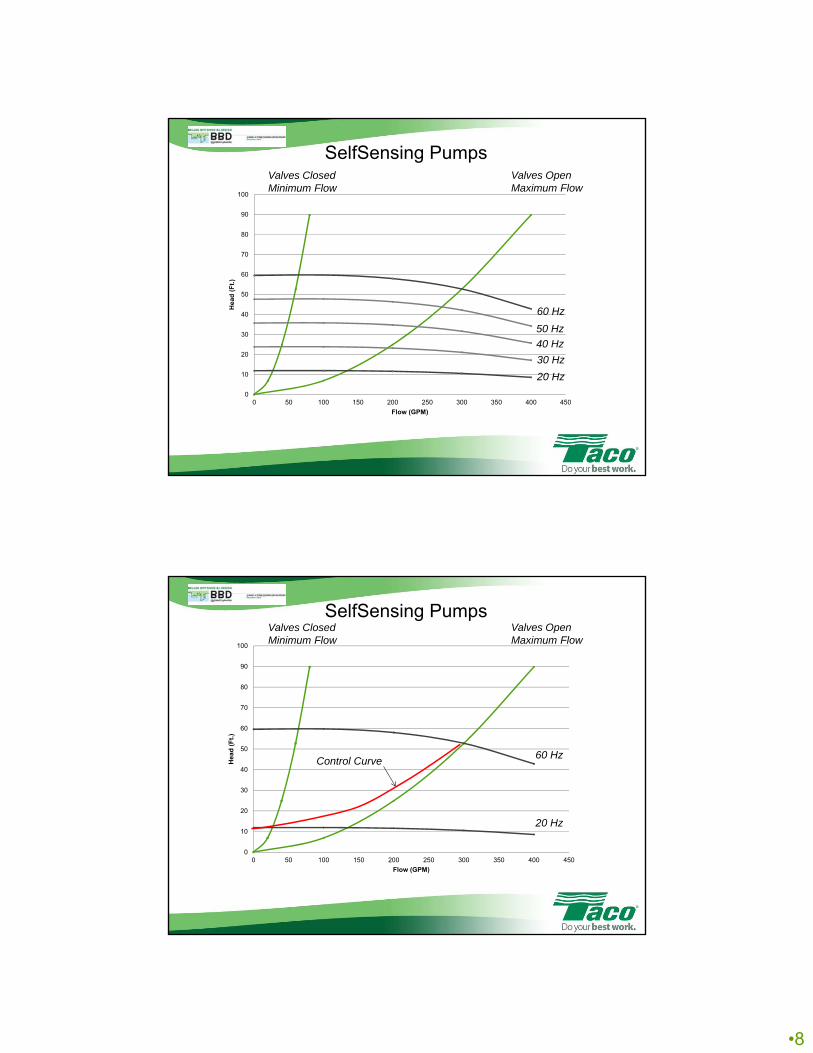
Valves Open Maximum Flow
Valves Closed Minimum Flow
SelfSensing Pumps
•8
0
10
20
30
40
50
60
70
80
90
100
0 50 100 150 200 250 300 350 400 450
Hea
d (
Ft.
)
Flow (GPM)
Valves Open Maximum Flow
Valves Closed Minimum Flow
60 Hz
50 Hz
40 Hz
30 Hz
20 Hz
SelfSensing Pumps
0
10
20
30
40
50
60
70
80
90
100
0 50 100 150 200 250 300 350 400 450
Hea
d (
Ft.
)
Flow (GPM)
60 Hz
20 Hz
Valves Open Maximum Flow
Valves Closed Minimum Flow
Control Curve
SelfSensing Pumps
•9
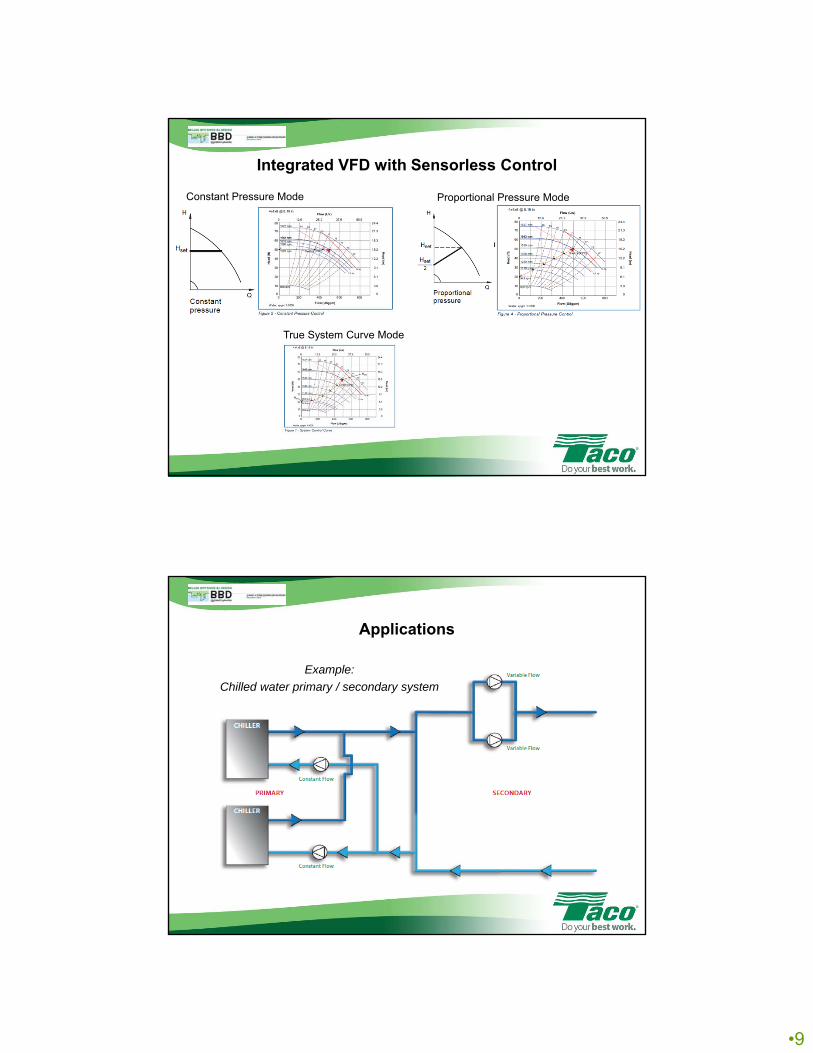
Integrated VFD with Sensorless Control
Constant Pressure Mode Proportional Pressure Mode
True System Curve Mode
Applications
Example:
Chilled water primary / secondary system
•10
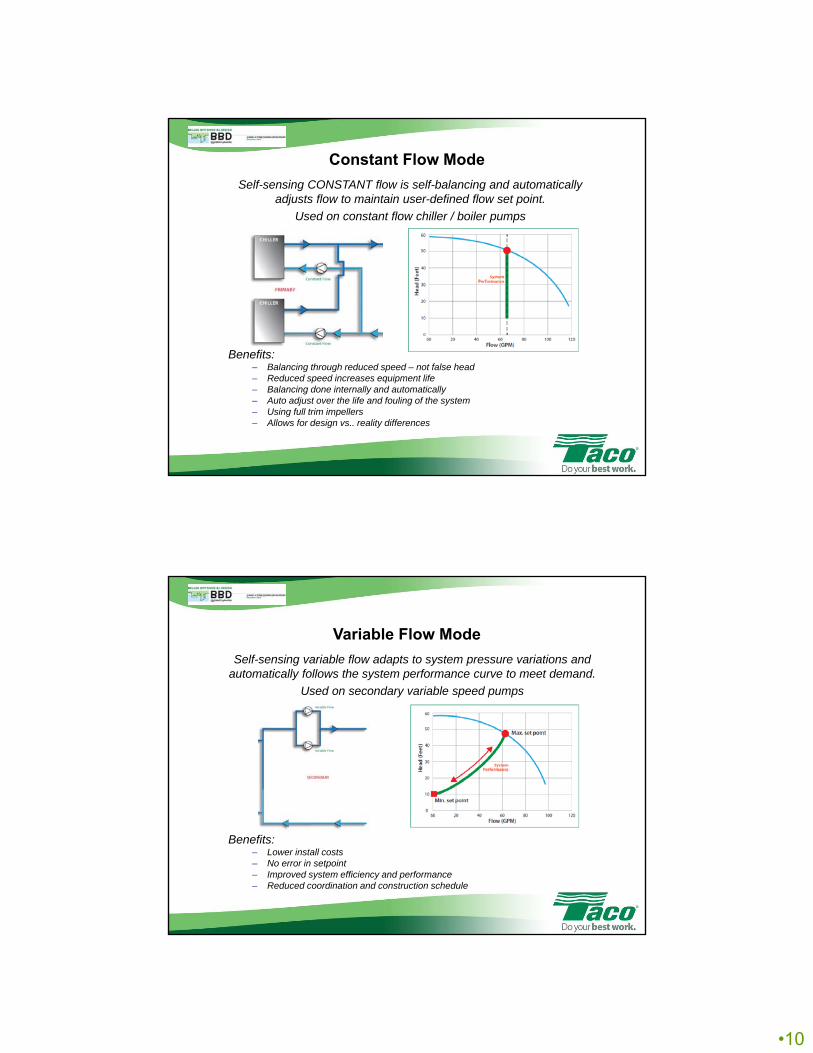
Constant Flow Mode
Self-sensing CONSTANT flow is self-balancing and automatically adjusts flow to maintain user-defined flow set point.
Used on constant flow chiller / boiler pumps
Benefits:– Balancing through reduced speed – not false head– Reduced speed increases equipment life– Balancing done internally and automatically– Auto adjust over the life and fouling of the system– Using full trim impellers– Allows for design vs.. reality differences
Variable Flow Mode
Self-sensing variable flow adapts to system pressure variations and automatically follows the system performance curve to meet demand.
Used on secondary variable speed pumps
Benefits:– Lower install costs– No error in setpoint– Improved system efficiency and performance– Reduced coordination and construction schedule
•11
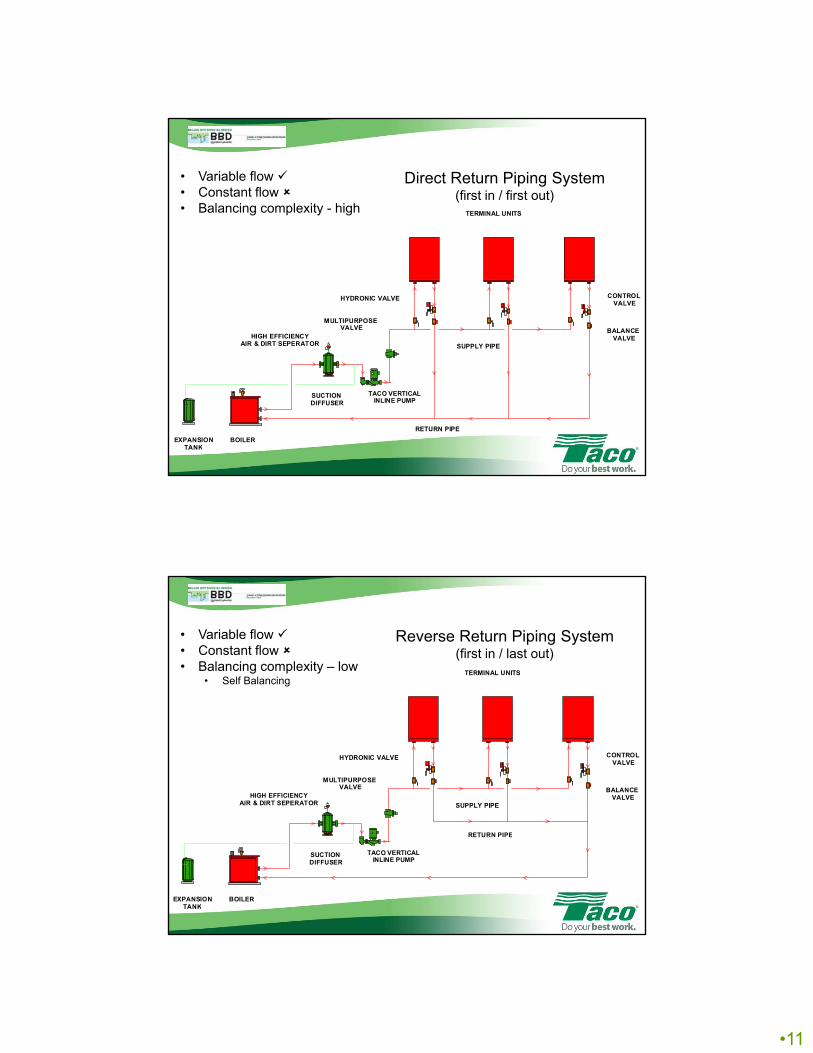
EXPANSIONTANK
BOILER
RETURN PIPE
SUPPLY PIPE
TERMINAL UNITS
CONTROL VALVE
BALANCE VALVE
HYDRONIC VALVE
TACO VERTICALINLINE PUMP
MULTIPURPOSE VALVE
SUCTION DIFFUSER
HIGH EFFICIENCYAIR & DIRT SEPERATOR
Direct Return Piping System(first in / first out)
• Variable flow • Constant flow • Balancing complexity - high
Reverse Return Piping System(first in / last out)
• Variable flow • Constant flow • Balancing complexity – low
• Self Balancing
EXPANSIONTANK
BOILER
RETURN PIPE
SUPPLY PIPE
TERMINAL UNITS
CONTROL VALVE
BALANCE VALVE
HYDRONIC VALVE
TACO VERTICALINLINE PUMP
MULTIPURPOSE VALVE
SUCTION DIFFUSER
HIGH EFFICIENCYAIR & DIRT SEPERATOR
•12
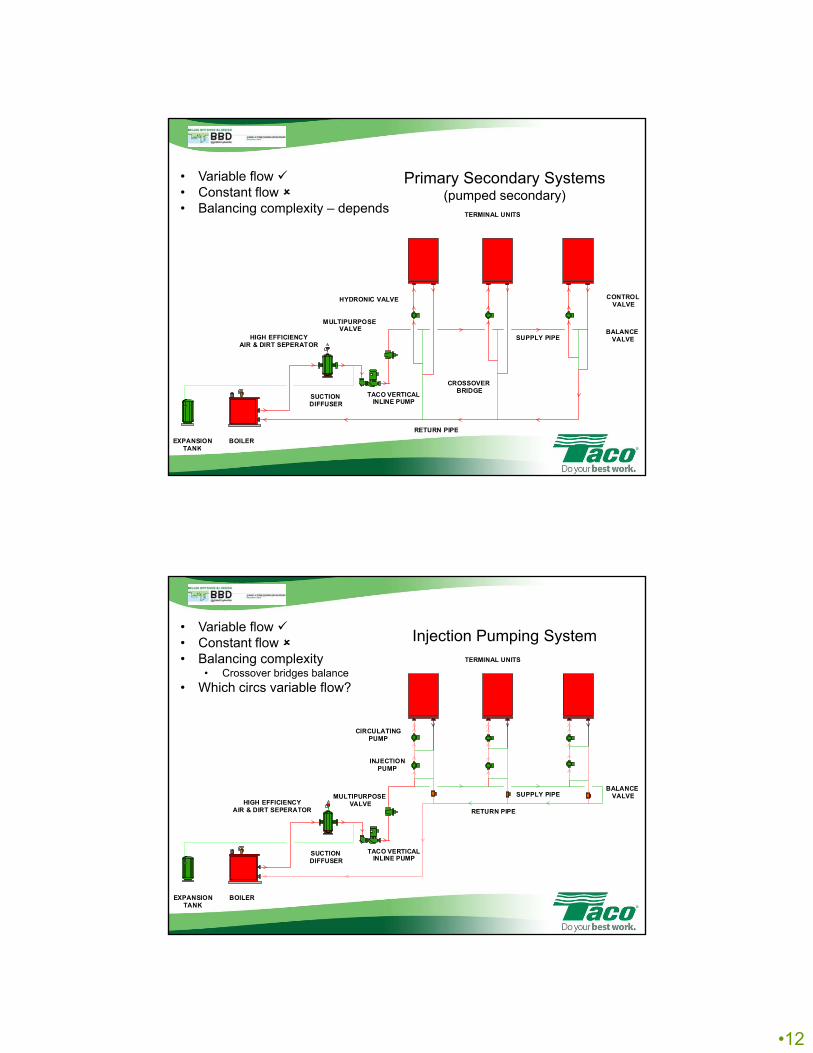
Primary Secondary Systems(pumped secondary)
• Variable flow • Constant flow • Balancing complexity – depends
EXPANSIONTANK
BOILER
RETURN PIPE
SUPPLY PIPE
TERMINAL UNITS
CONTROL VALVE
BALANCE VALVE
HYDRONIC VALVE
TACO VERTICALINLINE PUMP
MULTIPURPOSE VALVE
SUCTION DIFFUSER
HIGH EFFICIENCYAIR & DIRT SEPERATOR
CROSSOVER BRIDGE
EXPANSIONTANK
BOILER
RETURN PIPE
SUPPLY PIPE
TERMINAL UNITS
BALANCE VALVE
TACO VERTICALINLINE PUMP
MULTIPURPOSE VALVE
SUCTION DIFFUSER
HIGH EFFICIENCYAIR & DIRT SEPERATOR
INJECTIONPUMP
CIRCULATINGPUMP
Injection Pumping System• Variable flow • Constant flow • Balancing complexity
• Crossover bridges balance
• Which circs variable flow?
•13
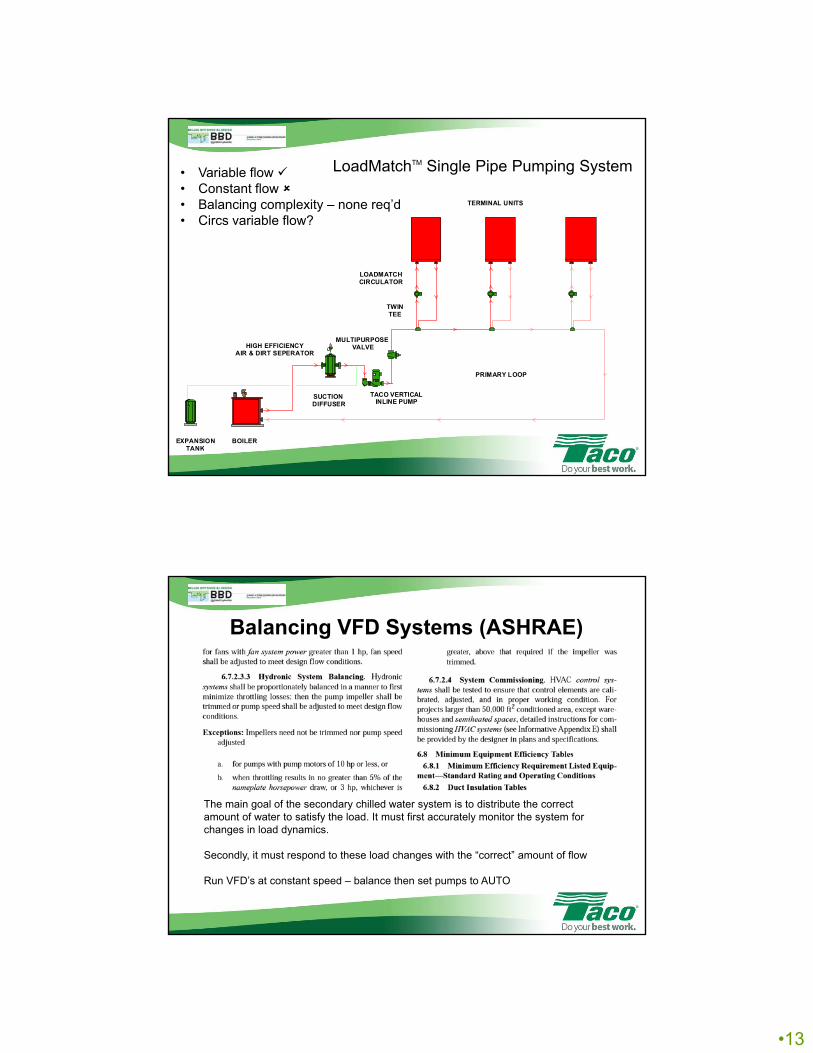
• Variable flow • Constant flow • Balancing complexity – none req’d• Circs variable flow?
EXPANSIONTANK
BOILER
PRIMARY LOOP
TERMINAL UNITS
TACO VERTICALINLINE PUMP
MULTIPURPOSE VALVE
SUCTION DIFFUSER
HIGH EFFICIENCYAIR & DIRT SEPERATOR
TWINTEE
LOADMATCHCIRCULATOR
LoadMatchTM Single Pipe Pumping System
Balancing VFD Systems (ASHRAE)
The main goal of the secondary chilled water system is to distribute the correct amount of water to satisfy the load. It must first accurately monitor the system for changes in load dynamics.
Secondly, it must respond to these load changes with the “correct” amount of flow
Run VFD’s at constant speed – balance then set pumps to AUTO
•14
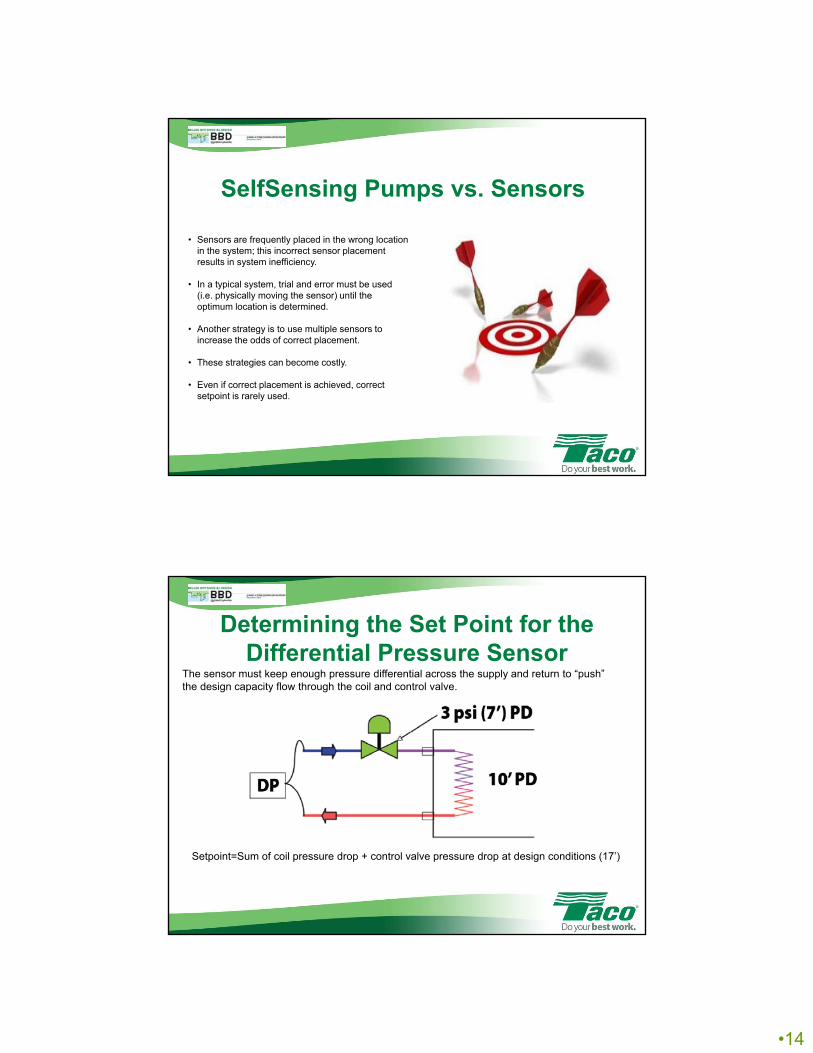
SelfSensing Pumps vs. Sensors
• Sensors are frequently placed in the wrong location in the system; this incorrect sensor placement results in system inefficiency.
• In a typical system, trial and error must be used (i.e. physically moving the sensor) until the optimum location is determined.
• Another strategy is to use multiple sensors to increase the odds of correct placement.
• These strategies can become costly.
• Even if correct placement is achieved, correct setpoint is rarely used.
Determining the Set Point for the Differential Pressure Sensor
The sensor must keep enough pressure differential across the supply and return to “push” the design capacity flow through the coil and control valve.
Setpoint=Sum of coil pressure drop + control valve pressure drop at design conditions (17’)

•15
CONTROLVALVE
BYPASSW/VALVE
TERMINALUNIT
PRIMARYPUMP
DIFF. PRESSURETRANSMITTER
CONTROLVALVE
BYPASSW/VALVE
TERMINALUNIT
PRIMARYPUMP
DIFF. PRESSURETRANSMITTER
80’ setpoint
17’ setpoint
Location of ∆P TransmittersEffeciencies are dramatically affected
Differential TemperatureDelta-T lends itself to even more cost effective variable speed pumping.The issues associate with placement and of Delta-P sensors is replaced with ease and simplicity of thermisters.As the Delta-T falls below setpoint, the pumps would slow down.As the Delta-T rises above setpoint, the pumps speed up.Remember that BTUH = GPM x ∆T x 500
•16
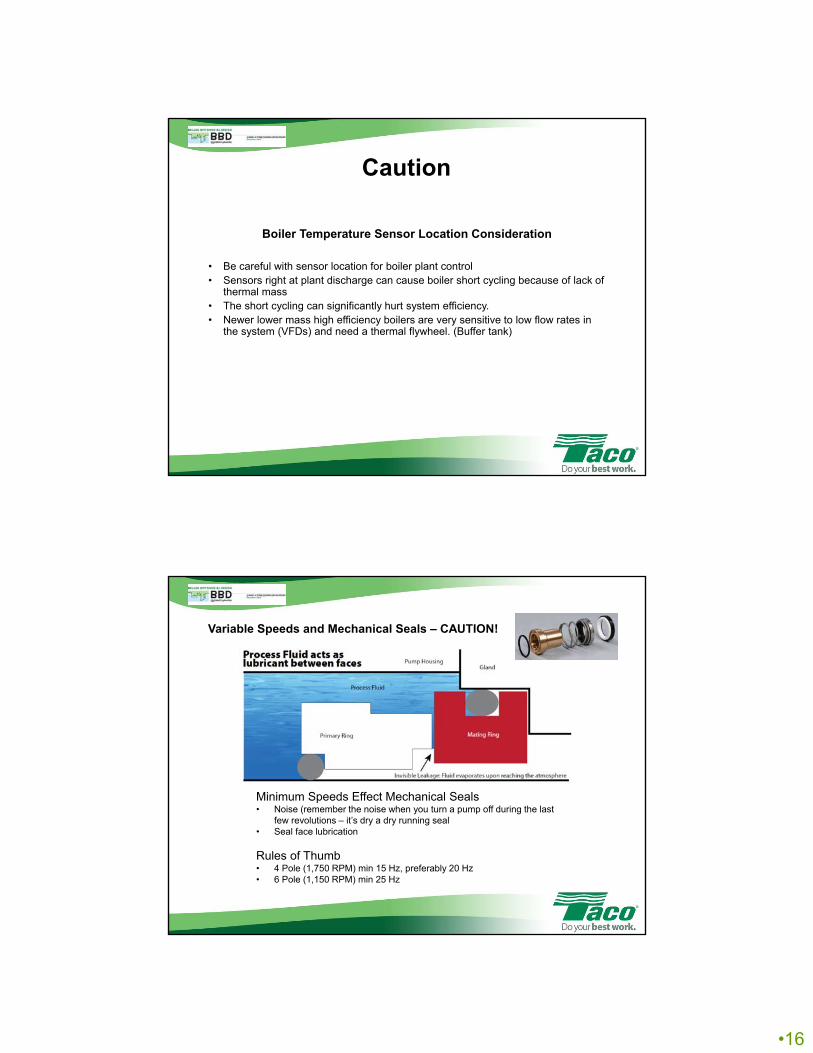
Boiler Temperature Sensor Location Consideration
• Be careful with sensor location for boiler plant control• Sensors right at plant discharge can cause boiler short cycling because of lack of
thermal mass• The short cycling can significantly hurt system efficiency.• Newer lower mass high efficiency boilers are very sensitive to low flow rates in
the system (VFDs) and need a thermal flywheel. (Buffer tank)
Caution
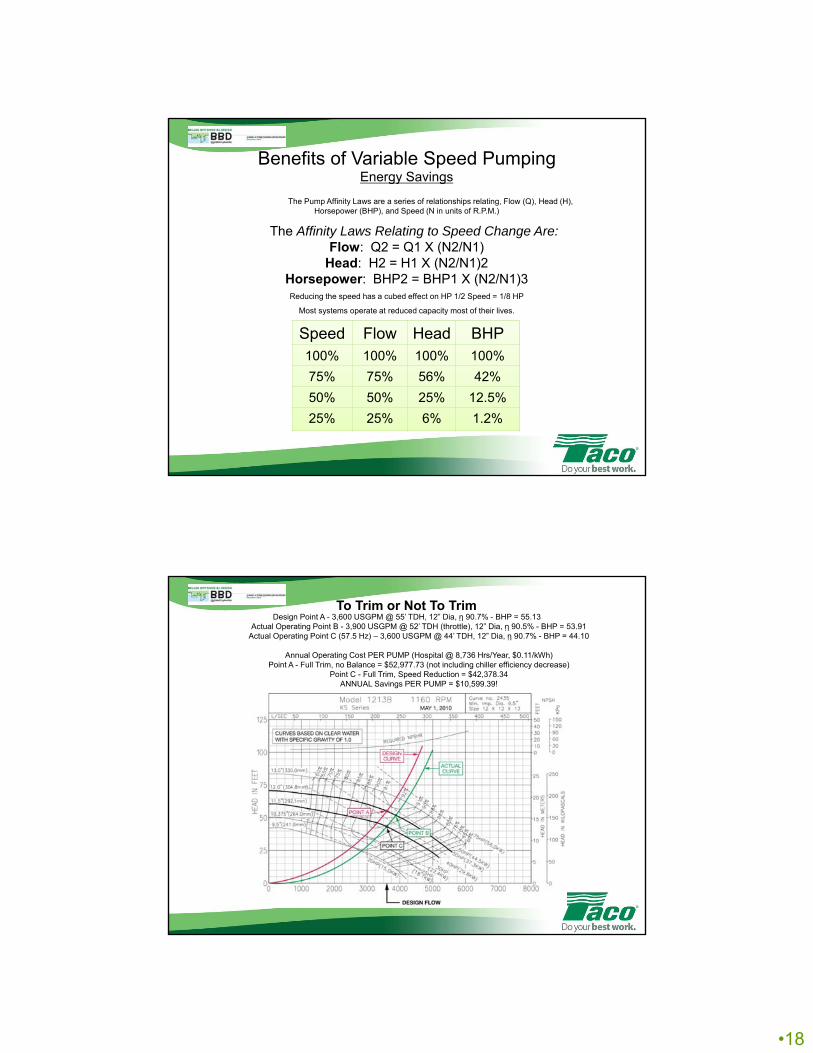
Variable Speeds and Mechanical Seals – CAUTION!
Minimum Speeds Effect Mechanical Seals• Noise (remember the noise when you turn a pump off during the last
few revolutions – it’s dry a dry running seal• Seal face lubrication
Rules of Thumb• 4 Pole (1,750 RPM) min 15 Hz, preferably 20 Hz• 6 Pole (1,150 RPM) min 25 Hz

•17
Causes of Excess System Flow
• Poor / excessive balancing
• Poor control valve selection (oversizing)
• Improper installation of control sensors
• Set point too high on DP transmitters
• Oversized pumps (with/without VFD’s)
• ∆P transducers in the wrong location is a common mistake (see next slide)
Universal Problems
• The secondary system will try to distribute more chilled water than is needed. This is inefficient and used excess horsepower
• Higher flow causes low system temperature differentials, excess flow and change in flow direction in the crossover bridge
• The chiller plant must keep more chillers on-line than is required by the load. The chillers and their chiller pumps are brought on just to keep up with excessive system flow
• Solution: Designing and installing a variable speed pumping system can help eliminate these problems. A well designed and commissioned system can greatly improve an owners chiller plant utilization and life cycle cost.
Chiller Plants – Things to Consider
• The flow rate of the chiller plant should be equal to or greater than the system flow rate
• Changes in the direction of flow in the cross over bridge can be used for chiller staging
• Control valve problems (or balancing) can result in artificially high flows, low temperature differentials, and the need to rerate chillers
• Watch out for the physical configuration of the cross over bridge, especially 6” and above.
• Make sure that chiller plant loop has sufficient volume to cover chiller minimum run times.
Boilers – Things to Consider
• The flow rate of the primary boiler plant does not need to be greater than the system flow rate
• Boiler plants and distribution loops can be designed with different temperature differentials to take advantage of smaller pipe sizes and mixing in the bridge
• The mixing in the bridge can be used to protect non-condensing boilers in a water source heat pump system.
•18
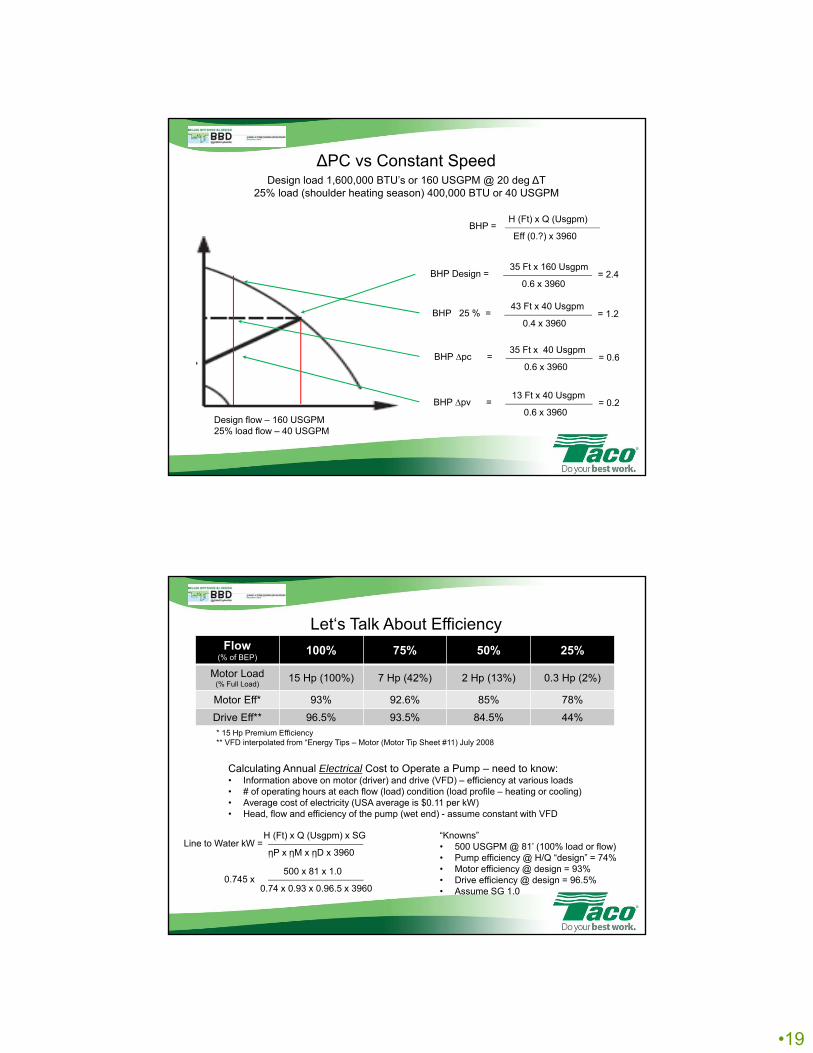
Energy Savings
The Pump Affinity Laws are a series of relationships relating, Flow (Q), Head (H), Horsepower (BHP), and Speed (N in units of R.P.M.)
The Affinity Laws Relating to Speed Change Are:Flow: Q2 = Q1 X (N2/N1)
Head: H2 = H1 X (N2/N1)2Horsepower: BHP2 = BHP1 X (N2/N1)3
Reducing the speed has a cubed effect on HP 1/2 Speed = 1/8 HP
Most systems operate at reduced capacity most of their lives.
Speed Flow Head BHP100% 100% 100% 100%
75% 75% 56% 42%
50% 50% 25% 12.5%
25% 25% 6% 1.2%
Benefits of Variable Speed Pumping
Design Point A - 3,600 USGPM @ 55’ TDH, 12” Dia, ῃ 90.7% - BHP = 55.13Actual Operating Point B - 3,900 USGPM @ 52’ TDH (throttle), 12” Dia, ῃ 90.5% - BHP = 53.91
Actual Operating Point C (57.5 Hz) – 3,600 USGPM @ 44’ TDH, 12” Dia, ῃ 90.7% - BHP = 44.10
Annual Operating Cost PER PUMP (Hospital @ 8,736 Hrs/Year, $0.11/kWh)Point A - Full Trim, no Balance = $52,977.73 (not including chiller efficiency decrease)
Point C - Full Trim, Speed Reduction = $42,378.34ANNUAL Savings PER PUMP = $10,599.39!
To Trim or Not To Trim
•19
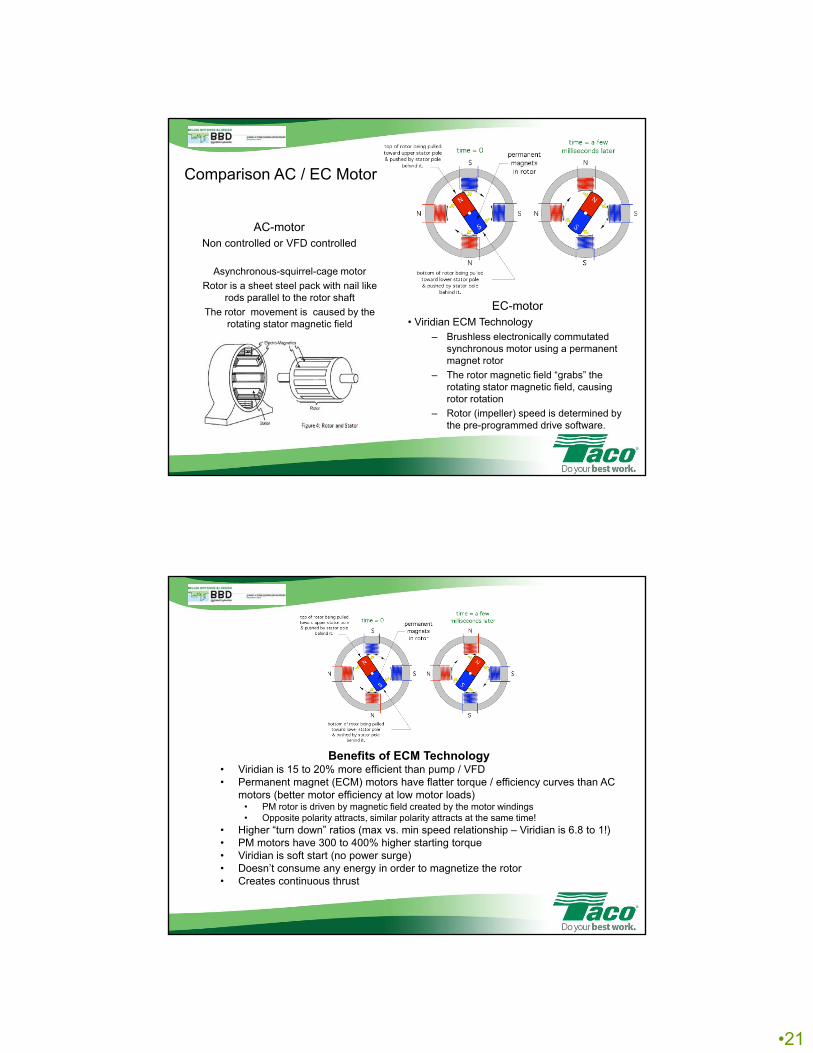
H (Ft) x Q (Usgpm)
Eff (0.?) x 3960BHP =
35 Ft x 160 Usgpm
0.6 x 3960BHP Design = = 2.4
43 Ft x 40 Usgpm
0.4 x 3960BHP 25 % = = 1.2
35 Ft x 40 Usgpm
0.6 x 3960BHP ∆pc = = 0.6
13 Ft x 40 Usgpm
0.6 x 3960BHP ∆pv = = 0.2
∆PC vs Constant SpeedDesign load 1,600,000 BTU’s or 160 USGPM @ 20 deg ∆T
25% load (shoulder heating season) 400,000 BTU or 40 USGPM
Design flow – 160 USGPM25% load flow – 40 USGPM
• TDH @ constant speed• TDH @ constant pressure• TDH @ proportional pressure
Let‘s Talk About EfficiencyFlow
(% of BEP)100% 75% 50% 25%
Motor Load(% Full Load)
15 Hp (100%) 7 Hp (42%) 2 Hp (13%) 0.3 Hp (2%)
Motor Eff* 93% 92.6% 85% 78%
Drive Eff** 96.5% 93.5% 84.5% 44%* 15 Hp Premium Efficiency** VFD interpolated from “Energy Tips – Motor (Motor Tip Sheet #11) July 2008
H (Ft) x Q (Usgpm) x SG
ῃP x ῃM x ῃD x 3960Line to Water kW =
Calculating Annual Electrical Cost to Operate a Pump – need to know:• Information above on motor (driver) and drive (VFD) – efficiency at various loads• # of operating hours at each flow (load) condition (load profile – heating or cooling)• Average cost of electricity (USA average is $0.11 per kW)• Head, flow and efficiency of the pump (wet end) - assume constant with VFD
500 x 81 x 1.0
0.74 x 0.93 x 0.96.5 x 39600.745 x
“Knowns”• 500 USGPM @ 81’ (100% load or flow)• Pump efficiency @ H/Q “design” = 74%• Motor efficiency @ design = 93%• Drive efficiency @ design = 96.5%• Assume SG 1.0

•20
Motor Efficiency – AC Motors• Optimum operating range 60% to 80%!
• EISA, NEMA and ASHRAE only refer to FULL LOAD minimum efficiency
Energy Efficient Circulator Options• European energy efficient circulator technology is becoming available
today in U.S. but acceptance has been slow because:– U.S. hydronic heating installed base is much smaller than EU
– A very small portion of new homes in the U.S. use hydronic heat.
– U.S. hydronic systems typically only run for small portion of year
– Electricity in U.S. is less expensive
– Cost of energy efficient circulators is nearly double traditional wet rotor circulators.
•21
Comparison AC / EC Motor
AC-motorNon controlled or VFD controlled
Asynchronous-squirrel-cage motor
Rotor is a sheet steel pack with nail like rods parallel to the rotor shaft
The rotor movement is caused by the rotating stator magnetic field
EC-motor• Viridian ECM Technology
– Brushless electronically commutated synchronous motor using a permanent magnet rotor
– The rotor magnetic field “grabs” the rotating stator magnetic field, causing rotor rotation
– Rotor (impeller) speed is determined by the pre-programmed drive software.
Benefits of ECM Technology• Viridian is 15 to 20% more efficient than pump / VFD• Permanent magnet (ECM) motors have flatter torque / efficiency curves than AC
motors (better motor efficiency at low motor loads)• PM rotor is driven by magnetic field created by the motor windings• Opposite polarity attracts, similar polarity attracts at the same time!
• Higher “turn down” ratios (max vs. min speed relationship – Viridian is 6.8 to 1!)• PM motors have 300 to 400% higher starting torque• Viridian is soft start (no power surge)• Doesn’t consume any energy in order to magnetize the rotor• Creates continuous thrust
•22
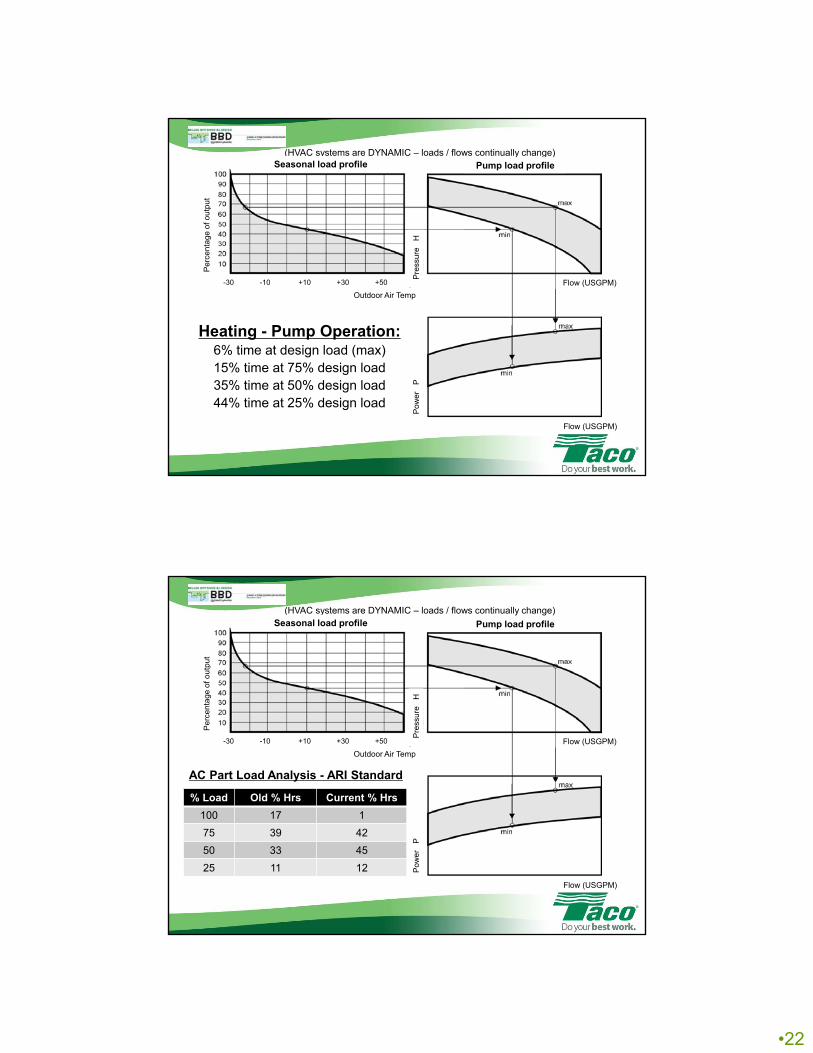
(HVAC systems are DYNAMIC – loads / flows continually change)
Heating - Pump Operation:6% time at design load (max) 15% time at 75% design load35% time at 50% design load44% time at 25% design load
Outdoor Air Temp
Flow (USGPM)
Pump load profileSeasonal load profile
Pe
rce
nta
ge o
f o
utp
ut
Pre
ssur
e
HP
ow
er
P
Flow (USGPM)
-30 -10 +10 +30 +50
(HVAC systems are DYNAMIC – loads / flows continually change)
AC Part Load Analysis - ARI Standard
Outdoor Air Temp
Flow (USGPM)
Pump load profileSeasonal load profile
Pe
rce
nta
ge o
f o
utp
ut
Pre
ssur
e
HP
ow
er
P
Flow (USGPM)
-30 -10 +10 +30 +50
% Load Old % Hrs Current % Hrs
100 17 1
75 39 42
50 33 45
25 11 12

•23
Chilled Water ‐ Constant Speed Pumps, Throttling Valves (no VFD's)
% Load Conditions ARI Standards
% LoadGPM
(USGPM)Head (ft) Eff Pump Eff Motor Drive NIC
Wire to water eff
P1 to P4 Hp
Annual KW Annual Cost
1% 100% 500 80.65 74% 93% 100% 69% 14.76 1181 $130
42% 75% 375 87.51 70% 91% 100% 64% 13.01 43711 $4,808
45% 50% 250 92.75 59% 78% 100% 46% 12.72 45805 $5,039
12% 25% 125 95.97 37% 62% 100% 23% 13.21 12677 $1,395
Totals 103375 $11,371.25
Chilled Water ‐ Variable Speed Pumps
% Load Conditions ARI Standards
% LoadGPM
(USGPM)Head (ft) Pump Eff Motor Eff Drive Eff
Wire to water eff
P1 to P4 Hp
Annual KW Annual Cost
1% 100% 500 80.7 74% 93% 97% 66% 15.34 1227 $135
42% 75% 375 45.4 74% 93% 94% 64% 6.71 22546 $2,480
45% 50% 250 20.2 74% 85% 85% 53% 2.40 8638 $950
12% 25% 125 5 74% 78% 44% 25% 0.62 597 $66
Totals 33008 $3,630.88
Energy Savings Calculator – Chilled WaterCW Load Profile and 8000 Hours, $0.11 / kWh
Energy Savings Calculator - HeatingHeating Load Profile and 6000 Hours, $0.11 / kWh
Heating ‐ Constant Speed Pumps, Throttling Valves (no VFD's)
% Load Conditions EU Standards
% LoadGPM
(USGPM)Head (ft) Eff Pump Eff Motor Drive NIC
Wire to water eff
P1 to P4 Hp
Annual KW Annual Cost
6% 100% 500 80.65 74% 93% 100% 69% 14.76 5315 $585
15% 75% 375 87.51 70% 91% 100% 64% 13.01 11708 $1,288
35% 50% 250 92.75 59% 78% 100% 46% 12.72 26720 $2,939
44% 25% 125 95.97 37% 62% 100% 23% 13.21 34863 $3,835
Totals 78606 $8,646.67
Heating ‐ Variable Speed Pumps
% Load Conditions EU Standards
% LoadGPM
(USGPM)Head (ft) Pump Eff Motor Eff Drive Eff
Wire to water eff
P1 to P4 Hp
Annual KW Annual Cost
6% 100% 500 80.7 74% 93% 97% 66% 15.34 5523 $608
15% 75% 375 45.4 74% 93% 94% 64% 6.71 6039 $664
35% 50% 250 20.2 74% 85% 85% 53% 2.40 5039 $554
44% 25% 125 5 74% 78% 44% 25% 0.62 1641 $180
Totals 18242 $2,006.60

•24
Payback AnalysisBased on 6,480 annual operating hours, pump costs and $0.11/kWh cost of power
Data from LCL Excel file for energy comparison – Viridian vs1900 Series
ECM and Self Sensing Technology
FAQs:
•Availability of larger ECM motors•ECM motors in Residential markets
•ECM/Variable Flow in Solar – why/why not?•State Incentive Programs – residential and commercial
•ECM Failure Modes•Available Voltages
•Sensor Lessons Learned•ASHRAE and DOE Activities
•25
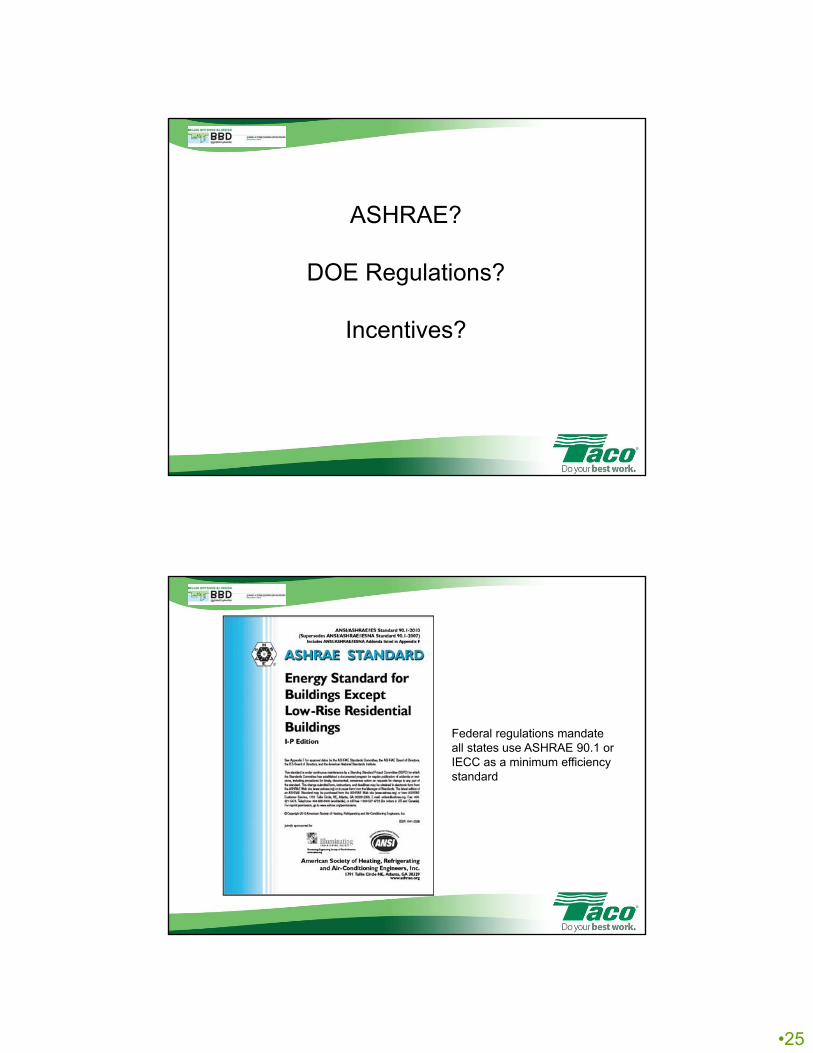
ASHRAE?
DOE Regulations?
Incentives?
Federal regulations mandate all states use ASHRAE 90.1 or IECC as a minimum efficiency standard
•26
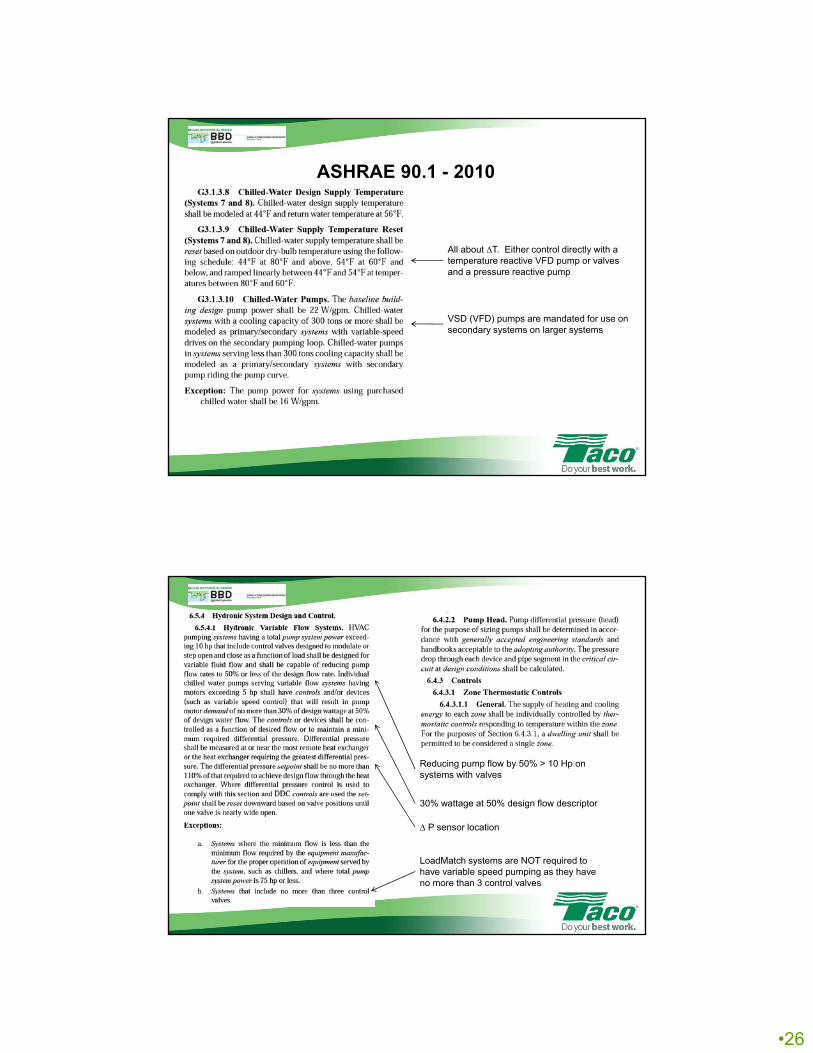
All about ∆T. Either control directly with a temperature reactive VFD pump or valves and a pressure reactive pump
VSD (VFD) pumps are mandated for use on secondary systems on larger systems
ASHRAE 90.1 - 2010
30% wattage at 50% design flow descriptor
Reducing pump flow by 50% > 10 Hp on systems with valves
∆ P sensor location
LoadMatch systems are NOT required to have variable speed pumping as they have no more than 3 control valves

•27
30% wattage at 50% design flow descriptor
Higher velocities (smaller pipes) with VFD!
DOE?Regulation Due this fall – 5 years to comply
•28
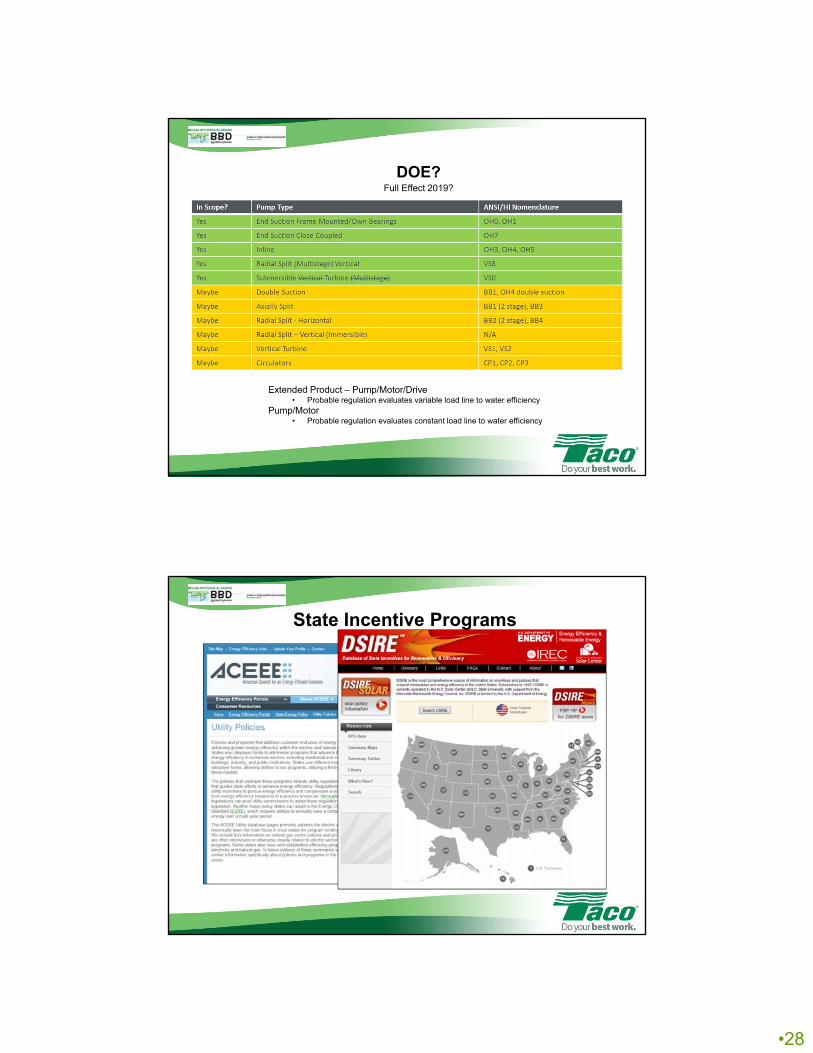
DOE?Full Effect 2019?
Extended Product – Pump/Motor/Drive• Probable regulation evaluates variable load line to water efficiency
Pump/Motor• Probable regulation evaluates constant load line to water efficiency
State Incentive Programs
•29
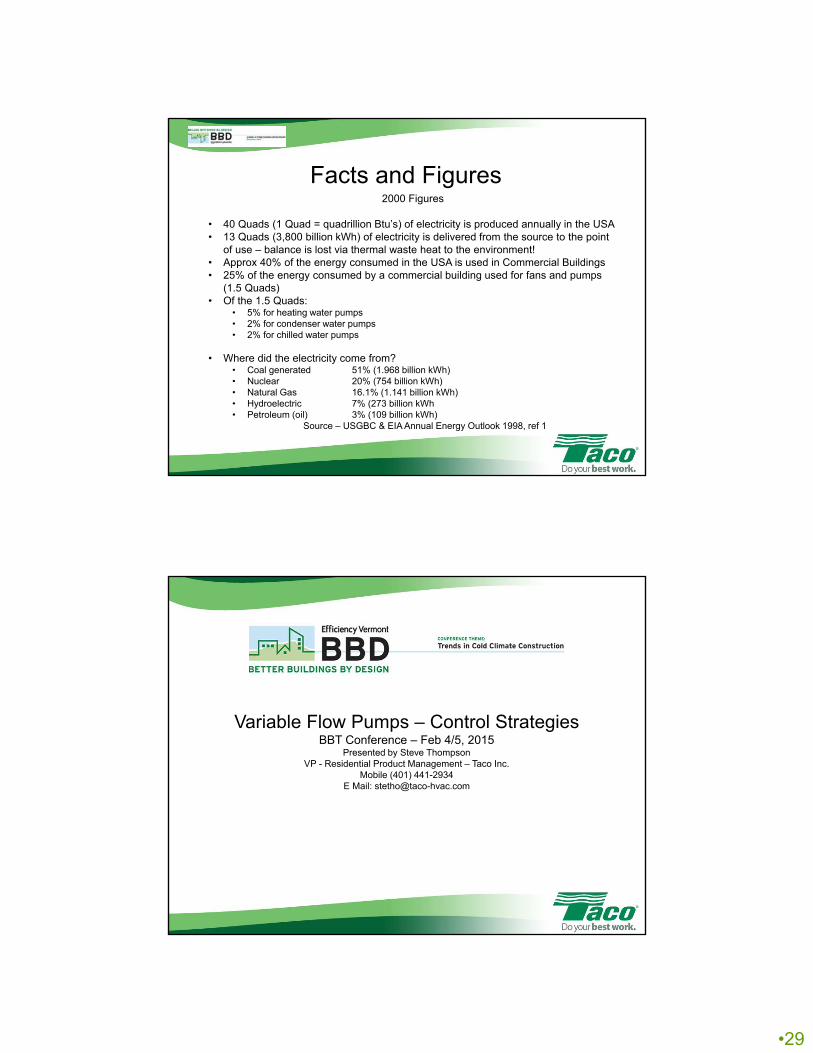
Facts and Figures2000 Figures
• 40 Quads (1 Quad = quadrillion Btu’s) of electricity is produced annually in the USA• 13 Quads (3,800 billion kWh) of electricity is delivered from the source to the point
of use – balance is lost via thermal waste heat to the environment!• Approx 40% of the energy consumed in the USA is used in Commercial Buildings• 25% of the energy consumed by a commercial building used for fans and pumps
(1.5 Quads)• Of the 1.5 Quads:
• 5% for heating water pumps• 2% for condenser water pumps• 2% for chilled water pumps
• Where did the electricity come from?• Coal generated 51% (1.968 billion kWh)• Nuclear 20% (754 billion kWh)• Natural Gas 16.1% (1.141 billion kWh)• Hydroelectric 7% (273 billion kWh• Petroleum (oil) 3% (109 billion kWh)
Source – USGBC & EIA Annual Energy Outlook 1998, ref 1
Variable Flow Pumps – Control StrategiesBBT Conference – Feb 4/5, 2015
Presented by Steve ThompsonVP - Residential Product Management – Taco Inc.
Mobile (401) 441-2934E Mail: [email protected]