variance components for modeling quantitative traitsgenome.sph.umich.edu/w/images/e/e9/666.20.pdfbe...
TRANSCRIPT

Variance Component Models for Quantitative Traits
Biostatistics 666

Today Analysis of quantitative traits
Kinship coefficients
• measure of genetic similarity between two individuals
Modeling covariance for pairs of individuals • estimating heritability • estimating locus-specific heritability
Extending the model to larger pedigrees

Kinship Coefficients
Summarize genetic similarity between pairs of individuals.
In a variance components model, they predict the phenotypic similarity between individuals.
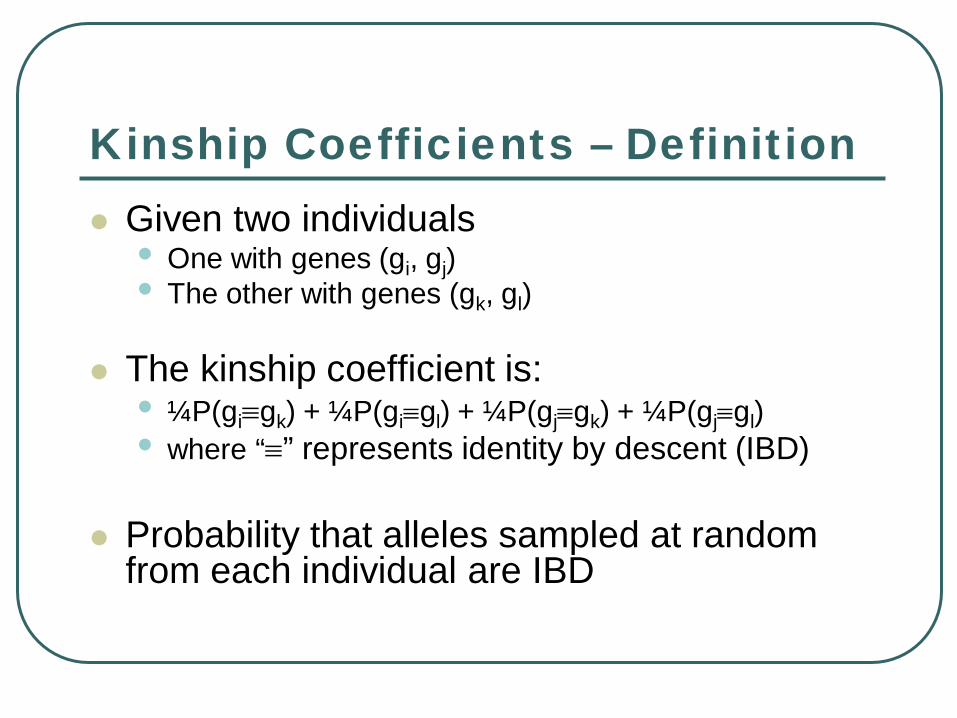
Kinship Coefficients – Definition Given two individuals
• One with genes (gi, gj) • The other with genes (gk, gl)
The kinship coefficient is: • ¼P(gi≡gk) + ¼P(gi≡gl) + ¼P(gj≡gk) + ¼P(gj≡gl) • where “≡” represents identity by descent (IBD)
Probability that alleles sampled at random
from each individual are IBD

Some kinship coefficients
Unrelated (ϕ=0) Parent-Offspring
(ϕ=1/4)
Half-Sibs (ϕ=1/8) Siblings (ϕ=1/4) MZ Twins (ϕ=1/2)

What about other relatives?
For any two related individuals i and j …
… use a recursive algorithm allows calculation of kinship coefficient
Algorithm requires an order for individuals in the pedigree where ancestors precede descendants
• That is where for any i>j, i is not ancestor of j • Such an order always exists (e.g. the birth order!)

Computing Kinship Coefficients
The recursive definition is then (for i ≥ j):
=+≠+
==
jiji
ijiji
ifatherimother
jifatherjimotherij
)1()(
foundera is ,founders are and 0
)()(21
)()(21
21
ϕϕϕ
ϕ

An example pedigree…
Can you find …
Suitable ordering for recursive calculation?
Calculate kinship coefficient between shaded individuals?

Inbreeding Coefficients
The kinship coefficient is related to the inbreeding coefficient
If ϕii > 0.5, individual i is inbred
The inbreeding coeffient is fi = ϕmother(i)father(i) = 2(ϕii – 0.5)

So far …
Summarize genetic similarity between any two individuals …
Next, we will proceed to build a simple model for their phenotypes

Simplest Data Structure
Pairs of related individuals • Siblings (or twins!) • Parent-Offspring
Corresponding phenotype measurements
• y = (y1, y2)’

Elements for a simple model …
If the trait is normally distributed …
Model mean and variance for y1 and y2 • Mean and variance could be assumed equal … • … or they could depend on some covariates
But we are also interested in covariance
between the two …

Variance-Covariance Matrix
=Ω
)(),(),()(
221
211
yVyyCovyyCovyV
Model must describe not only variance of each observation but also covariance for pairs of observations

Bivariate density function
Normal density function
Bivariate normal density function
Extends univariate density function
222
1 /)(1
21)( σµσπ
−−−= yeyL
)()'(2/1 12
1||21)( μyμyy −Ω−−− −
Ω= eLπ
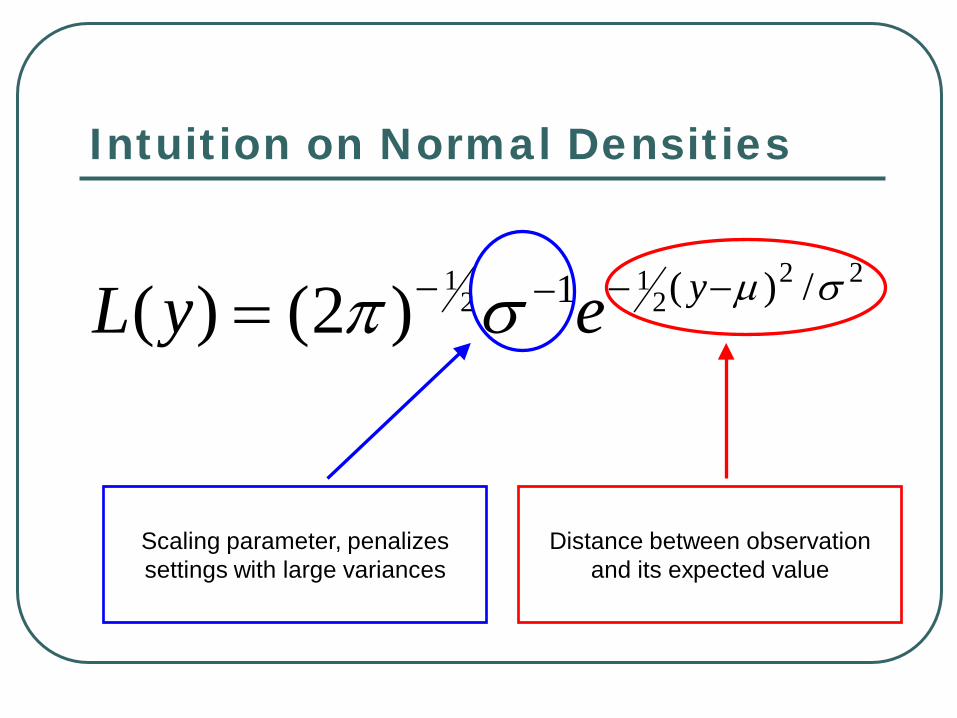
Intuition on Normal Densities
222
12
1 /)(1)2()( σµσπ −−−−= yeyL
Distance between observation and its expected value
Scaling parameter, penalizes settings with large variances

( ) )()'(1 12
12
1||2)( μyμyy −Ω−−−− −
Ω= eL π
Bivariate Normal Densities
Distance between observation and its expected value
Scaling parameter, penalizes settings with large variances

Variability in Height, Independent Observations
Height in Centimeters
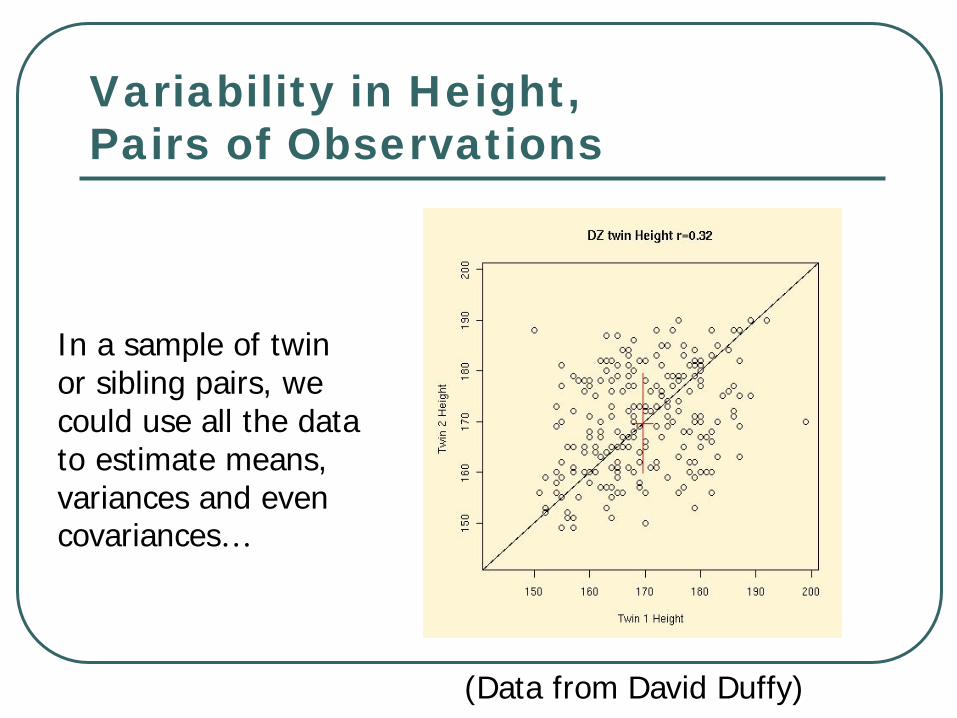
Variability in Height, Pairs of Observations
In a sample of twin or sibling pairs, we could use all the data to estimate means, variances and even covariances…
(Data from David Duffy)

(How would you interpret these data from David Duffy?)
Height in DZ and MZ twins

Incorporating Kinship Coefficients
If genes influence trait …
Covariance will differ for each class of relative pair
Instead of estimating covariance for each relationship, …
Impose genetic model that incorporates kinship
and relates covariance between different classes of relative pair

A Simple Model for the Variance-Covariance Matrix
sindividual twofor thet coefficien kinship theis
Where,
22
222
222
ϕ
σσϕσϕσσσ
++
=Ωegg
geg

Example…
N r MZ males 292 .80
MZ females 380 .80
DZ males 179 .47
DZ females 184 .55
DZ male-female 284 .41
(Reading ability scores from Eaves et al., 1997)

Interpretation…
Fitting a maximum likelihood model… • Eaves et. al estimated
•σg² = .81
•σe² = .19
• Found no evidence for sex differences • Saturated model did not improve fit

So far …
Model allows us to estimate the genetic contribution to the variation in any trait
Incorporates different relative pairs …
But it doesn’t always fit… • Fortunately, the model can be easily refined

Another Example…
N r MZ males 271 .56
MZ females 353 .52
DZ males 167 .33
DZ females 165 .45
DZ male-female 260 .41
(Psychomotor retardation scores from Eaves et al., 1997)

Refined Matrix
sindividual twofor thet coefficien kinship theis
Where,
22
22222
22222
ϕ
σσσσϕσσϕσσσσ
++++++
=Ωecgcg
cgecg
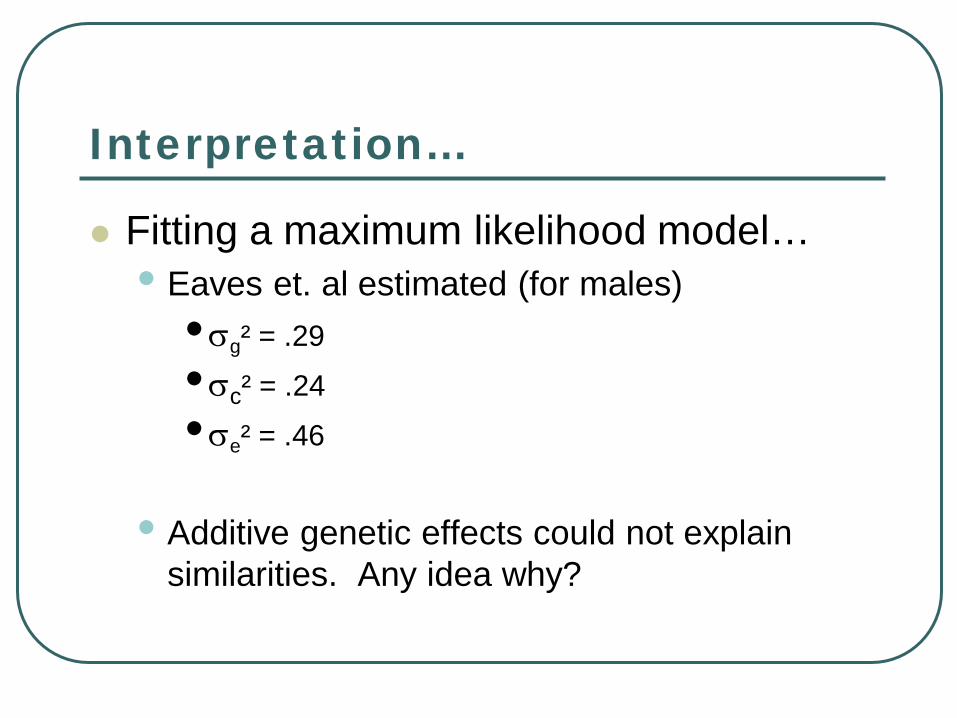
Interpretation…
Fitting a maximum likelihood model… • Eaves et. al estimated (for males)
•σg² = .29
•σc² = .24
•σe² = .46
• Additive genetic effects could not explain
similarities. Any idea why?
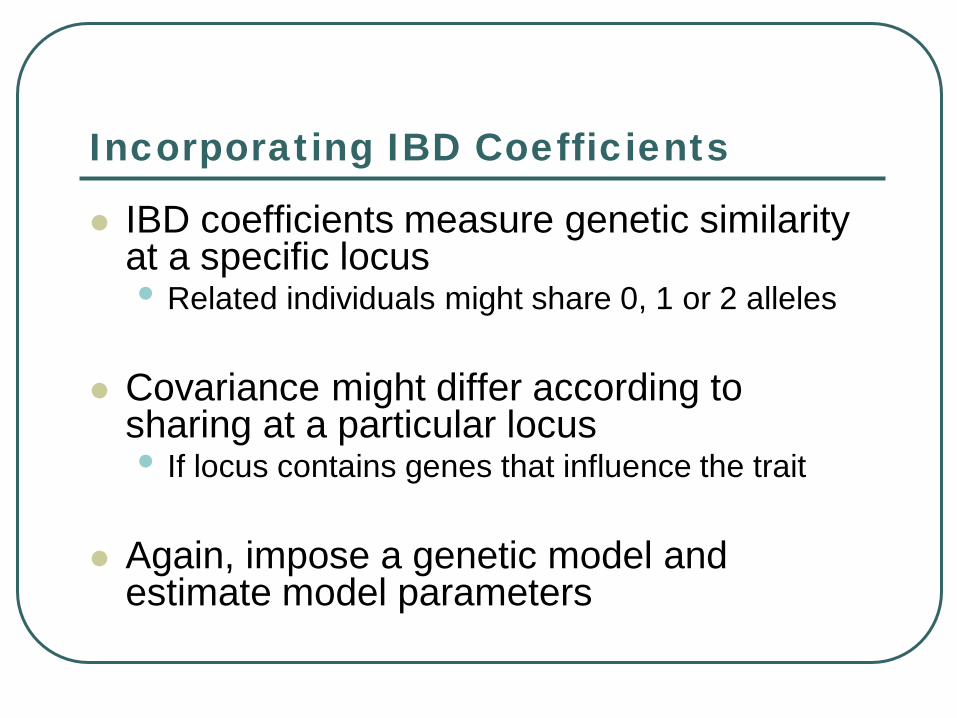
Incorporating IBD Coefficients
IBD coefficients measure genetic similarity at a specific locus • Related individuals might share 0, 1 or 2 alleles
Covariance might differ according to
sharing at a particular locus • If locus contains genes that influence the trait
Again, impose a genetic model and
estimate model parameters

Linkage

No Linkage

Relationship to IBD probabilities
For non-inbred pair of relatives, marker or locus-specific kinship coefficients can be derived from IBD probabilities:
)2()1( 21
41 =+== markermarkermarker IBDPIBDPϕ

Variance-Covariance Matrix
IBD shared alleles ofnumber theon depends sindividual twofor thet coefficien kinship theis
Where,
2222
22222
22222
marker
egagamarker
gamarkerega
ϕϕ
σσσϕσσϕϕσσϕσσσ
++++++
=Ω

Likelihood function, Incorporating Uncertain IBD
∑
∏
∏ ∑
==
−−−−−
=
−−−−=
−
ΩΩ=Ω
==
Ω≈
Ω=
−
−=
2,1,0
)(*)'(1
2,1,0
)()'(1
Expected"" *
iesprobabilit sharing IBD )datamarker |(
|*|)2(
||)2(
12
12
1
12
12
1
jjIBDij
iij
i
i jjIBDij
Z
jIBDPZ
e
eZL jIBD
μyΩμy
μyΩμy
π
π

How it works …
To find linkage to a particular trait…
Collect sibling pair sample
Calculate IBD for multiple points along genome
Model covariance as a function of IBD sharing at each point

Example…
0%
10%
20%
30%
40%
0 50 100 150 200
Prop
ortio
n of
Var
ianc
e
Position (cM)
Estimated Major Gene Component σa2

Example…
0
2
4
6
8
10
12
14
16
18
20
0 50 100 150 200
Chi
squa
re
Position (cM)
Likelihood Ratio Chisquared 2 ln L(σa
2)/L(σa2=0)

Example…
0
1
1
2
2
3
3
4
4
5
0 50 100 150 200
LOD
Sco
re
Position (cM)
LOD Score log10 L(σa
2)/L(σa2=0)

So far …
Models for similarity between relative pairs
Kinship coefficient used to estimate overall genetic effect
Locus-specific coefficients used to detect genetic linkage

Examples of Useful Extensions… For larger pedigrees, expand the
covariance matrix
For populations with individuals of uncertain relatedness, estimate kinship using genotypes
To model genetic association, allow individual specific means to depend on genotype
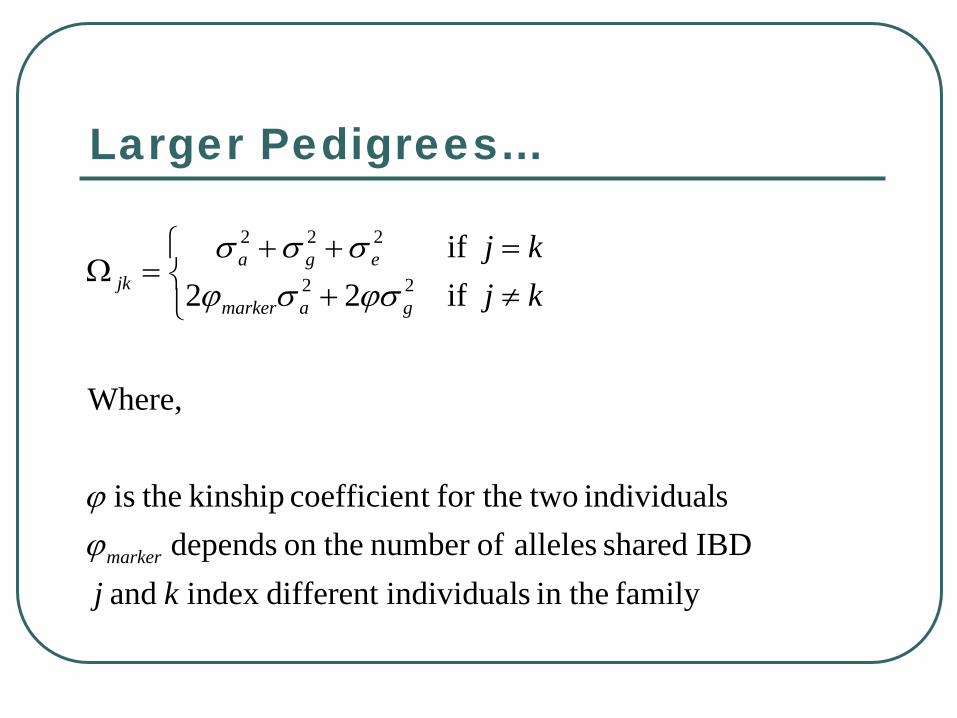
Larger Pedigrees…
family thein sindividualdifferent index and IBD shared alleles ofnumber theon depends
sindividual twofor thet coefficien kinship theis
Where,
if22 if
22
222
kj
kjkj
marker
gamarker
egajk
ϕϕ
ϕσσϕσσσ
≠+=++
=Ω

Multivariate density function
Normal density function
Multivariate normal density function
Extends univariate density function
222
12
1 /)(1)2()( σµσπ −−−−= yeyL
)()'( 12
12
12 ||2)( μyμyy −Ω−−−− −
Ω= eL nπ

Covariate and Genotype effects
ikkiii xxxyE βββµ ++++= ...)( 2211
Measured Covariates for Individual i
(e.g. age, sex, genotype)
Estimated effects for covariates (e.g. expected weight increases
1kg/year with age)
Expected Phenotype for Individual i
(e.g. expected weight)
In addition to modeling variances and covariances, can model fixed effects

Simple Association Model
Each copy of allele changes trait by a fixed amount • Include covariate counting copies for allele of interest
Evidence for association when a ≠ 0
igi
i
gyE
ig
βµ +=
=
)(
individualin interest of allele of copies ofnumber
βg is effect of each allele (the additive genetic value).

Relatedness in Populations Although we have focused on individuals of
known relationship, …
Marker data can also be used to estimate relatedness.
For example, Kang et al (2010) use:
𝜙𝑖𝑖 =1𝑀
(𝑔𝑖𝑖 − 2𝑝𝑖)(𝑔𝑖𝑖 − 2𝑝𝑖)4𝑝𝑖(1 − 𝑝𝑖)
𝑀
𝑖=1
44

Today Analysis of quantitative traits
Kinship coefficients
• Measure of genetic similarity between two individuals
Modeling covariance for pairs of individuals • estimating heritability • estimating locus-specific heritability
Extending the model to larger pedigrees

Useful References
Amos (1994) Am J Hum Genet 54:535-543 Hopper and Matthews (1982) Ann Hum Genet 46:373–383 Lange and Boehnke (1983) Am J Med Genet 14:513-24