variation in center of mass estimates for extant sauropsids and its importance for reconstructing...
TRANSCRIPT

THE ANATOMICAL RECORD 292:1442–1461 (2009)
Variation in Center of Mass Estimates forExtant Sauropsids and its Importancefor Reconstructing Inertial Properties
of Extinct ArchosaursVIVIAN ALLEN, HEATHER PAXTON, AND JOHN R. HUTCHINSON*
Department of Veterinary Basic Sciences, Structure and Motion Laboratory,The Royal Veterinary College, University of London, Hatfield, Hertfordshire, United Kingdom
ABSTRACTInertial properties of animal bodies and segments are critical input
parameters for biomechanical analysis of standing and moving, and thusare important for paleobiological inquiries into the broader behaviors,ecology and evolution of extinct taxa such as dinosaurs. But how accu-rately can these be estimated? Computational modeling was used to esti-mate the inertial properties including mass, density, and center of mass(COM) for extant crocodiles (adult and juvenile Crocodylus johnstoni) andbirds (Gallus gallus; junglefowl and broiler chickens), to identify the chiefsources of variation and methodological errors, and their significance.High-resolution computed tomography scans were segmented into 3Dobjects and imported into inertial property estimation software thatallowed for the examination of variable body segment densities (e.g., airspaces such as lungs, and deformable body outlines). Considerable biologi-cal variation of inertial properties was found within groups due to ontoge-netic changes as well as evolutionary changes between chicken groups.COM positions shift in variable directions during ontogeny in differentgroups. Our method was repeatable and the resolution was sufficient foraccurate estimations of mass and density in particular. However, wealso found considerable potential methodological errors for COM relatedto (1) assumed body segment orientation, (2) what frames of reference areused to normalize COM for size-independent comparisons among animals,and (3) assumptions about tail shape. Methods and assumptions are sug-gested to minimize these errors in the future and thereby improve esti-mation of inertial properties for extant and extinct animals. In the bestcases, 10%–15% errors in these estimates are unavoidable, but particu-larly for extinct taxa errors closer to 50% should be expected, and there-fore, cautiously investigated. Nonetheless in the best cases these methodsallow rigorous estimation of inertial properties. Anat Rec, 292:1442–1461,2009. VVC 2009 Wiley-Liss, Inc.
Keywords: center of mass; biomechanics; sensitivity analysis;computer modeling; archosaur; dinosaur; bird;locomotion
Grant sponsor: BBSRC; Grant numbers: BB/C516844/1; BB/F01169/1.
*Correspondence to: John R. Hutchinson, Structure andMotion Laboratory, Hatfield, Hertfordshire AL9 7TA, UnitedKingdom. Fax: 44-1707-666-371. E-mail: [email protected]
Received 9 June 2009; Accepted 9 June 2009
DOI 10.1002/ar.20973Published online in Wiley InterScience (www.interscience.wiley.com).
VVC 2009 WILEY-LISS, INC.

An animal’s body mass, or the mass of any of its com-ponent segments, can be abstracted as having a centerof mass (COM) located at some point within or near it.The COM along with mass and inertial tensor valuesare typically grouped as ‘‘inertial (or mass) properties,’’(used here) ‘‘inertial parameters,’’ ‘‘body segment param-eters,’’ or ‘‘mass sets.’’ Like all inertial properties, accu-rate knowledge of animal COM is critical for theanalysis of posture, gait, energetics, and other biologicalphenomena (e.g., Cavagna et al., 1977; Fedak et al.,1982).
COM positions alone are valuable for predicting loco-motor/dynamic performance variables (e.g., turning orrunning speed) and other ecologically-relevant factors(Srygley and Dudley, 1993). An excellent example is thestudy by Clemente et al. (2008), which showed how COMproximity to the hips in extant lizards is strongly corre-lated with bipedal running ability. This value extendsinto paleobiological questions, such as the role of segmentinertia in feeding (Snively and Russell, 2007) and turning(Carrier et al., 2001; Henderson and Snively, 2004;Hutchinson et al., 2007) behaviors of large tyrannosaurs,or ontogenetic changes in posture in smaller dinosaurs(Heinrich et al., 1993; Reisz et al., 2005).
Yet relative to other inertial properties, the accuracyof COM estimation has often been neglected, especiallywith reference to studies of extinct taxa. Here, we ana-lyze natural and methodological (i.e., error) variation inCOM estimates for extant archosaurs (crocodylians andbirds). We aim to phylogenetically bracket (looselyapplied) how much variation of COM values might beexpected for extinct archosaurs, especially non-aviandinosaurs.
By far the most effort in measuring or estimatingCOM values has been invested in human-based biome-chanical or ergonomic studies, using mechanical balanc-ing, cadaver-based regressions, photogrammetry, orgeometrical modeling (Dempster and Gaughran, 1967;Jensen, 1978; Hatze, 1980; Lephart, 1984; Yeadon, 1990;Sarfaty and Ladin, 1993; Baca, 1996; de Leva, 1996;Challis, 1999; Dumas et al., 2007). Scanning techniquesare also widely used, including gamma scanning(Zatsiorsky and Seluyanov, 1983), dual X-ray absorpti-ometry (Wicke et al., 2008), laser surface scanning(Norton et al., 2002), magnetic resonance imaging (Mun-giole and Martin, 1990), and computed tomography[(CT); Huang and Suarez, 1983; Wei and Jensen, 1995].
Studies of inertial properties, such those that includeCOM measurements, have incomplete coverage for non-human species. Manion (1984) estimated COMs forchickens across their ontogeny by suspending them fromthree different points and overlaying photographs to findCOM coordinates relative to landmarks. He found thatCOMs shifted cranioventrally from 5 to 19 days of age.During this time, the pectoral limbs grew and limb ori-entation became more flexed during standing, but moreextended during walking. Similar kinds of suspension/pendulum-based techniques, occasionally combined withgeometric modeling or regression equations, are by farthe most common methods used for other species (e.g.,in Fedak et al., 1982; Walter and Carrier, 2002), espe-cially primates (Crompton et al., 1996; Isler et al., 2006),horses (van den Bogert et al., 1989; Buchner et al.,1997), elephants (Ren and Hutchinson, 2008), and birds(Hutchinson, 2004; Goetz et al., 2008).
Recently, dinosaur researchers have estimated dino-saur COMs to reconstruct their locomotor biomechanics.Alexander (1985) used physical models to show that di-nosaur COMs were positioned cranioventral to the hips,which enabled the estimation of fore and hind limb boneloadings. Henderson (1999) provided a major improve-ment by implementing 3D body reconstructions in com-puter models to estimate COMs for large dinosaurs andalso, for validation of the technique, extant large mam-mals. He subsequently conducted similar analyses forvarious sauropods (Henderson, 2004, 2006) as well astheropods and other bipedal archosaurs (Henderson andSnively, 2004), which included brief sensitivity analysesof unknowns such as mediolateral body dimensions.Heinrich et al. (1993), Jones et al. (2000), and Christian-sen and Bonde (2002) reconstructed COMs for a smallgroup of dinosaurs using simple models, but like manyprevious studies, did not present quantitative data. LikeGunga et al.(2007), Bates et al. (2009) used laser-scan-ning of whole dinosaur skeletons to build whole-bodymodels, and (unlike Gunga et al., 2007) estimate inertialproperties.
Hutchinson et al. (2007) built deformable B-splinesolid computer models of an ostrich carcass, for proce-dural validation, and an adult Tyrannosaurus rex, forsensitivity analysis of COM and other parameters toestimate turning and running biomechanics (thisincluded 30 different models of T. rex anatomy). The lat-ter study quantified errors/variation in COM values,finding that the total body COM for a representativeadult T. rex was 0.45–0.74 m cranial and 0.229–0.335 mventral to the hips (�0.5 and �0.25 femur segmentlengths cranioventral). Air sac dimensions had smalleffects on COM, whereas tail (and pelvic limb) dimen-sions had proportionately large effects. Bates et al.(2009) also performed a very similar sensitivity analysis,with similar results.
Motani (2001) noted that the assumptions of an ellipti-cal body cross section by Henderson (1999 and later) andother studies could not only introduce inaccuracies inestimating mass but also COM, perhaps causing a cau-dad directional bias of COM position due to underesti-mation of body mass in the cranial half of the body. Also,he observed that cross-sectional profiles of animal bodysegments diverge significantly in size and shape fromtheir underlying skeletal scaffold. Especially in taxawith long tails, this has the potential to be an importantsource of uncertainty for COM position estimates.
Yet to date there has been little study of the accuracyof quantifying COM and other inertial properties forextant taxa (except for humans and a few other species)from the underlying anatomy alone (refer Hutchinsonet al., 2007 and Bates et al., 2009 for simple exampleswith ostriches), or the individual variation amongst thesame age cohort or across ontogeny. As COM has criticalimportance for behaviors of broad paleobiological inter-est, such as bipedalism/rearing, gait mechanics, ontoge-netic shifts, and flight, there are unresolved concernsabout the expected variability and accuracy of inertialproperty estimates for extinct taxa.
Here, for extant archosaurs, we characterize thedegree of COM variation (1) among conspecific individu-als of the same size, (2) during growth (using ontoge-netic sequences) and evolution (using related breeds), (3)due to errors in estimating COM values (e.g., resolution
CENTER OF MASS VARIATIONS 1443

of imaging technologies, human measurement error,frames of reference for reporting COM values, and limb/body segment orientations), and (4) with estimates in abest case scenario for extant taxa [e.g., effects ofassumptions ca. body outlines beyond skeletal indicators(especially in the tail; Motani, 2001), and air spaceswithin the body that alter regional densities]. This hasdirect implications for COM estimates in extinct taxa,particularly those with long tails such as archosaurs, forwhich COM values will forever be unknown parameters.As mass and density are related to COM and arecalculated in its estimation, we additionally compare theaccuracies of estimating mass and density versuscalculating them using computational methods. Byquantifying the amount of natural variation versus‘‘methodological variation’’ of inertial properties for ex-tant taxa, we will better appreciate how closely we canestimate these values for extinct taxa and therebyinform future biomechanical and evolutionary analyses.
MATERIALS AND METHODS
To acquire 3D geometry of animal bodies necessary forCOM estimation, we used CT scanning of cadavericspecimens. All scans took place at The Royal VeterinaryCollege’s Hawkshead campus, using a Picker PQ5000CT scanner. We focused on crocodylians and birds(extant Archosauria). For crocodylians, we CT scannedone juvenile (body mass 1.54 kg) and one adult (bodymass 20.19 kg) Australian freshwater crocodile (Crocody-lus johnstoni), ages unknown. Specimens had died natu-rally in captivity and were free from pathologies thatwould influence our results. We obtained the adult croco-dile in three sections (head, torso/limbs, and tail) thatwere scanned separately and digitally reconnected inMIMICS 11.0 imaging software (Materialise; Leuven,Belgium).
For birds, we CT scanned 15 domestic chickens (Gal-lus gallus): ten 4-week old (body mass 1.99 � 0.16 kg)and five ‘‘mature’’ (morphologically subadult, but atslaughter age) 6-week old specimens of Cobb 500 broilers(body mass 2.79 � 0.22 kg). Broilers are bred forextreme anatomy related to large pectoral muscle mass,and in terms of unusual body shape thus are a ‘‘worstcase’’ example for estimating inertial properties. In addi-tion, to represent the more natural ancestral morpho-type from which broiler chickens evolved (Fumihitoet al., 1994; Liu et al., 2006), we CT scanned five (6-week old; body mass 0.60 � 0.074 kg) juvenile and fiveadult (15-week old; body mass 1.94 � 0.15 kg) giant jun-glefowl. Junglefowl and broiler chickens here are dis-cussed together as ‘‘chickens.’’ Chickens were obtainedas byproducts of normal culling and did not have patho-logies that would influence our main results here.
Animals were placed with their ventral surface restingon a radiolucent cushion. Limbs were posed as similarlyas possible for each species (Figs. 1 and 2), to minimizepostural effects on COM estimates. However, in all casesdue to scanner constraints and the imprecision of posinglimbs manually, precise positioning of the limbs andbody was not possible among specimens—we return tothis critical point in the Results and Discussion. Thespecimens were then scanned with axial 512 � 512 pixelCT slices at 100 mA and 120 kVp X-ray beam inten-
sities. Details on CT scan slice thicknesses and resolu-tions are presented in Table 1.
CT scans were converted to DICOM images andimported into MIMICS 11.0 imaging software (Material-ise; Leuven, Belgium) for segmentation and 3D recon-struction. Images were semiautomatically thresholdedinto 3D volumes using grayscale values (involving somemanual adjustment from baseline values) and exportedas DXF, OBJ, STL, or ASC format 3D computer graphicsimages. These then were imported into custom inertialproperty measurement software (Hutchinson et al.,2007). In the latter software we either used the raw seg-mented geometry (original models) with homogeneousdensity (as below) or constructed a simplified frameworkof deformable b-spline solids (as in Hutchinson et al.,2007), one per body segment. These b-spline solidsallowed for deformation of the body surface (e.g., to sim-ulate the reconstruction of body outlines from skeletallandmarks alone) and embedding of zero-density objects(e.g., lungs and other air spaces). To examine the accu-racy of this procedure, we modeled the same individual(an adult junglefowl, discussed further below for a sensi-tivity analysis of air space dimensions) using both thedetailed original segmentation (which did not allow em-bedded air spaces or easy deformation of tissues) andthe simplified b-spline solid geometry (which did allowsuch modifications).
The 3D geometric objects representing flesh weregiven densities equivalent to water (1000 kg m�3),whereas those representing air spaces were given zerodensity (a reasonable approximation for the empty cav-ities; Hutchinson et al., 2007). In our original models ofcrocodiles and chickens (Tables 1–3), we excluded the airspaces entirely, but we compared actual body masseswith estimated masses to determine the effects of thisassumption. In later, detailed models (Tables 4 and 5),we included air spaces directly segmented from the cav-ities evident in CT scans.
COM positions along the x (craniocaudal; positive ¼cranial), y (dorsoventral; positive ¼ dorsal), and z axes(mediolateral; positive ¼ right lateral) were calculatedby the inertial properties software for the input geome-try and densities, and expressed relative to the locationof the right hip joint (following Hutchinson et al., 2007;Figs. 1 and 2). Note that the z-coordinate value is thedistance from the body midline and thus is about half ofthe distance between the right and left hip joint centers.Values were then expressed with four different frames ofreference to normalize them for cross-taxa comparisons,therefore removing size effects: (1) body mass0.33 (per-haps an ideal method to non-dimensionalize COM valuesas it is more independent of individual body dimensionsthat might themselves vary separately from COM varia-tion); (2) femur length (following Hutchinson et al., 2007and related studies); (3) body length (snout to tail tipwith body straightened); and (4) limb length (center offemoral head to middle of third metatarsophalangealjoint; sum of all bone lengths if limb were extendedvertically).
Different normalizing factors had distinct advantagesand demerits. Body mass0.33 seems an ideal parameterfor normalizing COM (as it by definition scales isometri-cally with size), but it is less well-constrained for extincttaxa than femur length or limb or body length. Bodylength is a simple metric to apply. Alternatively, femur
1444 ALLEN, PAXTON, AND HUTCHINSON

or limb length can have greater functional relevance.For example, the femur must be sufficiently long to posi-tion the knee cranially to the COM to allow for bipedalstability, and limb length must be adequate to permitplacement of the foot under the COM (e.g., Hutchinson,2004; Hutchinson et al., 2007). Certainly for extincttaxa, body length or especially femur and limb lengthare more directly measurable than body mass.
In addition, the craniocaudal position of the right hipjoint as a fraction of body length was examined for com-parison to these factors, to provide a more complete pic-ture of how different ways of reporting COM positionsmight influence broader conclusions, and to assess the
reliability of using the right hip as a reference point.COM estimates were expressed for the whole body(including limbs) and trunk only (pelvic limbs removedat their proximal joints in MIMICS software; Fig. 3).This COM estimation avoided the problems inherent inthe variable pelvic limb poses. It was also conducted forthe crocodile models.
For investigation of potential errors in COM positionestimates, we CT scanned one adult broiler chicken andone junglefowl at lower (3.0 mm slice thickness) andhigher (1.5 mm slice thickness) longitudinal resolution.Between scans, the broiler chicken specimen wasremoved, so its pose was only roughly consistent among
Fig. 1. Australian freshwater crocodile (Crocodylus johnstoni) mod-els used for inertial properties calculations, in right lateral view (corre-sponding to data in Tables 1, 2, and 5). Not to scale; scaled to sametotal length where relevant—refer Table 1 for measurements. Pink discrepresents right hip’s reference point; red disc shows center of mass.Axes shown are x (cranial; red), y (dorsal; green), and z (lateral; blue).Original, unstraightened models from original scan positions: A, juve-nile; B, adult. ‘‘Straightened, detailed’’ models in reference pose (trunkonly COMs in Table 2 corresponds to these models with limbs omit-ted): C, juvenile; D, adult. E, Original scan of juvenile crocodile in right
lateral view, showing air cavities (dark blue ¼ lung; light blue ¼ pha-ryngeal/cranial cavities) used in ‘‘realistic’’ models (Table 5). F, ‘‘Simpli-fied’’ modeling procedure using skeletal dimensions alone to estimateinertial properties; juvenile crocodile shown in right oblique view. Thepurple hoops correspond to anatomical landmarks and were deformedby set amounts to extend the flesh beyond the skeleton. Simplifiedmodels of juvenile crocodile to illustrate the COM estimates in Table 5:G, ‘‘Max caudal’’ model; H, ‘‘Max cranial’’ model (refer Methods). Pur-ple ellipse represents thoracic cavity boundaries; blue filled sectionrepresents thoracic cavity (zero density) area in each model.
CENTER OF MASS VARIATIONS 1445

scans. The junglefowl was not disturbed between scans.This again allowed us to check the effects of the limband head/neck poses used in scanning.
In addition, for one 6-week old broiler chicken werepeated the MIMICS segmentation and COM modelingprocedure (above) 5 times to check the effects of thiscritical step on our COM estimates.
To assess the effects of differing poses on chicken andcrocodile inertial properties, we compared results basedon the raw scans of specimens in their original poses tothose based on specimens which had been re-posed intoa straightened ‘‘reference pose’’ by deforming the origi-nal scan in Blender 2.47 open source 3D graphics soft-ware (www.blender.org). Briefly, the individual verticesthat define the 3D geometry of the body were selected ingroups representing body segments, and these wererotated into the reference poses displayed in Fig.
1C,D,F–H—forelimbs fully abducted and extended (i.e.,oriented along the z-axis), hindlimbs extended fully ven-trally, glenoid and acetabulum horizontal, tail fullyextended caudally (similar to Hutchinson et al., 2007),and other vertebrae posed in the neutral position sug-gested by their articular surfaces. As a convention, here,we refer to the initial scanned poses as the ‘‘original’’models, and inertial properties estimates for reference-poses as the ‘‘straightened’’ models.
To evaluate typical methodology used to estimate iner-tial properties for extinct taxa (e.g., Henderson, 1999;Hutchinson et al., 2007) we created simplified models inBlender based solely on skeletal landmarks from anadult junglefowl and the juvenile and adult C. johnstoni,and then compared estimates of inertial properties basedon these simple models to those based on the originalscans. The simple models were created in Blender by
Fig. 2. Chicken (Gallus gallus) models, in right lateral view, corresponding to cohorts in Table 1. Not toscale; scaled to same total length. Labels as in Fig. 1. The skeletons are shown for reference and werenot part of inertial properties calculations; the translucent outline represents the ‘‘virtual flesh’’ of themodels.
1446 ALLEN, PAXTON, AND HUTCHINSON

fitting octagonal ‘‘hoops’’ tightly onto the skeleton (Fig.1F), and lofting (polygon skinning) them to create a‘‘watertight’’ (i.e., gapless) polygon mesh. The whole-body mesh was divided into eight segments: cranial, cer-vical (vertebral series from atlas to first dorsal/pectoralvertebra), thoracic/abdominal/pelvic (body from pectoralgirdle to pelvic girdle), caudal, two forelimbs, and twohindlimbs.
In these simple models, the lungs were recreated assegments of an ellipsoid fitted closely to the inside of theribcage (Fig. 1G,H), representing set fractions of the tho-racic cavity volume (bounded by ranges observed inextant archosaurs). Smaller airspaces were simply fittedto appropriate skeletal landmarks—the inside of thenasal sinuses for the nasal cavity, the interior marginsof the mandible and bony palate for the buccal cavity.
To account for unknowns regarding the true bodydimensions of extinct animals, it is now standard toapply a sensitivity analysis to paleontological reconstruc-tions of inertial properties, in which body segment pa-rameters are systematically altered, and the potentialrange of estimations for inertial properties noted. We
applied a similar sensitivity analysis to our simple mod-els. The radial dimensions of the simple hoops thatdefined each body segment’s shape were scaled betweentheir initial skeleton-hugging values and þ20% to simu-late a ‘‘minimal’’ and ‘‘maximal’’ body outline (afterHutchinson et al., 2007). These were then combined torepresent the maximum plausible variability in totalmass estimates and the most dorsal, ventral, cranial,and caudal positions of the centre of mass—thus bound-ing the possible range of inertial properties estimatespossible. As an example, the ‘‘maximal caudal’’ modelsimply consists of the largest tail and hindlimbs com-bined with the smallest chest, neck, and forelimbs andthe largest air spaces; the ‘‘maximal cranial’’ model wasthe opposite (Fig. 1G,H).
We also CT-scanned three lizard cadavers to model therelationship between tail shape and skeletal dimensions,for comparison with archosaurs. These lizard specimenswere included because of their more basal phylogeneticposition outside Archosauria (Gauthier et al., 1988),polarizing the evolution of tail shape, but were excludedfor body COM calculations due to the eviscerated/
TABLE 1. Main archosaurian study specimens—basic information
ParameterJuvenilebroiler
Maturebroiler
Juvenilejunglefowl
Adultjunglefowl
Juvenilecrocodile
Adultcrocodile
Age (wk) 4 6 6 15 n/a n/aN (cadavers) 10 5 5 5 1 1Actual mean massa 1.99 2.79 0.60 1.94 1.54 20.19SD 0.16 0.22 0.07 0.15 n/a n/aEstimated massb 2.06 2.92 0.66 2.17 1.79 21.3SD 0.16 0.30 0.09 0.27 n/a n/aEstimated/actual mass (%)c 103 105 110 112 116 105Estimated density (kg m�3)d 968 953 909 894 860 948CT slice thickness (mm) 3.0 3.0 1.5 3.0 1.3 2.5CT resolution (pixels mm�1) 2.133 1.707 2.560 1.707 2.048 1.024aMass from electronic balance (�0.001 kg).bMass from inertial properties estimation software.cError ¼ 100*(Estimated mass/Actual mass).dModel density of 1,000 kg m�3 divided by (estimated/actual mass) from above to estimate actual density of cadaver.
TABLE 2. Center of mass (COM) position normalized by femur length for Crocodylus cadavers
Pose COM positionJuvenilecrocodile Diff. (%)
Adultcrocodile Diff. (%) Ratio
Original Cranial x (/femur length) 0.55 0 1.6 0 2.8Original Ventral y (/femur length) �0.24 0 �0.10 0 0.42Original Medial z (/femur length) �0.33 0 �0.96 0 2.9Straightened Cranial x (/femur length) 0.92 167 1.2 79 1.3Straightened Ventral y (/femur length) �0.24 100 �0.10 110 0.42Straightened Medial z (/femur length) �0.41 122 �0.51 52 1.2Trunk only Cranial x (/femur length) 1.6 297 1.94 124 1.2Trunk only Ventral y (/femur length) �0.22 92 0.010 �10 �0.043Trunk only Medial z (/femur length) �0.41 169 �0.51 52 1.2
‘‘Original’’ pose is the cadaver scanned in its unstraightened configuration (Fig. 1A,B). ‘‘Straightened’’ pose corresponds toa modified model in the reference posture, with limbs vertically straightened and trunk aligned with the craniocaudal (x)axis (Fig. 1C,D). ‘‘Trunk only’’ corresponds to the straightened model with the limbs removed. Air cavities were still absentin all of these models. The ‘‘diff ’’ column is the % difference from the original pose model. The ‘‘ratio’’ column is the ontoge-netic ratio of COM position in the adult relative to the juvenile crocodile. Note that this ratio is negative for the ‘‘trunkonly’’ model’s ventral COM position because the adult’s COM is 0.010 femur length dorsal to the right hip joint. Juvenileand adult femur lengths were 0.054 m and 0.105 m, respectively.x, cranial; y, ventral; z, medial relative to right hip.
CENTER OF MASS VARIATIONS 1447

damaged condition of their presacral regions or limbs.We scanned (as above; 1.5 mm slice thickness, 2.13–2.56pixels mm�1) one adult green iguana (Iguana iguana),one adult savannah monitor (Varanus exanthematicus),and one subadult basilisk lizard (Basiliscus vittatus).
To assess the deviation of tail cross-sectional shapesfrom those suggested by the caudal skeleton, and theireffects on inertial properties, we segmented the fleshand skeleton as separate 3D meshes in MIMICS. InBlender software, we then fitted simple octagonal hoops
TABLE 3. Center of mass (COM) for chicken body and trunk, with normalization methods
COM parameter Juvenile broiler Mature broiler Juvenile junglefowl Adult junglefowl
COM x (/body mass0.33) 0.035 0.028 0.028 0.039�SD 0.0027 0.0043 0.0086 0.0048COM x (/femur length) 0.611 0.502 0.375 0.533�SD 0.042 0.086 0.11 0.063COM x (/limb length) 0.177 0.148 0.111 0.150�SD 0.012 0.027 0.033 0.015COM x (/body length) 0.121 0.099 0.083 0.113�SD 0.0086 0.012 0.025 0.012Trunk COM x (/femur length) 0.927 0.826 0.710 0.787�SD 0.066 0.11 0.082 0.068COM y (/body mass0.33) �0.023 �0.029 �0.038 �0.034�SD 0.0024 0.0035 0.0057 0.0044COM y (/femur length) �0.402 �0.532 �0.500 �0.466�SD 0.043 0.072 0.077 0.059COM y (/limb length) �0.116 �0.156 �0.148 �0.132�SD 0.012 0.019 0.023 0.016COM y (/body length) �0.080 �0.106 �0.111 �0.099�SD 0.0084 0.016 0.018 0.013Trunk COM y (/femur length) �0.378 �0.524 �0.478 �0.446�SD 0.040 0.066 0.071 0.067COM z (/body mass0.33) �0.020 �0.019 �0.014 �0.022�SD 0.0047 0.0046 0.0096 0.0089COM z (/femur length) �0.347 �0.350 �0.192 �0.292�SD 0.091 0.075 0.13 0.12COM z (/limb length) �0.100 �0.103 �0.057 �0.083�SD 0.025 0.023 0.038 0.035COM z (/body length) �0.068 �0.070 �0.042 �0.062�SD 0.016 0.017 0.028 0.026Trunk COM z (/femur length) �0.354 �0.350 �0.192 �0.299�SD 0.091 0.062 0.12 0.10
x, cranial; y, ventral; z, medial relative to right hip.
TABLE 4. Air space inflation sensitivity analysis for adult junglefowl cadaver
ModelCOM
cranial (x)COM
ventral (y)Cranialdiff (%)
Ventraldiff (%)
Ratiocranial
Ratioventral
Estimated/actual
mass (%)
Lifelike, no cavities 0.086 �0.019 172 41 1.3 0.41 131Minimal inflation 0.087 �0.023 174 50 1.4 0.49 118Maximal inflation 0.092 �0.026 184 57 1.4 0.56 103Straightened, detailed 0.064 �0.047 128 101 n/a n/a 129Straightened, no cavities 0.062 �0.042 124 91 0.97 0.90 148Simplified, max caudal 0.044 �0.066 88 143 0.69 1.4 125Simplified, max cranial 0.065 �0.041 130 89 1.0 0.88 150
COM positions are in meters. The ‘‘lifelike, no cavities’’ model was posed as in Fig. 5A,B. The ‘‘minimal’’ and ‘‘maximal’’inflation models had air sacs deflated or inflated as described in the Methods; these were added as cavities to the lifelikemodel. All three of these models had body segment poses approximating those during standing (not recumbent as in scansfrom Table 3 or Fig. 2). The ‘‘straightened, detailed’’ model had its body segments straightened (Fig. 5C,D) but was basedon the original scan geometry (detailed anatomy) and had internal ‘‘relaxed’’ cavities matching the original scans. The‘‘straightened, no cavities’’ model simply lacked these cavities. The two ‘‘simplified’’ models used the basic skeletal geometryof the ‘‘straightened’’ model as an underlying framework around (or into) which deformable hoops representing flesh distri-bution (or cavities) were placed; the ‘‘max caudal’’ model had flesh distribution biasing the COM to a more caudal position(Fig. 5E), the ‘‘max cranial’’ model to a more cranial position (Fig. 5F; refer Methods). The ‘‘diff ’’ columns (cranial and ven-tral) show the differences (ratio as a %; 100% ¼ identical) of the cranial and ventral COM positions from the originally-scanned recumbent specimen (pose as in Fig. 2); x and y COM positions were 0.050 m and �0.046 m, respectively. The ‘‘ra-tio’’ columns give model values relative to the ‘‘straightened, detailed’’ model; 1 ¼ identical. The ‘‘estimated/actual mass’’column gives % difference from actual body mass of 2.069 kg; 100% ¼ identical.
1448 ALLEN, PAXTON, AND HUTCHINSON

(Fig. 4) tightly to the caudal skeleton at regular inter-vals, again representing the fleshy outline suggested byassuming elliptical cross sections and using skeletaldimensions alone. These skeleton based outlines werethen systematically deformed until they closely approxi-mated the actual fleshy cross sections, varying mediolat-eral, dorsal, and ventral dimensions to account for sizedifferences. To account for differences in outline shape,the dorsal and ventral diagonal dimensions (Fig. 4) ofeach octagonal hoop were each scaled (varying the basicellipse-approximating shape to one closer to a diamondor a square) in a crude approximation of the super-ellipse approach described by Motani (2001). To repre-sent typical saurian tail dimensions, we calculated amean of these deformations for all specimens.
For one adult junglefowl cadaver, we conducted a sen-sitivity analysis of actual air space dimensions, to ap-proximate the effects of ventilation (air space volumechanges) on COM position, and to determine the effectsof differing estimates of air space volume or even totalexclusion of the air spaces on COM estimates. We sus-pended the specimen via threads from the pectoral andpelvic girdles to avoid deformation of the chest cavity bythe cadaver’s weight, and posed its body and limbs tomatch photographs of standing junglefowl (allowing acomparison with models that were posed in more recum-bent positions). Air was then injected or removed fromthe pulmonary system using a large syringe barrelattached via a length of tubing inserted into the trachea.The plunger of the syringe was either depressed orextended until significant resistance was met, represent-ing ‘‘maximal inflation’’ (addition of �150 mL of air) and‘‘minimal inflation’’ (i.e., deflation; removal of �45 mL ofair), respectively, and secured in this position while thespecimen was CT-scanned. The resulting maximal andminimal pulmonary cavities were segmented as 3Dshapes in MIMICS (Fig. 5A,B), and modeled for inertial
properties in our custom software as above (setting cav-ity densities as zero).
We used SPSS 15.0 (Statistical Package for the SocialSciences, Chicago, IL) software for statistical analysis, tocheck for differences of COM estimates between chickencohorts. One way analysis of variance (ANOVA) wasused to test the differences among several means withthe cohort as the factor and the COM value as the de-pendent variable. If a significant result was shown, a se-quential Bonferroni post hoc test was used to establishwhich cohorts were significantly different. An adjustedP-value < 0.05 was considered statistically significant. At-test was used to examine the effect of MIMICS seg-mentation and the COM estimation procedure for differ-ences between the two groups.
RESULTS
Detailed results for our models are presented in theAppendices (Tables A1–A5), but we summarize our keyfindings here.
Estimated Versus Actual BodyMass and Density
In crocodiles (Table 1), our model of the juvenile over-estimated actual cadaver body mass by 16%, whereasthe adult model overestimated mass by 5%. These dataindicate a slightly higher density (948 kg m�3) for theadult versus the juvenile (860 kg m�3). Curiously, theadult’s density is only 88% of the 1080 kg m�3 estimatedby Cott (1961). Predominance of low-density cartilageand other tissues in juveniles, especially for the armoredscutes, may explain the apparent ontogenetic differencein density, supported by our dissections and examina-tions of the CT scans. COM values in the initial modelswith density equal to water (Table 2) are biased
TABLE 5. Tail deformation sensitivity analysis for crocodile cadavers
‘‘REAL’’ COM (m)
CrocodileTail
reconstruction Cranial (x) Ventral (y) Medial (z)Estimated/
actual mass (%)
Juvenile Standard 87Juvenile Informed 0.047 �0.013 �0.021 99Adult Standard 86Adult Informed 0.119 �0.012 �0.053 99
Estimated COM x (m) Estimated COM y (m) Estimated COM z (m)
CrocodileTail
reconstruction Max Min diff Max Min diff Max Min diff
Juvenile Standard 0.100 0.073 0.040 �0.016 �0.013 �0.002 �0.022 �0.022 �0.001Juvenile Informed 0.084 0.034 0.012 �0.016 �0.013 �0.002 �0.022 �0.022 �0.001Adult Standard 0.213 0.142 0.059 �0.021 �0.010 �0.004 �0.058 �0.055 �0.004Adult Informed 0.182 0.066 0.005 �0.022 �0.014 �0.006 �0.056 �0.053 �0.002
COM positions are in meters. ‘‘Tail reconstructions’’ are: Standard ¼ tail shape represented as simple ellipse; Informed ¼tail shape deformed from ‘‘hoop’’ method (Figs. 3, 6, and 7). ‘‘Real’’ COM is from straightened, detailed models in Fig. 1C,D,but with actual air spaces (from CT scans; as in Fig. 1E) included. The ‘‘estimated/actual mass’’ column gives % differenceof mean model value [(max þ min)/2 from below] from actual body masses in Table 1; 100% ¼ identical. ‘‘Estimated’’ COMis for simplified models (e.g., Fig. 1F–H); ‘‘max’’ and ‘‘min’’ columns are for maximal (þ20%) and minimal body outlines;‘‘diff ’’ column is mean model value [(max þ min)/2] minus ‘‘real COM’’ from section earlier.
CENTER OF MASS VARIATIONS 1449

accordingly. We address this point further below byexamining effects on COM by including realistic airspaces in the crocodile models.
We also assessed the effects on body mass estimatesfrom assuming a homogeneous 1000 kg m�3 density forthe birds, finding that our method uniformly overesti-mated the actual masses by only 3%–5% for broilerchickens and 10%–12% for junglefowl (Table 1), worsen-
ing with growth. Thus, the actual mean densities of thebirds were closer to 950 and 900 kg m�3; unlike in thecrocodiles there was no appreciable change of mean den-sity across the two ontogenetic series. Again, as COMpositions may be affected by our omission of air spacesin these models, we examine the influence of cavity vol-umes on COM positions further below.
Variation Within Chicken Cohorts
Body mass estimates varied similarly to or slightlyhigher than actual body masses (SD values in Table 1).Estimated COM positions varied appreciably withineach group of chickens examined (Table 3). Standarddeviations were moderately high in some cases, presum-ably due to the low sample sizes (5–10) and variablelimb/body poses during CT scanning (Fig. 2). In themedial (z) direction, this variation was relatively thehighest (standard deviations averaging 35% of the meanvalues), followed by cranial (x) at 14% and ventral (y) at13% standard deviations/mean value. In all cases, themethod we used to normalize these COM data for com-parison had negligible effects on this variation.
Variation Between Chicken Cohorts
The moderate COM variation within our cohort sam-ples complicated statistical analysis of differencesbetween them (Table 3), but nonetheless the juvenilejunglefowl had significantly more caudally positionedwhole body COMs (mean 38% femur length cranial tothe right hip) compared with the other cohorts (mean
Fig. 3. Procedure for digitally removing chicken limbs to estimatethe trunk center of mass (refer Methods and Table 3 for furtherdetails). A ‘‘mature’’ broiler chicken is shown in dorsal view (yellow ¼trunk; purple ¼ removed pelvic limbs), with flesh translucent and skel-eton (for reference) more opaque. Not to scale.
Fig. 4. Tail deformation method to examine the extents of bodyoutline beyond skeletal landmarks, shown for a proximal cross-sectionof a juvenile Crocodylus tail. An initial octagonal hoop (inner one) is fit-ted to the neural spine, transverse processes and chevron (gray inte-rior shape; green points). The hoop is then scaled (red arrows, fromgreen points to blue points on outer hoop) to approximate the fleshyoutline (magenta irregular shape) as a larger outer hoop (labeled‘‘HOOP’’). The required deformations from smaller (skeletal) to larger(fleshy) hoops are thus recorded (e.g., 1.7 � mediolateral deformationshown). Not to scale.
1450 ALLEN, PAXTON, AND HUTCHINSON

Fig. 5. Junglefowl inflation method to examine the effects of airspace geometry on center of mass positions for Table 4. A,B: Rightlateral views of adult junglefowl model in ‘‘lifelike’’ pose with minimally(A) and maximally (B) inflated air spaces. Blue interior objects repre-sent the air spaces. The flesh and feathers are rendered transparent(in yellow) and the skeleton is opaque (in orange; for reference only,not used for estimating inertial properties). C,D: Right lateral and rightoblique views of ‘‘straightened, detailed’’ model of same specimen,
showing how limbs were extended into the reference pose. E,F: Rightoblique views of ‘‘max caudal’’ (E) and ‘‘max cranial’’ (F) simplifiedmodels (using the octagonal hoop deformation method as in Fig. 1E),showing how body shape was deformed by biasing mass distributioncaudally/cranially (refer Methods), to bound ranges of inertial propertyvalues (Table 4). Not to scale; scaled to same total length in each pairof images.
CENTER OF MASS VARIATIONS 1451

54% femur length cranial to the right hip). Additionally,the juvenile broilers had significantly more dorsal wholebody COM positions (mean 40% femur length) exceptcompared with adult junglefowl (mean 47% femurlength). The other cohorts had a collective mean of 52%femur length and neither one was statistically similar tothe former two or different from each other. There wereno observed significant differences between mediolateralwhole body COM positions of any cohorts. Any actualsignificance may have been obscured by the variationnoted earlier.
Ontogenetic Variation
The models of juvenile and adult crocodiles (Table 2)suggest that the COM shifts craniodorsally (whenexpressed in terms of femur lengths) across ontogeny inC. johnstoni. The shift was most striking in the cranialdirection, changing from 92% to 120% femur lengths(þ28%) with a 1,189% change of body mass. The changesof COM position dorsally and medially were smaller(�10% of femur length). Substantial error was intro-duced by the more abducted (dorsal) posture of the limbswhen scanned (Fig. 1A,B). Table 2 shows that the origi-nally scanned pose had COM positions that were 52%–167% of the straightened reference pose COMs. In addi-tion, the relatively shorter femur in the adult compli-cates the usage of femur length for normalizing COMpositions. Nonetheless, the observed ontogenetic differ-ences between the original and straightened models arepreserved when trunk (body sans limbs) COM valuesare compared as well (Table 2). Therefore, the majorontogenetic changes of COM are caused less by limbdimensions or positions than by trunk shape.
For the birds (Table 3), the broiler chickens exhibiteda caudoventral shift of the whole body COM from juve-nile to mature individuals, but interestingly the jungle-fowl showed an opposite shift: craniodorsally fromjuvenile to adult. As earlier, other errors in the analysissuch as body segment orientation during scanning andbody proportions may cause inaccuracies in our quanti-tative estimates; we examine these further below.
Variation Due to Methodology
Human error in estimating whole body COM positionswas assessed by resegmenting and re-estimating bodymass and COM values for the same five mature broilerchickens, starting from the same raw CT scan data. Thesame operator did all of these procedures. Repeated esti-mates of body mass were underestimated by a mean of�0.099 kg from original values (range, �0.005 to�0.266; SD 0.105 kg) or on average only 2.9% of bodymass. Estimated COM positions were 46 � 7.1, 53 � 5.6,and 40 � 5.0 percent of femur length in the cranial, ven-tral, and medial directions (mean � SD) for this secondmeasurement, compared with 50 � 8.6, 53 � 7.2, and 35� 7.5 percent femur length for the first measurements(Table 3). Repeated measures P values for these COMpositions were 0.420, 0.909, and 0.254, respectively, sothis variation was not significant.
Increasing resolution (reducing slice thickness) forrepresentative mature broiler chicken and adult jungle-fowl models had small effects on body mass and wholebody COM values. After repositioning the specimen and
scanning at higher resolution, body mass was overesti-mated by 0.090 kg (þ3.3% cf. with the first scan, whichitself overestimated the real body mass by 2.9%). Thebroiler COM values were 8% more medial, 5% more ven-tral, and only 83% as cranial (percentages relative to fe-mur length) as in the lower-resolution scan. Withoutspecimen repositioning, at higher resolution the jungle-fowl specimen mass was again overestimated by 0.133kg (þ7.1% cf. with the first scan, which itself overesti-mated the real body mass by 7.9%). However, its COMvalues (normalized by femur length) as expected faredbetter than for the broiler: 93% as medial and ventral,and 100% as cranial as in the lower-resolution scan.Overall, variation due to scan resolution appeared con-siderably smaller than errors introduced by segmentingthe CT scan data or especially repositioning thespecimen.
As noted earlier, specimen pose also had large effectson crocodylian COM estimates medially and especiallycranially (Table 2)—overestimating cranial COM posi-tion by 33% (1.6/1.2 femur lengths) in the adult, andunderestimating it by 60% (0.55/0.92 femur lengths) inthe juvenile crocodile. Dorsoventral COM position wasunaffected.
We found that it did not matter which frame of refer-ence (normalized by body mass0.33, femur length, pelviclimb length, or body length) was used for the chickenmodels; the same statistically significant differencesnoted above were found for all four normalization meth-ods (Table 3). We also found that acetabular position asa percentage of body length was consistent (and statisti-cally identical; ANOVA: F ¼ 2.161, P ¼ 0.133) among allcohorts (mean 80 � 1.5% SD), so using the right pelvicjoint as a reference point for all COM normalizationmethods involves an assumption (constant relative posi-tion of the right acetabulum) validated here.
Digital removal of the pelvic limbs to estimate trunk(body sans hindlimbs and associated muscles) COM posi-tions for chickens showed interesting differences fromthe analyses focusing on whole body COMs (Table 3).Statistically significant differences were found along thecraniocaudal axis (juvenile broiler COMs were positionedmore cranially than in mature broilers: mean 93% vs.83% femur length; other cohorts were intermediatebetween these values but not statistically different fromeither). Trunk COM ontogenetic shifts thus matchedthose inferred for the whole body COMs (above; same asfor the crocodiles in Table 2). No statistically significantdorsoventral differences were found. Mediolateral COMpositions were significantly different between juvenilebroilers and juvenile junglefowl (38% vs. 48% femurlength; broiler trunk COMs apparently more medialbecause their pelvic widths are larger, moving the ace-tabular reference point laterally).
Variation Due to Air Space Geometryand Other Factors
Body masses for the inflated junglefowl modelimproved their match to the actual measured mass ofthe cadaver with increasing air space inflation (Table 4),from a 31% overestimate without air spaces (for thisspecimen, higher than the 12% average error in Table 1for other individuals), to only a 3% overestimate withmaximal inflation. Note that body shape did not change
1452 ALLEN, PAXTON, AND HUTCHINSON
with inflation in our models; only air space volume waschanged, which explains why estimated mass decreased.The 31% mass estimate error raises concern for accu-rately estimating masses of extinct animals and usingthose estimates in higher-level inferences such as loco-motion or metabolism. This concern is reinforced byother models with straightened limbs and varied bodyshapes; 29%–50% mass estimation errors are common(Table 4). The best match with the actual body mass wasobtained using the ‘‘maximal inflation’’ model (3%overestimate).
While our comparisons show that we overestimatedmass and density for the specimens studied (Table 1;also see earlier), how much do air space dimensions alterthe COM positions? For a junglefowl with air spacesranging from absent to deflated and maximally inflated,posed in a ‘‘lifelike’’ body segment orientation (Fig.5A,B), we found that the COM shifts cranioventrallywith larger air spaces, and the effects of air space geom-etry are generally larger in the ventral direction thancranially in chickens.
Yet how much of these differences were due to differ-ent body segment positions rather than air space dimen-sions? To investigate this, we first reposed the modelinto a ‘‘straightened, detailed’’ version including‘‘relaxed’’ air spaces (Table 4, fourth model; Fig. 5C,D)that was in a vertically legged reference pose (referMethods). We then also removed the cavities from thismodel. In the latter model, the COM moved only 4% cau-dally and 10% dorsally, showing that the cavities alonehave small effects on COM positions. In contrast, thealterations of body pose between the straightened modeland the original, recumbently posed model (Fig. 2) hadalmost an order of magnitude greater influence on bodyCOMs than cavities did (‘‘diff ’’ column in Table 4). Thesedifferences ranged from 172% to 184% as cranial and41% to 57% as dorsal (in absolute values) compared withthe original recumbent scanned pose (Table 3), versus128% and 101% as cranial and dorsal for the ‘‘straight-ened, detailed’’ model versus the original recumbentpose. Thus, body segment orientation alone can cause�50%–80% differences in the chicken COM positions,and accounts for most of the COM differences in Table 4.However, there seemed to be a tradeoff between accu-rately estimating mass and COM. The ‘‘straightened,detailed’’ model overestimated mass by 29%, or 48%without cavities, which accounts for most of the massestimation differences in Table 4.
This variance can be greater than the effects of repre-senting the real, detailed anatomy by simple (but plausi-ble) geometry. This step approximates the errorsimposed by an unknown relationship of fleshy to skeletaldimensions that confounds mass and COM estimates forextinct taxa (refer Methods). Compared to the ‘‘straight-ened, detailed’’ model (Fig. 5C,D), simplified models withextreme body dimensions that were biased toward cau-dal (Fig. 5E) or cranial (Fig. 5F) COM positions intro-duced differences in COM positions that ranged from�31 to þ40% (‘‘ratio’’ column in Table 4). Thus, the stepof moving from an anatomically realistic model to a sim-plified representation, even in the best cases whereanatomy is well known, can have more influence (<40%)on COM positions than the effects of air space geometry(<10%), but sometimes less influence than body segmentorientations (�50%–80%). Mass estimation errors were
comparable to the other models; 25%–50%. Again therewas a tradeoff—simplified models that matched the‘‘straightened, detailed’’ model COM values more closelymatched the actual mass less closely.
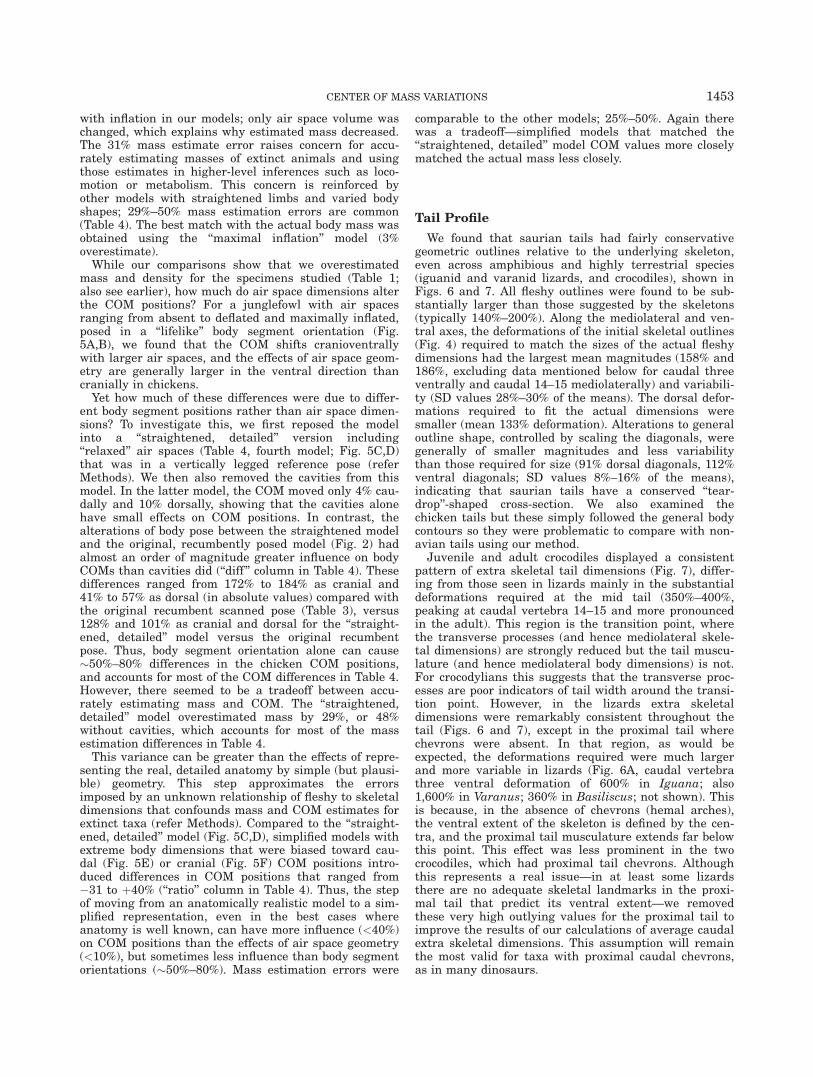
Tail Profile
We found that saurian tails had fairly conservativegeometric outlines relative to the underlying skeleton,even across amphibious and highly terrestrial species(iguanid and varanid lizards, and crocodiles), shown inFigs. 6 and 7. All fleshy outlines were found to be sub-stantially larger than those suggested by the skeletons(typically 140%–200%). Along the mediolateral and ven-tral axes, the deformations of the initial skeletal outlines(Fig. 4) required to match the sizes of the actual fleshydimensions had the largest mean magnitudes (158% and186%, excluding data mentioned below for caudal threeventrally and caudal 14–15 mediolaterally) and variabili-ty (SD values 28%–30% of the means). The dorsal defor-mations required to fit the actual dimensions weresmaller (mean 133% deformation). Alterations to generaloutline shape, controlled by scaling the diagonals, weregenerally of smaller magnitudes and less variabilitythan those required for size (91% dorsal diagonals, 112%ventral diagonals; SD values 8%–16% of the means),indicating that saurian tails have a conserved ‘‘tear-drop’’-shaped cross-section. We also examined thechicken tails but these simply followed the general bodycontours so they were problematic to compare with non-avian tails using our method.
Juvenile and adult crocodiles displayed a consistentpattern of extra skeletal tail dimensions (Fig. 7), differ-ing from those seen in lizards mainly in the substantialdeformations required at the mid tail (350%–400%,peaking at caudal vertebra 14–15 and more pronouncedin the adult). This region is the transition point, wherethe transverse processes (and hence mediolateral skele-tal dimensions) are strongly reduced but the tail muscu-lature (and hence mediolateral body dimensions) is not.For crocodylians this suggests that the transverse proc-esses are poor indicators of tail width around the transi-tion point. However, in the lizards extra skeletaldimensions were remarkably consistent throughout thetail (Figs. 6 and 7), except in the proximal tail wherechevrons were absent. In that region, as would beexpected, the deformations required were much largerand more variable in lizards (Fig. 6A, caudal vertebrathree ventral deformation of 600% in Iguana; also1,600% in Varanus; 360% in Basiliscus; not shown). Thisis because, in the absence of chevrons (hemal arches),the ventral extent of the skeleton is defined by the cen-tra, and the proximal tail musculature extends far belowthis point. This effect was less prominent in the twocrocodiles, which had proximal tail chevrons. Althoughthis represents a real issue—in at least some lizardsthere are no adequate skeletal landmarks in the proxi-mal tail that predict its ventral extent—we removedthese very high outlying values for the proximal tail toimprove the results of our calculations of average caudalextra skeletal dimensions. This assumption will remainthe most valid for taxa with proximal caudal chevrons,as in many dinosaurs.
CENTER OF MASS VARIATIONS 1453

Effects of Tail Dimensions onInertial Properties
We compared our best crocodylian models, with the mostrealistic body (including tail) outlines and internal air spaceanatomy (Table 5: ‘‘real’’ COM columns; Fig. 1C,D; airspaces in E), to simpler estimation procedures (Table 5: bot-tom section; Fig. 1F–H). These simpler models began withskeletal anatomy alone (Fig. 1F) and reconstructed sur-rounding soft tissues simply from these landmarks (as forthe junglefowl in Table 4 and Fig. 5). Two sets of maximaland minimal volumetric models of each crocodile were cre-ated. The first set used standard assumptions to recreatethe tail (Fig. 4; elliptical cross sections fitted to skeletaldimensions for minimal volume, then plus 20% for maximalvolume). The second set used the mean values (for the non-avian saurians, excluding artefacts noted earlier: 158%
mediolaterally, 133% dorsally, 186% ventrally, 91% dorsaldiagonally, and 112% ventral diagonally) for extra skeletalsize and shape calculated from extant tail profiles (Figs. 4,6, and 7),�20% for maximal andminimal volumes.
The most detailed and realistic ‘‘informed’’ modelsclosely approximated body mass (only 1% underesti-mate), whereas the ‘‘standard’’ elliptical tail modelsunderestimated mass by 13%–14%. The informed modelsthus were a substantial improvement over the 5%–16%initial mass overestimates (Table 1), whereas the stand-ard models changed the error to an underestimate butdid not greatly reduce its magnitude.
Our COM estimates fared relatively worse in thestandard versus informed tail models. In the juvenilecrocodile, the standard model positioned the body COMa mean of 4 cm too far cranially (an error of 85%), whichimproved to 1.2 cm too far cranially (26% overestimate)with the informed model. The adult crocodile modelsimproved even more substantially, from mean cranialoverestimates of 5.9 cm (50%) to 0.5 cm (4%). For bothspecimens, ventral and medial COM estimates changedonly trivially if at all (Table 5). Taking the mean of ‘‘min-imal’’ and ‘‘maximal’’ models seemed to give the closestoverall match to the ‘‘real’’ COMs, especially cranially.Overall, we found that assumptions about tail shapealone can cause large (here 50%–85%) errors that can beimproved considerably (here reduced to 4%–26%) withour ‘‘informed’’ tail deformation method that takes intoaccount typical saurian tail dimensions.
Fig. 7. Tail profiles for all five non-avian saurian taxa examined.Graph of octagonal ‘‘hoop’’ deformations required, starting from skele-tal shape alone, along the mediolateral axis (as in Figs. 4 and 6) tomatch the body outline (y-axis), plotted against caudal vertebra num-ber (x-axis; for every caudal segment). Note the increase of deforma-tions required at the transition point (�caudal 15) in the crocodiles.Data terminate where the plot reaches a plateau that continues to thedistal end of the tail; for simplicity the entire tail is not shown. Theseresults imply that non-avian saurian tail shapes are fairly conservative,which can be used to inform estimates of tail shape and inertial prop-erties in extinct saurians.
Fig. 6. Tail deformation results for a representative saurian tail(adult Iguana iguana). A, Graph of deformation required along axesshown in Fig. 4, versus caudal vertebra number (plotted for everyeven-numbered caudal vertebra segment). B, Approximate shapes ofoctagonal hoops to represent the caudal skeleton (light gray) anddeformed octagonal hoops to represent the extra skeletal body outline(dark blue) corresponding to positions along the x-axis in A. C, Seg-mented CT scan data for the same specimen (in left lateral view), ori-ented to roughly match A and B; flesh in black and skeleton in pink.Not to scale. Data terminate where the plot reaches a plateau thatcontinues to the distal end of the tail; for simplicity the entire tail is notshown.
1454 ALLEN, PAXTON, AND HUTCHINSON

DISCUSSIONHow Much Biological Variation of COMValues is Expected?
With our method, COM variation within chickencohorts was moderately high (�35%) along the mediolat-eral axis and smaller (13%–14%) along other axes. Wejudge this variation to be largely due to variability oflimb/body orientation during scanning (Figs. 2 and 5; Ta-ble 4) rather than intrapopulational variation, which isdifficult to measure without larger sample sizes andhighly consistent methods of measuring COM. Overall,the poses we used were adequate and allowed for funda-mental differences between cohorts to be found. Broilershave more dorsal and cranial COM positions than jun-glefowl, which we ascribe mainly to their shorter, lighterpelvic limbs and larger pectoral muscles (pers. obs.). Themore cranial COM positions would require morecrouched limb poses and potentially increased joint andmuscle moments, which deserve deeper investigation inlight of domestic chicken health and welfare. In contrast,the more caudal COM position in junglefowl helps tomaintain their proficiency in bipedal running (Hutchin-son, 2004; Clemente et al., 2008). How the differences indorsoventral COM position factor into this or the rela-tive inclination of the main body axis (Hutchinson et al.,2007) remains to be seen.
Although we found that any frame of reference fornormalizing COM values gives similar results, usingtrunk COM removes some of these problems of posturalvariation and reinforces the validity of the whole bodyCOM differences found (Tables 2 and 3). However, ourchicken cohorts had similar gross body morphology, andthus it may not be surprising that all normalizing meth-ods gave similar results. For studies involving taxa ofwidely different body shapes, such as large dinosaurianclades, we urge that multiple normalizing methods beapplied. Perceived differences or similarities of COM val-ues among taxa may be due to independent variation ofthe normalizing factors used (e.g., allometry of body orfemur length with body size) or the reference point usedto express COM location (e.g., shifts of the acetabularposition along the body axis). For example, our jungle-fowl ‘‘straightened, detailed’’ model (Table 4) has a cra-nial body COM position relative to femur length (0.74)over half that of the juvenile (0.92) and adult (1.2) croco-dile models (Table 2). Yet usage of trunk COM givesquite different results (0.54, 1.6, and 1.94 femur lengths,respectively), as does usage of the ‘‘lifelike’’ (Fig. 5A,B;Table 4) pose for the junglefowl (1.0 femur lengths).
Similarly, the large ontogenetic change of COM posi-tions inferred for Crocodylus partly depends on ourusage of femur lengths to normalize them, although ourfindings still have relevance for understanding ecologicalshifts in crocodylians. The relative reduction of the limbsand relative craniodorsal shift of COM during ontogenyinferred probably applies to most crocodylians, judgingfrom morphometric data (e.g., Dodson, 1975; Webb andMessell, 1978). This change, along with body densityincreases, should cause relative increases of loading onpelvic limb joints and muscles (Hutchinson, 2004), andthus could help to explain the decline of bounding (andgalloping) capacity with increasing size in crocodylians(e.g., Cott, 1961; Zug, 1974). Similar ontogenetic shifts ofCOM influencing locomotor mechanics have been
inferred for other dinosaurs, such as the small ornithi-schian Dryosaurus (Heinrich et al., 1993) and the earlysauropodomorph Massospondylus (Reisz et al., 2005).
Likewise, the ontogenetic changes in chicken COMswe found vary among cohorts—broiler chicken COMsshift caudodorsally, whereas Manion (1984) found thatin white leghorn domestic chickens the COM shifts cra-nioventrally. Although on phylogenetic grounds it istempting to infer that the craniodorsal COM shift inboth Crocodylus and junglefowl is a shared archosauriancharacteristic (archosaurian limbs often get relativelyshorter while heads get more robust during growth, e.g.,Bybee et al., 2006; this should draw the COM craniodor-sally), this demands broader taxonomic investigation.This caution is reinforced by the wide phylogenetic dis-tance between the two extant clades, the small samplesizes (especially for crocodiles), and the considerable var-iation in domestic chickens despite only moderate evolu-tionary morphological changes, compared with drasticmorphological changes in extinct dinosaurs.
How Much Methodological Error forMass and COM is Expected?
We have found that anatomically accurate models canestimate body mass with a reasonable margin of error(e.g., 1% under- to 16% overestimate for crocodiles, withchickens falling inside this range). This error is largely,as expected, due to inappropriate assumptions aboutdensity, including air spaces (especially for birds), aswell as ontogenetic changes and tail shape (especiallyfor crocodiles). However, these density effects are gener-ally stronger on body mass than on COM positions. Asmost air spaces, especially the lungs, lie close to theCOM, air space geometry has little effect on COM values(e.g., Table 4; also Henderson, 2003; Hutchinson et al.,2007; Bates et al., 2009). We found body mass estimatesnonetheless to be repeatable (�3% variation). Judgingfrom similar variation found for different CT resolutionsettings, this variation is probably largely due to humanerror in segmenting CT scan data rather than poorimage resolution of anatomy.
The main concern for estimations of body mass inextinct taxa, however, is properly estimating body den-sity (�10%–15% source of error). If juvenile crocodilesand adult birds are a reliable guide (Table 1), mean den-sities of �860–894 kg m�3 are good starting assumptions(although it is surprising that juvenile crocodiles can beless dense than chickens). That density range comparesfavorably to values for an ostrich carcass (888 kg m�3)and ranges of estimates for models of Tyrannosaurus(787–894 kg m�3) from Hutchinson et al. (2007). ‘‘Bestestimates’’ by Bates et al. (2009; Tables 1–6) for a wholeostrich were similar (857 kg m�3), but curiously aver-aged slightly higher for various dinosaurs, around 900–940 kg m�3 (sensitivity analysis in their Table 7: 866–947 kg m�3).
Density estimates might be improved by carefullymodeling detailed air space anatomy and entering spe-cific values for tissue densities within segments (e.g.,fat, muscle, bone, cartilage). Yet we see this as certain tointroduce more assumptions (each of which must be var-ied for extinct taxa) but not certain to appreciably con-strain the probable density range. Hence it wouldquickly become more of a technical distraction than a
CENTER OF MASS VARIATIONS 1455

rigorous methodological improvement. Considering thesmall effects of density on COM values, we see littlevalue in pursuing that approach, easy as it would be todo so with modern imaging technology (e.g., Mungioleand Martin, 1990; Wei and Jensen, 1995; Wicke et al.,2008).
We have shown that computational methods for esti-mating COM positions are fairly repeatable and withsufficient geometric resolution can give reliable results(within �5%–8% total variation). These errors are addi-tive to the errors noted above for limb and body (includ-ing head/neck) orientation, which we urge must bestandardized carefully in any comparative studies ofCOM—an important omission from previous studiessuch as Bates et al. (2009). This point is demonstratedby our models of recumbent (Fig. 2, Table 3) versusmore upright (approximating standing; Fig. 5, Table 4)junglefowl. With these changes of limb (and head/neck)orientation alone, COM values shifted cranially þ28%–72%, and ventrally �59% to dorsally þ1% (Table 4:‘‘diff ’’ columns).
As almost all methods for estimating COM even forextant taxa involve some error in image resolution,repeatability and body segment orientation, we cautionthat �10%–15% error in COM estimates is a ‘‘best case’’scenario for most methods. Some errors in our COM esti-mates, using an approach identical to that used to esti-mate COM for extinct taxa, even approached orexceeded 50% (Tables 4 and 5). Even force platform mea-surement of COM during standing in vivo, which mightbe the ‘‘gold standard’’ approach, involves photogram-metric errors and individual variation (in standing limbposes) that are likely to be of similar 10%–15% totalmagnitudes.
Where known experimental values have been com-pared with modeling/regression estimates for the samesubjects in other studies, COM values, like masses, gen-erally have been accurately estimated (within �10%). Incontrast, 10%–40% errors in inertia values are notuncommon (Hatze, 1980; van den Bogert et al., 1989;Sarfaty and Ladin, 1993; Baca, 1996; Norton et al.,2002), and 20%–80% errors are common when estimat-ing inertial properties for individual subjects from groupregressions (e.g., Challis, 1999). The influences of errorsin COM and other inertial properties on biomechanical
analyses vary widely (Jensen, 1989; Krabbe et al., 1997;Pearsall and Costigan, 1999; Dellanini et al., 2003; Raoet al., 2006; Reinbolt et al., 2007), but naturally aregreatest for larger, more proximal segments. Thus allstudies using COM values as input properties shouldminimally consider 10%, and for extinct animals �50%,potential total error (e.g., Hutchinson et al., 2007).
Tail Dimensions as a Major Componentof COM Error
Structures most cranial and caudal to the body COMwill influence its position the most. Head dimensions,however, can be well-constrained by skull geometry(pers. obs., this study and Hutchinson et al., 2007), andthe head is generally lower in density and mass thanthe tail (except in crown group birds and their relatives).As Motani (2001) suggested, assumptions about tailshape can greatly influence COM (and other inertialproperty) values, biasing them toward inaccuratecraniad values. We found that indeed non-avian sauriantails deviated appreciably (90% to >>200%) from ellipti-cal shapes suggested by skeletal landmarks, and hadmajor effects on COM estimates (Table 5). We thereforesuggest that, for non-avian saurian taxa with unreducedtails, including extinct dinosaurs, these mean values fortail deformations are a good initial assumption groundedin phylogenetic optimization and quantitative empiricaldata, and should lead to considerably improved esti-mates of body or tail segment mass and particularlyCOM. To test the effects of this procedure, we next trythis method on a well-studied dinosaur, Tyrannosaurus.
Estimation of Inertial Propertiesfor an Extinct Dinosaur
Finally, we test our revised understanding of factorsinfluencing the accuracy of inertial property estimationby revisiting the estimated mass and COM of an adultTyrannosaurus rex (Dinosauria: Theropoda), as inHutchinson et al. (2007). We applied the same octagonalhoop-based body shape estimation as in Table 5, includ-ing the ‘‘informed’’ tail shape, and air space geometry(also Figs. 1F–H, 4, 6, and 7). Table 6 shows the resultsfor different models with extreme cranial, caudal, dorsal,
TABLE 6. Center of mass methods applied to Tyrannosaurus rex
COM (m) COM (femur lengths)
T. rex modelCOM
cranial (x)COM
ventral (y)Cranialdiff (%)
ventraldiff (%)
COMcranial (x)
COMventral (y)
Cranialdiff (%)
Ventraldiff (%)
Bodymass (kg)
Massdiff (%)
Original (#1) 0.599 �0.289 115 104 0.49 �0.24 115 104 5450 83Best guess (#30) 0.519 �0.279 100 100 0.43 �0.23 100 100 6583 100Max cranial 0.785 �0.283 151 101 0.64 �0.23 151 101 8205 125Max caudal 0.133 �0.344 26 123 0.11 �0.28 26 123 6773 103Max dorsal 0.524 �0.258 101 92 0.43 �0.21 101 92 8973 136Max ventral 0.424 �0.324 82 116 0.35 �0.27 82 116 6009 91Mean 0.459 �0.291 88 104 0.38 �0.24 88 104 7593 115
Original (#1; minimally ‘‘skinny’’ model) and ‘‘best guess’’ (#30; tail enlarged 21%, rest of body 10%) models are from Hutch-inson et al. (2007). The remaining models used the skeletal landmarks from that study and the octagonal hoop deformationmethod and ‘‘informed’’ tail shape (as in Table 5; also Figs. 4, 6, 7 and refer Methods) from this study. Differences (‘‘diff ’’columns) between the best guess model and all other models are shown for absolute and normalized COM positions, andfor body mass; 100% ¼ identical values.
1456 ALLEN, PAXTON, AND HUTCHINSON

and ventral mass distributions, and Fig. 8 shows thefive resulting models. The mean of these improved mod-els compares favorably in COM positions with the ‘‘bestguess’’ improved model of Hutchinson et al. (2007; 88%as cranial and 104% as ventral), but with a 15% largerbody mass. It is further from the values for the original‘‘skinny’’ model, which had a tail shape based upon astandard elliptical cross-section.
These revised models support the inference that theCOM of Tyrannosaurus was further caudally positionedand it had a slightly larger body mass (>6,500 kg oreven >8,000 kg) than previously assumed. Application ofthe methods suggested here to other dinosaur models(e.g., Bates et al., 2009) should have similar effects. AsMotani (2001) cautioned, unsupported assumptionsabout tail and other body segment shapes are a majorcause of these errors. However, as these estimates gener-ally lie within the bounds of those considered by Hutch-inson et al. (2007) they do not appreciably alter theirconclusions about turning or running mechanics, but dorefine them.
CONCLUSIONS
To date, studies estimating COM (and body mass) forextinct animals have only been weakly validated byapplying the same techniques to living animals (oftenwith no knowledge of actual masses or COMs for indi-viduals) and examining the individual variation/errorsources introduced. Our analysis of these factors identi-fies the major problems in, and provides decent valida-tion for, computational techniques for estimating inertialproperties. Expected variation and errors of at least10%–15% for mass and 10%–50% for COM should beexamined; inertia values depend on these and other fac-
tors, and are thus anticipated to have slightly highervariation. An error of 10% in a best case situation prob-ably poses minimal problems for modeling locomotor bio-mechanics, for example in extant taxa, so this method iswell-validated for these applications where body dimen-sions can be obtained directly from scans of cadavers.We have suggested density values and a simple ‘‘octago-nal hoop’’-based deformation method that improves esti-mates of body segment dimensions, especially for thetail, that can be used in computational models of extantand extinct archosaurs. However, ontogenetic stages,body segment orientations, and frames of referenceto normalize COM values for comparisons need cautiousmethodological control for all studies. Thoroughlyconsidering these factors can potentially minimizeerrors and lead to better-constrained paleobiologicalconclusions.
ACKNOWLEDGEMENTS
The authors thank the BBSRC for grants BB/C516844/1 and BB/F01169/1 to J.R.H that enabled thisresearch. They also thank the Department of VeterinaryBasic Sciences at The Royal Veterinary College for sup-port. Vivian Allen’s research was partly supported by aSam and Doris Welles award from the University of Cal-ifornia, Museum of Paleontology. Heather Paxton’sresearch was supported by a CASE Industrial Student-ship from the BBSRC, sponsored by Cobb-Vantress Inc.They appreciate the influence of fellow members of theStructure and Motion Laboratory, Stanford University’sNeuromuscular Biomechanics Laboratory, and PadianLab at the University of California. Martin Baker, San-dra Corr, Peter Dodson, Alexis Wiktorowicz Conroy, andtwo anonymous reviewers are thanked for their
Fig. 8. Revised models of Tyrannosaurus rex following the methodsdeveloped here to estimate the inertial properties (Table 6), and usingthe skeletal dimensions from Hutchinson et al. (2007) from which todeform overlaid octagonal hoops that represent fleshy body outlines.Center: mean model with only moderate deformations. Maximal dorsal
and ventral COM positions induced by 20% deformations beyond theinitial shape are above and below, respectively, and maximal cranialand caudal COM positions are left and right, respectively. Not toscale; scaled to same total length.
CENTER OF MASS VARIATIONS 1457

constructive feedback on earlier drafts of this manu-script. Allan Ball and Roy Mutimer are thanked foraccess to Cobb 500 broiler chickens, and Nick Anthonyis heartily thanked for provision of the junglefowl. Theauthors thank David Gower, Kent Vliet, and DavidKledzik for finding lizard and crocodile specimens fortheir usage and Larry Witmer for the use of his labora-tory and access to CT imaging for the crocodiles. Finally,they thank Victor Ng-Thow-Hing of Honda ResearchLaboratory for technical assistance with the inertialproperties estimation software.
LITERATURE CITED
Alexander RMcN. 1985. Mechanics of posture and gait of some largedinosaurs. Zool J Linn Soc 83:1–25.
Baca A. 1996. Precise determination of anthropometric dimensionsby means of image processing methods for estimating humanbody segment parameter values. J Biomech 29:563–567.
Bates KT, Manning PL, Hodgetts D, Sellers WI. 2009. Estimatingmass properties of dinosaurs using laser scanning and 3D com-puter modelling. PLoS One 4:e4532. DOI:10.1371/journal. pone.0004532.
Buchner HHF, Savelberg HHCM, Schamhardt HC, Barneveld A.1997. Inertial properties of Dutch warmblood horses. J Biomech30:653–658.
Bybee PJ, Lee AH, Lamm E-T. 2006. Sizing the Jurassic theropodAllosaurus: assessing growth strategy and evolution of ontoge-netic scaling of limbs. J Morphol 267:347–359.
Carrier DR, Walter RM, Lee DV. 2001. Influence of rotational iner-tia on turning performance of theropod dinsosaurs: clues fromhumans with increased rotational inertia. J Exp Biol 204:3717–3926.
Cavagna GA, Heglund NC, Taylor CR. 1977. Mechanical work interrestrial locomotion: two basic mechanisms for minimizingenergy expenditure. Am J Physiol 233:R243–R261.
Challis JH. 1999. Precision of the estimation of human limb inertialparameters. J Appl Biomech 15:418–428.
Christiansen P, Bonde N. 2002. Limb proportions and avian terres-trial locomotion. J Ornithol 143:356–371.
Clemente CJ, Withers PC, Thompson G, Lloyd D. 2008. Why gobipedal? Locomotion and morphology in Australian agamid liz-ards. J Exp Biol 211:2058–2065.
Cott HB. 1961. Scientific results of an inquiry into the ecology andeconomic status of the Nile crocodile (Crocodylus niloticus) inUganda and Northern Rhodesia. Trans Zool Soc London 29:211–358.
Crompton RH, Li Y, Alexander RMcN, Wang W, Gunther MM.1996. Segment inertial properties of primates: new techniques forlaboratory and field studies of locomotion. Am J Phys Anthropol99:547–570.
de Leva P. 1996. Adjustments to Zatsiorsky-Seluyanov’s segment in-ertial parameters. J Biomech 29:1223–1230.
Dellanini L, Hawkins D, Martin RB, Stover S. 2003. An investiga-tion of the interactions between lower-limb bone morphology, limbinertial properties and limb dynamics. J Biomech 36:913–919.
Dempster WT, Gaughran GRL. 1967. Properties of body segmentsbased on size and weight. Am J Anat 120:33–54.
Dodson P. 1975. Functional and ecological significance of relativegrowth in Alligator. J Zool 175:315–355.
Dumas R, Cheze L, Verriest J-P. 2007. Adjustments to McConvilleet al. and Young et al. body segment inertial parameters. J Bio-mech 40:543–553.
Fedak MA, Heglund NC, Taylor CR. 1982. Energetics and mechan-ics of terrestrial locomotion. II. Kinetic energy changes of thelimbs and body as a function of speed and body size in birds andmammals. J Exp Biol 79:23–40.
Fumihito A, Miyake T, Sumi S-I, Takada M, Ohno S, Kondo N.1994. One subspecies of the red junglefowl (Gallus gallus gallus)
suffices as the matriarchic ancestor of all domestic breeds. ProcNatl Acad Sci USA 91:12505–12509.
Gauthier JA, Kluge G, Rowe T. 1988. Amniote phylogeny and theimportance of fossils. Cladistics 4:105–209.
Goetz JE, Derrick TR, Pedersen DR, Robinson DA, Conzemius MG,Brown TD. 2008. Hip joint contact force in the emu (Dromaiusnovaehollandiae) during normal level walking. J Biomech 41:770–778.
Gunga HC, Suthau T, Bellmann A, Friedrich A, Schwanebeck T,Stoinski S, Trippel T, Kirsch K, Hellwich O. 2007. Body mass esti-mations for Plateosaurus engelhardti using laser scanning and3D reconstruction methods. Naturwissenschaften 94:623–630.
Hatze H. 1980. A mathematical model for the computational deter-mination of parameter values of anthropometric segments. J Bio-mech 13:833–843.
Heinrich RE, Ruff CB, Weishampel DB. 1993. Femoral ontogenyand locomotor biomechanics of Dryosaurus lettowvorbecki (Dino-sauria, Iguanodontia). Zool J Linn Soc 108:179–196.
Henderson DM. 1999. Estimating the masses and centers of mass ofextinct animals by 3-Dmathematical slicing. Paleobiology 25:88–106.
Henderson DM. 2003. Effects of stomach stones on the buoyancyand equilibrium of a floating crocodilian: a computational analy-sis. Can J Zool 81:1346–1357.
Henderson DM. 2004. Tipsy punters: sauropod dinosaur pneumatic-ity, buoyancy and aquatic habits. Biol Lett 271:180–183.
Henderson DM. 2006. Burly gaits: centers of mass, stability, andthe trackways of sauropod dinosaurs. J Vert Paleont 26:907–921.
Henderson DM, Snively E. 2004. Tyrannosaurus en pointe: allome-try minimized rotational inertia of large theropod dinosaurs. BiolLett 271:S57–S60.
Huang HK, Suarez FR. 1983. Evaluation of cross-sectional geome-try and mass density distributions of humans and laboratory ani-mals using computerized tomography. J Biomech 16:821–832.
Hutchinson JR. 2004. Biomechanical modeling and sensitivity analysisof bipedal running ability. I. Extant taxa. J Morphol 262:421–440.
Hutchinson JR, Ng-Thow-Hing V, Anderson FC. 2007. A 3D interac-tive method for estimating body segmental parameters in ani-mals: application to the turning and running performance ofTyrannosaurus rex. J Theor Biol 246:660–680.
Isler K, Payne RC, Gunther MM, Thorpe SKS, Li Y, Savage R,Crompton R. 2006. Inertial properties of hominoid limb segments.J Anat 209:201–218.
Jensen RK. 1978. Estimation of the biomechanical properties ofthree body types using a photogrammetric method. J Biomech11:349–358.
Jensen RK. 1989. Changes in segment inertia proportions between4 and 20 years. J Biomech 22:529–536.
Jones TD, Farlow JO, Ruben JA, Henderson DM, Hillenius WJ.2000. Cursoriality in bipedal archosaurs. Nature 406:716–718.
Krabbe B, Farkas R, Baumann W. 1997. Influence of inertia onintersegment moments of the lower extremity joints. J Biomech30:517–519.
Lephart SA. 1984. Measuring the inertial parameters of cadaversegments. J Biomech 17:537–543.
Liu Y-P, Wu G-S, Yao Y-G, Miao Y-W, Luikart G, Baig M, Beja-Pe-reira A, Ding Z-L, Palanichamy MG, Zhang Y-P. 2006. Multiplematernal origins of chickens: out of the Asian jungles. Mol Phylo-genet Evol 38:12–19.
Manion BL. 1984. The effects of size and growth on hindlimb locomo-tion in the chicken; Ph.D. Thesis. Chicago: University of Illinois.
Motani R. 2001. Estimating body mass from silhouettes: testing theassumption of elliptical body cross-sections. Paleobiology 27:735–750.
Mungiole M, Martin PE. 1990. Estimating segment inertial proper-ties: comparison of magnetic resonance imaging with existingmethods. J Biomech 23:1039–1046.
Norton J, Donaldson N, Dekker L. 2002. 3D whole body scanning todetermine mass properties of legs. J Biomech 35:81–86.
Pearsall DJ, Costigan PA. 1999. The effect of body segment parame-ter error on gait analysis results. Gait Posture 9:173–183.
Rao G, Amarantini D, Berton E, Favier D. 2006. Influence of bodysegments’ parameters on inverse dynamics solutions during gait.J Biomech 39:1531–1536.
1458 ALLEN, PAXTON, AND HUTCHINSON

Reinbolt JA, Haftka RT, Chmielewski TL, Fregly BJ. 2007. Are patient-specific joint and inertial parameters necessary for accurate inversedynamics analyses of gait? IEEE Trans Biomed Eng 54:782–793.
Reisz RR, Scott D, Sues H-D, Evans DC, Raath MA. 2005. Embryosof an early Jurassic prosauropod dinosaur and their evolutionarysignificance. Science 309:761–764.
Ren L, Hutchinson JR. 2008. The three-dimensional locomotor dy-namics of African (Loxodonta africana) and Asian (Elephas maxi-mus) elephants reveal a smooth gait transition at moderatespeed. J R Soc Interface 5:195–211.
Sarfaty O, Ladin Z. 1993. A video-based system for the estimation ofthe inertial properties of body segments. J Biomech 26:1011–1016.
Snively E, Russell AP. 2007. Craniocervical feeding dynamics ofTyrannosaurus rex. Paleobiology 33:610–638.
Srygley RB, Dudley R. 1993. Correlation of the position of body cen-ter of mass with butterfly escape tactics. J Exp Biol 174:155–166.
van den Bogert AJ, Schamhardt HC, Crowe A. 1989. Simulation ofquadrupedal locomotion using a dynamic rigid body model. J Bio-mech 22:33–41.
Walter RM, Carrier DR. 2002. Scaling of rotational inertia in murinerodents and two species of lizard. J Exp Biol 205:2135–2141.
Webb GJW, Messel H. 1978. Morphometric analysis of Crocodylusporosus from the north coast of Arnhem land, northern Australia.Aust J Zool 26:1–27.
Wei C, Jensen RK. 1995. The application of segment axial densityprofiles to a human body inertia model. J Biomech 28:103–108.
Wicke J, Dumas GA, Costigan PA. 2008. Trunk density profileestimates from dual x-ray absorptiometry. J Biomech 41:861–867.
Yeadon MR. 1990. The simulation of aerial movement—II. Amathematical inertia model of the human body. J Biomech23:67–74.
Zatsiorsky V, Seluyanov V. 1983. The mass and inertia characteris-tics of the main segment of the human body. In: Matsui K,Kobayashi K, editors. Biomechanics VIII-B. Campaign, IL:Human Kinetics Publishers. p 1152–1159.
Zug G. 1974. Crocodilian galloping: an unique gait for reptiles?Copeia 2:550–552.
APPENDIX
TABLE A1. Chicken inertial properties
Subject
Bodymass(kg)
Bodymass
estimate(kg)
Body massestimatewith legsremoved
(kg)
Femurlength(m)
Limblength(m)
Bodylength(m)
Body COMInertial tensor(kg m�2)—bodyCOM coordinates
x y z x y z
Low resolutionJuvenile broiler 1 1.789 1.898 1.330 0.074 0.247 0.365 0.050 0.032 �0.018 0.004 0.013 0.012Juvenile broiler 2 2.031 2.117 1.535 0.066 0.242 0.382 0.046 0.025 �0.030 0.004 0.018 0.015Juvenile broiler 3 1.831 1.925 1.374 0.071 0.244 0.356 0.043 0.027 �0.030 0.004 0.013 0.011Juvenile broiler 4 2.119 2.205 1.624 0.076 0.254 0.373 0.044 0.025 �0.033 0.005 0.017 0.014Juvenile broiler 5 1.972 2.140 1.565 0.071 0.241 0.371 0.040 0.031 �0.025 0.004 0.015 0.013Juvenile broiler 6 1.853 1.881 1.300 0.075 0.247 0.338 0.045 0.027 �0.013 0.004 0.012 0.010Juvenile broiler 7 2.043 2.063 1.511 0.075 0.259 0.361 0.043 0.031 �0.020 0.004 0.015 0.013Juvenile broiler 8 2.086 2.192 1.532 0.073 0.259 0.359 0.045 0.030 �0.026 0.004 0.016 0.014Juvenile broiler 9 1.869 1.853 1.341 0.068 0.238 0.344 0.040 0.027 �0.027 0.004 0.013 0.011Juvenile broiler 10 2.308 2.290 1.615 0.071 0.249 0.375 0.043 0.034 �0.026 0.005 0.019 0.016Mature broiler 1 3.106 3.354 2.430 0.080 0.270 0.39334 0.039 0.042 �0.033 0.009 0.032 0.027Mature broiler 2 2.896 3.107 2.265 0.077 0.268 0.38295 0.032 0.050 �0.025 0.003 0.027 0.023Mature broiler 3 2.578 2.687 1.834 0.081 0.271 0.38474 0.035 0.037 �0.035 0.006 0.019 0.017Mature broiler 4 2.763 2.844 2.003 0.075 0.253 0.41191 0.047 0.037 �0.025 0.007 0.026 0.022Mature broiler 5 2.587 2.626 1.923 0.077 0.260 0.39292 0.042 0.041 �0.019 0.006 0.020 0.023Juvenile junglefowl 1 0.698 0.737 0.531 0.066 0.226 0.305 0.032 0.027 �0.005 0.001 0.004 0.003Juvenile junglefowl 2 0.629 0.748 0.583 0.064 0.219 0.305 0.021 0.036 �0.018 0.001 0.004 0.004Juvenile junglefowl 3 0.523 0.548 0.423 0.061 0.203 0.257 0.015 0.034 �0.002 0.000 0.003 0.003Juvenile junglefowl 4 0.531 0.578 0.448 0.061 0.207 0.274 0.031 0.026 �0.016 0.001 0.002 0.002Juvenile junglefowl 5 0.632 0.703 0.488 0.064 0.215 0.293 0.020 0.035 �0.020 0.001 0.003 0.003Junglefowl 1 1.972 2.145 1.645 0.092 0.318 0.426 0.040 0.044 �0.030 0.004 0.020 0.018Junglefowl 2 2.073 2.550 1.610 0.093 0.328 0.444 0.050 0.046 �0.026 0.004 0.019 0.018Junglefowl 3 2.069 2.283 1.656 0.094 0.330 0.442 0.051 0.034 �0.045 0.004 0.021 0.019Junglefowl 4 1.708 1.851 1.417 0.088 0.321 0.428 0.054 0.044 �0.019 0.003 0.017 0.016Junglefowl 5 1.872 2.019 1.470 0.093 0.331 0.422 0.050 0.046 �0.015 0.004 0.018 0.016
High resolutionMature broiler 4 2.763 2.853 Not
calculated0.075 0.253 0.41191 0.039 0.039 �0.027 0.007 0.027 0.023
Junglefowl 5 1.872 2.005 0.093 0.331 0.422 0.050 0.043 �0.014 0.004 0.018 0.016Repeated measures
Mature broiler 1 3.106 3.088 Notcalculated
0.080 0.270 0.39334 0.039 0.041 �0.031
Mature broiler 2 2.896 2.975 0.077 0.268 0.38295 0.026 0.037 �0.035Mature broiler 3 2.578 2.682 0.081 0.271 0.38474 0.037 0.038 �0.028 Not
calculatedMature broiler 4 2.763 2.785 0.075 0.253 0.41191 0.038 0.044 �0.035Mature broiler 5 2.587 2.594 0.077 0.260 0.39292 0.039 0.045 �0.027
x, cranial; y, ventral; z, medial.
CENTER OF MASS VARIATIONS 1459

TABLE A2. Chicken inertial properties (trunk)
Subject
Trunk COM
Inertial tensor (kg m�2)—trunkCOM coordinates
x y z x y z
Low resolutionJuvenile broiler 1 0.073 0.032 �0.019 0.002 0.008 0.007Juvenile broiler 2 0.071 0.023 �0.028 0.002 0.010 0.009Juvenile broiler 3 0.065 0.027 �0.032 0.002 0.007 0.007Juvenile broiler 4 0.067 0.024 �0.032 0.002 0.010 0.009Juvenile broiler 5 0.063 0.029 �0.026 0.002 0.009 0.008Juvenile broiler 6 0.067 0.024 �0.013 0.002 0.007 0.006Juvenile broiler 7 0.064 0.030 �0.020 0.002 0.009 0.008Juvenile broiler 8 0.069 0.029 �0.026 0.002 0.010 0.009Juvenile broiler 9 0.059 0.025 �0.027 0.002 0.007 0.007Juvenile broiler 10 0.068 0.029 �0.030 0.002 0.011 0.010Mature broiler 1 0.067 0.041 �0.033 0.005 0.018 0.016Mature broiler 2 0.055 0.049 �0.025 0.004 0.015 0.014Mature broiler 3 0.058 0.037 �0.034 0.003 0.012 0.011Mature broiler 4 0.073 0.038 �0.023 0.004 0.016 0.014Mature broiler 5 0.068 0.039 �0.022 0.003 0.013 0.012Juvenile junglefowl 1 0.050 0.027 �0.005 0.002 0.002 0.000Juvenile junglefowl 2 0.043 0.034 �0.019 0.002 0.002 0.000Juvenile junglefowl 3 0.037 0.032 �0.002 0.001 0.001 0.000Juvenile junglefowl 4 0.047 0.025 �0.014 0.001 0.001 0.000Juvenile junglefowl 5 0.044 0.034 �0.019 0.002 0.002 0.000Junglefowl 1 0.064 0.042 �0.030 0.003 0.012 0.012Junglefowl 2 0.073 0.046 �0.026 0.003 0.012 0.012Junglefowl 3 0.076 0.031 �0.043 0.003 0.013 0.012Junglefowl 4 0.078 0.042 �0.021 0.002 0.011 0.010Junglefowl 5 0.071 0.044 �0.018 0.002 0.011 0.010
High ResolutionMature broiler 4 Not calculated Not calculatedJunglefowl 5
Repeated measuresMature broiler 1Mature broiler 2Mature broiler 3 Not calculated Not calculatedMature broiler 4Mature broiler 5
x, cranial; y, ventral; z, medial.
TABLE A3. Complex, standard, and informed models of Juvenile Crocodylus johnstoni
Model iterationBody
mass (kg)
Bodymass
estimate(kg)
Femurlength (m)
Gleno-Acetabularlength (m)
COM coordinates (m)
x y z
Complex model, original pose, with cavities 1.540 1.722 0.054 0.177 0.025 �0.014 �0.018Complex model, original pose, without cavities 1.540 1.791 0.054 0.177 0.030 �0.013 �0.018Complex model, original pose, raw scan without cavities 1.540 1.790 0.054 0.177 0.027 �0.011 �0.020Complex model, straightened pose, with cavities 1.540 1.817 0.054 0.177 0.047 �0.013 �0.021Complex model, straightened pose, without cavities 1.540 1.858 0.054 0.177 0.050 �0.013 �0.022Complex model, straightened torso only with cavities 0.789 0.789 0.054 0.177 0.089 �0.012 �0.021Complex model, straightened torso only without cavities 0.789 0.824 0.054 0.177 0.089 �0.012 �0.022Simple model, standard tail, maximum total body mass 1.540 1.726 0.054 0.177 0.083 �0.014 �0.022Simple model, standard tail, minimum total body mass 1.540 0.952 0.054 0.177 0.099 �0.014 �0.023Simple model, standard tail, maximum cranial distribution of mass 1.540 1.560 0.054 0.177 0.100 �0.014 �0.022Simple model, standard tail, maximum caudal distribution of mass 1.540 1.132 0.054 0.177 0.073 �0.015 �0.022Simple model, standard tail, maximum dorsal distribution of mass 1.540 1.668 0.054 0.177 0.086 �0.013 �0.022Simple model, standard tail, maximum ventral distribution of mass 1.540 1.024 0.054 0.177 0.092 �0.016 �0.022Mean of standard tail models 1.540 1.346 0.054 0.177 0.087 �0.015 �0.022Simple model, informed tail, maximum total body mass 1.540 1.983 0.054 0.177 0.055 �0.014 �0.022Simple model, informed tail, minimum total body mass 1.540 1.067 0.054 0.177 0.075 �0.014 �0.023Simple model, informed tail, maximum cranial distribution of mass 1.540 1.675 0.054 0.177 0.084 �0.013 �0.022Simple model, informed tail, maximum caudal distribution of mass 1.540 1.389 0.054 0.177 0.034 �0.015 �0.022Simple model, informed tail, maximum dorsal distribution of mass 1.540 1.926 0.054 0.177 0.056 �0.013 �0.022Simple model, informed tail, maximum ventral distribution of mass 1.540 1.139 0.054 0.177 0.070 �0.016 �0.022Mean of informed tail models 1.540 1.532 0.054 0.177 0.059 �0.015 �0.022
x, cranial; y, ventral; z, medial.
1460 ALLEN, PAXTON, AND HUTCHINSON

TABLE A4. Complex, standard, and informed models of adult Crocodylus johnstoni
Model iteration
Bodymass(kg)
Bodymass
estimate(kg)
Femurlength(m)
Gleno-Acetabular
length(m)
COMcoordinates (m)
x y z
Complex model, original pose, with cavities 20.190 20.935 0.105 0.421 0.155 0.009 �0.102Complex model, original pose, without cavities 20.190 21.767 0.105 0.421 0.164 0.010 �0.101Complex model, original pose, raw scan without cavities 20.190 21.258 0.105 0.421 0.160 0.009 �0.101Complex model, straightened pose, with cavities 20.190 21.090 0.105 0.421 0.119 �0.012 �0.053Complex model, straightened pose, without cavities 20.190 21.888 0.105 0.421 0.129 �0.011 �0.053Complex model, straightened torso only with cavities 11.058 11.058 0.105 0.421 0.200 0.000 �0.053Complex model, straightened torso only without cavities 11.058 11.684 0.105 0.421 0.204 0.001 �0.053Simple model, standard tail, maximum total body mass 20.190 22.718 0.105 0.421 0.178 �0.013 �0.056Simple model, standard tail, minimum total body mass 20.190 11.992 0.105 0.421 0.198 �0.015 �0.058Simple model, standard tail, maximum cranial distribution of mass 20.190 20.476 0.105 0.421 0.213 �0.010 �0.056Simple model, standard tail, maximum caudal distribution of mass 20.190 14.375 0.105 0.421 0.142 �0.021 �0.056Simple model, standard tail, maximum dorsal distribution of mass 20.190 21.863 0.105 0.421 0.185 �0.010 �0.055Simple model, standard tail, maximum ventral distribution of mass 20.190 13.030 0.105 0.421 0.181 �0.021 �0.058Mean of standard tail models 20.190 17.436 0.105 0.421 0.178 �0.016 �0.056Simple model, informed tail, maximum total body mass 20.190 26.000 0.105 0.421 0.122 �0.017 �0.053Simple model, informed tail, minimum total body mass 20.190 13.458 0.105 0.421 0.149 �0.016 �0.056Simple model, informed tail, maximum cranial distribution of mass 20.190 21.942 0.105 0.421 0.182 �0.011 �0.055Simple model, informed tail, maximum caudal distribution of mass 20.190 17.657 0.105 0.421 0.066 �0.025 �0.053Simple model, informed tail, maximum dorsal distribution of mass 20.190 25.145 0.105 0.421 0.126 �0.014 �0.053Simple model, informed tail, maximum ventral distribution of mass 20.190 14.496 0.105 0.421 0.137 �0.022 �0.056Mean of informed tail models 20.190 19.810 0.105 0.421 0.124 �0.018 �0.054
x, cranial; y, ventral; z, medial.
TABLE A5. Complex, standard, and informed models of adult Junglefowl (Gallus gallus)
Model iteration
Bodymass(kg)
Bodymass
estimate(kg)
Femurlength(m)
Gleno-Acetabular
length(m)
COMcoordinates (m)
x y z
Complex model, original pose, with maximally inflated cavities 2.069 2.141 0.087 0.136 0.092 �0.026 �0.012Complex model, original pose, with minimally inflated cavities 2.069 2.435 0.087 0.136 0.087 �0.023 �0.012Mean of complex models, original poses with varying inflation 2.069 2.288 0.087 0.136 0.090 �0.025 �0.012Complex model, original pose, without cavities 2.069 2.717 0.087 0.136 0.086 �0.019 �0.013Complex model, original pose, raw scan without cavities 2.069 2.710 0.087 0.136 0.097 �0.030 �0.013Complex model, straightened pose, with maximally inflated cavities 2.069 2.537 0.087 0.136 0.065 �0.048 �0.025Complex model, straightened pose, with minimally inflated cavities 2.069 2.815 0.087 0.136 0.063 �0.045 �0.024Mean of complex models, straightened poses with varying inflation 2.069 2.676 0.087 0.136 0.064 �0.047 �0.025Complex model, straightened pose without cavities 2.069 3.065 0.087 0.136 0.062 �0.042 �0.025Complex model, straightened torso only, with maximally inflated cavities 1.544 1.025 0.087 0.136 0.047 �0.033 �0.027Complex model, straightened torso only, with minimally inflated cavities 1.544 1.303 0.087 0.136 0.046 �0.030 �0.026Complex model, straightened torso only, without cavities 1.544 1.544 0.087 0.136 0.047 �0.027 �0.026Simple model, standard tail, maximum total body mass 2.069 3.659 0.087 0.136 0.053 �0.053 �0.021Simple model, standard tail, minimum total body mass 2.069 1.943 0.087 0.136 0.059 �0.052 �0.025Simple model, standard tail, maximum cranial distribution of mass 2.069 3.104 0.087 0.136 0.065 �0.041 �0.022Simple model, standard tail, maximum caudal distribution of mass 2.069 2.594 0.087 0.136 0.044 �0.066 �0.025Simple model, standard tail, maximum dorsal distribution of mass 2.069 3.119 0.087 0.136 0.064 �0.041 �0.022Simple model, standard tail, maximum ventral distribution of mass 2.069 2.588 0.087 0.136 0.043 �0.065 �0.023Mean of standard tail models 2.069 2.851 0.087 0.136 0.054 �0.053 �0.023
x, cranial; y, ventral; z, medial.
CENTER OF MASS VARIATIONS 1461