variations in tuberculosis prevalence, russian federation
TRANSCRIPT

Bull World Health Organ 2019;97:737–745A | doi: http://dx.doi.org/10.2471/BLT.19.229997
Research
737
IntroductionDuring the 1990s the tuberculosis epidemic in the Russian Federation worsened due to an economic recession in the country at that time. National tuberculosis case notifications reached a peak of 90.7 per 100 000 in the population of 146.6 million in the year 2000. The robust measures to control tu-berculosis taken by the government between 2000 and 2010 led to a reduction in case notifications to 48.3 per 100 000 in the population of 144.5 million by 2017. Despite these measures, the tuberculosis situation in the Asian part of the Russian Federation remained less favourable compared with the European part. For example, in the year 2017, tuberculosis case notifications in the Siberian federal district (population: 19.3 million) and Far Eastern federal district (population: 6.1 million) were as high as 83.3 and 86.1 per 100 000 respec-tively.1–4 Identification of the key factors that determine the unfavourable epidemic situation in these districts is therefore a top priority for research. The evidence collected can then be used to plan focused interventions.
Tuberculosis surveillance and monitoring were estab-lished in their present form in these two federal districts in 2003 with data pm dozens of variables are collected annually by the government. We aimed to identify the variables that are closely correlated and to understand how they interact and contribute to the tuberculosis epidemic in different regions of Siberian and Far Eastern federal districts. We used multivari-ate principal coordinate analysis,5 a method that allowed us to condense the complex, multidimensional data set into a small
number of aggregated indicators for each region. Description of the regions’ tuberculosis status in terms of these indicators would enable us to characterize and compare the epidemiol-ogy of tuberculosis among regions. The results are intended to inform the development of a unified prevention, care and control policy that addresses each region’s specific needs.
MethodsData source
The study was a retrospective epidemiological analysis cov-ering all tuberculosis cases notified in the Asian part of the Russian Federation from 2003 to 2016.
We analysed data obtained from federal and department reports for each of the 21 regions in the Siberian and Far Eastern federal districts which constitute the Asian part of the Russian Federation. The health authority reports cover all registered patients with records of all forms of tuberculosis. A total of 68 variables of tuberculosis incidence, treatment and outcomes are collected. The method of data gathering is identical in all regions of both federal districts. Access to the epidemiological data is restricted to clinical specialists and medical statisticians. The raw data are obtained by re-gional tuberculosis centres from tuberculosis hospitals and outpatient departments at regional, municipal and township levels using official ministerial guidelines, and collated for analysis in Novosibirsk Tuberculosis Research Institute. The data are regularly checked for consistency and reliability by experienced research personnel at the Institute who frequently
Objective To analyse the epidemiological trends of tuberculosis in the Siberian and Far Eastern federal districts, the areas with the highest disease burden in the Russian Federation.Methods We applied principal coordinate analysis to study a total of 68 relevant variables on tuberculosis epidemiology, prevention and control. Data on these variables were collected over 2003–2016 in all 21 regions of the Siberian federal district and Far Eastern federal district (total population: 25.5 million) through the federal and departmental reporting system. We identified the regions with a favourable or unfavourable tuberculosis epidemiological profile and ranked them as low or high priority for specific interventions.Findings The median number of tuberculosis notifications in the regions was 123.3 per 100 000 population (range: 54.5–265.7) in 2003, decreasing to 82.3 per 100 000 (range: 52.9–178.3) in 2016. We found large variations in the tuberculosis epidemiological profile across different regions. The principal coordinate analysis revealed that three aggregated indicators accounted for 55% of the variation. The first coordinate corresponded to tuberculosis prevalence and case notifications in the regions; the second to the severity of the disease among patients; and the third to the percentage of multidrug-resistant tuberculosis among tuberculosis patients. The regions where intervention was most urgently needed were Chukotka Autonomous Okrug, Jewish Autonomous Oblast and Tyva Republic.Conclusion The variability in tuberculosis epidemiology across regions was likely due to differences in the quality of antituberculosis services. Precision in defining necessary interventions, as determined through the principal coordinate analysis approach, can guide focused tuberculosis control efforts.
a FSBI Novosibirsk Tuberculosis Research Institute, Ministry of Health of the Russian Federation, Novosibirsk, Okhotskaya street 81A, 630040, Russian Federation.b Institute of Global Health, University of Geneva, Geneva, Switzerland.c Global Health Centre, University of Milan, Milan, Italy.Correspondence to Ivan Meshkov (email: [email protected]).(Submitted: 17 January 2019 – Revised version received: 29 May 2019 – Accepted: 31 May 2019 – Published online: 3 September 2019 )
Variations in tuberculosis prevalence, Russian Federation: a multivariate approachIvan Meshkov,a Tatyana Petrenko,a Olivia Keiser,b Janne Estill,b Olga Revyakina,a Irina Felker,a Mario C Raviglione,c Vladimir Krasnova & Yakov Schwartza
Research
738 Bull World Health Organ 2019;97:737–745A| doi: http://dx.doi.org/10.2471/BLT.19.229997
ResearchTuberculosis in the Asian part of the Russian Federation Ivan Meshkov et al.
conduct supervisory visits in the ob-served regions.
A detai led descript ion of a l l variables collected by the federal au-thorities and their calculation rules and periods of data collection are available from the data repository.6 These variables are recommended for epidemiological reporting as key fac-tors in control of epidemic tuberculo-sis.7,8 Variables cover a wide range of characteristics, including: (i) case no-tifications and the number of notified tuberculosis cases stratified by age and by urban or rural population; (ii) data on tuberculosis patients who were difficult to treat, including those with multidrug-resistant (MDR) tuber-culosis or extensive fibrotic changes and cavities (verified by a medical board of experts reviewing difficult cases using clinical and tomography data);9–11 (iii) coverage of tuberculo-sis diagnostics, including any type of examination; and (iv) outcomes of tuberculosis treatment.
Data analysis
We used principal coordinate analy-sis for the study. In this method, the differences between regions are represented by a small number of coordinates. The method has several advantages compared with more com-monly used methods such as principal component analysis. First, principal coordinate analysis has low sensitiv-ity to the presence of outliers in the data. Second, the method can reflect the relationships between the variables analysed regardless of whether they are linear or not. Third, it has good applicability when the number of vari-ables (in our case the epidemiological data) is much greater than the number of observations (in our case the differ-ent regions).
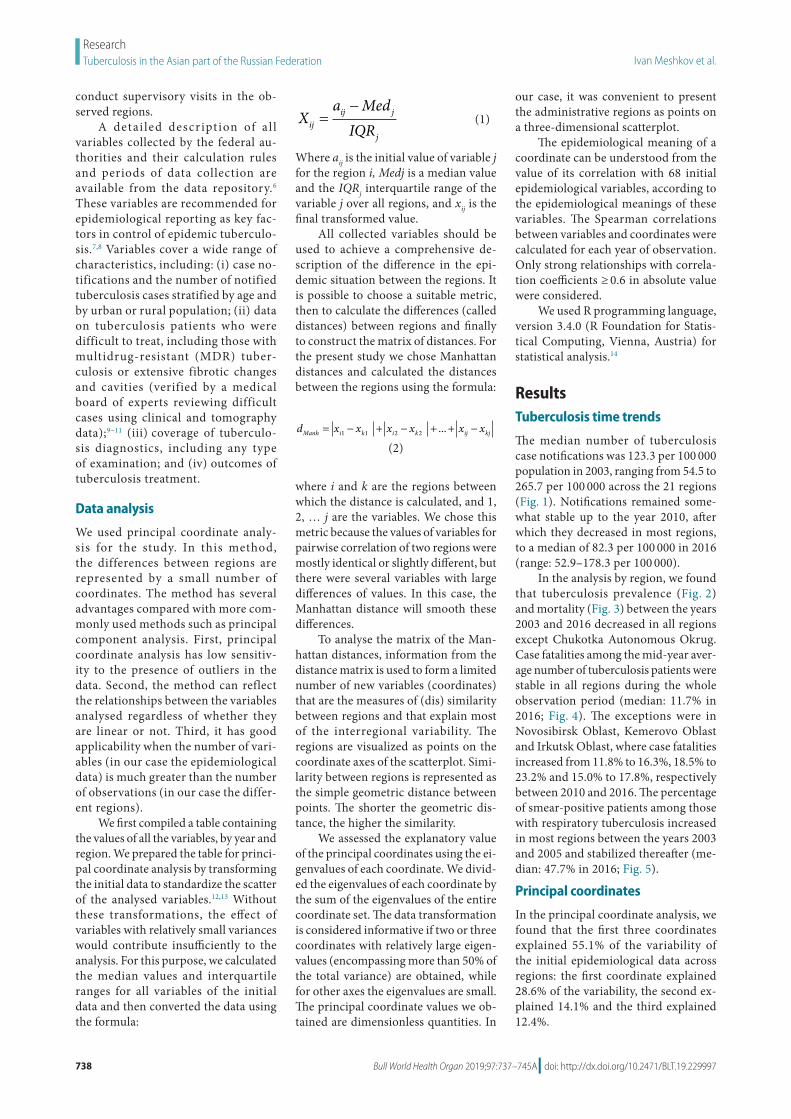
We first compiled a table containing the values of all the variables, by year and region. We prepared the table for princi-pal coordinate analysis by transforming the initial data to standardize the scatter of the analysed variables.12,13 Without these transformations, the effect of variables with relatively small variances would contribute insufficiently to the analysis. For this purpose, we calculated the median values and interquartile ranges for all variables of the initial data and then converted the data using the formula:
Xa Med
IQRijij j
j
=−
(1)
Where aij is the initial value of variable j for the region i, Medj is a median value and the IQRj interquartile range of the variable j over all regions, and xij is the final transformed value.
All collected variables should be used to achieve a comprehensive de-scription of the difference in the epi-demic situation between the regions. It is possible to choose a suitable metric, then to calculate the differences (called distances) between regions and finally to construct the matrix of distances. For the present study we chose Manhattan distances and calculated the distances between the regions using the formula:
d x x x x x xManh i k i k ij kj= − + − + + −1 1 2 2 ...
(2)
where i and k are the regions between which the distance is calculated, and 1, 2, … j are the variables. We chose this metric because the values of variables for pairwise correlation of two regions were mostly identical or slightly different, but there were several variables with large differences of values. In this case, the Manhattan distance will smooth these differences.
To analyse the matrix of the Man-hattan distances, information from the distance matrix is used to form a limited number of new variables (coordinates) that are the measures of (dis) similarity between regions and that explain most of the interregional variability. The regions are visualized as points on the coordinate axes of the scatterplot. Simi-larity between regions is represented as the simple geometric distance between points. The shorter the geometric dis-tance, the higher the similarity.
We assessed the explanatory value of the principal coordinates using the ei-genvalues of each coordinate. We divid-ed the eigenvalues of each coordinate by the sum of the eigenvalues of the entire coordinate set. The data transformation is considered informative if two or three coordinates with relatively large eigen-values (encompassing more than 50% of the total variance) are obtained, while for other axes the eigenvalues are small. The principal coordinate values we ob-tained are dimensionless quantities. In
our case, it was convenient to present the administrative regions as points on a three-dimensional scatterplot.
The epidemiological meaning of a coordinate can be understood from the value of its correlation with 68 initial epidemiological variables, according to the epidemiological meanings of these variables. The Spearman correlations between variables and coordinates were calculated for each year of observation. Only strong relationships with correla-tion coefficients ≥ 0.6 in absolute value were considered.
We used R programming language, version 3.4.0 (R Foundation for Statis-tical Computing, Vienna, Austria) for statistical analysis.14
ResultsTuberculosis time trends
The median number of tuberculosis case notifications was 123.3 per 100 000 population in 2003, ranging from 54.5 to 265.7 per 100 000 across the 21 regions (Fig. 1). Notifications remained some-what stable up to the year 2010, after which they decreased in most regions, to a median of 82.3 per 100 000 in 2016 (range: 52.9–178.3 per 100 000).
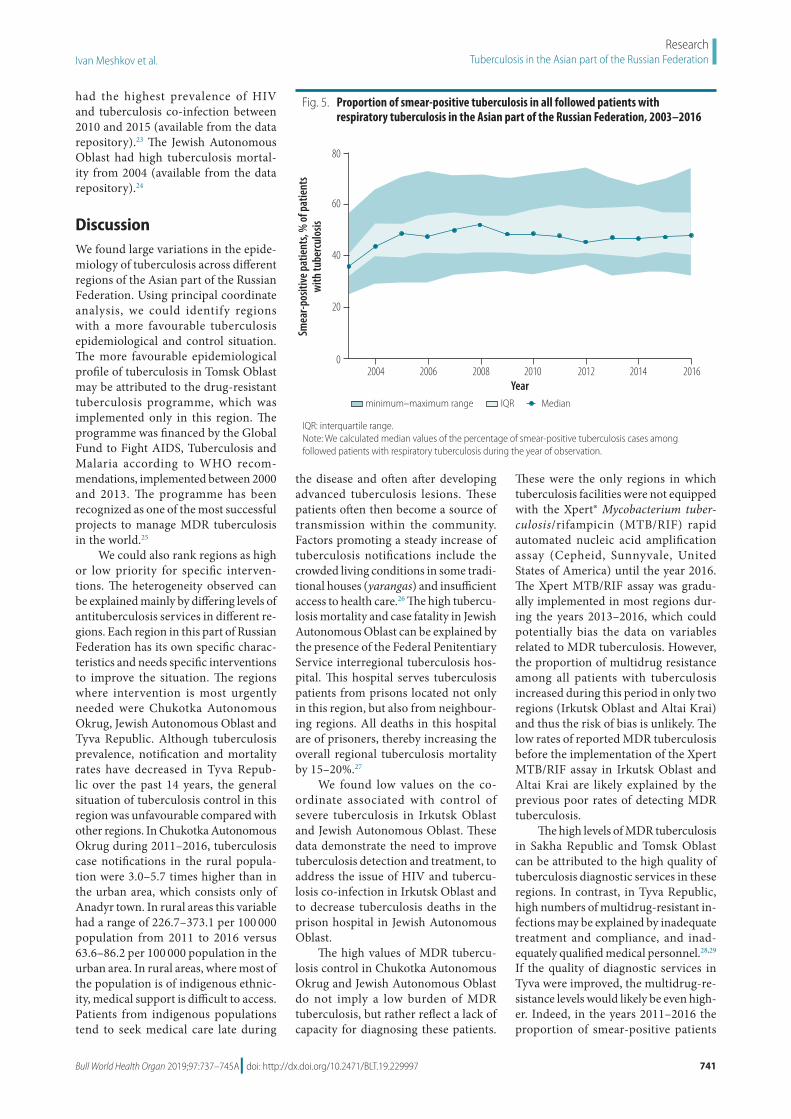
In the analysis by region, we found that tuberculosis prevalence (Fig. 2) and mortality (Fig. 3) between the years 2003 and 2016 decreased in all regions except Chukotka Autonomous Okrug. Case fatalities among the mid-year aver-age number of tuberculosis patients were stable in all regions during the whole observation period (median: 11.7% in 2016; Fig. 4). The exceptions were in Novosibirsk Oblast, Kemerovo Oblast and Irkutsk Oblast, where case fatalities increased from 11.8% to 16.3%, 18.5% to 23.2% and 15.0% to 17.8%, respectively between 2010 and 2016. The percentage of smear-positive patients among those with respiratory tuberculosis increased in most regions between the years 2003 and 2005 and stabilized thereafter (me-dian: 47.7% in 2016; Fig. 5).
Principal coordinates
In the principal coordinate analysis, we found that the first three coordinates explained 55.1% of the variability of the initial epidemiological data across regions: the first coordinate explained 28.6% of the variability, the second ex-plained 14.1% and the third explained 12.4%.

739Bull World Health Organ 2019;97:737–745A| doi: http://dx.doi.org/10.2471/BLT.19.229997
ResearchTuberculosis in the Asian part of the Russian FederationIvan Meshkov et al.
Epidemiological favourability
The first coordinate correlated in-versely with 13 variables, including: tuberculosis case notification by chest X-ray screening examination per 1000 people; tuberculosis case notification in the total population, in rural and in urban populations (as percentages of the total population) and among adolescents aged 15–17 years; tuber-culosis prevalence per 100 000 people among adolescents and adults; and tuberculosis relapse and mortality. An inverse relationship was also found between this coordinate and the preva-lence of tuberculosis with extensive fibrotic changes and cavities; and the proportion of patients with that type of tuberculosis among all tuberculosis patients. There was a positive correla-tion with two variables: the percentage of respiratory tuberculosis patients with bacteriological conversion; and the proportion of closure of cavities among tuberculosis patients. The Spearman correlation coefficients and P-values of all variables correlated with the first coordinate are available from the data repository.15
The first coordinate could be inter-preted as an aggregated indicator of in-terregional variations of epidemiological tuberculosis transmission and severity, and we called it the epidemiological fa-vourability coordinate. The high values of this coordinate reflect both a low level of tuberculosis transmission and a high efficiency of antituberculosis measures. The higher the proportion of cured pa-tients, the lower the relapse rate and the prevalence of tuberculosis.
Severe tuberculosis
The second coordinate correlated negatively with six variables, including: tuberculosis case notifications in the total population and in urban areas; the total number of people registered for treatment; the number of followed patients co-infected with HIV and tuberculosis; tuberculosis-related case fatality and mortality; and the propor-tion of tuberculosis patients who died outside hospitals in 2006, 2011 and 2014. There was a positive correlation of this coordinate with one variable: the density of tuberculosis specialists in the region. The Spearman correlation coefficients of all variables correlated with the second coordinate are available from the data repository.16
The correlations indicate that the regions characterized by high values of the second coordinate were those with a relatively low prevalence of severe tuberculosis. Moreover, these relationships probably indicate that a high concentration of tuberculosis specialists in a region increased the cure rate and lowered tuberculosis re-lated mortality. The second coordinate therefore reflects the interregional variations in the efficacy of interven-
tions in preventing severe tuberculosis and in reducing mortality and could be called the control of severe tuber-culosis coordinate. This coordinate correlated inversely with tuberculosis case notifications in urban popula-tions, but no relationship was found in rural populations. This finding can probably be explained by the higher availability of antituberculosis services and the higher number of tuberculosis specialists in the cities.
Fig. 1. Tuberculosis case notifications in the Asian part of the Russian Federation, 2003–2016
Patie
nts w
ith tu
berc
ulos
is id
entif
ied
per 1
00 0
00 p
opul
atio
n
Yearminimum–maximum range IQR Median
2004 2006 2008 2010 2012 2014 2016
300
200
100
0
IQR: interquartile range.Notes: We analysed data obtained from federal and department reports. We calculated median values of tuberculosis case notifications as the ratio of all tuberculosis cases notified for the first time (including postmortem diagnoses) during the year to the mid-year total population of the region.
Fig. 2. Tuberculosis prevalence in the Asian part of the Russian Federation, 2003–2016
Regi
ster
ed tu
berc
ulos
is pa
tient
s pe
r 100
000
pop
ulat
ion
Yearminimum–maximum range IQR
2004 2006 2008 2010 2012 2014 2016
1200
800
400
0
Median
IQR: interquartile range.Note: We calculated median values of tuberculosis prevalence as the median ratio of followed tuberculosis patients during the year to the mid-year total population of the region.

740 Bull World Health Organ 2019;97:737–745A| doi: http://dx.doi.org/10.2471/BLT.19.229997
ResearchTuberculosis in the Asian part of the Russian Federation Ivan Meshkov et al.
MDR tuberculosis
The third coordinate correlated nega-tively with seven variables, including: the proportions of MDR tuberculosis cases among tuberculosis patients; MDR tuberculosis case notifications; and the percentage of cavity closures in newly diagnosed patients. This coordinate was therefore associated with the control of MDR tuberculosis. The detailed list of variables correlated with the third
coordinate is available from the data repository.17
The data show that the more pa-tients newly registered for treatment, the higher the proportion of diagnosed cases with MDR tuberculosis. Between the years 2005 and 2010, the tubercu-losis epidemic was particularly severe in certain regions, which prompted government-supported interventions. The measures included additional fi-nancing, strengthening of tuberculosis
services, more training courses for tuberculosis specialists, an increased number of radiological examinations and an increase in the number of tu-berculosis surgeries. These actions may have led to an increase in the number of diagnosed bacteriological conversions with a subsequent decrease in trans-mission and, ultimately, tuberculosis notifications and mortality after 2010. However, we cannot exclude that during these interventions some patients were still treated inadequately, leading to low cure rates and an increased number of patients with MDR tuberculosis.18
Geographical variations
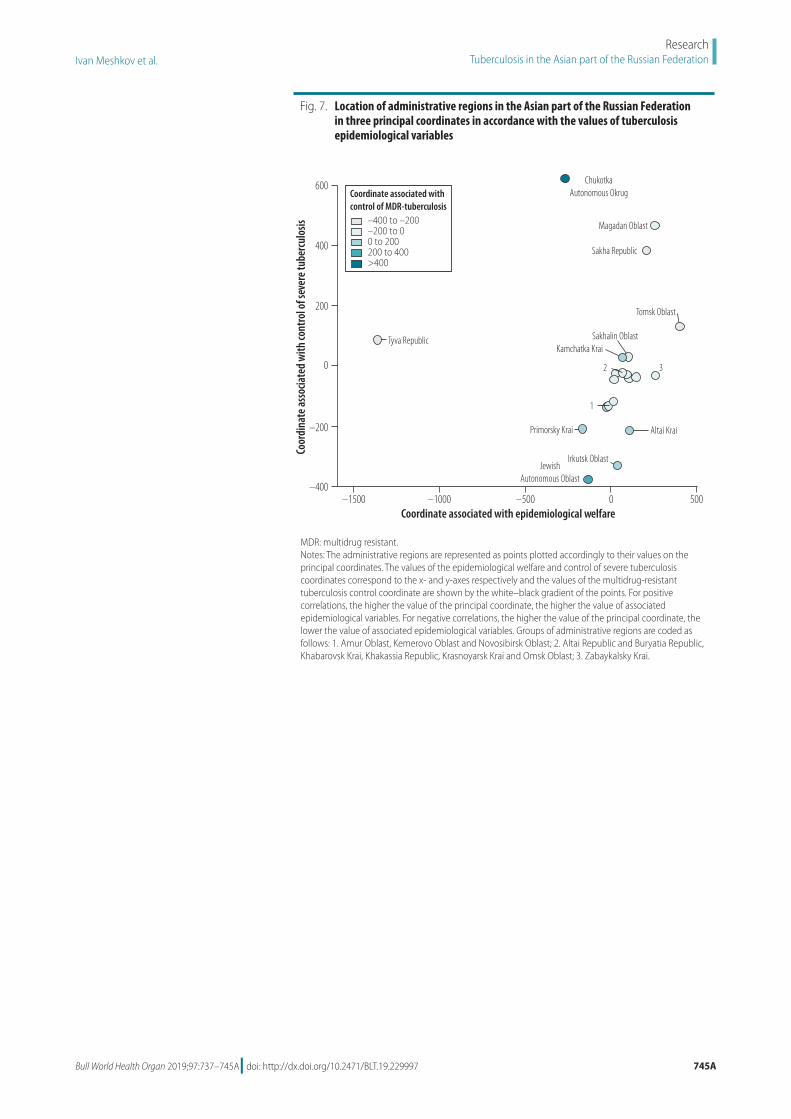
The values of the three coordinates for all regions are shown on a map of the Russian Federation (Fig. 6) and three-dimensional scatter plot (Fig. 7; avail-able at http://www.who.int/bulletin/volumes/97/11/19-229997). Of the 21 regions, Tomsk Oblast had the highest value for the first coordinate, associated with epidemiological welfare. The lowest values of the epidemiological welfare coordinate were in Tyva Republic and Chukotka Autonomous Okrug. The value of the second coordinate, associ-ated with control of severe tuberculosis, was highest in Chukotka Autonomous Okrug and lowest in Jewish Autono-mous Oblast, Irkutsk Oblast, Altai Krai and Primorskiy Krai. The value of the third coordinate, associated with control of MDR tuberculosis, was also highest in Chukotka Autonomous Okrug region, but lowest in Sakha Republic, Tyva Re-public and Tomsk Oblast.
The prevalence and incidence of tuberculosis in Chukotka Autonomous Okrug and Tyva Republic over the study period are available from the data repository.20,21 Chukotka Autonomous Okrug was the only region with a steady increase in tuberculosis case notifica-tions and prevalence during 2008–2016. Tyva Republic had the highest tubercu-losis prevalence and case notifications over the whole period of observation.
Tuberculosis case notifications in the urban populations of the Jewish Autonomous Oblast, Irkutsk Oblast, Altai Krai and Primorskiy Krai regions were higher over the years 2010–2016 than in most of other regions (avail-able from the data repository).22 These four regions are characterized by their markedly low values of the second coor-dinate and thereby unfavourable profile of severe tuberculosis. Irkutsk Oblast
Fig. 3. Tuberculosis mortality in the Asian part of the Russian Federation, 2003–2016
Deat
hs p
er 1
00 0
00 p
opul
atio
n
100
75
50
25
0
Yearminimum–maximum range IQR
2004 2006 2008 2010 2012 2014 2016
Median
IQR: interquartile range.Note: We calculated median values of tuberculosis mortality as the ratio of all registered deaths of tuberculosis patients caused by tuberculosis during the year to the mid-year total population of the region.
Fig. 4. Case fatalities in the Asian part of the Russian Federation, 2003–2016
Case
fata
litie
s, %
of p
atie
nts
with
tube
rcul
osis
Yearminimum–maximum range IQR
2004 2006 2008 2010 2012 2014 2016
30
20
10
0
Median
IQR: interquartile range.Note: We calculated median values of case fatality as the ratio of all tuberculosis-related deaths among tuberculosis patients during the year to the mid-year average number of tuberculosis patients in the region.
741Bull World Health Organ 2019;97:737–745A| doi: http://dx.doi.org/10.2471/BLT.19.229997
ResearchTuberculosis in the Asian part of the Russian FederationIvan Meshkov et al.
had the highest prevalence of HIV and tuberculosis co-infection between 2010 and 2015 (available from the data repository).23 The Jewish Autonomous Oblast had high tuberculosis mortal-ity from 2004 (available from the data repository).24
DiscussionWe found large variations in the epide-miology of tuberculosis across different regions of the Asian part of the Russian Federation. Using principal coordinate analysis, we could identify regions with a more favourable tuberculosis epidemiological and control situation. The more favourable epidemiological profile of tuberculosis in Tomsk Oblast may be attributed to the drug-resistant tuberculosis programme, which was implemented only in this region. The programme was financed by the Global Fund to Fight AIDS, Tuberculosis and Malaria according to WHO recom-mendations, implemented between 2000 and 2013. The programme has been recognized as one of the most successful projects to manage MDR tuberculosis in the world.25
We could also rank regions as high or low priority for specific interven-tions. The heterogeneity observed can be explained mainly by differing levels of antituberculosis services in different re-gions. Each region in this part of Russian Federation has its own specific charac-teristics and needs specific interventions to improve the situation. The regions where intervention is most urgently needed were Chukotka Autonomous Okrug, Jewish Autonomous Oblast and Tyva Republic. Although tuberculosis prevalence, notification and mortality rates have decreased in Tyva Repub-lic over the past 14 years, the general situation of tuberculosis control in this region was unfavourable compared with other regions. In Chukotka Autonomous Okrug during 2011–2016, tuberculosis case notifications in the rural popula-tion were 3.0–5.7 times higher than in the urban area, which consists only of Anadyr town. In rural areas this variable had a range of 226.7–373.1 per 100 000 population from 2011 to 2016 versus 63.6–86.2 per 100 000 population in the urban area. In rural areas, where most of the population is of indigenous ethnic-ity, medical support is difficult to access. Patients from indigenous populations tend to seek medical care late during
the disease and often after developing advanced tuberculosis lesions. These patients often then become a source of transmission within the community. Factors promoting a steady increase of tuberculosis notifications include the crowded living conditions in some tradi-tional houses (yarangas) and insufficient access to health care.26 The high tubercu-losis mortality and case fatality in Jewish Autonomous Oblast can be explained by the presence of the Federal Penitentiary Service interregional tuberculosis hos-pital. This hospital serves tuberculosis patients from prisons located not only in this region, but also from neighbour-ing regions. All deaths in this hospital are of prisoners, thereby increasing the overall regional tuberculosis mortality by 15–20%.27
We found low values on the co-ordinate associated with control of severe tuberculosis in Irkutsk Oblast and Jewish Autonomous Oblast. These data demonstrate the need to improve tuberculosis detection and treatment, to address the issue of HIV and tubercu-losis co-infection in Irkutsk Oblast and to decrease tuberculosis deaths in the prison hospital in Jewish Autonomous Oblast.
The high values of MDR tubercu-losis control in Chukotka Autonomous Okrug and Jewish Autonomous Oblast do not imply a low burden of MDR tuberculosis, but rather reflect a lack of capacity for diagnosing these patients.
These were the only regions in which tuberculosis facilities were not equipped with the Xpert® Mycobacterium tuber-culosis/rifampicin (MTB/RIF) rapid automated nucleic acid amplification assay (Cepheid, Sunnyvale, United States of America) until the year 2016. The Xpert MTB/RIF assay was gradu-ally implemented in most regions dur-ing the years 2013–2016, which could potentially bias the data on variables related to MDR tuberculosis. However, the proportion of multidrug resistance among all patients with tuberculosis increased during this period in only two regions (Irkutsk Oblast and Altai Krai) and thus the risk of bias is unlikely. The low rates of reported MDR tuberculosis before the implementation of the Xpert MTB/RIF assay in Irkutsk Oblast and Altai Krai are likely explained by the previous poor rates of detecting MDR tuberculosis.
The high levels of MDR tuberculosis in Sakha Republic and Tomsk Oblast can be attributed to the high quality of tuberculosis diagnostic services in these regions. In contrast, in Tyva Republic, high numbers of multidrug-resistant in-fections may be explained by inadequate treatment and compliance, and inad-equately qualified medical personnel.28,29 If the quality of diagnostic services in Tyva were improved, the multidrug-re-sistance levels would likely be even high-er. Indeed, in the years 2011–2016 the proportion of smear-positive patients
Fig. 5. Proportion of smear-positive tuberculosis in all followed patients with respiratory tuberculosis in the Asian part of the Russian Federation, 2003–2016
Smea
r-pos
itive
pat
ient
s, %
of p
atie
nts
with
tube
rcul
osis
80
60
40
20
0
Yearminimum–maximum range IQR
2004 2006 2008 2010 2012 2014 2016
Median
IQR: interquartile range.Note: We calculated median values of the percentage of smear-positive tuberculosis cases among followed patients with respiratory tuberculosis during the year of observation.

742 Bull World Health Organ 2019;97:737–745A| doi: http://dx.doi.org/10.2471/BLT.19.229997
ResearchTuberculosis in the Asian part of the Russian Federation Ivan Meshkov et al.
Fig.
6.
Dist
ribut
ion
of th
e th
ree
prin
cipal
coor
dina
tes o
f tub
ercu
losis
epi
dem
iolo
gy in
21
regi
ons o
f the
Asia
n pa
rt o
f the
Rus
sian
Fede
ratio
n, 2
003–
2016
–140
0 to
–20
0–2
00 to
00
to 2
0020
0 to
400
>40
0
Coor
dina
te as
socia
ted
with
ep
idem
iolo
gica
l fav
oura
bilit
y
–400
to –
200
–200
to –
100
–100
to 0
0 to
300
300
to 6
00>
600
Coor
dina
te as
socia
ted
with
co
ntro
l of s
ever
e tub
ercu
losis
–400
to –
200
–200
to 0
0 to
200
200
to 4
00>
400
Coor
dina
te as
socia
ted
with
co
ntro
l of M
DR tu
berc
ulos
is
Chuk
otka
Aut
onom
ous O
blast
(0.05
milli
on)
Kam
chatk
a Krai
(0
.32 m
illion
)
Khab
arovs
k Krai
(1.3
milli
on)
Sakh
a Rep
ublic
(0
.96 m
illion
)
Kras
noya
rsk Kr
ai
(2.9
milli
on)
Irkut
sk O
blast
(2
.4 m
illion
)
Tyva
Repu
blic
(0.31
milli
on)
Altai
Repu
blic
(0.22
milli
on)
Kem
erovo
Obla
st (2
.8 m
illion
)
Altai
Krai
(2
.3 m
illion
)
Novo
sibirs
k Obla
st (2
.8 m
illion
)
Omsk
Obla
st
(2.0
milli
on)
Tom
sk O
blast
(1
.1 m
illion
)
Sakh
alin O
blast
(0.49
milli
on)
Amur
Obla
st
(0.80
milli
on)
Zaba
ykals
kiy Kr
ai (1
.1 m
illion
)
Bury
atia R
epub
lic (0
.98 m
illion
)
Khak
assia
Repu
blic
(0.54
milli
on)
Prim
orsk
y Krai
(1
.9 m
illion
)
Jewi
sh A
uton
omou
s Obla
st (0
.16 m
illion
)
Mag
adan
Obla
st (0
.17 m
illion
)
MD
R: m
ultid
rug
resis
tant
. N
otes
: Adm
inist
rativ
e re
gion
s con
stitu
te S
iber
ian
and
Far E
ast F
eder
al d
istric
ts o
f the
Rus
sian
Fede
ratio
n. R
egio
ns a
re sh
aded
acc
ordi
ng to
the
valu
es o
f the
thre
e pr
inci
pal c
oord
inat
es; d
arke
r sha
des o
f col
our i
ndic
ate
a hi
gher
val
ue o
f the
co
ordi
nate
. The
prin
cipa
l coo
rdin
ate
valu
es a
re d
imen
sionl
ess q
uant
ities
. Pop
ulat
ion
data
is fr
om 2
016.
So
urce
: The
se m
aps a
re d
eriv
ativ
es o
f the
map
pre
sent
ed in
the
Relie
fWeb
libr
ary.19

743Bull World Health Organ 2019;97:737–745A| doi: http://dx.doi.org/10.2471/BLT.19.229997
ResearchTuberculosis in the Asian part of the Russian FederationIvan Meshkov et al.
who were tested for drug sensitivity in the Tyva Republic varied between 44.8% and 67.8%, whereas in Tomsk Oblast and Sakha Republic the proportion was above 85%. Of note, Tyva Republic had the highest tuberculosis prevalence and case notifications among all 21 regions.
This study has some limitations. We included variables in the analysis that were measured longitudinally, but each value was considered indepen-dently; we could therefore not describe the time trends of the variables using principal coordinate analysis. Since we did not have data at the individual level, correlations between variables could also be marginally affected by some unmeasured confounders. As this work focused on a large geographical area with a high burden of tuberculosis,
specific population subgroups, such as marginalized communities or inhabit-ants from hard-to-reach rural areas, may not be completely covered by the analysis. However, the proportion of these people in the total population is small and we believe that the potential bias is negligible.
The overall burden of tuberculosis in the Asian part of the Russian Fed-eration is still serious. The quality of diagnosis and treatment, and the avail-ability of qualified medical personnel operating in properly equipped facilities are the most important factors that can improve individual care and population control of tuberculosis. Precision in de-fining and implementing the necessary interventions, as defined through the principal coordinate analysis approach,
can guide efforts to control tuberculosis in this vast territory. ■
AcknowledgementsJE is also affiliated with the institute of Mathematical Statistics and Actuarial Science, University of Bern, Bern, Swit-zerland. MCR is also affiliated with the Institute of Global Health, University of Geneva, Geneva, Switzerland.
Funding: The work was supported by the Novosibirsk Tuberculosis Research Institute. Olivia Keiser was supported by a professorship grant from the Swiss National Science Foundation (grant number 163878).
Competing interests: None declared.
摘要俄罗斯联邦的结核病患病率差异:多变量分析方法目的 旨在分析结核病在俄罗斯联邦疾病负担最高的地区(西伯利亚和远东联邦区)内的流行病学趋势。方法 我 们 采 用 主 坐 标 分 析 法, 对 结 核 病 流 行 病学、预防和控制共 68 个相关变量进行研究。2003 年至 2016 年期间通过联邦和部门报告系统在西伯利亚联邦区与远东联邦区的所有 21 个地区收集了变量数据
(总人口 :2550 万)。我们确定了具有有利或不利结核病流行病学特征的区域并针对特定干预措施将其列为低优先级或高优先级。结 果 2003 年, 各 区 域 的 结 核 病 通 报 中 位 数为 123.3/100000 人(范围 :54.5-265.7),2016 年下降到 82.3/100000(范围 :52.9-178.3)。我们发现不同地
区的结核病流行病学特征存在很大差异。主坐标分析显示,三个综合指标占变量的 55%。第一个坐标对应于各地区的结核病患病率和病例通报 ;第二个对应于患者的疾病严重程度 ;第三个对应于结核病患者中耐多药结核病的百分比。最迫切需要干预的地区是楚科奇自治区、犹太自治州和图瓦共和国。结论 各地区结核病流行病学的差异性可能是由于抗结核病服务的质量不同。通过主坐标分析法确定的必要干预措施精确性可以指导结核病控制工作的集中开展。
ملخصالاختلافات في انتشار السل، الاتحاد الروسي:نهج متعدد المتغيرات
الفيدرالية المناطق في للسل الوبائية الاتجاهات تحليل الغرض عبء أعلى تمثل التي المناطق وهي الأقصى، والشرق سيبيريا في
للمرض في الاتحاد الروسي.الطريقة قمنا بتطبيق تحليل الإحداثيات الرئيسي لدراسة إجمالي 68 من المتغيرات ذات الصلة، على وباء السل والوقاية منه والسيطرة عليه.تم جمع البيانات حول هذه المتغيرات خلال الفترة من 2003 الفيدرالية سيبيريا منطقة في 21 الـ الأقاليم جميع في 2016 إلى مليون السكان:25.5 (إجمالي الفيدرالية الأقصى الشرق ومناطق نسمة) من خلال نظام الإبلاغ الفيدرالي والإداري.حددنا المناطق ذات الظروف الوبائية المواتية أو غير المواتية للسل، وقمنا بتصنيفها
على أنها ذات أولوية عالية أو منخفضة بالنسبة لتدخلات معينة.المناطق، في بالسل الإصابة إخطارات عدد متوسط بلغ النتائج 123.3 لكل 100000 نسمة (نطاق القياس:54.5 إلى 265.7) (نطاق نسمة 100000 لكل 82.3 إلى وانخفض ،2003 في اختلافات وجدنا .2016 عام في (178.3 إلى القياس:52.9
تحليل المختلفة.كشف المناطق في السل وباء ظروف في كبيرة إليها يعود مجتمعة مؤشرات ثلاثة هناك أن الرئيسي الإحداثيات انتشار إلى الأول الإحداثي الاختلاف.يشير من 55٪ في السبب الثاني الإحداثي ويشير المناطق؛ في الحالات وإشعارات السل النسبة إلى الثالث الإحداثي يشير بينما المرضى؛ بين المرض لشدة السل. مرضى بين المتعددة للأدوية المقاوم السل لمرض المئوية Chukotka كانت المناطق ذات الاحتياج العاجل جداً للتدخل هي Tyvaو ،Jewish Autonomous Oblastو ،Autonomous Okrug
.Republicكان المناطق، السل عبر وباء التباين في أن المحتمل الاستنتاج من يمكن السل. مكافحة خدمات لجودة المختلفة المستويات بسبب الضرورية، كما هو محدد في نهج تحليل التدخلات للدقة في تحديد الإحداثيات الرئيسي، أن تؤدي إلى توجيه الجهود المركزة لمكافحة
مرض السل.
744 Bull World Health Organ 2019;97:737–745A| doi: http://dx.doi.org/10.2471/BLT.19.229997
ResearchTuberculosis in the Asian part of the Russian Federation Ivan Meshkov et al.
Résumé
Variations de la prévalence de la tuberculose, Fédération de Russie: une approche à variables multiplesObjectif Analyser les tendances épidémiologiques de la tuberculose dans le district fédéral sibérien et le district fédéral extrême-oriental, qui présentent la charge de morbidité la plus élevée au sein de la Fédération de Russie.Méthodes Nous avons appliqué une analyse en coordonnées principales pour étudier un total de 68 variables pertinentes sur l'épidémiologie, la prévention et le contrôle de la tuberculose. Des données sur ces variables ont été collectées entre 2003 et 2016 dans les 21 régions du district fédéral sibérien et du district fédéral extrême-oriental (population totale: 25,5 millions) à l'aide du système de notification fédéral et ministériel. Nous avons déterminé les régions présentant un profil épidémiologique de la tuberculose favorable ou défavorable, puis nous les avons assimilées à un degré de priorité faible ou élevé concernant des interventions spécifiques.Résultats Le nombre médian de notifications de cas de tuberculose dans les régions considérées s'élevait à 123,3 pour 100 000 habitants (étendue: 54,5-265,7) en 2003, puis diminuait pour atteindre 82,3 pour
100 000 habitants (étendue: 52,9-178,3) en 2016. Nous avons constaté d'importantes variations du profil épidémiologique de la tuberculose entre les différentes régions. L'analyse en coordonnées principales a révélé que trois indicateurs agrégés contribuaient pour 55% aux variations. La première coordonnée correspondait à la prévalence et aux notifications de cas de tuberculose dans les régions considérées; la deuxième correspondait à la gravité de la maladie chez les patients atteints; et la troisième correspondait au pourcentage de tuberculose multirésistante chez les patients atteints. Les régions où les interventions étaient les plus urgentes étaient le district autonome de Tchoukotka, l'oblast autonome juif et la République de Touva.Conclusion La variabilité de l'épidémiologie de la tuberculose entre les régions était probablement due à des différences dans la qualité des services antituberculeux. Il peut être utile de définir précisément les interventions nécessaires, comme déterminé à l'aide de la méthode d'analyse en coordonnées principales, pour orienter les efforts de lutte contre la tuberculose.
Резюме
Разница в показателях распространенности туберкулеза в Российской Федерации: многофакторный подходЦель Анализ тенденций развития эпидемиологической ситуации по туберкулезу в Сибирском и Дальневосточном федеральных округах, то есть в областях с максимальным бременем заболевания на территории Российской Федерации.Методы Авторы применили анализ главных координат для изучения в общей сложности 68 релевантных факторов эпидемиологической ситуации по туберкулезу, его профилактике и контролю. За период с 2003 по 2016 год были собраны данные по этим факторам в общей сложности в 21 субъекте Сибирского федерального округа и Дальневосточного федерального округа (общая численность населения: 25,5 млн человек) на основе федеральной и ведомственной систем отчетности. Авторы определили регионы с благоприятным и неблагоприятным эпидемиологическим профилем по туберкулезу и классифицировали их по группам с низким и высоким уровнем необходимости специализированного вмешательства.Результаты Среднее число уведомлений о заболевании т у б е р к у л е з о м в р е г и о н а х с о с т а в и л о 1 2 3 , 3 н а 100 000 населения (диапазон 54,5–265,7) в 2003 году; этот
показатель сократился до 82,3 на 100 000 населения (диапазон: 52,9–178,3) в 2016 году. Авторы выявили значительную разницу в факторах эпидемиологического профиля по туберкулезу в разных регионах. Анализ главных координат выявил три сводных показателя, ответственные за 55% случаев различия факторов. Первая координата соответствовала распространенности туберкулеза и уведомлениям о случаях заболевания в регионах, вторая соответствовала тяжести заболевания пациентов, а третья — процентной доле мультирезистентной формы туберкулеза среди пациентов. К числу регионов, требующих наиболее срочного вмешательства, относятся Чукотский автономный округ, Еврейская автономная область и Республика Тыва.Вывод Разница в показателях эпидемиологической ситуации по туберкулезу в разных регионах, вероятнее всего, обусловлена разным уровнем качества противотуберкулезных мероприятий. Точное определение необходимых вмешательств, выявленных методом анализа главных координат, может помочь в концентрации усилий по борьбе с туберкулезом.
Resumen
Variaciones en la prevalencia de la tuberculosis, Federación de Rusia: un enfoque multivariadoObjetivo Analizar las tendencias epidemiológicas de la tuberculosis en los distritos federales de Siberia y Extremo Oriente, las zonas con mayor carga de morbilidad de la Federación de Rusia.Métodos Se aplicó el análisis de coordenadas principales para estudiar un total de 68 variables relevantes en epidemiología, prevención y control de la tuberculosis. Los datos sobre estas variables se recopilaron entre 2003 y 2016 en las 21 regiones del distrito federal de Siberia y del distrito federal del Extremo Oriente (población total: 25,5 millones) a través del sistema de presentación de informes federal y departamental. Se identificaron las regiones con un perfil epidemiológico favorable o desfavorable de la tuberculosis y se clasificaron como de baja o alta prioridad para intervenciones específicas.
Resultados El número promedio de notificaciones de tuberculosis en las regiones fue de 123,3 por cada 100 000 habitantes (rango: 54,5-265,7) en 2003, disminuyendo a 82,3 por cada 100 000 habitantes (rango: 52,9-178,3) en 2016. Se encontraron notables variaciones en el perfil epidemiológico de la tuberculosis entre las diferentes regiones. El análisis de las coordenadas principales reveló que tres indicadores agregados representaban el 55 % de la variación. La primera coordenada correspondía a la prevalencia de la tuberculosis y las notificaciones de casos en las regiones; la segunda a la gravedad de la enfermedad entre los pacientes; y la tercera al porcentaje de tuberculosis multirresistente entre los pacientes con tuberculosis. Las regiones en las que la

745Bull World Health Organ 2019;97:737–745A| doi: http://dx.doi.org/10.2471/BLT.19.229997
ResearchTuberculosis in the Asian part of the Russian FederationIvan Meshkov et al.
intervención era más urgente eran el Distrito Autónomo de Chukotka, la Provincia Autónoma Hebrea y la República de Tyva.Conclusión La variabilidad en la epidemiología de la tuberculosis entre regiones se debió probablemente a las diferencias den la calidad de los
servicios de tratamiento antituberculoso. La precisión en la definición de las intervenciones necesarias, determinada a través del enfoque de análisis de coordenadas principales, puede guiar los esfuerzos focalizados de control de la tuberculosis.
References1. Tuberculosis notification rate in the Russian Federation. In: Tuberculosis
in the Russian Federation, 2009. An analytical review of the tuberculosis statistical indicators used in the Russian Federation. Moscow: Ministry of Health and Social Development of the Russian Federation; 2011. Available from: http://mednet.ru/images/stories/files/static/VOZ_tub_2009_eng.pdf [cited 2019 Jan 17].
2. Brizhatyuk EV, Kulchavenya EV. Specifics of epidemiological situation regarding extrapulmonary tuberculosis in Siberia and Far East. Tuber Lung Dis. 2015;93(5):51–2. [Russian.] Available from: https://www.tibl-journal.com/jour/article/view/388/389 [cited 2019 Jan 17].
3. Krasnov VA, Revyakina OV, Filimonov PN, Stepanov DV, Maltsev AV. Influence of some demographic and geographic factors on antituberculous care in the regions of Siberia and Far East. Tuber Lung Dis. 2012;89(8):10–5. Russian. Available from: https://elibrary.ru/item.asp?id=20469885 [cited 2019 Jan 17].
4. Krasnov VA, Revyakina OV, Alekseeva TV, Filippova OP, Pavlenok IV. The major indicators of antituberculosis activity of medical services in Siberian and Far Eastern regions. Novosibirsk: Novosibirsk State Medical University publications and printing office; 2017. Russian. Available from: https://drive.google.com/file/d/0B-pPYwGOnjVISHdRYXEwQzFsNG8/view [cited 2019 Jan 17].
5. Jolliffe IT. Principal component analysis. 2nd ed. New York: Springer-Verlag; 2002.
6. Supplementary Table 1. Variables used in the analysis. London: Figshare; 2019. doi: http://dx.doi.org/https://doi.org/10.6084/m9.figshare.7583273.v3doi: http://dx.doi.org/10.6084/m9.figshare.7583273.v3
7. Shilova MV. [The tuberculosis epidemic situation in the Russian Federation by early 2009.] Tuber Lung Dis. 2010;87(5):14–21. Russian. Available from: https://elibrary.ru/item.asp?id=16496166 [cited 2019 Jun 26].
8. Nechaeva OB. [The tuberculosis and HIV infection situation in Russia.] Tuber Lung Dis. 2014;91(6):9–16. Russian. Available from: https://elibrary.ru/item.asp?id=21922003 [cited 2019 Jun 26].
9. Ors F, Deniz O, Bozlar U, Gumus S, Tasar M, Tozkoparan E, et al. High-resolution CT findings in patients with pulmonary tuberculosis: correlation with the degree of smear positivity. J Thorac Imaging. 2007 May;22(2):154–9. doi: http://dx.doi.org/10.1097/01.rti.0000213590.29472.ce PMID: 17527119
10. Hassanzad M, Bolursaz MR, Mehrian P, Aghahosseini F, Velayati AA. Relation between smear positivity and imaging findings in children with pulmonary tuberculosis. Int J Mycobacteriol. 2016 Dec;5 Suppl 1:S163. doi: http://dx.doi.org/10.1016/j.ijmyco.2016.08.007 PMID: 28043529
11. te Riele JB, Buser V, Calligaro G, Esmail A, Theron G, Lesosky M, et al. Relationship between chest radiographic characteristics, sputum bacterial load, and treatment outcomes in patients with extensively drug-resistant tuberculosis. Int J Infect Dis. 2019 Feb;79:65–71. doi: http://dx.doi.org/10.1016/j.ijid.2018.10.026 PMID: 30395979
12. Gentleman R, Carey V, Huber W, Irizarry R, Dudoit S, editors. Bioinformatics and computational biology solutions using R and bioconductor. New York: Springer-Verlag; 2005. doi: http://dx.doi.org/10.1007/0-387-29362-0
13. Srinivasan Perumbakkam S, Kohl M. Statistical learning in precision medicine. In: Deigner HP, Kohl M, editors. Precision medicine: tools and quantitative approaches. London: Academic Press; 2018. pp. 47–56. doi: http://dx.doi.org/10.1016/B978-0-12-805364-5.00003-2
14. Racine JS. RStudio: a platform-independent IDE for R and Sweave. J Appl Econ. 2012;27(1):167–72. doi: http://dx.doi.org/10.1002/jae.1278
15. Supplementary Table 2. Correlations between analysed variables and the epidemiological welfare-associated coordinate. London: Figshare; 2019. doi: http://dx.doi.org/10.6084/m9.figshare.7963010.v3doi: http://dx.doi.org/10.6084/m9.figshare.7963010.v3
16. Supplementary Table 3. Correlations between analysed variables and the control of severe tuberculosis-associated coordinate. London: Figshare; 2019. doi: http://dx.doi.org/10.6084/m9.figshare.7963025.v2doi: http://dx.doi.org/10.6084/m9.figshare.7963025.v2
17. Supplementary Table 4. Correlations between analysed variables and the multidrug resistant-tuberculosis control-associated coordinate. London: Figshare; 2019. doi: http://dx.doi.org/10.6084/m9.figshare.7963034.v2doi: http://dx.doi.org/10.6084/m9.figshare.7963034.v2
18. Galkin VB, Sterlikov SA, Balasanyants GS, Yablonsky PK. Changes in the prevalence of drug resistant tuberculosis. Tuber Lung Dis. 2017;95(3):5–12. Russian. doi: http://dx.doi.org/10.21292/2075-1230-2017-95-3-5-12
19. Russia - Basemap (as of 20 Feb 2017) [internet]. New York: Reliefweb; 2017. Available from: https://reliefweb.int/map/russian-federation/russia-basemap-20-feb-2017 [cited 2019 Aug 26].
20. Supplementary Figure 1. Trends of tuberculosis prevalence in Chukotka Autonomous Okrug and Tyva Republic, Russian Federation London: Figshare; 2019. doi: http://dx.doi.org/10.6084/m9.figshare.8796149.v1doi: http://dx.doi.org/10.6084/m9.figshare.8796149.v1
21. Supplementary Figure 2. Trends of tuberculosis case notification rate in Chukotka Autonomous Okrug and Tyva Republic, Russian Federation. London: Figshare; 2019. doi: http://dx.doi.org/10.6084/m9.figshare.8796152.v1doi: http://dx.doi.org/10.6084/m9.figshare.8796152.v1
22. Supplementary Figure 3. Trends of tuberculosis case notification in the urban populations of the Jewish Autonomous Oblast, Irkutsk Oblast, Altai Krai and Primorskiy Krai regions, Russian Federation. London: Figshare; 2019. doi: http://dx.doi.org/10.6084/m9.figshare.8796155.v1doi: http://dx.doi.org/10.6084/m9.figshare.8796155.v1
23. Supplementary Figure 4. Trends of prevalence of HIV and tuberculosis co-infection in Jewish Autonomous Oblast, Irkutsk Oblast, Altai Krai and Primorsky Krai, Russian Federation. London: Figshare; 2019. doi: http://dx.doi.org/10.6084/m9.figshare.8796161.v1doi: http://dx.doi.org/10.6084/m9.figshare.8796161.v1
24. Supplementary Figure 5. Trends of tuberculosis mortality in Jewish Autonomous Oblast, Irkutsk Oblast, Altai Krai and Primorsky Krai, Russian Federation. London: Figshare; 2019. doi: http://dx.doi.org/10.6084/m9.figshare.8796257.v1doi: http://dx.doi.org/10.6084/m9.figshare.8796257.v1
25. Taran DV. Global Fund to Fight AIDS, Tuberculosis and Malaria project (RUS-304- G02T): Tomsk Oblast comprehensive strategy on reducing the burden of drug-resistant tuberculosis. Tuber Lung Dis. 2014; 2S:3–80. Russian.
26. Revich BA. Determinants of public health in Arctic and Subarctic territories of Russia. Stud Russ Econ Dev. 2017;28(1):39–47. doi: http://dx.doi.org/10.1134/S1075700717010099
27. Alekseeva TV, Revyakina OV, Filippova OP, Krasnov VA. [Tuberculosis in Siberian and Far Eastern federal districts (2007–2016).] Tuber Lung Dis. 2017;95(8):12–7. Russian. doi: http://dx.doi.org/10.21292/2075-1230-2017-95-8-12-17
28. Tsybikova EB. [Organization-wise failure cases in population-based treatment for primary identified pulmonary tuberculosis in Russia.] Soc Aspects Pop Health. 2011;21(5). Russian. Available from: http://vestnik.mednet.ru/content/view/365/lang,ru/ [cited 2019 Jun 30].
29. Koretskaya NM, Shogzhal IS. Modern clinicosocial characteristics of first-revealed tuberculosis of respiratory apparatus in women of Tuva Republic. Acta Biomedica Scientifica. 2012;2:91–5. [Russian.] Available from: https://elibrary.ru/item.asp?id=17930099 [cited 2019 Jan 17].
Bull World Health Organ 2019;97:737–745A| doi: http://dx.doi.org/10.2471/BLT.19.229997 745A
ResearchTuberculosis in the Asian part of the Russian FederationIvan Meshkov et al.
Fig. 7. Location of administrative regions in the Asian part of the Russian Federation in three principal coordinates in accordance with the values of tuberculosis epidemiological variables
–1500 –1000 –500 0 500
Coor
dina
te as
socia
ted
with
cont
rol o
f sev
ere t
uber
culo
sis
Coordinate associated with epidemiological welfare
600
400
200
0
–200
–400
–400 to –200–200 to 00 to 200200 to 400>400
Coordinate associated with control of MDR-tuberculosis
Sakha Republic
ChukotkaAutonomous Okrug
Magadan Oblast
Tomsk Oblast
Sakhalin Oblast
32
1
Kamchatka Krai
Primorsky Krai Altai Krai
Irkutsk Oblast
Tyva Republic
JewishAutonomous Oblast
MDR: multidrug resistant.Notes: The administrative regions are represented as points plotted accordingly to their values on the principal coordinates. The values of the epidemiological welfare and control of severe tuberculosis coordinates correspond to the x- and y-axes respectively and the values of the multidrug-resistant tuberculosis control coordinate are shown by the white–black gradient of the points. For positive correlations, the higher the value of the principal coordinate, the higher the value of associated epidemiological variables. For negative correlations, the higher the value of the principal coordinate, the lower the value of associated epidemiological variables. Groups of administrative regions are coded as follows: 1. Amur Oblast, Kemerovo Oblast and Novosibirsk Oblast; 2. Altai Republic and Buryatia Republic, Khabarovsk Krai, Khakassia Republic, Krasnoyarsk Krai and Omsk Oblast; 3. Zabaykalsky Krai.