vascular function at baseline in the hemodialysis fistula ... · high-resolution linear ultrasound...
TRANSCRIPT

Vascular Function at Baseline in the Hemodialysis Fistula MaturationStudyLaura M. Dember, MD; Peter B. Imrey, PhD; Mai-Ann Duess, BS; Naomi M. Hamburg, MD, MS; Brett Larive, MS; Milena Radeva, MS;Jonathan Himmelfarb, MD; Larry W. Kraiss, MD; John W. Kusek, PhD; Prabir Roy-Chaudhury, MD, PhD; Christi M. Terry, PhD;Miguel A. Vazquez, MD; Wanpen Vongpatanasin, MD; Gerald J. Beck, PhD; Joseph A. Vita, MD;* Hemodialysis Fistula MaturationStudy Group†
Background-—End-stage renal disease is accompanied by functional and structural vascular abnormalities. The objective of thisstudy was to characterize vascular function in a large cohort of patients with end-stage renal disease, using noninvasivephysiological measurements, and to correlate function with demographic and clinical factors.
Methods and Results-—We analyzed cross-sectional baseline data from the Hemodialysis Fistula Maturation Study, a multicenterprospective observational cohort study of 602 patients with end-stage renal disease from 7 centers. Brachial artery flow- andnitroglycerin-mediated dilation, carotid-femoral and -radial pulse wave velocity, and venous occlusion plethysmography wereperformed prior to arteriovenous fistula creation. Relationships of these vascular function measures with demographic, clinical, andlaboratory factors were evaluated using linear mixed-effects models. Arterial function, as assessed by flow- and nitroglycerin-mediated dilation and carotid-femoral pulse wave velocity, worsened with increasing age and diabetes mellitus. Venouscapacitance decreased with diabetes mellitus but not with age. Flow-mediated dilation was higher among patients undergoingmaintenance dialysis than for those at predialysis, and a U-shaped relationship between serum phosphorus concentration and flow-mediated dilation was evident. Partial correlations among different measures of vascular function, adjusting for demographicfactors, diabetes mellitus, and clinical center, were modest or essentially nonexistent.
Conclusions-—Multiple demographic and clinical factors were associated with the functions of vessels of different sizes and typesin this large cohort of patients with end-stage renal disease. Low correlations between the different measures, controlling fordemographic factors, diabetes mellitus, and center, indicated that these different types of vascular function otherwise varyheterogeneously across patients. ( J Am Heart Assoc. 2016;5:e003227 doi: 10.1161/JAHA.116.003227)
Key Words: chronic kidney disease • end-stage renal disease • flow-mediated dilation • nitroglycerin-mediated dilation • pulsewave velocity • vascular function • venous occlusion plethysmography
P atients with end-stage renal disease (ESRD) have a highburden of vascular disease as a result of both traditional
risk factors such as hypertension and diabetes mellitus andnontraditional risk factors such as disordered mineral
metabolism. Brachial artery flow-mediated dilation (FMD)and pulse wave velocity (PWV) are noninvasive physiologicalmeasures of arterial function that provide information aboutendothelial function and arterial stiffness, respectively.
From the Perelman School of Medicine, University of Pennsylvania, Philadelphia, PA (L.M.D.); Department of Quantitative Health Sciences, Cleveland Clinic LernerCollege of Medicine of Case Western Reserve University, Cleveland, OH, (P.B.I., B.L., M.R., G.J.B.); Boston University School of Medicine, Boston, MA (M.-A.D., N.M.H.,J.A.V.); University of Washington, Seattle, WA (J.H.); University of Utah, Salt Lake City, UT (L.W.K., C.M.T.); National Institute of Diabetes and Digestive and KidneyDiseases, Bethesda, MD (J.W.K.); University of Arizona, Tuscon, AZ (P.R.-C.); University of Texas-Southwestern, Dallas, TX (M.A.V., W.V.).
Accompanying Data S1 and Tables S1 through S5 are available at http://jaha.ahajournals.org/content/5/7/e003227/DC1/embed/inline-supplementary-material-1.pdf
*Deceased.†A complete list of the Hemodialysis Fistula Maturation Study Group members can be found in the Appendix at the end of the manuscript.
Portions of this work were presented at the American Society of Nephrology Kidney Week in San Diego, CA, October 30—November 4, 2012.
Correspondence to: Laura M. Dember, MD, Renal, Electrolyte and Hypertension Division, Center for Clinical Epidemiology and Biostatistics, Perelman School ofMedicine, University of Pennsylvania, 920 Blockley Hall, 423 Guardian Drive, Philadelphia, PA 19104. E-mail: [email protected]
Received January 21, 2016; accepted May 27, 2016.
ª 2016 The Authors. Published on behalf of the American Heart Association, Inc., by Wiley Blackwell. This is an open access article under the terms of the CreativeCommons Attribution-NonCommercial-NoDerivs License, which permits use and distribution in any medium, provided the original work is properly cited, the use isnon-commercial and no modifications or adaptations are made.
DOI: 10.1161/JAHA.116.003227 Journal of the American Heart Association 1
ORIGINAL RESEARCH

Among persons with preserved kidney function, both reducedFMD and increased PWV predict future cardiovascularevents.1,2 Forearm venous occlusion plethysmography (VOP)provides an indirect indication of venous capacitance bymeasuring the increase in forearm volume in response tooutflow obstruction.3 Venous capacitance, as assessed byVOP, has been associated with hemodialysis arteriovenousfistula (AVF) maturation, a process that requires venous aswell as arterial dilation.4 Although it is well appreciated thatESRD is accompanied by structural and functional alterationsin blood vessels, most descriptions of noninvasive physiolog-ical measures of vascular function in ESRD populations comefrom single-center studies that assessed only one type ofvascular function.5–11 It is not known whether the clinical anddemographic factors that are associated with vascularfunction abnormalities among persons with preserved kidneyfunction are also important for ESRD patients. In addition,relationships between different types of vascular function,such as endothelium-dependent and -independent processes,or between functions of different types of vessels, such aselastic arteries, muscular arteries, resistance arterioles, andveins, have not been established in ESRD. It is not known, forexample, whether arterial stiffness is accompanied by lowvenous capacitance after accounting for major systemicfactors such as age.
The Hemodialysis Fistula Maturation Study (HFM) was amulticenter prospective cohort study designed to identifypredictors and underlying mechanisms of hemodialysis AVFmaturation.12 The study enrolled patients with ESRD under-going surgical creation of an AVF. Preoperative vascularfunction studies were performed to determine relationshipsbetween underlying vascular function and AVF maturation.This rich data set provides a unique opportunity to examinethe determinants of vascular function in ESRD, separate fromany linkages to AVF maturation. The objectives of this reportwere to characterize vascular function in the HFM participantsand to describe cross-sectional relationships (1) betweenvascular function measures and demographic, clinical, andbiochemical factors and (2) among the different vascularfunction measures, adjusted in each case for potentialconfounding by age, sex, race, and diabetes mellitus status.
Methods
ParticipantsThe HFM enrolled 602 patients from 7 centers who underwentcreation of an AVF between March 23, 2010, and September23, 2013. Enrollment required completion of at least 2 of thefollowing 3 sets of studies within 45 days prior to AVFcreation: (1) brachial artery FMD followed by nitroglycerin-mediated dilation (NMD) unless contraindicated, (2) carotid-
radial (C-R) and carotid-femoral (C-F) PWV, and (3) VOP.Approval for the study was obtained from the institutionalreview board of each center, and all participants providedinformed consent.
Vascular Function StudiesVascular function studies used uniform protocols and wereperformed by study personnel who were trained and certifiedby the HFM Vascular Function Core at Boston University.Participants fasted for at least 6 hours prior to the studiesand refrained from exercise starting at midnight before thestudies. When possible, all studies were performed on a singleday in the following order: (1) VOP, (2) arterial PWV, (3)brachial artery FMD, and (4) brachial artery NMD. Studieswere performed on the arm that was expected to be used forAVF creation unless there was a patent arteriovenous vascularaccess in that arm. Prior to performing VOP, after a 10-minuteperiod of rest, blood pressure and heart rate were measuredusing a SunTech 247 device (SunTech Medical). Threemeasurements of blood pressure and heart rate wereobtained, each separated by 1 minute.
Brachial artery reactivity
FMD was measured as an indicator of the endothelium-dependent arterial dilatory response to increased blood flow,and NMD was determined as an indicator of the endothe-lium-independent arterial dilatory response to nitroglycerin,an exogenous source of nitric oxide. After placement of acustom Hokanson 3.25″922″ blood pressure cuff with aquick release sphygmomanometer (D.E. Hokanson, Inc.) onthe upper arm and 10 minutes of rest in a supine position, ahigh-resolution linear ultrasound probe (≥7.5 MHz) was usedto obtain 2-dimensional images of the brachial artery andpulsed wave Doppler signals. The blood pressure cuff wasthen inflated to 200 mm Hg or to 50 mm Hg above thesystolic blood pressure, whichever value was higher. After5 minutes of inflation, the cuff was deflated. At 15 secondsafter deflation, brachial artery Doppler signals were obtained.The 2-dimensional images gated on the R-wave wereobtained 55 to 65 seconds after deflation to determineFMD. Following a 10-minute period of rest in a supineposition, 2-dimensional ultrasound imaging of the brachialartery was performed again at the same location used forthe measurement of FMD. Nitroglycerin was administeredsublingually at a dose of 0.4 mg, and brachial arteryultrasound imaging was repeated 3 minutes later to deter-mine NMD. NMD was not assessed if any of the systolicblood pressure readings were <100 mm Hg, if there was useof a phosphodiesterase type 5 inhibitor within the past7 days, or if there was a history of migraine headaches ornitroglycerin intolerance.
DOI: 10.1161/JAHA.116.003227 Journal of the American Heart Association 2
Vascular Function in End-Stage Renal Disease Dember et alORIG
INALRESEARCH
The 2-dimensional images were used for measurement ofbrachial artery diameter using customized software, and theDoppler signals were used for determination of flow. Imageanalysis was performed at the HFM Vascular Function Corefacility at Boston University. Resting and hyperemic flow weredetermined from the Doppler signals. Hyperemic flow isdependent on ischemia-induced dilation of resistance arteri-oles and is mediated in part by nitric oxide.
C-R and C-F arterial PWV
PWV was measured using the SphygmoCor device (AtcorMedical) as an assessment of stiffness of the aorta (C-F PWV)and the upper extremity arteries (C-R PWV). The C-F distancewas computed as the distance from the sternal notch to thefemoral pulse minus the distance from the sternal notch tothe carotid pulse. The C-R distance was computed as thedistance from the sternal notch to the radial pulse minus thedistance from the sternal notch to the carotid pulse. The pulsewaveforms were recorded using applanation tonometry at thecarotid followed by the radial sites for the C-R PWVdetermination and at the carotid followed by the femoralsites for C-F PWV determination. Waveform acquisition wasrepeated if the automated, device-determined standard devi-ation for a set of 10 waveforms was >10%. The QRS complexfrom electrocardiogram leads served as the reference for theorigin of the pulse waveform. Pulse wave velocities areexpressed as meters per second.
Venous occlusion plethysmography
VOP was performed to assess the capacitance of the veins inthe upper extremity. Participants were placed in a supineposition with the arm supported and elevated above the levelof the heart. The Hokanson EC5 strain-gauge plethysmogra-phy device with NIVP3 software was used for waveformacquisition and analysis (D.E. Hokanson, Inc). A strain gaugeof appropriate size was placed around the forearm at theposition of greatest diameter to measure change in forearmcircumference. An SC10D arm cuff (D.E. Hokanson, Inc)placed on the upper arm was inflated for 3 minutes to thedesignated pressure and then deflated using an automatedrapid inflator device. Waveforms were acquired while the cuffwas inflated and for 5 seconds after deflation. The procedurewas performed at cuff inflations to 20, 30, 40, 50, and60 mm Hg in succession. The relative change in forearmvolume after cuff inflation, expressed as milliliter increase per100 mL of forearm volume (mL/100 mL), was determined ateach cuff pressure; the slope of its regression on cuffpressure, termed “capacitance slope,” is taken as theprincipal measure of venous capacitance. This is expressedas the additional fractional expansion of forearm volume (mL/100 mL) per 10-mm Hg increase in cuff pressure and thus in
units D(mL/100 mL)/10 mm Hg. The mean relative increasein forearm volume over the 5 cuff pressures (in mL/100 mL)is also described. The maximum venous outflow (mL/100 mLforearm volume per minute) was also recorded after deflationfrom each cuff pressure. As with capacitance, the slope of itsregression on venous pressure, termed “maximum venousoutflow slope” and reported as D(mL/100 mL per minute)/10 mm Hg, is taken as the principal indicator of maximumvenous outflow. The mean maximum relative venous outflowover the 5 cuff pressures (in mL/100 mL per minute) is alsodescribed.
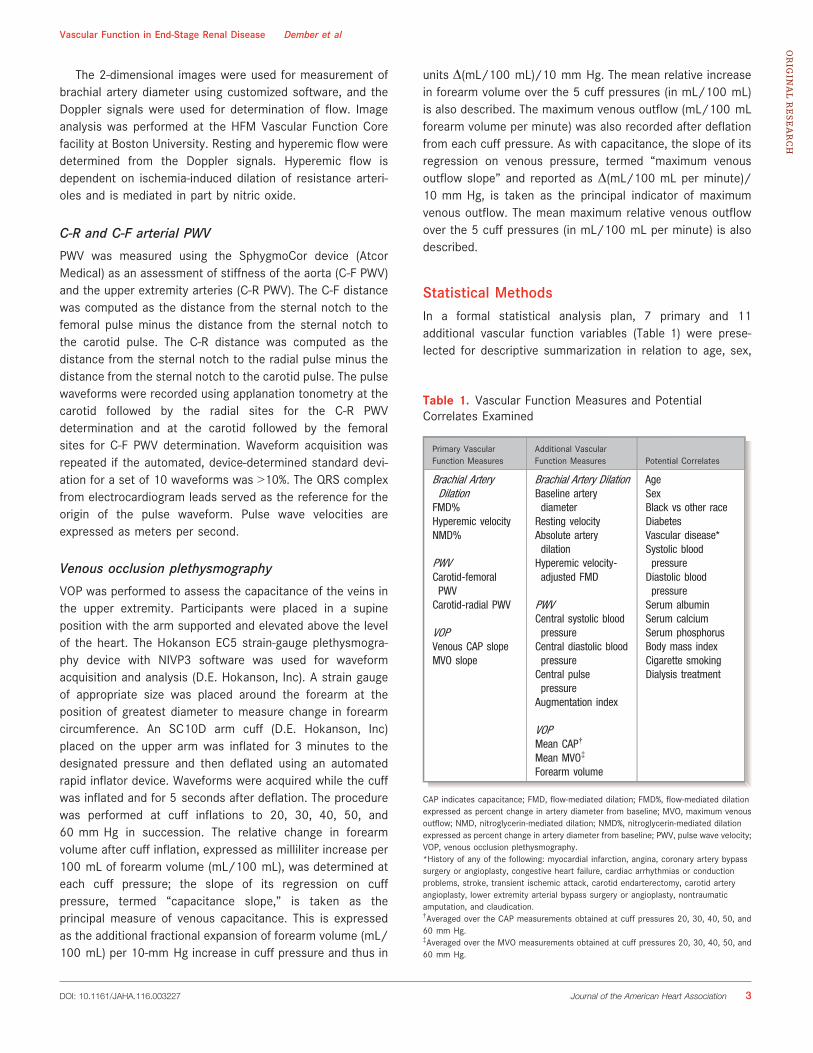
Statistical MethodsIn a formal statistical analysis plan, 7 primary and 11additional vascular function variables (Table 1) were prese-lected for descriptive summarization in relation to age, sex,
Table 1. Vascular Function Measures and PotentialCorrelates Examined
Primary VascularFunction Measures
Additional VascularFunction Measures Potential Correlates
Brachial ArteryDilation
FMD%Hyperemic velocityNMD%
PWVCarotid-femoralPWV
Carotid-radial PWV
VOPVenous CAP slopeMVO slope
Brachial Artery DilationBaseline arterydiameter
Resting velocityAbsolute arterydilation
Hyperemic velocity-adjusted FMD
PWVCentral systolic bloodpressure
Central diastolic bloodpressure
Central pulsepressure
Augmentation index
VOPMean CAP†
Mean MVO‡
Forearm volume
AgeSexBlack vs other raceDiabetesVascular disease*Systolic bloodpressure
Diastolic bloodpressure
Serum albuminSerum calciumSerum phosphorusBody mass indexCigarette smokingDialysis treatment
CAP indicates capacitance; FMD, flow-mediated dilation; FMD%, flow-mediated dilationexpressed as percent change in artery diameter from baseline; MVO, maximum venousoutflow; NMD, nitroglycerin-mediated dilation; NMD%, nitroglycerin-mediated dilationexpressed as percent change in artery diameter from baseline; PWV, pulse wave velocity;VOP, venous occlusion plethysmography.*History of any of the following: myocardial infarction, angina, coronary artery bypasssurgery or angioplasty, congestive heart failure, cardiac arrhythmias or conductionproblems, stroke, transient ischemic attack, carotid endarterectomy, carotid arteryangioplasty, lower extremity arterial bypass surgery or angioplasty, nontraumaticamputation, and claudication.†Averaged over the CAP measurements obtained at cuff pressures 20, 30, 40, 50, and60 mm Hg.‡Averaged over the MVO measurements obtained at cuff pressures 20, 30, 40, 50, and60 mm Hg.
DOI: 10.1161/JAHA.116.003227 Journal of the American Heart Association 3
Vascular Function in End-Stage Renal Disease Dember et alORIG
INALRESEARCH
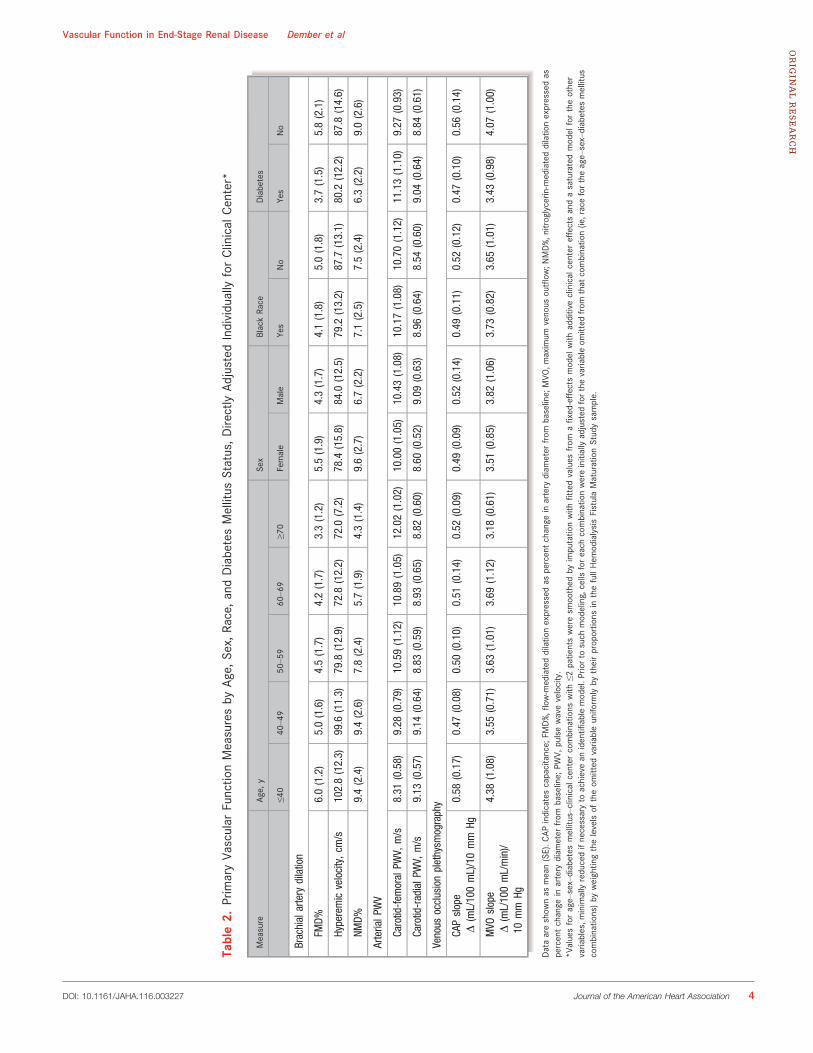
Table2.
PrimaryVa
scular
Functio
nMeasuresby
Age,
Sex,
Race,andDiabetesMellitus
Status,Dire
ctly
Adjusted
Individually
forClinical
Center*
Measure
Age,
ySe
xBlackRa
ceDiabetes
≤40
40–4
950
–59
60–6
9≥7
0Female
Male
Yes
No
Yes
No
Brachialartery
dilation
FMD%
6.0(1.2)
5.0(1.6)
4.5(1.7)
4.2(1.7)
3.3(1.2)
5.5(1.9)
4.3(1.7)
4.1(1.8)
5.0(1.8)
3.7(1.5)
5.8(2.1)
Hyperemicvelocity,cm
/s102.8(12.3)
99.6
(11.3)
79.8
(12.9)
72.8
(12.2)
72.0
(7.2)
78.4
(15.8)
84.0
(12.5)
79.2
(13.2)
87.7
(13.1)
80.2
(12.2)
87.8
(14.6)
NMD%
9.4(2.4)
9.4(2.6)
7.8(2.4)
5.7(1.9)
4.3(1.4)
9.6(2.7)
6.7(2.2)
7.1(2.5)
7.5(2.4)
6.3(2.2)
9.0(2.6)
ArterialP
WV
Carotid-fem
oralPW
V,m/s
8.31
(0.58)
9.28
(0.79)
10.59(1.12)
10.89(1.05)
12.02(1.02)
10.00(1.05)
10.43(1.08)
10.17(1.08)
10.70(1.12)
11.13(1.10)
9.27
(0.93)
Carotid-radialP
WV,
m/s
9.13
(0.57)
9.14
(0.64)
8.83
(0.59)
8.93
(0.65)
8.82
(0.60)
8.60
(0.52)
9.09
(0.63)
8.96
(0.64)
8.54
(0.60)
9.04
(0.64)
8.84
(0.61)
Venous
occlusionplethysm
ography
CAPslope
D(mL/100mL)/10mm
Hg0.58
(0.17)
0.47
(0.08)
0.50
(0.10)
0.51
(0.14)
0.52
(0.09)
0.49
(0.09)
0.52
(0.14)
0.49
(0.11)
0.52
(0.12)
0.47
(0.10)
0.56
(0.14)
MVO
slope
D(mL/100mL/min)/
10mm
Hg
4.38
(1.08)
3.55
(0.71)
3.63
(1.01)
3.69
(1.12)
3.18
(0.61)
3.51
(0.85)
3.82
(1.06)
3.73
(0.82)
3.65
(1.01)
3.43
(0.98)
4.07
(1.00)
Dataareshow
nas
mean(SE).C
APindicatescapacitance;
FMD%,fl
ow-m
ediateddilatio
nexpressedas
percentchange
inartery
diam
eter
from
baseline;
MVO
,maximum
venous
outflow
;NMD%,n
itroglycerin
-mediateddilatio
nexpressedas
percentchange
inartery
diam
eter
from
baseline;
PWV,
pulsewavevelocity.
*Valuesforage–sex–diabetes
mellitus–clinical
center
combinatio
nswith
≤2patie
ntsweresm
oothed
byimputatio
nwith
fitted
values
from
afixed-effectsmodel
with
additiveclinical
center
effectsandasaturatedmodel
fortheother
varia
bles,m
inimallyreducedifnecessaryto
achievean
identifi
ablemodel.P
riorto
such
modeling,cells
foreach
combinatio
nwereinitiallyadjusted
forthevaria
bleom
itted
from
that
combinatio
n(ie,racefortheage–sex–diabetes
mellitus
combinatio
ns)by
weightin
gthelevelsof
theom
itted
varia
bleuniform
lyby
theirproportio
nsin
thefullHem
odialysisFistulaMaturationStudysample.
DOI: 10.1161/JAHA.116.003227 Journal of the American Heart Association 4
Vascular Function in End-Stage Renal Disease Dember et alORIG
INALRESEARCH

race, and self-reported diabetes mellitus status. The primaryvariables were correlated with each other and with prese-lected clinical factors, controlling for these 4 variables(Table 1).
FMD and NMD are expressed as the postischemia andpostnitroglycerin percentage changes (FMD% and NMD%),
respectively, in brachial artery diameter. Recent papers haveargued that diameter change relative to baseline diameter, asin FMD% and NMD%, does not properly standardize arterialdilation to the size of the patient and artery and advocatealternative allometrically adjusted measures.13–15 To see ifsuch allometric adjustment materially affected results, wemodeled 2 suggested alternatives to each of FMD% and NMD%, both formed from regression of log(poststimulus diameter)on log(prestimulus diameter): (1) the patient’s residual fromthis regression14 and (2) the ratio of the patient’s poststim-ulus to prestimulus diameter after first exponentiating thelatter by the estimated regression coefficient.14
For all vascular function variables studied, we used amodified direct-adjustment procedure to estimate means ofeach variable in strata formed separately by age (<40, 40–49,50–59, 60–69, and ≥70 years), sex, black versus other race,and prevalent diabetes and by age–sex–race and age–sex–diabetes mellitus combinations, adjusted to a populationequally distributed across clinical sites.16 For the 2 sets of 3-factor strata estimates, we used a model with clinical sites asfixed blocks and all 3-way interactions of age, sex, race, anddiabetes mellitus (or a minimally further reduced model ifneeded) to impute the site-specific values required by thedirect adjustment approach for 3-factor combinations thatwere absent at specific clinical sites and to smooth site-specific means of combinations with ≤2 patients at ≥1 site.
Table 3. Differences in Vascular Function Measures With Age, Sex, Black Race, and Diabetes Mellitus, Adjusted for ClinicalCenter, From Joint Mixed Multiple Linear Regression Models
Measure
Age (Per Decade) Male Black Race Diabetes
Estimate SE P Value Estimate SE P Value Estimate SE P Value Estimate SE P Value
Brachial artery dilation
FMD% �0.38 0.15 0.013 �0.78 0.39 0.047 �0.50 0.38 0.19 �2.00 0.40 <0.0001
Allometrically adjusted FMD% �0.08 0.13 0.53 1.26 0.34 0.0007 0.08 0.33 0.82 �1.80 0.36 <0.0001
Hyperemic velocity, cm/s �8.37 1.00 <0.0001 �3.63 2.67 0.18 �10.70 2.70 0.0001 �4.17 2.74 0.13
NMD% �1.10 0.20 <0.0001 �3.20 0.60 <0.0001 �0.63 0.57 0.27 �2.60 0.60 <0.0001
Allometrically adjusted NMD% �0.64 0.17 0.0002 0.28 0.49 0.57 0.15 0.46 0.73 �2.40 0.45 <0.0001
Arterial PWV
Carotid-femoral PWV, m/s Age, sex, and race interact with diabetes mellitus. Sex and age interact among patients both with and without diabetesmellitus. P<0.0001 for diabetes mellitus main effect; P<0.0001 for sex by race interaction in diabetes mellitus strata;P=0.003 for linear age; P=0.008 for nonlinear age trend.*
Carotid-radial PWV, m/s �0.03 0.06 0.63 0.52 0.17 0.0024 0.54 0.17 0.0013 0.31 0.16 0.054
Venous occlusion plethysmography
CAP slopeD(mL/100 mL)/10 mm Hg
0.05 0.07 0.52 0.17 0.18 0.36 �0.29 0.18 0.11 �0.41 0.17 0.021
MVO slopeD(mL/100 mL/min)/10 mm Hg
�0.04 0.07 0.52 0.35 0.17 0.036 �0.14 0.17 0.41 �0.27 0.16 0.09
CAP indicates capacitance; FMD%, flow-mediated dilation expressed as percent change in artery diameter from baseline; MVO, maximum venous outflow; NMD%, nitroglycerin-mediateddilation expressed as percent change in artery diameter from baseline; PWV, pulse wave velocity.*See Figure 1 for illustration of interactions.
Figure 1. Trends of fitted C-F PWV means by age for combina-tions of sex, black race, and diabetes mellitus across HemodialysisFistula Maturation Study clinical centers. C-F indicates carotid-femoral, PWV, pulse wave velocity.
DOI: 10.1161/JAHA.116.003227 Journal of the American Heart Association 5
Vascular Function in End-Stage Renal Disease Dember et alORIG
INALRESEARCH

Linear mixed-effects statistical models with random effectsof clinical sites and fixed effects of age, sex, race, anddiabetes mellitus were fitted to each of the 7 primary vascularfunction and 4 alternative allometrically adjusted measures.A stagewise backward elimination procedure was used, withmodels successively tested for classes of interactive andnonlinear effects, potentially allowing recognition of sucheffects if strong, and essentially penalizing complexity andcontrolling overall type 1 statistical error from multipletesting. The effects of age, sex, race, and diabetes mellituson each vascular function variable were then estimated and
tested while controlling simultaneously for the other 3. Effectsof the additional potential demographic and clinical baselinecorrelates of vascular function were similarly examined byincorporation into the age, sex, race, and diabetes mellitusmodel reached by this reduction process. These variableswere retained in all models, regardless of statistical signifi-cance, to adjust for any potential confounding by thesefactors. The examination of each continuous predictorincluded an initial test for nonlinearity.
Statistical associations among the vascular function mea-sures were assessed, controlling for clinical site, age, sex,
Table 4. Differences in Brachial Artery Dilation Measures Associated With Prespecified Baseline Predictors, Adjusted for ClinicalCenter, Age, Sex, Black Race, and Diabetes Mellitus, From Mixed Multiple Linear Regression Models
FMD% Hyperemic Velocity, cm/s NMD%
Estimate SE P Value Estimate SE P Value Estimate SE P Value
BMI, per kg/m2 �0.03 0.02 0.22 0.15 0.17 0.38 �0.06 0.04 0.15
Systolic BP, per 10 mm Hg �0.07 0.08 0.38 0.12 0.05 0.03 �0.41 0.12 0.001
Diastolic BP, per 10 mm Hg 0.04 0.14 0.77 0.32 0.09 0.0003 �0.01 0.21 0.95
Serum albumin, per g/dL �0.30 0.31 0.34 4.05 2.13 0.06 0.17 0.46 0.72
Serum calcium, per mg/dL �0.04 0.23 0.88 3.14 1.54 0.04 0.29 0.31 0.36
Serum phosphorus, per mg/dL Overall P=0.017, nonlinearityP=0.010*
0.98 0.86 0.26 �0.30 0.18 0.10
History of vascular disease† �0.94 0.38 0.02 �5.04 2.72 0.07 �1.23 0.58 0.07
Cigarette use past 12 months �0.80 0.43 0.06 �1.69 2.93 0.56 �0.51 0.63 0.42
Maintenance dialysis 1.20 0.40 0.002 �4.46 2.63 0.09 0.10 0.58 0.87
BMI indicates body mass index; BP, blood pressure, FMD%, flow-mediated dilation expressed as percent change in artery diameter from baseline; NMD%, nitroglycerin-mediated dilationexpressed as percent change in artery diameter from baseline.*See Figure 2.†History of any of the following: myocardial infarction, angina, coronary artery bypass surgery or angioplasty, congestive heart failure, cardiac arrhythmias or conduction problems, stroke,transient ischemic attack, carotid endarterectomy, carotid artery angioplasty, lower extremity arterial bypass surgery or angioplasty, nontraumatic amputation, and claudication.
Table 5. Differences in Arterial Pulse Wave Velocity Associated With Prespecified Baseline Predictors, Adjusted for Clinical Center,Age, Sex, Black Race, and Diabetes Mellitus, From Mixed Multiple Linear Regression Models
Carotid-Femoral PWV Carotid-Radial PWV
Estimate SE P Value Estimate SE P Value
BMI, per kg/m2 �0.01 0.02 0.48 �0.035 0.012 0.003
Systolic BP, per 10 mm Hg 0.34 0.05 <0.0001 0.22 0.03 <0.0001
Diastolic BP, per 10 mm Hg 0.32 0.08 <0.0002 0.52 0.05 <0.0001
Serum albumin, per g/dL 0.06 0.18 0.74 0.04 0.13 0.77
Serum calcium, per mg/dL �0.13 0.12 0.28 �0.09 0.09 0.31
Serum phosphorus, per mg/dL 0.11 0.08 0.15 0.04 0.05 0.43
History of vascular disease* 0.47 0.26 0.07 �0.14 0.17 0.40
Cigarette use past 12 months �0.27 0.27 0.33 0.03 0.18 0.86
Maintenance dialysis �0.39 0.27 0.16 0.32 0.17 0.06
BMI indicates body mass index; BP, blood pressure; PWV, pulse wave velocity.*History of any of the following: myocardial infarction, angina, coronary artery bypass surgery or angioplasty, congestive heart failure, cardiac arrhythmias or conduction problems, stroke,transient ischemic attack, carotid endarterectomy, carotid artery angioplasty, lower extremity arterial bypass surgery or angioplasty, nontraumatic amputation, and claudication.
DOI: 10.1161/JAHA.116.003227 Journal of the American Heart Association 6
Vascular Function in End-Stage Renal Disease Dember et alORIG
INALRESEARCH

black versus other race, and diabetes mellitus, by pairwisePearson correlations of the respective residuals of eachcomponent from the primary adjustment models developedabove.
Analyses were restricted to participants for whom thevariables involved were measured, without imputation ofmissing data. A statistical analysis appendix (Data S1)provides further details of the adjustment and modelingprocesses. Except as otherwise noted, the criterion forstatistical significance was P<0.05 and was met by theassociations reported.
ResultsBaseline characteristics of all 602 HFM participants and thesubgroups with each vascular function test are shown inTable S1. For the full cohort, the mean age was �55 years,44% of the participants were black, and 59% had diabetesmellitus. At the time of AVF creation, 64% were receivingmaintenance dialysis. The most frequent reasons for non-completion of each vascular function study were as follows:(1) for FMD, the study was rejected by the core because oftechnical flaws (5.5%); (2) for NMD, contraindication tonitroglycerin administration was present (9.6%) or the studywas rejected by the core because of technical flaws (5.7%); (3)for PWV, technical data capture difficulties were present dueto atrial fibrillation or body habitus (10.5%) or standarddeviation ≤10% could not be obtained for a set of 10 pulsewaveforms (9.8%); and (4) for VOP, technical or logisticaldifficulties were present at the clinical center (2%). For eachvascular function test, baseline characteristics of participantswho completed the test were similar to those of the fullcohort (Table S1).
Tables 2 and S2 show the primary and additional center-adjusted vascular function measurements, respectively, strat-ified individually by age, sex, race, and diabetes mellitus, eachof which has been found in other populations to be associatedwith FMD or PWV. Tables S3 and S4 show analogous resultsfor the full set of vascular function measurements but jointlystratified by age, sex, and race (Table S3) and by age, sex, anddiabetes mellitus (Table S4). In linear mixed models controllingfor clinical site, age, sex, race, and diabetes mellitus (Table 3),increased age was associated with lower hyperemic velocity,FMD%, and NMD% and higher C-F PWV; male sex wasassociated with lower FMD%, lower NMD%, higher C-R PWV,and higher maximum venous outflow slope. Black race wasassociated with lower hyperemic velocity and higher C-R PWV,and diabetes mellitus was associated with lower FMD, NMD,and venous capacitance slope and higher C-F PWV and wasmarginally significantly associated with higher C-R PWV. Asillustrated in Figure 1, for C-F PWV, there were interactionsbetween diabetes mellitus and age, sex, and race. C-F PWV, forexample, increased with age but was higher among youngerpatients with diabetes mellitus than in older patients withoutdiabetes mellitus and was higher among female than maleblack patients with diabetes mellitus but lower in femalepatients in other subgroups. The relationship between C-F-PWV and age appeared nonlinear, steepening at �45 years.Allometric adjustment (Table 3) for FMD% removed the age-related decline and a trend to lower values among blackpatients and reversed the male–female difference. For NMD%,allometric adjustment attenuated the age-related decline by42% and removed both the effect of sex and the trend to lowervalues among black patients. Allometric adjustment had onlyminimal effects on diabetes-associated reductions for FMD%and NMD%.
Table 6. Differences in Venous Occlusion Plethysmography Measures Associated With Prespecified Baseline Predictors, Adjustedfor Clinical Center, Age, Sex, Black Race, and Diabetes Mellitus, From Mixed Multiple Linear Regression Models
CAP Slope, D(mL/100 mL)/10 mm Hg MVO Slope, D(mL/100 mL/min)/10 mm Hg
Estimate SE P Value Estimate SE P Value
BMI, per kg/m2 �0.067 0.011 <0.0001 �0.455 0.103 <0.0001
Systolic BP, per 10 mm Hg 0.021 0.036 0.56 0.039 0.033 0.25
Diastolic BP, per 10 mm Hg 0.007 0.061 0.91 0.041 0.055 0.45
Serum albumin, per g/dL �0.164 0.140 0.24 �3.066 1.300 0.02
Serum calcium, per mg/dL �0.099 0.098 0.31 �0.946 0.894 0.29
Serum phosphorus, per mg/dL 0.114 0.054 0.04 0.929 0.509 0.07
History of vascular disease* �0.097 0.176 0.60 2.98 1.66 0.079
Cigarette use past 12 months 0.100 0.187 0.59 �1.041 1.763 0.56
Maintenance dialysis 0.115 0.185 0.53 2.79 1.74 0.11
BMI indicates body mass index; BP, blood pressure.*History of any of the following: myocardial infarction, angina, coronary artery bypass surgery or angioplasty, congestive heart failure, cardiac arrhythmias or conduction problems, stroke,transient ischemic attack, carotid endarterectomy, carotid artery angioplasty, lower extremity arterial bypass surgery or angioplasty, nontraumatic amputation, and claudication.
DOI: 10.1161/JAHA.116.003227 Journal of the American Heart Association 7
Vascular Function in End-Stage Renal Disease Dember et alORIG
INALRESEARCH

Additional factors that were hypothesized to affect vascu-lar function were evaluated for associations with each of thevascular function tests in models incorporating age, sex, race,and diabetes mellitus (Tables 4 through 6). For FMD, clinicalhistory of vascular disease and dialysis treatment wereassociated with lower and higher FMD%, respectively, and therelationship with serum phosphorus was U-shaped with higherFMD% at low serum phosphorus concentrations and at highconcentrations (Figure 2). For hyperemic velocity, both sys-tolic and diastolic brachial artery blood pressures wereassociated with higher ischemia-induced velocity, and forNMD, systolic brachial artery blood pressure was associatedwith lower nitroglycerin responsiveness. Relationships
between FMD% and both dialysis treatment and phosphoruspersisted with allometric adjustment, as did the relationshipbetween NMD% and systolic blood pressure. Allometricadjustment converted an association of vascular diseasehistory with reduced NMD% from marginally nonsignificant(P=0.07) to marginally statistically significant (P=0.04)(Table S5). For PWV, systolic and diastolic blood pressureswere both associated with higher C-F and C-R PWV, and bodymass index was associated with lower C-R PWV but not withC-F PWV. For the VOP measures, higher body mass index wasassociated with lower capacitance and maximum outflowslopes, higher serum albumin was associated with lowermaximum outflow slope, and higher serum phosphorus wasassociated with higher venous capacitance slope and margin-ally nonsignificantly associated with higher maximum venousoutput slope.
Partial correlations between different vascular functionstudies are shown in Table 7. After controlling for demographicfactors and diabetes mellitus, relationships of reasonablemagnitude were evident for (1) FMD% and NMD% (R=0.503,P<0.0001) and (2) venous capacitance and maximum venousoutflow slopes (R=0.671, P<0.0001). There were statisticallysignificant but modest correlations between C-F and C-R PWV(R=0.196, P<0.0001) and between C-F PWV and NMD%(R=0.167, P=0.0027). There were no apparent relationshipsbetween venous capacitance or maximum outflow slopes andany of themeasures of arterial function or betweenmeasures ofbrachial artery dilation (FMD or NMD) and PWV.
DiscussionWe performed a comprehensive assessment of vascularfunction in a large cohort of patients who were being treatedwith hemodialysis or were anticipated to begin hemodialysiswithin 3 months. The assessment included evaluation ofarteries of different sizes and types as well as the venoussystem. Some, but not all, attributes that have beenassociated with impairment in vascular function in popula-tions without chronic kidney disease were similarly associatedwith vascular functional impairment in our ESRD cohort.Conversely, some of the associations we identified have notbeen described previously in other populations. Of note, aftercontrolling for the contributions of age, sex, black race,diabetes mellitus, and clinical center, we found only modestcorrelations among the major categories of vascular functionmeasurements, indicating that the different types of vascularfunction vary relatively autonomously after accounting forthese case-mix factors. Overall, in comparison with cohortswithout ESRD, arterial function in the HFM cohort was poorwith low FMD and NMD and high C-F PWV, indicatingsubstantial impairments in endothelial function, nitric oxideresponsiveness, and arterial compliance, respectively.17–20
A
B
Figure 2. Relationship of FMD% to baseline phosphorus. A,Scatterplot of raw data for FMD% and phosphorus at baseline. B,Fitted mean phosphorus values for a mixed statistical model forFMD% in which the relationship of FMD% to serum phosphorus isadditively adjusted for Hemodialysis Fistula Maturation Studyclinical centers and age, sex, race, and diabetes mellitus atbaseline. Lines connect predicted means for each age–sex–racecombination. FMD indicates flow-mediated dilation expressed aspercent change in artery diameter from baseline.
DOI: 10.1161/JAHA.116.003227 Journal of the American Heart Association 8
Vascular Function in End-Stage Renal Disease Dember et alORIG
INALRESEARCH

The relationships between demographic factors andbrachial artery reactivity in the HFM participants were similarto those identified in studies of persons with preserved kidneyfunction. In the absence of allometric adjustment, increasedage and male sex were associated with lower FMD and NMDin our cohort, as in other populations.21,22 In addition, aspreviously reported, FMD% was higher in men than in womenafter incorporation of allometric adjustment.14 Although blackrace was associated with lower hyperemic velocity, we foundno relationship between black race and FMD to NMD; thisfinding differs from a previous study of a cohort withoutchronic kidney disease in which black race was associatedwith higher NMD.23 Among the clinical factors we evaluated,diabetes mellitus was associated with lower FMD and NMD,similar to many studies of other populations.24,25 The findingthat FMD was greater among those receiving treatment withmaintenance hemodialysis than in those who had not yetinitiated dialysis is consistent with dialytic removal ofmediators of endothelial dysfunction and, importantly, sug-gests that endothelial function is modifiable in this patientpopulation. The largely U-shaped relationship that weobserved between serum phosphorus and FMD, with higherFMD% at both low and high phosphorus concentrations, hasnot been reported in other cohorts. Higher FMD at lowphosphorus concentrations is consistent with the generallyaccepted view that phosphorus has deleterious effects on thevasculature, at least in part by promoting calcification.26,27 Itis not clear, however, why a benefit of low phosphorus wasnot also evident for NMD or PWV, each of which has moreobvious dependence than FMD on vessel wall structure, orwhy FMD would be better at markedly elevated, comparedwith moderately elevated, phosphorus levels. Adjustment by
dialysis status did not notably alter the shape of the FMD–phosphorus relationship, suggesting that the observed rela-tionship was not simply a reflection of different phosphorusconcentrations in patients before and after initiation ofmaintenance dialysis.
The associations of C-F PWV with age, diabetes mellitus,and both systolic and diastolic blood pressures observed inthis study are consistent with well-established risk factors foraortic vascular stiffness28,29; however, the interaction of ageand diabetes in our cohort, with a greater impact of diabetesmellitus at younger versus older ages, has not beenhighlighted in cohorts without chronic kidney disease. Ourfinding may reflect greater severity of manifestations ofdiabetes mellitus, including diabetes-associated vasculardisease, among diabetic patients who develop ESRD atyounger ages. In contrast to C-F PWV, we found noassociation of age and only a borderline statistically non-significant association of diabetes mellitus with higher C-RPWV. Our finding of different risk factors for elevated C-F andC-R PWV is consistent with the results of Pannier et al, whomeasured C-F and C-R PWV in 305 patients with ESRD andfound pulse pressure to be the only factor associated with C-RPWV, whereas age, diabetes mellitus, pulse pressure, smok-ing, and low-density lipoprotein cholesterol were each asso-ciated with C-F PWV.30 In the population without chronickidney disease, increases in stiffness associated with agingare greater for the aorta than for peripheral arteries31; asimilar pattern could underlie the absence of a detectablerelationship between C-R PWV and age in the HFM cohort.
Little is known about determinants of venous function ineither the presence or absence of chronic kidney disease. Theinverse association between serum albumin concentration
Table 7. Partial Pearson Correlations Between Primary Vascular Function Measures Controlling for Clinical Center, Age, Sex, BlackRace, and Diabetes Mellitus
Variable Hyperemic Velocity NMD% C-F PWV C-R PWV CAP Slope MVO Slope
FMD% 0.150, P=0.0027,n=494
0.503, P<0.0001,n=421
�0.076, P=0.14,n=382
0.080, P=0.12,n=383
�0.033, P=0.22,n=517
0.048, P=0.51,n=517
Hyperemicvelocity
— 0.163, P=0.0007,n=412
0.039, P=0.81,n=376
0.020, P=0.63,n=377
0.101, P=0.013,n=504
0.062, P=0.24,n=504
NMD% — — �0.167, P=0.0027,n=321
0.026, P=0.65,n=321
�0.014, P=0.65,n=434
0.039, P=0.70,n=434
C-F PWV — — — 0.196, P<0.0001,n=420
�0.014, P=0.42,n=420
0.038, P=0.56,n=420
C-R PWV — — — — 0.020, P=0.68,n=421
0.038, P=0.50,n=421
CAP slope — — — — — 0.671, P<0.0001,n=569
CAP indicates capacitance; C-F, carotid-femoral; C-R, carotid-radial; NMD%, nitroglycerin-mediated dilation expressed as percent change in artery diameter from baseline; MVO, maximumvenous outflow; NMD%, nitroglycerin-mediated dilation expressed as percent change in artery diameter from baseline; PWV, pulse wave velocity.
DOI: 10.1161/JAHA.116.003227 Journal of the American Heart Association 9
Vascular Function in End-Stage Renal Disease Dember et alORIG
INALRESEARCH
and venous outflow may relate to the effects of albumin onblood viscosity. The inverse associations of body mass indexwith venous capacitance slope and maximum venous outflowmay underlie, in part, previously reported associationsbetween obesity and AVF failure.32,33
The absence of relationships among different types ofvascular function, after adjustment for demographic factorsand diabetes mellitus, indicates heterogeneity in patterns ofvascular function. The finding that partial associations of eachof the arterial function measures with venous function werenonsignificant or negligible is particularly striking.
Our study has limitations. Because participants wererequired to complete only 2 of the 3 groups of vascularfunction tests (brachial artery reactivity, PWV, and VOP),missing NMD and PWV data limit the precision of estimatesand the power to confirm their associations with possiblecorrelates. Although the similar characteristics of testcompleters and the full cohort (Table S1) do not suggestthis, possible nonresponse bias is also a concern inprinciple. The lack of normative values for the vascularfunction studies that we conducted limits comparisonsbetween the HFM cohort and persons with preserved kidneyfunction. Our assessment of arterial stiffness was restrictedto PWV and did not include direct assessments of arterialdistensibility. Finally, cross-sectional data cannot supportcausal inferences.
Our study also has a number of strengths. The sample sizeis substantially larger than most previous studies of vascularfunction in advanced chronic kidney disease, and the array ofvascular studies performed is more comprehensive. Themeasurements were performed at multiple centers usinguniform protocols and central evaluation and quality control ofthe brachial artery ultrasound images. Consideration ofallometric scaling in sensitivity analyses allowed us todetermine that most FMD and NMD findings were qualitativelysimilar if the degree of dilation was allometrically standardizedto body size and brachial artery diameter.
In summary, this study provides the cross-sectional resultsof a comprehensive assessment of vascular function in a largecohort of patients with ESRD, describes the relationshipsbetween these tests, and identifies demographic and clinicalfactors associated with each.
Appendix
ContributorsMembers of the Hemodialysis Fistula Maturation Study Group:Chair, Steering Committee—University of Pennsylvania: H.Feldman, Clinical Centers—Boston University: L. Dember (PI),A. Farber, J. Kaufman, L. Stern, P. LeSage, C. Kivork, D.Soares, M. Malikova; University of Alabama: M. Allon (PI), C.
Young, M. Taylor, L. Woodard, K. Mangadi. University ofCincinnati: P. Roy-Chaudhury (PI), R. Munda, T. Lee, R.Alloway, M. El-Khatib, T. Canaan, A. Pflum, L. Thieken, B.Campos-Naciff; University of Florida: T. Huber (PI), S. Berceli,M. Jansen, G. McCaslin, Y. Trahan; University of TexasSouthwestern: M. Vazquez (PI), W. Vongpatanasin, I. David-son, C. Hwang, T. Lightfoot, C. Livingston, A. Valencia, B.Dolmatch, A. Fenves, N. Hawkins; University of Utah: A.Cheung (PI), L. Kraiss, D. Kinikini, G. Treiman, D. Ihnat, M.Sarfati, I. Lavasani, M. Maloney, L. Schlotfeldt; University ofWashington: J. Himmelfarb (PI), C. Buchanan, C. Clark, C.Crawford, J. Hamlett, J. Kundzins, L. Manahan, J. Wise; DataCoordinating Center—Cleveland Clinic: G. Beck (PI), J.Gassman, T. Greene, P. Imrey, L. Li, J. Alster, M. Li, J.MacKrell, M. Radeva, B. Weiss, K. Wiggins; Cores: HistologyCore—University of Washington: C. Alpers (PI), K. Hudkins, T.Wietecha; Ultrasound Core—University of Alabama at Birm-ingham: M. Robbin (PI), H. Umphrey, L. Alexander, C. Abts, L.Belt; Vascular Function Core—Boston University: J. Vita (PI),M. Duess, A. Levit; Repositories: NIDDK Biosample Repository—Fisher BioServices: H. Higgins, S. Ke, O. Mandaci, C. Snell;NIDDK DNA Repository—Fred Hutchinson Cancer ResearchCenter: J. Gravley, S. Behnken, R. Mortensen; External ExpertPanel: G. Chertow (Chair), A. Besarab, K. Brayman, M. Diener-West, D. Harrison, L. Inker, T. Louis, W. McClellan, J. Rubin;NIDDK: J. Kusek, R. Star
AcknowledgmentsThe authors are grateful to Joan M. Alster, M.S., for statisticalcomputing assistance in the preparation of Table 2 and the TablesS1 through S5.
Sources of FundingThe Hemodialysis Fistula Maturation Study was funded bygrants U01DK066597, U01DK082179, U01DK082189,U01DK082218, U01DK082222, UO1DK082232, U01DK082236, and U01DK082240 from the National Institute ofDiabetes and Digestive and Kidney Diseases.
DisclosuresNone.
References1. Xu Y, Arora RC, Hiebert BM, Lerner B, Szwajcer A, McDonald K, Rigatto C,
Komenda P, Sood MM, Tangri N. Non-invasive endothelial function testing andthe risk of adverse outcomes: a systematic review and meta-analysis. EurHeart J Cardiovasc Imaging. 2014;15:736–746.
2. Ben-Shlomo Y, Spears M, Boustred C, May M, Anderson SG, Benjamin EJ,Boutouyrie P, Cameron J, Chen CH, Cruickshank JK, Hwang SJ, Lakatta EG,Laurent S, Maldonado J, Mitchell GF, Najjar SS, Newman AB, Ohishi M, Pannier
DOI: 10.1161/JAHA.116.003227 Journal of the American Heart Association 10
Vascular Function in End-Stage Renal Disease Dember et alORIG
INALRESEARCH

B, Pereira T, Vasan RS, Shokawa T, Sutton-Tyrell K, Verbeke F, Wang KL, WebbDJ, Willum Hansen T, Zoungas S, McEniery CM, Cockcroft JR, Wilkinson IB.Aortic pulse wave velocity improves cardiovascular event prediction: anindividual participant meta-analysis of prospective observational data from17,635 subjects. J Am Coll Cardiol. 2014;63:636–646.
3. Wilkinson IB, Webb DJ. Venous occlusion plethysmography in cardiovascularresearch: methodology and clinical applications. Br J Clin Pharmacol.2001;52:631–646.
4. van der Linden J, Lameris TW, van den Meiracker AH, de Smet AA, BlankestijnPJ, van den Dorpel MA. Forearm venous distensibility predicts successfularteriovenous fistula. Am J Kidney Dis. 2006;47:1013–1019.
5. Guerin AP, Blacher J, Pannier B, Marchais SJ, Safar ME, London GM. Impact ofaortic stiffness attenuation on survival of patients in end-stage renal failure.Circulation. 2001;103:987–992.
6. Yilmaz MI, Sonmez A, Saglam M, Yaman H, Kilic S, Turker T, Unal HU, Gok M,Cetinkaya H, Eyileten T, Oguz Y, Caglar K, Vural A, Mallamaci F, Zoccali C.Longitudinal analysis of vascular function and biomarkers of metabolic bonedisorders before and after renal transplantation. Am J Nephrol. 2013;37:126–134.
7. Recio-Mayoral A, Banerjee D, Streather C, Kaski JC. Endothelial dysfunction,inflammation and atherosclerosis in chronic kidney disease—a cross-sectionalstudy of predialysis, dialysis and kidney-transplantation patients. Atheroscle-rosis. 2011;216:446–451.
8. Demir M, Kucuk A, Sezer MT, Altuntas A, Kaya S. Malnutrition-inflammationscore and endothelial dysfunction in hemodialysis patients. J Ren Nutr.2010;20:377–383.
9. Morimoto S, Yurugi T, Aota Y, Sakuma T, Jo F, Nishikawa M, Iwasaka T, Maki K.Prognostic significance of ankle-brachial index, brachial-ankle pulse wavevelocity, flow-mediated dilation, and nitroglycerin-mediated dilation in end-stage renal disease. Am J Nephrol. 2009;30:55–63.
10. Verbeke FH, Agharazii M, Boutouyrie P, Pannier B, Guerin AP, London GM.Local shear stress and brachial artery functions in end-stage renal disease. JAm Soc Nephrol. 2007;18:621–628.
11. Blacher J, Safar ME, Guerin AP, Pannier B, Marchais SJ, London GM. Aorticpulse wave velocity index and mortality in end-stage renal disease. Kidney Int.2003;63:1852–1860.
12. Dember LM, Imrey PB, Beck GJ, Cheung AK, Himmelfarb J, Huber TS, Kusek JW,Roy-Chaudhury P, Vazquez MA, Alpers CE, Robbin ML, Vita JA, Greene T,Gassman JJ, Feldman HI. Objectives and design of the hemodialysis fistulamaturation study. Am J Kidney Dis. 2014;63:104–112.
13. Atkinson G, Batterham AM. Allometric scaling of diameter change in theoriginal flow-mediated dilation protocol. Atherosclerosis. 2013;226:425–427.
14. Atkinson G, Batterham AM. The percentage flow-mediated dilation index: alarge-sample investigation of its appropriateness, potential for bias and causalnexus in vascular medicine. Vasc Med. 2013;18:354–365.
15. Atkinson G, Batterham AM, Thijssen DH, Green DJ. A new approach to improvethe specificity of flow-mediated dilation for indicating endothelial function incardiovascular research. J Hypertens. 2013;31:287–291.
16. Inskip H. Standardization methods. In: Gail MH, Benichou J, eds. EncyclEpidemiol Method. Chichester: John Wiley and Sons;1999:871–884.
17. Schnabel RB, Schulz A, Wild PS, Sinning CR, Wilde S, Eleftheriadis M,Herkenhoff S, Zeller T, Lubos E, Lackner KJ, Warnholtz A, Gori T, BlankenbergS, Munzel T. Noninvasive vascular function measurement in the community:cross-sectional relations and comparison of methods. Circ Cardiovasc Imaging.2011;4:371–380.
18. Kiani S, Aasen JG, Holbrook M, Khemka A, Sharmeen F, LeLeiko RM, Tabit CE,Farber A, Eberhardt RT, Gokce N, Vita JA, Hamburg NM. Peripheral arterydisease is associated with severe impairment of vascular function. Vasc Med.2013;18:72–78.
19. Brunner EJ, Shipley MJ, Ahmadi-Abhari S, Tabak AG, McEniery CM, WilkinsonIB, Marmot MG, Singh-Manoux A, Kivimaki M. Adiposity, obesity, and arterialaging: longitudinal study of aortic stiffness in the Whitehall II cohort.Hypertension. 2015;66:294–300.
20. Mitchell GF, Hwang SJ, Vasan RS, Larson MG, Pencina MJ, Hamburg NM, VitaJA, Levy D, Benjamin EJ. Arterial stiffness and cardiovascular events: theFramingham Heart Study. Circulation. 2010;121:505–511.
21. Benjamin EJ, Larson MG, Keyes MJ, Mitchell GF, Vasan RS, Keaney JF Jr,Lehman BT, Fan S, Osypiuk E, Vita JA. Clinical correlates and heritability offlow-mediated dilation in the community: the Framingham Heart Study.Circulation. 2004;109:613–619.
22. Herrington DM, Fan L, Drum M, Riley WA, Pusser BE, Crouse JR, Burke GL,McBurnie MA, Morgan TM, Espeland MA. Brachial flow-mediated vasodilatorresponses in population-based research: methods, reproducibility andeffects of age, gender and baseline diameter. J Cardiovasc Risk. 2001;8:319–328.
23. Gokce N, Holbrook M, Duffy SJ, Demissie S, Cupples LA, Biegelsen E, KeaneyJF Jr, Loscalzo J, Vita JA. Effects of race and hypertension on flow-mediated andnitroglycerin-mediated dilation of the brachial artery. Hypertension.2001;38:1349–1354.
24. McVeigh GE, Brennan GM, Johnston GD, McDermott BJ, McGrath LT, HenryWR, Andrews JW, Hayes JR. Impaired endothelium-dependent and independentvasodilation in patients with type 2 (non-insulin-dependent) diabetes mellitus.Diabetologia. 1992;35:771–776.
25. Williams SB, Cusco JA, Roddy MA, Johnstone MT, Creager MA. Impaired nitricoxide-mediated vasodilation in patients with non-insulin-dependent diabetesmellitus. J Am Coll Cardiol. 1996;27:567–574.
26. Jono S, McKee MD, Murry CE, Shioi A, Nishizawa Y, Mori K, Morii H, GiachelliCM. Phosphate regulation of vascular smooth muscle cell calcification. CircRes. 2000;87:E10–E17.
27. Floege J, Ketteler M. Vascular calcification in patients with end-stage renaldisease. Nephrol Dial Transplant. 2004;19(suppl 5):V59–V66.
28. Mitchell GF, Parise H, Benjamin EJ, Larson MG, Keyes MJ, Vita JA, Vasan RS,Levy D. Changes in arterial stiffness and wave reflection with advancing age inhealthy men and women: the Framingham Heart Study. Hypertension.2004;43:1239–1245.
29. Strain WD, Chaturvedi N, Dockery F, Shiff R, Shore AC, Bulpitt CJ, Rajkumar C.Increased arterial stiffness in Europeans and African Caribbeans with type 2diabetes cannot be accounted for by conventional cardiovascular risk factors.Am J Hypertens. 2006;19:889–896.
30. Pannier B, Guerin AP, Marchais SJ, Safar ME, London GM. Stiffness ofcapacitive and conduit arteries: prognostic significance for end-stage renaldisease patients. Hypertension. 2005;45:592–596.
31. Mitchell GF. Effects of central arterial aging on the structure and function ofthe peripheral vasculature: implications for end-organ damage. J Appl Physiol(1985). 2008;105:1652–1660.
32. Chan MR, Young HN, Becker YT, Yevzlin AS. Obesity as a predictor of vascularaccess outcomes: analysis of the USRDS DMMS Wave II study. Semin Dial.2008;21:274–279.
33. Kats M, Hawxby AM, Barker J, Allon M. Impact of obesity on arteriovenousfistula outcomes in dialysis patients. Kidney Int. 2007;71:39–43.
DOI: 10.1161/JAHA.116.003227 Journal of the American Heart Association 11
Vascular Function in End-Stage Renal Disease Dember et alORIG
INALRESEARCH

1
SUPPLEMENTAL MATERIAL

2
Data S1
Statistical Appendix
To accommodate empty cells and further stabilize directly clinical center adjusted vascular function
measures, means for strata with two or fewer patients at a particular site were imputed from a fixed
effects factorial linear model for age, sex, race, and diabetes with clinical sites treated as additive blocks.
Full factorial age×sex×race×diabetes models were used when possible, with high order interactions
deleted to obtain a reduced saturated model if necessary. Predicted means and their standard errors
were imputed to these strata and thereby incorporated into the clinical site-adjusted means and
standard errors. Age×sex×diabetes values also were adjusted for race, weighted to the study-wide
proportion of blacks among HFM patients.
In fitting the linear mixed models, alternative covariance structures were fit by restricted maximum
likelihood using a saturated fixed effects model, and allowing variance to depend on clinical site or
combinations of clinical site with age, sex, race, or diabetes. The best fitting of such models was
selected using the Bayesian information (BIC) criterion34 In modeling the mean, age trends were allowed
to vary nonlinearly through two degree of freedom (df) restricted cubic splines, with knots at the 5th,
20th, 80th, and 95th age percentiles. Successive effect classes and corresponding α’s required for
statistical significance in the model reduction sequence were as follows: all four- and three-way
interactions (0.5%), nonlinear age interactions (0.5%), all other pairwise interactions (2%), and nonlinear
age trend (2%). Statistical significance of continuous factors was assessed by test of the slope in the
reduced model or, when significant nonlinearity was found, and by the omnibus 3 df test of the overall
effect.

3
Supplemental Tables
Table S1. Baseline characteristics of the Hemodialysis Fistula Maturation Study cohort and subgroups with vascular function tests*
Subcohorts with Vascular Function Tests
Characteristic Full Cohort
(N=602) FMD
(N=549) NMD
(N=460) PWV
(N=448) VOP
(N=569)
Male 423 (70.3%) 388 (70.7%) 332 (72.2%) 316 (70.5%) 399 (70.1%)
Age at vascular function assessment, years 55.1 ± 13.4 55.3 ± 13.4 55.6 ± 13.3 53.9 ± 13.6 54.9 ± 13.4
Race (self-reported)
Native American, Aboriginal Canadian or Alaskan Native, First Nation, Aboriginal Australian
13 (2.2%) 13 (2.4%) 11 (2.4%) 11 (2.5%) 13 (2.3%)
Asian 13 (2.2%) 13 (2.4%) 12 (2.6%) 12 (2.7%) 12 (2.1%)
Native Hawaiian or Other Pacific Islander 12 (2.0%) 12 (2.2%) 7 (1.5%) 10 (2.2%) 12 (2.1%)
Black, African-American, African 264 (43.9%) 241 (43.9%) 203 (44.1%) 198 (44.2%) 244 (42.9%)
White/Caucasian 283 (47.0%) 254 (46.3%) 215 (46.7%) 204 (45.5%) 271 (47.6%)
Multiracial 9 (1.5%) 9 (1.6%) 7 (1.5%) 7 (1.6%) 9 (1.6%)
Unknown or Not Reported 8 (1.3%) 7 (1.3%) 5 (1.1%) 6 (1.3%) 8 (1.4%)
Hispanic or Latino ethnicity (self-reported) 79 (13.1%) 75 (13.7%) 69 (15.0%) 64 (14.3%) 77 (13.5%)
Highest education:
Without high school diploma 161 (26.7%) 151 (27.5%) 130 (28.3%) 125 (27.9%) 152 (26.7%)
High school graduate 163 (27.1%) 148 (27.0%) 122 (26.5%) 129 (28.8%) 156 (27.4%)
Vocational, technical, or business degree 34 (5.6%) 32 (5.8%) 29 (6.3%) 22 (4.9%) 33 (5.8%)
Some college, without degree 121 (20.1%) 110 (20.0%) 92 (20.0%) 90 (20.1%) 112 (19.7%)
Associate’s Degree 29 (4.8%) 27 (4.9%) 19 (4.1%) 24 (5.4%) 28 (4.9%)
Bachelor’s Degree 48 (8.0%) 40 (7.3%) 35 (7.6%) 31 (6.9%) 45 (7.9%)
Master’s/Doctoral/Professional school 28 (4.7%) 27 (4.9%) 21 (4.6%) 21 (4.7%) 25 (4.4%)
Unknown 18 (3.0%) 14 (2.6%) 12 (2.6%) 6 (1.3%) 18 (3.2%)
Not employed:
Homemaker or student 13 (2.2%) 13 (2.4%) 10 (2.2%) 11 (2.5%) 12 (2.1%)
Retired 127 (21.1%) 115 (20.9%) 99 (21.5%) 91 (20.3%) 117 (20.6%)
Disabled 340 (56.5%) 317 (57.7%) 269 (58.5%) 259 (57.8%) 320 (56.2%)
Not disabled 44 (7.3%) 39 (7.1%) 29 (6.3%) 34 (7.6%) 44 (7.7%)

4
Table S1. Baseline characteristics of the Hemodialysis Fistula Maturation Study cohort and subgroups with vascular function tests*
Subcohorts with Vascular Function Tests
Characteristic Full Cohort
(N=602) FMD
(N=549) NMD
(N=460) PWV
(N=448) VOP
(N=569)
Employed:
Part-time 31 (5.1%) 28 (5.1%) 23 (5.0%) 22 (4.9%) 30 (5.3%)
Full-time 44 (7.3%) 35 (6.4%) 29 (6.3%) 31 (6.9%) 44 (7.7%)
Unknown 3 (0.5%) 2 (0.4%) 1 (0.2%) 0 2 (0.4%)
On maintenance dialysis at vascular function testing 377 (62.8%) 351 (64.2%) 292 (63.8%) 283 (63.3%) 355 (62.5%)
BMI, kg/m2 30.4 ± 7.56 30.3 ± 7.57 30.1 ± 7.36 29.2 ± 6.75 30.4 ± 7.59
Diabetes 353 (58.6%) 321 (58.5%) 269 (58.5%) 249 (55.6%) 330 (58.0%)
Vascular disease† 315 (52.3%) 285 (51.9%) 235 (51.1%) 226 (50.0%) 290 (51.0%)
Coronary artery disease‡ 156 (25.9%) 139 (25.3%) 117 (25.4%) 110 (24.6%) 140 (24.6%)
Congestive heart failure 165 (27.4%) 149 (27.1%) 126 (27.4%) 116 (25.9%) 152 (26.7%)
Cardiac arrhythmias or conduction problems 85 (14.1%) 81 (14.8%) 61 (13.3%) 53 (11.8%) 78 (13.7%)
Cerebrovascular diseaseǁ 88 (14.6%) 76 (13.8%) 64 (13.9%) 65 (14.5%) 82 (14.4%)
Peripheral artery disease¶ 91 (15.1%) 81 (14.8%) 74 (16.1%) 57 (12.7%) 87 (15.3%)
Systolic blood pressure at vascular function testing, mm Hg 151 ± 23.4 151 ± 23.5 153 ± 22.7 151 ± 23.1 151 ± 23.4
Diastolic blood pressure at vascular function testing, mm Hg 84.8 ± 14.3 84.9 ± 14.3 85.3 ± 14.2 84.8 ± 14.3 84.8 ± 14.3
Smoking within last 12 months 148 (24.8%) 135 (24.8%) 114 (25.0%) 117 (26.2%) 140 (24.8%)
Smoked within 6 hours prior to FMD determination 44 (7.3%) 41 (7.5%) 37 (8.0%) 34 (7.6%) 42 (7.4%)
Serum albumin (g/dL) 3.61 ± 0.62 3.62 ± 0.62 3.62 ± 0.62 3.63 ± 0.64 3.61 ± 0.62
Serum calcium (mg/dL) 8.89 ± 0.86 8.87 ± 0.84 8.87 ± 0.89 8.90 ± 0.87 8.89 ± 0.86
Serum phosphorus (mg/dL) 5.04 ± 1.49 5.04 ± 1.50 5.04 ± 1.50 5.07 ± 1.50 5.04 ± 1.49
Brachial artery dilation
Resting velocity (cm/s) -- 12.8 ± 5.81 -- -- --
Hyperemic velocity (cm/s) -- 82.8 ± 33.4 -- -- --
Baseline diameter (mm) -- 4.55 ± 0.81 -- -- --
FMD% -- 4.79 ± 4.96 -- -- --
Absolute FMD (mm) 0.20 ± 0.20
Hyperemic velocity-adjusted FMD (%/cm/s) -- 0.07 ± 0.11 -- -- --
NMD% -- -- 7.22 ± 6.27 -- --
Arterial pulse-wave velocity

5
Table S1. Baseline characteristics of the Hemodialysis Fistula Maturation Study cohort and subgroups with vascular function tests*
Subcohorts with Vascular Function Tests
Characteristic Full Cohort
(N=602) FMD
(N=549) NMD
(N=460) PWV
(N=448) VOP
(N=569)
Carotid-femoral PWV (m/s) -- -- -- 10.7 ± 3.20 --
Carotid-radial PWV (m/s) -- -- -- 8.81 ± 1.71 --
Central pulse pressure (mm Hg) -- -- -- 53.3 ± 19.1 --
Central systolic BP (mmHg) -- -- -- 137.9 ± 23.0 --
Central diastolic BP (mmHg) -- -- -- 84.6 ± 14.9 --
Augmentation index (%) -- -- -- 26.1 ± 13.1 --
Venous occlusion plethysmography
Capacitance slope Δ(ml/100ml)/10mmHg -- -- -- -- 0.53 ± 0.36
Maximum venous outflow slope Δ(ml/100 ml/min)/10mmHg
-- -- -- -- 3.92 ± 2.91
Mean capacitance (ml/100ml) 1.8 ± 1.2 Mean maximum venous outflow (ml/100 ml/min) 16.7 ± 13.0 Forearm volume (mm3) 62.7 ± 16.8
*Percentage or mean ± SD †History of any of the following: myocardial infarction, angina, coronary artery bypass surgery or angioplasty, congestive heart failure, cardiac arrhythmias or conduction problems, stroke, transient ischemic attack, carotid endarterectomy, carotid artery angioplasty, lower extremity arterial bypass surgery or angioplasty, non-traumatic amputation, and claudication
‡Angina, coronary artery angioplasty or bypass surgery, or myocardial infarction ǁStroke, transient ischemic attack, carotid endarterectomy, or carotid angioplasty ¶Claudication, lower extremity angioplasty or bypass surgery, or non-traumatic amputation Abbreviations: FMD, flow-mediated dilation; NMD, nitroglycerin-mediated dilation; PWV, pulse wave velocity; VOP, venous occlusion plethysmography

6
*Values for age × sex ×diabetes × clinical center combinations with 2 or fewer patients were smoothed by imputation with fitted values from a fixed effects models with additive clinical center effects and a saturated model for the other variables, minimally reduced if necessary to achieve an identifiable model. Prior to such modeling, cells for each combination were initially adjusted for the variable omitted from that combination (i.e., race for the age × sex × diabetes combinations), by weighting the levels of the omitted variable uniformly by their proportions in the full HFM Study sample.
Abbreviations: FMD, flow-mediated dilation; bp, blood pressure
Table S2. Additional vascular function measures, by age, sex, race, and diabetes status, directly-adjusted for clinical center*
Age Sex Black Race Diabetes
≤ 40 40-49 50-59 60-69 ≥ 70 Female Male Yes No Yes No
Measure Mean (SE) Mean (SE) Mean (SE) Mean (SE) Mean (SE) Mean (SE) Mean (SE) Mean (SE) Mean (SE) Mean (SE) Mean (SE)
Brachial Artery Dilation
Resting velocity (cm/s) 14.14 (2.70) 13.38 (2.18) 13.14 (1.76) 11.99 (1.61) 12.80 (1.71)
13.58 (1.76)
12.74 (2.14)
12.49 (2.05)
13.52 (2.07) 13.44 (1.84) 12.40 (2.31)
Baseline diameter (mm) 4.36 (0.28) 4.30 (0.26) (11.3]]\\\\\\\
\\\\)
4.47 (0.30) 4.84 (0.35) 4.69 (0.25) 3.96 (0.23)
4.76 (0.30) 4.61 (0.34) 4.41 (0.31) 4.56 (0.32) 4.52 (0.32)
Absolute FMD (mm) 0.24 (0.09) 0.20 (0.06) 0.19 (0.07) 0.18 (0.08) 0.15 (0.05) 0.21 (0.07) 0.19 (0.07) 0.17 (0.07) 0.21 (0.07) 0.16 (0.06) 0.24 (0.08)
Hyperemic velocity-adjusted FMD% (%/cm/s) 0.07 (0.03) 0.06 (0.02) 0.08 (0.07) 0.07 (0.04) 0.05 (0.02) 0.12 (0.09) 0.06 (0.03) 0.08 (0.06) 0.06 (0.03) 0.05 (0.03) 0.09 (0.07)
Arterial Pulse-Wave Velocity
Central systolic bp (mmHg) 130.6 (7.7) 133.7 (8.3) 138.2 (7.5) 136.1 (9.7) 137.1 (8.0) 138.8 (9.7) 135.1 (8.2) 134.3 (8.6) 135.5 (7.7) 139.9 (9.3) 131.1 (6.9)
Central diastolic bp (mmHg) 93.2 (5.3) 87.4 (5.7) 85.4 (4.9) 77.7 (4.6) 74.5 (4.6) 82.8 (5.9) 84.9 (5.6) 85.7 (5.1) 81.3 (5.1) 82.0 (5.6) 86.3 (5.3)
Central pulse pressure (mmHg)
37.5 (3.6) 46.2 (5.8) 52.7 (6.3) 58.4 (7.2) 62.7 (7.3) 56.1 (7.1) 50.2 (6.7) 48.7 (6.9) 54.2 (6.2) 58.0 (7.6) 44.8 (5.5)
Augmentation index (%) 18.20 (4.90) 21.03 (5.08) 28.49 (3.87) 27.98 (5.27) 30.58 (3.41) 31.49 (4.32) 23.50 (5.07) 22.29 (6.42) 26.71 (4.45) 25.36 (5.36) 25.58 (4.96)
Venous Occlusion Plethysmography
Mean capacitance (ml/100ml)
2.07 (0.54) 1.67 (0.31) 1.65 (0.33) 1.69 (0.46) 1.53 (0.29) 1.66 (0.36) 1.73 (0.40) 1.67 (0.37) 1.73 (0.39) 1.55 (0.32) 1.90 (0.46)
Mean maximum venous outflow (ml/100 ml/min)
18.64 (5.20) 15.11 (3.53) 14.68 (3.87) 15.19 (4.11) 14.19 (2.70) 14.38 (4.07) 15.77 (3.92) 15.05 (3.91) 15.19 (3.99) 13.89 (3.48) 17.26 (4.51)
Forearm volume (mm3) 63.51 (5.97) 65.16 (6.74) 62.33 (6.35) 64.90 (6.37) 63.87 (4.43) 53.51 (5.33) 68.09 (6.01) 65.93 (6.14) 64.47 (6.16) 64.94 (6.49) 62.42 (6.24)
7
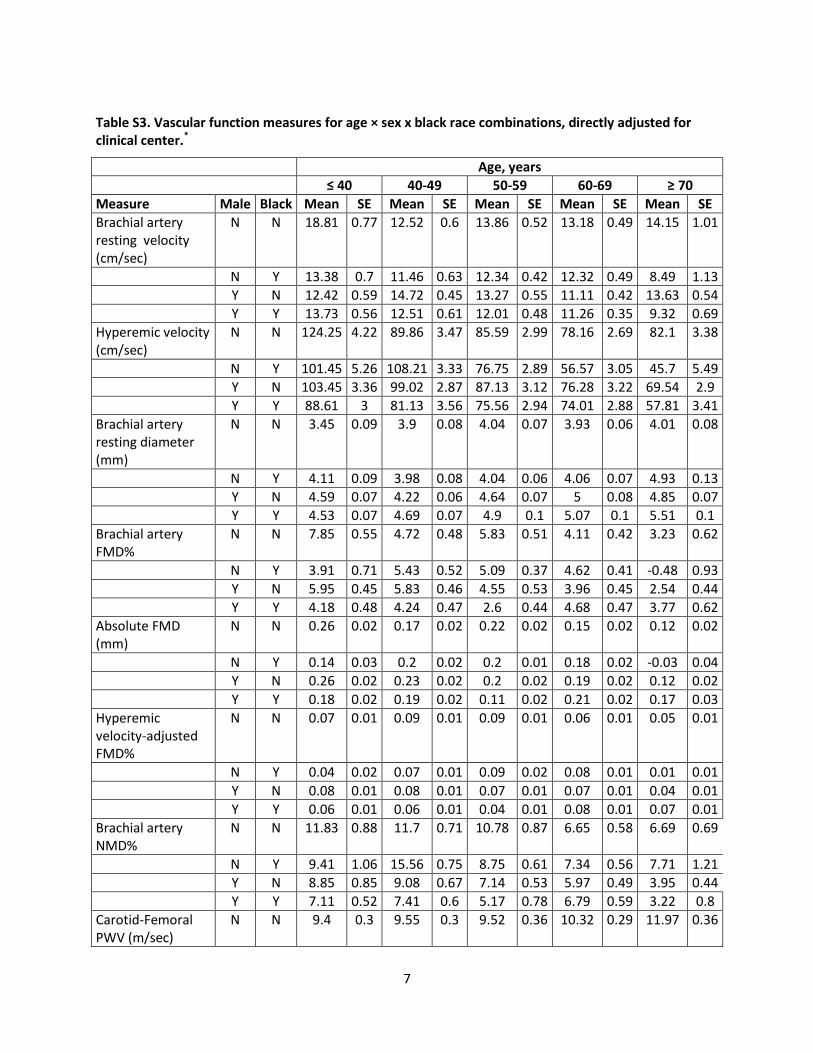
Table S3. Vascular function measures for age × sex x black race combinations, directly adjusted for clinical center.*
Age, years
≤ 40 40-49 50-59 60-69 ≥ 70
Measure Male Black Mean SE Mean SE Mean SE Mean SE Mean SE
Brachial artery resting velocity (cm/sec)
N N 18.81 0.77 12.52 0.6 13.86 0.52 13.18 0.49 14.15 1.01
N Y 13.38 0.7 11.46 0.63 12.34 0.42 12.32 0.49 8.49 1.13
Y N 12.42 0.59 14.72 0.45 13.27 0.55 11.11 0.42 13.63 0.54
Y Y 13.73 0.56 12.51 0.61 12.01 0.48 11.26 0.35 9.32 0.69
Hyperemic velocity (cm/sec)
N N 124.25 4.22 89.86 3.47 85.59 2.99 78.16 2.69 82.1 3.38
N Y 101.45 5.26 108.21 3.33 76.75 2.89 56.57 3.05 45.7 5.49
Y N 103.45 3.36 99.02 2.87 87.13 3.12 76.28 3.22 69.54 2.9
Y Y 88.61 3 81.13 3.56 75.56 2.94 74.01 2.88 57.81 3.41
Brachial artery resting diameter (mm)
N N 3.45 0.09 3.9 0.08 4.04 0.07 3.93 0.06 4.01 0.08
N Y 4.11 0.09 3.98 0.08 4.04 0.06 4.06 0.07 4.93 0.13
Y N 4.59 0.07 4.22 0.06 4.64 0.07 5 0.08 4.85 0.07
Y Y 4.53 0.07 4.69 0.07 4.9 0.1 5.07 0.1 5.51 0.1
Brachial artery FMD%
N N 7.85 0.55 4.72 0.48 5.83 0.51 4.11 0.42 3.23 0.62
N Y 3.91 0.71 5.43 0.52 5.09 0.37 4.62 0.41 -0.48 0.93
Y N 5.95 0.45 5.83 0.46 4.55 0.53 3.96 0.45 2.54 0.44
Y Y 4.18 0.48 4.24 0.47 2.6 0.44 4.68 0.47 3.77 0.62
Absolute FMD (mm)
N N 0.26 0.02 0.17 0.02 0.22 0.02 0.15 0.02 0.12 0.02
N Y 0.14 0.03 0.2 0.02 0.2 0.01 0.18 0.02 -0.03 0.04
Y N 0.26 0.02 0.23 0.02 0.2 0.02 0.19 0.02 0.12 0.02
Y Y 0.18 0.02 0.19 0.02 0.11 0.02 0.21 0.02 0.17 0.03
Hyperemic velocity-adjusted FMD%
N N 0.07 0.01 0.09 0.01 0.09 0.01 0.06 0.01 0.05 0.01
N Y 0.04 0.02 0.07 0.01 0.09 0.02 0.08 0.01 0.01 0.01
Y N 0.08 0.01 0.08 0.01 0.07 0.01 0.07 0.01 0.04 0.01
Y Y 0.06 0.01 0.06 0.01 0.04 0.01 0.08 0.01 0.07 0.01
Brachial artery NMD%
N N 11.83 0.88 11.7 0.71 10.78 0.87 6.65 0.58 6.69 0.69
N Y 9.41 1.06 15.56 0.75 8.75 0.61 7.34 0.56 7.71 1.21
Y N 8.85 0.85 9.08 0.67 7.14 0.53 5.97 0.49 3.95 0.44
Y Y 7.11 0.52 7.41 0.6 5.17 0.78 6.79 0.59 3.22 0.8
Carotid-Femoral PWV (m/sec)
N N 9.4 0.3 9.55 0.3 9.52 0.36 10.32 0.29 11.97 0.36

8
Table S3. Vascular function measures for age × sex x black race combinations, directly adjusted for clinical center.*
Age, years
≤ 40 40-49 50-59 60-69 ≥ 70
Measure Male Black Mean SE Mean SE Mean SE Mean SE Mean SE
N Y 8.84 0.34 8.28 0.33 11.76 0.31 11 0.29 13.99 0.62
Y N 8.84 0.27 9.98 0.24 10.57 0.21 12.16 0.36 12.62 0.29
Y Y 8.64 0.25 9.41 0.21 10.58 0.24 10.49 0.23 9.96 0.43
Carotid-Radial PWV (m/sec)
N N 9.7 0.2 8.11 0.21 8.06 0.17 8.09 0.18 8.26 0.23
N Y 8.6 0.22 8.93 0.21 8.88 0.14 9.31 0.18 10.63 0.37
Y N 9.34 0.16 8.77 0.15 8.72 0.17 9.14 0.22 9.04 0.21
Y Y 9.29 0.16 9.92 0.14 9.3 0.15 9.14 0.14 8.53 0.26
Central pulse Pressure (mmHg)
N N 53.72 2.03 62.47 2.22 53.66 1.82 69.18 2.06 70.78 2.37
N Y 47.31 2.26 46.64 2.06 58.44 1.51 64.07 1.8 83.73 3.76
Y N 37.91 1.44 51.51 1.7 55.93 1.59 56.52 2.23 62.4 2.28
Y Y 38.66 1.45 41.61 1.38 47.46 1.67 54.66 1.49 52.58 2.58
Central systolic BP (mmHg)
N N 158.84 2.78 136.5 2.71 133.92 2.79 144.14 2.54 148.49 3.02
N Y 147.29 3.11 141.05 2.82 141.12 1.9 150.21 2.6 162.85 4.99
Y N 135.35 2.13 135.95 2.27 139.9 1.79 134.45 3.2 133.23 2.39
Y Y 133.55 2.09 134.4 2.15 137.14 2.09 137.82 1.97 132.02 3.39
Central diastolic BP (mmHg)
N N 104.59 1.7 75.38 1.53 79.71 1.46 74.39 1.29 77.45 1.76
N Y 99.69 1.91 95.27 1.66 83.53 1.15 85.37 1.6 77.6 2.92
Y N 97.43 1.35 84.06 1.21 83.85 1.57 77.76 1.42 71.71 1.67
Y Y 94.97 1.32 92.91 1.30 89.64 1.49 82.69 1.19 78.55 2.06
Augmentation Index (%)
N N 35.8 1.61 32.15 1.41 30.02 1.33 34.83 1.38 36.89 1.66
N Y 21.84 1.72 29.26 1.61 31.65 1.06 31.76 1.55 30.92 2.69
Y N 17.2 1.50 21.41 1.13 27.62 1.13 28.84 1.45 27.95 1.31
Y Y 14.68 1.23 18.24 1.35 24.25 1.22 26.7 1.31 21.83 1.90
Capacitance slope Δ(ml/100 ml)/10mmHg)
N N 0.57 0.04 0.43 0.02 0.44 0.03 0.46 0.03 0.45 0.05
N Y 0.46 0.03 0.31 0.03 0.53 0.02 0.59 0.02 0.37 0.06
Y N 0.59 0.03 0.54 0.03 0.54 0.03 0.54 0.05 0.54 0.03
Y Y 0.52 0.04 0.45 0.02 0.47 0.02 0.53 0.02 0.40 0.03
Capacitance mean (ml/100ml)
N N 2.01 0.2 1.33 0.08 1.45 0.08 1.42 0.07 1.20 0.16
N Y 1.68 0.09 1.28 0.12 1.84 0.06 1.73 0.07 0.96 0.20
Y N 2.20 0.07 1.88 0.09 1.69 0.07 1.84 0.17 1.63 0.09
Y Y 1.69 0.10 1.54 0.07 1.57 0.07 1.74 0.09 1.10 0.10

9
Table S3. Vascular function measures for age × sex x black race combinations, directly adjusted for clinical center.*
Age, years
≤ 40 40-49 50-59 60-69 ≥ 70
Measure Male Black Mean SE Mean SE Mean SE Mean SE Mean SE
Maximum venous outflow slope (Δ(ml/100 ml/min)/10mmHg)
N N 3.71 0.36 2.64 0.22 3.08 0.22 3.58 0.26 2.91 0.38
N Y 3.44 0.27 2.38 0.24 3.56 0.19 3.96 0.23 1.67 0.50
Y N 5.08 0.27 3.99 0.24 4.04 0.33 3.59 0.30 3.41 0.22
Y Y 3.73 0.22 3.50 0.16 3.33 0.14 3.93 0.29 2.44 0.28
Mean maximum venous outflow (ml/100 ml/min)
N N 17.43 2.26 10.41 0.98 12.29 1.07 13.2 0.75 12.91 1.75
N Y 14.54 1.03 10.68 1.14 15.19 0.78 15.58 0.76 6.81 2.21
Y N 21.75 0.75 16.79 0.89 16.43 0.99 15.01 1.30 15.68 0.79
Y Y 14.64 0.86 15.19 1.37 12.95 0.77 17.74 1.14 10.26 1.16
Forearm Volume (mm3)
N N 48.2 1.97 50.82 1.46 55.62 1.67 53.31 1.57 49.64 1.55
N Y 47.26 1.95 68.07 1.94 53.79 1.11 55.82 1.67 60.36 2.79
Y N 63.05 1.48 63.84 1.59 62.71 1.64 69.69 1.92 65.28 1.16
Y Y 73.9 1.47 74.04 2.38 71.04 1.52 67.10 1.42 75.34 1.92
*Values for age × sex × race × clinical center combinations with 2 or fewer patients were smoothed by imputation with fitted values from a fixed effects models with additive clinical center effects and a saturated model for the other variables, minimally reduced if necessary to achieve an identifiable model. Prior to such modeling, cells for each combination were initially adjusted for the variable omitted from that combination (i.e., Diabetes for the Age × Sex × Race and Race for the Age × Sex × Diabetes combinations), by weighting the levels of the omitted variable uniformly by their proportions in the full HFM Study sample.
Abbreviations: FMD, flow-mediated dilation; NMD, nitroglycerin-mediated dilation; PWV, pulse wave velocity; BP, blood pressure; CAP, capacitance; MVO, maximum venous outflow; N, no; Y, yes

10
Table S4: Vascular function measures for age × sex × diabetes combinations, directly adjusted for clinical center*.
Age
≤ 40 40-49 50-59 60-69 ≥ 70
Measure Mal
e Diabete
s Mean SE Mean SE Mean SE Mean SE Mean SE
Brachial artery resting velocity (cm/sec)
N N 16.15 0.76
11.51 0.71
11.88 0.46
12.85 0.57
8.61 1.37
N Y 16.58 0.72
12.43 0.56
14.09 0.49
12.75 0.44
13.76 0.85
Y N 14.51 0.75
10.94 0.34
12.44 0.67
12.44 0.67
10.87 0.82
Y Y 11.94 0.47
15.71 0.59
12.9 0.43
11.39 0.41
12.31 0.46
Brachial artery hyperemic velocity (cm/sec)
N N 107.47
3.47
106.06
4.04
89.97 2.93
78.1 3.28
46.83 6.33
N Y 118.78
5.08
92.36 3.01
75.83 2.92
61.86 2.55
79.32 2.78
Y N 105.87
3.06
89.17 2.56
88.64 3.44
88.64 3.44
66.27 3.91
Y Y 90.53 3.27
92.4 3.38
77.31 2.8 75.45 3.16
62.95 2.58
Brachial artery baseline diameter (mm)
N N 3.67 0.06
3.66 0.09
4.01 0.07
3.77 0.08
5 0.15
N Y 3.79 0.1 4.12 0.07
4.06 0.06
4.14 0.06
4.01 0.07
Y N 4.72 0.06
4.42 0.06
4.76 0.09
4.76 0.09
5.34 0.09
Y Y 4.46 0.07
4.44 0.07
4.75 0.08
5.02 0.09
5 0.07
Brachial artery FMD%
N N 9.18 0.55
7.71 0.58
7.61 0.45
5.48 0.41
-1.69 1.17
N Y 3.94 0.65
3.16 0.44
4.02 0.46
3.53 0.42
3.88 0.41
Y N 6.13 0.48
6.13 0.44
4.98 0.73
4.98 0.73
1.89 0.56
Y Y 4.48 0.45
4.42 0.46
2.77 0.31
3.45 0.41
3.93 0.48
Brachial artery absolute FMD (mm)
N N 0.33 0.02
0.27 0.02
0.3 0.02
0.21 0.02
-0.07 0.05
N Y 0.12 0.03
0.12 0.02
0.15 0.02
0.14 0.02
0.14 0.02

11
Table S4: Vascular function measures for age × sex × diabetes combinations, directly adjusted for clinical center*.
Age
≤ 40 40-49 50-59 60-69 ≥ 70
Measure Mal
e Diabete
s Mean SE Mean SE Mean SE Mean SE Mean SE
Y N 0.27 0.02
0.25 0.02
0.22 0.03
0.22 0.03
0.09 0.02
Y Y 0.19 0.02
0.18 0.02
0.12 0.01
0.16 0.02
0.18 0.02
Brachial artery hyperemic velocity-adjusted FMD%
N N 0.09 0.01
0.12 0.01
0.14 0.02
0.08 0.01
-0.02 0.02
N Y 0.03 0.02
0.05 0.01
0.06 0.01
0.06 0.01
0.06 0.01
Y N 0.08 0.01
0.08 0.01
0.07 0.01
0.07 0.01
0.03 0.01
Y Y 0.06 0.01
0.06 0.01
0.05 0.01
0.05 0.01
0.07 0.01
Brachial artery NMD%
N N 13.28 0.76
18.23 0.81
11.83 0.57
7.86 0.62
7.64 1.34
N Y 8.98 1.03
10.04 0.68
8.51 0.85
6.32 0.54
6.8 0.62
Y N 9.36 0.61
10.43 0.68
8.22 0.76
8.22 0.76
2.46 0.72
Y Y 7.18 0.78
6.87 0.62
4.9 0.56
5.56 0.5 4.44 0.53
Carotid-Femoral PWV (m/sec)
N N 7.28 0.23
7.71 0.31
8.63 0.24
10.1 0.31
13.18 0.71
N Y 10.47 0.34
9.89 0.31
11.84 0.38
10.99 0.28
12.65 0.3
Y N 7.94 0.21
8.01 0.21
9.17 0.23
9.17 0.23
11.58 0.36
Y Y 9.32 0.28
10.93 0.23
11.56 0.22
11.3 0.32
11.34 0.34
Carotid-Radial PWV (m/sec)
N N 8.9 0.16
8.01 0.21
8.47 0.16
8.29 0.18
10.56 0.44
N Y 9.43 0.22
8.79 0.2 8.39 0.15
8.87 0.17
8.45 0.17
Y N 8.49 0.13
8.62 0.14
8.92 0.2 8.92 0.2 9.1 0.23
Y Y 9.9 0.17
9.74 0.15
9.02 0.13
9.11 0.2 8.61 0.23
Central pulse pressure (mmHg)
N N 35.54 1.46
46.86 2.06
50.33 1.5 67.5 1.82
79.05 4.4

12
Table S4: Vascular function measures for age × sex × diabetes combinations, directly adjusted for clinical center*.
Age
≤ 40 40-49 50-59 60-69 ≥ 70
Measure Mal
e Diabete
s Mean SE Mean SE Mean SE Mean SE Mean SE
N Y 61.63 2.36
61.45 2.18
59.61 1.78
66.49 2 74.78 1.88
Y N 33.17 1.18
37.96 1.39
44.93 1.55
44.93 1.55
52.19 2.19
Y Y 41.8 1.54
53.54 1.65
57.24 1.64
56.28 1.98
62.15 2.47
Central systolic bp (mmHg)
N N 125.27
2.11
123.07
2.78
133.67
2.11
149.62
2.43
165.93
5.78
N Y 173.67
3.2 149.37
2.71
139.54
2.61
144.88
2.59
147.11
2.45
Y N 121.05
1.76
125.96
2.13
130.25
2.13
130.25
2.13
129.41
3.01
Y Y 144.03
2.25
141.79
2.24
144.59
1.77
132.88
2.99
134.99
2.69
Central diastolic bp (mmHg)
N N 89.55 1.46
76.89 1.63
83.9 1.37
81.8 1.48
85.32 3.43
N Y 111.44
1.91
89.36 1.54
79.66 1.31
77.5 1.36
72.04 1.36
Y N 88.35 1.16
87.52 1.33
85.28 1.5 85.28 1.5 76.35 2.08
Y Y 101.94
1.4 88.33 1.19
87.23 1.53
76.15 1.39
73.62 1.67
Augmentation index (%)
N N 25.68 1.4 33.47 1.61
33.3 1.17
37.5 1.65
31 3.17
N Y 32.34 1.75
29.04 1.41
28.95 1.24
30.64 1.32
36.51 1.28
Y N 12.93 1.3 16.51 1.28
26.01 1.22
26.01 1.22
26.23 1.63
Y Y 18.29 1.43
22.45 1.18
26.2 1.12
25.49 1.49
24.53 1.51
Capacitance slope (Δ(ml/100 ml)/10mmHg)
N N 0.55 0.05
0.42 0.03
0.54 0.03
0.58 0.02
0.26 0.09
N Y 0.5 0.03
0.34 0.02
0.43 0.03
0.47 0.02
0.53 0.03
Y N 0.62 0.06
0.51 0.01
0.51 0.03
0.51 0.03
0.45 0.04
Y Y 0.52 0.02
0.49 0.03
0.5 0.03
0.48 0.03
0.5 0.03

13
Table S4: Vascular function measures for age × sex × diabetes combinations, directly adjusted for clinical center*.
Age
≤ 40 40-49 50-59 60-69 ≥ 70
Measure Mal
e Diabete
s Mean SE Mean SE Mean SE Mean SE Mean SE
Mean capacitance (ml/100ml)
N N 1.97 0.25
1.63 0.12
1.94 0.09
1.64 0.07
0.38 0.29
N Y 1.79 0.1 1.08 0.08
1.41 0.07
1.49 0.07
1.59 0.09
Y N 2.39 0.11
1.73 0.05
1.71 0.06
1.71 0.06
1.41 0.11
Y Y 1.68 0.07
1.72 0.1 1.59 0.07
1.56 0.1 1.38 0.08
MVO slope (Δ(ml/100 ml/min)/10mmHg)
N N 3.65 0.41
2.68 0.26
3.93 0.26
3.82 0.2 1.01 0.68
N Y 3.54 0.27
2.42 0.21
2.84 0.18
3.7 0.27
3.3 0.22
Y N 4.8 0.33
3.97 0.16
3.65 0.19
3.65 0.19
2.78 0.3
Y Y 4.25 0.2 3.63 0.24
3.78 0.31
3.42 0.26
3.12 0.21
Mean MVO (ml/100ml/min)
N N 18.97 2.87
13.38 1.17
15.86 1.12
16.16 0.85
4.4 3.05
N Y 14.16 1.06
8.54 0.96
11.98 0.88
12.92 0.7 14.27 0.97
Y N 23 0.88
16 0.57
15.37 0.67
15.37 0.67
13.32 1.24
Y Y 15.5 0.73
16.14 1.28
14.54 1 13.96 0.97
13.23 0.76
Forearm volume (ml)
N N 51.16 1.68
53.85 1.68
54.88 1.2 55.87 1.56
60.31 3.08
N Y 45.36 2.08
61.73 1.63
54.77 1.59
53.37 1.62
50.12 1.34
Y N 64.43 1.42
66.83 1.76
62.74 1.99
62.74 1.99
66.2 1.86
Y Y 70.28 1.49
69.42 2 69.01 1.33
69.74 1.85
72.26 1.26
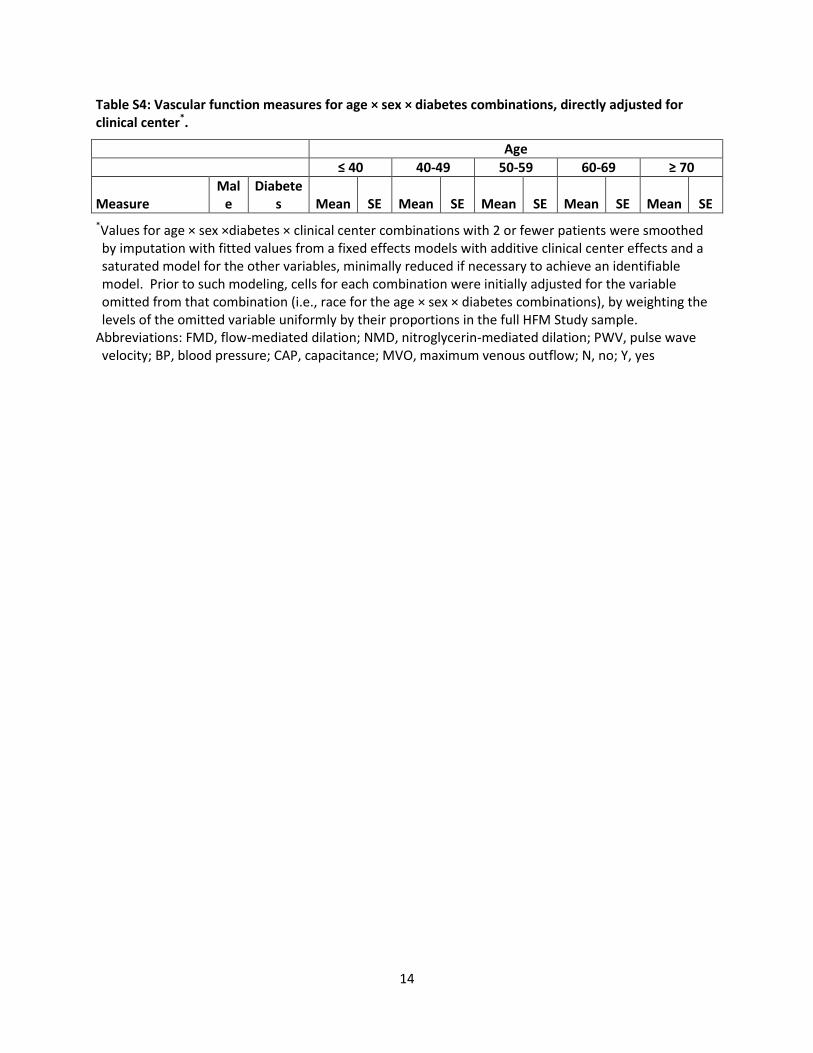
14
Table S4: Vascular function measures for age × sex × diabetes combinations, directly adjusted for clinical center*.
Age
≤ 40 40-49 50-59 60-69 ≥ 70
Measure Mal
e Diabete
s Mean SE Mean SE Mean SE Mean SE Mean SE
*Values for age × sex ×diabetes × clinical center combinations with 2 or fewer patients were smoothed by imputation with fitted values from a fixed effects models with additive clinical center effects and a saturated model for the other variables, minimally reduced if necessary to achieve an identifiable model. Prior to such modeling, cells for each combination were initially adjusted for the variable omitted from that combination (i.e., race for the age × sex × diabetes combinations), by weighting the levels of the omitted variable uniformly by their proportions in the full HFM Study sample.
Abbreviations: FMD, flow-mediated dilation; NMD, nitroglycerin-mediated dilation; PWV, pulse wave velocity; BP, blood pressure; CAP, capacitance; MVO, maximum venous outflow; N, no; Y, yes

15
Table S5. Allometrically adjusted differences in flow-mediated and nitroglycerin-mediated dilation associated with pre-specified predictorsadjusted for clinical center, age, sex, black race, and diabetes, from mixed multiple linear regression models.
Flow-Mediated Dilation % Nitroglycerin-Mediated Dilation %
Measure Estimate SE p-value Estimate SE p-value
BMI (per kg/m2) 0.012 0.021 0.58 0.02 0.03 0.55
Systolic bp (per 10 mm Hg)
-0.15 0.07 0.034 -0.44 0.1x < 0.0001
Diastolic bp (per 10 mm Hg)
0.021 0.12 0.86 -0.08 0.17 0.63
Serum albumin (per g/dL)
-0.18 0.27 0.52 0.33 0.37 0.37
Serum calcium (per mg/dL)
0.04 0.20 0.86 0.31 0.25 0.23
Serum phosphorus (per mg/dL)
Nonlinear (p=0.02, p=0.009 for nonlinearity), with slightly attenuated component linear decline (-0.9 vs. -1.1) vs. FMD%.
-0.21 0.15 0.16
History of vascular disease*
-0.70 0.33 0.04 -1.05 0.47 0.04
Cigarette use past 12 months
-0.70 0.38 0.052 -0. 42 0.51 0.41
Maintenance dialysis 1.30 0.3x 0.0001 0.47 0.47 0.31 *History of any of the following: myocardial infarction, angina, coronary artery bypass surgery or angioplasty, congestive heart failure, cardiac arrhythmias or conduction problems, stroke, transient ischemic attack, carotid endarterectomy, carotid artery angioplasty, lower extremity arterial bypass surgery or angioplasty, non-traumatic amputation, and claudication
Abbreviations: BMI, body mass index; bp, blood pressure