vasesketch: automatic 3d representation of pottery …nachumd/papers/vasesketch.pdf · includes...
TRANSCRIPT

VASESKETCH: Automatic 3D Representation of Potteryfrom Paper Catalogue Drawings
Francesco Banterle, Matteo Dellepiane,Marco Callieri, Roberto Scopigno
Visual Computing LaboratoryISTI-CNR, Pisa, Italy
{banterle,dellepiane,callieri,scopigno}@isti.cnr.it
Barak Itkin, Lior Wolf, Nachum DershowitzBlavatnik School of Computer Science
Tel Aviv UniversityTel Aviv, Israel
{barakitk,wolf,nachum}@cs.tau.ac.il
Abstract—We describe an automated pipeline for digitizationof catalogue drawings of pottery types. This work is aimedat extracting a structured description of the main geometricfeatures and a 3D representation of each class. The pipelineincludes methods for understanding a 2D drawing and using itfor constructing a 3D model of the pottery. These will be usedto populate a reference database for classification of potsherds.
Furthermore, we extend the pipeline with methods forbreaking the 3D model to obtain synthetic sherds and methodsfor capturing images of these sherds in a way that matchesthe imaging methodology of archaeologists. These will serve tobuild a massive set of synthetic sherd images that will helptrain and test future automated classification systems.
I. INTRODUCTION
One of the most active research areas in AI is Sim2Real,where classifiers and agents are trained on simulated dataand then deployed in the real world. Examples includeautomatic driving based on hundreds of hours of captureddriving-simulators’ data and visual recognition of objectsbased on their CAD models. We study the problem ofDoc2Sim, where simulated data are obtained from documentimages. This task is a major stepping stone toward our endgoal of Doc2Sim2Real for the classification of archaeolog-ical pottery sherds.
Pottery classification in the context of excavation sites isa crucial operation, because pottery sherds are the “carbondating” of archeology in the absence of organic material.The classification of a sherd provides valuable informationabout the historical period, commercial routes, eating habits,industrial production, etc.
To obtain a coherent description, the different potterytypologies are subdivided into classes and subclasses, whichare described in a reasonably well-structured way.
The main references for pottery specialists are publishedcatalogues that contain the collection of the classes of eachtypology. Each class has both a textual and a pictorialdescription, which represents the profile of the main ele-ments (viz. the body and the handle) of a class. Additional
The project has received funding from the European Union’s Horizon2020 research and innovation programme under grant agreement No.693548 (project ArchAIDE).
information (e.g. the decoration style) may be present. Fig. 1shows two examples of drawings, taken from two differentcatalogs. Typically, the classification of a sherd is obtainedby visually comparing it with the drawings in the relevantcatalog, possibly taking into account the most descriptivefeatures such as mouth shape, base, and handles.
One of the goals of the ArchAIDE project1 is to developan automatic classification system that supports the work ofarchaeologists on-site by extracting geometric features froma single image of the sherd taken on-site (or later), suchas the one in Fig. 2. This geometric information will thenbe used by a machine-learning classifier trained on all theclasses in a reference database, in order to select a set ofcandidates for classification.
Starting from the idea of replicating the process usedby archaeologists on the field who compare the sherdswith the catalog drawings, this paper presents an automaticpipeline for the digitization of pottery profile drawings.The aim is to extract a structured description of the maingeometric features and a 3D representation of each class.These data will be used to populate the reference databasefor classification and to build a massive set of syntheticsherds. The synthetic sherds will then be employed to trainthe classification system.
1http://www.archaide.eu
Figure 1: Two drawings of pottery types taken from cata-logues.

II. RELATED WORK
A. Pottery Classification and Computer Science
The study of pottery has been a topic of interest incomputer science for several years. This may be due tothe fact that, historically, several typologies of pottery weremanufactured on an industrial scale, so that one can exploitstandardized shapes in their analysis.
The advent of 3D acquisition technologies led to severalprojects in which a 3D representation of a sherd wasobtained via 3D scanning: the 3D model was used foranalysis [1] and reconstruction of the full vessel [2], [3].Unfortunately, the 3D acquisition of sherds is not an easytask, especially outside of the laboratory setting (the sameholds for recent efforts in using multi-view stereo matchingapproaches [4]). Hence, the proposed automated systems [5],[6] have never enjoyed widespread use.
Moreover, any classification or reconstruction operationwas essentially based on the extraction of the descriptiveprofile from the 3D model. This operation can be automa-tized only in specific cases: it usually requires interventionby an experienced user to position the sherd before profileextraction.
Profiles are the basic feature that is used for classificationand analysis. Once extracted from 3D data or drawings,they were analyzed and compared using several measures,including Hough transform [7], morphological measures [8],[9], and curvature functions [10].
Other works aim at extracting the features described byarchaeologists in paper catalogs [11] and use them directlyfor partial matching and classification [12]. However, inthose works the extracted profiles are matched withouttaking the different components of the profiles into account,whereas our solution uses the component information.
Finally, some work has been proposed regarding the useof appearance [13] or the combination of appearance andshape [14].
Figure 2: An example of an amphora sherd.
B. 3D Reconstruction from Drawings
The creation of 3D shapes from 2D lines is an importantissue in computer graphics, since most of the interactionfor modeling has to pass through two-dimensional inputmetaphors. Sketching interfaces have been studied in depth;we refer the reader to a recent survey [15] for an overview.
However, the aim of this paper is to extract informationfrom a more structured type of information, where a setof strict rules guides the creation of the drawing. Theinterpretation of line drawing has been studied right fromthe beginning of computer graphics [16]. Even recently, inthe general case, the interpretation of simple sketches [17]or only the extraction of curved lines [18] still pose severechallenges.
More interesting results can be obtained when the draw-ing style follow pre-defined rules: orthographic views [19]or drawing scaffolds [20] can guide the reconstruction ofcomplex objects.
Drawings coming from certain communities (e.g. char-acter design [21] or architecture [22]) follow structuredrules that can help the extraction of geometric features forreconstruction. Our system works in a similar context, i.e.the guiding features for tracing a drawing can be used for3D reconstruction. Furthermore, our aim is also to extract awell structured set of features that could be used in differentcontexts such as classification and comparison.
III. THE AUTOMATIC PIPELINE
Our proposed system comprises three main components,which are described in this section. The first componentextracts a set of pre-defined geometric features from theinitial drawing: the features will be part of the referencedataset for the classification system. The second one usesthe geometric features to generate a 3D representation ofthe drawing and to “break” the 3D model into a set ofsherds. Finally, the third component extracts the training setof features for the classification system from the syntheticsherds.
A. Geometric Features and their Extraction
Pottery drawings in the catalogues are already a tech-nical representation of a geometry, but all the seman-tic information is flattened in a single raster layer, en-coded following specific representation rules (e.g. line thick-ness/filling/dashing, and axis orientation). This is due tothe nature of the media used and to when this standardwas defined. While perfectly fine for human interpretation,this representation is limited. The use of a digital vectorialrepresentation allows us to separate the different semanticelements and to add location-based metadata. This newrepresentation is more suitable for the use on digital media,both from human and automatic algorithms. Therefore,our first step is to create such representation. The set ofgeometric features to be extracted from drawings should
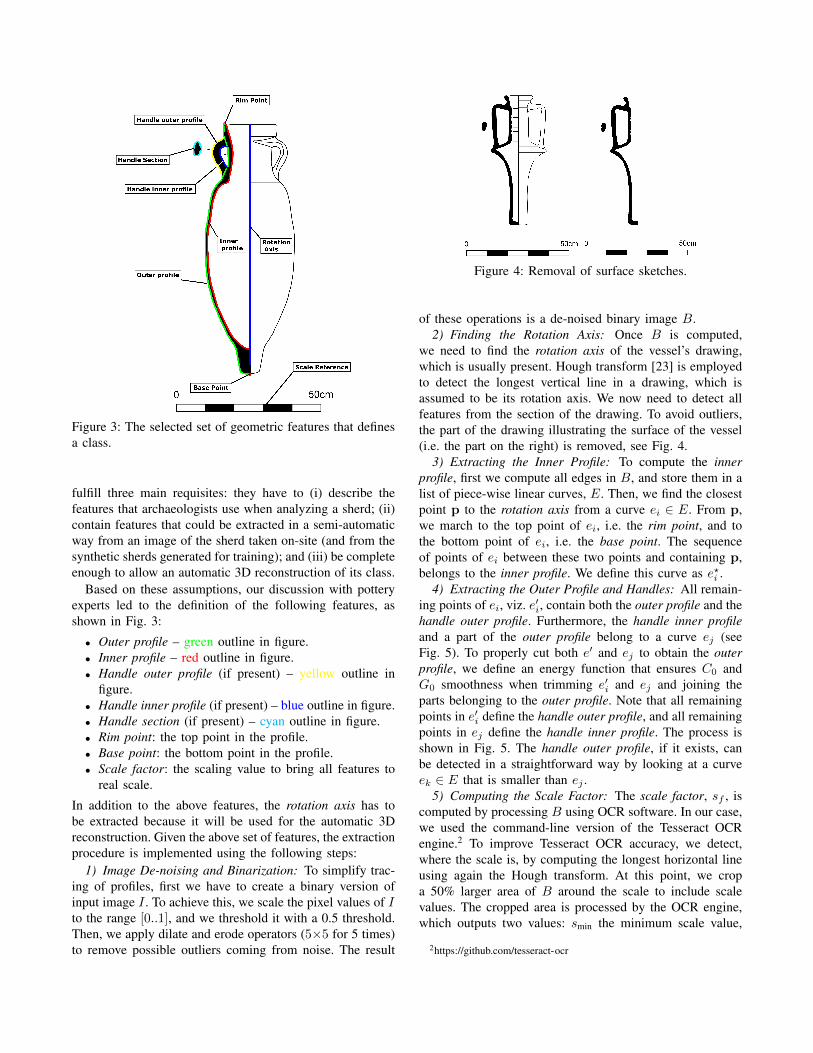
Figure 3: The selected set of geometric features that definesa class.
fulfill three main requisites: they have to (i) describe thefeatures that archaeologists use when analyzing a sherd; (ii)contain features that could be extracted in a semi-automaticway from an image of the sherd taken on-site (and from thesynthetic sherds generated for training); and (iii) be completeenough to allow an automatic 3D reconstruction of its class.
Based on these assumptions, our discussion with potteryexperts led to the definition of the following features, asshown in Fig. 3:
• Outer profile – green outline in figure.• Inner profile – red outline in figure.• Handle outer profile (if present) – yellow outline in
figure.• Handle inner profile (if present) – blue outline in figure.• Handle section (if present) – cyan outline in figure.• Rim point: the top point in the profile.• Base point: the bottom point in the profile.• Scale factor: the scaling value to bring all features to
real scale.
In addition to the above features, the rotation axis has tobe extracted because it will be used for the automatic 3Dreconstruction. Given the above set of features, the extractionprocedure is implemented using the following steps:
1) Image De-noising and Binarization: To simplify trac-ing of profiles, first we have to create a binary version ofinput image I . To achieve this, we scale the pixel values of Ito the range [0..1], and we threshold it with a 0.5 threshold.Then, we apply dilate and erode operators (5×5 for 5 times)to remove possible outliers coming from noise. The result
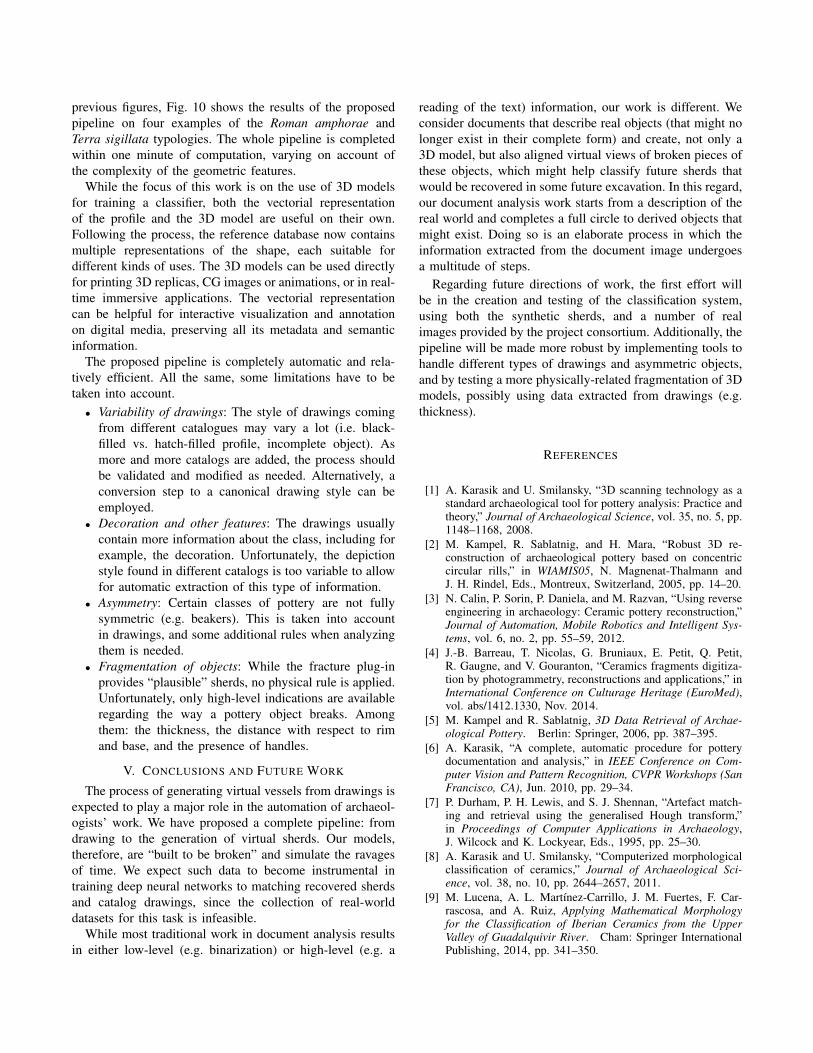
Figure 4: Removal of surface sketches.
of these operations is a de-noised binary image B.2) Finding the Rotation Axis: Once B is computed,
we need to find the rotation axis of the vessel’s drawing,which is usually present. Hough transform [23] is employedto detect the longest vertical line in a drawing, which isassumed to be its rotation axis. We now need to detect allfeatures from the section of the drawing. To avoid outliers,the part of the drawing illustrating the surface of the vessel(i.e. the part on the right) is removed, see Fig. 4.
3) Extracting the Inner Profile: To compute the innerprofile, first we compute all edges in B, and store them in alist of piece-wise linear curves, E. Then, we find the closestpoint p to the rotation axis from a curve ei ∈ E. From p,we march to the top point of ei, i.e. the rim point, and tothe bottom point of ei, i.e. the base point. The sequenceof points of ei between these two points and containing p,belongs to the inner profile. We define this curve as e?i .
4) Extracting the Outer Profile and Handles: All remain-ing points of ei, viz. e′i, contain both the outer profile and thehandle outer profile. Furthermore, the handle inner profileand a part of the outer profile belong to a curve ej (seeFig. 5). To properly cut both e′ and ej to obtain the outerprofile, we define an energy function that ensures C0 andG0 smoothness when trimming e′i and ej and joining theparts belonging to the outer profile. Note that all remainingpoints in e′i define the handle outer profile, and all remainingpoints in ej define the handle inner profile. The process isshown in Fig. 5. The handle outer profile, if it exists, canbe detected in a straightforward way by looking at a curveek ∈ E that is smaller than ej .
5) Computing the Scale Factor: The scale factor, sf , iscomputed by processing B using OCR software. In our case,we used the command-line version of the Tesseract OCRengine.2 To improve Tesseract OCR accuracy, we detect,where the scale is, by computing the longest horizontal lineusing again the Hough transform. At this point, we cropa 50% larger area of B around the scale to include scalevalues. The cropped area is processed by the OCR engine,which outputs two values: smin the minimum scale value,
2https://github.com/tesseract-ocr

ej
ei*e'i
Figure 5: The process of cutting different curves around thehandle of the vessel: On the left are the extracted curvesbefore cutting and joining. The e′i curve is green; e?i is red;and ej is blue. On the right is the result after cutting.
and smax the maximum scale value. Finally, the scale factoris computed as
sf =smax − smin
sp,
where sp is the length of the scale, in pixels, by using theresult of the Hough transform.
B. Generating the 3D Model and Sherds
In order to train a machine-based classifier to identifypotsherds, the first step is to actually obtain data. These dataare needed both for the training and the testing processes.However, while we have many paper catalogs describingthe various types of pottery, very few of them includeinformation on specific sherds. While it is possible to obtainsome data by taking photos of sherds that were alreadyclassified and stored, this process is tedious and mightnot be enough, since training machine-learning classifiers,especially deep neural networks, require large amounts ofsamples.
Therefore, we seek to employ synthetic training dataobtained through a specialized 3D algorithm to virtually“break” the 3D models produced in the previous step intomany small sherds. When generating data this way, we canobtain a large quantity of samples, with class labels for eachsherd, in a way that does not require a large amount ofmanual work. In addition, we can obtain the same amountof data even for classes for which only few samples werefound in the field.
1) Simplifying the Profile: The first stage is to simplifythe model. The outlines that were obtained previously comefrom identifying connected components in binary images.This may lead to aliasing artifacts on diagonal lines andcurves. By applying line simplification algorithms, we aim toreduce the number of points (to make further computationsfaster) and eliminate those small aliasing features.
To simplify the outline, we use a modified version of Vis-valigam’s algorithm [24]. The original algorithm simplifiesan outline by maintaining the list of triangles formed on theline by every three consecutive points. The “importance”of a point is then measured by the area of the triangle of
which it’s the middle point – because removing this pointwill flatten the triangle to a line, thus making a change ofthis size. Intuitively, we should always strive to make thesmallest changes when removing a point, thus at each stepwe remove the point that would eliminate the triangle withthe smallest area.
The problem with using many out-of-the-box line sim-plification algorithms, including [24], is that they do notprotect against the arise of self-intersections in the out-line during the simplification process. To solve this, weuse the newer approach suggested in [25], which modifiesVisvalingam’s algorithm to avoid self intersections. Ourexperiments showed that, using [25], most outlines can bereduced from a few thousand points, to typically fewer than200, with no visible differences. Furthermore, by cappingthe area of the removed triangles, the level of simplificationcan be fine-tuned as desired.
2) Generating the 3D Model: Many types of pottery arecrafted on a potter’s wheel; the body is produced by rotatingthe clay around a central axis while deforming the profileto form the base of the vessel. The handles (and sometimesother external elements) are created with a manual process.Nevertheless the handle section and attachment to the bodyare usually common among the exemplars of the same class.In this paper, we suggest mimicking the same process toreconstruct the 3D model out of the profile, treating the bodyand the handles in different ways.
Generating the body: First, we extract the profile ofthe body (made by joining the inner and outer profiles) andthe rotation axis. Then, we simplify the profile and scale itto the real measures using the scale factor. Afterwards, wealign the profile on the xz plane in 3D, so that the rotationaxis is located on the z-axis. Finally, we generate the 3Dbody by rotating the result around the z-axis.
Generating the handles (if present): First, we extractthe handle profiles and section. Then, we create the handlemodel by extruding the handle sections following the handleprofiles, while scaling the section according to the distancebetween the profiles. Afterwards, we align the handles to thexz plane. Finally, the handles and the body are connectedby finding the intersection between the models and creatinga 2-manifold surface.
Fine-tuning rotational resolution: When generating thebody by rotating the simplified profile, one parameter we stillhave to determine is the number of “vertical rings”, i.e. howmany times to duplicate the profile around the axis, to formthe body. While it is possible to set this to a fixed number(200 seems to yield smooth results), we can also determinethis dynamically using the same simplification logic fromVisvaligam’s algorithm, to yield consistent level of detail.Let k be the number of vertical rings, and let rmax be themaximal (horizontal) radius from the rotation axis. Then, thearea of a triangle formed by the same point at radius rmax

Figure 6: A snapshot of some reconstructed 3D models.
on 3 consecutive vertical rings, is given by the formula:
∆area = r2max · sin(
2π
k
)·(
1− cos
(2π
k
))As can be seen from the formula, the area increases as kdecreases. Therefore, to achieve the same level of detail thatwas obtained in the simplification process, we want to findthe minimal k so that the area is still less than the areaof triangles we eliminated in the simplification process. Inpractice, using this formula allows to decrease the numberof vertical rings by a factor of 3–5 times compared to thefixed value of k = 200.
Results: Fig. 6 shows 8 examples of reconstructed3D models: the different parts of the object (external andinternal body surface, handles) are represented with differentcolors, visualizing the different geometric features used inthe generation process.
3) Generating Synthetic Sherds: To break the 3D modelinto sherds, we use the “Cell Fracture” plug-in of Blender3
open-source tool. The plug-in breaks apart 3D models bygenerating a 3D Voronoi diagram, and then computing theintersection of each 3D Voronoi cell with the original model.Therefore, the resulting fractures in the model correspond tothe separating planes between the Voronoi cells.
Before breaking the model, we annotate faces as exte-rior/interior (as in Fig. 6). The fracturing process preservesthese notations, while also adding a fracture notation forfaces that represent fractures. This process can be repeatedagain to generate many sherds for each model. Furthermore,by controlling the number of Voronoi cells, we can influencethe size of the sherds (fewer cells imply larger cells andlarger sherds); thus we can obtain sherds of all sizes.
C. Capturing 2D Sherd Images
Since our goal is to generate sherd images that matchthose that are taken by field archaeologists, we discussedwith the archaeologists involved in the ArchAIDE projectthe semi-canonical views that are often being used to capture
3https://www.blender.org
(a) A reconstructedamphora modelwithout handles.This model has 61vertical rings and142 profile points.
(b) Sherd with avertical fracture.The inner and outerprofiles are on theleft and right of thefracture, resp.
(c) Sherd without avertical fracture. Itsright side is alignedto outline the outerprofile.
Figure 7: Amphora with two types of sherds.
a sherd. From their answers, it seems that the most indicativepicture would be the one looking at a fracture face, tryingto align the rotation axis to the vertical direction of theimage. For such a fracture, we can extract the outlines ofthe inner and outer profiles with a semi-automatic method(see Fig. 3). Since it is not always possible to find a pointof view where both the internal and external profiles arevisible, the alternative is to find a point of view where onlyone profile (usually the external one) is visible, and use onlythis feature for classification.
1) Righting Sherds: For real potsherds, rotational symme-try can be identified in most cases. While some ambiguitymay arise in areas that come from handles or other “extra”features, archaeologists are usually able to guess the axisof rotation, also by taking into account other details (suchas the geometric features in the internal side of the body).For synthetic data, since the process of breaking the modelinto sherds did not move sherds from their place, we alreadyhave all sherds oriented upwards as desired.
2) Finding Vertical Fractures and Aligning the Camera:Our generated data has smooth fracture faces, as they aregenerated from the bounding planes between 3D convexcells. Therefore, faces that correspond to a vertical fracturecan be characterized as faces that form a small angle withthe rotation axis. When taking the picture of the sherd, wealign the camera so that its “up” direction is the true updirection of the rotation axis, and so there’s only one degreeof freedom on its angle – choosing the rotation angle aroundthe rotation axis (the z-axis).
Our goal is to take the picture of the largest verticalfracture. This can be formalized by maximizing the areaoccupied by faces of vertical fractures in the 2D image.To solve this optimization problem, we approximate thesolution by considering only orthographic projection (i.e. noperspective deformation based on distance from the camera)and no occlusion by other faces. We then can characterize

(a) Maximizing leftvertical fracturearea.
(b) Maximizingoverall verticalfracture area.
(c) Maximizingright verticalfracture area
Figure 8: Handling multiple vertical fractures. As can beseen in (b), aligning multiple vertical fractures togetherresults in an unintuitive pose. Archaeologists would typicallyalign one fracture at a time.
the target function as
arg max~d
∑f∈Fvert
max(
0, normal (f) · ~d)· area (f) (1)
Instead of solving this optimization problem directly (whichis hard due to the non-linearity of max), we quantize theinfinite solution space into a finite set of a few hundred pos-sible direction vectors, and pick the best one (see Fig. 7b).As detailed below, this optimization will be solved once forevery vertical fracture. Specifically, the non-trivial cases weneed to handle are as follows:
No vertical fractures: As mentioned before, somesherds have no vertical fractures (or only have smallones),and for those we must align the side with the outerprofile as shown in Fig. 7c. To do this, we find the verticalring with the longest line along the outer profile, and alignthe normal of that plane to point to the camera.
Multiple vertical fractures: Each sherd can be the resultof multiple fractures in varying directions, with multipledisconnected vertical fractures. In that case, the optimizationof Eq. (1) may yield an angle observing two separate verticalfractures instead of being optimally aligned with one such(see Fig. 8b). To solve this, instead of globally maximizingvertical fracture areas in the 2D image, we apply the processseparately for each vertical fracture. Let P be the 3Dpolyhedron representing the sherd, and let Gf be the facegraph of P . The vertices of Gf correspond to faces of P , andthere is an edge in Gf iff the corresponding faces in P sharea common edge. Let Gvert be a subgraph of G containingonly faces in P that correspond to vertical fractures. Theneach connected component in Gvert corresponds to a distinctvertical fracture. For each such, we solve the above opti-mization problem and pick the fracture and angle yieldingthe highest global score computed over all fractures.
V-fractures: Another issue to consider is “V-fractures”– vertical fractures that form a “V” shape in the sherd, aswe have in Fig. 9. These fractures can be separated into twosmaller instances of vertical fractures. Let P (t) : [0..1] →R2 be the function representing the 2D curve of the profileoutline, progressing clockwise around the outline (the closed
(a) A sherd with annotated tvalues.
(b) Corresponding t values onthe profile.
Figure 9: Mapping points on a V-shaped cut to the t time onthe profile. By identifying local maxima (the blue points) of ton the fracture, one can decide where the boundary betweentwo separate vertical fractures is.
shape formed by the inner and outer profiles) as t increases.Since P is a one-to-one mapping, we can define the inversefunction, P−1 from a 2D point on the outline, to its t valuealong the curve. The inverse mapping is extended to 3Dresulting in P−13 , which maps a point on the 3D rotationof the profile, back to its t along the curve. We then breakthe V-fractures by finding the P−13 value of each point onthe contour of the fracture faces (i.e. points shared with aninner/outer face), and splitting vertical fractures by findinglocal maxima/minima in the P−13 values.
3) Capturing 2D Sherd Images: Once we have the di-rection vector of the camera, we need to create the 2Dimage. While this can be done via traditional ray-tracing,it is both inefficient (running time depends on the imageresolution) and inaccurate – as we’ll again have to trace anoutline in a 2D image and simplify it to get rid of aliasingartifacts. Instead, we propose generating the image by using2D envelopes of the 3D sherd model. The upper envelopeof a 3D model is a projection of its faces into 2D, so thatwhen multiple faces share the same (x, y) coordinate, thevisible face will be the face with highest z value.
By using the implementation of [26] in CGAL,4 we canefficiently obtain the 2D envelope of our model. This isessentially the same 2D projection we would have achievedusing classic ray-tracing, but obtained with points and linesinstead of discrete pixel values. By finding the correspon-dence between 2D faces in the planar map of the envelopeand 3D faces of sherd, we can compute the 2D outline ofthe fracture area, thus completing our generation process.
IV. RESULTS AND DISCUSSION
The ArchAIDE project selected three typologies of potteryfor the first testing of all its components: Roman amphorae,terra sigillata and medieval pottery. Especially for the firsttwo, archaeologists rely heavily on shape for classification.
The total number of reference classes for the three ty-pologies is on the order of a few hundred. In addition to
4http://www.cgal.org
previous figures, Fig. 10 shows the results of the proposedpipeline on four examples of the Roman amphorae andTerra sigillata typologies. The whole pipeline is completedwithin one minute of computation, varying on account ofthe complexity of the geometric features.
While the focus of this work is on the use of 3D modelsfor training a classifier, both the vectorial representationof the profile and the 3D model are useful on their own.Following the process, the reference database now containsmultiple representations of the shape, each suitable fordifferent kinds of uses. The 3D models can be used directlyfor printing 3D replicas, CG images or animations, or in real-time immersive applications. The vectorial representationcan be helpful for interactive visualization and annotationon digital media, preserving all its metadata and semanticinformation.
The proposed pipeline is completely automatic and rela-tively efficient. All the same, some limitations have to betaken into account.• Variability of drawings: The style of drawings coming
from different catalogues may vary a lot (i.e. black-filled vs. hatch-filled profile, incomplete object). Asmore and more catalogs are added, the process shouldbe validated and modified as needed. Alternatively, aconversion step to a canonical drawing style can beemployed.
• Decoration and other features: The drawings usuallycontain more information about the class, including forexample, the decoration. Unfortunately, the depictionstyle found in different catalogs is too variable to allowfor automatic extraction of this type of information.
• Asymmetry: Certain classes of pottery are not fullysymmetric (e.g. beakers). This is taken into accountin drawings, and some additional rules when analyzingthem is needed.
• Fragmentation of objects: While the fracture plug-inprovides “plausible” sherds, no physical rule is applied.Unfortunately, only high-level indications are availableregarding the way a pottery object breaks. Amongthem: the thickness, the distance with respect to rimand base, and the presence of handles.
V. CONCLUSIONS AND FUTURE WORK
The process of generating virtual vessels from drawings isexpected to play a major role in the automation of archaeol-ogists’ work. We have proposed a complete pipeline: fromdrawing to the generation of virtual sherds. Our models,therefore, are “built to be broken” and simulate the ravagesof time. We expect such data to become instrumental intraining deep neural networks to matching recovered sherdsand catalog drawings, since the collection of real-worlddatasets for this task is infeasible.
While most traditional work in document analysis resultsin either low-level (e.g. binarization) or high-level (e.g. a
reading of the text) information, our work is different. Weconsider documents that describe real objects (that might nolonger exist in their complete form) and create, not only a3D model, but also aligned virtual views of broken pieces ofthese objects, which might help classify future sherds thatwould be recovered in some future excavation. In this regard,our document analysis work starts from a description of thereal world and completes a full circle to derived objects thatmight exist. Doing so is an elaborate process in which theinformation extracted from the document image undergoesa multitude of steps.
Regarding future directions of work, the first effort willbe in the creation and testing of the classification system,using both the synthetic sherds, and a number of realimages provided by the project consortium. Additionally, thepipeline will be made more robust by implementing tools tohandle different types of drawings and asymmetric objects,and by testing a more physically-related fragmentation of 3Dmodels, possibly using data extracted from drawings (e.g.thickness).
REFERENCES
[1] A. Karasik and U. Smilansky, “3D scanning technology as astandard archaeological tool for pottery analysis: Practice andtheory,” Journal of Archaeological Science, vol. 35, no. 5, pp.1148–1168, 2008.
[2] M. Kampel, R. Sablatnig, and H. Mara, “Robust 3D re-construction of archaeological pottery based on concentriccircular rills,” in WIAMIS05, N. Magnenat-Thalmann andJ. H. Rindel, Eds., Montreux, Switzerland, 2005, pp. 14–20.
[3] N. Calin, P. Sorin, P. Daniela, and M. Razvan, “Using reverseengineering in archaeology: Ceramic pottery reconstruction,”Journal of Automation, Mobile Robotics and Intelligent Sys-tems, vol. 6, no. 2, pp. 55–59, 2012.
[4] J.-B. Barreau, T. Nicolas, G. Bruniaux, E. Petit, Q. Petit,R. Gaugne, and V. Gouranton, “Ceramics fragments digitiza-tion by photogrammetry, reconstructions and applications,” inInternational Conference on Culturage Heritage (EuroMed),vol. abs/1412.1330, Nov. 2014.
[5] M. Kampel and R. Sablatnig, 3D Data Retrieval of Archae-ological Pottery. Berlin: Springer, 2006, pp. 387–395.
[6] A. Karasik, “A complete, automatic procedure for potterydocumentation and analysis,” in IEEE Conference on Com-puter Vision and Pattern Recognition, CVPR Workshops (SanFrancisco, CA), Jun. 2010, pp. 29–34.
[7] P. Durham, P. H. Lewis, and S. J. Shennan, “Artefact match-ing and retrieval using the generalised Hough transform,”in Proceedings of Computer Applications in Archaeology,J. Wilcock and K. Lockyear, Eds., 1995, pp. 25–30.
[8] A. Karasik and U. Smilansky, “Computerized morphologicalclassification of ceramics,” Journal of Archaeological Sci-ence, vol. 38, no. 10, pp. 2644–2657, 2011.
[9] M. Lucena, A. L. Martı́nez-Carrillo, J. M. Fuertes, F. Car-rascosa, and A. Ruiz, Applying Mathematical Morphologyfor the Classification of Iberian Ceramics from the UpperValley of Guadalquivir River. Cham: Springer InternationalPublishing, 2014, pp. 341–350.

Figure 10: Four examples of the 3D model generation pipeline. (a) Original drawing. (b) Geometric features. (c) 3D model.(d) 3D sherds.
[10] A. Gilboa, A. Karasik, I. Sharon, and U. Smilansky, “Towardscomputerized typology and classification of ceramics,” Jour-nal of Archaeological Science, vol. 31, no. 10, pp. 681–694,2004.
[11] M. Kampel and R. Sablatnig, “Automated segmentation ofarchaeological profiles for classification,” in Object recogni-tion supported by user interaction for service robots, vol. 1,2002, pp. 57–60.
[12] C. Maiza and V. Gaildrat, “Automatic classification of ar-chaeological potsherds,” in The 8th International Conferenceon Computer Graphics and Artificial Intelligence (3IA’2005),May 2005, pp. 135–147.
[13] M. Makridis and P. Daras, “Automatic classification of ar-chaeological pottery sherds,” J. Comput. Cult. Herit., vol. 5,no. 4, pp. 15:1–15:21, Jan. 2013.
[14] J. Poblome, P. Bes, and C. Piccoli, “Towards the auto-matic classification of pottery sherds: Two complementaryapproaches,” in CAA Conference Proceedings, May 2013, pp.463–474.
[15] C. Ding and L. Liu, “A survey of sketch based modelingsystems,” Frontiers of Computer Science, vol. 10, no. 6, pp.985–999, 2016.
[16] J. Malik, “Interpreting line drawings of curved objects,”International Journal of Computer Vision, vol. 1, no. 1, pp.73–103, 1987.
[17] C. Tian, M. A. Masry, and H. Lipson, “Physical sketching:Reconstruction and analysis of 3D objects from freehandsketches,” Computer-Aided Design, vol. 41, no. 3, pp. 147–158, 2009. [Online]. Available: http://dx.doi.org/10.1016/j.cad.2009.02.002
[18] Y. Wang, J. Liu, Y. Chen, and X. Tang, “3D reconstruction
of curved objects from single 2D line drawings,” in 2009IEEE Computer Society Conference on Computer Vision andPattern Recognition (CVPR) Workshops. Los Alamitos, CA,USA: IEEE Computer Society, 2009, pp. 1834–1841.
[19] H. Lee and S. Han, “Reconstruction of 3D interacting solidsof revolution from 2D orthographic views,” Comput. AidedDes., vol. 37, no. 13, pp. 1388–1398, Nov. 2005.
[20] B. Xu, W. Chang, A. Sheffer, A. Bousseau, J. McCrae, andK. Singh, “True2Form: 3D curve networks from 2D sketchesvia selective regularization,” ACM Trans. Graph., vol. 33,no. 4, pp. 131:1–131:13, Jul. 2014.
[21] M. Bessmeltsev, W. Chang, N. Vining, A. Sheffer, andK. Singh, “Modeling character canvases from cartoon draw-ings,” ACM Trans. Graph., vol. 34, no. 5, pp. 162:1–162:16,Nov. 2015.
[22] X. Yin, P. Wonka, and A. Razdan, “Generating 3D buildingmodels from architectural drawings: A survey,” IEEE Com-puter Graphics and Applications, vol. 29, no. 1, pp. 20–30,Jan. 2009.
[23] R. C. Gonzales and P. Wintz, Digital Image Processing (2NdEd.). Boston, MA, USA: Addison-Wesley Longman, 1987.
[24] M. Visvalingam and J. Whyatt, “Line generalisation by re-peated elimination of the smallest area,” Cartographic Infor-mation Systems Research Group, University of Hull, Tech.Rep., 1992.
[25] J. Davies. (2014) Visvalingam’s algorithm: Avoidingintersections. [Online]. Available: https://www.jasondavies.com/simplify/
[26] M. Meyerovitch, “Robust, generic and efficient constructionof envelopes of surfaces in three-dimensional spaces,” Mas-ter’s thesis, Tel Aviv University, 2006.