vaughan, ontario - sustainabletechnologies.ca · performance evaluation of an anionic polymer for...
TRANSCRIPT

Performance Evaluation of an Anionic Polymer for Treatment of Construction Runoff Vaughan, Ontario
Prepared by: Toronto and Region Conservation Final Report 2010


Performance Evaluation of an Anionic Polymer
for Treatment of Construction Runoff Vaughan, Ontario
Final Report
Prepared by:
Toronto and Region Conservation
under the
Sustainable Technologies Evaluation Program
November 2010
© Toronto and Region Conservation Authority


Performance Evaluation of an Anionic Polymer
Final Report Page i
NOTICE The contents of this report do not necessarily represent the policies of the supporting agencies. Although every reasonable effort has been made to ensure the integrity of the report, the supporting agencies do not make any warranty or representation, expressed or implied, with respect to the accuracy or completeness of the information contained herein. Mention of trade names or commercial products does not constitute endorsement or recommendation of those products.
PUBLICATION INFORMATION Comments on this document, or requests for other studies conducted under STEP, should be directed to: Tim Van Seters Manager, Sustainable Technologies Toronto and Region Conservation Authority 5 Shoreham Drive, Downsview, Ontario M3N 1S4 Tel: 416-661-6600, Ext. 5337 Fax: 416-661-6898 E-mail: [email protected]

Performance Evaluation of an Anionic Polymer
Final Report Page ii
THE SUSTAINABLE TECHNOLOGIES EVALUATION PROGRAM The Sustainable Technologies Evaluation Program (STEP) is a multi-agency program, led by the Toronto and Region Conservation Authority (TRCA). The program helps to provide the data and analytical tools necessary to support broader implementation of sustainable technologies and practices within a Canadian context. The main program objectives are to:
• monitor and evaluate clean water, air and energy technologies;
• assess barriers and opportunities for implementing technologies;
• develop supporting tools, guidelines and policies; and
• promote broader use of effective technologies through research, education and advocacy.
Technologies evaluated under STEP are not limited to physical structures; they may also include preventative measures, alternative urban site designs, and other innovative practices that help create more sustainable and liveable communities.

Performance Evaluation of an Anionic Polymer
Final Report Page iii
ACKNOWLEDGEMENTS Funding support for this project was generously provided by:
• City of Vaughan;
• Government of Canada’s Great Lakes Sustainability Fund;
• Toronto and Region Remedial Action Plan;
• Fisheries and Oceans Canada;
• Regional Municipality of York; and
• Regional Municipality of Peel.
The following organizations provided in-kind support in the form of products, technical advice and/or professional services:
• Ontario Ministry of Environment Laboratory Services Branch
• Applied Polymer Systems Inc.
• Clearflow Enviro Systems Group Inc.
• Aquatech Dewatering Company


Performance Evaluation of an Anionic Polymer
Final Report Page iv
EXECUTIVE SUMMARY The impacts of a construction project on the natural features that surround it can be substantial. Large areas stripped of their vegetative cover during construction are susceptible to erosion, resulting in high turbidity runoff that can be detrimental to aquatic organisms in receiving waters. Sediment control measures like detention ponds have proven effective in removing the majority of suspended sediment, however the levels in construction effluent from most sites in the Greater Golden Horseshoe Area are still above thresholds required for the protection of aquatic habitat. The use of flocculation polymers for the clarification of construction runoff has recently garnered a great deal of attention. Their effectiveness lies in their ability to enhance coagulation and/or flocculation of fine particles, allowing for more rapid settling in downstream detention practices. Polymer-based water clarification has been used in wastewater and drinking water treatment for decades, but treatment of construction runoff is a newer and less established application of the technology. This study evaluates the performance of the polymer anionic polyacrylamide (PAM) for treatment of construction runoff in two potential dewatering applications. PAMs are a group of high molecular weight, water soluble molecules formed by polymerization of the monomer acrylamide. It was selected as the subject of this evaluation based on promising performance and low toxicity findings in studies completed to date. A literature review was also completed to provide a context for the field study, and improve overall understanding of the nature, performance, and safety of PAM and some of its polymer alternatives. Study site Field monitoring activities completed as part of this study were carried out at the construction site for a 77 ha residential development in the City of Vaughan, near the intersection of Pine Valley Drive and Major Mackenzie Drive. The site drains to Marigold Creek within the East Humber River subwatershed. Field monitoring focused on evaluation of two applications of anionic PAM products to treat stormwater being pumped out of a construction sediment control pond located on the development site. In the first application, PAM products were used in a roadside ditch, and in the second application the product was introduced via a mixing tank installed in series with a larger settling tank. Approach The primary PAM product used was the Floc Log®, a semi-solid block composed of drinking water treatment chemicals and anionic PAM, and manufactured by Applied Polymer Systems Inc. (APS) based in the U.S. state of Georgia. For the ditch application, an anionic PAM-based powder sold by APS under the proprietary name Silt Stop® was also used. The specific formulations of both products used were determined by APS based on laboratory analysis of sediment and water samples collected from the site. For each application a polymer-free control was also set up in order to quantify the added sediment removal benefit the polymer provided over and above that of the same measures applied without polymers.

Performance Evaluation of an Anionic Polymer
Final Report Page v
Ditch application A portion of the roadside ditch on Pine Valley Drive, bordering the construction site, was converted into a polymer-based system for the clarification of water being pumped from the sediment control pond. A south-draining stretch of the ditch was retrofitted with a polyethylene liner, rock check dams, Floc Logs®, and jute netting coated with Silt Stop®. A control for the experiment was installed on a north-draining portion of the ditch, and was retrofitted with all the same components with the exception of the PAM products. The amounts of Floc Log® and Silt Stop® to be used, the placement of the logs and check dams in the ditch, and the optimal water flow rate were all determined based on consultation with Clearflow Enviro Systems Group and APS. Their recommendation was to use 8 Floc Logs® and pump water into the ditch at a rate between 9 and 13 litres per second. The ditch was designed to provide adequate space for polymer dosing (dissolution of logs into water), mixing, and settling. Sampling of ditch influents and effluents was planned during periods of elevated pond turbidity, as dry weather pond turbidity was too low (< 10 FTU) to allow for an accurate assessment of polymer performance. Two separate experiments were undertaken to characterize the effectiveness of the ditches. In the first experiment, water was pumped into the ditch at 11 L/s and automated water samplers set up at the beginning and end of each ditch collected hourly samples for 20 hours following a 60 mm rainfall event on August 20, 2009. Prior to the second experiment the position of the logs was reassessed due to the minimal turbidity reduction observed in the first experiment. The logs were re-positioned to better channelize the flow, encourage contact between the logs and water, and minimize water short-circuiting the dosing area. During the second experiment, carried out on September 9, 2009, influent turbidity was elevated through manual disturbance of pond bottom sediments near the pump intake. Rather than continuous sampling, grab samples were taken at different points along the ditches to measure the progressive decline in turbidity through the flow path. Samples were taken at two pump flow rates (8 L/s and 11 L/s) and at different influent turbidity levels to assess the extent to which these factors would influence performance. Tank application In the second application, the anionic PAM product was introduced through a polymer mixing tank in series with a large settling tank downstream and a sediment bag at the end of the system for final filtration and flow dispersion. A control for the experiment consisted of a settling tank with a sediment bag downstream. The 1.8 m3 mixing tank used contains three separate horizontal compartments; the top to hold the Floc Logs®, and the bottom two forcing mixing of the water and the dissolved PAM. A total of eight large Floc Logs® - equivalent to double the mass of those used in the ditch experiment - were placed in the mixing tank. Water was pumped from the pond to the mixing tank (polymer side) or directly to the settling tank (control side) at a rate of 12.6 L/s. Field monitoring of the polymer and control tank systems occurred in December 2009. Samples were collected on two occasions: the first set during a rainfall event on December 2, and the second set during manual disturbance of pond sediments on December 4. For samples from the December 2 rainfall event, handheld turbidity measurement of influent during the event showed that it was too clear for the test (less than 80 FTU). As a result, these samples were not

Performance Evaluation of an Anionic Polymer
Final Report Page vi
submitted for laboratory analysis, and instead only turbidity levels were measured using a handheld turbidimeter. During the December 4 experiment, it was observed that freezing conditions overnight had resulted in the freezing of Floc Logs® in the mixing tank. A few test samples taken when the logs were frozen indicated that effluent turbidity was similar to influent turbidity and that the logs were not dosing effectively in that condition. The logs were subsequently defrosted gradually by water that was pumped through the tank and the warmer daytime temperatures before it was determined that sampling could be initiated. Samples collected from both the ditch and tank applications were submitted to the Ontario Ministry of Environment Laboratory for analysis of turbidity and suspended solids concentrations. Select samples were also analyzed for particle size distribution. Findings
Performance results Despite a wide variation in performance among different experiments, the systems in which polymer products were used were consistently more effective at reducing TSS than their corresponding control systems for both applications (Figure 1). The Aug. 20 ditch experiment was the only one for which the average effluent TSS concentration was higher for the polymer system. Reasons for the poor performance of the polymer ditch during that experiment include the less than optimal orientation of the logs and the finer PSD of the polymer ditch influent. The modest reduction in turbidity observed for both the polymer and control tanks on Dec. 2 (16.2% and -1.5%, respectively) is also likely attributable to a finer influent particle size distribution compared to the Dec. 4 test. The naturally turbid runoff from the Dec. 2 rainfall event would be expected contain finer particles than influent from Dec. 4, which was turbid as a result of manual agitation. The polymer systems yielded the best results during the Sept. 9 and Dec. 4 experiments, both with respect to effluent TSS concentration and percent TSS reduction. Percent TSS reductions in the polymer systems during these two tests – 88% for the ditch and 92% for the tank – would seem to indicate that the tank was slightly more effective than the ditch, however the ditch resulted in a substantially lower TSS effluent, averaging 20 mg/L, compared to the tank average of 42 mg/L. Based on the experiments conducted, neither application (ditch or tank) was demonstrated to perform more effectively than the other with respect to reducing suspended solids levels. While the largest TSS reduction was observed on Dec. 4, this is largely a function of the greatly elevated influent TSS concentration during that experiment. Ultimately, the system that achieved the largest TSS reduction (95%) and lowest effluent TSS concentration (13 mg/L) was the polymer tank system with the sediment bag. If the ditch system was also applied with a similar type of final filtration measure, it is conceivable that effluent TSS concentrations would have been closer to the low levels discharged from the tank system with the sediment bag.

Performance Evaluation of an Anionic Polymer
Final Report Page vii
0
15
30
45
60
75
90
105
120
135
150
165
-10
0
10
20
30
40
50
60
70
80
90
100
Polymer Control Polymer Control Polymer Control Polymer Control Polymer Control
Aug. 20 (ditch) Sept. 9 (ditch) Dec. 2 (tank)* Dec. 4 (tank) Dec. 4 (tank + bag)**
Effluent averageTSS conc. (mg/L)
Aver
age T
SS R
educ
tion (
%)
% TSS Reduction - Control % TSS Reduction - Polymer Effluent TSS concentration (mg/L)
Figure 1: Average percent TSS reductions and effluent concentrations for all experiments. Data table also includes influent TSS concentrations.
Experiment date Application
Average TSS concentration (mg/L) Average % TSS reduction Comments
Control influent Control effluent Polymer influent Polymer effluent Control Polymer Aug. 20 ditch 78.0 73.7 115.3 106.5 5.4 7.7 Before correction of Floc Log® positions
Sept. 9 ditch 148 108 171 20.4 22.3 87.7 After correction of Floc Log® positions
Dec. 2 tank TSS data not collected -1.5* 16.2* * No TSS data available; values represent turbidity reduction
Dec. 4 tank 706 126 706 41.6 82.2 94.1 Tank effluent prior to sediment bag filtration
Dec. 4 tank + bag 564 ** 153 ** 564 ** 13.3 ** 58.6 ** 94.9 ** Tank effluent after sediment bag filtration
**Average of only 4 samples; other results for Dec. 4 represent 16 samples.

Performance Evaluation of an Anionic Polymer
Final Report Page viii
TSS levels in effluents from the both control systems were consistently greater than 100 mg/L with the exception of the Aug. 20 event, for which influent was only 78 mg/L and thus the effluent was 74 mg/L. While TSS reduction was sometimes substantial in these systems (82% on Dec. 4), these effluent TSS concentrations are not low enough to prevent impacts to aquatic habitat. Because settling is the primary mechanism of sediment removal in the control systems, and detention time provided during dewatering was relatively short, fine particles could not be settled out of suspension using the ditch or tank as they were applied during these experiments. Modifications to the design and/or method of application of these practices could help to optimize settling and yield better results. Factors influencing performance The three main steps in the polymer-based systems were dosing, mixing and final filtration. Polymer-based flocculation systems for stormwater clarification are designed to optimize performance of these three functions, and the experiments conducted demonstrated the importance of each, as described below.
• Re-positioning of the Floc Logs® after the first ditch test resulted in more opportunity for contact between the water and the logs during the second test, and a therefore a substantial improvement in ditch performance (from 7.7% to 87.7% TSS reduction).
• The importance of adequate opportunity for mixing/reaction of the polymer and the water was most apparent during the Sept 9 ditch test, during which TSS levels progressively decreased through the polymer ditch from the inlet to the outlet. Optimization of flow rate, and system length and structure are essential to proper mixing.
• While no filtration was provided at the end of the ditches, the effect of filtration in the tank experiment was substantial. The polymer tank effluent TSS concentration decreased from 42 mg/L to 13 mg/L after filtration through the sediment bag.
For the control systems, factors affecting the gravitational settling of suspended particles, such as flow rate and particle size distribution, were expected to be the most important determinants of sediment removal performance. During the Sept. 9 ditch test, a lower flow rate and coarser influent particle size distribution resulted in the greatest TSS removal for the control ditch system. Sediment accumulation in detention type measures can also reduce performance over time due to re-suspension. This is widely accepted as a factor impacting the performance of settling tanks, or any other measure that promotes settling through detention (e.g., basins). During the Dec. 4 experiment, effluent TSS concentrations increased over the course of sampling as sediment accumulated in the polymer and control tanks. The TSS increase was greater for the control tank, which is line with polymer manufacturer claims that polymer-based flocculation results in settled sediment that resists re-suspension. This effect was less apparent in the ditches, likely because they were used for a shorter period and accumulated less sediment than the tanks. Recommendations Anionic PAM has the potential to be a highly effective aid in clarifying construction site runoff when the delivery system is properly designed and maintained. The following recommendations are based on study results and the need to fill existing knowledge gaps with respect to polymers.

Performance Evaluation of an Anionic Polymer
Final Report Page ix
Polymer system design and monitoring
Anionic PAM-based delivery systems must be designed to ensure that they provide for proper dosing, adequate mixing, and a final filtration to prevent flocs from entering receiving waters. The intended installation location and the expected flow rate are important considerations in determining the physical structure of the system.
The chemistry of water to be treated and sediment from the site are the primary data used to determine the type and quantity of polymer and mixing time required. Data provided to the polymer product supplier must be true to field conditions.
During PAM-based construction runoff clarification, the system should be continuously monitored to ensure that no PAM is released to adjacent natural features. Designs that are protected from the elements and vandalism are preferable.
Risk of accidental polymer release to the environment can be minimized by (i) increasing redundancy in the system by installing protection surrounding a ditch application or extra filtration at the end of the system, (ii) ensuring calculations of the amount of polymer used are accurate and (iii) educating construction staff about the polymer being used.
Where geotextile bags are used for final filtration, close monitoring is required to ensure that bags are replaced as needed Because they can fill up quickly when used as part of a polymer system, extra caution should be exercised to ensure the bag does not rupture.
For ditch systems, the impact of wet weather flows in the ditch must be considered. Any water that flows into the ditch from somewhere other than the inlet, or flows out from somewhere other than the outlet (where there is a final filtration) should be monitored to ensure that polymer-dosed water is not released to areas outside the treatment system.
Control systems – dewatering ditch and settling tank
Settling tanks like the one tested, used without polymers, should not be applied in the clarification of sediment-laden construction runoff consisting of a large proportion of fine particles, as the mechanism of sediment removal in the tank does not allow for reduction of TSS to levels low enough to meet thresholds for aquatic habitat protection.
The control ditch tested, as designed in this study, should not be applied for the purpose of clarifying construction runoff if used as a standalone measure. The ditch was ineffective at reducing TSS to acceptable levels, particularly for fine particles. Using a permeable and/or natural cover (e.g., vegetation, erosion control mats) to stabilize the ditch would improve both infiltration and evaporation.
Research needs Further study in the following areas will help to provide information needed in order to inform the establishment of effective policy and guidance documents governing anionic PAM use.
Physical impact of reacted and unreacted anionic PAM deposition in aquatic habitats.
Safety of anionic PAM to other, more sensitive benthic invertebrates, particularly those commonly found in southern Ontario e.g., mussels, caddisflies, stoneflies, mayflies

Performance Evaluation of an Anionic Polymer
Final Report Page x
Performance of other viable applications of anionic PAM for treatment of construction runoff as well as stormwater from other urban developments.
Quantification of the extent to which re-suspension is reduced for settled sediment that contains anionic PAM (e.g., where PAM was used as a flocculant).
Cost assessment of different anionic PAM applications; design, installation, maintenance and decommissioning should all be included to ensure that the real costs of the applications are being compared.
Performance of PAM-based applications for reducing real turbidity levels resulting from dewatering during early construction stages before ponds are in place (e.g., earthworks).
Performance of anionic PAM for preventing erosion and increasing stormwater infiltration on construction sites in southern Ontario.
Identification and evaluation of viable non-polymer alternatives for clarification of sediment-laden construction runoff during early stages of construction.
Residual acrylamide content in existing PAM products; research in support of development of a local (Canada or Ontario) policy governing residual levels.
The extent to which PAM in the environment can degrade to AMD, including identification of which if any conditions in the natural environment can catalyze the reaction.
Research in support of development of a local certification or verification program for PAM products, to ensure consumers are receiving accurate information about their safety and performance.


Performance Evaluation of an Anionic Polymer
Final Report Page xi
TABLE OF CONTENTS
EXECUTIVE SUMMARY……………………………………………….………………1.0 INTRODUCTION……………………………………………………….………....
1.1 Context…………………………………..…………………….……..….….…1.2 Polymer technology…………………………...………………..………........…1.3 Study objectives……………………...………….……………..………........…
2.0 LITERATURE REVIEW……………………………………………………..…...2.1 What is polyacrylamide? …………………………………….………………..…2.2 Uses of polyacrylamide…………………………………….……………………2.3 Performance of PAM as a flocculant…………………………………..…………
2.3.1 Construction runoff treatment……………………………………………2.3.2 Stormwater quality management……………………………………..…2.3.3 Laboratory-scale studies…………………………………….……….…2.3.4 Manufacturer test results…………………………………….……….…
2.4 Performance of polyacrylamide as an erosion control………………….…………2.4.1 Agriculture industry…………………………………….…………….…2.4.2 Construction industry…………………………………….……..………
2.5 Environment and human health impacts of polymers………………………..……2.5.1 Toxicity…………………………………….……………………..……2.5.2 Risks associated with acrylamide………………………………………..2.5.3 Sustainability of PAM production and use……………………………..…
2.6 Summary…………………………………….…………………………………
3.0 FIELD STUDY……………………………………….……………..…………..…3.1 Ditch application…………………………….……………..………………...…
3.1.1 System design…………………………….………………...…………3.1.2 Monitoring approach…………………………….…………………..…3.1.3 Results…………………………….……………..………………...…3.1.4 Discussion…………………………….……………..……………..…
3.2 Tank application…………………………….……………..…………….......…3.2.1 System design…………………………….……………..………….…3.2.2 Monitoring approach…………………………….………………......…3.2.3 Results…………………………….……………..……………………3.2.4 Discussion…………………………….……………..…………......…
3.3 Comparison of ditch and tank applications…………………………….…………
iv
1
1
1
2
3
3
3
3
4
4
5
8
8 9 11
12
12
16
18
19
21
23
23
26
28
3840
4142
44
49
50

Performance Evaluation of an Anionic Polymer
Final Report Page xii
4.0 CONCLUSIONS…………………………….……………..…….……………..…
5.0 RECOMMENDATIONS…………………………….……………………….……5.1 Polymer system design and monitoring…………………………….………….…5.2 Control systems – dewatering ditch and settling tank…………………………..…5.3 Research needs…………………………….……………..……………………
REFERENCES…………………………………….…………………………….………
52
54
54
54
55
56

Performance Evaluation of an Anionic Polymer
Final Report Page xiii
LIST OF TABLES Table 2.1: Turbidity reduction resulting from cationic PAM clarification and chitosan-enhanced
sand filtration of construction stormwater………………………………………………...
Table 2.2: TSS removal efficiencies of clarifier at different polymer doses……………………
Table 2.3: Total mass exported in PAM-treated runoff, at three flow rates, as a percent of controls……………………………………………………………………………………….
Table 2.4: Summary of studies on toxicity of anionic PAM to aquatic invertebrates……………..
Table 2.5: Summary of studies on toxicity of anionic PAM to fish………………………………….
Table 2.6: Toxicity data for studies conducted by Clearflow Enviro Systems Group…………….
Table 2.7: Acute toxicity data for two wastewater treatment polymers in 96 hour static toxicity tests with lake trout fry……………………………………………………………………...
Table 3.1: Sampling summary for ditch monitoring……………………………………………….
Table 3.2: Summary of scenarios applied for ditch performance monitoring on September 9, 2009………………………………………………………………………….
Table 3.3: Summary of changes in median particle sizes for scenarios applied in ditch performance monitoring on Sept. 9, 2009………………………………………………..
Table 3.4: Sampling summary for tank monitoring………………………………….…………….
Table 3.5: TSS concentrations of influent and geotextile bag effluent for samples in Figure 3.26………………………………………………………………………………… Table 3.6: Summary of performance for all experiments…………………………………………
5
5
9
13
13
14 15
27
31 36
43 4751

Performance Evaluation of an Anionic Polymer
Final Report Page xiv
LIST OF FIGURES Figure 2.1: Polyacrylamide molecule………………………………………………………………..
Figure 2.2: Turbidity change over time during mixing tests of sediment and linear anionic PAM for three different initial solution turbidities………………………………………
Figure 3.1: APS Floc Log® and Silt Stop® powder………………………………………………….
Figure 3.2: Vellore Village Development study area in Vaughan, Ontario………………………
Figure 3.3: Post installation images of the polymer and control ditches…………………………
Figure 3.4: Experimental setup of control and polymer ditches………………………………..
Figure 3.5: Polymer ditch before re-positioning of Floc Logs® …………………………………
Figure 3.6: Polymer ditch after re-positioning of Floc Logs®………………………………………
Figure 3.7: TSS concentrations of influents and effluents from polymer and control ditches during sampling on Aug. 20-21, 2009. .....................................................................
Figure 3.8: Turbidity of influents and effluents from polymer and control ditches during sampling on August 20-21, 2009 ..............................................................................
Figure 3.9: Percent TSS reduction during sampling on Aug. 20-21, 2009 .................................
Figure 3.10: Influent particle size distributions for polymer and control ditches during sampling on Aug. 20, 2009………………………………………………………………………….
Figure 3.11: TSS concentrations along the polymer ditch during three scenarios tested on Sept. 9……………………………………………………………………………………..
Figure 3.12: Turbidity along the polymer ditch during three scenarios tested on Sept. 9……….
Figure 3.13: TSS concentrations along the control ditch during three scenarios tested on Sept. 9……………………………………………………………………………………..
Figure 3.14: Turbidity along the control ditch during three scenarios tested on Sept. 9……..…
Figure 3.15: Percent reduction in TSS for polymer and control ditches on Sept. 9………………
Figure 3.16: Particle size distribution of ditch influents and effluents during “high flow, high turbidity” scenarios on Sept. 9, 2009…………………………………………………..
Figure 3.17: Particle size distribution of ditch influents and effluents during “low flow, high turbidity” scenarios on Sept. 9, 2009…………………………………………………..
Figure 3.18: Experimental set up for tank application……………………………………………….
Figure 3.19: Settling tanks……………………………………………………………………………...
Figure 3.20: Polymer mixing tank……………………………………………………………………...
Figure 3.21: Geotextile bag at the end of the polymer treatment system…………………………
Figure 3.22: Influent and effluent turbidities for samples collected during a rainfall event on Dec. 2-3, 2009…………………………………………………………………………….
Figure 3.23: Percent turbidity reduction for polymer and control tanks on Dec. 2, 2009………..
Figure 3.24: Influent and Effluent TSS during sampling on December 4, 2009. ..........................
3
7
21
22
2324
25
25
28
29
30
31
32
32 33
33
34
35
36
40
41
41
42 44
45
45

Performance Evaluation of an Anionic Polymer
Final Report Page xv
Figure 3.25: Percent reduction in TSS for polymer and control tanks (before filtration through geotextile bags) during sampling on December 4, 2009…………............................
Figure 3.26: Total percent reduction in TSS during sampling on December 4, 2009. .................
Figure 3.27: Average particle size distribution of influent and polymer and control tank effluent during sampling on December 4, 2009…………………………………………………
46
47
48


Performance Evaluation of an Anionic Polymer
Final Report Page 1
1.0 INTRODUCTION
1.1 Context
The impacts of a construction project on the natural features that surround it can be substantial. Large areas stripped of their vegetative cover during construction are highly susceptible to wind and water erosion, resulting in high turbidity runoff generated during storm events. High turbidity levels in receiving watercourses can be detrimental to aquatic organisms in several ways; sediment deposited on gravel stream beds compromises fish spawning and alters the habitat of bottom-dwelling organisms and young fish, while suspended sediments can cause abrasion of gills, reduction in visibility required for spawning and feeding, and decreased sunlight penetration, which inhibits photosynthesis by algae and aquatic plants. Sediment can also carry other contaminants into receiving waters, including several heavy metals and nutrients which tend to bind to sediment particles. To prevent these impacts, construction runoff must be treated to remove suspended sediments before it is released to receiving watercourses. Erosion control practices prevent exposed soils from being entrained by a mobile agent such as stormwater, while sediment controls address the removal of sediment that has already become suspended in the stormwater. Most erosion controls are physical barriers applied at the soil surface, such as vegetation or protective natural fibre mats and blankets. Sediment controls, on the other hand, are targeted towards promoting the settling of suspended particles, usually by dissipating the energy in the flowing stormwater. While energy dissipation through technologies like sediment control ponds are an effective means of removing the majority of suspended sediment, levels found in construction effluent from most sites are still above thresholds for protection of aquatic habitat (Greenland International and TRCA, 2001; Clarifica Inc., 2004; TRCA and University of Guelph, 2006). This is mainly attributable to large inflow volumes and excessively high concentrations of sediment flowing into the pond, rather than to pond performance, which based on current design standards in the Greater Golden Horseshoe Area results in at least 80% - and often substantially greater – removal of suspended sediment. These elevated levels of suspended solids consist primarily of fine particles that do not settle during the detention time provided within sediment control ponds. 1.2 Polymer technology For several years, polymer-based technologies have been promoted as an important component of a multi-barrier approach to addressing elevated sediment levels in construction site runoff. Their effectiveness lies in their ability to enhance coagulation and/or flocculation of fine particles, allowing for more rapid settling in downstream detention practices. Once these larger flocs have formed, they are also more readily removed through other means, such as filtration. Although polymer-based water clarification is a technique that has been used extensively in wastewater and drinking water treatment for decades, treatment of construction runoff is a newer and less established application of this technology. There are currently several different types of polymers that have been marketed as construction runoff treatments, and new formulations are developed every year. Developing a product that is both safe and effective for various

Performance Evaluation of an Anionic Polymer
Final Report Page 2
applications has been a challenge faced by many manufacturers entering this market. In recent years, polymer use for construction sediment control has become increasingly common in Alberta and throughout the U.S., and many studies have investigated their potential benefits and risks. While there is a distinct interest in using polymers in Ontario, there have been few demonstrations or formal performance evaluations of polymers within the province. 1.3 Study objectives Assessing polymer performance under local soil and climate conditions, and understanding which application methods are most effective, are essential first steps in determining the future role of polymers in improving construction sediment management in southern Ontario. The specific objectives of this study are to:
Quantify the performance of a product consisting of the polymer anionic polyacrylamide for construction runoff clarification through field testing of two potential methods for dewatering a sediment control pond;
Determine which application tested is the most effective;
Identify the key factors that affected performance;
Summarize existing literature on the performance and toxicity of polymers and assess findings in relation to results of the current field study; and
Interpret data collected to identify and assess potential ecological impacts.
The products evaluated in this study are made from the anionic form of the polymer polyacrylamide (PAM). Products that employ PAM as their active ingredient were selected as the subject of this evaluation study based on promising performance and low toxicity findings described in studies completed to date (see section 2.5). Results of this study will assist in the establishment of policies and guidelines governing the use of polymers, and help to inform future education and training on polymer applications for construction sites.

Performance Evaluation of an Anionic Polymer
Final Report Page 3
2.0 LITERATURE REVIEW The product evaluated in the current study uses the synthetic polymer anionic polyacrylamide (PAM) as its active ingredient. The following literature review is focused on studies of the performance and safety of anionic PAM. Other synthetic polymers and biopolymers (e.g., chitosan) are also discussed, primarily for the purpose of comparison. 2.1 What is polyacrylamide? PAMs are a group of high molecular weight, water soluble molecules formed by polymerization of the monomer acrylamide. The molecular structure of PAM is shown in Figure 2.1.
Figure 2.1: Polyacrylamide molecule (n is the number of repeating acrylamide units) Anionic PAM - the form of PAM that carries a negative charge - is produced when acrylamide is polymerized with an anionic co-monomer. PAMs can be manufactured to have different molecular weights and charge densities by varying the reaction parameters and/or the relative quantities of reagents used. The charge density of PAM is often expressed in the literature as percent anionic or cationic, referring to the percentage of its monomers that contain a charged functional group. These variations can result in significant differences in the extent to which the PAM will bind to different types of particles. Even among products that contain anionic PAM as their active ingredient, performance can vary substantially if the PAM charge densities or molecular weights are different. 2.2 Uses of polyacrylamide PAMs and other polymers have been used for decades in a variety of industries, and have proven particularly effective in facilitating solid liquid separations such as waste and drinking water treatment, and clarification of various types of effluents (Barvenik, 1994). The clarification that can be achieved with the use of polymers improves the quality of industrial and agricultural effluents by removing suspended sediment particles and associated contaminants such as nitrogen and phosphorus. High molecular weight PAM works as a flocculant, which aids in solid-liquid separation by causing suspended particles to bind together to form larger aggregates in a process known as “polymer bridging.” Some common uses of PAM as a flocculant are:
reduction of sediment and nutrient loads (largely from agricultural sources) to natural lakes and ponds, often when they are eutrophic;

Performance Evaluation of an Anionic Polymer
Final Report Page 4
wastewater and drinking water treatment; and clarification of effluents in other industries, such as pulp and paper, and aquaculture.
The use of PAM in the treatment of turbid stormwater (during construction and post-development) is a newer and less common application that has recently begun to garner more attention. Flocculation differs from the mechanism of action of some other polymers which provide water clarification through coagulation. Polymers that are coagulants tend to have a low molecular mass and high charge density, while polymers that are flocculants have a high molecular mass and low charge density (Exall et al., 2008). Coagulation differs from flocculation in that it involves charge balancing, and occurs when the coagulant neutralizes the negatively charged particle surface (Laird, 1997). In water treatment, coagulants and flocculants are often used together – coagulants are used first to neutralize charges and flocculants are then added to cause the small neutralized particles to form large aggregates (Mason et al., 2005). Non-polymer coagulants, such as the metal salt aluminum sulphate, are also commonly used (Exall et al., 2008). PAM is also marketed for use as a tackifier in erosion control and pond demucking applications. As soil particles treated with PAM bind to one another they become more resistant to shear-induced detachment (Entry et al., 2002). As a result, high purity anionic PAM has become the most common synthetic polymer for reducing erosion caused by construction, and agricultural activities such as furrow irrigation (Sojka et al., 2005). It can be applied directly to soil surfaces or added to water used for irrigation. Once applied it can reduce water and wind erosion, and in certain conditions, prevent surface sealing and maintain the soil’s capacity to infiltrate water (Shainberg et al., 1990). In pond demucking, PAM helps to bind soil particles together and thereby facilitates the removal and transport of wet sediment, usually from the bottom of a pond. PAM is applied to wet sediment after a pond has been dewatered. Once it has reacted with the sediment, the pond can be excavated and the tackified sediment transported offsite. 2.3 Performance of PAM as a flocculant Several studies have evaluated the performance of flocculation polymers for improved management of sediment in a variety of applications. All the studies described in the following subsections evaluated the performance of flocculation polymers, however the majority of performance studies are focused on cationic (positively charged) polymers, and those addressing anionic PAM are limited. As a result, the majority of studies included in this section evaluate cationic PAMs. 2.3.1 Construction runoff treatment
A study completed by Benedict et al. (2004) in Redmond, Washington was the most similar to the current study with respect to its objective, which was to reduce turbidity of construction site runoff through polymer enhanced settling. The study assessed turbidity reduction and effluent toxicity for two types of polymers – the synthetic cationic PAM and the biopolymer chitosan, a linear polysaccharide derived from chitin, which is the structural element found in the exoskeleton of crustaceans and cell walls of fungi.

Performance Evaluation of an Anionic Polymer
Final Report Page 5
A liquid cationic PAM product (known as Catfloc 2953) was added to the construction stormwater through metered dosing in lined detention cells, while the chitosan in liquid form was mixed with water in a mixing chamber followed by a sand filter. Effluent was tested for turbidity and acute toxicity to Daphnia magna (water flea) and Oncorhynchus mykiss (rainbow trout). A comparison of influent and effluent turbidities resulting from the use of both products is shown in Table 2.1. Table 2.1: Turbidity reduction resulting from cationic PAM clarification and chitosan-enhanced sand filtration of construction stormwater (based on Benedict et al., 2004)
Type of Treatment
Total volume
treated (L)
Turbidity, untreated water (NTU) Turbidity, treated water (NTU) Range for indiv.
samples Range for
median values Range for indiv.
samples Range for
median values Polymer Clarification
(cationic PAM) 219,837,789 7 – 22,000 117 – 14,000 <1 – 45 4 – 11
Chitosan-enhanced sand filtration 3,671,849 71 – 710 168 <1 - 4 2
Based on these results, the chitosan based system seems to have performed slightly better than the system using cationic PAM, although the authors did not report on whether there was a statistically significant difference between the two. Further, differences in system components make it difficult to isolate the specific effect of the polymers and conclusively state that one polymer is more effective than the other. Nevertheless, the study demonstrates that both systems achieved impressive results, resulting in effluent turbidity levels in line with state standards (i.e., Washington Administrative Code WAC 173-201A), which require that discharges to receiving waters not increase turbidity by more than 5 NTU for background levels up to 50 NTU, or by more than 10% when background is above 50 NTU (Benedict et al., 2004). 2.3.2 Stormwater quality management
Wood et al. (2004) also investigated the clarification potential of a cationic polymer in a clarifier for treatment of stormwater from a mixed commercial, industrial and residential area in Toronto, Ontario. The study assessed performance of the clarifier structure, with and without lamellar plates, and at different levels of polymer dosing, including a scenario with no polymer added. The metal lamellar plates were positioned parallel to the direction of flow through the clarifier to help promote clarification by causing precipitation of flocculated material flowing across them. The TSS removal efficiencies for the different scenarios investigated are summarized in Table 2.2, which is derived from the data provided in the study. Table 2.2: TSS removal efficiency of clarifier at different polymer doses (from Wood et al., 2004)
With lamellar plates Without lamellar plates Polymer dosage
(mg/L) # of
samples TSS removal efficiency (%)
Polymer dosage (mg/L) # of samples TSS removal
efficiency (%) 0 6 26 0 5 5 2 7 61 2 6 47 4 32 83 4 7 52 8 11 68 - - -

Performance Evaluation of an Anionic Polymer
Final Report Page 6
The polymer addition also enhanced removal of other contaminants, such as nutrients and heavy metals, which are often removed along with sediment particles to which they tend to bind. While TSS concentrations are not provided in the study, the removal efficiencies are evaluated in the context of the Ontario Ministry of Environment Stormwater Management Planning and Design Manual (2003) which requires that a stormwater management technology remove at least 80% of TSS in order to be classified as providing an ‘enhanced’ level of aquatic habitat protection. With the system used, this level was achieved at a polymer dosing of 4 mg/L when the clarifier employed the lamellar plates. 2.3.3 Laboratory-scale studies A laboratory-scale study by Mason et al. (2005) addressed the use of aluminum sulfate (a non-polymer coagulant) and PAM (anionic, cationic and nonionic) to reduce loadings of soluble and particulate phosphorus from tributaries flowing into the Salton Sea in California. A jar test method was used to test the effectiveness of these different chemical amendments. The contents of the jar were subjected to different mixing speeds to determine which compounds were effective at which flow rates, thereby allowing for comparison to the flow rates experienced in the tributaries flowing into the Salton Sea. Experiments showed that the cationic form of PAM was the most effective in reducing turbidity at all mixing speeds tested (up to 300 RPM). Although less effective than the cationic PAM, both the anionic and nonionic PAMs tested (without alum) were still capable of reducing turbidity to less than 10% of that in the influent for mixing speeds of 25 to 50 RPM. Particulate phosphorus was also effectively reduced by the anionic and nonionic PAMs, but soluble phosphorus was not. Alum alone was effective in reducing turbidity and particulate phosphorus, but only in low energy systems (< 5 RPM) due to the weakness of the floc the alum formed. The alum floc was also effective in adsorbing soluble phosphorus, but again the lack of floc strength made it difficult to settle the flocs at higher mixing speeds. Ultimately, the authors determined that the combination of alum and nonionic PAM was the best option for removal of both particulate and soluble phosphorus where mixing speeds will exceed 5 RPM. When used together, the alum adsorbed soluble phosphorus without interfering with the capacity of the nonionic PAM to flocculate both the suspended solids and the alum floc. Despite the effectiveness of the cationic PAM, the authors discourage its use in Salton Sea tributaries due to concerns regarding its toxicity to aquatic life. PAM toxicity is discussed in section 2.5.1. Exall et al. (2008) examined floc formation following the addition of chemical amendments (alum, chitosan and cationic PAM) to sediment laden water in order to assess the potential for these amendments to assist in remediation and improved sediment management in high turbidity aquatic environments. Experiments carried out used Hamilton Harbour sediments to create a turbid solution for this laboratory-scale testing of floc behaviour. The cationic PAM performed the most effectively, as its flocs were larger and settled out faster than flocs formed with the other two amendments (Exall et al., 2008). The Desert Research Institute and the University of Nevada also collaborated on a series of anionic PAM studies, prepared for the U.S. Bureau of Reclamation. The bureau initiated this research based on their interest in assessing impacts from the use of anionic PAM for reducing seepage losses in unlined water delivery canals, however experiments measuring the ability of

Performance Evaluation of an Anionic Polymer
Final Report Page 7
PAM to clarify sediment laden water were also carried out. In jar tests completed, kaolinite clay was added to water to create solutions with a range of turbidities, to which dry granular anionic PAM was added to result in concentrations ranging from 0.5 to 32 ppm (Moran and Young, 2007). Figure 2.2 shows the resulting turbidity reductions for three different initial turbidity levels tested.
Figure 2.2: Turbidity change over time during mixing tests of sediment and linear anionic PAM for three different initial solution turbidities: (a) 150 NTU, (b) 300 NTU and (c) 600 NTU. Each curve represents a different concentration of PAM used (see legend). Source: Moran and Young, 2007.

Performance Evaluation of an Anionic Polymer
Final Report Page 8
The charts show the substantial turbidity reduction achieved by the anionic PAM over time. PAM concentrations of 2 and 4 ppm were the most effective at all three turbidity levels, and higher concentrations of PAM (16 and 32 ppm) did not improve performance over these lower doses. This is believed to be a result of the increased viscosity of the 16 and 32 ppm PAM solutions, which may prevent flocs from settling out of suspension (Moran and Young, 2007). 2.3.4 Manufacturer test results
Applied Polymer Systems Inc. (APS), the manufacturers of the anionic PAM products evaluated in the current study, have conducted numerous experiments investigating both the performance and safety of their products. An APS study completed by Iwinski and Snowdon (2006) tested the effectiveness of anionic PAM Floc Logs® for clarification of water being pumped out of a sediment pond on a construction site. Water was pumped from the pond to a ‘pipe mixer’ (a length of PVC pipe which held the logs) and then released to an open, polyethylene and jute lined ditch for settling of flocs. This set-up was used at two different sites, and monitoring results showed average turbidity reductions of 95 and 98%, corresponding to respective decreases from 400 and 850 NTU in the influents to 19.4 and 15.5 NTU in the effluents. The respective flow rates were 8.4 and 8.1 L/s. 2.4 Performance of polyacrylamide as an erosion control The ability of polymers to stabilize soils and prevent erosion has made this technology a valuable tool in both the construction and agriculture industries. In agriculture, the use of anionic PAM in furrow irrigation is an application of great interest to the industry, and consequently the subject of much of the existing research on PAM for erosion control. In the early 2000’s, PAM was being applied to approximately 400,000 irrigated hectares in the U.S. on an annual basis (Lentz et al., 2002). Research on the benefits of anionic PAM as an erosion control measure have focused primarily on prevention of soil loss and the transport of sediment, nutrients and other contaminants from the soil surface to receiving waterways. In furrow irrigation, there are several methods by which PAM may be distributed through the furrows (Sojka et al., 2005), including:
the addition of PAM to the irrigation water itself; the application of PAM in solution or powder form directly onto the soil; and a ‘powder patch’ in which a more dense layer of PAM granules is applied to the soil
immediately downslope of the furrow inflow location. On construction sites, PAM may be applied by broadcast of granules, distributed as a solution by a construction site watering vehicle, or included in a hydroseeding mixture to provide additional erosion protection during seed establishment. While the results of agriculture-focused PAM studies are relevant to the construction industry and vice versa, each study is generally carried out with only one of these applications in mind, and the experimental method used reflects the intended audience. In light of this, the following summary of PAM’s erosion control performance is divided into agriculture and construction focused studies.

Performance Evaluation of an Anionic Polymer
Final Report Page 9
2.4.1 Agriculture industry Over the past two decades, numerous studies have demonstrated the ability of anionic PAM to reduce soil erosion and the transport of contaminants. Entry and Sojka (2003) investigated the ability of anionic PAM to reduce transport of sediment and nutrients in runoff at three different flow rates. A powder patch of anionic PAM applied to the irrigation furrows in a 40 m field resulted in runoff sediment reductions of 37, 97 and 98% (calculated from results in “sediment” column in Table 2.3) relative to the control, at flow rates of 7.5, 15 and 22.5 L/min, respectively. Runoff from the PAM-treated area also contained lower levels of nutrients and metals, as shown in Table 2.3. Based on these results PAM would appear to be substantially less effective at a flow rate of 7.5 L/min, and nearly the same effectiveness at the two higher flow rates. The authors explain that because the numbers are presented as a proportion of the control, the fact that there was less erosion (and therefore less sediment transport) from the control at the low flow rate of 7.5 L/min, resulted in the PAM providing a smaller relative reduction in erosion at that flow rate. Table 2.3: Total mass exported in PAM-treated runoff, at three flow rates, as a percent of controls. (Source: Entry and Sojka, 2003, as interpreted in Sojka et al., 2005)
Flow rate (L/min) Sediment C N P K Ca Mg Mn Fe Cu B Zn
7.5 63.5 70.7 63.5 63.6 63.5 63.9 62.9 64.0 63.4 64.1 75.0 71.4
15.0 3.1* 3.0* 3.1* 3.1* 3.1* 3.1* 3.1* 3.1* 3.1* <0.1* <0.1* 3.1*
22.5 2.5* 2.5* 2.3* 2.5* 2.4* 2.4* 2.5* 2.5* 2.5* <0.1* 0.2* 0.2* * Differs from control at P=0.05 for a given flow rate. An earlier study by Sojka and Entry (2000) investigated the potential for PAM to reduce transport of another contaminant group found in agricultural runoff – microorganisms. The authors found that, for water that travelled 40 m across a PAM-treated field at flow rates ranging from 7.5 to 22.5 L/min, there was a reduction in algae, numbers of active and total bacteria, active and total fungal length, and total bacterial, fungal and microbial biomasses relative to a control plot. Field studies of anionic PAM applied on highly erodible silt loam soils in Idaho have also demonstrated substantial reductions in sediment loss, with larger PAM application rates corresponding with less erosion (Lentz and Sojka, 1994). At application rates less 0.7 kg/ha, sediment in runoff was on average 70% less than the control, while at application rates higher than 0.7 kg/ha, this average jumped to 94%. In this study the PAM treatment was also found to reduce levels of phosphate, nitrate and biochemical oxygen demand in runoff. Lentz et al. (1992) considered several factors impacting the performance of PAM for erosion control in irrigation furrows by injecting anionic PAM into irrigation water, and monitoring sediment losses relative to a control area over the course of three consecutive irrigations. The study showed that while soil loss was reduced by between 68 and 99% relative to the control during the first irrigation, it fell to between 38 and 58% during the second irrigation, suggesting that the efficacy of the residual PAM declined with each subsequent PAM-free irrigation. The authors also determined that the concentration at which PAM is applied, the duration of furrow exposure, and variations in the irrigation process affected its ability to reduce erosion. For example, a

Performance Evaluation of an Anionic Polymer
Final Report Page 10
“surge” method, in which irrigation was interrupted for 25 minutes once the water in the furrows had advanced, resulted in less soil loss compared to irrigating without this flow interruption. Some studies have also considered the effect of PAM applied on infiltration rates when applied to a soil surface. Studies considering this use of PAM have yielded mixed results; some have demonstrated that PAM can reduce surface sealing and thus substantially increase infiltration, while others have been carried out based on the hypothesis that PAM application would help to prevent infiltration. As an example, a summary of research on this topic by Sojka et al. (1998) concluded that the balance of evidence shows that anionic PAM increases infiltration when it is applied according to the U.S. Department of Agriculture’s Natural Resources Conservation Practice standard (USDA, 2002). On sandy loam soils, PAM use in furrow irrigation water at 20 ppm caused a 15% increase in infiltration (Lentz et al., 1992; Lentz and Sojka, 1994). Conversely, The Desert Research Institute and the University of Nevada completed a study for the U.S. Bureau of Reclamation in which they considered anionic PAM for reducing seepage losses (infiltration) in unlined water delivery canals. As part of the study, several experiments measured changes in soil saturated hydraulic conductivity following anionic PAM application (Moran and Young, 2007). The saturated hydraulic conductivity is the rate at which water can pass through a soil in saturated conditions, and is expressed as a depth per unit time. Results showed that PAM added to water at a concentration of 32 ppm caused reductions in saturated hydraulic conductivity of 80%, 81% and 52 % for a #70 mesh washed silica sand, a natural C33 sand and a loam soil, respectively. When sediment was added with the PAM, the reduction in hydraulic conductivity was even greater. The addition of 300 ppm of sediment to the water, along with any of the concentrations of PAM tested (ranging from 4 to 32 ppm), reduced hydraulic conductivity by at least 92%. The authors attribute this reduction in conductivity to the higher viscosity of the PAM-water solution (relative to water alone) and to the flocculated sediment creating a surface seal (Moran and Young, 2007). The conflicting information regarding the effect of anionic PAM on infiltration is best explained by considering differences in the way in which the PAM is applied, and the structure of the soil surface. When PAM is added to sediment laden water, and then allowed to pass over a soil surface, the flocculated sediment has the potential to clog pores and reduce infiltration. When PAM is instead applied directly to a soil surface, or applied in a relatively clear solution, the formation of flocs does not occur before the PAM is in contact with the soil surface. Once PAM is applied to a soil surface, it binds to the soil in situ and promotes the preservation of the existing structure of that surface soil. If this surface soil has a good structure (i.e., low density, high porosity, and minimal resistance to biological activity and root penetration), then the direct application of PAM to the surface will help to preserve and/or enhance capacity to infiltrate water (R.D. Lentz, personal communication, Sept. 17, 2010). The bottom of water delivery canals tend to have poorer soil structure than irrigation furrows, and thus the prospect of using PAM to prevent infiltration in the canals is more plausible. A study by Orts et al. (2000) compared the erosion prevention performance of anionic PAM to several biopolymers which are derived from natural by-products. Of the eight products tested, anionic PAM was the most effective in reducing sediment content in runoff from laboratory-scale mini-furrows used in the study. Application of only 10 ppm of PAM resulted in a 98% reduction in sediment in runoff relative to the control. Despite being applied in substantially higher amounts (80 ppm), most of the biopolymers only resulted in reductions ranging from 75 to 87% (Orts et al.,

Performance Evaluation of an Anionic Polymer
Final Report Page 11
2000). For chitosan, both field and laboratory tests were conducted. While laboratory performance was close to that of PAM, field results diverged substantially, with chitosan resulting in a sediment reduction of 51% compared to 99% for PAM. The authors suggest that the difference between field and lab results for chitosan was a result of the polymer flocculating out early in the furrow, such that none of it remained in the solution, and the downslope parts of the furrow were not exposed to the polymer. 2.4.2 Construction industry One of the major challenges related to sediment management on construction sites is preventing erosion on steeply sloped areas. Despite abundance of research on PAM as an erosion control in irrigation furrows, their slight slopes limit the relevance of this performance data in evaluating potential application on the steeper slopes found on construction sites. Flanagan et al. (2002) investigated the effectiveness of PAM on steep slopes in a construction application by comparing two different treatments to a control plot: (i) a solution of anionic PAM (P) and (ii) a solution of anionic PAM combined with dry gypsum (PG). The land area – tested using a rainfall simulator - had a 32% slope and was surfaced with 30 cm of silt loam topsoil over the sand and gravel subgrade. Results showed that both areas surfaced with PAM were very effective in reducing soil loss. The PG treatment was more effective, with an average reduction in soil loss of 91% relative to the control, compared to an average reduction of 83% on the P treatment plot. The respective runoff reductions for these two treatments were 52 and 40%. The authors explain that the role of gypsum is to increase the concentration of multivalent cations in the soil and thereby allow clay in the soil to remain in a flocculated state. This is believed to increase the effectiveness of anionic PAM (Shainberg and Levy, 1994). PAM is also often used in conjunction with other ground covers on construction sites to enhance erosion control. McLaughlin and Brown (2006) evaluated the additional benefit of PAM used in conjunction with several erosion control practices including straw, straw erosion control blankets, bonded fiber matrices, and wood fibres. The experiments conducted, in which PAM was applied at a rate of 19 kg/ha to a 4% slope, determined that while all the other covers used resulted in reduced runoff volume, turbidity and soil loss, PAM used alone was only effective in enhancing the turbidity reduction. The authors also tested the ability of PAM to improve vegetation establishment on bare soils and found that overall, treatment with PAM resulted in a statistically significant increase in vegetative cover relative to a control (McLaughlin and Brown, 2006). Roa-Espinoza et al. (2000) investigated the erosion prevention and infiltration enhancing potential of a PAM applied on plots at a construction site, and further considered the effect of different application methods. Application methods included dry PAM to dry soil, PAM solution to wet and dry soils, and PAM solution to dry soil with mulch. The largest sediment reduction (93% relative to a control plot) was achieved for the application of PAM solution to dry soil with mulch. The next best method was the application of dry PAM to dry soil, which resulted in an 83% reduction in sediment. This was also the only application method for which there was a reduction in runoff (16%) relative to the control.

Performance Evaluation of an Anionic Polymer
Final Report Page 12
2.5 Environment and human health impacts of polymers Assessing the potential impacts of polymers on the environment and human health has been a key focus of polymer research. Risks associated with the use of PAM as flocculant for construction runoff can be divided into the following main categories:
Acute and chronic toxicity of unreacted PAM to terrestrial and aquatic biota Potential release of acrylamide monomer (a carcinogen and neurotoxin) to the environment Physical impact of PAM deposited in receiving waters
While there have been numerous studies investigating the toxicities of various polymer products and the risks of acrylamide release associated with PAM, few studies have considered the potential physical impact of polymer deposition in streams. The following subsections provide a summary of key research findings related to the safety of PAMs and chitosan.
2.5.1 Toxicity Concerns regarding the toxicity of PAMs are largely focused on assessing potential impacts to aquatic life. With respect to toxicity to mammals, Stephens (1991) summarizes numerous experiments that investigated chronic and acute toxicity, dermal and ocular irritation, and reproductive effects of PAM on mammals (rats, dogs and rabbits). Findings showed that PAM exhibited little to no ill effect during all experiments carried out. To date there have been numerous studies investigating polymer toxicity to aquatic organisms. These studies have investigated impacts to a variety of species, and have also considered several different polymers (e.g., cationic PAM, anionic PAM, chitosan) and the physical form of the product containing the polymer (e.g., granular powder, emulsion, liquid). Polyacrylamide
The aquatic toxicity studies reviewed investigated impacts of anionic PAM on both aquatic invertebrates (Table 2.4) and fish (Table 2.5). Aquatic invertebrates are organisms without a backbone that live in freshwater for at least part of the lifecycle, and include groups such as crustaceans, aquatic insects, insect larvae and mussels. One of the primary toxicity indicators reported is the LC50, which is the concentration of polymer that is lethal to 50% of the sample population. LC50 values are specified over a specific time period (e.g., 48 days), indicating the time required to achieve 50% mortality at that concentration. The results provided in the tables reveal some trends in anionic PAM toxicity that have been noted by researchers. First, the data show that the polymer is more toxic to aquatic invertebrates than to fish, although this can vary widely based on the species being compared. Aquatic invertebrates are a diverse group with a wide range of sensitivities to water quality conditions. This diversity makes it difficult to draw conclusions about how different species of aquatic invertebrates will be impacted, however Hall and Mirenda (1991) did observe physical entrapment or clumping of the water flea Daphnia pulex during their toxicity study. The observation suggests that their very small size (< 2 mm) contributed to PAM causing higher mortality of this species in comparison to the fathead minnow (Pimephales promelas).

Performance Evaluation of an Anionic Polymer
Final Report Page 13
Table 2.4: Summary of studies on toxicity of anionic PAM to aquatic invertebrates
Study Form of anionic PAM LC50 (mg/L) Comments
Weston et al., 2009
granular Hyalella azteca: >100 Chironomus dilutus: >100 Ceriodaphia dubia: 28.7
H. azteca and C. dilutus tested for 96 hrs, C. dubia for 6-8 days
oil-based emulsion Hyalella azteca: 0.8 and 2.1 Chironomus dilutus: 3.0 Ceriodaphnia dubia: 0.3
H. azteca and C. dilutus tested for 96 hrs, C. dubia for 6-8 days 2 different trials done for Hyalella azteca
water-based liquid Hyalella azteca: >100 Chironomus dilutus: >100 Ceriodaphnia dubia: >100
H. azteca and C. dilutus tested for 96 hrs, C. dubia for 6-8 days
Hall and Mirenda, 1991 emulsion Daphnia pulex 0.09 – 0.66 96 hr test, range of anionic PAM emulsions tested
de Rosemond and Liber, 2004 granular Ceriodaphnia dubia: 218 48 hr test
Biesinger et al., 1976 granular Daphnia magna: 345*, 17** *48 hr test, **96 hr test
Biesinger and Stokes, 1986 granular Daphnia magna: >100 48 hr test
Table 2.5 Summary of studies on toxicity of anionic PAM to fish
Study Form of anionic PAM LC50 (mg/L) Comments
Weston et al., 2009 granular Pimephales promelas: >100 Tested for 7 days oil-based emulsion Pimephales promelas: 16.6 Tested for 7 days water-based liquid Pimephales promelas: >100 Tested for 7 days
Hall and Mirenda, 1991 emulsions Pimephales promelas: 21 - 85 96 hr test, range of products tested
Kobunshi Gyoshuzai Konwakai (1986)* unknown Oncorhynchus mykiss: 53.2 and 75.2 96 hr test, two different PAM products tested
Biesinger & Stokes, 1986 granular Pimephales promelas: >100 48 hr test
Liber et al., 2005 granular Salvelinus namaycush: >600 96 hr test
*as cited in Biesinger and Stokes, 1986

Performance Evaluation of an Anionic Polymer
Final Report Page 14
In toxicity studies completed by Clearflow Enviro Systems Group Inc., a similar trend was observed. Kerr (2007), in an anionic PAM toxicity review for Clearflow, states that during their toxicity studies freshwater aquatic invertebrates were the most sensitive of all organisms tested, with LC50 values as low as 383 mg/L for Daphnia magna and 235 mg/L for Ceriodaphnia dubia following exposure to APS Floc Logs® and granular products. Table 2.6 shows aquatic invertebrate toxicity data listed in U.S. Materials Safety Data Sheets for various APS products. The numbers listed in the first column are product identifiers that represent different formulations. Table 2.6: Toxicity data for studies conducted by Clearflow Enviro Systems Group Inc. (source: Applied Polymer Systems Inc., 2010)
Product 48 hour LC50 (mg/L)
Chaetogammarus marinus Ceriodaphnia dubia Daphnia magna
Emulsions
602 15 605 15 630 15 640 15
Floc Logs
703d >500 703d#3 673 >383 706b >420 707a 234.7
Powders
702 >420 705 >420 712 1617 >420 730 >420 740 >420 745 >420
To put the numbers in Table 2.6 in context, polymer dosage calculations indicate that the polymer log product release rate ranges from 2 to 30 mg/L (Kerr, 2006), which is substantially lower than the LC50 values listed, with the exception of results for the emulsion forms of PAM. Tables 2.4 to 2.6 also show a distinct decrease in LC50 values (high toxicity) where the form of PAM used is an emulsion. Weston et al. (2009) considered this issue by testing several different forms of PAM. They concluded that two oil based anionic PAM products tested were significantly more toxic than the other forms of anionic PAM tested (e.g., granular and water-based liquid), particularly to aquatic invertebrates (see Tables 2.4 and 2.5). Based on these findings, the authors suggest that it is not PAM but the other components of the oil based products - such as emulsifiers and surfactants - that caused high toxicity. The higher toxicity of anionic PAM emulsions was also observed in Hall and Mirenda (1991) and in the MSDS data summarized in Table 2.6. Several studies also focus on comparing anionic PAM toxicity to that of other similar flocculant and coagulant polymers. Liber et al. (2005) investigated impacts of both anionic PAM and a cationic polymer to lake trout fry (Salvelinus namaycush). The cationic polymer used was polydiallydimethylammonium chloride, which is sold under the proprietary name MagnaFloc® 368 and the anionic polymer used was sodium acrylate PAM, which is sold under the proprietary

Performance Evaluation of an Anionic Polymer
Final Report Page 15
name MagnaFloc® 156. During chronic toxicity testing – for which exposure was 30 days – the anionic polymer did not cause greater mortality than the control for all concentrations tested up to the maximum of 150 mg/L. In contrast, the cationic polymer was found to increase mortality at a concentration of 1 mg/L. Acute toxicity results are summarized in Table 2.7. Again, the anionic polymer was found to be much less toxic based on the 96 hour test, with an LC50 of greater than 600 mg/L, relative to an LC50 of 2.08 mg/L for the cationic polymer. Table 2.7: Acute toxicity data for two wastewater treatment polymers in 96 hour static toxicity tests with lake trout fry (Liber et al., 2005)
Polymer LC50 (mg/L) NOECa (mg/L) LOECa (mg/L) % mortality at NOEC/LOEC
MagnaFloc® (anionic) 156 >600 600b >600 5/-
MagnaFloc® (cationic) 368 2.08 1.6 3.2 18/93 a No observed and lowest observed effect concentrations b Maximum concentration that could be dissolved in solution. Above 600 mg/L the solution became “gel-like” The study also found that fish behaviour, including swimming patterns, startle response, and other parameters, were altered to a greater extent in the anionic polymer solutions, however this is believed to be a result of their higher viscosity. The anionic solutions prepared had much higher concentrations (and therefore higher viscosity) than the cationic solutions since the threshold at which the cationic polymer became toxic was so much lower. An earlier study of the impact of polymer-treated diamond mine effluent on a species of water flea (Ceriodaphnia dubia) used the same cationic and anionic polymer products as Liber et al. (2005) and yielded similar results. De Rosemond and Liber (2004) found that the cationic polymer was more toxic to C. dubia, with a 48 hour LC50 of 0.32 mg/L, compared to 218 mg/L for the anionic polymer. In this study, as little as 10 µg/L of reactive cationic polymer (representing less than 0.1% of the amount applied) present in solution was sufficient to cause considerable reproductive impairment to C. dubia (de Rosemond and Liber, 2004). Biesinger and Stokes (1986) investigated the effects of several different types of cationic, anionic and nonionic polymers on various aquatic organisms. The study found that the cationic polymers exhibited greater acute toxicity to the species tested – daphnids, gammarids, fathead minnows and midges – relative to the anionic polymers. The authors also observed that toxicity varied widely among different polymer formulations, suggesting that factors such as polymer chemistry, charge density and molecular weight may impact the extent to which the polymer will cause mortality, and that toxicity to one species is not predictive of toxicity to others. Hall and Mirenda (1991) also determined that there was a positive correlation between charge density and cationic polymer toxicity to fathead minnows (P. promelas), but not to water fleas (D. pulex). The Biesinger and Stokes (1986) study and several others (Hall and Mirenda, 1991; Goodrich et al., 1991; Muir et al., 1997) have addressed the mechanism by which cationic polymers cause increased fish mortality. While the literature suggests more than one potential mechanism, there is some agreement that (i) there is a potential attraction between negatively charged sites on fish gills and the cationic polymer and (ii) it is the impact of the cationic polymer on fish gills that results in mortality. Muir et al. (1997) found that the cationic polymer concentrates in gill tissue

Performance Evaluation of an Anionic Polymer
Final Report Page 16
and not in other organs, suggesting that the polymer causes mortality by interfering with gill function and ion regulation. Hall and Mirenda (1991) investigated the issue of cationic polymer toxicity further by testing whether the addition of humic acid would decrease toxicity. Humic acid and other materials, such as clay, organic matter, and anionic polymers, have been investigated in other studies as potential additives to reduce the toxicity of cationic polymer solutions. Hall and Mirenda (1991) discovered that toxicity to P. promelas and D. pulex was reduced by two orders of magnitude after addition of 60 mg/L of humic acid, likely resulting from the cationic polymer preferentially binding to the acid rather than to the organisms (Hall and Mirenda, 1991). The authors suggest that this finding demonstrates that the chemistry of dilution waters used in toxicity testing may result in a higher toxicity than that which would occur in stormwater or receiving water systems, in which turbidity and organic content would likely be higher. Chitosan
While no studies were encountered which specifically tested and compared toxicities of PAM and the biopolymer chitosan, Bullock et al. (2000) tested the toxicity of acidified chitosan to rainbow trout (Oncorhynchus mykiss). The chitosan used in the test was dissolved in acetic acid which is typically done to create a liquid form of the product. Bullock et al. (2000) found the chitosan tested was highly toxic to O. mykiss, with mortality occurring within 24 hours of exposure to 0.075 mg/L of the chitosan. During examination of the affected trout the only significant pathological changes observed were in the gills. In testing completed by Nautilus Environmental on behalf of Natural Site Solutions (2004, 2006) to meet Washington State toxicity testing requirements for stormwater treatment chemicals, two chitosan acetate products (StormKlear Liqui-Floc™ and Gel-Floc™) were tested for toxicity to O. mykiss, P. promelas, and D. pulex. In this study the chitosan products were found to be slightly less toxic to O. mykiss than in Bullock et al. (2000), with 96-hr LC50 values of 1.7 mg/L and 6.4 mg/L for the Liqui-Floc™ and Gel-Floc™, respectively. The products were less toxic to P. promelas (LC50 values of 6.4 and 22.8 mg/L) and D. pulex (LC50 values of 13.7 and 135 mg/L) than they were to the O. mykiss. The authors qualify these results by explaining that the manufacturers of the products tested specify that they are intended for use as part of a system which includes a final “clean up sand filtration step” to remove dissolved chitosan and reacted particulate matter (Natural Site Solutions, 2004). 2.5.2 Risks associated with acrylamide
One of the key concerns regarding the safety of PAM products is the potential release of its monomer acrylamide (AMD), which is considered by several authorities, including the U.S. Environmental Protection Agency, to be a likely human carcinogen and neurotoxin (U.S. EPA, 2010). Because the monomer is water soluble and unlikely to adsorb to organic and inorganic soil components, potential for soil leaching and groundwater contamination are often considered in the research on AMD (Brown et al., 1980). All PAM products contain some level of residual AMD, but the amount of residual can vary substantially depending on what measures were taken during the manufacturing process to maximize the extent of polymerization. Research conducted on AMD risks associated with PAMs consider two potential methods by which AMD levels may be

Performance Evaluation of an Anionic Polymer
Final Report Page 17
increased: (i) the use of PAM products that contain high levels of residual AMD and (ii) the release of AMD during the breakdown of the PAM molecule. In Canada, the federal government regulates PAM-related AMD releases in the following ways (Environment Canada and Health Canada, 2009):
Natural health products containing PAM as a non-medicinal ingredient are subject to a 5 ppm AMD threshold.
Soil additives containing PAM must be registered as supplements under the Fertilizers Act, which requires disclosure of the percentage of residual AMD in the product.
Voluntary health-based standards (adopted from National Sanitation Foundation Standard 60: Drinking Water Treatment Chemicals) limit the amount of AMD residual present in the finished drinking water to 0.5 ppb (0.5 µg/L for liquids).
Other jurisdictions have developed more stringent and application-specific limits for residual AMD in PAMs. Within the European Union, all PAMs are required to contain less than 0.1% residual AMD (European Chemicals Bureau, 2002), and more stringent thresholds are also set for specific PAM uses. In PAMs used to treat potable water, the U.S. EPA (2010) specifies that the amount of residual AMD must not exceed 0.05%. Several commercial PAM products meet this residual AMD criterion, even when they are not marketed for potable water treatment (Barvenik et al., 1996). The USDA Natural Resources Conservation Service (2002) applies the same residual AMD threshold (0.05%) for anionic PAM used for erosion control in irrigated agriculture. Some agencies also set standards for levels of residual AMD remaining in drinking water that has been treated with PAM. The World Health Organization and European Union set this threshold at 1 µg/L, while the U.S. EPA specifies a lower threshold of 0.5 µg/L (Exon, 2006). Several studies have also considered potential AMD release caused by degradation of PAM. PAM is considered a highly stable polymer, known to degrade at a rate of only 10% per year (Orts et al., 2000). There is general consensus that the degradation of PAM to AMD is not a thermodynamically favourable reaction, and thus will not occur in the absence of certain catalysts. What remains uncertain is the stability of PAM under various temperature, chemical and irradiation conditions, and the extent to which its degradation in these conditions releases AMD. Studies investigating this issue have often applied conditions that are expected to be encountered in the environment in which the PAM is being used, such as UV or chlorine exposure for disinfection in water treatment facilities (e.g., Caulfield et al., 2003). While some studies have demonstrated that degradation of PAMs are accelerated by exposure to UV irradiation and oxidants like chlorine and ozone (Kay-Shoemake et al., 1998; Suzuki et al., 1979; Woodrow and Miller, 2007) the literature appears to be divided on whether or not AMD is liberated in the process. Kay-Shoemake et al., (1998) investigated the degradation of PAM applied to agricultural soils and considered the effect of exposure to UV radiation. The authors determined that there was evidence of PAM degradation (decreased molecular weight) but no AMD was liberated. This finding was based on the fact that the PAM sample could not support bacterial growth, while the AMD monomer (if it was present) could serve as a sole carbon source for bacterial growth. Vers (1999) also considered the effect of sunlight on PAM and determined that the polymer did not degrade to AMD. The combined effect of exposure to ozone and intense UV radiation on PAM was tested by Suzuki et al. (1979, as cited in Barvenik et al., 1996). The experiments conducted

Performance Evaluation of an Anionic Polymer
Final Report Page 18
determined that although these conditions did break the polymer chain, releasing several low molecular weight products, AMD was not liberated. Contrary to these findings, recent studies have brought forth evidence that PAM can degrade to release measurable amounts of AMD under specific conditions. Caulfield et al. (2003) tested PAM solutions to determine whether the molecule would degrade to the AMD monomer when subject to fluorescent light, UV light and elevated temperatures. Results showed that only UV exposure caused the AMD monomer to be liberated. When the PAM was exposed to UV radiation with a 254 nm wavelength (which is used in water disinfection), the average amount of AMD released over 10 days was 50 ppm (i.e., 50 free AMD monomers for every 1 million AMD monomers in the PAM chain). The authors noted that the polymerization method used affected stability due to slight variations in the orientation of bonds. A more recent study – Woodrow and Miller, 2007 – also investigated PAM stability in the presence of UV radiation, and determined that the amount of AMD released was higher when iron was added to the PAM solution prior to irradiation. The addition of 2 ppm iron (ferrous sulfate) resulted in the liberation of approximately 2.3 ppb AMD from a 15 ppm PAM solution during 8 hours sunlight exposure. The concentration of iron added was directly correlated with the amount of AMD liberated in the samples tested.
Barvenik et al. (1996) address the fate of AMD when applied to cropland and also considers levels resulting from various other applications. The authors state that a PAM product with 0.05% residual AMD monomer, applied at dosage of 1.0 ppm PAM, would result in a maximum "at the tap" AMD concentration of 0.5 ppb (or 0.5 µg/L) which would be in line with the U.S. EPA standard. One of the study’s key conclusions is that, while AMD is highly mobile and will not readily bind to soil particles, levels in runoff from PAM treated cropland would not be toxic to aquatic organisms or crops, given the AMD level in the PAM product is low (0.05% or less) and the product is applied at the recommended application rates (Barvenik et al., 1996). When PAM is applied to prevent erosion in furrow irrigation, only 3 to 5% of the polymer is expected to be transported from the field in runoff, as almost all of it will bind to soil particles (Lentz and Sojka, 1996). Further, Lentz et al. (2008) found that the potential for groundwater contamination by AMD was minimal in PAM treated furrow irrigated soils when AMD residual was 0.05% or less. 2.5.3 Sustainability of PAM production and use
Concerns related to the sustainability of PAM production and long-term use are focused on two main characteristics of the polymer: (i) its high stability and slow rate of degradation and (ii) its synthesis from a product derived from a non-renewable resource. Orts et al. (2000) explain that the stability of PAM , which degrades less than 10% per year, may result in accumulation in the natural environment in the long term. If allowed to accumulate, levels of PAM in the natural environment may reach levels substantially higher than those intended during its initial application. For this reason, biopolymers have been investigated as a potential PAM alternative, as they are readily biodegradable with no risk of accumulating in the environment. PAM is also considered less sustainable than most biopolymers derived from natural by-products because it is synthetic and composed of the monomer AMD, which is derived from oil refining (Orts et al., 2000). These are only two elements of sustainability; there are several other factors that should be considered in comparing the sustainability of PAM to a viable alternative.
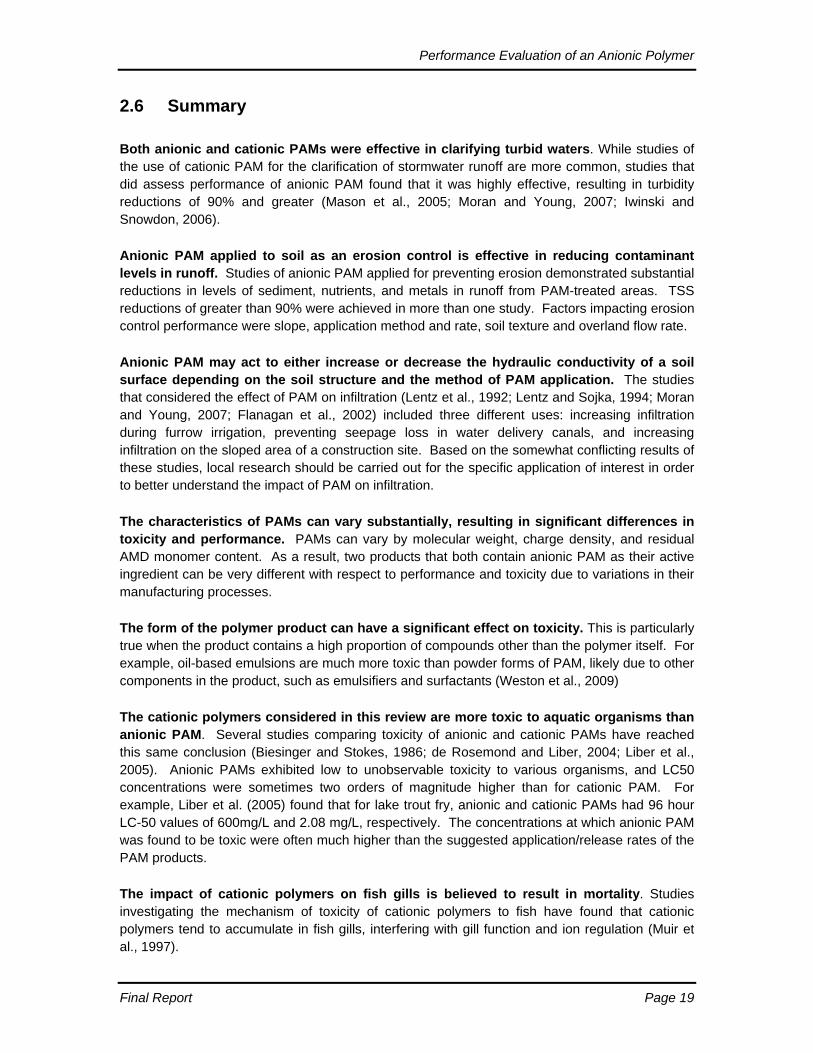
Performance Evaluation of an Anionic Polymer
Final Report Page 19
2.6 Summary Both anionic and cationic PAMs were effective in clarifying turbid waters. While studies of the use of cationic PAM for the clarification of stormwater runoff are more common, studies that did assess performance of anionic PAM found that it was highly effective, resulting in turbidity reductions of 90% and greater (Mason et al., 2005; Moran and Young, 2007; Iwinski and Snowdon, 2006).
Anionic PAM applied to soil as an erosion control is effective in reducing contaminant levels in runoff. Studies of anionic PAM applied for preventing erosion demonstrated substantial reductions in levels of sediment, nutrients, and metals in runoff from PAM-treated areas. TSS reductions of greater than 90% were achieved in more than one study. Factors impacting erosion control performance were slope, application method and rate, soil texture and overland flow rate.
Anionic PAM may act to either increase or decrease the hydraulic conductivity of a soil surface depending on the soil structure and the method of PAM application. The studies that considered the effect of PAM on infiltration (Lentz et al., 1992; Lentz and Sojka, 1994; Moran and Young, 2007; Flanagan et al., 2002) included three different uses: increasing infiltration during furrow irrigation, preventing seepage loss in water delivery canals, and increasing infiltration on the sloped area of a construction site. Based on the somewhat conflicting results of these studies, local research should be carried out for the specific application of interest in order to better understand the impact of PAM on infiltration.
The characteristics of PAMs can vary substantially, resulting in significant differences in toxicity and performance. PAMs can vary by molecular weight, charge density, and residual AMD monomer content. As a result, two products that both contain anionic PAM as their active ingredient can be very different with respect to performance and toxicity due to variations in their manufacturing processes.
The form of the polymer product can have a significant effect on toxicity. This is particularly true when the product contains a high proportion of compounds other than the polymer itself. For example, oil-based emulsions are much more toxic than powder forms of PAM, likely due to other components in the product, such as emulsifiers and surfactants (Weston et al., 2009)
The cationic polymers considered in this review are more toxic to aquatic organisms than anionic PAM. Several studies comparing toxicity of anionic and cationic PAMs have reached this same conclusion (Biesinger and Stokes, 1986; de Rosemond and Liber, 2004; Liber et al., 2005). Anionic PAMs exhibited low to unobservable toxicity to various organisms, and LC50 concentrations were sometimes two orders of magnitude higher than for cationic PAM. For example, Liber et al. (2005) found that for lake trout fry, anionic and cationic PAMs had 96 hour LC-50 values of 600mg/L and 2.08 mg/L, respectively. The concentrations at which anionic PAM was found to be toxic were often much higher than the suggested application/release rates of the PAM products.
The impact of cationic polymers on fish gills is believed to result in mortality. Studies investigating the mechanism of toxicity of cationic polymers to fish have found that cationic polymers tend to accumulate in fish gills, interfering with gill function and ion regulation (Muir et al., 1997).

Performance Evaluation of an Anionic Polymer
Final Report Page 20
Chitosan acetate exhibited high toxicity to rainbow trout. No studies were encountered which specifically tested and compared toxicities of PAM and chitosan, however studies of chitosan acetate (common liquid form of chitosan) toxicity to rainbow trout found that the polymer resulted in significant mortality at low concentrations (<6.4 mg/L) (Natural Site Solutions, 2004). Similar to that observed in cationic PAM exposure, the gills were the only part of the trout where pathological changes were observed.
Certain species of aquatic invertebrates were more sensitive than fish to anionic PAM. This was not observed for all aquatic invertebrates due to the great diversity within this group of organisms, which also increases uncertainty about how other invertebrates would respond. In Hall and Mirenda (1991) physical entrapment or clumping of the Daphnia pulex was observed during exposure to anionic PAM, suggesting the smaller size of aquatic invertebrates could partly explain why anionic PAM was more toxic to these species than to fish. PAMs are highly stable and degradation to acrylamide monomer has only been observed in the presence of specific reaction catalysts. UV radiation applied to PAM alone and in the presence of iron was shown to result in the release of AMD from the breakdown of PAM in Caulfield et al. (2003) and Woodrow and Miller (2007). In other studies, exposure of PAM to UV radiation did not liberate AMD (Kay-Shoemake et al., 1998; Vers, 1999). Given the conflicting information regarding the degradation of PAM to AMD, there appears to be a need for further research that specifically measures the extent of AMD liberation from PAM if it was present in a natural environment (e.g., stream, wetland).
The U.S. Environmental Protection Agency currently regulates the levels of residual acrylamide monomer to 0.05% in PAMs used to treat potable water. Further, PAM based products manufactured today often have residual AMD levels <0.05%. For AMD that remains in drinking water after it is treated, the World Health Organization and European Union require that levels do not exceed 1 µg/L, while the U.S. Environmental Protection Agency use a lower threshold of 0.5 µg/L (Exon, 2006). Acrylamide is not expected to be released from anionic PAM at levels that are toxic to aquatic biota, if it is properly selected and applied. It is essential that the anionic PAM application rate and other application procedures are carried out in accordance with product manufacturer recommendations. Further, residual AMD levels should be below the thresholds set by the USDA and U.S. EPA (0.05%) to reduce risk of AMD release to the natural environment.

Performance Evaluation of an Anionic Polymer
Final Report Page 21
3.0 FIELD STUDY The field monitoring component of this study evaluates two applications of anionic PAM products for clarification of construction during dewatering. In the first application, the products were used in a roadside ditch and the second application the product was introduced via a mixing tank installed in series with a larger settling tank. Both applications were intended to treat stormwater being pumped out of a construction sediment control pond located on a development site. These controlled treatment methods were selected for the following reasons:
Dewatering of sediment-laden water is a common activity on a construction site, particularly during earthworks before the sediment control pond is constructed. Improving water treatment during dewatering has the potential to greatly minimize sediment transport offsite.
The steady and controlled flow of the water being treated allows for the most accurate calculation of the amount of polymer needed to provide adequate treatment.
The primary PAM product used was the Floc Log®, a semi-solid block composed of drinking water treatment chemicals and anionic PAM, and manufactured by Applied Polymer Systems Inc. (APS) based in Georgia. An anionic PAM-based powder sold by APS under the proprietary name Silt Stop® was also used in the ditch application only. The products are shown in Figure 3.1.
Figure 3.1: APS Floc Log® (left) and Silt Stop® powder (right) Field monitoring activities completed as part of this study were carried out at the Block 39 North-West construction site in the City of Vaughan, near the intersection of Pine Valley Drive and Major Mackenzie Drive (Figure 3.2). The area is the future site of the 77 ha Vellore Village residential development, on which construction was initiated in the fall of 2007. The site drains to Marigold Creek within the East Humber River subwatershed. The onsite sediment control pond was the source of construction stormwater treated as part of this monitoring study.

Performance Evaluation of an Anionic Polymer
Final Report Page 22
Figure 3.2: Vellore Village development study area in Vaughan, Ontario.
Sediment Control Pond

Performance Evaluation of an Anionic Polymer
Final Report Page 23
3.1 Ditch application In August 2009, a portion of the roadside ditch on the west side of Pine Valley Drive, bordering the Block 39 development, was converted into a polymer-based system for the clarification of water being pumped from the sediment control pond. A south-draining stretch of the ditch was retrofitted with a polyethylene liner, rock check dams, Floc Logs®, and jute netting coated with Silt Stop®. A stretch of the same ditch draining in the opposite direction (north) was retrofitted in the same way, excluding the polymer products. This second ditch served as a control for the study, allowing for the performance of the polymer products to be distinguished from the effects of the jute, rock check dams and the ditch itself. The main objective of polymer and control ditch monitoring was to compare the amount of sediment removed by each ditch system and, by doing so, to determine how much removal could be attributed to the action of the anionic PAM products. Monitoring efforts were also focused on understanding how the polymer ditch worked to remove sediment and exploring potential structural modifications to improve the system. 3.1.1 System design Figure 3.3 shows the polymer and control portions of the ditch after installation. While every effort was made to ensure that the two portions of the ditch were as similar as possible, site restrictions only allowed for the construction of a control ditch that was approximately half the length of the polymer ditch. As shown in Figure 3.4, the control ditch was 52 metres long and included 8 rock check dams while the polymer ditch was 94 metres and included 13 check dams.
Figure 3.3: Post installation images of the polymer (left) and control (right) ditches.

Performance Evaluation of an Anionic Polymer
Final Report Page 24
Figure 3.4: Experimental setup of control and polymer ditches during experiments conducted on August 20, 2009 (left) and Sept. 9, 2009 (right). The placement of Floc Logs® and check dams in the ditch was determined based on consultation with Clearflow Enviro Systems Group, who have worked extensively with APS products, and the consulting engineers for the Block 39 development. Water and sediment samples from the sediment control pond to be dewatered were sent for analysis to APS. APS manufactures many different formulations of both the Floc Log® and Silt Stop® powder products to work for a wide range of soil types and water chemistries. Based on their analyses of stormwater and sediment from the sediment control pond, APS provided recommendations on the specific formulation of Floc Log® and Silt Stop® that should be used, the number of logs to be placed in the ditch, and the flow rate that would result in optimal water clarification. The recommendation was to use 8 Floc Logs® and pump water into the ditch at a rate between 9 and 13 litres per second. The ditch was designed to provide adequate space for polymer dosing, mixing, and settling. Dosing – the dissolution of the Floc Logs® into the water – occurred in the first 10 metres of the ditch, where the logs were strategically placed to allow for maximum contact with the water flowing into the ditch. The positioning of the logs was re-evaluated upon analysis of results from the first event sampled, which showed only a modest improvement in suspended solids levels.
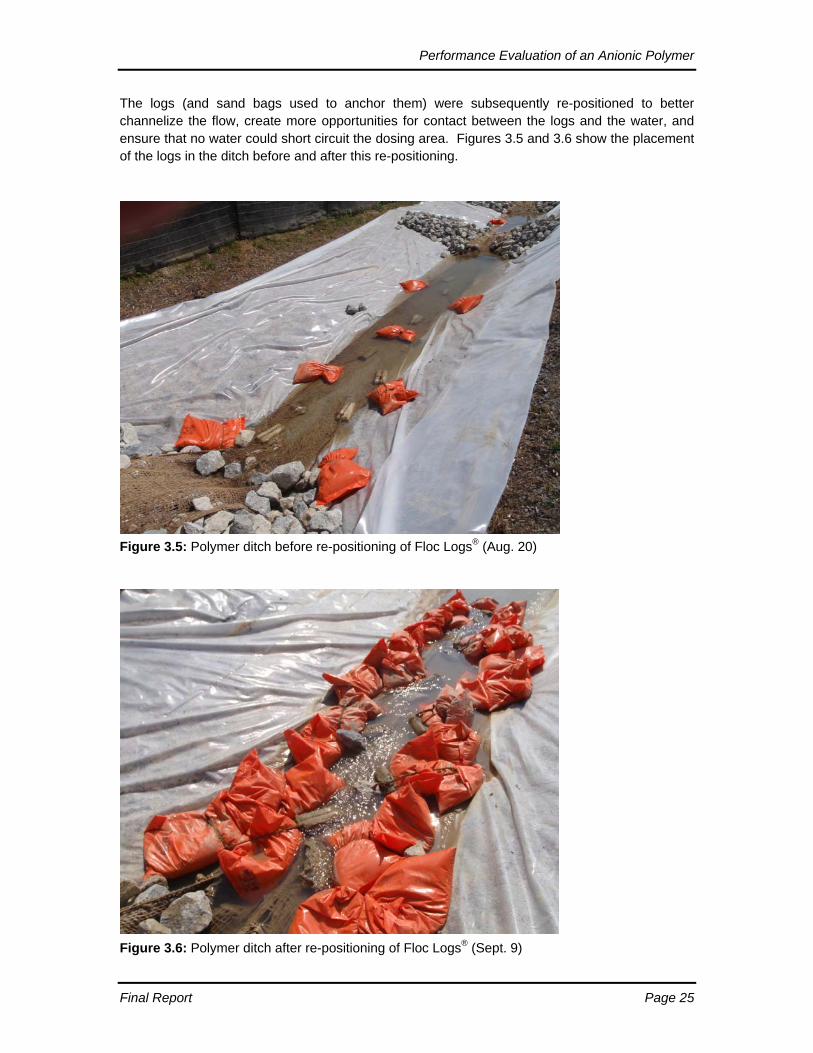
Performance Evaluation of an Anionic Polymer
Final Report Page 25
The logs (and sand bags used to anchor them) were subsequently re-positioned to better channelize the flow, create more opportunities for contact between the logs and the water, and ensure that no water could short circuit the dosing area. Figures 3.5 and 3.6 show the placement of the logs in the ditch before and after this re-positioning.
Figure 3.5: Polymer ditch before re-positioning of Floc Logs® (Aug. 20)
Figure 3.6: Polymer ditch after re-positioning of Floc Logs® (Sept. 9)

Performance Evaluation of an Anionic Polymer
Final Report Page 26
Downstream of the dosing area of the ditch, water flowed through the rock check dams to create turbulence and force the mixing that is essential in order for PAM to react with the sediment in the water. The role of the jute material coated with the Silt Stop® powder was to attract the flocs in the water, causing them to be removed from suspension by attaching to the jute. 3.1.2 Monitoring approach During the dewatering of the sediment control pond, which began in August 2009, water samples were collected and turbidity readings recorded for both the control and polymer ditches to assess the performance of this application of the PAM products. The turbidity of influent water pumped from the pond was measured during dry weather with a LaMotte 2020e handheld turbidimeter. Initial measurements indicated that the dry weather turbidity levels were too low (less than 10 FTU) to serve as an appropriate influent for testing of polymer performance. As a result, it was determined that performance could only be effectively measured during periods of elevated turbidity in the pond. Two separate experiments were undertaken to characterize the effectiveness of the polymer and control ditches. The experimental setups of both are shown in Figure 3.4. In the first experiment, ISCO 6700 series samplers were set up at the beginning and end of each ditch to collect hourly samples for 20 hours, immediately following a 60 mm rainfall event on August 20, 2009. Samples from the ditch were not collected during the rainfall, as the road runoff flowing into the ditch from the sides would have added to sediment levels and compromised the comparison of influent and effluent. Instead, the event only served to elevate pond turbidity levels so that water pumped into the ditch (at a uniform flow rate of 11 L/s) was turbid enough to allow for the clarification potential of the polymer products to be effectively measured. During this experiment, two different pumps (and intake locations) were used for the control and polymer ditches. The pump intakes were placed in these two locations (shown in Figure 3.4) because they were among the deepest and therefore most appropriate spots from which to pump water. The intake labeled N (for north) was used for the control ditch influent, while the S (south) intake was used for polymer ditch influent. During the second ditch experiment, described in the next paragraph, the same pump and intake location (N) was used for both ditches. The second experiment, which was completed on September 9, 2009, was carried out after Floc Logs® were re-positioned (see Figures 3.5 and 3.6). Influent turbidity was artificially elevated by manual disturbance of pond bottom sediments around the pump intake (N). Rather than continuous sampling, grab samples were taken at different points along each ditch to determine where in the flow path the improvements in turbidity could be noticed (Figure 3.4, right side). Samples were collected at fixed times based on the amount of time required for water to pass from one sampling point to the next, which was determined prior to the start of the experiment. Samples were taken at two different pump flow rates (8 L/s and 11 L/s) and at different influent turbidity levels to assess the extent to which these factors would influence performance. All samples collected in both experiments were submitted to the Ontario Ministry of Environment Laboratory for analysis of turbidity and suspended solids concentrations. Select samples were also analyzed for particle size distribution. Table 3.1 summarizes sampling completed during monitoring of the ditches.

Performance Evaluation of an Anionic Polymer
Final Report Page 27
Table 3.1: Sampling summary for ditch monitoring
Date Event type Flow rate(s) (L/s)
Sampling locations
Parameters tested
Test method
20-Aug-09 Rainfall, 60 mm 11 Ctrl IN, Ctrl OUT, Poly IN, Poly OUT TSS, Turbidity Lab analysis
09-Sep-09 Manual pond
sediment disturbance
8, 11 Ctrl: IN, MID, OUT
Poly: IN, CELL 3, MID, CELL 10, OUT
Turbidity, TSS, PSD* Lab analysis
Abbreviations:
Ctrl IN, MID, OUT - Control ditch at the inflow, middle and outflow. Poly IN, CELL 3, MID, CELL 10, OUT - Polymer ditch at the inflow, 3rd, middle, 10th cell, and outflow. 3rd and 10th cells are one-quarter and three-quarters of the length of the ditch, respectively. TSS - Total Suspended Solids. PSD - Particle Size Distribution.
* Only selected samples submitted for PSD

Performance Evaluation of an Anionic Polymer
Final Report Page 28
3.1.3 Results
August 20, 2009 Total suspended solids (TSS) and turbidity results obtained during sampling on Aug. 20, 2009 are shown in Figures 3.7 and 3.8, respectively. Both charts show that there was a modest improvement in water quality as water passed through the polymer ditch, with the exception of the first few samples which were collected soon after the rainfall event. For some samples collected before 12:00am (displayed as 0:00 in the charts) on August 21, TSS concentrations were higher in the effluent than in the influent. This may have been a result of residual sediment deposited in the ditch from direct road runoff during the rainfall event. If so, the sediment may have been flushed out or diluted as more time elapsed after the rainfall event, which ended at 19:30 on August 20, thereby allowing the performance of the polymer to improve.
Figure 3.7: TSS concentrations of influents and effluents from polymer and control ditches during sampling on Aug. 20-21, 2009. Flow rate is 11 L/s.

Performance Evaluation of an Anionic Polymer
Final Report Page 29
Figure 3.8: Turbidity of influents and effluents from polymer and control ditches during sampling on August 20-21, 2009. Flow rate is 11 L/s. Figure 3.9 shows the percent reductions in TSS concentration that correspond to the sample points in Figure 3.7. The average load-based percent reductions in TSS for the polymer and control ditches were 7.7% and 5.4% respectively. These numbers depict the performance of the polymer ditch as only marginally better than that of the control ditch, however these averages are greatly affected by the three samples collected before 12:00 am on August 21. When these samples are omitted, the average percent reduction for the polymer ditch is 21.4%, while for the control ditch a 3.2% increase in TSS concentration was observed. While these results demonstrate some of the flocculation power of the PAM products, effluent TSS concentrations only fell to a low of 44 mg/L, with turbidity at 55 FTU. The target TSS concentration for construction site runoff in this study was 25 mg/L, which is a widely accepted threshold for preventing impacts to fish and fish habitat (e.g., Newcombe, 1986; EIFAC, 1965).

Performance Evaluation of an Anionic Polymer
Final Report Page 30
Figure 3.9: Percent TSS reduction during sampling Aug. 20-21, 2009. Load-based average reductions for the polymer and control ditches were 7.7% and 5.4% respectively. The performance of both the polymer and control ditches may have been compromised by sediment deposited in the ditches from overland road runoff during the rainfall event the day before sampling, however this was not confirmed through field observation. The differences in influent particle size distributions of the polymer and control ditches may also help to explain the results from this experiment. As described in section 3.1.2 and shown in Figure 3.4, the control and polymer ditches received water pumped from two different parts of the pond during testing on Aug. 20. The particle size distributions of influent samples from both ditches are shown in Figure 3.10. The PSD curves shown are averages based only on the final three samples collected from each ditch. The chart shows that the water entering the control ditch had a much greater proportion of coarse particles than the water pumped into the polymer ditch. These larger particles are more readily settled out of suspension, resulting in a greater TSS reduction than would otherwise be achieved. The combined effects of the discrepancy in influent PSDs and the incorrect orientation of the logs in the polymer ditch may have worked to equalize the performance of the two ditches when in fact the polymer ditch would be expected to provide much greater suspended solids removal.

Performance Evaluation of an Anionic Polymer
Final Report Page 31
Figure 3.10: Influent particle size distributions for polymer and control ditches during sampling on Aug. 20, 2009. Note: PSD data represent only the final three samples, collected 15, 16 and 17 hours post-event. Medians are 1.3 and 9.0 µm for the polymer and control, respectively. September 9, 2009 The six scenarios applied in the Sept. 9 experiment are summarized in Table 3.2, and total suspended solids (TSS) and turbidity results for these scenarios are shown in Figures 3.11 to 3.14. Calculated percent reductions in TSS are provided in Figure 3.15. Table 3.2: Summary of scenarios applied for ditch performance monitoring on Sept. 9, 2009.
Location Scenario name Flow rate (L/s)
Influent turbidity (FTU) Sampling points
Polymer Ditch
high flow, high turbidity 11 168 IN, CELL 3, MID, CELL 10, OUT
high flow, low turbidity 11 104 IN, CELL 3, MID, CELL 10, OUT
low flow, high turbidity 8 238 IN, CELL 3, MID, CELL 10, OUT
Control Ditch
high flow, high turbidity 11 187 IN, MID, OUT
high flow, low turbidity 11 63 IN, MID, OUT
low flow, high turbidity 8 133 IN, MID, OUT Abbreviations: IN, MID, OUT - inflow, middle and outflow. CELL3, CELL 10 - 3rd and 10th cells are one-quarter and three-quarters of the length of the polymer ditch, respectively.

Performance Evaluation of an Anionic Polymer
Final Report Page 32
Figure 3.11: TSS concentrations along the polymer ditch during three scenarios tested on Sept. 9, 2009.
Figure 3.12: Turbidity along the polymer ditch during three scenarios tested on Sept. 9, 2009.

Performance Evaluation of an Anionic Polymer
Final Report Page 33
Figure 3.13: TSS concentrations along the control ditch during three scenarios tested on Sept. 9, 2009.
Figure 3.14: Turbidity along the control ditch during three scenarios tested on Sept. 9, 2009.

Performance Evaluation of an Anionic Polymer
Final Report Page 34
Figure 3.15: Percent reduction in TSS for polymer and control ditches on Sept. 9, 2009. For all scenarios tested, the reduction in TSS in the polymer ditch, which ranged from 83 to 92% was substantially greater than that observed in the control, which ranged from -0.5 to 40 % (Figure 3.15), and also greater than TSS reductions in the polymer ditch during the Aug. 20 test (7.7%). The pattern of decline in TSS and turbidity observed in the polymer ditch was also more predictable than the control, with levels steadily decreasing from one sampling point to the next. Among the scenarios, the “high flow, high turbidity” is the best comparison between the two ditches due to similar influent turbidities (168 and 187 FTU, respectively). In that scenario the polymer ditch removed 92% of TSS while the control only removed 27%. In considering the extent to which effluent TSS concentrations met the 25 mg/L target, the polymer ditch effluent met this standard during the two of the three tests (12, 18 and 32 mg/L) while the control ditch effluent did not meet the standard during any of the tests (66, 88 and 170 mg/L). As described in Section 3.1.1, site restrictions only allowed for the construction of a control ditch that was approximately half the size of the polymer ditch, and included just over half the number of rock check dams. If the control ditch was as long as the polymer ditch, TSS removal observed in the control may have been higher. Despite this, the difference in length alone cannot account for the difference between polymer and control ditch performance. This is evidenced by the substantial TSS removals observed at the polymer ditch midpoint (Figure 3.15), which exceeded 60% for all three scenarios. When compared to TSS reductions over the entire length of the control ditch (26.7%, -0.5% and 39.7% as shown in Figure 3.15), the superior performance of the polymer ditch remains apparent. The decline in TSS between cell 10 and the outlet of the

Performance Evaluation of an Anionic Polymer
Final Report Page 35
polymer ditch also seems to suggest that a longer ditch may have further reduced effluent TSS – a trend that is not observed in the control ditch data. The particle size distributions (PSD) of influents and effluents for the “high flow, high turbidity” and “low flow, high turbidity” scenarios are presented in Figures 3.16 and 3.17, and median particle sizes for all scenarios in Table 3.3. PSDs for the low turbidity scenarios are not included because lab results indicated that polymer ditch effluent for this scenario was too clear for the PSD analysis to be carried out. Table 3.3 shows that despite the range in influent PSDs (medians ranged from 4 to 8 µm), the effluent PSDs were similar, with all medians falling within a 0.3 µm range. In both ditches, and for both the high and low flow tests, effluents had a higher proportion of fines than influents, which is expected since larger, heavier particles are easier to settle.
0
10
20
30
40
50
60
70
80
90
100
0.1 1 10 100 1000
% G
reat
er T
han
Particle Size (µm)
Polymer Inf luent
Polymer Ef f luent
Control Inf luent
Control Ef f luent
Figure 3.16: Particle size distribution of ditch influents and effluents during “high flow, high turbidity” scenarios on Sept. 9, 2009.
High flow, high turbidity

Performance Evaluation of an Anionic Polymer
Final Report Page 36
0
10
20
30
40
50
60
70
80
90
100
0.1 1 10 100 1000
% G
reat
er T
han
Particle Size (µm)
Polymer Inf luent
Polymer Ef f luent
Control Inf luent
Control Ef f luent
Figure 3.17: Particle size distribution of ditch influents and effluents during “low flow, high turbidity” scenarios on Sept. 9, 2009. Table 3.3: Summary of changes in median particle sizes for scenarios applied in ditch performance monitoring on Sept. 9, 2009
Location Scenario name Median Particle Size (µm) % reduction in median
particle size Influent Effluent
Polymer Ditch high flow, high turbidity 5.5 2.5 51
low flow, high turbidity 5.3 2.5 53
Control Ditch high flow, high turbidity 4.1 2.3 44
low flow, high turbidity 8.0 2.6 68
For the control ditch, influent particle size distribution and the water flow rate are the main factors expected to impact TSS removal, as both affect the gravitational settling of suspended particles. As shown in Table 3.3, the median influent particle size was larger during the low flow test than in the high flow test. The higher TSS removal observed for the control during the low flow test (39.7% vs. 26.7% for the high flow test) corresponds well with the PSD results and also with the lower flow rate, given that larger particles in slower moving water have a greater propensity to settle out of suspension. In the case of the polymer ditch, the primary factors affecting TSS removal should be those that impact the efficiency of polymer dosing and mixing. Proper dosing occurs when all water flowing through the ditch has adequate contact time with the Floc Logs®, and proper mixing occurs when
Low flow, high turbidity
Performance Evaluation of an Anionic Polymer
Final Report Page 37
the structure of the ditch (e.g., rock check dams) and flow rates provide some degree of turbulence. While there may be more contact with Floc Logs® and opportunity for gravitational settling in slower flowing water, polymer product manufacturers specify the importance of turbulence to promote mixing of the polymer and the water. To achieve this, they specify flow rates that will optimize the performance of the product by balancing the need for contact time and mixing through turbulence. For the ditch application tested, Clearflow Enviro Systems Group recommended a flow rate between 10 and 13 L/s. Despite the large reduction in TSS during the low flow test in the polymer ditch (87.8%), the data collected in this experiment do not provide sufficient evidence to conclude that the polymer product would work more effectively at this flow rate (8 L/s) than at the higher rate (11 L/s) if all other factors were equal. TSS removal in the polymer ditch did not vary substantially with the change in flow rate, and ultimately the low flow test still yielded the effluent with the highest TSS concentration. In fact, the effluent TSS concentration is a more important performance indicator than percent reduction, as this is the actual measure of the amount of a given pollutant being released to receiving waters. Percent reduction, as a stand-alone indicator of the performance of stormwater management practices, has several key shortcomings which researchers in the field have identified (Wright Water Engineers and Geosyntec Consultants, 2007; Lenhart, 2008). In a study by Wright Water Engineers and Geosyntec Consultants (2007) the fact that percent reduction (or ‘percent removal’) is highly dependent upon influent concentration was identified as one of the main reasons it should be considered an inappropriate performance indicator. Because of the way it is calculated, it is more indicative of how high influent concentrations are than it is of the effectiveness of the treatment practice being considered. In the current study, this is best illustrated by comparing data from the polymer ditch for two of the scenarios tested. For the “low flow, high turbidity” scenario, influent TSS was 260 mg/L and percent reduction was 87.8%. For the “high flow, low turbidity” scenario, influent TSS was 106 mg/L and percent reduction was 83.4%. If considered alone, this would appear to indicate that the lower flow rate provided better treatment, when in fact it resulted in a TSS effluent of 32 mg/L, which is 44% greater than the high flow rate scenario (18 mg/L). Another important limitation identified in the same study is the failure of percent reductions to compensate for the effect of ‘irreducible concentrations’. The ‘irreducible concentration’ is the lowest concentration of a given pollutant that can possibly be achieved by a given stormwater management practice. As the effluent approaches this minimum concentration, there are diminishing returns on any improvements in treatment variables like detention time, surface area, or treatment volume (Schueler, 2000). This residual concentration may persist in a stormwater treatment facility (e.g., pond or wetland) as a result of various factors, such as the natural production of sediment and/or nutrients within the facility itself. Schueler (2000) explains that the wide variability in percent reductions observed from one storm event to the next for the same stormwater practice may be a result of the effluent approaching the irreducible concentration, rather than the result of real fluctuations in the effectiveness of the practice. For facilities that discharge effluent at concentrations close to this minimum, events with the dirtiest influent will result in the most impressive percent reductions, potentially giving a false impression that the facility performed best during those events.

Performance Evaluation of an Anionic Polymer
Final Report Page 38
3.1.4 Discussion While there were considerable differences in both the methods and results of the two ditch tests, several key findings can be derived from the data collected. These are discussed below. Performance is greatly affected by polymer ditch design. Experiments conducted demonstrated that proper design of the system to allow for adequate dosing and mixing of the polymer and water were key determinants of performance. During dosing (dissolution of the polymer into the water) the logs must be positioned to allow maximum contact with the water. The re-positioning of the Floc Logs® after the August 20 test appeared to promote greater dissolution of PAM into the water and less short circuiting. This improvement is supported by performance data, which showed an increase in TSS removal from an average of 8% (Figure 3.9) before re-positioning, to greater than 83% after (Figure 3.15). With respect to mixing, the progressive decline in TSS across the polymer ditch during the September 9 test demonstrated that providing an adequate ditch length for mixing and settling was also important. Because the declining TSS concentration during that test did not level off, it remains uncertain whether the ditch length used was optimal or whether a longer ditch would have further reduced effluent TSS. The ditch system alone, without polymer, did not result in a substantial TSS reduction. The control ditch, containing a polyethylene liner, rock check dams and no polymer, did not prove effective in removing suspended solids in water from the construction sediment pond. In the tests conducted, TSS reduction in the control ditch ranged from -0.5% (a slight increase in TSS caused by the ditch) to 40% (Figure 3.15). While a longer or more gently sloping ditch may have performed slightly better, significant modifications that would enhance evaporation and infiltration and/or increase ponding of water in the ditch would likely be required in order to realize any substantial increase in TSS removal. For example, if the bottom of the ditch was vegetated, the ponding of water behind rock check dams or other barriers would provide more opportunity for evapotranspiration and/or infiltration than a polyethylene-lined ditch would allow for. Coarse influent PSDs did not always lead to improved TSS removals during ditch experiments. During the Aug. 20 test, the control and polymer ditches performed similarly – 5.4 and 7.7 % removals, respectively – even though the control influent PSD was coarser than that of the polymer influent (Figure 3.10). The coarser PSD of the control and the incorrect orientation of the logs in the polymer ditch may have worked to equalize the performance of the two ditches when in fact the polymer ditch would otherwise perform better. For the control ditch, influent PSD on Sept 9 during the ‘high flow, high turbidity’ test was much finer (4.1 µm median particle size) than it was on Aug 20 (9.0 µm median particle size). Despite this, it performed better on Sept 9 (22% compared to 5.4% on Aug 20). The poor performance of the control ditch on Aug. 20, despite the higher proportion of coarse particles in suspension, may have been a result of sediment deposited in the ditch from overland road runoff during the rainfall event the day before sampling (discussed in Section 3.1.3). Obtaining a definitive picture of the relationship between influent PSD and ditch performance would have required controlling for other factors affecting performance from one sampling event to the next. Percent TSS reduction can be misleading and should be evaluated in the context of the influent and effluent TSS concentrations. Two main limitations of using percent reduction as a stand-alone indicator of performance were discussed in Section 3.1.3; they are (i) the strong positive correlation between influent concentration and percent reduction and (ii) the existence of

Performance Evaluation of an Anionic Polymer
Final Report Page 39
an irreducible concentration. During the Sept. 9 tests, the ‘low flow, high turbidity’ scenario yielded a better percent TSS reduction than the ‘high flow, low turbidity’ scenario, despite the latter test exhibiting a lower effluent TSS concentration (18 vs. 32 mg/L). Where percent reductions are used as a determinant of the efficacy of a treatment practice, both influent and effluent concentrations must also be considered to ensure that the percent reduction reported has not been skewed based on these well-established limitations.

Performance Evaluation of an Anionic Polymer
Final Report Page 40
3.2 Tank application Within the GTA, settling tanks are increasingly used to treat sediment laden water from construction sites when wet ponds are emptied for dredging or re-grading. Despite this, data on their performance for this application remains limited. This second application of an anionic PAM product, tested in December 2009, involved this type of settling tank, used with a polymer mixing tank upstream, and a sediment (geotextile) bag downstream for final filtration and flow dispersion. Sediment bags are typically used to filter sediment laden construction runoff when water is being discharged from the site without passing through a sediment control pond. Like the experimental setup of the ditch application, a control was also used, which consisted of only a settling tank and sediment bag. The objectives of monitoring this polymer application and a polymer-free (control) version of the tank were to assess the performance of the tank and compare it to that which could be achieved by using a mixing tank to dose the stormwater with PAM prior to pumping to the settling tank. Figure 3.18 provides an aerial depiction of the components of the system and their locations, and Figure 3.19 shows the two settling tanks.
Figure 3.18: Experimental set up for tank application

Performance Evaluation of an Anionic Polymer
Final Report Page 41
Figure 3.19: Settling tanks (provided by Aquatech Dewatering) located immediately north of the sediment control pond 3.2.1 System design The 1.8 cubic metre mixing tank (Figure 3.20) used contains three separate horizontal compartments; the first (top) to hold the Floc Logs®, and the second and third to mix the water and allow it to react with the PAM. A total of eight large Floc Logs®, which were double the mass of those used in the ditch experiment, were placed in the mixing tank. Water was pumped from the pond to the mixing tank (polymer side) or directly to the settling tank (control side) at a rate of 12.6 L/s, which was determined in consultation with Applied Polymer Systems. Both the polymer and control systems received influent from the same pump intake, located at the north end of the sediment control pond (pump intake location N in Figure 3.4).
Figure 3.20: Polymer mixing tank

Performance Evaluation of an Anionic Polymer
Final Report Page 42
The settling tanks used consisted of a series of weirs that divide the volume into several compartments. Settling of suspended sediments occurs in these compartments as the weirs reduce flow velocities and dissipate energy in the flowing water. Only the finest particles can remain in suspension and proceed from one compartment to the next by flowing over the top of a weir. During the second tank experiment (December 4), jute fabric was suspended from the top of each of the weir compartments in both settling tanks, such that the jute was perpendicular to the flow path in the tank. This was done in an effort to increase sediment removal by providing a surface for floc attachment, however the jute fabric used was not charged with Silt Stop® powder like the jute used in the ditch. Effluent from each settling tank was pumped to sediment bags for final filtration and as a means to disperse the effluent and prevent erosion (Figure 3.21). The bags used were capable of filtering particles 150 microns or larger. Bags were replaced prior to each experiment to ensure that they would function at full capacity.
Figure 3.21: Geotextile bag at the end of the polymer treatment system
3.2.2 Monitoring approach Field monitoring of the polymer and control tank systems occurred in December 2009. Similar to during the ditch tests, the turbidity of the influent pumped from the pond during dry weather was too low for testing of polymer performance. As a result, tests of tank performance could only be completed during wet weather, or by disturbing pond bottom sediments to generate higher turbidity around the pump intake. Samples were collected on two occasions: the first set during a rainfall event on December 2, and the second set during manual disturbance of pond sediments on December 4. Table 3.4 summarizes all sampling completed during monitoring of the tanks.

Performance Evaluation of an Anionic Polymer
Final Report Page 43
Table 3.4: Sampling summary for tank monitoring
Date Event type Flow rate (L/s)
Sampling locations
Parameters tested
Test method
02-Dec-09 Rainfall, 17 mm 12.6 Influent, Ctrl Tank OUT, Poly Tank OUT Turbidity Handheld
turbidimeter
04-Dec-09 Manual pond
sediment disturbance
12.6 Influent, Ctrl Tank OUT,
Ctrl bag, Poly Tank OUT, Poly bag
TSS, Turbidity, PSD*
Lab analysis
Abbreviations:
Ctrl Tank OUT - Effluent from control settling tank. Ctrl bag - Effluent from geotextile bag in control system. Poly Tank OUT - Effluent from polymer settling tank. Poly bag - Effluent from geotextile bag in polymer system. TSS - Total Suspended Solids. PSD - Particle Size Distribution.
* Only selected samples submitted for PSD For samples from the December 2 rainfall event, handheld turbidity measurement of influent during the event showed that it was too clear for the test (less than 80 FTU). As a result, these samples were not submitted for laboratory analysis, and instead only turbidity measurements of the influent and tank effluents were measured using a handheld turbidimeter. No samples of the sediment bag effluent (final system discharge) were collected during this experiment. Two sets of turbidity measurements were completed for polymer settling tank effluent samples collected on December 2. These are referred to in the results section as “shaken” and “settled”. Proper turbidity measurement, according to the Ontario Ministry of Environment Laboratory Services Branch Standard Methods, requires the sample to be inverted several times just before measurement in order to account for any solids that have settled in the sample bottle. During testing, several large flocs were observed in the polymer settling tank effluent, most of which settled rapidly when shaking ceased. This observation was unexpected, since flocs were expected to settle in the tank rather than in the sample collection bottle. This may have been a result of re-suspension in the tank, or the long reaction time to which water in the sample bottle was subjected. Sediment in the samples, which were sitting in the auto sampler for several hours before the turbidity was measured, may have continued to react with the polymer to generate larger flocs which were more prone to settling. Ultimately it was determined that turbidity measurements should be taken twice – immediately after the sample was shaken and after 30 seconds of settling – in order to account for this phenomenon. On December 4, it was observed that freezing conditions overnight had resulted in the freezing of Floc Logs® in the mixing tank. A few test samples taken when the logs were frozen indicated that effluent turbidity was similar to influent turbidity and that the logs were not dosing effectively in that condition. As a result, the logs were defrosted gradually by water that was pumped through the tank, and warmer daytime temperatures, before it was determined that sampling could be initiated. Once the logs were defrosted, samples of influent, effluent from both settling tanks, and effluent from both geotextile bags were collected and submitted to the Ontario Ministry of Environment Laboratory to be analyzed for suspended solids, turbidity, and particle size distribution.

Performance Evaluation of an Anionic Polymer
Final Report Page 44
3.2.3 Results
December 2, 2009 Turbidity measurements for samples collected on Dec. 2 are shown in Figure 3.22. The chart shows that the control tank effluent and shaken effluent from the polymer tank both had turbidities that exceeded the influent at times during the event, but the turbidity of the settled polymer effluent was consistently lower than the influent. When averaged over the event, the turbidities of shaken and settled polymer effluent samples are very similar – 45.7 and 46.0 FTU respectively. These are slightly higher than effluents from the Sept. 9 polymer ditch experiment, which ranged from 18 to 40 FTU, but lower than the effluent from the Aug. 20 experiment which ranged from 55 to 542 FTU.
Figure 3.22: Influent and effluent turbidities for samples collected during rainfall event on Dec. 2-3, 2009. Flow rate is 12.6 L/s. Figure 3.23 shows the average percent reduction in turbidity for the shaken polymer and control effluents. The turbidity of the shaken polymer effluent was approximately 16% lower than the influent turbidity, while the control effluent was actually more turbid than the influent by 1.5%. The modest percent reductions in turbidity observed for both systems are likely attributable to low influent turbidity and the limitations of percent reduction as an indicator of performance (see discussion on pg. 37).

Performance Evaluation of an Anionic Polymer
Final Report Page 45
Figure 3.23: Percent turbidity reduction for polymer and control tanks on Dec. 2, 2009. Result for settled effluent (not shown) is similar (<1% higher) to that of the shaken effluent. December 4, 2009 Total suspended solids concentrations of influent, tank effluents, and sediment bag effluents are plotted on the chart shown in Figure 3.24. Due to the higher concentrations, influent is plotted on the primary (left) axis, while all effluents are plotted on the secondary (right) axis. Samples from the sediment bags are labeled “filtered polymer tank effluent” and “filtered control tank effluent”.
0
30
60
90
120
150
180
210
0
200
400
600
800
1000
1200
1400
4/12/09 12:40 4/12/09 13:00 4/12/09 13:20 4/12/09 13:40 4/12/09 14:00 4/12/09 14:20 4/12/09 14:40
Effluent TSS (mg/L)In
fluen
t TSS
(mg/
L)
Inf luent
Polymer Tank Ef f luent
Ctrl Tank Ef f luent
Filtered Polymer Tank Ef f luent
Filtered Ctrl Tank Ef f luent
Figure 3.24: Influent and effluent TSS during sampling on Dec. 4, 2009. Flow rate is 12.6 L/s. Effluent TSS concentrations from the polymer tank were consistently lower than from the control tank (Figure 3.24). TSS concentrations of both tank effluents increased over the course of the

Performance Evaluation of an Anionic Polymer
Final Report Page 46
experiment, although this increase was considerably more gradual for the polymer tank. Re-suspension of settled sediment likely accounts for this decreased performance over time. The tanks had been used in the days leading up the experiment and thus were not clear of sediment, however levels were low and had not reached the threshold for maintenance to be carried out. Based on the averages of all the influent and tank effluent samples, the polymer and control tanks removed 94% and 82% of TSS, respectively (Figure 3.25). These numbers correspond with a reduction in the average influent TSS concentration of 706 mg/L to a polymer tank effluent of 42 mg/L and a control tank effluent of 126 mg/L, demonstrating that the polymer tank effluent was substantially closer to the 25 mg/L threshold for the protection of aquatic habitat than the control tank effluent (Newcombe, 1986; EIFAC, 1965). Corresponding turbidities are 816 FTU for the influent and 15.4 and 130 FTU for the polymer and control, effluents respectively. This result shows a substantial improvement over the performance observed during the Dec. 2 test, during which the control tank actually increased turbidity and the polymer tank only reduced turbidity from 55 to 46 FTU. Despite the fact that samples from the Dec. 2 event were not analyzed for particle size distribution, it is likely that the naturally turbid runoff from that rainfall event contained particles that were finer than the particles in suspension as a result of manual agitation during the Dec. 4 experiment. This could be an indication that the settling tanks are less effective for settling fines, however the addition of jute fabric to the settling tank for the Dec. 4 experiment must also be considered. If the jute performed as intended, it would have enhanced sediment removal by providing an additional surface to which suspended flocs could attach.
94.1 %
82.2 %
0.0 20.0 40.0 60.0 80.0 100.0
Polymer Tank Effluent
Control Tank Effluent
Percent Reduction in TSS Figure 3.25: Percent reduction in TSS for polymer and control tanks (before filtration through geotextile bags) during sampling on December 4, 2009.

Performance Evaluation of an Anionic Polymer
Final Report Page 47
Samples from the sediment bags (end of the treatment train) were taken four times during the experiment. For the polymer system, this geotextile filtration greatly improved performance, bringing TSS levels down to under the 25 mg/L threshold. In contrast, filtration was not beneficial in the control system, for which all bag effluent samples had higher TSS than the corresponding tank effluent (Figure 3.24). When the effect of the sediment bag filtration is considered, the difference between the performance of the polymer and control systems is more pronounced. Figure 3.26 shows the total percent TSS reduction from the influent to the sediment bag effluents for the four samples taken collected during the experiment. The polymer system was very effective in removing suspended solids, with percent reductions ranging from 85.5% to 99.6%. The control system did not perform as effectively as the polymer, and results were more variable, ranging from 33% to 87%. The polymer system yielded an effluent with very low TSS concentrations (Table 3.5), ranging from 4.5 to 23.3 mg/L. Control system effluent TSS was considerably higher (108 to 208 mg/L) and greatly exceeded thresholds for the mitigation of impacts to aquatic habitat (25 mg/L) for all samples.
85.5 %
96.1 %
99.6 %
98.4 %
32.9 %
74.2 %
86.8 %
40.4 %
0 10 20 30 40 50 60 70 80 90 100
04/12/2009 13:10
04/12/2009 13:40
04/12/2009 14:10
04/12/2009 14:40
Total Percent Reduction in TSS
Polymer System Control System
Figure 3.26: Total percent reduction in TSS (after filtration through sediment bags) during sampling on December 4, 2009. Table 3.5: TSS concentrations of influent and geotextile bag effluent for samples in Figure 3.26.
Sample collection
date and time
TSS (mg/L)
Influent Polymer tank effluent
Polymer bag effluent
Control tank effluent
Control bag effluent
04/12/09 13:10 161 34.4 23.3 97.2 108 04/12/09 13:40 507 38.4 19.9 121 131 04/12/09 14:10 1240 46.4 4.5 133 164 04/12/09 14:40 349 50 5.6 180 208

Performance Evaluation of an Anionic Polymer
Final Report Page 48
Based on the manual agitation method used to generate turbid influent, the improved performance of the control (relative to the Dec. 2 experiment) is not surprising. The PSD data (Figure 3.27) show that the influent had a coarser PSD than the effluent from the control tank, and the polymer tank effluent contained the largest particles. Because sediment is removed by gravitational settling in the tank or by filtration through the sediment bag (only for particles larger than 150 microns), finer particles will tend to remain in suspension as water passes through the control system. The polymer system differs in that it allows for greater removal of fine particles by causing them to bind together and form larger flocs. During sampling, some of these flocs were observed in polymer tank effluent. The flocs that are not heavy or dense enough to settle out of suspension in the tank were easier to filter with the sediment bag because of their large diameter. This effect may have been enhanced as a result of the physical characteristics of the flocculated sediment that accumulated in the sediment bag. The flocs formed in that system may have worked to seal the inside of the sediment bag so that it would better filter the water passed through it. This hypothesis is supported by the effluent concentrations in Table 3.5. Unlike the other effluents (polymer and control tanks, control sediment bag) TSS concentration of effluent from the polymer sediment bag actually decreased over the course of sampling, which would seem to support the suggestion that continual accumulation of flocs in the bag served to further improve filtration.
0
10
20
30
40
50
60
70
80
90
100
0.1 1 10 100 1000
% G
reat
er T
han
Particle Size (µm)
Control Tank Effluent
Influent
Polymer Tank Effluent
Figure 3.27: Average particle size distribution of influent and polymer and control tank effluent during sampling on December 4, 2009.

Performance Evaluation of an Anionic Polymer
Final Report Page 49
3.2.4 Discussion
The control settling tank system did not reduce TSS levels to the 25mg/L target. During the first tank experiment, the control tank yielded effluent with a turbidity higher than the influent, and in the second experiment on Dec. 4, the control tank achieved an 82% TSS reduction but effluent levels were still high, averaging 126 mg/L. While the tank experiments conducted don’t necessarily show a direct connection between influent PSD and tank performance, the finer PSD of the control tank effluent (Figure 3.27) suggests that, as expected, fines are difficult to remove through average settling processes, particularly when detention is short. This is supported by the poor performance of the control during the first tank experiment, carried out during a rainfall event which would generate finer sediments in the influent relative to the coarse sediments stirred up by manual agitation during the second experiment. Lastly, the lack of sediment removal attributed to the bag in the control system also suggests that particles were too fine to be filtered by the bag. Filtration of polymer tank effluent was essential to ensure removal of unsettled flocs. The observation of suspended flocs in polymer tank effluent during the Dec. 4 experiment reinforced the importance of providing a means of filtration (e.g., sediment bag) at the end of the polymer treatment system to prevent the flocs from being released to receiving water systems. The improvement in system performance attributed to the use of the sediment bag is evident in the results of the Dec. 4 experiment, which show that TSS in the polymer tank effluent, which ranged from 34 to 50 mg/L was further reduced by the sediment bag, from which concentrations ranged from 4.5 to 23 mg/L. Both settling tanks were considerably less effective in treating runoff from a rainfall event. The potential reasons identified for the discrepancy between the first (rainfall event on Dec. 2) and second (manual agitation on Dec. 4) tank experiments are differences in particle size distribution of influents, and the addition of jute in the tanks during the second experiment. The experimental method did not allow for a specific determination of the impacts of these variables, but the difference in performance between the two experiments is substantial enough to warrant further investigation of these factors. Freezing of Floc Logs® in sub-zero temperatures prevents proper dosing. While not formally quantified in these experiments, the freezing of Floc Logs® in the mixing tank on December 4 was found to limit the performance of the product. While frozen, the log could not properly dissolve into the water flowing through the mixing tank. Like the log placement in the ditch experiments, this observation reinforced the importance of adequate polymer dosing. Sediment accumulation in the tanks reduces performance over time due to re-suspension. Although sediment accumulation in the tanks was not measured, this is widely accepted as a factor impacting the performance of settling tanks, or any type of settling container or basin. Due to the increased potential for re-suspension, higher levels of sediment accumulated in the tank are expected to result in decreased tank performance. During the Dec. 4 experiment, effluent TSS concentrations steadily increased over the course of sampling as sediment accumulated in both the polymer and control tanks. This observed TSS increase was more substantial for the control tank, which is line with polymer manufacturer assertions that polymer-based flocculation results in settled sediment that is less likely to re-suspend.

Performance Evaluation of an Anionic Polymer
Final Report Page 50
3.3 Comparison of ditch and tank applications
Despite a wide variation in performance for different experiments, the polymer systems were consistently more effective at reducing TSS than the corresponding control systems for both applications tested. Table 3.6 shows average percent reductions in TSS for all experiments. Results from the Sept. 9 ditch test and the Dec. 4 tank test yielded substantially better results than the other tests, both with respect to effluent TSS concentration and percent TSS (and turbidity) reduction. Considering the performances of the polymer systems when they were most effective – the Sept. 9 ditch test and the Dec. 4 tank test – percent removals would suggest that the two applications performed similarly, with 88% TSS removal achieved for the ditch application and 94% achieved for the tank. This would appear to indicate that the polymer tank was slightly more effective than the ditch, but in fact the ditch still resulted in a lower TSS effluent, averaging 20 mg/L, compared to the tank average of 42 mg/L. The two experiments also had dramatically different influent TSS levels, with the ditch starting 148 mg/L and the tank starting at 706 mg/L, which also helps to explain the high percent reduction achieved on Dec. 4. Ultimately, the best performance was achieved in the polymer tank system with the sediment bag, which resulted in 95% TSS reduction and an average effluent TSS concentration of only 13 mg/L. Based on the control systems results in Table 3.6, it is unclear whether the ditch or the tank was the better practice with respect to reducing suspended solids levels. While the largest TSS reduction was observed on Dec. 4, this is largely a function of the greatly elevated influent TSS concentration during that experiment. TSS levels in effluents from the both control systems were consistently greater than 100 mg/L with the exception of the Aug. 20 event, for which influent was only 78 mg/L and thus the effluent was 74 mg/L. These results seem to indicate that both the ditch and tank applications, without polymers, are capable of removing a limited amount of sediment, but not necessarily yielding an effluent TSS concentration that is close to meeting the 25 mg/L threshold for aquatic habitat protection. As mentioned previously, because settling is the primary mechanism of sediment removal in the control systems, and detention time provided during dewatering was relatively short, fine particles could not be settled out of suspension using either the ditch or tank methods as they were applied during the experiments conducted. Modifications to the design and/or method of application of these practices could help to optimize settling and yield better results. Some of these potential design improvements are described in the recommendations chapter of this report (Section 5.0).

Performance Evaluation of an Anionic Polymer
Final Report Page 51
Table 3.6: Summary of performance for all experiments
Experiment date Application Event
type Average TSS concentration (mg/L) Average %
Reduction in TSS
Control influent Control effluent Polymer influent Polymer effluent Control Polymer
Aug. 20 ditch rainfall 78.0 73.7 115.3 106.5 5.4 7.7
Sept. 9 ditch manual agitation 148 108 171 20.4 22.3 87.7
Dec. 2 tank rainfall TSS data not collected -1.5 * 16.2 *
Dec. 4 tank manual agitation 706 126 706 41.6 82.2 94.1
Dec. 4 tank + bag manual agitation 564 ** 153 ** 564 ** 13.3 ** 58.6 ** 94.9 **
* No TSS data obtained for this experiment, number shown is percent difference in turbidity.
** Average of only 4 samples. Other results for Dec. 4th represent 16 samples.


Performance Evaluation of an Anionic Polymer
Final Report Page 52
4.0 CONCLUSIONS The following key study conclusions are based on performance results from monitoring of both the ditch and tank applications, and observations made during the experimental design and implementation. Effective application of polymer-based systems depends on appropriate dosing, mixing and final filtration. Polymer-based flocculation systems for stormwater clarification are designed to optimize performance of these three functions, and the experiments conducted demonstrated the importance of each, as described below.
• As noted during the ditch test, re-positioning of the logs allowed ample opportunity for contact between the water and the logs, resulting in a substantial improvement in ditch performance. During the tank test, it was also observed that the logs could not dissolve effectively when frozen, and that they needed to be thoroughly hydrated prior to use.
• The importance of adequate opportunity for mixing/reaction of the polymer and the water was most apparent during the Sept 9 ditch test, during which TSS levels progressively decreased through the polymer ditch from the inlet to the outlet (Figure 3.11). To achieve this effect, product suppliers specify the flow rate and length of flow path that will optimize the performance of the product by balancing the need for contact time and mixing through turbulence (caused by permeable barriers like check dams).
• While no filtration was provided at the end of the ditches, the effect of filtration in the tank experiment was substantial. The polymer tank effluent had an average TSS concentration of 42 mg/L, which fell to an average of 13 mg/L after filtration through the sediment bag.
Both the ditch and the tank were more effective with PAM than without. Polymer performance was consistently better than control performance when average TSS reductions were compared. For individual samples, instances when control performance exceeded that of the polymer only occurred during the Aug. 20 experiment. Several reasons for the poor performance of the polymer ditch during that experiment are discussed in Section 3.1.3 (pg. 30), and include the incorrect orientation of the logs and the finer PSD of the polymer ditch influent. Polymer systems also resulted in lower effluent TSS concentrations than the control for almost all experiments. Only the polymer tank system with the geotextile bag succeeded in yielding effluent with TSS concentrations below the 25 mg/L threshold for mitigation of impacts to aquatic habitat. Studies discussed in the literature review (Mason et al., 2005; Desert Research Institute, 2007; Iwinski and Snowdon, 2006) also determined that using anionic PAM-based products for water clarification resulted in turbidity reductions of 90% and greater. Dry weather pond turbidity may be too low to warrant polymer use during dewatering. During extended dry weather periods, turbidity in a sediment control pond may fall to levels low enough that the water can be discharged without further treatment. In these cases, additional treatment, such as polymers, may only be required when pond depth is low and bottom sediments are at risk of being re-suspended due to pumping action. Other situations may also be appropriate for polymer-based clarification, such as instances when sediment-laden water must be removed from a part of the site quickly without adequate settling time.

Performance Evaluation of an Anionic Polymer
Final Report Page 53
Open ditch system is vulnerable to damage and sediment contamination. Rainfall events, windblown dust, reckless construction activity or other tampering could easily compromise the design of the ditch system used. When the ditch is contaminated with additional sediment from surrounding runoff or wind-blown dust, cleaning the system to maintain effectiveness could be labour-intensive and costly. The siting and design of this type of ditch clarification system should be undertaken so as to minimize these potential sources of contamination. Final filtration was an essential component of the polymer tank system. For the tank experiment, the combination of just the mixing tank and settling tank (without the geotextile bag filtration) resulted in flocs suspended in the effluent. Filtration through the geotextile bag greatly improved sediment removal for the polymer system and brought effluent TSS levels down to less than 25 mg/L. It is clear that some sort of final filtration is necessary to prevent suspended flocs from being released to the receiving waters. While the bags used in the polymer system did require frequent replacement, this only serves to demonstrate how effective they were in removing suspended sediment. Regular maintenance is essential to achieving optimal performance of the practices tested, with or without the addition of PAM. The effect of sediment accumulation on the performance of the tank was most clearly observed during the Dec. 4 experiment, during which effluent TSS levels climbed steadily over the course of sampling. This effect was less apparent in the ditch tests, likely because the ditches had been used less and had accumulated less sediment than the tanks. If the ditch had been in operation for a longer period, it would be expected to require additional maintenance of the rock check dams and other components that may have shifted or been subject to excessive wear and tear.

Performance Evaluation of an Anionic Polymer
Final Report Page 54
5.0 RECOMMENDATIONS Anionic PAM has the potential to be a highly effective aid in clarification of construction site runoff when the delivery system is properly designed and maintained. The current study assessed performance of PAM in two viable construction site applications. The following recommendations are based on the results of the current study and the need to fill additional knowledge gaps with respect to polymer technology. 5.1 Polymer system design and monitoring
Anionic PAM-based delivery systems must be designed to ensure that they provide for proper dosing, adequate mixing, and a final filtration to prevent flocs from entering receiving waters. The specific location where the system will be installed and the expected flow rate are important considerations in determining the physical structure of the system.
The chemistry of water to be treated and sediment from the site are the primary data used to determine the type and quantity of polymer and the amount of mixing that should be provided. It is essential that the data provided to the polymer product supplier are true to conditions in the field.
During polymer-based construction runoff clarification, the system should be continuously monitored to ensure that no PAM is released to adjacent natural features. Designs that are more protected from the elements and vandalism are preferable to exposed systems that may require excessive maintenance to ensure safety and functionality.
The design of the system and its ongoing monitoring should be undertaken so as to minimize the risk of accidental polymer release to the environment. This may be achieved by increasing redundancy in the system, such as installing protection surrounding a ditch application or adding extra filtration at the end of the system. Risk can also be minimized by ensuring calculations determining the amount of polymer used are accurate, and educating construction staff about the polymer being used.
Where geotextile bags are used for final filtration, close monitoring is required to ensure that bags are replaced as needed (i.e., when they become full and begin to swell, outflow rate slows down and/or effluent turbidity increases). Because they can fill up quickly when used as part of a polymer system, extra caution should be exercised to ensure the bag does not rupture.
For ditch systems, the impact of wet weather flows in the ditch must be considered. Any water that flows into the ditch from somewhere other than the inlet, or flows out from somewhere other than the outlet (where there is a final filtration) should be monitored to ensure that polymer-dosed water is not released to areas outside the treatment system.
5.2 Control systems – dewatering ditch and settling tank
Settling tanks like the one tested, used without polymers should not be applied in the clarification of sediment-laden construction runoff consisting of a large proportion of fine

Performance Evaluation of an Anionic Polymer
Final Report Page 55
particles, as the mechanism of sediment removal in the tank does not allow for reduction of TSS to levels low enough to meet thresholds for aquatic habitat protection.
The control ditch system tested (as designed in the current study) should not be applied for the purpose of clarifying turbid construction runoff, if used as a standalone measure. The ditch was ineffective at reducing TSS to acceptable levels, particularly for fine particles. Using a permeable, and/or natural material cover to stabilize the ditch, such as vegetation or erosion control mats, would improve both infiltration and evaporation. Once the ditch is permeable, the ponding of water behind rock check dams or other permeable barriers would also help to infiltrate water rather that just settle sediment.
The effectiveness of both practices tested (ditch and tank) could be improved if design modifications were made to enhance settling of fines and minimize re-suspension of sediment.
5.3 Research needs Based on the literature review and field study presented in this report, the following issues are recommended for future research. The suggested research topics would help to fill existing knowledge gaps and provide information that is essential to establishing effective policy and guidance documents governing anionic PAM use.
Physical impact of reacted and unreacted anionic PAM deposition in aquatic habitats.
Safety of anionic PAM to other, more sensitive benthic invertebrates, particularly those commonly found in southern Ontario e.g., mussels, caddisflies, stoneflies, mayflies
Performance of other viable applications of anionic PAM for treatment of construction runoff as well as stormwater from other urban developments.
Quantification of the extent to which re-suspension is reduced for settled sediment that contains anionic PAM (e.g., where PAM was used as a flocculant).
Cost assessment of different anionic PAM applications; design, installation, maintenance and decommissioning should all be included to ensure that the real costs of the applications are being compared.
Performance of PAM-based applications for reducing real turbidity levels resulting from dewatering during early construction stages before ponds are in place (e.g., earthworks).
Performance of anionic PAM for preventing erosion and increasing stormwater infiltration on construction sites in southern Ontario.
Identification and evaluation of viable non-polymer alternatives for clarification of sediment-laden construction runoff during early stages of construction.
Acceptable residual acrylamide content in existing PAM products; research in support of the development of a local policy governing residual levels.
The extent to which PAM in the environment can degrade to AMD, including identification of which if any conditions in the natural environment can catalyze the reaction.
Research in support of development of a local certification or verification program for PAM products, to ensure consumers are receiving accurate information about their safety and performance.

Performance Evaluation of an Anionic Polymer
Final Report Page 56
6.0 REFERENCES Applied Polymer Systems Inc., 2010. MSDS Reports. Online document <http://www.siltstop.com/msds_toxicity_reports.html> Barvenik, F.W. 1994. Polyacrylamide characteristics related to soil applications. Soil Sci 158:235-243. Benedict, A., Oliver, G., Franklin, R. and R. Devitt, 2004. Raising the Bar on Construction Stormwater Treatment. Stormwater 5. Online document <http://www.stormh2o.com/may-june-2004/construction-stormwater-treatment.aspx> Biesinger, K.E. and G.N. Stokes, 1986. Effects of synthetic polyelectrolytes on selected aquatic organisms. J Water Poll Control Fed 58(3):207-213. Biesinger, K.E., Lemke, A.E., Smith, W.E., and R.M. Tyo, 1976. Comparative toxicity of polyelectrolytes to selected aquatic animals. J Water Pollut Control Fed 48:183-187. Brown, L., Bancroft, K.C.C. and M.M. Rhead, 1980. Laboratory studies on the adsorption of acrylamide monomer by sludge, sediments, clays, peat, and synthetic resin. Water Res 14:779-781. Bullock, G., Blazer, v., Tsukuda, S. and S. Summerfelt, 2000. Toxicity of acidified chitosan for cultured rainbow trout (Oncorhynchus mykiss). Aquaculture 185(3): 273-280. Canadian Council of Ministers of the Environment (CCME), 1999. Canadian Environmental Quality Guidelines (CWQG), Canadian Council of Ministers of the Environment, Winnipeg. Clarifica Inc. and Ryerson University, 2004. Assessment of Construction Sediment Control Ponds to Protect Receiving Waters, prepared for Toronto and Region Conservation and Fisheries and Oceans Canada, Toronto. de Rosemond, S.J.C. and K. Liber, 2004. Wastewater treatment polymers identified as the toxic component of a diamond mine effluent. Environ Toxicol Chem 23: 2234– 2242 Entry, J.A., Sojka, R.E., Watwood, M., and C. Ross, 2002. Polyacrylamide preparations for protection of water quality threatened by agricultural runoff contaminants. Environ Pollut 120:191-200. Entry, J.A. and R.E. Sojka, 2003. The efficacy of polyacrylamide to reduce nutrient movement from an irrigated field. Trans ASAE 46(1): 75-83. Environment Canada and Health Canada, 2009. Proposed Risk Management Approach for Acrylamide. Online document < http://www.ec.gc.ca/substances/ese/eng/challenge/batch5/batch 5_79-06-1_rm_en.pdf> European Chemicals Bureau, 2002. European Union Risk Assessment Report: Acrylamide. Office for Official Publications of the European Communities, Luxembourg. European Inland Fisheries Advisory Commission (EIFAC), 1965. Water quality criteria for European freshwater fish. Report on finely divided solids and inland fisheries. Int J Air Water Poll 9: 151-168. Exall, K., Droppo, I.G., and K. Stafford, 2008. Effects of chemical amendments on aquatic floc structure, settling and strength. Water Res 42: 169-179.

Performance Evaluation of an Anionic Polymer
Final Report Page 57
Flanagan, D.C., Chaudhari, K. and L. D. Norton, 2002. Polyacrylamide soil amendment effects on runoff and sediment yield on steep slopes: Part I. Simulated Rainfall Conditions. Trans ASAE 45(5): 1327-1337. Goodrich, M.S., L.H. Dulak, M.A. Freidman, and J.J. Lech, 1991. Acute and longterm toxicity of water-soluble cationic polymers to rainbow trout (Oncorhynchus mykiss) and the modification of toxicity by humic acid. Environ Toxicol Chem 10:509-551. Greenland International Consulting Inc., and the Toronto and Region Conservation Authority, 2001. Urban Construction Sediment Control Study. Toronto, Ontario. Hall, S.W. and R.J. Mirenda, 1991. Acute toxicity of wastewater treatment polymers to Daphnia puliz and the fathead minnow (Pimephales promelas) and the effects of humic acid on polymer toxicity. Research Journal WPCF. 63:6-13. Iwinski, S.R., and L. Snowdon, 2006. Polymer Stormwater Pipe Mixing Methods for Water Quality Enhancement. Kay-Shoemake, J.L. Watwood, M.E., Lentz, R.D. and R.E. Sojka, 1998. Polyacrylamide as an organic nitrogen source for microorganisms with potential effects on inorganic soil nitrogen in agricultural soil. Soil Biol Biochem 2(8): 1045-1052. Kay-Shoemake, J.L. and M.E. Watwood, 1996. Microbial ecology of polyacrylamide application in Agricultural soils. In: Sojka, R.E. and R.D. Lentz (eds.) Proceedings: Managing Irrigation-Induced Erosion and Infiltration with Polyacrylamide May 6, 7, and 8, 1996, College of Southern Idaho, Twin Falls, ID. University of Idaho Misc. Pub. 101-96, pp.33-41. Kerr, J.L., 2006. Anionic polyacrylamides and their impact upon the environment. Clearflow Enviro Systems Group Inc. Kobunshi Gyoshuzai Konwakai (High Molecular Flocculant Association). "Safety of Polyacrylamide Flocculants and Safety of Cationic Polyacrylamide Flocculants." Laird, D.A., 1997. Bonding between polyacrylamide and clay mineral surfaces. Soil Sci 162:826-832. Lenhart, J.H., 2008. BMP Performance Expectation Functions – A Simple Method for Evaluating Stormwater Treatment BMP Performance Data. Florida Water Resources Journal, pp. 28-39. Lentz, R.D., Shainberg, I., Sojka, R.E. and D.L. Carter, 1992. Preventing irrigation furrow erosion with small applications of polymers. Soil Sci Soc Am J 58: 1926-1932. Lentz, R.D. and R.E. Sojka, 1994. Field Results using polyacrylamide to manage furrow erosion and infiltration. Soil Sci 158(4):274-282. Lentz, R.D. and R.E. Sojka, 1996. A PAM primer: A brief history of PAM and PAM-related issues. In: Sojka, R.E. and R.D. Lentz (eds.) Proceedings: Managing Irrigation-Induced Erosion and Infiltration with Polyacrylamide May 6, 7, and 8, 1996, College of Southern Idaho, Twin Falls, ID. University of Idaho Misc. Pub. 101-96, pp.33-41. Lentz, R.D., Sojka, R.E. and B.E. Mackey, 2002. Fate and Efficacy of Polyacrylamide Applied in Furrow Irrigation. J Environ Qual 31: 661-670. Lentz, R.D. Andrawes, F. F., Barvenik, F.W. and A.C. Koehn, 2008. Acrylamide Monomer Leaching from Polyacrylamide-Treated Irrigation Furrows. J Environ Qual 37:2293–2298.

Performance Evaluation of an Anionic Polymer
Final Report Page 58
Liber, K., Weber, L., and C. Lévesque, 2005. Sublethal toxicity of two wastewater treatment polymers to lake trout fry (Salvelinus namaycush). Chemosphere 61: 1123-1133. Mason, L.B., Amrhein, C., Goodson, C.C., Matsumoto, M.R. and M.A. Anderson, 2005. Reducing Sediment and Phosphorus in Tributary Waters with Alum and Polyacrylamide. J Environ Qual 34: 1998-2004. McLaughlin, R.A. and T.T. Brown, 2006. Performance of erosion control materials and polyacrylamide under field and rainfall simulator conditions. J Am Water Res Assoc 42(3):675-684. Moran, E.A. and M.H. Young, 2007. Effect of LA-PAM on Soil Hydraulic Conductivity. In M.H. Young (Ed.), Technical Report: Results of Lab Experiments in Support of PAM-Related Research (p. 4-27) DHS Publ. 41237. Desert Research Institute, Las Vegas, NV. Muir, M.M., Kosteretzoe, K.G. and J.J. Lech, 1997. Localization, depuration, bioaccumulation and impairment of ion regulation associated with cationic polymer exposure in rainbow trout (Oncorhynchus mykiss). Xenobiotica 27(10): 1005-1014. Natural Site Solutions, 2004. Toxicity Testing for Liqui-floc. Redmond, WA. Natural Site Solutions, 2006. Toxicity Testing for Gel-floc. Redmond, WA. Ontario Ministry of the Environment (OMOE), 2003. Stormwater Management Planning and Design Manual. Queen’s Printer for Ontario. Newcombe, C.P., 1986. Suspended sediments in aquatic ecosystems: a guide to impact assessment. British Columbia Ministry of Environment and Parks, Waste Management Branch, Victoria. Orts, W.J., R.E. Sojka, and G.M. Glenn, 2000. Biopolymer additives to reduce erosion-induced soil losses during irrigation. Industrial Crops & Products 11:19-29. Roa-Espinosa, A., Bubenzer, G.D. and E.S. Miyashita, 2000. Sediment and runoff control on construction sites using four application methods of polyacrylamide mix. In Proceedings of the National Conference on tools for Urban Water Resource Management and Protection, 278-283. February 7-10, 2000. Chicago, IL. EPA No. 625R00001. Cincinnati, OH: National Service Centre for Environmental Publications. Schueler, T.S., 2000. Irreducible pollutant concentrations discharged from stormwater practices. Watershed Protection Techniques 2(2): 369-372. Shainberg, I., Warrington, D. and P. Rengasamy, 1990. Water-quality and PAM interactions in reducing surface sealing. Soil Sci 149:301-307. Shainberg, I. and G.J. Levy, 1994. Organic polymers and soil sealing in cultivated soils. Soil Sci 158:267-273. Sojka R.E. and R.D. Lentz, 1996. A PAM Primer: A brief history of PAM and PAM-related issues. In: Sojka, R.E. and Lentz, R.D. (eds.) Managing irrigation-induced erosion and infiltration with polyacrylamide. University of Idaho Miscellaneous Publication No. 101-96, pp. 11-20. Sojka, R.E., Lentz, R.D., Ross, C.W., Trout, T.J., Bjornberg, D.L. and J.K. Aase, 1998. Polyacrylamide effects on infiltration in irrigated agriculture. J Soil Water Cons 53(4):325-331.

Performance Evaluation of an Anionic Polymer
Final Report Page 59
Sojka, R.E., and J.A. Entry, 2000. Influence of polyacrylamide application to soil on movement of microorganisms in runoff water. Environ Poll 108(3):405-412. Sojka, R.E., Entry, J.A., Orts, W.J., Morishita, D.W., Ross, C.W., and D.J. Horne, 2005. Synthetic- and bio-polymer use for runoff water quality management in irrigation agriculture. Water Sci Technol 51:107-115. Stephens, S.H., 1991. Final Report on the safety of polyacrylamide. J Am Coll Toxicol 10:193-202. Suzuki, J., Harada, H., and S. Suzuki, 1979. Ozone treatment of water-soluble polymers. V. Ultraviolet irradiation effects on the ozonization of polyacrylamide. J Appl Polymer Sci 24(4):999-1006. Toronto and Region Conservation Authority (TRCA) and University of Guelph, 2006. Evaluation of Design Criteria for Construction Sediment Control Ponds. Toronto, Ontario. U.S. Department of Agriculture (USDA) Natural Resources Conservation Service, 2002. Conservation Practice Standard: Anionic Polyacrylamide Application, Code 450. Online document <http://efotg.sc.egov.usda.gov//references/public/CO/CO450-3-02.pdf> U.S. Environmental Protection Agency, 2010. Toxicological Review of Acrylamide In Support of Summary Information on the Integrated Risk Information System (IRIS). EPA/635/R-07/009F. Online document <www.epa.gov/iris/toxreviews/0286tr.pdf> Vers, L.M.V., 1999. Determination of acrylamide monomer in polyacrylamide degradation studies by high-performance liquid chromatography. J Chromatogr Sci 37:486-494. Weston, D.P., Lentz, D.R., Cahn, M.D., Ogle, R.S., Rothert, A.K., and M.J. Lydy, 2009. Toxicity of Anionic Polyacrylamide Formulations when used for Erosion Control in Agriculture. J Environ Qual 38:238–247. Wood, J., Dhanvantari, S., Yang, M., Rochfort, Q., Chessie, P., Marsalek, J., Kok, S., and P. Seto, 2004. Feasibility of Stormwater Treatment by Conventional and Lamellar Settling With and Without Polymeric Flocculant Addition. Water Qual Res J Canada 39(4): 406-416. Woodrow, J. and G. Miller, 2007. UV degradation of LA-PAM and AMD. In M.H. Young (Ed.), Technical Report: Results of Lab Experiments in Support of PAM-Related Research (p. 4-27) DHS Publ. 41237. Desert Research Institute, Las Vegas, NV. Wright Water Engineers and Geosyntec Consultants, 2007. Frequently Asked Questions Fact Sheet for the International Stormwater BMP Database: Why does the International Stormwater BMP Database Project omit percent removal as a measure of BMP performance? Online document <http://www.bmpdatabase.org/Docs/FAQPercentRemoval.pdf>