vccedge-preface new
TRANSCRIPT
India’s most comprehensive financial research platform for deal makers
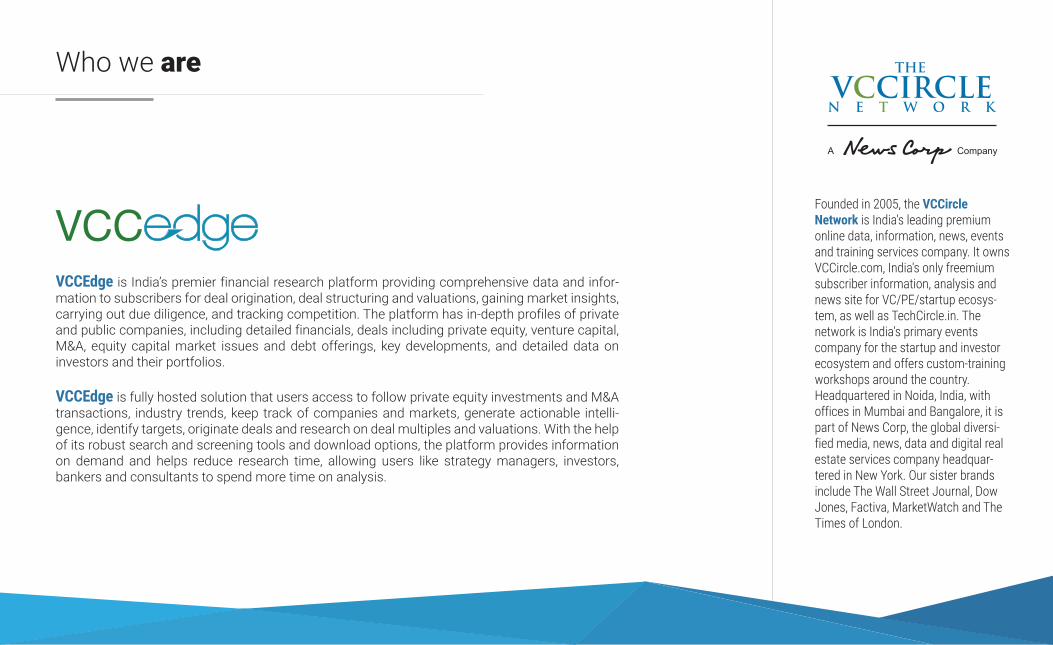
Who we are
Founded in 2005, the VCCircle Network is India's leading premium online data, information, news, events and training services company. It owns VCCircle.com, India's only freemium subscriber information, analysis and news site for VC/PE/startup ecosys-tem, as well as TechCircle.in. The network is India's primary events company for the startup and investor ecosystem and offers custom-training workshops around the country. Headquartered in Noida, India, with offices in Mumbai and Bangalore, it is part of News Corp, the global diversi-fied media, news, data and digital real estate services company headquar-tered in New York. Our sister brands include The Wall Street Journal, Dow Jones, Factiva, MarketWatch and The Times of London.
VCCEdge is India’s premier financial research platform providing comprehensive data and infor-mation to subscribers for deal origination, deal structuring and valuations, gaining market insights, carrying out due diligence, and tracking competition. The platform has in-depth profiles of private and public companies, including detailed financials, deals including private equity, venture capital, M&A, equity capital market issues and debt offerings, key developments, and detailed data on investors and their portfolios.
VCCEdge is fully hosted solution that users access to follow private equity investments and M&A transactions, industry trends, keep track of companies and markets, generate actionable intelli-gence, identify targets, originate deals and research on deal multiples and valuations. With the help of its robust search and screening tools and download options, the platform provides information on demand and helps reduce research time, allowing users like strategy managers, investors, bankers and consultants to spend more time on analysis.

Our Key Features
n COMPANIES Funded and non-funded private and public companies searchable on various parameters including industry, geography, and financials.
n DETAILED INDUSTRY CLASSIFICATIONScreen and analyze companies and data on the basis of S&P Gener-al Industry Classification – split across 10 Sectors, 24 Industry Groups, 68 Industries, and 154 Sub-Industries.
n DEALSAll mergers & acquisitions, private equity & venture capital invest-ment and exits deals, and public offerings in India, starting 1998, with detailed information.
n FINANCIALSCurrent and historical financials for public and private companies, including key ratios.
n PROFESSIONAL INTELLIGENCEContact details and professional relationships of all key manage-ment and board professionals employed with companies, including investment firms, law firms, and investment banks.
Download Deal Timeline

More Features
n POWERFUL SCREENING TOOLS
Screen for companies or deals on a plethora of parameters, including financial data items, deal details, and sector/industry.
n DIRECTORIES
Exhaustive listing of private equity/venture capital funds, investments banks, and law firms active in India with details of their transactions.
Deal Screening
Company Advisor LimitedPartners
Portfolioage
FundsPrivate equity funds
Fund Managers
Limited Partners Incubators
Angel Investors
Invest-ment banks
Law firms Auditors Profes-sionals
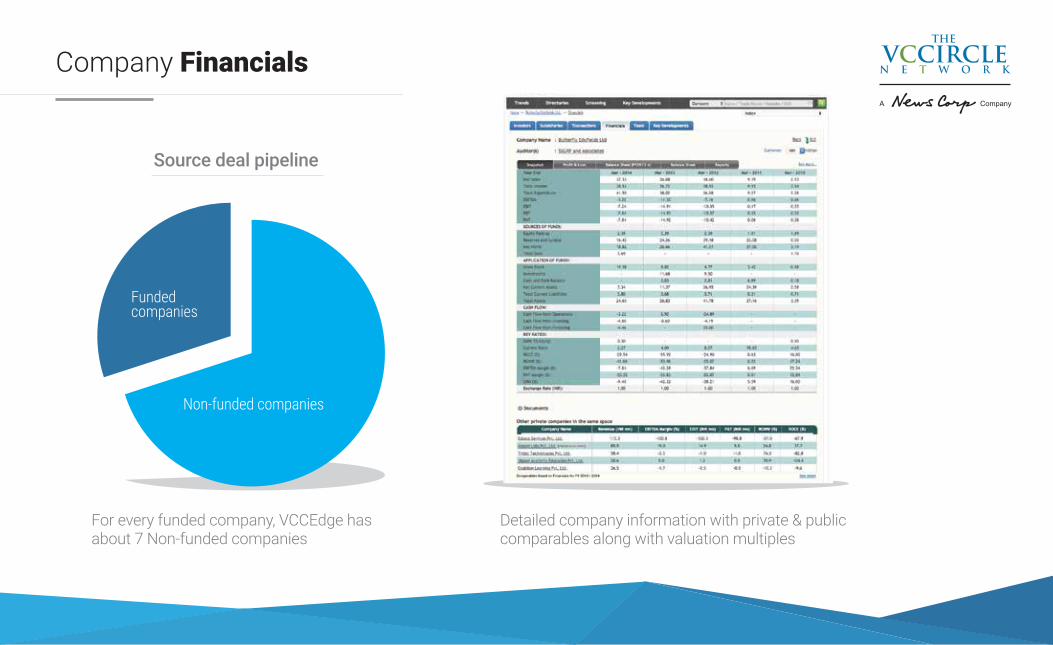
Source deal pipeline
For every funded company, VCCEdge hasabout 7 Non-funded companies
Detailed company information with private & public comparables along with valuation multiples
Funded companies
Non-funded companies
Company Financials
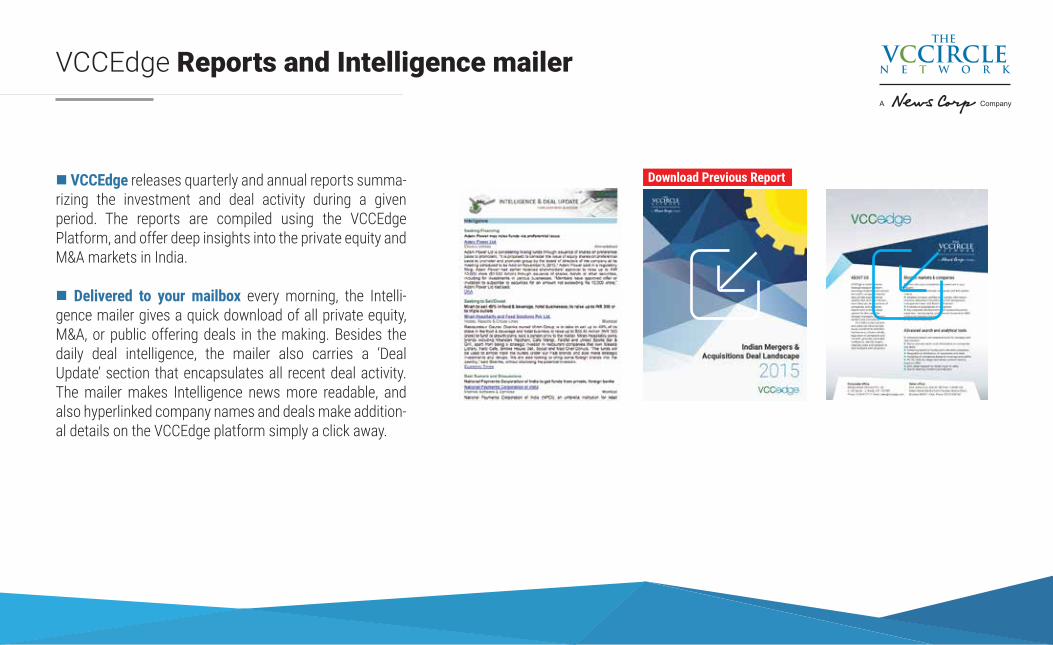
VCCEdge Reports and Intelligence mailer
n VCCEdge releases quarterly and annual reports summa-rizing the investment and deal activity during a given period. The reports are compiled using the VCCEdge Platform, and offer deep insights into the private equity and M&A markets in India.
n Delivered to your mailbox every morning, the Intelli-gence mailer gives a quick download of all private equity, M&A, or public offering deals in the making. Besides the daily deal intelligence, the mailer also carries a ‘Deal Update’ section that encapsulates all recent deal activity. The mailer makes Intelligence news more readable, and also hyperlinked company names and deals make addition-al details on the VCCEdge platform simply a click away.
Download Previous Report

How we can help
Venture capital/Angel fundsn Deal sourcing, build deal pipeline. n Browse through Startup Profiles
Consultant and Advisorsn Enhance Valuation Analysis, Sector Research and Idea generation. n Perform accurate valuation and comparable company analysis.
Corporationsn Identify potential acquisitions & potential investors, monitor sell side.n Better manage the deal pipeline and conduct effective due dilligence.
Investment bankersn Conduct comparable company and transaction analysis. n Keep track of your coverage universe; Identify and Leverage key relationships.
Private Equity Fundsn Analyze current or potential portfolios. Generate better investment ideas. n Exit from or merge a current holding. Analyze Cos with transparent data.
Limited Partnersn Comprehensive and exclusive data on LP Investors. n Profiles of institutional investors investing in India.

Market search & analytical tools
Monitor markets & companies
n Know who your competitors and peers are in your industry n Research and benchmark companies and their performancen Detailed company profiles with contact information, business description, founders and their background, management team and Board of Directorsn Investors & Subsidiaries of companiesn Key corporate developments from product/busi-ness expansion, raising capital, professional move-ments, M&A rumours to distress indicators n Alerts and Watchlists
Advanced search and analytical tools
n Advanced search and analytical tools for company and deal researchn Sector and sub sector wise information on companies and dealsn Screening based on funded and unfunded companiesn Geographical distribution of companies and dealsn Screening of companies based on revenues and profitsn PE/VC Deals by stages and series, control/minority, buyouts, LBOs n M&A deals research by target, buyer or sellern Search deals by investors and advisors

Contact us
Take a demo:Shashank Randev
CORPORATE OFFICE:Mosaic Media Ventures Pvt. Ltd.
A - 83, Sector - 2, Noida, U.P. - 201301Phone: 0120-4171111 Email: [email protected]
Website: www.vcccedge.com
SALES OFFICE:Dow Jones & Co. Unit 93,
9th Floor. 2 North Ave., Maker Maxity Bandra Kurla Complex, Bandra (East), Mumbai 400051, India.
Phone: 022-61456100

Copyright 2015 Mosaic Media Ventures Pvt. Ltd. All Rights Reserved page 1/4
SKS Microfinance Ltd. - Transaction Timeline
2003 Angel/Seed Investment ($4.70 mn) 09 Jun, 2003
SKS Microfinance raises $4.7 million from Unitus Equity Fund
2006 Financials 31 Mar, 2006
Total Income: INR 99.44 mn CAGR (3 Yr): -
PAT: INR 4.43 mn CAGR (3 Yr): -
Venture Capital Investment ($3.20 mn) 31 Mar, 2006
SKS Microfinance Ltd. raised $3.2 mn in its Series A round of Venture Capital financing from Small IndustriesDevelopment Bank of India & Unitus Equity Fund.
New Investor(s) 31 Mar, 2006
Small Industries Development Bank of India, Unitus Equity Fund
SKS Microfinance Ltd. raised $3.2 mn in its Series A round of Venture Capital financing from Small IndustriesDevelopment Bank of India & Unitus Equity Fund.
2007 Financials 31 Mar, 2007
Total Income: INR 456.66 mn CAGR (3 Yr): -
PAT: INR 18.04 mn CAGR (3 Yr): -
Venture Capital Investment ($11.78 mn) 31 Mar, 2007
SKS Microfinance raised $11.78 million in second round of funding.
New Investor(s) 31 Mar, 2007
Odyssey Capital LLC, Unitus Equity Fund, Sequoia Capital India Growth Fund I, Kismet Capital LLC
SKS Microfinance raised $11.78 million in second round of funding.
2008 Venture Capital Investment ($30.33 mn) 22 Jan, 2008
Small Industries Development Bank of India, SVB India Capital Partners Fund ,Columbia Capital, Unitus EquityFund, Sequoia Capital India Growth Fund, Kismet Capital and Yatish Trading invests $30.33 million in SKSMicrofinance
New Investor(s) 22 Jan, 2008
SVB India Capital Partners I LP, Columbia Capital LLC, Sequoia Capital India Growth Fund I, Small IndustriesDevelopment Bank of India, Unitus Equity Fund, Yatish Trading Co. Pvt. Ltd., Kismet Capital LLC
Small Industries Development Bank of India, SVB India Capital Partners Fund ,Columbia Capital, Unitus EquityFund, Sequoia Capital India Growth Fund, Kismet Capital and Yatish Trading invests $30.33 million in SKSMicrofinance
Financials 31 Mar, 2008
Total Income: INR 1,700.08 mn CAGR (3 Yr): 157.61%
PAT: INR 169.30 mn CAGR (3 Yr): 236.84%
Venture Capital Investment ($3.60 mn) 30 Sep, 2008
SKS Microfinance Ltd. raised $3.6 mn in its Series D round of Venture Capital financing from Sequoia Capital IndiaGrowth Fund I & Kismet Capital LLC.
2009 Venture Capital Investment ($75.00 mn) 26 Mar, 2009
SKS Microfinance Ltd. raised $75 mn in Private Equity financing from SVB India Capital Partners Fund, SandstoneCapital LLC & Kismet Capital LLC.
New Investor(s) 26 Mar, 2009
Sandstone Capital LLC, SVB India Capital Partners I LP, Kismet Capital LLC
SKS Microfinance Ltd. raised $75 mn in Private Equity financing from SVB India Capital Partners Fund, SandstoneCapital LLC & Kismet Capital LLC.

Copyright 2015 Mosaic Media Ventures Pvt. Ltd. All Rights Reserved page 2/4
Financials 31 Mar, 2009
Total Income: INR 5,539.99 mn CAGR (3 Yr): 129.78%
PAT: INR 804.92 mn CAGR (3 Yr): 254.68%
Merger & Acquisition ($10.38 mn) 02 Jul, 2009
Bajaj Allianz Life Insurance Co. Ltd. acquires 2.5% stake in SKS Microfinance Ltd. for $10.38 million throughpreferential allotment
New Investor(s) 02 Jul, 2009
Bajaj Allianz Life Insurance Co. Ltd.
Bajaj Allianz Life Insurance Co. Ltd. acquires 2.5% stake in SKS Microfinance Ltd. for $10.38 million throughpreferential allotment
Venture Capital Investment ($9.72 mn) 29 Jul, 2009
SKS Microfinance Ltd. raised $9.72 mn in Private Equity financing from Sequoia Capital India Growth Fund I.
2010 Pre-IPO Investment ($6.17 mn) 19 Jan, 2010
SKS Microfinance Ltd. raised $6.17 mn in its Pre-IPO round of Private Equity financing from Catamaran InvestmentsPvt. Ltd.
New Investor(s) 19 Jan, 2010
Catamaran Investments Pvt. Ltd.
SKS Microfinance Ltd. raised $6.17 mn in its Pre-IPO round of Private Equity financing from Catamaran InvestmentsPvt. Ltd.
Initial Public Offering ($364.12 mn) 25 Mar, 2010
SKS Microfinance Ltd. files for Initial Public Offering
Investor Exit 25 Mar, 2010
Kismet Capital LLC
SKS Microfinance Ltd. files for Initial Public Offering
Financials 31 Mar, 2010
Total Income: INR 9,589.29 mn CAGR (3 Yr): 78.01%
PAT: INR 1,749.25 mn CAGR (3 Yr): 117.80%
Private Equity Investment ($4.22 mn) 12 May, 2010
SKS Microfinance Ltd. raises $4.22 mn from Quantum Fund for 0.4% stake
New Investor(s) 12 May, 2010
Quantum Fund
SKS Microfinance Ltd. raises $4.22 mn from Quantum Fund for 0.4% stake
Initial Public Offering ($364.12 mn) 16 Jul, 2010
SKS Microfinance Ltd. fixes price band of INR 850-985 per share for its INR 16,539 million Initial Public Offering
Initial Public Offering ($364.12 mn) 05 Aug, 2010
SKS Microfinance Ltd. raises INR 16,539 million in Initial Public Offering
Initial Public Offering ($364.12 mn) 16 Aug, 2010
SKS Microfinance Ltd. announces listing of its 16,791,579 shares on Bombay Stock Exchange (BSE) and NationalStock Exchange (NSE)
2011 Financials 31 Mar, 2011
Total Income: INR 12,639.26 mn CAGR (3 Yr): 31.64%
PAT: INR 1,134.47 mn CAGR (3 Yr): 12.12%
Private Equity Exit ($23.41 mn) 01 Jul, 2011
Quantum Fund sells entire 4.16% stake for $23.41 million
Investor Exit 01 Jul, 2011
Quantum Fund
Quantum Fund sells entire 4.16% stake for $23.41 million
2012

Copyright 2015 Mosaic Media Ventures Pvt. Ltd. All Rights Reserved page 3/4
Financials 31 Mar, 2012
Total Income: INR 4,721.98 mn CAGR (3 Yr): -21.03%
PAT: INR -13,595.59 mn CAGR (3 Yr): -
Public Equity Investment ($6.07 mn) 12 Jul, 2012
WestBridge raises stake in SKS Microfinance.
New Investor(s) 12 Jul, 2012
WestBridge Ventures II LLC
WestBridge raises stake in SKS Microfinance.
Qualified Institutional Placement ($41.80 mn) 17 Jul, 2012
SKS Microfinance Ltd. raises INR 2.3 billion in a Qualified Institutional Placement issue
Private Equity Exit ($11.29 mn) 03 Dec, 2012
WestBridge and Sequoia sold their stake in SKS Micro Fin.
2013 Financials 31 Mar, 2013
Total Income: INR 3,525.64 mn CAGR (3 Yr): -34.66%
PAT: INR -2,971.39 mn CAGR (3 Yr): -
Private Equity Exit ($3.08 mn) 03 Sep, 2013
Sequoia Capital India sells 1.42% stake in SKS Microfinance for $3.08 million
Public Equity Investment ($3.46 mn) 09 Sep, 2013
WestBridge Ventures to invests $3.46 million for 1.48% stake Unitus to exit
Private Equity Exit ($0.01 mn) 18 Sep, 2013
Unitus Equity Fund sells its entire stake in SKS Microfinance
Investor Exit 18 Sep, 2013
Unitus Equity Fund
SKS Trusts may contest rejection of berth on company's board
Private Equity Exit ($1.63 mn) 28 Oct, 2013
Sequoia Capital India sells 0.63% stake in SKS Microfinance
Private Equity Investment ($4.61 mn) 12 Nov, 2013
WestBridge acquired stake in SKS Microfinance from Sequoia Capital.
Investor Exit 12 Nov, 2013
Sequoia Capital India Growth Fund I
WestBridge acquired stake in SKS Microfinance from Sequoia Capital.
2014 Financials 31 Mar, 2014
Total Income: INR 5,448.35 mn CAGR (3 Yr): 4.89%
PAT: INR 698.51 mn CAGR (3 Yr): -
Qualified Institutional Placement ($68.30 mn) 19 May, 2014
SKS Microfinance raises INR 4 billion in a Qualified Institutional Placement issue
New Investor(s) 19 May, 2014
CLSA Private Equity Management Ltd.
SKS Microfinance raises INR 4 billion in a Qualified Institutional Placement issue
Private Equity Exit ($22.70 mn) 19 Jun, 2014
WestBridge Ventures sells 3.94% stake in SKS Microfinance for $22.7 million
Private Equity Exit ($34.28 mn) 01 Jul, 2014
CLSA Private sells 5.47% stake in SKS Microfinance for $34.28 million

Copyright 2015 Mosaic Media Ventures Pvt. Ltd. All Rights Reserved page 4/4
Investor Exit 01 Jul, 2014
CLSA Private Equity Management Ltd.
CLSA Private sells 5.47% stake in SKS Microfinance for $34.28 million
2015 Debt Private Placement ($31.95 mn) 30 Mar, 2015
SKS Microfinance raises INR 2 billion through the issue of Debentures on a private placement basis
Financials 31 Mar, 2015
Total Income: INR 8,030.66 mn CAGR (3 Yr): 31.57%
PAT: INR 1,876.64 mn CAGR (3 Yr): -
Private Equity Exit ($22.13 mn) 10 Aug, 2015
WestBridge Ventures sells its 2.39% stake in SKS Microfinance for $22.13 million
Investor Exit 10 Aug, 2015
WestBridge Ventures II LLC
WestBridge Ventures sells its 2.39% stake in SKS Microfinance for $22.13 million

Indian Mergers & Acquisitions Deal Landscape
2015

INDIAN M&A DEAL LANDSCAPE - 2015
1
HE Indian growth story piggybacks largely on robust domestic consumption. Rising demand for
goods and services in the country, where nearly half the population is younger than 30 and the number of middle-class house-holds is increasing, has presented a lucra-tive growth opportunity. No wonder, then, that corporate houses as well as private equity firms have been looking to cash in on this opportunity.
Over the past decade, strategic and financial investments from overseas investors have been growing consistently. Appetite for Indian assets and businesses has grown as more and more global com-panies are looking at the country contribut-ing to their ambitious growth plans. Similar-ly, private equity investors, who initially invested out of their global offices and funds, have set up shop in the subcontinent and started hiring local talent to keep pace with the rapidly evolving market.
While India had been witnessing a few billion dollars’ worth of M&A transactions each year even earlier, it began to see a noticeble rise in deals only in 2006. That is when the world’s second most populous country started to outpace most developed and developing economies in terms of growth. By 2005 the economy (measured
in terms of GDP) was growing at a staggering 9.3 per cent, higher than the 7.9 per cent expansion in 2003 and 2004, and significantly higher than the 3.8 per cent growth record-ed in 2002. By the end of CY2006, assets worth more than $31 billion had changed ownership through 539 M&A deals, as recorded by VCCEdge. The next year (CY2007), aggre-gate disclosed value of M&A deals grew 45% to a mammoth $45 billion.
In the three years leading up to the 2008 financial meltdown, India had seen M&A deals in excess of $110 billion across some 1,900 deals. Private equity investments, too, grew unabatedly during this period with over $43 billion being invested across 1,982 deals. The year 2007 alone accounted for about 57 per cent of that capital and more than a third of the private equity deals recorded by VCCEdge.
T
*2015YTD represents the period Jan 1’ 15 to Oct 27’ 15
Private Equity ($ bn)Mergers & Acquisitions ($ bn)
$30.92
$44.98$34.26
$14.78
$62.41
$36.69
$20.89$25.88
$33.54
$18.44$8.13
$20.73$14.55
$5.70
$10.95 $12.78
$11.95
$12.01 $14.22$17.19
$0
$20
$40
$60
$80
2006 2007 2008 2009 2010 2011 2012 2013 2014 2015*

INDIAN M&A DEAL LANDSCAPE - 2015
In the aftermath of the meltdown, M&A value slumped to $14.8 billion spread across 553 deals. Private equity sentiment, too, remained weak as fresh allocations by Limited Parters (LPs) and commitments by General Partners (GPs) starting drying up. The deal activity hit rock bottom in 2009 with $5.7 billion of investments spread across 472 deals.
The signs of recovery became evident with M&A making a big-bang comeback in CY2010, when $62.5 billion of assets were acquired across 876 deals. Private equity fund raising also bounced back; between 2009 and 2011 GPs raised more than $14 billion in commitments from LPs for invest-ing in India alone. The capital raised by global funds with an India allocation and the capital available for investments was even higher.
The years 2012 and 2013 were challenging globally, and the India story was not an exception to slowing GDP growth across most emerging economies. Despite
the dip in growth and macro-issues ranging from inflation to high fiscal deficit and a depreciating rupee, India fared relatively well and grew between 4.5 per cent and 5 per cent on the back of resilient consumption. M&A activity did dip during these years to the levels seen in CY2010, but the momentum picked up in CY2014 with 894 deals – the highest ever -- being signed during the year.
The year so far (CY2015 YTD*) has seen a lacklustre performance on the deal value front in the absence of any mega-ticket M&As. While deal volume stands robust at 755 transactions and is well on way to beat the all-time high seen in CY2014, the disclosed deal value barely crosses the $17-billion mark and suggests a significant drop in the average deal value.
To give some perspective on the M&A run so far, CY2014 saw 732 deals worth $21.6 billion during the corresponding period. The spike in dealmaking over the last two years can be attributed to the optimism surrounding the new central government and hopes about much-needed policy and regulatory reforms. A host of related factors have supported dealmaking, including an easing in inflation, falling crude prices, increasing GDP growth, and reasonable valuations, all of which put India high on the investment attractiveness index.
$62.41$36.69 $20.89 $25.88
$33.54 $17.19
876 891
781
859
894
755
650
700
750
800
850
900
950
0
$10
$20
$30
$40
$50
$60
$70
2010 2011 2012 2013 2014 2015*
Value ($ bn)
*2015YTD represents the period Jan 1’ 15 to Oct 27’ 15
Volume
2

DEAL TYPE ANALYSIS
Deal Type Analysis (volume)Domestic Inbound Outbound #Others
HE value of domestic deals decreased 48 per cent to $6.3 billion in 2015 YTD from $12.2 billion in the
same period of 2014. The value of inbound deals, on the other hand, rose 50 per cent to $5.6 billion from $3.7 billion a year earlier. Similarly, the value of outbound deals surged 72 per cent to $3.2 billion from $1.9 billion.
The number of inbound deals fell 19 per cent to 114 in 2015 YTD* from 140 deals a year earlier. The number of outbound deals remains unchanged, while the count of domestic deals increased nearly 10 per cent to 453 from 411 during the same period.
The average size of domestic deals dropped 54 per cent to $38.68 million from $83.99 million, and that of inbound deals doubled to $109.03 million from $55 million. The average size of outbound deals so far this year increased 58 per cent as compared with CY2014.
The median deal size of inbound deals jumped 56 per cent to $27.25 million from $17.47 million. Median deal values in both domestic and outbound deals rose 16 per cent and 7 per cent, respectively, as compared with CY2014.
T454
137
246
39
490
162 19
247
409
150
153
69
477
165
134
83
501
167
132
94
453
114
107
81
2010 2011 2012 2013 2014 2015*
Deal Type Analysis (value $ bn)Domestic Inbound Outbound #Others
$29.23
$256.22
$226.61
$179.73
$109.60
$86.99 $91.04
$37.23$31.67
$87.11
$50.63$54.77
$83.99
$69.25
$128.24
$23.74
$109.03
$8.42$4.18 $5.51 $5
$6.8 $7.88
$15$14
$18.84
$21
$17.47
$27.25
$80.23
$38.68
Average Deal Amount ($ mn)
$17.
17$1
4.38
$1.6
2 $5.7
7
$19.22
$9.2
3$2
.47 $5
.99
$6.8
0$6
.79
$1.3
2
$8.4
1$7
.28
$8.5
9$1
.59
$19.40
$4.6
0$2
.63 $6
.90
$6.3
4$5
.67
$3.2
9$1
.88
2010 2011 2012 2013 2014 2015*
0
100
200
300
2010 2011 2012 2013 2014 2015*
DomesticInboundOutbound
DomesticInboundOutbound
Median Deal Amount ($ mn)
0
10
20
30
40
2010 2011 2012 2013 2014 2015*
3
*2015YTD represents the period Jan 1’ 15 to Oct 27’ 15.#’Others' as an M&A sub-type represents deals that either do not have the buyer disclosed, or an Indian seller in an overseas transaction.
$17.39$18
$22.20$22.50
$30.48$27.54

REGIONAL ANALYSIS
AHARASHTRA, Karnataka, Delhi, Tamil Nadu and Telanga-na were the top five states for
M&A deal activity since 2010. Together, they accounted for 58 per cent of deal volume and 42 per cent of deal value recorded since 2010.
MState Volume Value ($ bn) Maharashtra 1,336 $44.48Karnataka 498 $14.54Delhi 484 $10.18Tamil Nadu 337 $6.73Telangana 298 $6.05Period Jan 1’ 10 to Oct 27’ 15
Top 5 States
M
4

New Shares Old Shares
New Shares Old Shares
TRANSACTION ANALYSIS
majority of the M&A transac-tions announced since 2010 involved existing
shareholders selling stakes. But there have also been a few strategic investments, representing 4 per cent of aggregate deal
A
62 76 19 10 33 16
814 815 762 849 861 739
0%
20%
40%
60%
80%
100%
2010 2011 2012 2013 2014 2015*
New Shares Vs Secondary Shares - By Volume
New Shares Vs Secondary Shares - By Value ($ bn)
$3.26 $3.48 $0.30 $0.17 $1.07 $0.60
$59.15 $33.21 $20.59 $25.71 $32.47 $16.59
0%
20%
40%
60%
80%
100%
2010 2011 2012 2013 2014 2015*
5
volume and 5 per cent of deal value, where the buyer(s) acquired fresh shares by investing capital directly in the target company. Such direct investments are on the fall though, falling consistently year-on-year. Compared to CY2014, the number of strategic investments so far in CY2015 YTD* are down 52 per cent and deal value is down 44 per cent.
*2015YTD represents the period Jan 1’ 15 to Oct 27’ 15

TRANSACTION ANALYSIS
Majority deals Minority Deals
Majority deals Minority Deals
Majority Stake Vs Minority Stake Acquisitions - By Volume
Majority Stake Vs Minority Stake Acquisitions - By Value ($ bn)
527 545 476 504 553 520
279 268 235 267 237 153
0%
20%
40%
60%
80%
100%
0%
20%
40%
60%
80%
100%
2010 2011 2012 2013 2014 2015*
2010 2011 2012 2013 2014 2015*
$45.98 $14.33 $16.44 $15.70 $24.74 $11.46
$15.51 $21.78 $4.19 $8.65 $7.99 $3.99
6
quick look at the graph below reveals that majority-stake acquisitions represent a major
chunk (about 68 per cent) of the total M&A deals announced since 2010. To be specific, 3,125 majority-stake M&A deals worth $128.65 billion took place from 2010 to
A 2015YTD*. Minority-stake acquisitions witnessed some traction in 2011, exceeding majority-stake deals in terms of value. Overall, these deals represent 32 per cent of the aggregate deal volume since 2010; a total of 1,439 such deals worth $62.12 billion were recorded. This analysis is based on M&A deals announced between 2010 and 2015YTD* for which the stake type (majority or minority) was disclosed.
*2015YTD represents the period Jan 1’ 15 to Oct 27’ 15

MERGERS & ACQUISITIONS
$10,700Announced date: 3/30/10Target Company:Bharti Airtel Africa BVBuyer:Bharti Airtel Ltd.
Outbound
$8,360Announced date: 8/16/10Target Company:Cairn India Ltd.Buyer:Vedanta Resources Plc
Inbound
$4,000Announced date: 4/6/14Target Company:Ranbaxy Laboratories Ltd.Buyer:Sun Pharmaceutical Industries Ltd.
Domestic
$3,720Announced date: 5/21/10Target Company:Piramal's Healthcare Solutions Business (Domestic Formulations)Buyer:Abbott Healthcare Pvt. Ltd.
Domestic
$2,700Announced date: 8/3/10Target Company: Linc Energy Ltd., Carmichael Coal ProjectBuyer: Adani Enterprises Ltd.
Outbound
$2,640Announced date: 8/24/13Target Company: Anadarko Petroleum Corp., Rovuma Offshore Area 1Buyer: ONGC Videsh Ltd.
Outbound
$2,513Announced date: 7/24/13Target Company: Holcim India Pvt. Ltd.Buyer: Ambuja Cements Ltd.
Domestic
$7,200Announced date: 2/21/11Target Company: Reliance Industries Ltd., Oil and Gas BlocksBuyer: BP Plc.
Inbound
$5,460Announced date: 3/31/11Target Company: Vodafone India Ltd.Buyer: Vodafone Group Plc.
Inbound
$3,234Announced date: 11/9/12Target Company: United Spirits Ltd.Buyer: Diageo Plc
Inbound
Deal Value($ mn)
7
Top 10 Mergers & Acquisitions

Industry Group Domestic Inbound Outbound Volume Value ($ mn) Volume Value ($ mn) Volume Value ($ mn)
Automobiles & Components 55 $1,386 57 $673 48 $1,272
Banks 29 $3,709 8 $356 5 $1,793
Capital Goods 263 $2,842 121 $5,216 107 $1,799
Commercial & Professional Services 126 $353 62 $720 40 $889
Consumer Durables & Apparel 100 $407 27 $395 24 $262
Consumer Services 163 $1,548 19 $63 34 $2,714
Diversified Financials 191 $2,490 49 $1,779 23 $935
Energy 46 $3,984 15 $16,276 81 $19,246
Food & Staples Retailing 17 $65 3 $249 2 $14
Food, Beverage & Tobacco 144 $910 31 $4,653 35 $498
Health Care Equipment & Services 126 $1,144 27 $835 43 $2,645
Household & Personal Products 23 $889 28 $984
Insurance 17 $418 12 $2,210 2 $16
Materials 253 $9,743 81 $3,356 101 $7,136
Media 160 $2,146 59 $1,579 38 $218
Pharma. Biotech. & Life Sciences 129 $9,350 49 $4,487 67 $3,202
Real Estate 205 $4,157 8 $275 7 $285
Retailing 92 $499 21 $160 15 $280
Semiconductors & Semiconductor Equip. 2 $62 1 $3
Software & Services 378 $2,752 143 $1,777 209 $3,206
Technology Hardware & Equipment 25 $342 21 $719 4 $8
Telecommunication Services 34 $5,410 22 $9,678 21 $12,161
Transportation 68 $2,444 34 $811 23 $168
Utilities 138 $6,034 25 $1,672 7 $36
8
SECTOR ANALYSIS
Period Jan 1’ 10 to Oct 27’ 15

ABOUT USVCCEdge is India’s premier financial research platform providing comprehensive private and public company financial data, private equity, venture capital, M&A and debt transac-tions data, key developments of companies, and advanced search tools and download options for the users like strategy managers, investors, bankers and consultants.
It’s a fully hosted solution and users can follow private equity investments and M&A transactions, industry trends, keep track of companies and markets, generate actionable intelligence, identify targets, originate deals and research on deal multiples and valuations.
Monitor markets & companiesu Know who your competitors and peers are in your industry u Research and benchmark companies and their perfor-manceu Detailed company profiles with contact information, business description, founders and their background, management team and Board of Directorsu Investors & Subsidiaries of companiesu Key corporate developments from product/business expansion, raising capital, professional movements, M&A rumours to distress indicators u Alerts and Watchlists
Advanced search and analytical toolsu Advanced search and analytical tools for company and deal researchu Sector and sub sector wise information on companies and dealsu Screening based on funded and unfunded companiesu Geographical distribution of companies and dealsu Screening of companies based on revenues and profitsu PE/VC Deals by stages and series, control/minority, buyouts, LBOs u M&A deals research by target, buyer or selleru Search deals by investors and advisors
Corporate office:Mosaic Media Ventures Pvt. Ltd.A - 83, Sector - 2, Noida, U.P. - 201301Phone: 0120-4171111 Email: [email protected]
Sales office:Dow Jones & Co. Unit 93, 9th Floor. 2 North Ave., Maker Maxity Bandra Kurla Complex, Bandra (East), Mumbai 400051, India. Phone: 022-61456100