vce physics unit 2 detail study 3.1 astrophysics physics unit 2 detail study 3.1 you have chosen to...
TRANSCRIPT
VCE Physics Unit 2
Detail Study 31
Astrophysics
Workbook
Name School
2
Victorian Space Science Education Centre 400 Pascoe Vale Road Strathmore Vic 3041 wwwvssecviceduau This program was developed in conjunction with the CSIRO Australia Telescope National Facility (ATNF)
VCE Physics Unit 2 Detail Study 31 You have chosen to participate in the VCE Astrophysics program at the Victorian Space Science Education Centre (VSSEC) On completion of all the components you will have covered all the key knowledge in this detailed study You would have already completed a lesson at school If you undertook Unit 1 Detail Study 31 Astronomy in semester one this would have been a brief review If you did not completer Unit 1 Detail Study 31 it would have been a brief introduction to your work today
Program for the day
930 Welcome and introduction to the Centre and facilities 945 Massimo Room
Introductory lesson Galactic Explorer
1145 Short break 1200 Theatre
ESA Movie 1245 Lunch 115 Massimo Room
Theories on the origin of the Universe Star Catalogues part 2 Introduction to the Hipparcos database
245 Finish
Assessment This workbook contains the theory and questions related to the practical investigation you will complete at VSSEC This practical investigation will form the major component of your assessment for this detailed study Your teacher may also chose to set an assignment or test based on the material covered in this workbook This workbook is designed to be used in conjunction with the oral presentations and activities you will complete at VSSEC The workbook contains the theory covered in each activity additional support material and the assessment tasks We hope you find the information interesting if you would like to further your investigation of astrophysics links to additional material are provided The information required to answer the questions will not necessarily be given sequentially However by the end of the day you should have covered all the theory and answered all the questions
4
Galactic Explorer Program As you discovered in your pre-visit lesson observations made by ground-based telescopes are restricted by our atmosphere Space-based telescopes are also limited in the data they can collect by such factors as cost instrumentation and life span The ability to travel to the stars to collect data directly would eliminate all these problems The Galactic Explorer was designed by 4th year students from Latrobe Universityrsquos Games Technology Centre as a summer scholarship provided by the Victorian Space Science Education Centre You will use this software to visit a variety of types of stars in our galaxy and investigate their properties As you visit each star you will collect data from the star which you will record in your workbook as well as on the screen Initially you may not know much about the astronomical concepts you will encounter but as you work through the program these concepts will be explained Astronomy is often the collection of a large amount of data which then needs to be interpreted in order to understand it The activities in the afternoon will draw together all the concepts examined in the movie and through using the Galactic Explorer and your workbook The Galactic Explorer Program will allow you to through visiting a range of stars
Collect data about each of the stars you visit and plot them on a Hertzsprung-Russell Diagram
Investigate binary stars (Note that the program is accurate in its positional and distance information of stars but to make them easier to see the rotation of binary stars is speeded up and the distance between each star of the binary system is exaggerated There are more complex star systems in the galaxy but we have restricted the star systems to binary stars)
Investigate Cepheid variables Through these visits you will learn more about the range of stars in the galaxy and how we measure distances to stars and other galaxies Since it takes time to travel to different stars you will be directed to a number of activities in your workbook which will explain or extend the activities you do with the program The ship is fusion powered so it does require hydrogen You will need to keep track of your fuel level and re-fuel periodically in order to complete your mission Some stars have a hydrogen store that can be tapped these stars are marked When you refuel you will complete a related activity in your workbook If you run out of fuel you will be stranded until the refueling ship is sent Space travel is hazardous As you complete your tasks you will be faced with a number of events that could affect the success of your mission Some can be avoided others cannot Information about the event can be found in the event box on the screen Good luck
5
Operation of the program When you start up the program you need to select the spacecraft that you wish to use
Fig 1 Spacecraft selection Fig 2 Galactic Explorer main screen
Once you have selected your spacecraft you will enter the program and the screen in Fig 2 will appear The program is quite intuitive to use but if you are not sure of any feature please refer to the help section below
Useful Tips
To change the position of the camera hold down the left mouse button and move the mouse This will rotate the camera about the current focal point
To travel to a star you must first select it which you do from the Star list Your mission must include the stars listed but then you will be able to go to any star To reduce travel times it is desirable to select stars from the closest to ship button You can select a star from the star field by place the cursor over a star and right clicking but you could select a star that is a long way away and will take a significant time to travel to
Once you have selected a star press the Travel To Star button You will see the camera rotate in behind your ship The pre-engine burn alignment procedure will then begin Remember that the further away a star from your position the longer it will take to reach it
Initially there will only be limited information in the star information panel Once you have traveled to a star you must analyse it To do this press the Scan Nearest Stars button This will add the star to the Hertzsprung-Russell diagram and present you with any additional data that was mined from the scanning progress
6
You may view the Hertzsprung-Russell diagram at any time by pressing the appropriate button Initially there will be no stars on the diagram One of the primary objectives is to build up this plot by analysing as many stars as possible during the mission
If a star is a binary system information regarding binary stars and the types of them will appear
You will notice that the starrsquos position is given If you are in Galactic View mode the star position will be given as three numbers These numbers indicate the stars position relative to the Galaxys centre These are Cartesian coordinates
If you are in the Earth View mode the position will be given by right ascension RA and declination Dec Right ascension measures the longitude of a star in hours minutes and seconds Declination is a measure of how far from the celestial equator a star is It is measured in degrees and seconds
Mission Objective Your mission objective is to collect data from as many stars as possible As you visit each star you must record the information in Table 1 of your workbook and record the information on the Hertzsprung-Russell diagram You will need to complete the Hertzsprung-Russell diagram in the Galactic Explorer and in your workbook (Fig 4) During your mission you must collect data from a minimum of 20 stars These may be visited in any order but should include Alpha Centauri A amp B
Sirius LHS 58 A HD 205905 LHS 3359 CHI-1 Orionis A Wolf 363 Altair On completion of your mission you will know how to use the data collected from stars to formulate meaningful hypotheses as to nature of our universe
Fig 3 Astrophysics Timeline
7
Notes
8
Hertzsprung-Russell Diagram Graphing or plotting data is an essential tool used by scientists In attempting to make sense of data and see if two quantities are related we can plot them and seek trends One of the most useful and powerful plots in astrophysics is the Hertzsprung-Russell diagram (hereafter called the H-R diagram) It originated in 1911 when the Danish astronomer Ejnar Hertzsprung plotted the absolute magnitude of stars against their colour (hence effective temperature) Independently in 1913 the American astronomer Henry Norris Russell used spectral class against absolute magnitude Their resultant plots showed that the relationship between temperature and luminosity of a star was not random but instead appeared to fall into distinct groups When you plot the stars on the HR diagram using the Galactic Explorer program please also plot the positions on the HR diagram below
Fig 4 Hertzsprung-Russell diagram
9
Table 1 Data record sheet
Star Name Multiple System
(YN)
Distance from earth (light year)
Spectral Class
Absolute Magnitude
Apparent Magnitude
Parallax (milli-
arcseconds)
B-V Colour
Surface Temp (oK)
Mass (relative to
the sun)
Radius (relative to the sun)
Luminosity (solar units)
Sun (Sol) N 8min G2V 48 -268 NA 5780 1 1 1
10
Galactic Explorer Workbook Activities
Resolution and Sensitivity By obtaining and analysing the spectrum from a distant object astronomers can identify what type of object it is and determine a wealth of characteristics for the object These include its effective temperature how fast it is rotating and whether it is moving towards or away from us how large and dense it is and what it is made of To achieve this a telescope requires high sensitivity and high resolution Sensitivity is a measure of the minimum signal that a telescope can distinguish above the random background noise The more sensitive a telescope the more light it can gather from faint objects Resolution The higher the resolution of a telescope the more details we can see from the images obtained on it The theoretical resolving power of a telescope can be determined by the expression
Where θ = angular separation (in radians) λ = wavelength of light being collected D = diameter of the primary mirror or lens D and λ must both be in the same unit and this only applies where the size of the primary D is gtgt λ A more practical version of this equation expresses the theoretical value of the resolution in units of arcseconds (also written as arcsec as or )
There are 60 arcsecs in 1 arcminute and 60 arc minutes in 1 degree of arc 1 arcsec = 1(60x60) = 13600th of a degree From this equation we can see that the larger the diameter of the mirror the smaller the value of θ the theoretical resolution A large telescope therefore theoretically can resolve more detail than a small telescope at a given wavelength Question 1 Calculate the resolution of an 8m telescope compared to the human eye Give your answer in arcseconds Assume that a fully-dilated pupil has a diameter of 7mm and we are observing in yellow light at a wavelength of 550nm Resolution of human eye Resolution of 8m telescope
11
Parallax
One of the purposes of the Galactic Explorer is to introduce ways of calculating distances to the stars Using stellar parallaxes is one way of doing this When you visit stars the parallax information is given
By measuring the parallax angle for a star astronomers can then directly determine its distance In reality it is not quite so simple for several reasons The angle of parallax for even the closest stars is always lt 10 arcsec so careful observation and precision is required Also stars actually do appear to move across the sky relative to other stars in a definite direction over time This is called proper motion and must be accounted for when determining parallaxes
Fig 5 Parallax CAREFUL This diagram IS NOT TO SCALE In reality the triangle formed by the Earth at July the Sun and the nearby star is much narrower as even the nearest star is at a large distance The parallax angle p is extremely small For triangles with one very small angle we can apply the small angle approximation
tan p asymp p
This then means that the Earth - star and Sun - star distances are the same that is d The closer a star is to us the larger its angle of parallax will be Astronomers have defined a standard unit of distance to be the parsec (pc) One parsec is the distance to a point in space that subtends a parallax angle of one arc second This produces the simple but effective relationship
d = 1p Where d = distance (in parsecs) p = parallax angle (in arcsec)
12
Astronomers also measure distances in light years Recall that a light year is simply the distance that light travels in one year As light travels at 300000 km per second in a vacuum the total distance light travels in a year is approximately 30 times 10^8 times 60 times 60 times 24 times 365 asymp 946 x 10^15 m or almost 10 million million km 1 parsec asymp 326 light years Question 2 Calculate the distance to our closest star a small red dwarf M5 class star called Proxima Centauri in parsecs and light years if Proxima Centauri has a parallax of 0772rdquo (772 milliarcseconds)
parsecs light years
Question 3 Choose two stars to which you have traveled in the Galactic Explorer From the star information panel write down the parallax angle as given and calculate the distance to the star in parsecs and then light years Is the distance calculated by the Galactic Explorer correct Note The Galactic Explorer program
shows parallax in milli-arc seconds Star 1
parsecs
Star 1 light years Star 2
parsecs
Star 2 light years
13
Doppler Shift The radial velocity of object is how fast it is moving towards or away from us along our line of sight This is measured by measuring the Doppler shift of spectral lines in that objects spectrum If we obtain a spectrum from an object at rest to us then there is no Doppler shift in the spectrum If an object such as a star was moving away from us then the spectral lines would appear to shift towards the longer wavelength or redder part of the spectrum Such a shift is termed a redshift The amount of the shift would depend on the relative velocity between source and observer The greater the recession velocity the greater the shift in the lines In cases where an object is moving towards us its spectral lines will appear to shift to the shorter wavelength bluer part of the spectrum This is called a blueshift Again the amount of blueshift will depend upon the relative velocity between source and observer
Fig 6 Doppler shift
Binary Stars A binary system is simply one in which two stars orbit around a common centre of mass that is they are gravitationally bound to each other Perhaps up to 85 of stars are in binary systems with some in triple or even higher-multiple systems The orbital periods and distances of binaries vary enormously Some systems are so close that the surfaces of the stars are practically touching each other and can exchange material Others may be separated by a few thousand Astronomical Units and have orbital periods of hundreds of years
Fig 7 Binary star system
14
Even though it looks like in the diagram that the stars will collide they are actually rotating around the centre of mass of the system so unless the orbit is perturbed in some way they do not When we use the program Celestia this afternoon this is shown clearly
Question 4 From the Galactic Explorer program describe what a visual binary system is Question 5 Using the diagram below and information from the Galactic Explorer explain what a spectroscopic binary is Use the principle of Doppler shift in your explanation
Fig 8 Spectroscopic binaries
15
Spectral class Effective temperature Isaac Newton showed that a glass prism could be used to split sunlight into a spectrum in 1666 Further studies by William Wollaston in 1802 revealed some black lines on the component colours of the solar spectrum More detailed observations by Joseph von Fraunhofer resulted in 574 of these lines being mapped by 1815 These lines were named Fraunhofer lines in his honour The image below shows a solar spectrum with Fraunhofer lines
Fig 9 Suns Spectrum showing Fraunhofer lines copyDelbouille et al 1972 Two key questions arise from studying these lines - what do they represent and how are they formed The solutions to these questions were to take some time Leon Focault matched the lines produced by a sodium lamp with some of the dark lines in a solar spectrum in 1849 In 1857 Gustav Kirchoff and Robert Bunsen identified sodium in a solar spectrum They found that a luminous solid or highly compressed hot gas could produce a continuous spectrum whilst a diffuse hot gas produced a spectrum with narrow bright lines on a black background As spectroscopes were coupled to telescopes additional chemicals were identified in the spectra of stars and nebulae Spectra can be simplified to one of three basic types Simple examples in the visible wavebands are shown below
Type of Spectrum Photographic example
Continuous (or continuum)
Absorption (dark line)
Emission (bright line)
Fig 10 Types of Spectrum
This can be used to determine the effective temperature of the star Stars of different temperatures size and composition will have different spectra but most exhibit absorption lines The study of many thousands of stellar spectra in the late Nineteenth Century led to the development of our modern classification system for stars The overall spectrum of a galaxy is simply the combined spectrum of all the stars and other radiating matter in the galaxy As galaxies vary in structure and relative composition of star type and gas their spectra will vary The key factor at work here is temperature By temperature we really mean the effective temperature of the star (sometimes called the surface temperature) This is the temperature of a black body having the same size and luminosity as the star The variations in spectral lines for different stars are due primarily to the difference in temperature of the outer layers of gas in the star The standard spectral class classification scheme is thus based on temperature Most stars fit into one of the following types or spectral classes O B A F G K M These classes go from hot to cool with O the hottest and M cool Recent discoveries have led to tentative new classifications for even cooler L-class stars
16
The letters assigned to each class seem confusing and out of order This is an historical artefact as classes were assigned to spectra before the underlying physical relationship was known Rather than reassign letters to different spectra some classes were merged and the whole sequence arranged in order of decreasing temperature The basic system of a letter to denote spectral class is further refined by adding a number from 0 to 9 following it Each spectral class is thus broken down into ten subdivisions so that for example an F2 star is hotter than an F7 star The basic characteristics of each spectral class are summarised in the following table The four columns on the right of the table provide comparison of a stars mass radius and luminosity (power output) with respect to the Sun and the main sequence lifespan for a star of that spectral class
Spectral Class
Effective Temperature (K)
Colour H Balmer Features
Other Features
MMSun RRSun LLSun Main Sequence Lifespan
O 28000 - 50000 Blue weak
ionised He+ lines strong UV continuum
20 - 60 9 - 15 90000 - 800000
1 - 10 Myr
B 10000 - 28000 Blue-white
medium neutral He lines
3 - 18 30 - 84 95 - 52000
11 - 400 Myr
A 7500 - 10000 White strong
strong H lines ionised metal lines
20 - 30 17 - 27 8 -55 400 Myr - 3 Gyr
F 6000 - 7500 White-yellow
medium weak ionised Ca+
11 - 16 12 - 16 20 - 65 3 - 7 Gyr
G 4900 - 6000 Yellow weak ionised Ca+ metal lines
085 - 11
085 - 11
066 - 15
7 - 15 Gyr
K 3500 - 4900 Orange very weak
Ca+ Fe strong molecules CH CN
065 - 085
065 - 085
010 - 042
17 Gyr
M 2000 - 3500 Red very weak
molecular lines eg TiO neutral metals
008 - 005
017 - 063
0001 - 008
56 Gyr
L lt2000 Tentative new (2000) classification for very low mass stars
lt008 May or may not be fusing H in cores
Table 2 Spectral Class structure
17
Question 6 What is the hottest star you have visited using the Galactic Explorer What class is this star Why do you think you didnrsquot find stars hotter than this
Fig 11 The electromagnetic spectrum and spectral class
18
Notes
19
Distance to stars
Study the star field photograph shown below It shows a region of the sky around the constellation Crux commonly called the Southern Cross Which star is brightest
Fig 12 Southern Cross A photograph such as this shows bright stars as larger disks than fainter stars Does this mean that these stars are physically larger than the fainter stars in the photo Why then do some appear brighter (to our eyes) or larger (in photographs) than others What in fact is brightness and how can we measure it One point to remember about constellations is that the stars within a constellation are not usually physically associated with each other unlike stars in clusters The fact that they appear close together is purely an alignment effect along tour line of sight In fact the stars in the region above are widely separated in distance from us as shown in the next image
Fig 13 Southern Cross adapted from an image by copy P Caldwell It is straightforward to use shoe box to make a 3D model of the Southern Cross You may like to do this The concept of measuring and comparing the brightness of stars can be traced back to the Greek astronomer and mathematician Hipparchus In his system the brightest stars were assigned a magnitude of 1 the next brightest magnitude 2 and so on to the faintest stars just visible to the unaided eye which were magnitude 6
Apparent Magnitude
The apparent magnitude m of a star is the magnitude it has as seen by an observer on Earth A very bright object such as the Sun or the Moon can have a negative apparent magnitude Even though
20
Hipparchus originally assigned the brightest stars to have a magnitude of 1 more careful comparison shows that the brightest star in the night sky Sirius or α Canis Majoris (CMa) actually has an apparent magnitude of m = -144 With the recalibration of Hipparchus original values the bright star Vega is now defined to have an apparent magnitude of 00 The apparent magnitude of a star depends partly on its distance from us In fact Sirius appears brighter than Betelgeuse precisely because Sirius is very close to us only 26 pc away whereas Betelgeuse is about 160 pc distant The realisation that stars do not all have much the same luminosity meant that apparent magnitude alone was not sufficient to compare stars A new system that would allow astronomers to directly compare stars was developed This system is called the absolute magnitude M
Absolute Magnitude A star may appear bright for two main reasons it may be intrinsically luminous that is it may be a powerful emitter of electromagnetic radiation or it may be very close to us or both The absolute magnitude M of a star is the magnitude that star would have if it were at a distance of 10 parsecs from us A distance of 10 pc is purely arbitrary but now internationally agreed upon by astronomers The scale for absolute magnitude is the same as that for apparent magnitude that is a difference of 1 magnitude = 2512 times difference in brightness Most stars are too distant to have their parallax measured directly Nonetheless if you know both the apparent and absolute magnitudes for a star you can determine its distance
Luminosity The absolute magnitude of a star is a simple way of describing its luminosity Luminosity L is a measure of the total amount of energy radiated by a star or other celestial object per second This is therefore the power output of a star Fundamentally there are just two key properties that determine the intrinsic power output or luminosity of a star - the effective temperature Teff and the size of the star its radius R Temperature A black body radiates power at a rate related to its temperature - the hotter the black body the greater its power output per unit surface area This relationship helps account for the huge range of stellar luminosities A small increase in effective temperature can significantly increase the energy emitted per second from each square metre of a stars surface Size (radius) If two stars have the same effective temperature but one is larger than the other it has more surface area The power output per unit surface area is fixed so the star with greater surface area must be intrinsically more luminous than the smaller one
Question 7 α Centauri has an apparent magnitude of -03 and β Centauri has an apparent magnitude of 03 which means that they are both first magnitude stars of similar apparent brightness Use Figure 13 to explain what this implies about their absolute magnitude and luminosities
21
Cepheids
Cepheids are very luminous massive variables with periods of 1 -70 days Cepheid light curves are distinctive and show a rapid rise in brightness followed by a more gradual decline shaped like a shark fin Their amplitude range is typically 05 to 2 magnitudes The spectral class of a Cepheid actually changes as it pulsates being about an F at maximum luminosity and down to a G or K at minimum
Fig 14 Light curve for δ Cephei There are two types of Cepheids the original Type I or Classical Cepheids of which δ Cephei is an example and the slightly dimmer Type II or W Virginis Cepheids Type I Classical Cepheids take their name from δ Cephei Most have a period of between 5 -10 days and an amplitude range of 05 - 20 magnitudes in visible light They are 15 - 2 magnitudes more luminous than Type II Cepheids The distinctive light curve for δ Cephei is shown in Figure 14 Some types of pulsating variable stars such as Cepheids exhibit a definite relationship between their period and their intrinsic luminosity Such period-luminosity relationships are invaluable to astronomers as they are a vital method in calculating distances within and beyond our galaxy Both types of Cepheids and RR Lyrae stars all exhibit distinct period-luminosity relationships as shown in Fig 15
Fig 15 Period luminosity relationship for Type I and II Cepheids and RR Lyrae
22
Question 8 Give the period of two Cepheid variables you have visited using the Galactic explorer From its position on the Hertzsprung-Russell diagram give the luminosity and spectral class of these two stars Star 1 Name Period Luminosity Spectral class Star 2 Name Period Luminosity Spectral class
Standard Candles The term standard candle applies to celestial objects with well-defined absolute magnitudes which are assumed to not vary with age or distance Type I and II Cepheids and RR Lyraes are all examples All Cepheids with a certain period are assumed to have the same absolute magnitude Measuring the apparent magnitude of a Cepheid then allows us to determine its distance using the period-luminosity relationship If two Cepheids have the same period but one is fainter than the other it must be further away RR Lyraes similarly can be used as standard candles although as their intrinsic luminosity is lower than Classical Cepheids they cannot be detected at the great distances of Cepheids Other stellar objects can also be used as standard candles such as type 1a supernovae These are discussed in the movie
Fig 16 1987A supernova remnant near the center
23
The Sun
The Sun is an ordinary G2 star Even so it seems gigantic by our standards The mass of all the planets moons asteroids and comets combined is insignificant by comparison The sun makes up approximately 9877 of the solar systems total mass The Sun is also very active violent events like solar flares are common Solar flares are huge releases of energy The Suns extreme heat (of up to 15 million degrees Celsius) can be traced back to its core Nuclear reactions are constantly occurring there releasing huge quantities of energy which eventually travel to the surface Right now hydrogen atoms in the Suns core are fusing together to create helium Currently three quarters of the Sun is hydrogen and one quarter is helium but this ratio changes slowly time passes Some statistics of the Sun Diameter 1392times106 km
Mass 1988 435(27) times 1030 kg Absolute Magnitude 48m Actual Luminosity 3827x1026 W
Question 9 What Spectral class does the Sun belong to What does this tell us about the sunrsquos temperature Why is luminosity given as 1 in Table 1
Calculate the surface area and density of the Sun
Fig 17 Spectroheliograph image of the sun taken aboard Skylab in 1973 using the extreme ultraviolet radiation from ionized helium 304 Angstom wavelength
24
Refueling the Galactic Explorer Fusion is an atomic reaction that fuels stars The Galactic Explorer uses fusion to power the spacecraft Question 10 From the information given in the Galactic Explorer What is the most abundant element in our universe What is the overall reaction for hydrogen nuclear fusion in stars How is energy created in this process What famous equation relates to this process What does this equation mean
Fig 18 Stellar fusion
25
Using the H-R Diagram to Infer Stellar Properties
The H-R diagram below has a few specific stars included in the plot but otherwise just shows the main regions
Fig 19 Completed H-R diagram It can be seen that stars are not randomly scattered but are fall into particular groups However how do we know this information about the stars It would be easy if we could travel to the stars along the lines of the Galactic Explorer but obviously we cannot However we can use parallax to measure distances to representative stars We then assume if another star much further away has a similar spectrum then it is a similar star in brightness This was one of the early ways of measuring the distances to stars The majority of stars including our Sun are found along a region called the Main Sequence Main Sequence stars vary widely in effective temperature but the hotter they are the more luminous they are hence the main sequence tends to follow a band going from the bottom right of the diagram to the top left These stars are fusing hydrogen to helium in their cores Stars spend the bulk of their existence as main sequence stars Other major groups of stars found on the H-R diagram are the giants and supergiants luminous stars that have evolved off the main sequence and the white dwarfs Whilst each of these types is discussed in detail in later pages we can use their positions on the H-R diagram to infer some of their properties
26
We have looked at fusion reactions earlier Stars on the main sequence fuse hydrogen The more massive the star the brighter (and bluer) it is However what happens when most of the hydrogen has been converted to helium Gravity takes over and the star starts to collapse and heat up It then starts to fuse helium This process causes the star to expand and form a red giant (for stars the size of our sun) or if it was much more massive a red supergiant
Stars like our sun move through the HR diagram as follows
Fig 22 Life cycle of the Sun
Fig 20 Main sequence star
Fig 21 Red giant
27
Helium forms heavier elements such as carbon and oxygen Our sun will enter this stage in about 5 billion years Once the helium is used up the star blows off its outer atmosphere to form a planetary nebula the star itself collapses and forms a white dwarf Eventually the planetary nebula dissipates just leaving the white dwarf This will be the final fate of our sun But as we saw in the movie this morning we will have collided with the Andromeda galaxy before this Whether this will affect the sun we cannot know
Fig 23 Butterfly nebula (Planetary nebula) Stars heavier than 5 to 8 solar masses form red super giant stars They continue to fuse the elements forming all of the elements up to iron These stars finally explode forming supernovae Elements heavier than iron are formed in this case Either a neutron star or black hole will result Maybe a black hole is lurking out there quite close to the solar system
Question 11 Since there are elements heavier than iron present on earth what must have occurred in our vicinity before the Sun formed
Fig 24 Red super giant
28
Galaxies and Red Shift There are at least 100 billion galaxies in the universe Interestingly there are only 3 major types of galaxy with subsets of each type
Fig 25 Types of galaxies
Fig 26 Examples of galaxies
Question 12
What type of galaxy is each of the 3 galaxies shown
Galaxy NGC 1569
Sombrero Galaxy Whirlpool Galaxy
29
Red Shift of Galaxies The further away a galaxy is the more its spectrum is red shifted This red shift is caused through the expansion of the universe We can use the red shift to calculate how far away the galaxies are to give us the scale of the universe To work out the age of the universe we need to work out the rate of expansion of the universe This rate of expansion is called the Hubble constant Ho This constant is very important to work out because it allows us to calculate the age of the universe There have been a range of values given from 50 to 100 which gives an age of the universe from about 20 billion years less than 10 billion years The problem with the lower limit is that there are globular stars clusters that are older than 10 billion years We need to be able to accurately determine the Hubble constant and so we need to have our ldquostandard candlerdquo distance measurers as accurate as possible Fig 27 Redshift of a cluster of galaxies compared to the Sun spectrum
Origin of the Universe
All theories on the origin and evolution of the universe must take into account the expansion of the universe The Steady State Theory was proposed in 1948 by Hermann Bondi Thomas Gold and Fred Hoyle The Universe they proposed was infinite in size and did not have a beginning Since the Universe is expanding new matter has to appear In its simplest form they proposed that hydrogen atoms were
spontaneously created at the rate of a few atoms every couple of cubic metres every year which would
be almost undetectable This amount was sufficient to provide enough material for new stars and galaxies
Fig 28 Steady State Theory showing new galaxies forming as the universe expands
The Steady State Theory assumed that the universe was of similar composition no matter where you looked However in the 1960s it was discovered that there were objects such as quasars were found in the distance universe (ie in the distant past) but not close to us In 1965 the cosmic microwave background was discovered The Steady State theory could not explain this The Big Bang theory states that a tremendous explosion started the expansion of the universe At the point of this event all of the matter and energy of space was contained at one point What existed prior to
30
Fig 28 Hipparcos spacecraft
the Big Bang and what caused it is not known although it is thought that some sort of quantum process was involved The Big Bang was not a conventional explosion but rather an explosion of space with all the particles of the early universe rushing away from each other The remains of the hot dense state is the microwave background
Fig 29 The Background Microwave Radiation
It also appears that the Universe rapidly inflated in size due to a rapid expansion of space This occurred in the first tiny fraction of a second Our observations of the Universe also show that there is a lot more mass in the Universe than we can see This mass is called dark matter and it is not yet clear what it is There are still some questions that cannot be easily answered Cosmologists are working on a theories of quantum gravity which will hopefully provide answers
Star Catalogues
The movie we saw this morning provide a further illustration how improvements in technology can alter our understanding of the universe The movie mentioned Cepheid Variables as distance measurers and also type 1a supernova can also be used According to our understanding type 1a supernovae have a maximum magnitude of -196 which would allow us to measure distances to 4 billion light years a sizable fraction of the known universe We can measure how bright they appear to be and therefore can work out how far away they are However to calibrate these measurements we need to be able to as accurately as possible work out the distances to these stars Most distance estimations are based on our theories of how particular stars work Type 1a supernova are a good example of this But what if our theory is incomplete or in error in some way This is why it is essential that we can calibrate our ldquostandard candlesrdquo The only measurement that is not theory dependant in some way is parallax measurements Star Catalogues are lists of stars containing information such as the type of star parallax and so on The Galactic Explorer program is based on a modified form of the Gliese Catalogue which basically lists stars out to about 80 light years from earth The most detailed and accurate stellar databases available are the Hipparcos and Tycho Catalogues which were collected by the Hipparcos satellite mission The Hipparcos mission was the first space experiment dedicated to astrometry and was developed by the European Space Agency The Hipparcos Catalogue the primary result of the observations and reductions of the satellite-acquired data contains 118 218 entries with median astrometric precision of around 1 milliarcsec and specific results for double and multiple star systems The satellite flew from 1989 to 1993 but it took 4 years to process the data which was released in 1997
The Tycho Catalogue of slightly more than 1000000 objects has been constructed in parallel with the construction of the Hipparcos Catalogue and has a median astrometric precision of 7 milliarcsec for stars
31
less than 9 magnitude and 25 milliarcsec for stars between 9 and 11 magnitude The majority of stars contained in the Hipparcos Catalogue are also contained in the Tycho Catalogue As a reminder an arcsecond is the angle subtended by a 50 cent coin at a distance of 35 km The Hipparcos mission measured to better than one 1 milliarcsecond which would place the 50 cent coin at a distance of 35 km Question 13 How distant is a star at the limit of Hipparcosrsquo detection
Some of the spectacular achievements of the Hipparcos mission (some of which were mentioned in the movie this morning) giving us an unprecedented 3-D picture of the distances and movements of stars in the vicinity of the Sun and the Earth Data helped to predict the impacts of Comet Shoemaker-Levy 9 on Jupiter By measuring the proper motion of stars stars that will pass close to the Sun have been identified Knowing the distances to stars that possess planets allows us to more accurately determine the types and masses of the planets orbiting the star Data from Hipparcos has forced us to rethink aspects of our galaxies It cut the distance of the Pleiades cluster forcing a rethink about star theories It also discovered that the Milky Way is changing shape and identified a group of stars that invaded our Galaxy when it was young confirming that the milky way did ldquoswallow uprdquo nearby dwarf galaxies The accurate measures recalibrating our ldquostandard candlerdquo distance measures altered the cosmic distance scale making the Universe bigger and younger For example stars in globular clusters seemed to be older than other estimates of the age of the universe However by accurately measuring distances to stars of the same spectroscopic type to those in globular clusters the age of these clusters were revised Now the stars do appear to be younger than the universe which is a good thing The Hipparcos data also has confirmed Einsteins prediction of the effect of gravity on starlight to a much greater precision than previously The following is a page from the Hipparcos Catalogue It contains data for 42 stars The table leaves out about 9 columns on the variability of stars and a further 9 columns on values for data correction
Fig 29 Hipparcos and the Milky Way
32
33
Question 14 How many pages like the one above are required for the full 118218 entries
Until the event of high speed computers even the storing of this amount of Data was difficult It was 125 Gigabytes of data which in the early 1990s was very large Fortunately computation speeds and storage have increased dramatically The advantage of modern computers is that we can manipulate and view this data in a 3 dimensional form and manipulate it in real time
Celestia We used Galactic Explorer this morning this afternoon we will use another program Celestia This program is freely available on the web from httpwwwshattersnetcelestia Today you will have a brief introduction to the program by visiting the Earth and Alpha Centauri Celestia uses the data from the Hipparcos and Tycho missions Do not confuse this program with Celestia 2000 which is designed more for research purposes After the introduction screen the earth appears It is easier to test the features of the program using this screen The Mouse Functions are as follows
Left drag orient camera
Right drag orbit the selected object
Wheel adjust distance to selection
Right + Left drag adjust distance to selection
Ctrl + Left drag adjust distance to selection
Shift + Left drag change field of view (eg =gt telescopic view)
Wheel (middle button) click toggle field of view between 45 degrees and the previous field
Left - click select object
Left double click centre selection
Right - click bring up context menu
Keyboard Commands
Navigation Time
H Select the sun (Home) Space bar Stop time
C Centre on selected object L Time 10x faster
G Goto selected object K Time 10x slower
F Follow selected object J Reverse time
ESC Cancel motion or script Set time to now
Shift+Arrows Orbit object
There are a range of other keyboard functions but for todayrsquos exercise the we only need these ones
1 Use the mouse to zoom in and out on Earth 2 Press L to speed up time to 1000000 times faster 3 Over a few minutes you will notice bright dots move across the screen They are the planets Also
you will see the Sun move across
34
Question 15 The sun moves in a line across the screen against the background stars What do some of the planets appear to do To make it easier to see press P for planet labels This motion of the planets against the background of stars and there seemingly moving backwards at times (retrograde motion) distinguished the planets from the stars Go to navigation and then select tour guide Select Alpha Centauri You will then go the double star You will need to press L a few times to see the binary stars rotate Question 16 Calculate the binary starsrsquo rotation rate (ie time one rotation and then work out the amount we have sped the rotation up)
Future Missions In 2011 another astrometric satellite will be launched This is the Gaia mission and will measure parallaxes of about 1 billion stars all the way to the Galactic Centre This will give accurate distances to a wide range of different stars Our understanding of our universe depends on knowing the accurate distances to all the different types of astronomical objects This will help us confirm or cause us to modify many our current theories about the universe The movie discussed the final death of the universe in a ldquobig riprdquo The acceleration of the universe was discovered because type one supernovae at great distances appear to be dimmer than they should The distance is determined by the red shift The explanation for this is that the universe is accelerating in its expansion The cause for this is a mysterious dark energy Gaia with its very accurate measurements to calibrate our standard candles more accurately will either confirm or provide evidence for another explanation Fig 30 Planned Gaia mission
35
University Courses and Astronomy Resources
Monash University Centre for Stellar and Planetary Astrophysics (CSPA) CSPA exists to promote research into stars and planets within the Australian scientific community The courses are run by the School of Mathematics Several are offered in conjunction with other departments or schools within the Faculty of Science including School of Physics and Mathematical Engineering and the School of Chemistry Some of the courses on offer at present are
ASP 1022 - Life in the Universe ASP 2062 - Introduction to Astrophysics ASP 3012 - Stars and Galaxies ASP 3051 - Relativity and Cosmology
Students involved in third-year courses will also do some observational astronomy using telescopes in Melbourne The honours year bring students in touch with research for the first time Along with specialist lecture topics (including The Sun Planetary Dynamics General Relativity Planet Formation and Accretion Disks Computational Physics) they undertake a major project under expert supervision and an observational project using a research telescope at Siding Springs Honours students become part of CSPA with their own desks in the Centre and plenty of chance to work closely with staff and fellow studentsCSPA also hold seminars and conferences throughout the year wwwcspamonasheduau
University of Melbourne University of Melbourne Astrophysics Group The University of Melbourne offers astrophysics courses at all levels of an undergraduate physics degree as follows First year
The Solar System and the Cosmos
Stars and Galaxies Second year
Astrophysics and Optics II Third year
Astrophysics and Optics III Honours Year
As part of the Physics honours year the astrophysics group offers a range of projects in astronomy and astrophysics
Postgraduate Study The University of Melbourne offers postgraduate courses in astrophysics at the PhD MSc and Graduate Diploma levels The University of Melbourne Astrophysics Group also holds seminars and conferences during the year httpastrophunimelbeduau
36
La Trobe University The Department of Physics offers several courses in Astronomy at 1st 2nd and 3rd year level Astronomy and Space The Infinite Frontier Astronomy Decoded A Beginners Guide to Astrophysics Looking Back in Time Introductory Extra-Galactic Astronomy and Cosmology wwwlatrobeeduauspacescienceastroindexhtm
Space Physics Research Group Bachelor of Space Science (3 years duration) MSc or PhD in Space Physics wwwlatrobeeduauspacesciencespacephysprosstudentshtml
Swinburne University of Technology Centre for Astrophysics and Supercomputing Swinburne University of Technology offers a Bachelor of Science with a Computer Science major and an Astrophysics amp Supercomputing co-major httpastronomyswineduau As well as PhD by research the Centre for Astrophysics and Supercomputing also offers a range of online postgraduate courses via Swinburne Astronomy Online (SAO) They concentrate on the fundamental concepts of and key issues in contemporary astronomy Designed for science educators and communicators people working in astronomy related fields amateur astronomers and anyone with a love of astronomy The Master of Science in Astronomy is part of a nested suite of postgradaute programs which also includes the Graduate Certificate of Science (Astronomy) and the Graduate Diploma of Science (Astronomy) SAO also conduct a range of short courses for students with a general interest in astronomy (with no physics or astronomy background needed) httpastronomyswineduausao
Cosmos The Swinburne Astronomy Online Encyclopedia Cosmos is a unique astronomy reference written by research astronomers It is written for a general audience who wish to know detailed information on a wide range of astronomical topics Cosmos is an evolving resource with new entries being added all the time
httpastronomyswineduaucosmos
Space Works Swinburne SpaceWorks has created a library of 3D movies covering a variety of topics from planets to pulsars with new shows under production every year httpvrswineduau
37
RMIT University The School of Applied Science at RMIT University offers an elective course Astrophysics and Cosmology which builds on the foundation of physics laid down in the first year physics course wwwrmiteduaucourses038127
Other Australian Universities Research School of Astronomy and Astrophysics Canberra ACT httpmsowwwanueduauastronomyozcalendarshtml University of Queensland Brisbane Queensland wwwphysicsuqeduauapevents University of Adelaide Adelaide South Australia wwwphysicsadelaideeduauastrophysicsastrocalhtml University of Sydney Sydney NSW wwwphysicsusydeduauioaseminars
University of New South Wales Sydney NSW wwwphysunsweduau7Emwhitinglunch
Astronomy Astrophysics Related Resources
Melbourne Planetarium at Scienceworks httpmuseumvictoriacomauPlanetarium
Old Melbourne Observatory at the Royal Botanic Gardens Melbourne wwwrbgvicgovau
Australia National Telescope Facility Sydney NSW wwwatnfcsiroauwhats_onindexhtmlaction=eventlistampcategory=Al Square Kilometer Array The Square Kilometer Array (SKA) will be an interferometric array of individual antenna stations synthesizing an aperture with diameter of up to several 1000 kilometers The Square Kilometre Array (SKA) will probe the gaseous component of the early Universe thereby addressing fundamental questions in research on the origin and evolution of the Universe In Australia the project is being coordinated by the CSIRO ATNF For more information you can visit the international site wwwskatelescopeorg or the Australian site wwwatnfcsiroauSKA
AASTINO (Automated Astrophysical Site-Testing InterNational Observatory) The AASTINO is a joint Australia-France-Italy-US experiment to categorise the qualities of Dome C for a future astronomical observatory Dome C is an isolated site on the high Antarctic plateau The AASTINO was first deployed at Dome C in January 2003 and has operated completely unattended for over 143 days in 2003 and 100 days in 2004 The AASTINO was designed and built in the School of Physics University of New South Wales during 2002
38
The observatory located at Antarcticas Dome C is the worlds first fully-automated observatory By sending images and data back to astronomers at UNSWs school of physics it will help test the astronomers theory that the plateau is the best place on Earth for a range of astronomical observations wwwphysunsweduaunature4
Giant Magellan Telescope The Giant Magellan Telescope (GMT) is a collaborative effort between universities and research organizations to develop and build a state-of-the-art next-generation extremely large telescope In April 2006 the Australian National University joined the elite group of research and teaching institutions that are undertaking a detailed design of the telescope including the Carnegie Institution of Washington Harvard University Massachusetts Institute of Technology the University of Arizona the University of Michigan the Smithsonian Institution the University of Texas at Austin and the Texas AampM University The ANU contribution to the telescope design and future instrumentation projects will take place at the Advanced Instrumentation and Technology Centre (AITC) atop Mt Stromlo wwwgmtoorg
Anglo Australian Observatory Sydney NSW wwwaaogovauastrocolloquiameetingshtmlcoming
The Gemini Observatory The Gemini Observatory is an international partnership comprised of two 81-meter telescopes (each telescope has a main mirror over 26 feet across) One telescope is located on Hawaiis Mauna Kea and the other on Chiles Cerro Pachoacuten Australia is a partner in the Gemini Observatory along with the United States of America the United Kingdom Canada ChileArgentina and Brazil The name Gemini comes from the mythological twins whose stars are visible to both telescopes wwwgeminiedupublicpublichtml
Astronomical Society of Victoria wwwasvorgau
Astronomical Society of Australia The Astronomical Society of Australia (ASA) was formed in 1966 as the organisation of professional astronomers in Australia Membership of the ASA is open to anyone contributing to the advancement of Australian astronomy or a closely related field Australian Astronomy is the website of the Astronomical Society of Australia The website includes links to astronomical research teaching and public education facilities and activities in Australia The website also offers the opportunity to ldquoAsk an Astronomerrdquo for all those questions that have been generated by your day at VSSEC wwwastronomyorgau
Astronomy WA wwwastronomywanetau
Sloan Digital Sky Survey Sky Server is the educational home page for the Sloan Digital Sky Survey The Sloan Digital Sky Survey is the most ambitious astronomical survey ever undertaken The survey will map one-quarter of the entire sky in detail determining the positions and absolute brightnesses of hundreds of millions of celestial objects It will also measure the distances to more than a million galaxies and quasars
39
The Sky Server has a wealth of material for teachers and students at a variety of levels There are some excellent tutorials and many projects offered This educational interface provides access to the full database in a form that is easier for students to use httpskyserversdssorg
Project CLEA Project CLEA -- CONTEMPORARY LABORATORY EXPERIENCES IN ASTRONOMY ndash is a range of free laboratory exercises that illustrate modern astronomical techniques using digital data and color images They were produced by the Department of Physics at Gettysburg College under the leadership of Laurence Marschall a professor of physics and astrophysics researcher Project CLEA is funded by grants from the National Science Foundation One of the CLEA exercises was used in this program if you enjoyed this activity you can find additional free activities on their website httppublicgettysburgedu~marschalcleaCLEAhomehtml
Stellarium Stellarium is a free open source planetarium for your computer It shows a realistic sky in 3D just like what you see with the naked eye binoculars or a telescope It will calculate the positions of the Sun and Moon planets and stars and draw how the sky would look to an observer depending on their location and the time It can also draw the constellations and simulate astronomical phenomena such as meteor showers and solar or lunar eclipses wwwstellariumorg
If you want to practice your classification skills and be a part of real scientific research visit GalaxyZoo is a project which harnesses the power of the internet - and the human brain - to classify a million galaxies By taking part youll not only be contributing to scientific research youll view parts of the Universe that literally no-one has ever seen before and get a sense of the glorious diversity of galaxies that pepper the sky The human brain is much better at recognizing patterns than a computer can ever be A computer program can sort galaxies into categories with reasonable accuracy but it would also throw out the unusual the weird and the wonderful To rescue these interesting systems which have a story to tell Galaxy Zoo needs you httpgalaxyzooorg
Telescope and Astronomy Related Suppliers Astro Optical All the telescopes used during the VSSEC VCE Astronomy Program were supplied by Astro Optical VSSEC would like to thank Astro Optical for the donation of the Starry Night Pro software
40
320 St Kilda Rd St Kilda 3182 PH 9593 9512 wwwastro-opticalcomau
Astrovisuals VSSEC would like to thank Astrovisuals for the donation of the posters and star charts used during the VSSEC VCE Astronomy Program 6 Lind St Strathmore 3041 PH 9379 5753 wwwastrovisualscomau
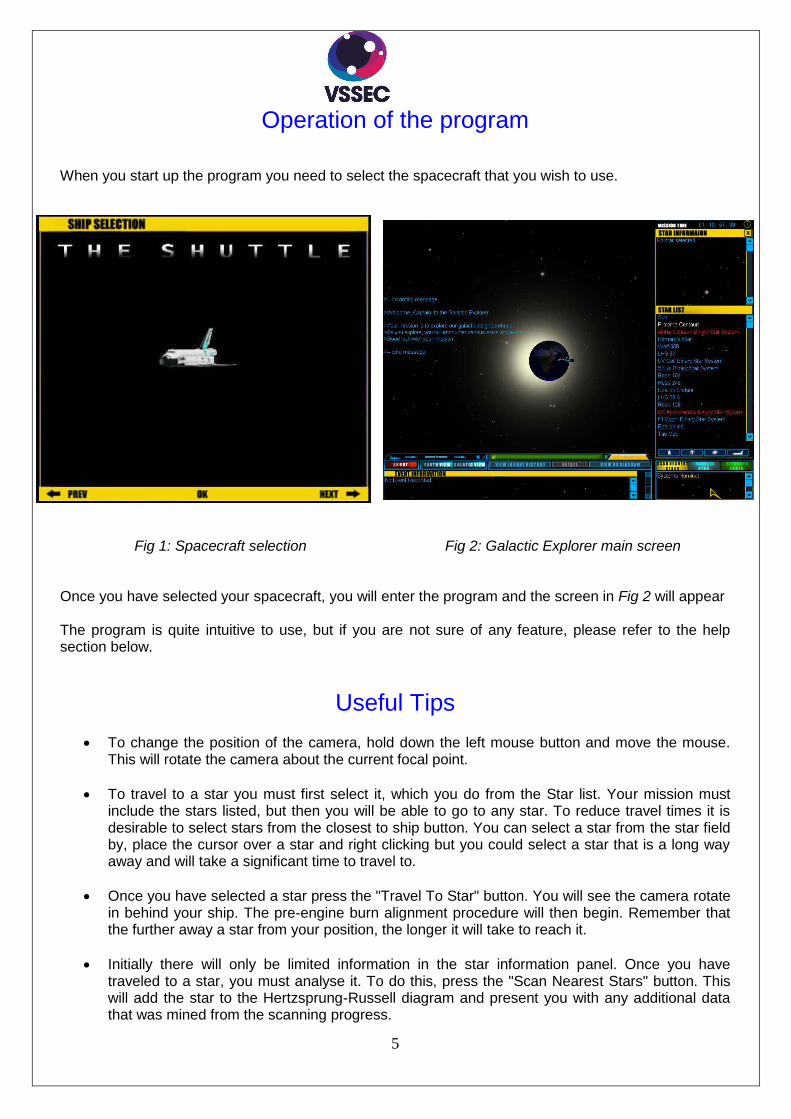
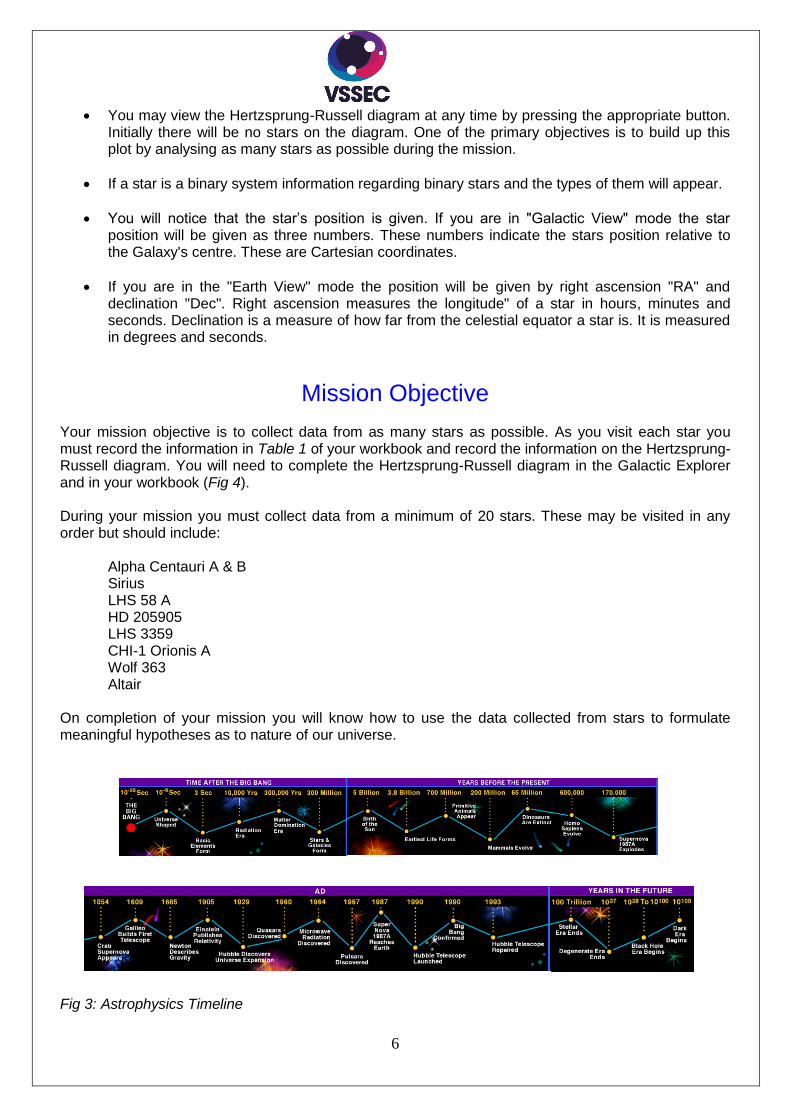
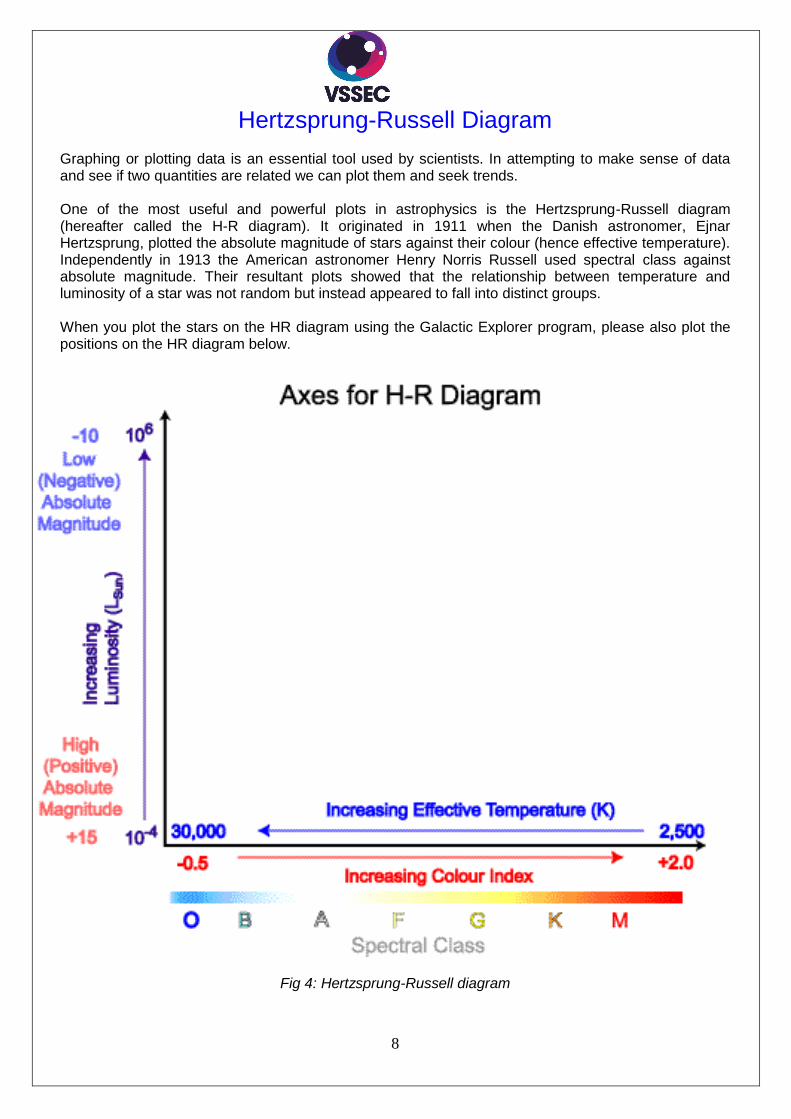
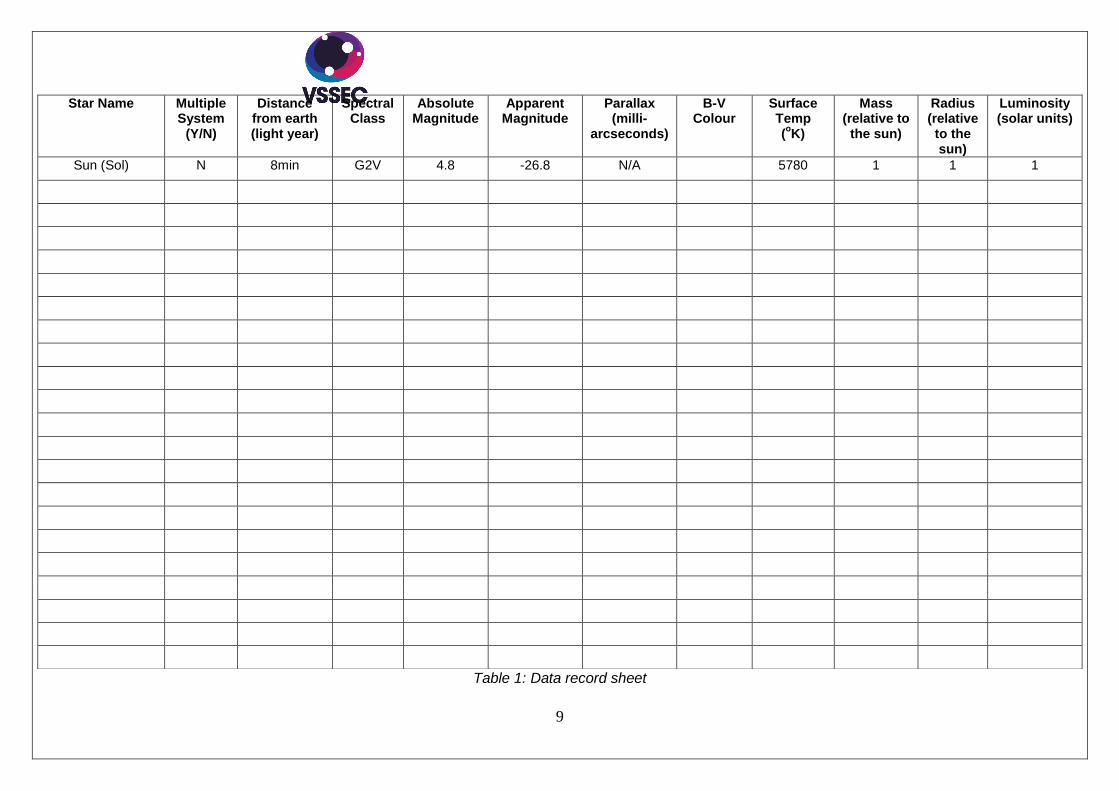
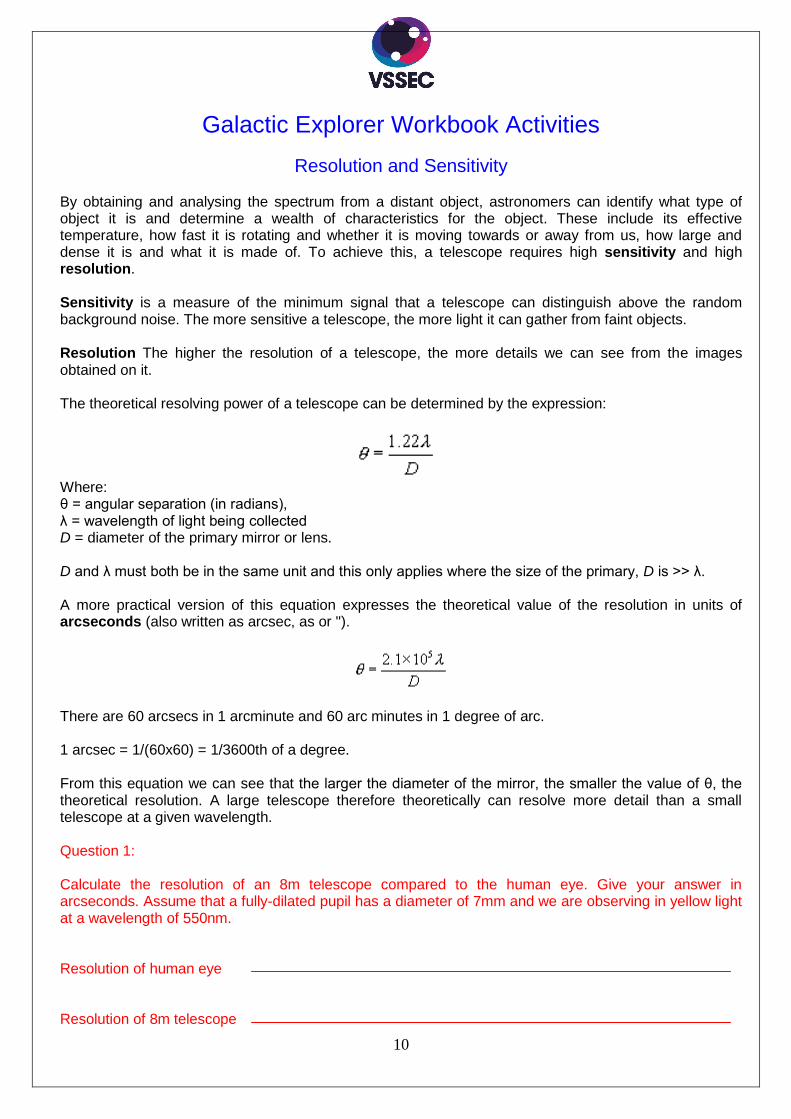
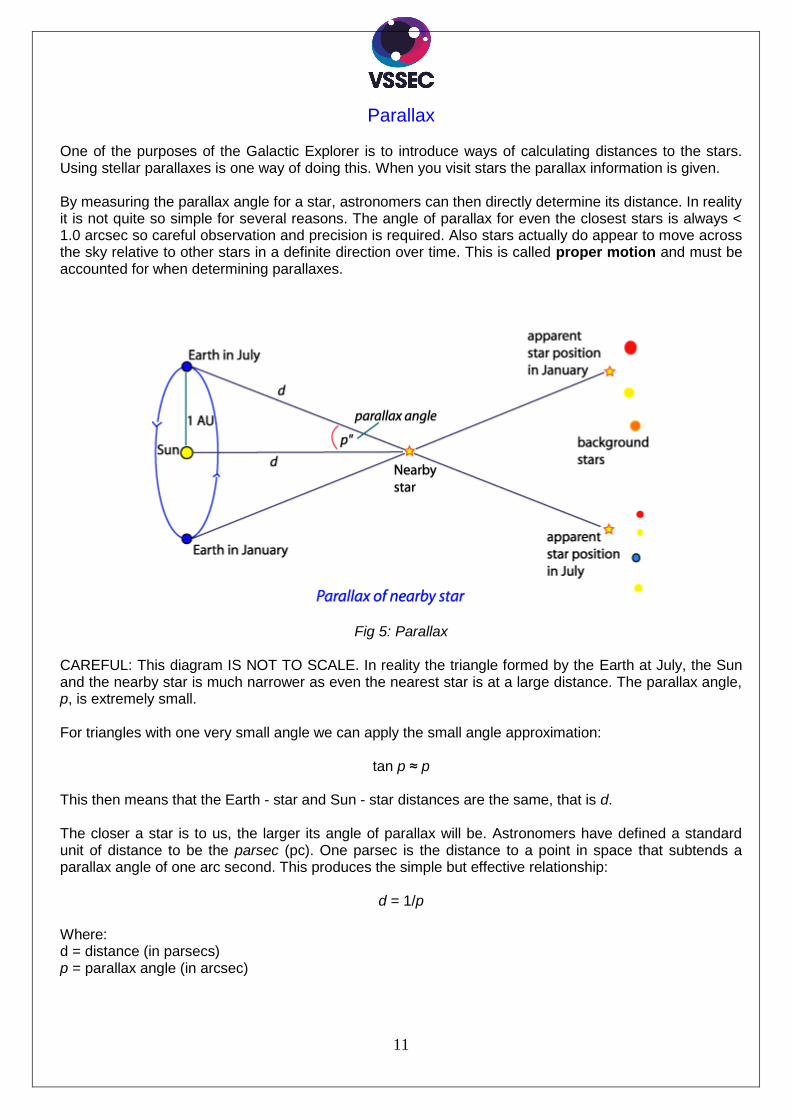
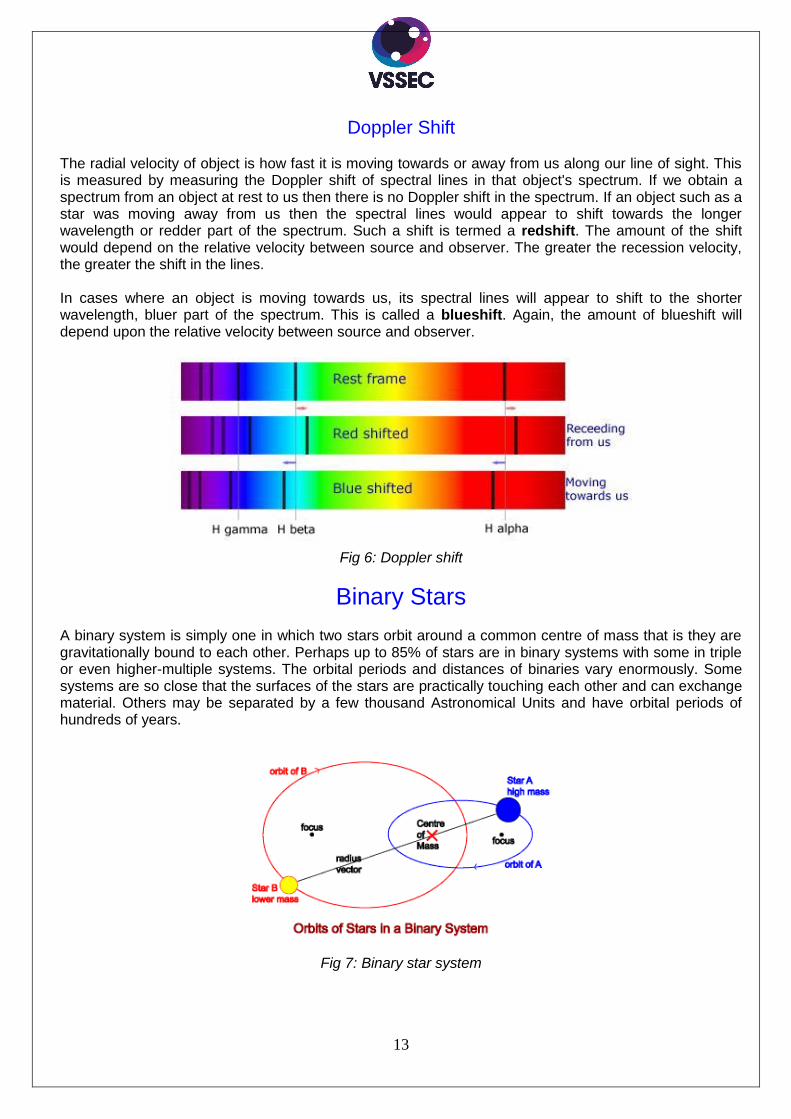
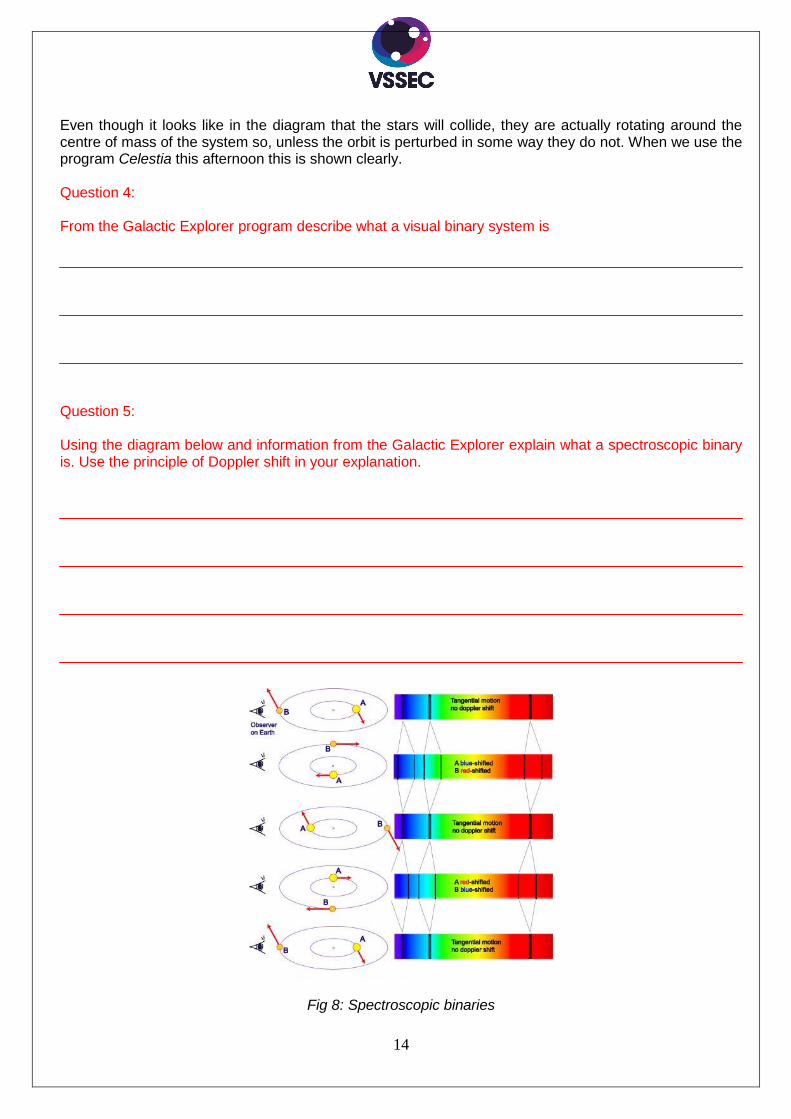
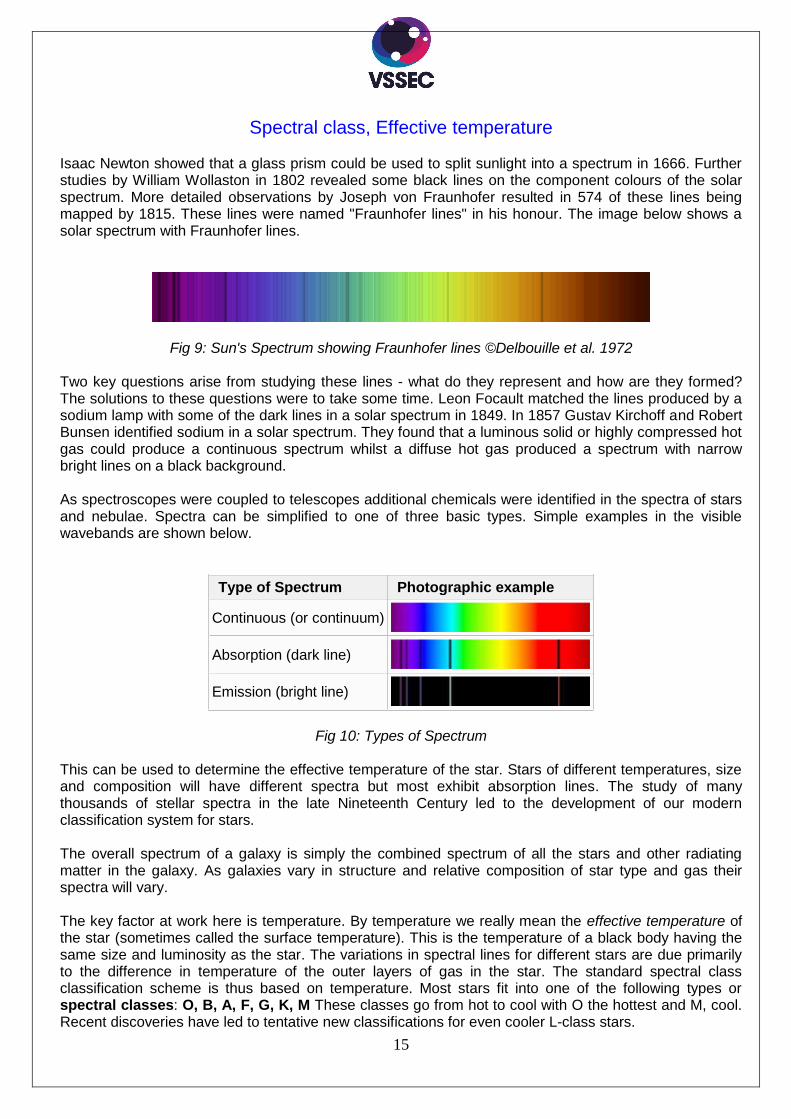
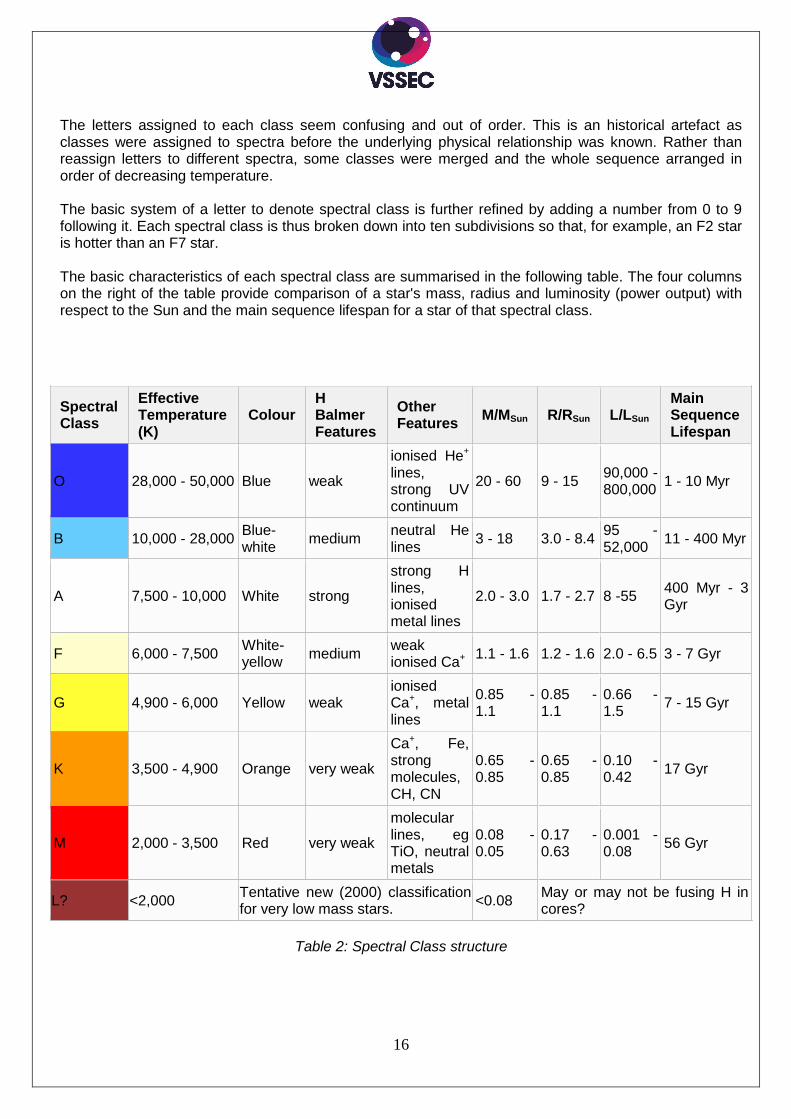
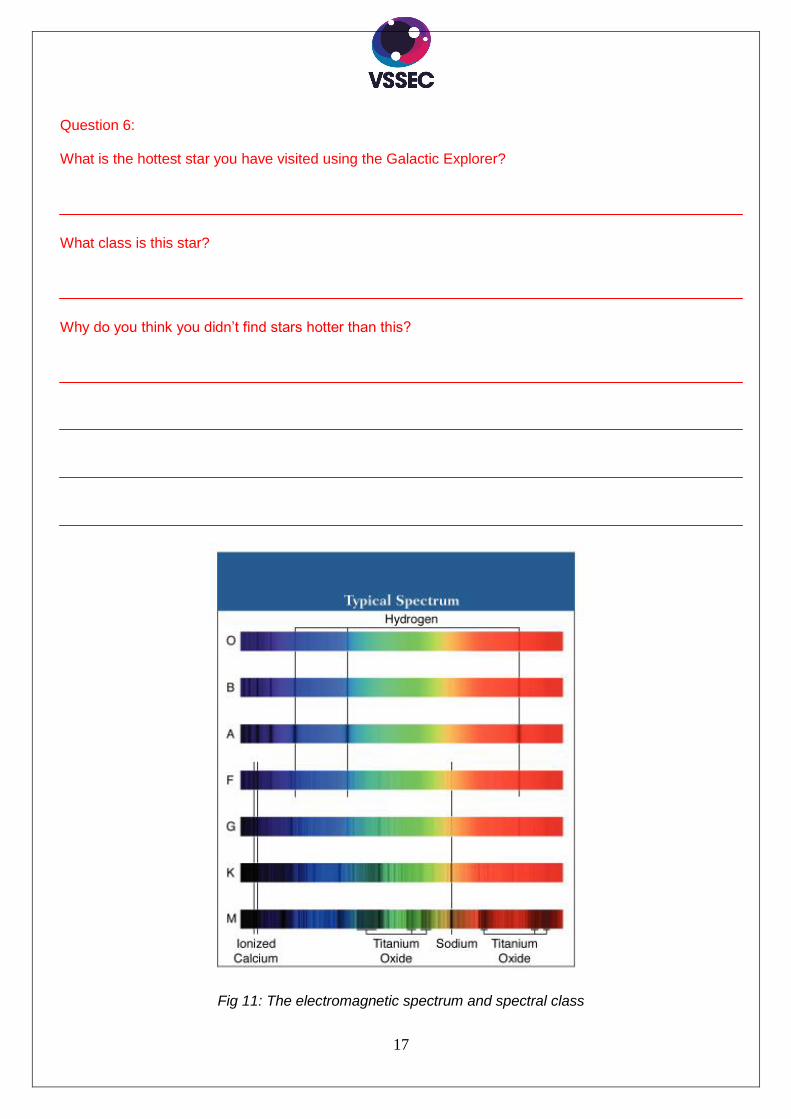
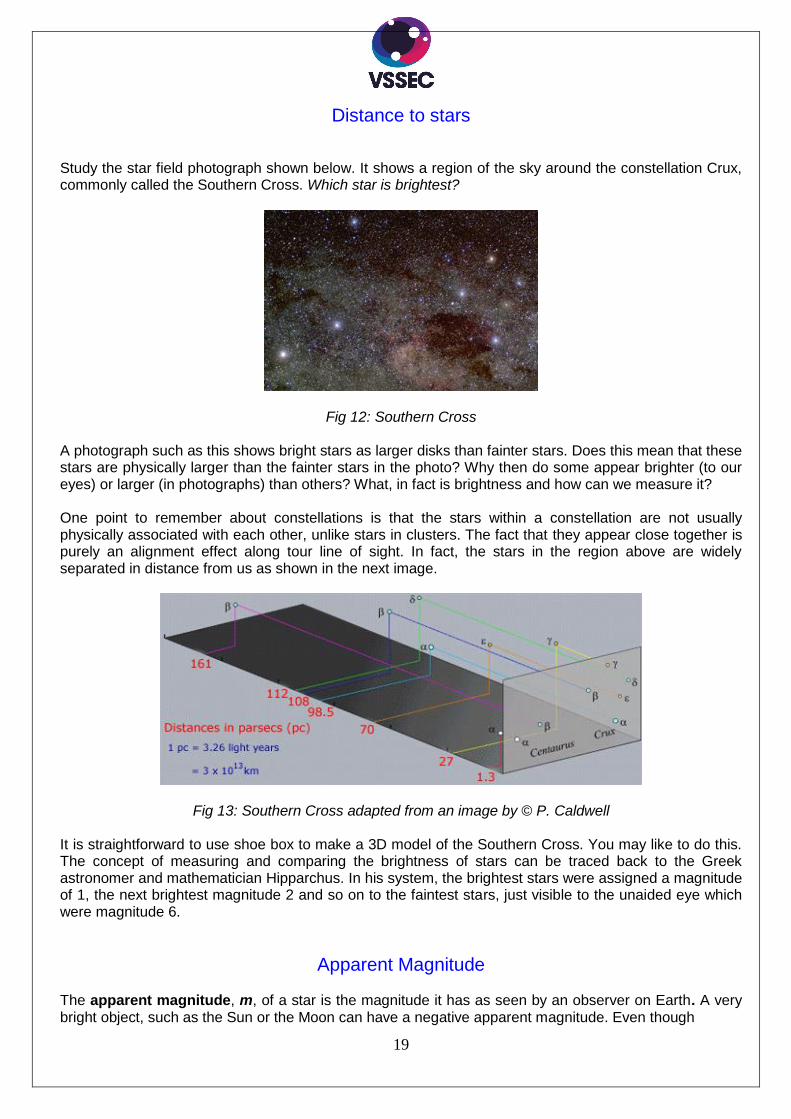
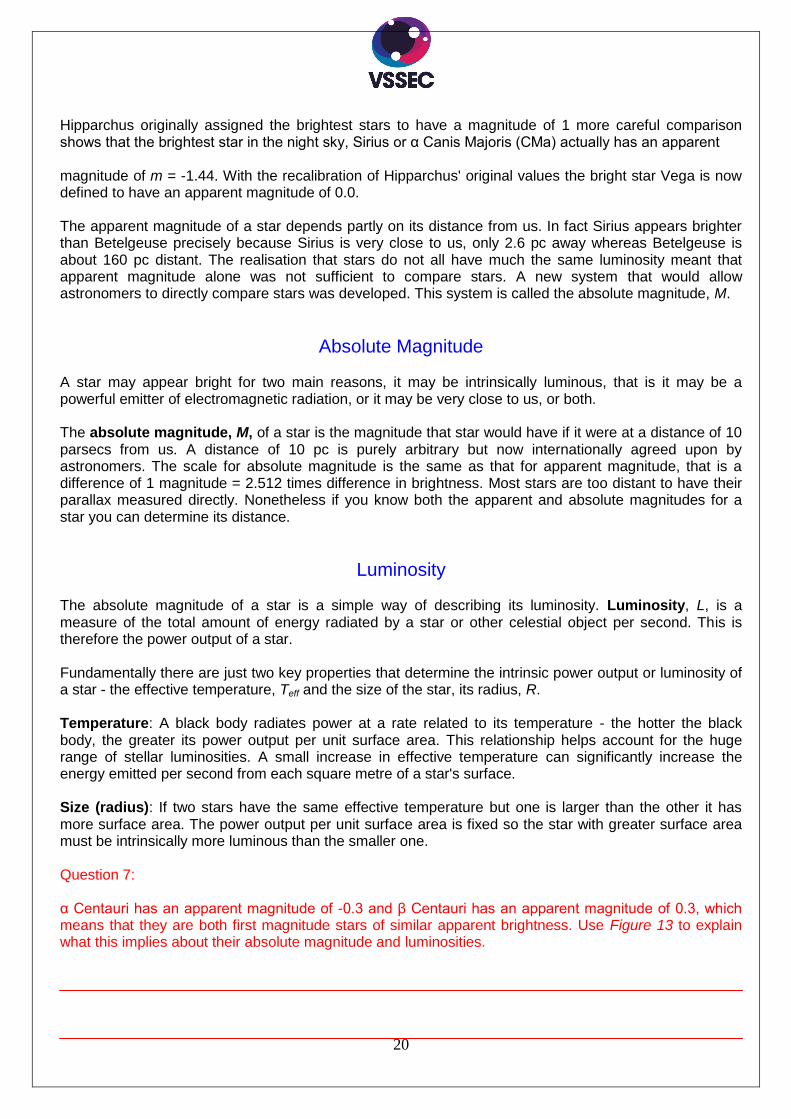
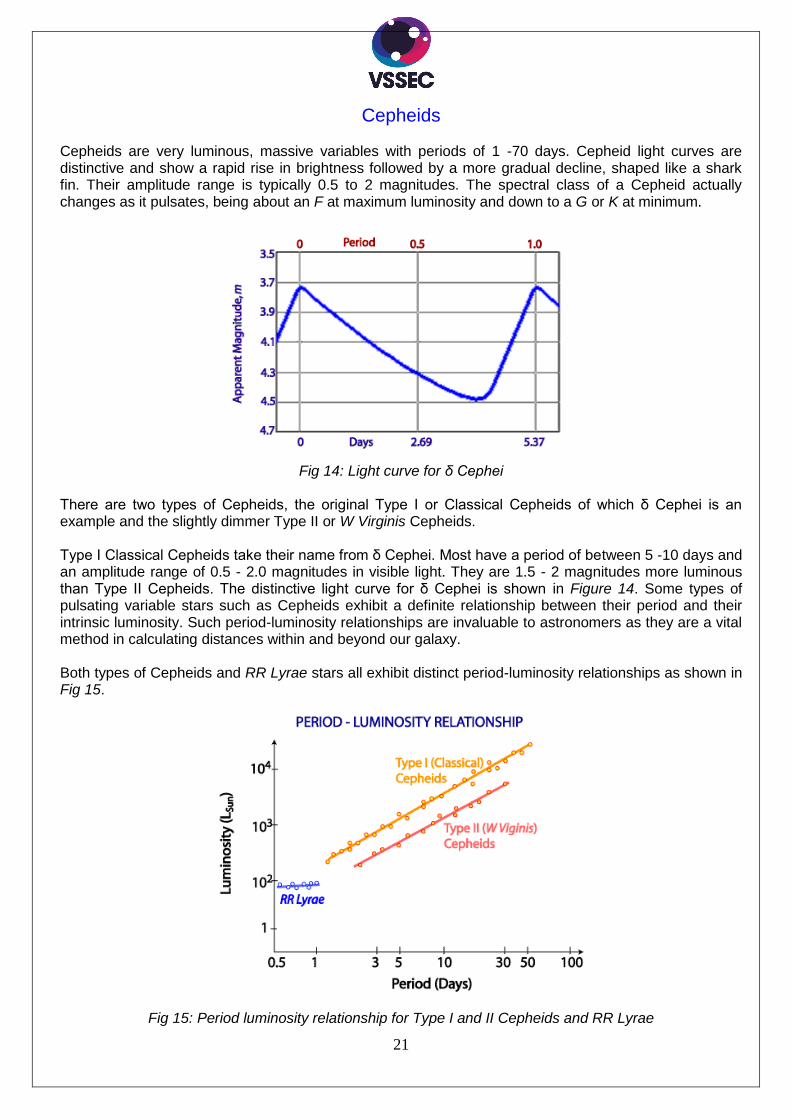
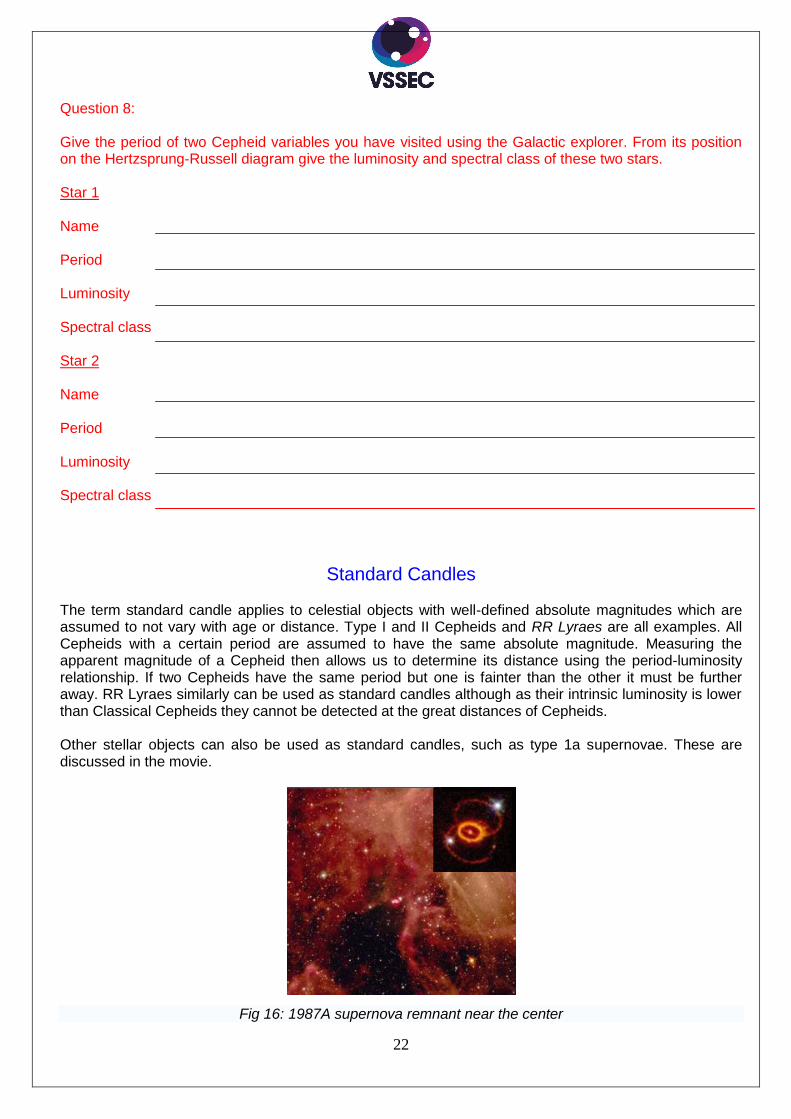
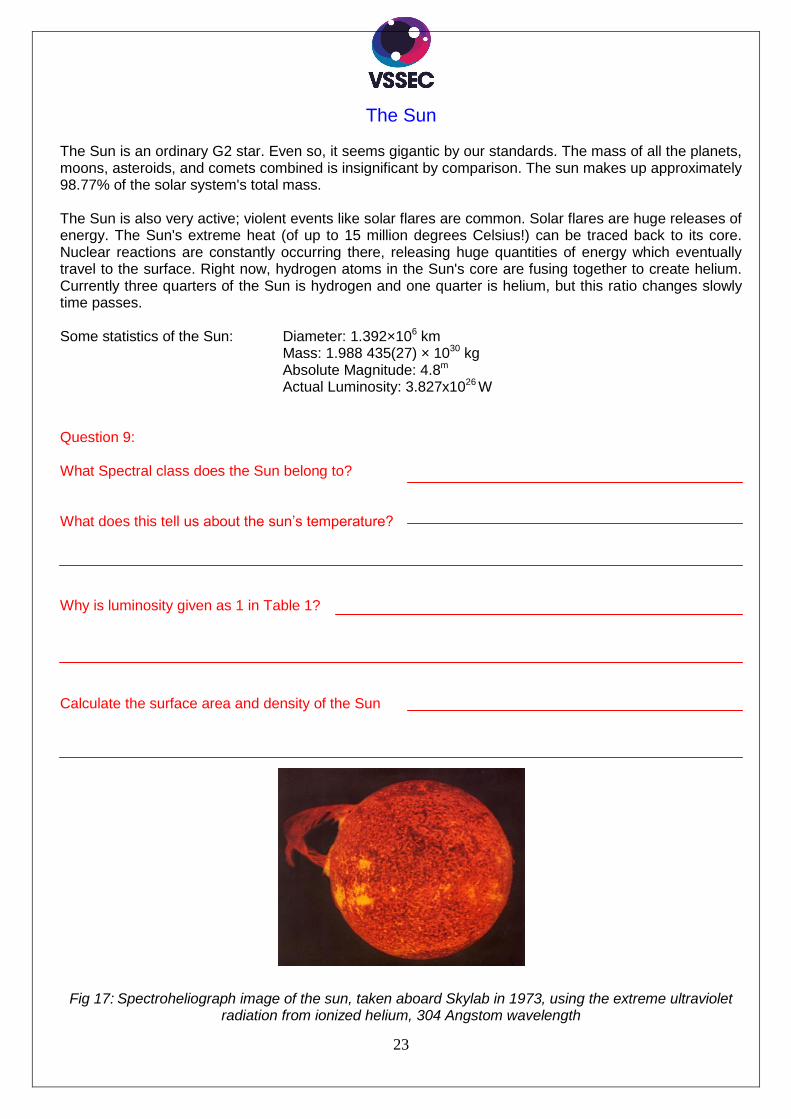
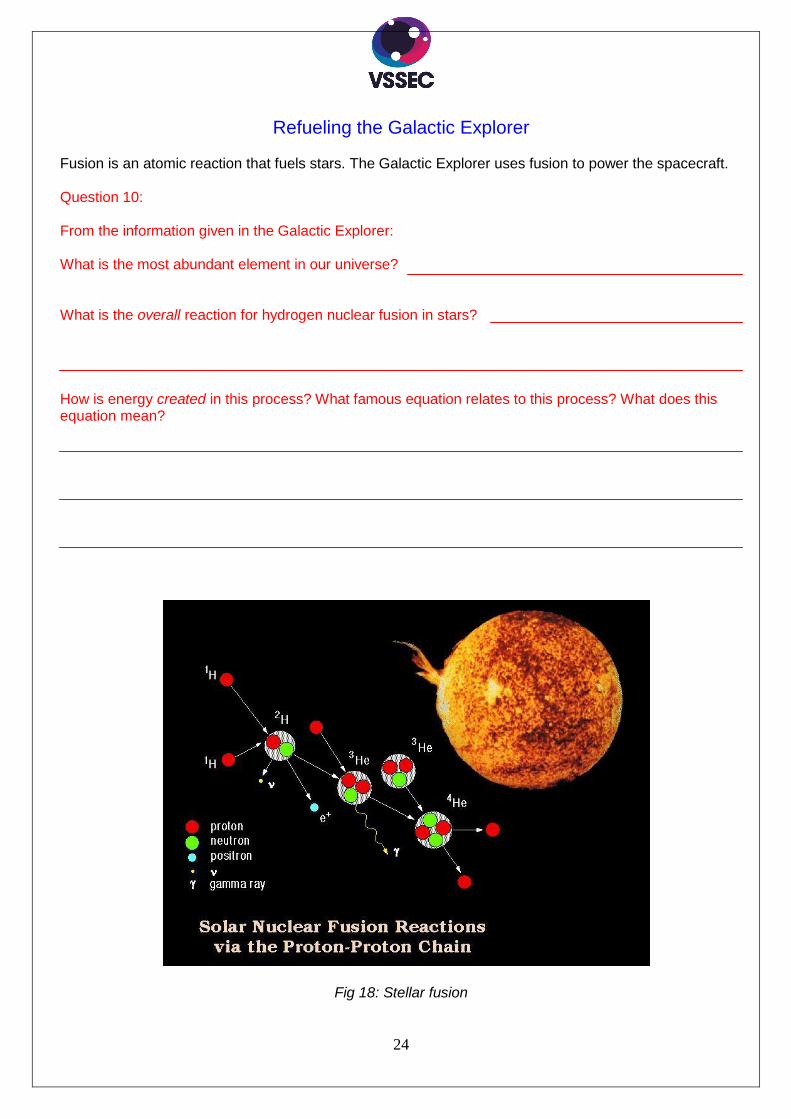
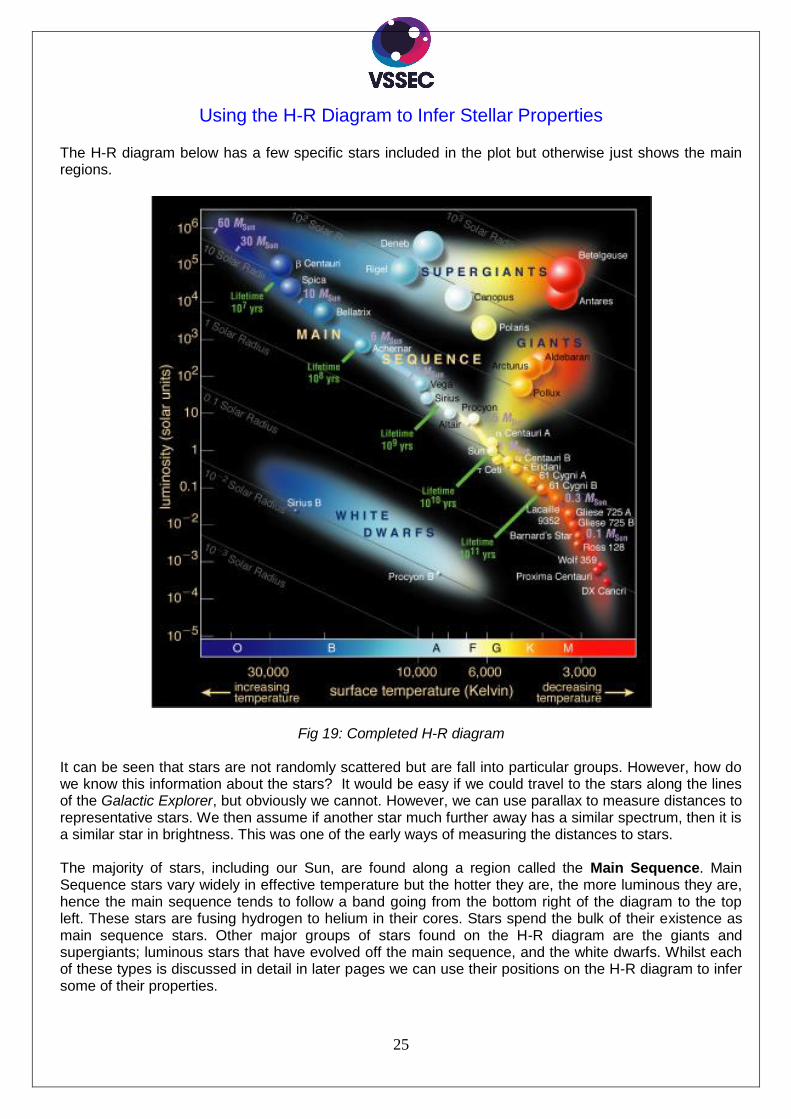
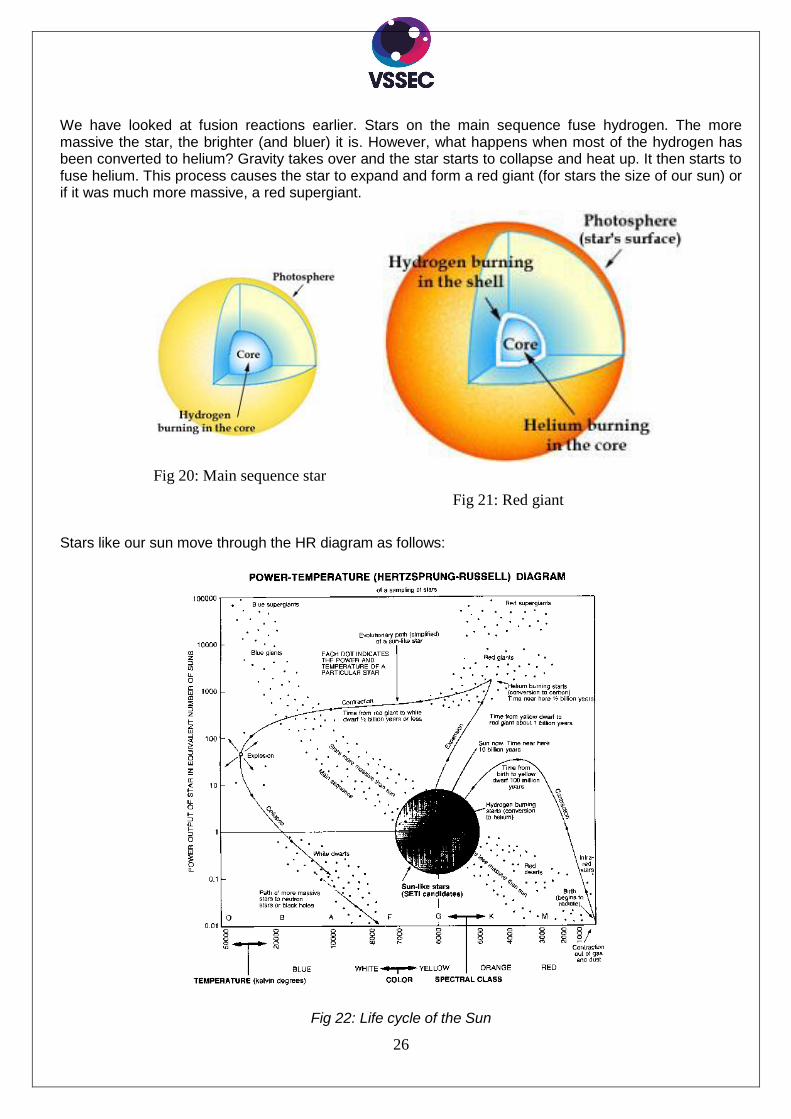
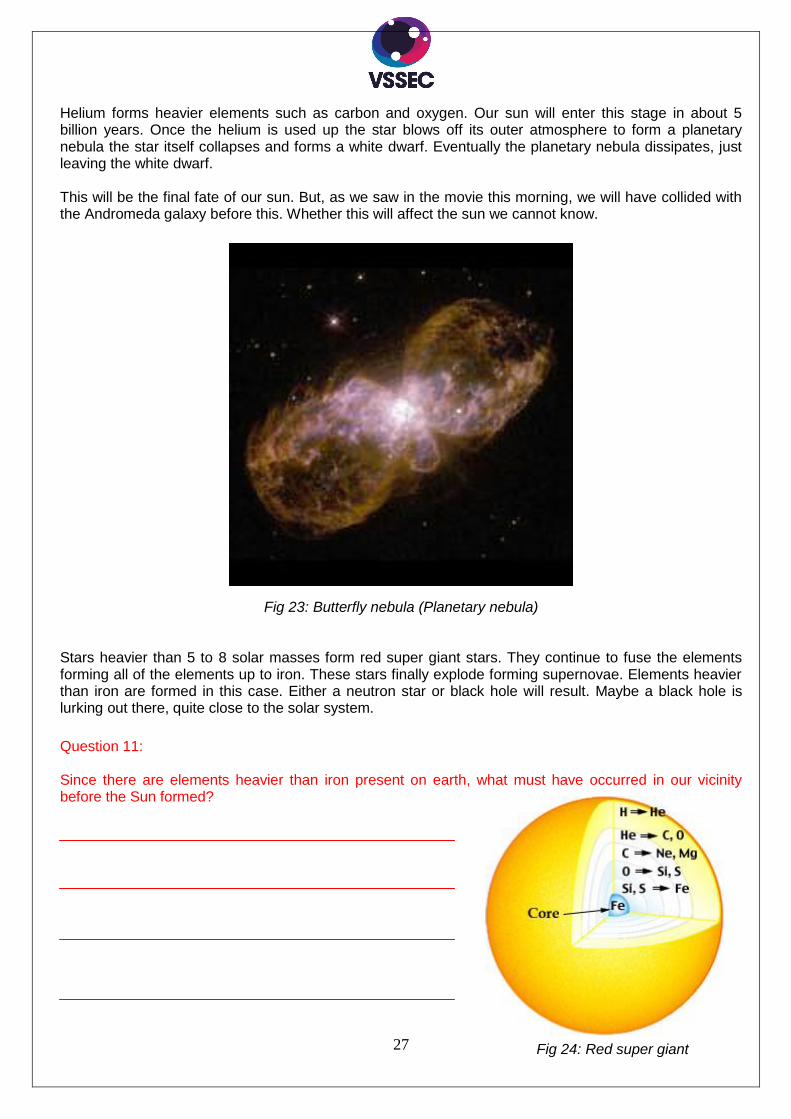
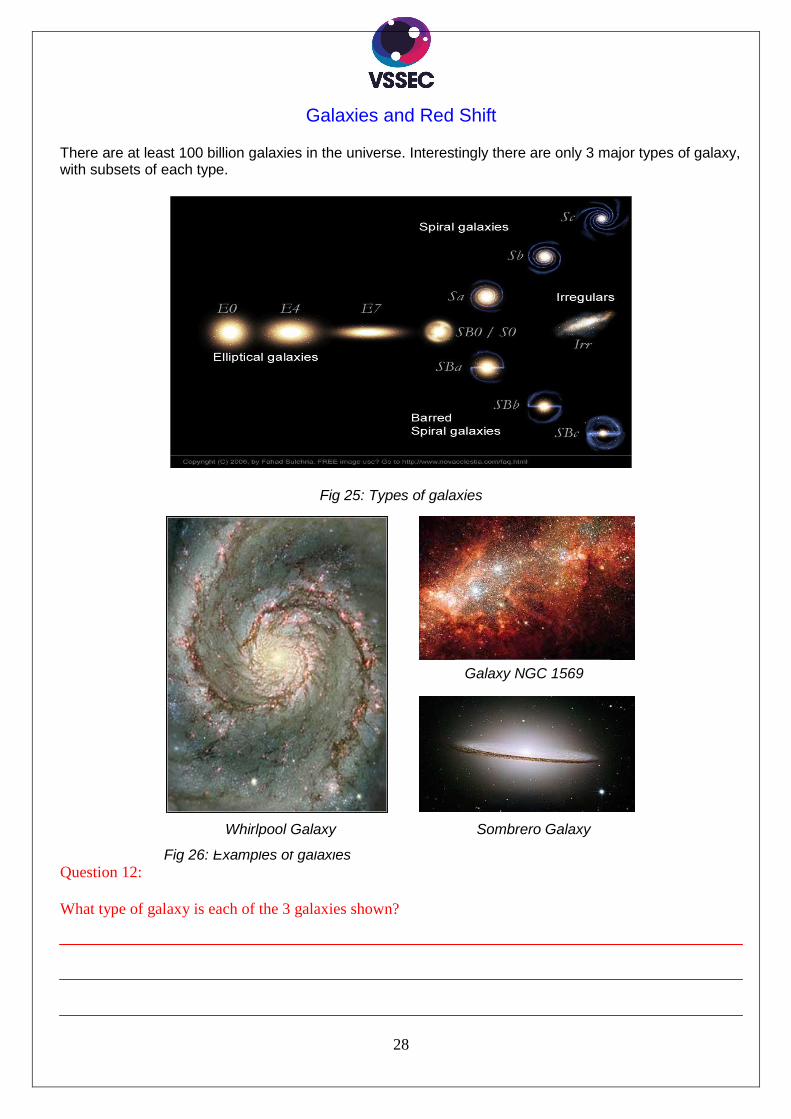
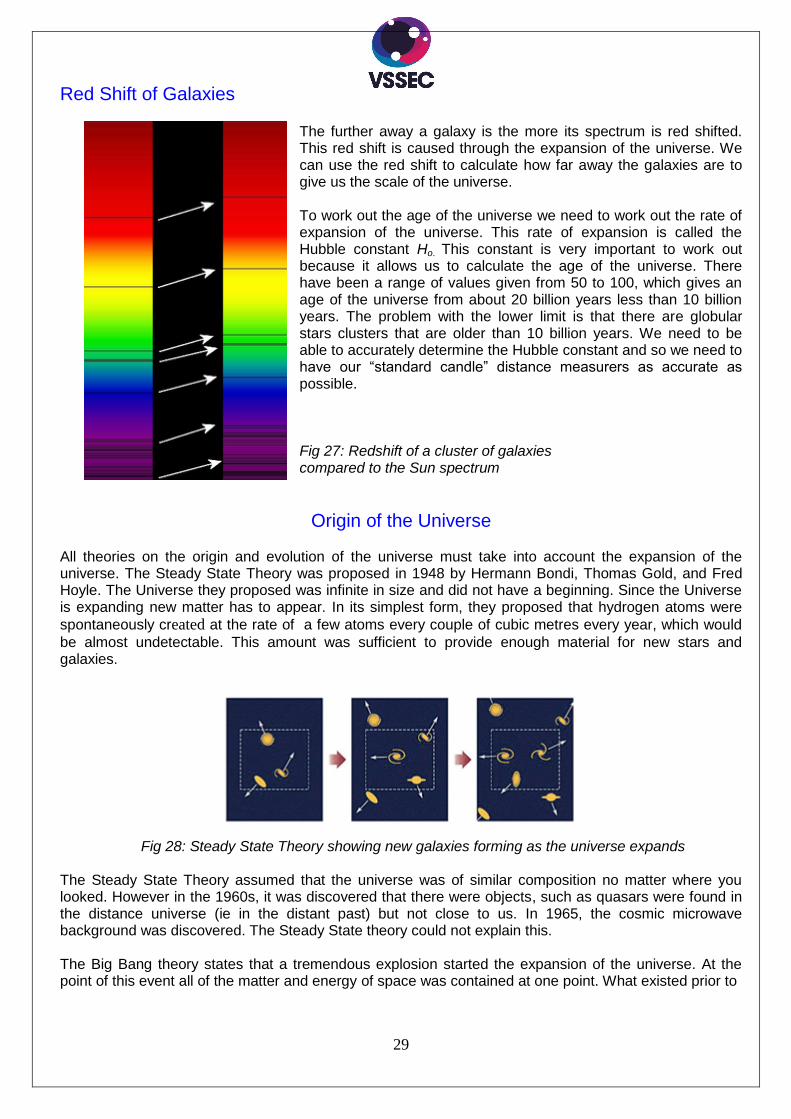
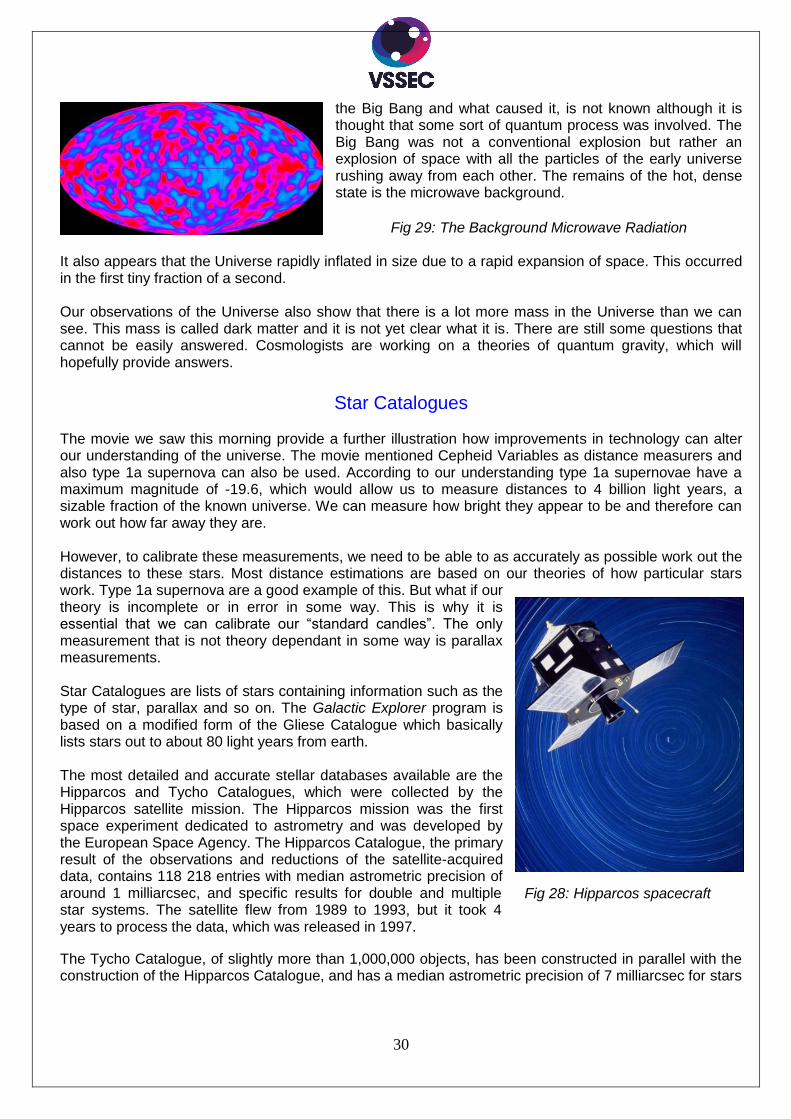
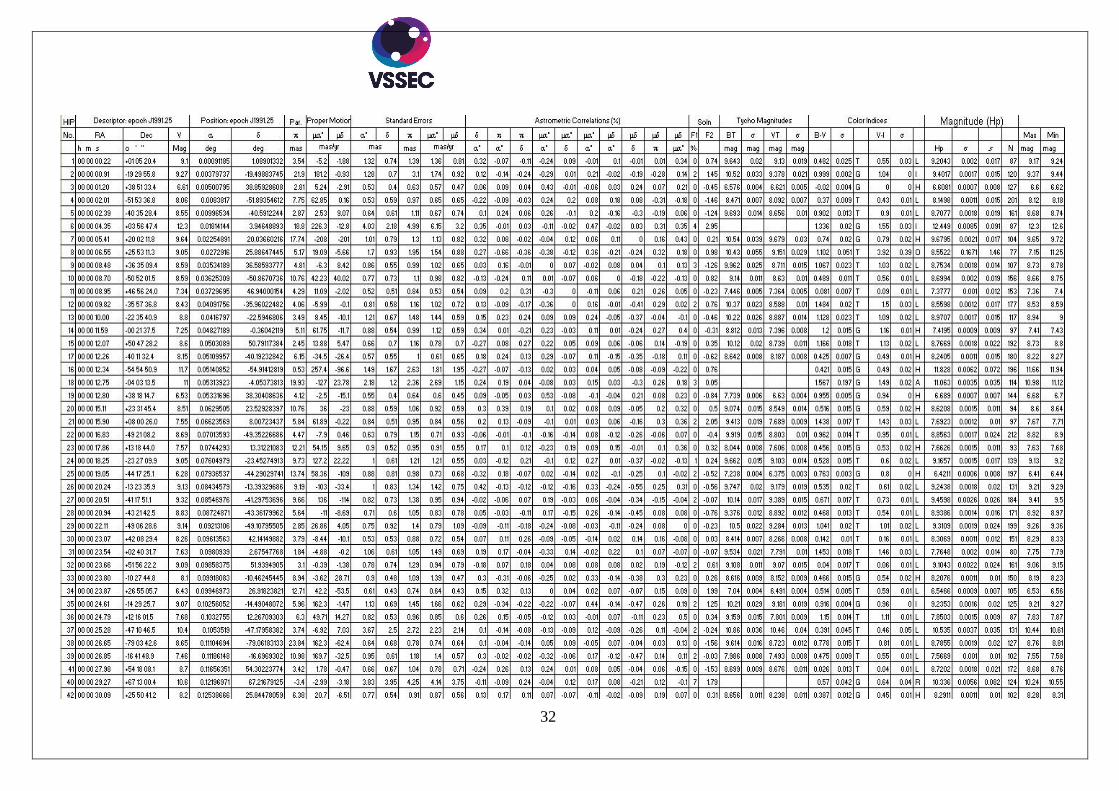
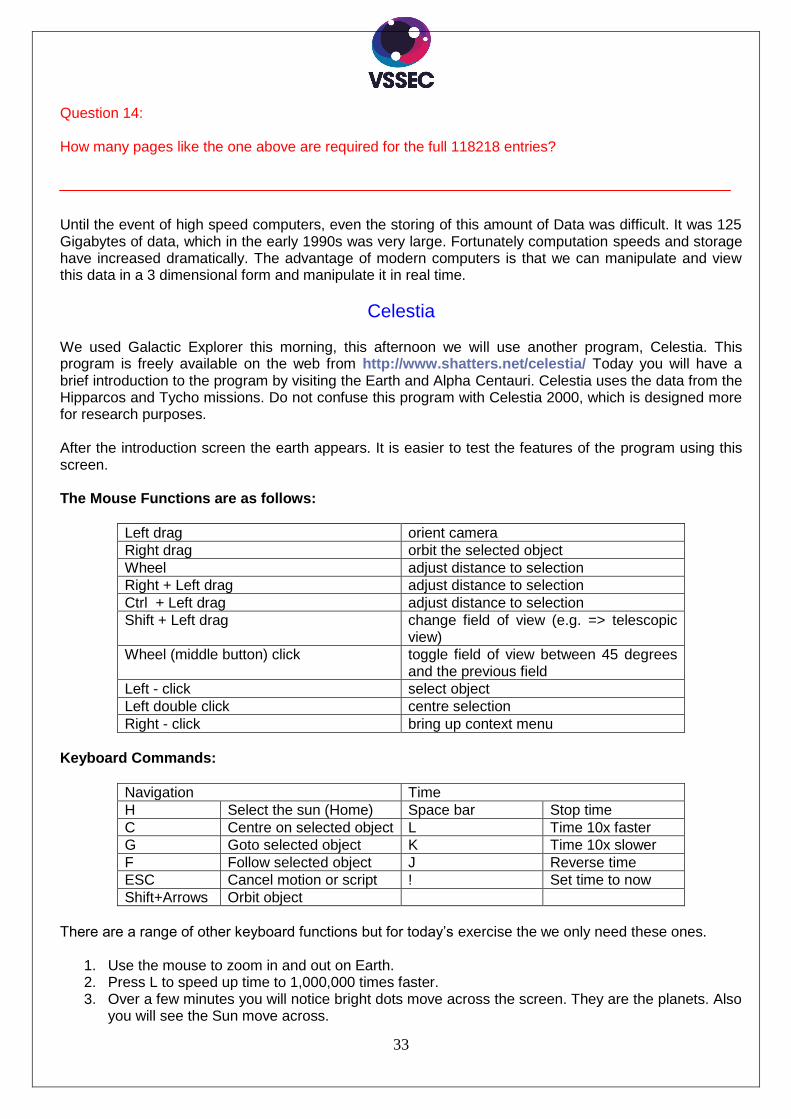
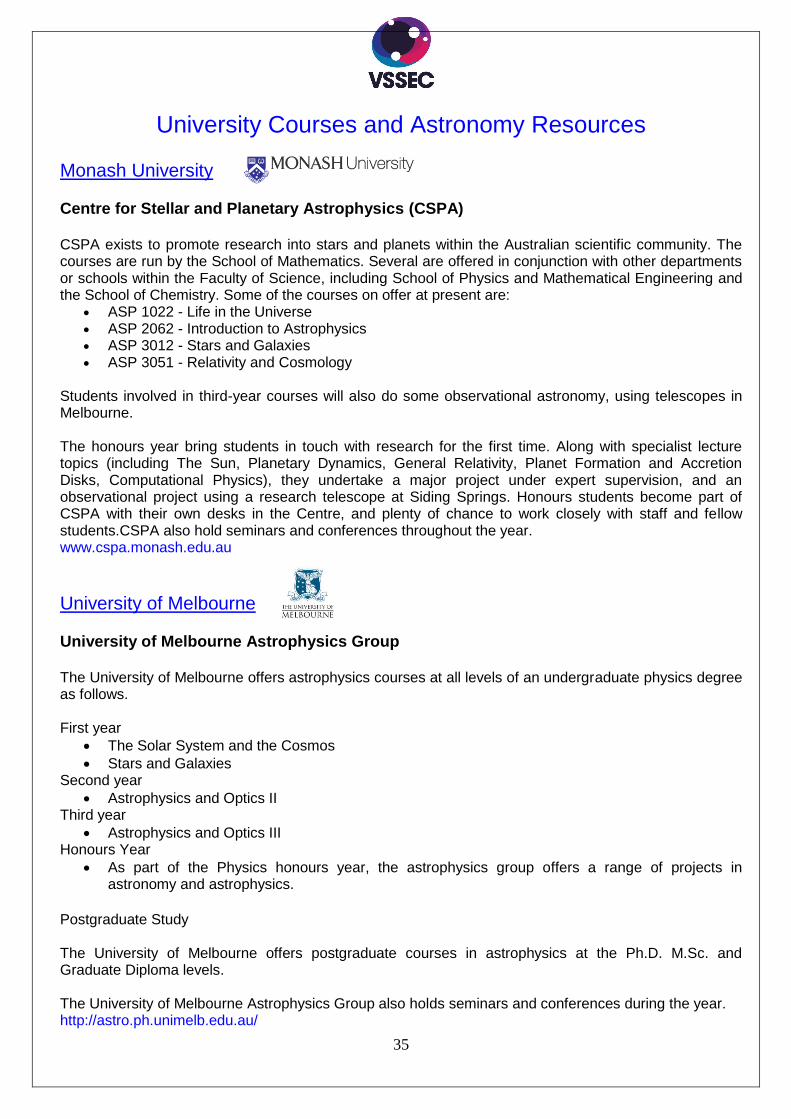
40
320 St Kilda Rd St Kilda 3182 PH 9593 9512 wwwastro-opticalcomau
Astrovisuals VSSEC would like to thank Astrovisuals for the donation of the posters and star charts used during the VSSEC VCE Astronomy Program 6 Lind St Strathmore 3041 PH 9379 5753 wwwastrovisualscomau