vegetation analysis toolkit
TRANSCRIPT
8/6/2019 Vegetation Analysis Toolkit
http://slidepdf.com/reader/full/vegetation-analysis-toolkit 1/12
ENVI Tutorial: Vegetation Analysis
Vegetation Analysis 2Files Used in this Tutorial 2 About Vegetation Analysis in ENVI 2
Opening the Input Image 3
Working wit h the Vegetatio n Index Calculator 5Opening th e V eget a tion Index Calculator 5Vegetation An alysis Tools 8
The Agri cultural Stre s s Tool 8The Fire Fu el Tool 9The For est Health Tool 11
1

8/6/2019 Vegetation Analysis Toolkit
http://slidepdf.com/reader/full/vegetation-analysis-toolkit 2/12
Vegetation AnalysisThis tutorial introduces vegetation analysis using ENVI. ENVI includes a suite of tools designed to helpyou determine the overall state of different vegetation types from their reflectance properties.
The application-specific vegetation analysis tools in ENVI classify the scene for vegetation analysisspecific to agricultural stress, fire fuel distribution, and overall forest health. This method enables you to
perform vegetation analysis using tools that guide index selections for a specific outcome.
In this tutorial, you will calculate vegetation indices using ENVI’s Vegetation Index Calculator, then perform some manual analysis of a few of the resultant indices.
In order to run this tutorial, you must have ENVI installed on your computer.
Files Used in this TutorialENVI Resource DVD: Data\flaash\hyperspectral\flaash_results
File DescriptionJasperRidge98av_flaash_refl.img (and .hdr) AVIRIS Reflectance image sample file
jasper_aviris_urban_mask (and .hdr) Mask for major roads and buildings
About Vegetation Analysis in ENVIRemote sensing offers an efficient way to estimate vegetation properties over large geographic areas.Vegetation indexes (VIs) are constructed from reflectance measurements in two or more wavelengthsand can be used to analyze specific characteristics of vegetation, such as total leaf area and water content. Successfully applying VIs with ENVI and analyzing their results requires the following:
l An understanding of the structure and function of vegetation and its reflectance properties. This
enables you to link vegetative structures and their condition to their reflectance behavior in anecological system of interest.
l An understanding of the vegetation properties that can be estimated by calculating VIs onhyperspectral reflectance data, and knowledge of how these VIs work.
l Using ENVI’s Vegetation Index Calculator to calculate applicable VIs, then analyzing the outputto determine the vegetation conditions in your data.
l Using ENVI’s Vegetation Analysis Tools to apply classifications to the various ecologies of theindices and analyzing the classifications for specific conditions, such as agricultural stress, firefuel distribution, and overall forest health.
The vegetation analysis component of ENVI includes complete documentation. The ENVI User’s Guidethat shipped with your software, as well as the ENVI Help, offer extensive documentation on vegetationanalysis using ENVI. They detail what comprises vegetation, how strong vegetation differs from weak vegetation, how vegetation properties and health affect the reflectance spectra of plants and plantcanopies, and how to use this information to analyze plant and ecosystem vegetative conditions usingENVI.
2
ENVI Tutorial: Vegetation Analysis
8/6/2019 Vegetation Analysis Toolkit
http://slidepdf.com/reader/full/vegetation-analysis-toolkit 3/12
ENVI Tutorial: Vegetation Analysis
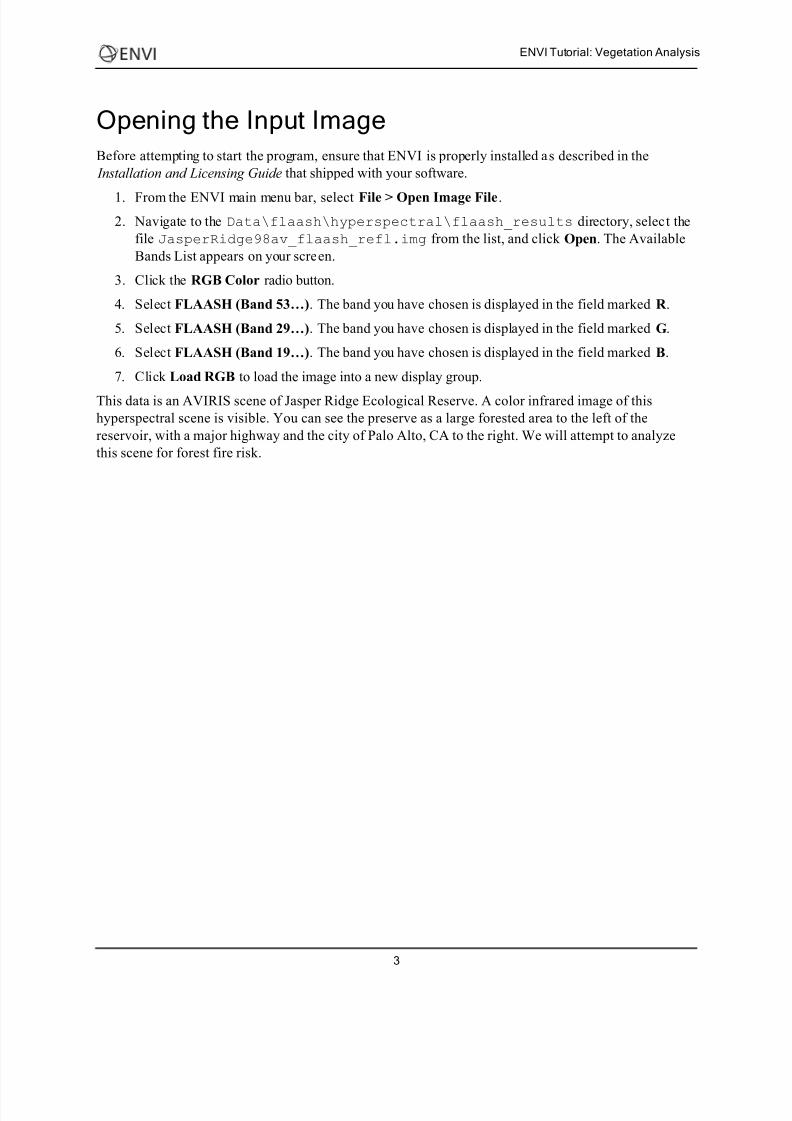
Opening the Input ImageBefore attempting to start the program, ensure that ENVI is properly installed as described in the Installation and Licensing Guide that shipped with your software.
1. From the ENVI main menu bar, select File > Open Image File .2. Navigate to the Data\flaash\hyperspectral\flaash_results directory, select the
file JasperRidge98av_flaash_refl.img from the list, and click Open . The AvailableBands List appears on your screen.
3. Click the RGB Color radio button.
4. Select FLAASH (Band 53…) . The band you have chosen is displayed in the field marked R .
5. Select FLAASH (Band 29…) . The band you have chosen is displayed in the field marked G .
6. Select FLAASH (Band 19…) . The band you have chosen is displayed in the field marked B .
7. Click Load RGB to load the image into a new display group.
This data is an AVIRIS scene of Jasper Ridge Ecological Reserve. A color infrared image of thishyperspectral scene is visible. You can see the preserve as a large forested area to the left of thereservoir, with a major highway and the city of Palo Alto, CA to the right. We will attempt to analyzethis scene for forest fire risk.
3
8/6/2019 Vegetation Analysis Toolkit
http://slidepdf.com/reader/full/vegetation-analysis-toolkit 4/12
4
ENVI Tutorial: Vegetation Analysis

8/6/2019 Vegetation Analysis Toolkit
http://slidepdf.com/reader/full/vegetation-analysis-toolkit 5/12
ENVI Tutorial: Vegetation Analysis
Working with the Vegetation Index CalculatorFirst, you will use ENVI to calculate all of the available vegetation indices for our input image. ENVI’sVegetation Index Calculator can be used to determine the vegetation indices that can be calculated for a
given input file and to calculate the indices that are applicable.ENVI provides 27 VIs you can use to detect the presence and relative abundance of various vegetation
properties. These VIs are combinations of surface reflectance at two or more wavelengths designed tohighlight a particular property of vegetation. Each index is grouped into a category by the main functionof the index. They are detailed in the ENVI Help and the User Guide that shipped with your software.
l Greenness VIs are designed to measure the overall quantity, amount, and vigor of greenvegetation in each pixel.
l Light use efficiency VIs are designed to provide a measure of the efficiency with whichvegetation is able to use incident light for photosynthesis, which is closely related to carbonuptake and vegetation growth rates.
l The Canopy nitrogen VI is designed to provide a measure of nitrogen concentration of remotelysensed foliage.
l Dry or senescent carbon VIs are designed to provide an estimate of the amount of carbon in itsdry states of lignin and cellulose.
l Leaf pigment VIs are designed to provide a measure of stress-related pigments, includingcarotenoids and anthocyanins, present in vegetation. These pigments are present in higher concentrations in weakened vegetation.
l Canopy water content VIs are designed to provide a measure of the amount of water containedin the foliage canopy.
Opening the Vegetation Index CalculatorOnce you select your input file, the Vegetation Index Calculator automatically determines which of theavailable 27 indices can be calculated on your input file based on the wavelengths present in your file. If no indices can be calculated because the correct wavelengths are not present, you will be warned at thistime.
1. From the ENVI main menu bar, select Spectral > Vegetation Analysis > Vegetation IndexCalculator . The Vegetation Indices Input File dialog appears.
5

8/6/2019 Vegetation Analysis Toolkit
http://slidepdf.com/reader/full/vegetation-analysis-toolkit 6/12
2. Select the JasperRidge98av_flaash_refl.img input file and click OK. The VegetationIndices Parameters dialog appears, showing all of the available indices for the dataset. You cansee that for this dataset, 25 of the 27 VIs in ENVI are available and all are selected by default.You could choose to calculate only a subset of these indices by selecting the desired indices fromthe list. For this exercise, you will calculate all of the available VIs.
3. Ensure that the Biophysical Cross Checking toggle is set to On . Biophysical cross check is oneof the truly unique features of the vegetation analysis component in ENVI. If enabled, it allowsthe comparison of different indices a t each pixel to validate their results. If conflicting valuesexist between indices, for example, a greenness index shows insufficient vegetation to support thewater content measurement from a canopy water index, those data values are ignored.
4. Click the File radio button and type or choose an output filename. The output data will be storedin a new file, with one band for each VI calculated, and the band name will contain the name of the VI, ready for use in additional processing in ENVI.
5. Click OK to begin processing. The result is passed into the Available Bands List. You can seethat each band in the new file is identified by the name of the VI it represents.
6
ENVI Tutorial: Vegetation Analysis
8/6/2019 Vegetation Analysis Toolkit
http://slidepdf.com/reader/full/vegetation-analysis-toolkit 7/12
ENVI Tutorial: Vegetation Analysis
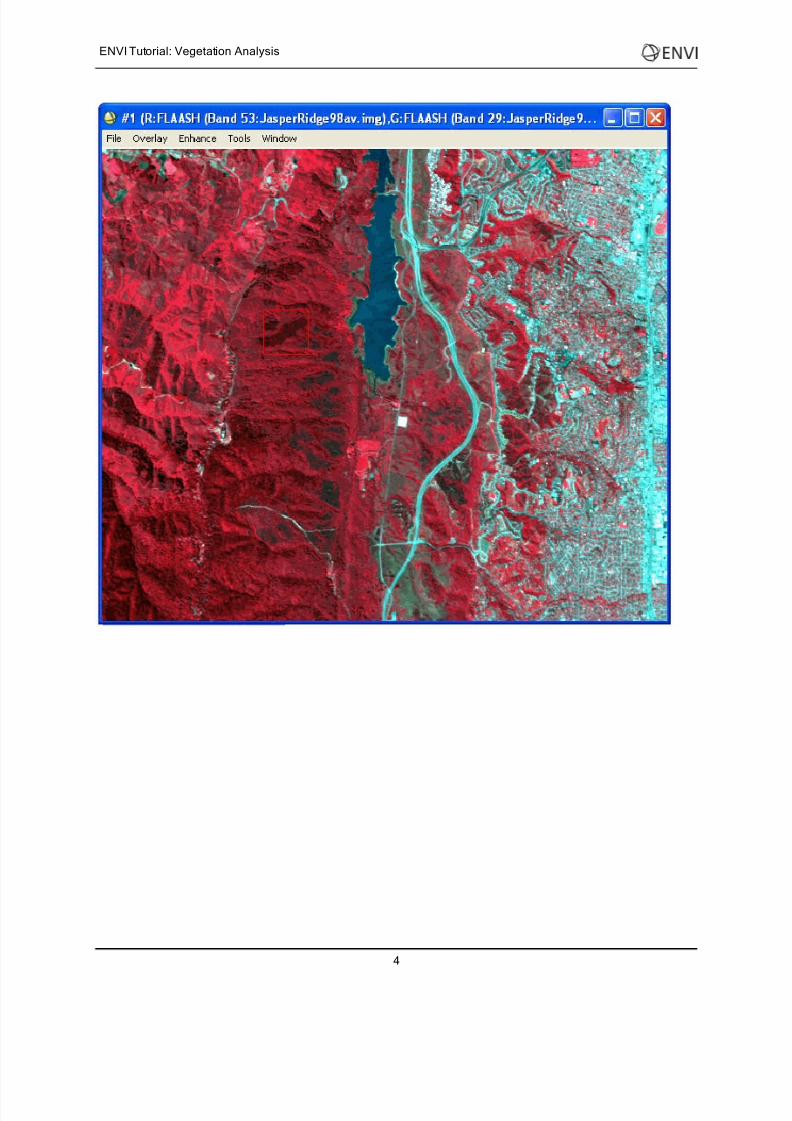
6. From the Available Bands List, select the Normalized Difference Vegetation Index (NDVI)result (a Greenness VI), then click Load Band . Explore this image. You can see that thegreenness values appear high in the forested areas, and lower in the urban portions of the scene.
7. Explore some of the other greenness VI results (displayed in the Available Bands List fromNormalized Difference Vegetation Index through Red Edge Position Index ). As you examinesome of the greenness indices, you can see that they all look similar overall, but each highlightsdifferent areas in different ways. Determining which VI most closely describes the fieldconditions requires some field measurements to be taken.
8. Explore some of the dry carbon and water content VI results (displayed in the Available BandsList from Normalized Difference Lignin Index through Plant Senescence Reflectance Index ).These can be used for fire fuel measurements. You can see that much of the forested area inthese results is masked out. These regions are masked by the biophysical cross check becausethere is too much green vegetation in the pixels for these VIs to work correctly.
9. Explore some of the canopy water content VI results (displayed in the Available Bands List fromWater Band Index to Normalized Difference Infrared Index ). The Water Band Index andNormalized Difference Water Index (NDWI) are good water content indices, and we can see
again that the NDWI has much of its area masked by the biophysical cross check. The VI resultsare now available for use for further processing in ENVI, if desired.
7

8/6/2019 Vegetation Analysis Toolkit
http://slidepdf.com/reader/full/vegetation-analysis-toolkit 8/12
Vegetation Analysis ToolsENVI provides three application-specific vegetation analysis tools, each specific to one kind of vegetation property: agricultural stress, fire fuels, and forest health. These tools allow you to perform
vegetation analysis by guiding you through index selections aimed at a specific outcome. The tools areavailable from the ENVI main menu bar by selecting Spectral > Vegetation Analysis . This tutorial willintroduce each tool and explore using the Fire Fuel Tool.
Each of the tools is similar in design and operation as well as in strengths and limitations. The results arerelative to the particular input image only and cannot be generalized to other areas or other images. Thismeans that the classes cannot be directly compared between images, as vegetative variability in theimage affect the output class distribution. In addition, it is important to field check the results and link the classes in your image to conditions on the ground.
The Agricultural Stress ToolThe Agricultural Stress tool is designed to create a spatial map showing the distribution of crop stress.This tool is intended specifically for use on agricultural land to support precision agriculture analysis.
The conditions that cause agricultural stress are the same as those that cause forest stress; however,agricultural stress analysis concentrates more on growth efficiency. Dry or dying crops do not efficientlyuse nitrogen and light, indicating agricultural stress, whereas a crop showing healthy, productivevegetation indicates low stress. The Agricultural Stress tool uses the following VI categories:
l Greenness , to indicate areas of idle cropland, weak vegetation, and healthy crops
l Canopy water content , to show levels of water stress
8
ENVI Tutorial: Vegetation Analysis
8/6/2019 Vegetation Analysis Toolkit
http://slidepdf.com/reader/full/vegetation-analysis-toolkit 9/12
ENVI Tutorial: Vegetation Analysis
l Canopy nitrogen , to estimate relative nitrogen levels
l Light use efficiency , to show vegetation growth rate
l Leaf pigments , to highlight vegetation stress
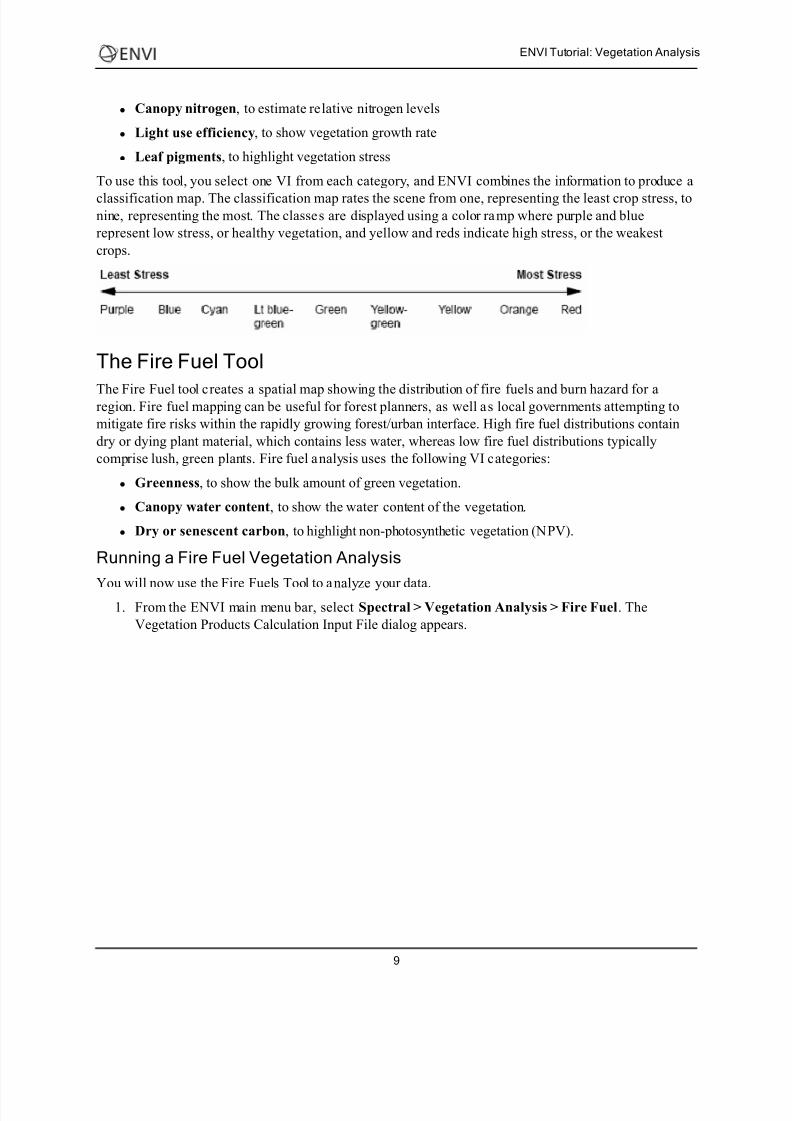
To use this tool, you select one VI from each category, and ENVI combines the information to produce a
classification map. The classification map rates the scene from one, representing the least crop stress, tonine, representing the most. The classes are displayed using a color ramp where purple and bluerepresent low stress, or healthy vegetation, and yellow and reds indicate high stress, or the weakestcrops.
The Fire Fuel Tool
The Fire Fuel tool creates a spatial map showing the distribution of fire fuels and burn hazard for aregion. Fire fuel mapping can be useful for forest planners, as well as local governments attempting tomitigate fire risks within the rapidly growing forest/urban interface. High fire fuel distributions containdry or dying plant material, which contains less water, whereas low fire fuel distributions typicallycomprise lush, green plants. Fire fuel analysis uses the following VI categories:
l Greenness , to show the bulk amount of green vegetation.
l Canopy water content , to show the water content of the vegetation.
l Dry or senescent carbon , to highlight non-photosynthetic vegetation (NPV).
Running a Fire Fuel Vegetation Analysis
You will now use the Fire Fuels Tool to analyze your data.1. From the ENVI main menu bar, select Spectral > Vegetation Analysis > Fire Fuel . The
Vegetation Products Calculation Input File dialog appears.
9
8/6/2019 Vegetation Analysis Toolkit
http://slidepdf.com/reader/full/vegetation-analysis-toolkit 10/12
2. Because this image displays mixed terrain with both forest and urban types, you will use a mask to exclude much of the urban area from classification. Click the Open drop-down button andselect New File .
3. Navigate to the Jasper_aviris_urban_mask file, select it, and click Open .
4. From the Select Input File area, click to select the file you created in the Vegetation Index
Calculator exercise.5. Click the Select Mask Band button, select the Jasper_aviris_urban_mask Mask Band
file and click OK .
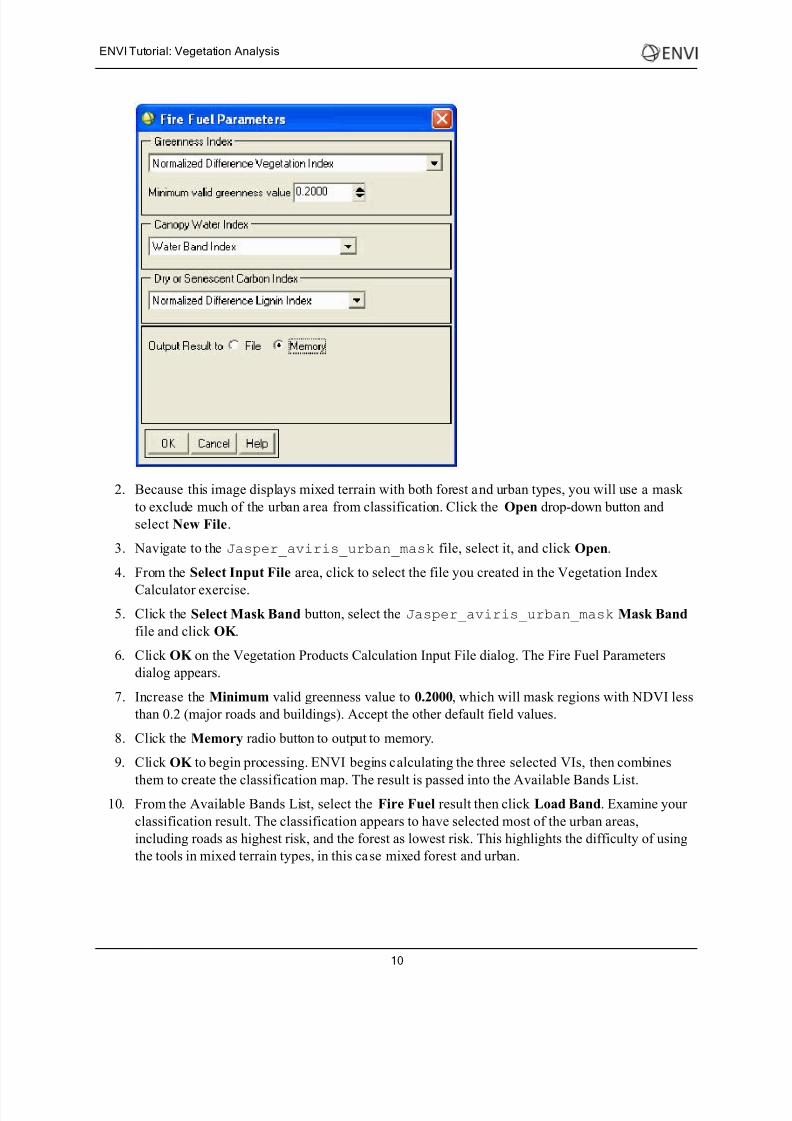
6. Click OK on the Vegetation Products Calculation Input File dialog. The Fire Fuel Parametersdialog appears.
7. Increase the Minimum valid greenness value to 0.2000 , which will mask regions with NDVI lessthan 0.2 (major roads and buildings). Accept the other default field values.
8. Click the Memory radio button to output to memory.
9. Click OK to begin processing. ENVI begins calculating the three selected VIs, then combines
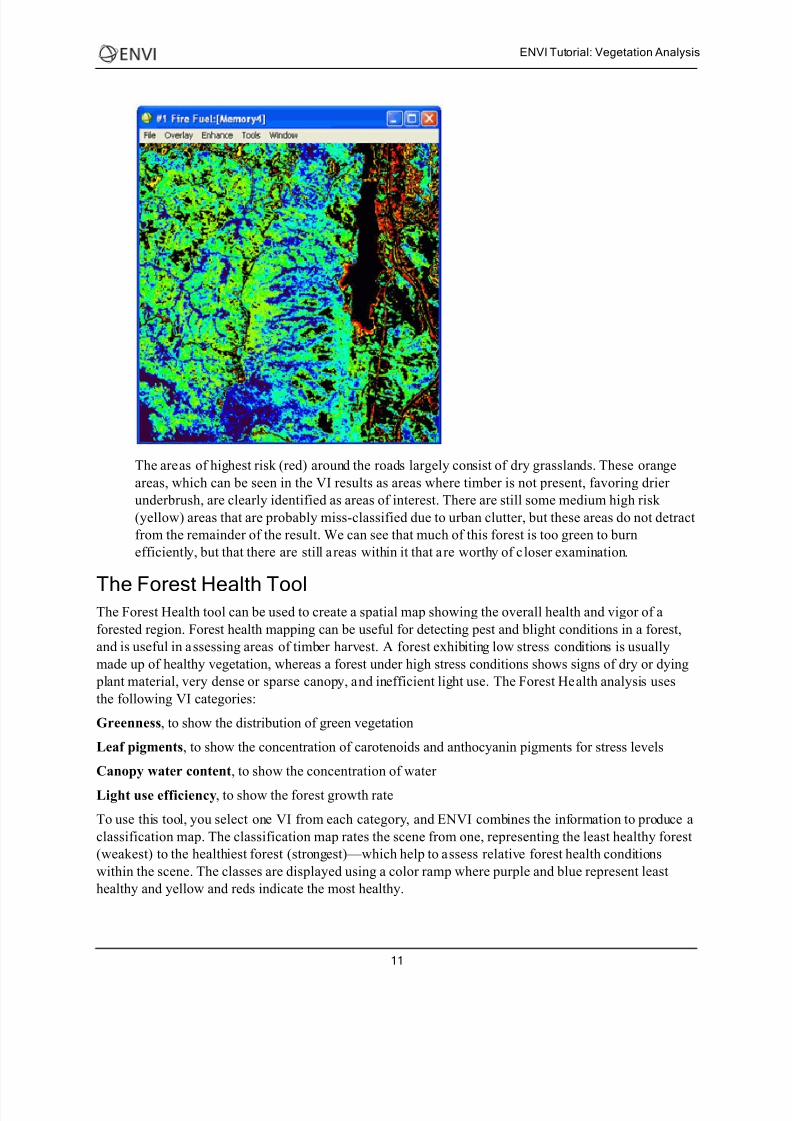
them to create the classification map. The result is passed into the Available Bands List.10. From the Available Bands List, select the Fire Fuel result then click Load Band . Examine your
classification result. The classification appears to have selected most of the urban areas,including roads as highest risk, and the forest as lowest risk. This highlights the difficulty of usingthe tools in mixed terrain types, in this case mixed forest and urban.
10
ENVI Tutorial: Vegetation Analysis
8/6/2019 Vegetation Analysis Toolkit
http://slidepdf.com/reader/full/vegetation-analysis-toolkit 11/12
ENVI Tutorial: Vegetation Analysis
The areas of highest risk (red) around the roads largely consist of dry grasslands. These orangeareas, which can be seen in the VI results as areas where timber is not present, favoring drier underbrush, are clearly identified as areas of interest. There are still some medium high risk (yellow) areas that are probably miss-classified due to urban clutter, but these areas do not detractfrom the remainder of the result. We can see that much of this forest is too green to burnefficiently, but that there are still areas within it that are worthy of c loser examination.
The Forest Health ToolThe Forest Health tool can be used to create a spatial map showing the overall health and vigor of aforested region. Forest health mapping can be useful for detecting pest and blight conditions in a forest,and is useful in assessing areas of timber harvest. A forest exhibiting low stress conditions is usuallymade up of healthy vegetation, whereas a forest under high stress conditions shows signs of dry or dying
plant material, very dense or sparse canopy, and inefficient light use. The Forest Health analysis usesthe following VI categories:
Greenness , to show the distribution of green vegetation
Leaf pigments , to show the concentration of carotenoids and anthocyanin pigments for stress levels
Canopy water content , to show the concentration of water
Light use efficiency , to show the forest growth rate
To use this tool, you select one VI from each category, and ENVI combines the information to produce aclassification map. The classification map rates the scene from one, representing the least healthy forest(weakest) to the healthiest forest (strongest)—which help to assess relative forest health conditionswithin the scene. The classes are displayed using a color ramp where purple and blue represent leasthealthy and yellow and reds indicate the most healthy.
11

8/6/2019 Vegetation Analysis Toolkit
http://slidepdf.com/reader/full/vegetation-analysis-toolkit 12/12
When you are finished experimenting with the Agricultural Stress Tool, Fire Fuel Tool, and ForestHealth Tool, exit ENVI by selecting File > Exit from the ENVI main menu bar.
12
ENVI Tutorial: Vegetation Analysis