vegetation monitoring gis/rs news
TRANSCRIPT

May, 2003 Pacific GIS/RS NEWS
Highlights
? RS and GIS to manage marine environment? GPS Field techniques? Database Linking
Highlights
? Image Analysis? GIS for Utilities, FEA? Vegetation Monitoring
GIS and Remote Sensing: Leaps andbounds through SOPAC-EU Project
ISSN 1562-4250
Download your digital version from SOPAC’s web site ..!
GIS/RS newsPacific Islands The Newsletter of the
GIS/Remote SensingUsers in the Pacific
Issue 1 /2003May 2003
During 2002 only one issue of the GIS&RS news-letter was published. This year, the situation willhopefully change as the circumstances have beenaltered. Now, through the SOPAC-EU project pro-ducing the newsletter is a part of the official workprogram and not a programmed office activity asbefore. Also the newsletter team has changedagain: Wolf Forstreuter is still looking after theoverall production and Lala Bukarau after the edi-torial style. New in the team are Litea Biukoto andElizabeth Lomani assisting in editorial work to-gether with Silika Tuivanuavou from the 2002team. Elenoa Rokodi handles the distribution asAbigail Duaibe left for studies in New Zealand.The newsletter is still facing the situation that it takeslots of time to get articles in from Pacific Islanders.There are plenty GIS and remote sensing newslet-ters available world wide, however, we want to de-velop the GIS&RS tools in the Pacific with the spe-cific prevailing conditions of this region, which inmany cases do not allow a simple technology trans-fer from other regions.The SOPAC-EU project (see article by Litea) willestablish GIS&RS support for the eight Pacific ACPcountries linked to the EDF8 funding (Lome con-vention) and this project possibly will be extendedto 6 further Pacific ACP countries linked to EDF9funding (Cotonou convention). The newsletter willpermanently report on the EU project activities asthey are focused around GIS.This issue of the newsletter covers a wide range ofissues from GIS application in Pacific Island Utili-
ties, environmental activities, documentation ofsquatter settlements to rapid mapping of landboundaries, which is an important activity in Fiji andwill become increasing important in other PacificIsland Countries. Besides this, the current news-letter explains technical topics such as linking tabu-lar and spatial data, handling of GPS equipmentand mapping of bathymetry.
We hope to get more newsletter contributionsduring the next weeks and month.
Handing out certificates after one of RS trainingcourses of the SOPAC-EU project

2 Pacific GIS/RS NEWS May, 2003
Contents
Fiji Coral Reef Conservation Project, Mamanuca Islands- Coral Cay Conservation ................... 3SOPAC Completes Multibeam Mapping of Penrhyn Atoll, Cook Islands ....................................... 4Downloading Trimble GPS Receivers in the Field ......................................................................... 6GPS Survey in Southwest Viti Levu ................................................................................................. 7Linking Access Tabular Data to GIS Layers ..................................................................................... 8Settlement in Nasinu Town, Suva .................................................................................................. 10GPS Base Stations .......................................................................................................................... 12Implementing the National Biodiversity Strategy for the Tropical Forests of Fiji: BuildingConservation Landscapes into Forestry Operations & Forest Certification .............................. 12Training GIS Backdrop Production ................................................................................................ 14GPS and GIS Improvement at the Native Land Trust Board in Fiji .............................................. 16GIS for Fiji Electricity Authority ....................................................................................................... 18Hawaii Synergy Project Offers New Opportunities for Remote Sensing of Pacific Islands ..... 19
Above and Under the Red Sea
This unique photograph of shallow Red Sea waters off the coast of Saudi Arabia gives us a glimpse of boththe coral reefs under the surface, and the texture and movements of surface waters. On the left side of theimage we see through the water column to the reefs below the surface. On the right side of the image, thesun reflects off of microscopic oily films formed by a combination of natural biological sources and humanactivities on the sea surface (visit Oceanography from the Space Shuttle for more info). The films areconcentrated by surface water movements and variably dampen surface capillary waves, which effect howthe sun’s light is reflected. This creates patterns of brighter and darker reflections when viewed from orbit.These patterns trace the complex surface water dynamics along the coast.

May, 2003 Pacific GIS/RS NEWS 3
Coral Cay Conservation, Mamanuca Islands
Coral Cay Conservation (CCC) is a not-for-profitorganisation whose stated aims are to provideresources to help sustain livelihoods and alleviatepoverty through the protection, restoration andmanagement of coral reefs and tropical forests. CCCis self-financed through the use of internationalvolunteers. Operating in this manner, we are able toprovide opportunities to our host-country counterpartsthat would otherwise be prohibitively expensive on aneconomic and resource basis.
The main output from CCC projects is the productionof a detailed habitat map that is based on ground-truthed field data collected by our teams of volunteers.Overlaid onto this basemap is data on the conservationvalue of the marine habitats identified (Edinger andRisk, 2000), information on fish populations, live hardcoral cover and overall univariate biodiversitymeasures. The end product provides a highly pictorial,visually accessible and readily understoodmanagement tool. Ultimately, our in-countrycounterparts then use this tool in partnership withfundamental socio-economic and demographic dataas a basis for making informed managementdecisions. The marine reserves and Marine ProtectedAreas (MPAs) that result are based upon a soundscientific footing, at the heart of which lies the GIS andhabitat map created from field survey data extrapolatedwith the aid of an additional data source in the form ofremotely sensed data.
The data analysis and management procedure thatCCC uses is three fold. An unsupervised classificationusing an ISOCLASS/ ISOSTAT equivalent algorithmis used to identify spatially confined areas in whichspectral reflectance values are homogenous andthere it can be assumed that habitat variation will below. By contrast, areas of high spectral variability arelikely to have high habitat heterogeneity. Using thisinformation allows survey strategies to be tailored toconcentrate survey effort where it is most needed andtherefore make better use of the resources we haveat our disposal.
The field data we collect represents a multivariate‘snapshot’ of the benthic community present andcontains a semi quantitative abundance of some 150sessile organisms and substrates. This data isanalysed using the Plymouth Routines In MultivariateEcological Research (PRIMER) software. Firstly,each record is ordinated against all others based onthe abundance of the species observed in a Multi-Dimensional Scaling (MDS) process. A hierarchalcluster plot based on the Bray-Curtis similaritymeasure is then constructed which identifies naturalgroupings of site records where each of these groupsis representative of a habitat. These habitats are givena descriptive name using the data together with thegeomorphological area of reef in which they werefound. Finally, each habitat is given a quantitativedescription from the data and other variables suchas fish assemblages and conservation values areassociated with them. The field data we collect isspatially defined using GPS, allowing a list of GPSlocations of examples of each habitat is produced.
Image pre-processing steps we take are thegeorectification of the imagery, the development ofland and deepwater masks and, in the case of satelliteimagery where there are an appropriate number ofspectral bands, atmospheric correction using theMsixs radiometric transfer model and the constructionof a water column correction procedure following thatproposed by Lyzenga.
The georectification of the image is done using thepolynomial, rubber sheet, nearest neighbourresampling algorithm. In the case of multispectralsatellite imagery, land and deep-water masks aredefined by creating a band-ratioing model relying onthe disparity in attenuation of light of differentwavelengths in the water column. This method is not
Fiji Coral Reef Conservation Project,Mamanuca Islands- Coral Cay
ConservationJames Comley
Coral Cay Conservation

4 Pacific GIS/RS NEWS May, 2003
Coral Cay Conservation, Mamanuca Islands
SOPAC Completes Multibeam Map-ping of Penrhyn Atoll,
Cook IslandsRobert Smith, Simon Young
SOPAC
possible for tri-spectra aerial imagery. Instead, AreasOf Interest (AOIs) are digitised and manual digitalnumber recoding is done.
The water column correction technique we employ isbased upon the physical properties of light of differingwavelengths passing through the water column. Sitesof bare substrate of equal reflectance properties, butat different depths are found. Viewed on the remotely-sensed image, the disparity in spectral signaturebetween these sites can be attributed solely to thepresence of the overlying water column. If enoughreplicate sites are used, then the ratio of absorptionof red versus green versus blue light represents theeffect of the absorption of the water column. In thisway, a model is constructed that recodes the digitalnumbers of pixels to remove the spectralcontamination of the overlying water.
The next stage we perform following pre-processingis the development of spectral signature sets. Thespatially-located sites characteristic of each habitatare identified on the image. These ‘seed pixels’ arethen used to ‘grow’ AOIs based on user-defineddifferences measured by statistical variability aroundthat of the seed pixel. The resulting spectralsignatures of each habitat are examined using theimage histograms and the signature set is evaluatedand refined in a user-defined iterative process.
Using these signature sets, supervised classificationis then performed on the image. The two classificationmodels we use most commonly are the maximumlikelihood classifier and the minimum distance withnull class removal algorithm.
The resulting thematic map then undergoes a processof contextual editing using defined decision rules torecode any obviously misclassified pixels. Finally, a3x3 median filter is used in the post-classificationsmoothing of the image. Whilst this may reduce thefinal accuracy of the end product, it reduces thepixelated appearance of the image, making it a moreuser-friendly end product.
The Fiji Reef Conservation Project is a three-yearprogram that has been running since April of 2002following a successful pilot phase program.Approaching the end of year one, we are currentlyworking towards the production of habitat maps ofareas surveyed thus far. The resulting report will
contain geographicaldefined areas of highimportance to therestoration andc o n t i n u e dmanagement of theMamanuca Islands.
We are currentlyengaged in adiscussion with others t a k e h o l d e r sthroughout Fiji toassess the feasibility of Coral Cay extending its workoutside of the present study area.Further information on our organisation is available atwww.coralcay.org, or we can be contacted directly [email protected] or on telephone (00679)6511518.
The Ministry of Marine Resources of the CookIslands as part of their efforts to develop back pearlfarming in outer atolls requested SOPAC tocomplete a multibeam survey of Penrhyn Atoll. Thisis by far the largest atoll targeted to map entirelywith multibeam to provide an unprecedenteddataset of the whole atoll. Located around 9º South,157º 58" West the atoll is the most northern islandin the Cooks and one of the remotest. The atoll isrectangular in shape, 23 km in length and 15km atits widest. With a lagoon perimeter of 60km thelagoon has an area of some 189 km2. Being a ratherremote atoll presented some logistical difficulties.This meant all equipment including a suitable vesselto complete the multibeam survey were shipped toPenrhyn ahead of the arrival of the survey team.
Existing knowledge of the bathymetry of the lagoonwas limited to small-scale hydrographic chart dataand a lot of local assumptions as to lagoon depthand shape. From the air the lagoon can be seen tobe studded by a vast number of coral reef patchesindicating a complex morphology hidden by lagoonwaters.

May, 2003 Pacific GIS/RS NEWS 5
Multibeam Mapping in Penryhn Atoll
Penrhyn as viewed from the northwest. Picture provided byPolynesian Black Pearls)
with as much as 70% of the lagoondeeper than 50m. The seafloor is mostlyrocky with sediments confined to thedeeper portions of the lagoon and coralheads dominate the seabed.
Other survey work undertaken includedthe acquisition of current data on lagooncirculation, with the deployment of 4current meters and routine “ConductivityTemperature Depth” CTD profilemeasurements of lagoon water such astemperature, conductivity (salinity)dissolved oxygen, and turbidity. Inaddition seabed, water and biologicalsampling was completed to develop acomprehensive baseline dataset for thelagoon. These studies are aimed atproviding a data base in a GeographicalInformation System, GIS, to simplify andimprove coastal and oceanic marine
resource management of the developing black pearlindustry in Penrhyn Atoll.
To map the bathymetry of the lagoon a 200m eastwest line spacing along the entire length of thelagoon was completed with some 1000 kilometersof survey data collected. The results from thesurvey show the lagoon shape to be rather complex
The swathmapper creates a digital terrain model that can then be used to produce contour lines.

6 Pacific GIS/RS NEWS May, 2003
Downloading GPS Data to Laptop Computer in the Field
Downloading Trimble GPS Receiv-ers in the Field
Wolf Forstreuter, SOPACReece Gardner, GeoSystems
IntroductionSurveying and mapping in the South Pacific oftenrequires extended periods of time in the field.During this time the GPS rover unit cannot bedownloaded to the desktop computer. This articledescribes how Trimble GPS rover receivers may bedownloaded in the field (to a field laptop). Data filescan then be deleted from the GeoExplorer II toprovide more storage for further work.
GeoExplorer IIThe Trimble Pathfinder Office software CD containsa small file called load.exe. This file enables you todownload the GPS rover files directly to a directoryon a laptop computer without having PathfinderOffice installed.
Use the instructions below to download theGeoExplorer II using load.exe:o Locate load.exe on the Pathfinder Office CDo Copy the load.exe file to your target directoryo Switch to MS-DOS windowo Go into the target directoryo Connect the GPS rover and computer using the
serial cableo Switch the GeoExplorer II into Data Transfer
modeo Run load.exe
Figure 1: The GeoExplorer 3 with attached serial clip
Figure 2: The GeoExplorer 3 in position during datadownload
The data files will be transferred to the laptopcomputer and you can delete the files from theGeoExplorer II.
GeoExplorer 3To download a GeoExplorer 3 the Pathfinder Officesoftware must be installed on the laptop computer.In the office the GeoExplorer 3 is downloaded usingthe Support Module and a power supply. In the fieldthe GeoExplorer may be downloaded using theserial clip (Figure 1).
Use the instructions below to download theGeoExplorer 3 using the serial clip:o Attach the serial clip to the GeoExplorer 3o Connect The GeoExplorer 3 and computer usingthe serial cable (null-modem)o On the GeoExplorer 3 go to the SYS Setup screenand select Configurations, then select COMMSo Change the Data transfer setting from Supportmodule to Serial clip. The RTCM input and NMEAoutput settings should be set to Off.o Initiate data transfer from Pathfinder Office in theusual manner.
Again, once the data files have been transferred tothe laptop the files on the GeoExplorer 3 can bedeleted making memory available for further work.
May, 2003 Pacific GIS/RS NEWS 7
GPS Survey in Southwest Viti Levu
This project was initiated by the joint purchasing ofIKONOS images that covered the Navua, Korolevuand Sigatoka areas by SOPAC, the MineralResources Department and the University of theSouth Pacific (see last newsletter). To beable to use the images as suitablebackdrops, they first had to be rectified.The Public Works Department providedtheir roads network layer but the surveyedroads consisted mostly of the major roadsand those they maintained. Some of theareas covered by the satellite images hadlittle or no roads covered by the PWDroads layer, so this survey was setup tocover some of the smaller roads andlogging tracks that would provide importantground control points for the imagerectification process.
The Global Positioning System units usedto conduct the survey were GeoExplorer IIunits from SOPAC and a GeoExplorer IIIunit from the Mineral ResourcesDepartment. A car antenna was used withone of the GeoExplorer II units.
The GPS units were set up to log positional data ata five-second interval that was changed on the
GPS Survey in Southwest Viti Levu
Jeremaiya Taganesia
second day to a one-second interval to improve theaccuracy and quality.
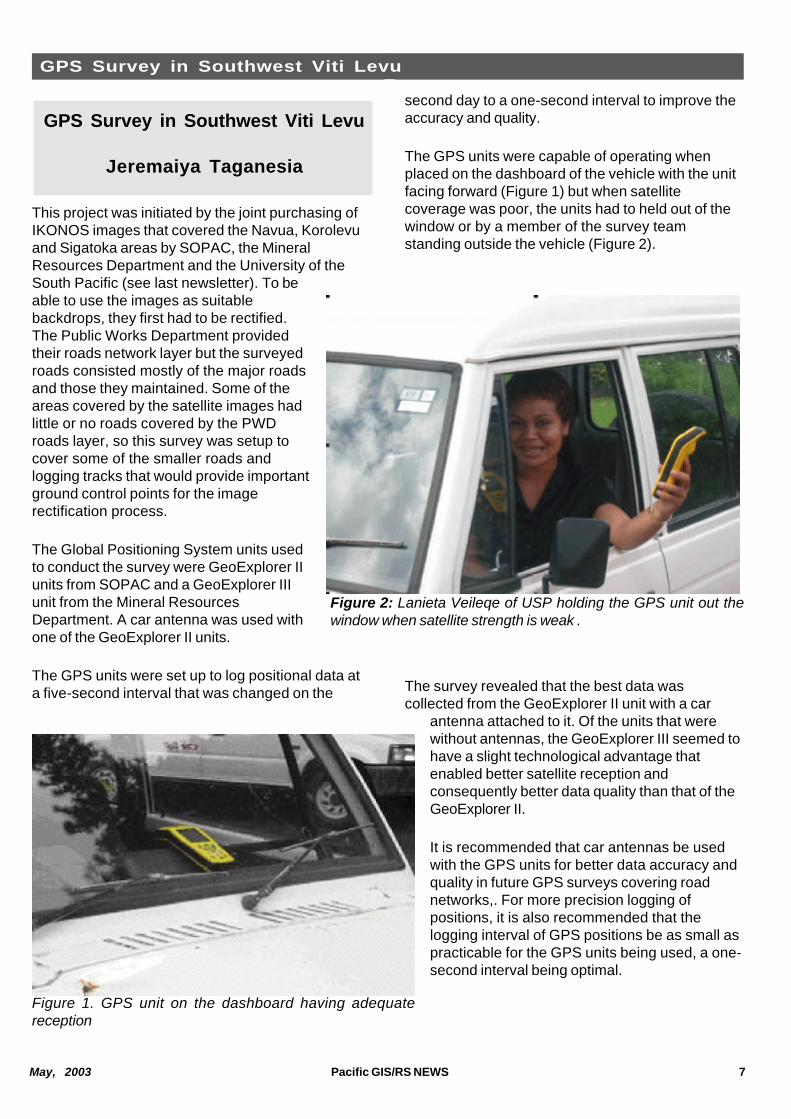
The GPS units were capable of operating whenplaced on the dashboard of the vehicle with the unitfacing forward (Figure 1) but when satellitecoverage was poor, the units had to held out of thewindow or by a member of the survey teamstanding outside the vehicle (Figure 2).
The survey revealed that the best data wascollected from the GeoExplorer II unit with a car
antenna attached to it. Of the units that werewithout antennas, the GeoExplorer III seemed tohave a slight technological advantage thatenabled better satellite reception andconsequently better data quality than that of theGeoExplorer II.
It is recommended that car antennas be usedwith the GPS units for better data accuracy andquality in future GPS surveys covering roadnetworks,. For more precision logging ofpositions, it is also recommended that thelogging interval of GPS positions be as small aspracticable for the GPS units being used, a one-second interval being optimal.
Figure 1. GPS unit on the dashboard having adequatereception
Figure 2: Lanieta Veileqe of USP holding the GPS unit out thewindow when satellite strength is weak .

8 Pacific GIS/RS NEWS May, 2003
Linking Access to MapInfo
IntroductionMost GIS products combine spatial data and tabulardata. The spatial element points such as, lines orpolygons have a record in an attached table. MapInfoautomatically creates a table when generating a newspatial data layer. In many established GIS thisMapInfo table stores all attribute data. The linkbetween tabular and spatial data is provided, but theuser is limited to the MapInfo facilities based ondBASE when analysing the tabular data content.MapInfo can also import Access tables, with a mapelement created for each record. This enables theanalysis of the tabular data content in an Accessenvironment without it being limited to MapInfo’sdBASE structure. However, changing of the tablestructure is difficult and the tabular database has toinclude the MapInfo ID for each record.For four years, SOPAC is proposing to link tabulardata and MapInfo spatial data by a unique identifieronly. This allows keeping the tabular data contentseparate from the map spatial data and only linkingit, if required for spatial data analysis.
The Spatial Data ComponentWhen creating the MapInfo layer or spatial datacomponent the operator must have in mind whichtabular data he wants to attach at a later stage. Themap element must be able to be linked to one onlyrecord. Therefore, it is important to have a well-
structured tabular database first before creating theMapInfo layer.As told before, a MapInfo spatial layer automaticallycreates a table. When the operator wants to link thespatial layer to an Access table at a later stage, thistable only requires two fields: 1) an unique identifierand 2) a field for the spatial content.The unique identifier is a number or character string,which is identical with the one in the correspondingrecord of the tabular database (in the examples shownin figure 1, the field MeterNo), which later will be linkedto the map element.The field for the spatial content will be:a) X and Y coordinates (like in our example) for point
features,b) a field LENGTH for line and polyline elements andc) an AREA field for regions (polygon) elements.
The Tabular DatabaseThe tabular database, typically an Access database,must have a corresponding table, which containsrecords having the same unique identifier, which is inour example the meter number. The table also shouldcontain a field for the spatial content.
Linking Access and MapInfo TableTo link the Access database with the spatial data layeryou have to first import the corresponding Access tableand then link it with the MapInfo table through a SQLstatement.The import of the Access table happens by openingit in MapInfo. Then, you have to make the tablemappable where you have to select the sameprojection employed to the corresponding MapInfotable. The sequence is Table, Maintenance, Structure,click on mappable, select projection. Finally you addthe table to the active map window.The linking of both tables is performed through SQLSELECT in MapInfo. The steps within the SQL menuare as follows (see figure 2):a) select both tablesb) set condition “link tables for all records where
unique identifier of MapInfo table equals uniqueidentifier of Access table”
c) store selection into LinkTableThe temporary LinkTable, which contains the fields ofboth tables (see figure 3), can be addressed like asingle table. It is possible to create a thematic mapcolouring the map features, which are part of theMapInfo table (in our example the meter), due to
Figure 1: Creating the MapInfo table containingunique identifier and fields for spatial content
Linking Access Tabular Data toGIS Layers
Wolf ForstreuterSOPAC

May, 2003 Pacific GIS/RS NEWS 9
Linking Access to MapInfo
content stored in the Access table such as meter type.It is also possible to label the map features withcontent stored in the Access table.The procedure contains several steps and seems tobe complicated, however, though MapBasic a smallroutine can be written which performs all stepsautomatically.
The Importance of the “Field of SpatialContent”In many cases MapInfo is only used to provide thespatial overview, in other words a map display. Moreadvanced users may want to carry out additionalspatial analysis. Having a display of pipes for theRarotonga Waterworks is not sufficient the utility wantsto know the length of pipes within one suburb. Suchan analysis requires two steps:1) filling the field for the spatial content in the MapInfo
table and2) bringing the spatial content across to Access.To fill the field of spatial content MapInfo providesa facility allowing the calculation of length, position orarea of the map elements. The sequence is: Table,Update Column, select the field for spatial dimension,Assist, select spatial dimension and all records willbe filled with the corresponding position, length orarea.The easy way to get spatial content across toAccess is to export the MapInfo table and thensubsequently import it to Access. Then, both tableshave to be linked through the unique identifier. InAccess an UpdateQuery transfers the data from thetable exported from MapInfo to the correspondingAccess table.
Figure 3: Filling the field of spatial content usingMapInfo tools
Again this procedure seems to be complicated asmany steps are involved, however, also this procedurecan be handled by a routine where MapInfo is calledwithin Access environment. Then the MapInfo exportincluding the exit of MapInfo is handled by a MapBasicroutine.
SummaryIt was noted that in several SOPAC member countriesGIS application created two databases, one set ofMapInfo tables and a separate set of Access tables.Too often the link between Access and MapInfo waslost, after the map elements were created from theimported Access table. The consequence was thatusers keep two sets of tables, where both are notupdates; the MapInfo tables do not have the latestinformation of the Access database and the Accesstables do not have the updated spatial information.To handle both tables in the described way allows aneasy handling (cleaning) of the spatial data layer as allrecords must have a graphic object and a uniqueidentifier. The spatial data layer keeps a small file sizeand can be distributed easily. The tabular data set canbe handled totally independently in Access, whichenables many more database handling tools thanMapInfo can offer for the tabular data.Hopefully this will eliminate the current practice of twodifferent databases in MapInfo and in Access runningparallel, both having to be updated separately.
Figure 2: Linking the MapInfo table and the Accesstable through a SQL query into a combined table calledLinkTable

10 Pacific GIS/RS NEWS May, 2003
Settlements in Nasinu Town, Suva
BackgroundThe Nasinu town council wanted toanalyse how the Suva suburb Nasinuwas growing during the last 20 years.Nasinu town was growing fast dueto the low-cost housing.Aerial photographs were rectified andmulti-temporal imagery wereproduced out of the rectified imagelayers as described by SilikaTuivanuavou in news letter 1 - 2002.Now, the Nasinu town council wantedto have exact figures of houses builtin the three periods:o In and before 1973o Between 1973 and 1986
o Between 1986 and 1996.
(Figures 1 and 2)ESCAP financed a GIS analysiswhich was carried out by SOPAC.
Settlement in Nasinu Town, SuvaElizabeth Lomani, SOPAC
Figure 01: Layer 1996 (left) and layer 1986 (right) displayed together in separatewindows to verify the interpretation.
Figure 2: Result of GIS analysis, The colours of this sub-area indicate inwhich period the houses were constructed. Red houses were constructedbefore 1973, green houses were constructed between 1973 and 1986and blue houses were constructed between 1986 and 1996.

May, 2003 Pacific GIS/RS NEWS 11
Settlements in Nasinu Town, Suva
GIS AnalysisFour different layers were available for the GIS analysis(see S. Tuivanuavou newsletter 1 - 2002):o Multi-temporal image layero The rectified aerial photographs 1973o The rectified aerial photographs 1986o The rectified aerial photographs 1996
Another layer was produced by digitising the Nasinutown boundaries to separate houses outside of Nasinufrom the ones located within the town. Then, threelayers were created one for each of the three timeperiods. The digitising of house locations started withinthe oldest houses built during or before 1973 thencontinued with the houses constructed between 1973and 1986. The layer 1996 was digitised last. It appearedto be practical to toggle between the multi-temporallayer and the black and white layers. It also proved tobe practical to display two layers in separate windowsfor direct comparison (Figure 1).
ResultsBefore the aerial photographs were recorded in 1973,749 houses had been constructed. Between 1973 and1986, 3540 houses were built and between 1986 and1996, 6732 houses were constructed. The areaoccupied by settlements was 60 hectare in 1973 andincreased by 457 hectare by 1986. By 1996, a further843 hectare were occupied by settlements, (Figure3).If this trend continues 1260 hectares will be requiredby 2010 if the type of settlement does not change(Figure 4).
Figure 3: Area occupied by houses in the years 1973,1986 and 1996
Figure 4: Extrapolation of required space for hous-ing if current trend continues like before.
? GPS Road Mapping exercise was carried out onEfate. The road network will serve as thebasemap for the rectification of the IKONOSimagery covering Efate.
? Imagery for Tuvalu and Samoa will also beordered once quotations come in.
? The commissioning of the new swath mapperwas carried out and work has begun for the FijiProject Area on the South East coast of Viti Levu.The area selected will cover Naselai to Momi.
? Franck Martin represents SOPAC at the nextSPC population GIS steering committee meetingin Noumea, New Caledonia. The objective of theproject is to improve access to data and make itpossible for Statistical Offices to produce exactlywhat planners need, whenever they need it.
? Wolf presented at the Head of Forestry meetingin Nadi to explain how the EU project can assistin vegetation monitoring of water catchments.
? The project will also focus on GIS&RS supportfor utilities and will start in Vanuatu shortly.
EDF 8 Project Updates

12 Pacific GIS/RS NEWS May, 2003
GPS Base Stations
GPS mapping in the South Pacific mapping is wellproven and widely used.During my recent visit to Suva, Fiji, I visited many or-ganizations and it was exciting to see so many peopleusing GPS to help them in their work. I was concernedto hear, however, that organisations seem to be work-ing independently with regards to establishing basestations.Fact: A single GPS base station in the Suva area willsatisfy the needs of EVERY GPS user within a rangeof 200 - 300 km.It would be great to see organisations working together,rather than duplicating effort and infrastructure.SOPAC has made excellent advancement in this areaby establishing a permanent base station that isuploading data to the Internet every hour. The data fromthis base station is available freely to any user withInternet access. The SOPAC base station antenna ispartially obstructed by some nearby trees. Obviously,the base station operation would be improved by mov-ing the antenna to a better site or trimming the offend-ing trees.
SOPAC is looking to make changes to the website(http://www.sopac.org.fj/gps/ssf/) and the data struc-ture to provide faster access for remote users.In New Zealand, Land Information New Zealand (LINZ)and the Institute of Geological and Nuclear Scienceshave together established a network of base stationsthat cover the North Island. The data from these basestations is available freely to any person with Internetaccess. If you are interested take a look at: http://www.linz.govt.nz/positionz
The tropical forests of Fiji are among the most unu-sual in the world. Fiji harbours a large number of spe-cies and genera with links to the ancient supercontinentof Gondwana, including the most primitive floweringplants in the world and unique groups of iguanas andparrots. Like Madagascar and New Caledonia, theplants and animals of Fiji suggest that the islands area long-isolated remnant of a continental terrains. Theforests are unusually diverse for oceanic islands andhave strong links to those forests further west e.g.,New Guinea. Fijian forests also contain a wealth ofendemic species spawned from the long isolation ofthe archipelago. This combination of features makesFijian biodiversity highly distinctive at a global and re-gional level. Unfortunately, the forests of Fiji are alsothreatened. Centuries of deforestation for agricultureand settlement in the lowlands, and today’s exploita-tion of remaining native forests for timber and planta-tions are reducing the last remaining blocks of Fijianforest. In order to promote the rational use of renew-able resources, we will work with the Ministry of Fish-eries and Forests of Fiji, the Fijian Department of theEnvironment, the National Trust of Fiji, the Native LandTrust Board, SOPAC, the University of the South Pa-cific, the forestry industry within Fiji, local NGOs, andlocal communities to help implement the conserva-tion vision for Fijian forests developed in the NationalBiodiversity Strategy. Specifically, we intend to workwith the forestry sector and private landowners toprioritise different areas for conservation and resourceextraction across whole landscapes, and to developforestry certification guidelines that help achieve land-scape-level conservation and renewable-resourcegoals. This process will include:1) identification and mapping of representative
conservation areas and corridors,2) mapping of forests in terms of their value for
ecosystem services and non-timber forestproducts,
3) guidelines for minimum-area requirements forsensitive species and ecological processes,
4) identification of focal species for monitoring and
Figure 1: SOPAC GPS base station antenna on topof the MRD building in Mead Rd., Suva. The treesare visible in the background.
GPS Base StationsReece Gardner
GeoSystems, New Zealand
Implementing the NationalBiodiversity Strategy for theTropical Forests of Fiji: BuildingConservation Landscapes intoForestry Operations & ForestCertification
David M. Olson, WCS South Pacific

May, 2003 Pacific GIS/RS NEWS 13
Implementing the National Biodiversity Strategy of Fiji
management, and5) recommendations for land-
scape features and manage-ment prescriptions for pro-tected forests, exploitedforests, and plantations.
Because the pace of deforestationand logging is rapid, and remain-ing blocks of forests are increas-ingly broken into smaller blocks,there is a limited window of oppor-tunity to put in place a long-term,landscape-scale conservationstrategy for Fijian forests. Thisstrategy should effectively addressconservation goals at the land-scape level, as well as help refinemanagement guidelines for pro-duction forests, plantations, and protected natural for-ests to ensure that they conserve biodiversity, main-tain ecological services, and meet the needs of localpeoples and economies. Fiji is interested in access-ing more international markets for its timber productsby making them more attractive through a robust cer-tification process. A major aim of this project is tointegrate landscape-scale conservation and renewableresource issues into certification guidelines. If suc-cessful, Fiji’s wood products would be recognised asone of the very few operations in the tropics wherethis has been accomplished. This would represent amajor selling point for international markets.
The Fiji National Code of Logging Practices specifiesoperational details concerning logging equipment,construction of roads, skid trails and landings,
protection of watercourses, equipment safety, andtraining. Environmental concerns are largely focusedon reducing erosion through slope restrictions, streambuffers, and road-building guidelines. Forestrycertification efforts, spearheaded internationally by theForest Stewardship Council, have also made greatadvances in identifying forestry practices that arecompatible with reducing environmental damage atlocal scales. The problem, however, is that guidelinesfor logging practices and certification requirements forlogging operations typically do not address landscape-scale requirements for the conservation of biodiversityor ecological services. In order to design effectiveconservation and resource landscapes, severalimportant questions dealing with landscape-scalepatterns and processes need to be fully addressedincluding:
? How much habitat area is required to maintainviable populations of the most area-sensitivenative species?
? How much habitat area is required to maintainpopulations of these species to ensure theirecological function, such as seed dispersal orpollination, is maintained throughout the ecosys-tem? (Note: Species densities for functionalitymay be greater than for viable populations).
? What kind of replication of conservation areas isnecessary to maintain the long-term persistenceof wide-ranging species in Fiji?
? Can forestry operations be designed to reducethe impact of habitat fragmentation on sensitivespecies? Which species are most sensitive to
The tropical forests of Fiji are among the most unusual in the world. Fijiharbours a large number of species and genera with links to the ancientsupercontinent of Gondwana
WCS is working with the forestry sector to further im-prove logging practise and towards certification

14 Pacific GIS/RS NEWS May, 2003
Training GIS Backdrop Production
fragmentation?? Are there certain forestry practices that should
be avoided or encouraged to promote the persis-tence of non-timber forest products in harvestedareas and across whole landscapes?
? How should forested watersheds be managed tomaintain critical ecological services, such asflood control or persistent stream flow?
? What level of connectivity between forest blocksis necessary to maintain landscape-scale move-ments of key species and gene flow, seed dis-persal, and pollination among populations ofharvested species? How wide should corridorsbe to be effective? What level of habitat degra-dation is acceptable?
? How important are lowland forests to variousfocal species (e.g., shining parrots) and howshould altitudinal habitat corridors be designed tomaintain seasonal movements or provide ac-cess to lowland cyclone refugia from mobilespecies?
? How should forestry operations and conservationareas be designed to minimize the spread ofalien species into natural forests?
It is these kinds of issues that will ultimately determinethe fate of many species and ecological processesacross landscapes, and the sustained renewal of natu-ral resources and ecosystem services for Fijians. Wehope to help bridge the gap between forestry codesand certification and new approaches in designing ef-fective Forest Resource and Conservation Land-scapes. Such landscapes, which map forestry pro-duction zones, core conservation areas, bufferszones, and habitat corridors, are the most cost-effec-tive way to ensure that extinction is halted and naturalforests continue to provide renewable resources andecological services into the future.A successful strategy for Fijian forests can act as amodel for other forest situations throughout the Pa-cific and beyond. Close collaboration between theWildlife Conservation Society, the government of Fiji,the forestry sector, Fijian biologists, and local com-munities is critical to accomplish this work and to en-sure the results are implemented on the ground.GIS will be a critical tool for conducting the analysesand presenting results of this project. Basic coveragessuch as topography, villages, hydrology, current natu-ral forest cover, forest classifications, provinces, andland tenure will be required for most analyses. Weare conducting field research and working with spe-cialists to develop maps showing distinct biological
communities across Fiji. These are used to assessthe contribution of different conservation areas towardsrepresenting the full range of forest communities.Special features, such as caves and ancient trees,are also to be highlighted as points. Forest cover datawill be queried to identify larger blocks of intact forest,optimal corridor areas, and remote forests where ratsand other alien species occur at lower densities.Forested watersheds will be analysed to assess theirrelative value for ecosystem services such as floodcontrol and water retention. We look forward to work-ing with the GIS community on this project.
A Project of the Wildlife Conservation Society,Supported by the USAID/EAPEI
David M. Olson, Program Director, WCS SouthPacific, 11 Ma’afu Street, Suva, Fiji
Tel: (679) 331-5174, E-mail: [email protected]
Training GIS Backdrop ProductionWolf Forstreuter, SOPAC
The SOPAC-EU project will purchase high-resolutionsatellite image data for all Pacific ACP countries. Thisimage data will allow the production of imagebackdrops usable at 1:10,000 scale.A scale of 1:10,000 will be the operational level ofsurvey and analysis for most parts of the project areain Fiji. Maps at this scale are not available in Fiji exceptfor very small sub-areas. High-resolution image datawill fill the gap, however, images have to be convertedto GIS backdrops before they can be utilised. Thetraining will ensure that GIS backdrops are producedand employed by stakeholders in Fiji.During training the participants converted IKONOSimages into GIS backdrops usable in MapInfoenvironment. The first step was the imagerectification, where the DGPS survey road networkwas used as reference. This data was kindly providedby PWD. Then, the participants learned how toregister the image data in MapInfo by editing thecorresponding MapInfo TAB files.One training result is that all participants gainedthe confidence in producing GIS backdrops, now.This will have two effects:1. More people will understand and utilise GIS
backdrops. So far the participants came from 10

May, 2003 Pacific GIS/RS NEWS 15
Training GIS Backdrop Production
different stakeholder groups of the EU-SOPACproject. Experience shows that this has asynergistic effect and other staff within thestakeholder organisations will learn from thetrainees, now. This will bypass the use of digitisingtables, which are problematic in the tropicalenvironment.
2. The trainees will continue to produce GISbackdrops. They learned the most difficult GISbackdrop production, which is the conversion ofhigh-resolution image data. Apart from images,physical maps also available can be converted toGIS backdrops. This is much easier as they arealready in orthogonal projection and just the
Figure 1: Multi-spectral IKONOS image data after image rectification to FijiMap Grid. The DGPS surveyed road network (red overlay) provided by PWDwas used as reference. The image shows Pacific Harbour at the South Coast ofViti Levu, Fiji
distortion during the scanningprocess has to be correctedby a linear transformation.The other result is theavailability of the backdrops assuch. They now allow otherusers to do imageinterpretation with costeffective GIS software ratherthan purchasing expensiveimage analysis software.Furthermore, they enable otherspatial analysis to beperformed at 1:10,000 scaleusing these backdrops as mapreplacement. It was mentionedbefore that there are no mapsat 1:10,000 scale.In Fiji, image analysis includinggeometric correction of imagedata is not new. Theparticipants of the first traininggroup have the requiredsoftware and just need a
nudge to stimulate further backdrop production andsubsequent utilisation.Currently, the GIS backdrops ended at the coastlineas they were no reference points, which could be usedfor the offshore areas of the images. A method mustbe developed to rectify the part of the image dataextending from the shoreline into the sea, because itis very important to employ the image backdrop forreef mapping, coral monitoring and other nearshoremanagement activities. The multi-beam mapperpurchased under the SOPAC-EU project will providethis, see Quan Chung et al. GIS & RS for Pearl FarmManagement in Manihiki, Newsletter 1 - 2002.Such training will be carried out in the other PacificACP countries which are all part of the project. In Fiji,further training demand was addressed by differentstakeholders and the training will be repeated.Unfortunately, the number of participants has to belimited to 6 people per course due to restrictions onspace and available computers. Future training willinclude image to image rectification allowingquantitative change detection of vegetation andshoreline.
Figure 2: At SOPAC Talanoa club after handing outthe workshop certificates.

16 Pacific GIS/RS NEWS May, 2003
GPS and GIS Improvement at theNative Land Trust Board in Fiji
Silika Tuivanuavou
GIS and GPS Improvement at NLTB, Fiji
IntroductionFrom May 13, 2002 to September 15, 2002, NLTBunderwent training in the use of GPS by theconsultant based at SOPAC, Fiji. This training wasfunded by ADB upon request by NLTB for the quicksurvey of its native leases to facilitate fast issues ofleases, which is politically important in Fiji. Theconventional survey used by NLTB described in thefollowing chapter was slow and this projectovercame this problem.
The Conventional Survey at NLTBA conventional survey required a “point of origin”with known coordinates to be used as a basis forthe survey. One day was normally set aside toidentify such a point. This can be a trigonometricpoint or an old survey mark. Even then, the surveymark once identified in the field was also required inthe survey to verify the coordinates. Identifying andgetting the survey plan can take up to more than aweek.For the conventional survey three instruments werenecessary, a measurement tape, a compass and aclinometer. One person records the compassbearing and inclination in his notebook, while twoother people handled the measurement tape andmeasuring the distance to the next peg. However, ifthere is a change in slope a point had to beestablished to which the distance was to be notedallowing a calculation of horizontal distance later inthe office. If there was an obstacle to the directboundary line, the team had to survey a line aroundthe obstacle, which required additional compassbearing and slope readings.The sketch map and notebook was then handed tothe draughtsman at the office after the field trip. Thedraughtsman then calculates a polygon in thehorizontal plane out of the recorded bearings,inclinations and distances. If the calculation doesnot result in closing the polygon, the team has toredo the survey. This will always be the case even ifone recording was missing or wrong.Once the polygon of a survey is closed, then thedraughtsman can draw the plan and calculate thearea. The draughtsman then digitises the plan to getthe information into InfoCAD where he is able to plot
a map. The described draughting work takes aboutone-week for a one-day field survey.However, the new way of mapping creates digitalposition data in the field, which is directly importedto GIS, where calculations are performed semiautomatically.
The New Way of MappingCarrying out the survey with GPS equipmentrenders it unnecessary to identify a point of origin.Every GPS recorded point automatically has X andY coordinates in a known projection. Distancemeasurements and subsequent recordings ofinclinations and distances are not necessary. Thesurveyor just stores a number of GPS readings forevery point in the instrument, which will be averagedto provide exact coordinates. He also records hisway from peg to peg in the GPS data storage.A normal residential plot requires about 8 to 10minutes. In addition the surveyor records the outlineof the houses within a plot, which takes an averageof 12 to 15 minutes per house.Back in the office the surveyor himself and not athird person does the area calculation andcomputerized drawing. After downloading the GPSdata he edits the map on the screen with plot andpeg number as well as a scale bar. The areacalculation and the calculation of distances from plotto plot is handled by the software. In addition to theprocedure before, the surveyor carries out twoadditional activities:a) he calculates the position for every peg, which isan important documentation andb) he displays the lots on a 1:50,000 backdrop,which allows easy identification of their location
Figure 1: Position recording of a fence post used as bound-ary marker in a corner of an residential plot, which has tobe separated from agricultural lease area .

May, 2003 Pacific GIS/RS NEWS 17
GIS and GPS Improvement at NLTB, Fiji
The introduced method of mapping anddocumenting landowner boundaries is moreaccurate and especially much faster than theconventional way of mapping used at NLTB before.This could be transferred to other organisations inFiji and other Pacific Island Countries.One to two maps a day of land parcels wereproduced jointly during the training by the teamswho were in training and transferred to NLTB HeadQuarters. Maps wereaccompanied by a field report.These field reports providedadditional documentaryinformation of the x, y positionof the markers indicating theboundaries, the distance inmeters between the markersand the position of the houseson the land parcels. The mapand report production continuedafter the teams were trained,The spatial information of landparcels is stored in the divisionsand centralised at NLTB HeadQuarters, ready to betransferred to other governmentdepartments if requested. Theworkshop carried out in thethree divisions demonstratedthat NLTB personnel are nowcapable of undertaking mappingabout 10 times faster thanbefore. This is also reflected inthe NLTB internal reports.
The first step of a lease survey was the preparationof a locality map. Maps at the suitable scale of1:10,000 or larger do not exist for most areas in Fijiand the survey team had to draft a sketch map fromavailable resources such as the 1:50,000topographic maps or historical land ownershipmaps at the scale of 1 inch to 16 chain.The map editing and calculations of areas, peg topeg distances and peg positions took about 45minutes for 30 to 40 plots. Finally, the surveyorwrites a field survey report which should take him
Figure 2: To avoid multiple path houses were recordedseveral meters away from roof and house walls. Torecord a house 8 points were recorded, see figure 3
Figure 4: The GPS survey displayed in the field office after the editing by thefield survey staff. The boundary pegs and the parcels are numbered and thecorresponding records of the attached tabular database show the peg x, yposition and the parcel size as an automated GIS calculation. The house lo-cation (green) is clearly visible. Another map of the same field report showsthe distance from peg to pep, which helps the re-identification at a later stage.
Figure 3: For every house 8 points were recorded inline with the wall, which later were joined within theGIS to create the outline of the house. Thisprocedure does not fulfill the requirements ofcadastral mapping. However, it provides a clearpicture of house numbers and house locations withina lease area.

18 Pacific GIS/RS NEWS May, 2003
GIS For FEA
about ten minutes as all tables a) lot table showingarea, lease type, name of tenants and file recordnumber b) peg table showing coordinates of thepeg positions and peg type just have to be importedby copy and paste from Excel to the correspondingword document. The different maps showing a) plotoutline, b) peg number, c) distance from peg to pegand d) the lots on 1:50,000 backdrop are directlyimported as JPEG images which takes one or twominutes to execute.Within one day, one person alone should be able tocarry out a) fieldwork, b) map editing and c) reportwriting for about 15 to 20 residential lots dependingon the number of houses on the lots and the timerequired driving to the place and back. Thesefigures do not include discussions of disputedterritory between land-owners. This should besolved before the survey takes place. Agriculturallots require much more time due to their larger size.In addition, these lots often have creeks asboundaries, which have to be followed manuallywith the GPS and this can require more time thanthe usual boundaries.
ResultsThe mapping performance recorded in the NLTBinternal reports also shows that staff working withthe new equipment became highly motivated afterfirsthand experience of the timesaving effect of thenew mapping system. The workshops in thedifferent divisions drew an overwhelmingenthusiastic response from the divisional NLTBmanagement when the field staff demonstrated thenew way of map production. During the finalworkshop most organisations present wereimpressed by the high-resolution GIS backdrop andthe technical method of screen digitising from theback-drops avoiding digitising from maps ondigitising tablets, which are sensitive in tropicalenvironment. This also applied to the handling oftabular data in Microsoft Access database andlinking this tabular data through a common fieldrather than importing the complete table into the GISsoftware. NLTB can now realistically present animage of a professional and modern organisationusing sophisticated mapping methods which isfundamental to their daily mapping work.The purpose of the project, which was to increasethe speed of mapping by NLTB, has been fulfilled.GPS units left in the project are being utilised on adaily basis. Comparing the old and new methods,the increase in mapping speed is estimated to beabout ten times.For further information contact:Silika Tuivanuavou, [email protected]
IntroductionIn today’s competitive world, a successful utility mustmake maximum use of its resources, from people toequipment to information. Using GIS to integrategeographic with other corporate data has becomeabsolutely vital to this task.
In 1998, Fiji Electricity Authority (FEA) set up its GISwith initial funding from regional EU funded energyproject. SOPAC was contracted to carry out the initialGIS development and training. However, plans toextend the project were halted as Management shelvedthe project a year later. After a lapse of more than 5years, the FEA Drawing Office has been given thegreen light to re-activate the project in developing aGIS for the FEA Distribution Network.
GIS for FEAWith the main operation of the Drawing & Survey Officenow located in Suva, work has begun with SOPAC toprepare baseline data required for the GIS. Thisongoing activity will include converting hardcopydistribution network drawings to digital or electronicformat over the next 3 years and capturing new datathrough GPS. FEA purchased 2 handheld TrimbleGPS units, GeoExplorer III, from GeoSystems NewZealand.
The tabular database will contain a record of all itsdistribution assets and keep track of maintenance andservicing of most of its overhead equipment. Theinformation can be accessed and used duringoperations and for monitoring the distribution system.
FEA plans to capture specific features in Suva overthe first 3 months of the project and later expanding tomap the remaining Central Division.
Geographical features captured include:Point features:? Pole positions? Pillar boxes? Underground cable joints
GIS for Fiji Electricity Authority
Timoci Bavadra

May, 2003 Pacific GIS/RS NEWS 19
Opportunities for Remote Sensing
? Street light column
Line features:? Electrical Overhead conductors? Underground cable
The meter locations will be captured by on screendigitizing from IKONOS high-resolution image data(see figure 1).In preparation for the project, integral members of theteam have been on training sessions.
A joint one week-long training session with TelecomFiji was conducted by Wolf Forstreuter, SOPAC atthe Vatuwaqa Telecom Training center. Componentscovered as follows:? GPS data enhancement in Pathfinder Office,? Map editing in MapInfo environment? Report design in MS Office environment.
In a separate training session, Reece Gardner,GeoSystems (New Zealand) conducted a TrimbleGPS Mapping Course in Suva. The two-day coursecovered Trimble GPS Mapping Systems covering fieldand office operation.
FEA relies on maps for operational purposes. GISwill allow a faster response to customer.
Following a series of meetings during the 11th PacificRegional Disaster Managers’ Meeting in Sigatoka, Fiji,May 5th - 7th 2003, a collaborative relationship wasestablished between SOPAC and the Hawaii Synergyproject. The Hawaii Synergy project is one of severalefforts sponsored in the United States by the NationalAeronautics and Space Administration (NASA). Thegoal of the national program is the promotion of theuse of data from NASA’s satellite such as Landsat 7,Terra and Aqua. The Hawaii Synergy project is run outof the University of Hawaii in Honolulu, USA, and hasas its focus the use of NASA data for disaster mitiga-tion and preparedness in the southwest Pacific.
Hawaii Synergy’s Dr. Peter Mouginis-Mark (PrincipalInvestigator) and Mr. Blair Craig (staff scientist) metwith SOPAC’s Dr. Wolf Forstreuter and Alan Mearnsto discuss collaborations in Fiji and the SW Pacific.Two of Hawaii Synergy’s current projects offer goodpromise for local GIS and remote sensing projects.First, the capability to produce cloud-free images ofwhole islands using data from the Landsat 7 spacecrafthas been developed. Individual images of most PacificIslands have at least some clouds in them, and soHawaii Synergy has developed techniques for theremoval of these clouds via the combination of severaldifferent images collected several weeks or monthsapart. As a test of this method, a cloud-free image ofFiji (Figure 1) has been prepared from segments ofsix different Landsat 7 scenes.
Landsat 7 obtains data that have a spatial resolutionof 30 m/pixel in multispectral mode, and 15 m/pixel inpanchromatic mode. As a result, these cloud-freeLandsat images may be used for numerous differentapplications that call for image base-maps at a scaleof 1:50,000 (colour) or 1:25,000 (panchromatic).Mapping watershed boundaries can be aided by such
Hawaii Synergy Project Offers NewOpportunities for Remote Sensingof Pacific Islands
Peter Mouginis-Mark and BlairCraig, Hawaii Synergy project,University of Hawaii at Manoa,Honolulu, Hawaii, USA.
Figure 1: FEA vector data of street lights, overheadlines and power poles. The map backdrop is a1:10,000 IKONOS multispectral image.

20 Pacific GIS/RS NEWS May, 2003
Opportunities for Remote Sensing
maps because they enable the entire island to beviewed at constant scale. By virtue of the manydifferent scenes that have been collected over thesame area, it is also possible to detect changes inthe pattern of vegetation due to forestry, or in coralreefs due to coastal sedimentation. In some instances,large-scale changes in beach geometry due toharvesting of aggregate for building materialsmight also be detected.
A second project that Hawaii Synergy hasestablished may also help SOPAC.Considerable experience has been developedin the production and analysis of digitalelevation data from radar measurements.Digital topography is particularly useful for themapping watersheds, as well as the predictionof areas that might be affected by landslides.These data have also been used in some partsof the Pacific to predict where storm surgesmay affect parts of a coastline. Numericalmodels that predict where a lava flow may goalso use these topographic data. The mostrecent example of the topographic work thatHawaii Synergy has completed is shown inFigure 2, which is a shaded relief image of theisland of Savai’i, Samoa.
TOPSAR data have a spatial resolution of 5 m/pixel,and a vertical accuracy of about 2 meters. The dataare collected from an aircraft, and so it is not possibleto collect these data over all Pacific Islands, but thereis the possibility that the next TOPSAR deployment tothe Pacific (planned for 2005) could be requested tocollect data over specific SOPAC areas of interest. Inaddition to working with these TOPSARmeasurements, Hawaii Synergy has also developedin-house capabilities to produce digital topographicmaps from either the ASTER instrument on the Terraspacecraft, or via orbital radar interferometry, usingeither the ERS-2 or RADARSAT data sets. HawaiiSynergy has also started to work with data obtainedby the Shuttle Radar Topography Mission (SRTM).These orbital sensors provide the ability to determinethe topography of much larger areas than TOPSAR,but have a lower spatial resolution (30 m/pixel) and avertical accuracy of about 15 - 20 m.
At this early stage, SOPAC and the Hawaii Synergyproject are still working to define the most helpfulprojects to collaborate on. It is clear, however, thatfuture collaborations will benefit from the strengths ofboth partners, namely SOPAC’s excellent localknowledge of important GIS issues and HawaiiSynergy’s strengths in satellite remote sensing anddata analysis. We look forward to these futureprojects!
Figure 2: Shaded relief version of a digital elevation model forthe island of Savai’i, Samoa. The map is a mosaic of 11 differentflight lines of data collected in 2000 by the NASA TOPSAR in-strument. The artificial illumination in this image is from the right,with the Sun at 30 degrees above the horizon.
Figure 1: Cloud-free mosaic of Fiji, produced using6 different Landsat 7 images collected betweenFebruary 2, 2000 and February 1, 2003
